UNITED STATES | |||
SECURITIES AND EXCHANGE COMMISSION | |||
Washington, D.C. 20549 | |||
| |||
SCHEDULE 14A | |||
| |||
Proxy Statement Pursuant to Section 14(a) of | |||
| |||
Filed by the Registrant x | |||
| |||
Filed by a Party other than the Registrant o | |||
| |||
Check the appropriate box: | |||
o | Preliminary Proxy Statement | ||
o | Confidential, for Use of the Commission Only (as permitted by Rule 14a-6(e)(2)) | ||
o | Definitive Proxy Statement | ||
x | Definitive Additional Materials | ||
o | Soliciting Material Pursuant to §240.14a-12 | ||
| |||
GENZYME CORPORATION | |||
(Name of Registrant as Specified In Its Charter) | |||
| |||
N/A | |||
(Name of Person(s) Filing Proxy Statement, if other than the Registrant) | |||
| |||
Payment of Filing Fee (Check the appropriate box): | |||
x | No fee required. | ||
o | Fee computed on table below per Exchange Act Rules 14a-6(i)(1) and 0-11. | ||
| (1) | Title of each class of securities to which transaction applies: | |
|
|
| |
| (2) | Aggregate number of securities to which transaction applies: | |
|
|
| |
| (3) | Per unit price or other underlying value of transaction computed pursuant to Exchange Act Rule 0-11 (set forth the amount on which the filing fee is calculated and state how it was determined): | |
|
|
| |
| (4) | Proposed maximum aggregate value of transaction: | |
|
|
| |
| (5) | Total fee paid: | |
|
|
| |
o | Fee paid previously with preliminary materials. | ||
o | Check box if any part of the fee is offset as provided by Exchange Act Rule 0-11(a)(2) and identify the filing for which the offsetting fee was paid previously. Identify the previous filing by registration statement number, or the Form or Schedule and the date of its filing. | ||
| (1) | Amount Previously Paid: | |
|
|
| |
| (2) | Form, Schedule or Registration Statement No.: | |
|
|
| |
| (3) | Filing Party: | |
|
|
| |
| (4) | Date Filed: | |
|
|
| |
| Patrick Flanigan Senior Director, Investor Relations Analyst Day May 6, 2010 Welcome |

| We Encourage Your Feedback |
| H. Termeer Agenda Welcome and Safe Harbor P. Flanigan Positioned for Value Creation H. Termeer Strategic Financial Overview M. Wyzga Streamlining Commercial Operations D. Meeker Q&A for first session presenters J. Butler An Overview of Renal and Mipomersen Q&A for second session presenters M. Enyedy Transplant and Oncology: Sustainable Innovation and Leadership M. Panzara Q&A for third session presenters Alemtuzumab: A Clinical Profile Alemtuzumab: A Promising New Standard of Care T. Murdock PGH: Building Our Future G. McDonough Q&A for fourth session presenters Concluding Remarks 1:00 – 1:05 1:15 – 1:35 1:35 – 1:45 1:45 – 2:15 2:15 – 2:40 1:05 – 1:15 2:40 – 2:50 2:50 – 3:15 3:40 – 3:50 3:15 – 3:30 3:30 – 3:40 3:50 – 4:25 4:35 – 4:55 4:55 – 5:00 p.m. Synvisc-One: A Life Changing Therapy M. Twyman 4:25 – 4:35 |

| Important Information On April 26, 2010, Genzyme filed a definitive proxy statement with the SEC in connection with the company’s 2010 annual meeting of shareholders. Genzyme shareholders are strongly advised to read carefully the company's definitive proxy statement before making any voting or investment decision because the definitive proxy statement contains important information. The company’s definitive proxy statement and any other reports filed by the company with the SEC can be obtained free of charge at the SEC’s web site at www.sec.gov or from Genzyme at www.genzyme.com. A copy of the company’s definitive proxy statement is available for free by writing to Genzyme Corporation, 500 Kendall Street, Cambridge, MA 02142. In addition, copies of the proxy materials may be requested from our proxy solicitor, Innisfree M&A Incorporated, 501 Madison Avenue, 20th Floor, New York, NY 10022, toll free at: (888) 750-5835. |
| Forward-Looking Statement This presentation contains forward-looking statements regarding Genzyme’s financial outlook and business plans and strategies, including without limitation our: forecasted cash flow return on investment for the company and its business segments for 2010 and 2015, segment return profiles to 2015, and cash position for 2010; plans to pursue strategic alternatives for our genetics, diagnostics and pharmaceuticals businesses and the forecasted financial impact of the potential divestitures; plans to improve operating margins and generate cost savings and plans to optimize our capital structure by implementing a $2 billion stock buyback, the timing and funding thereof, including plans for incurring debt and effect of the debt financing on our capital structure; our strategies to optimize our commercial portfolio and expectations for the sustainability of Genzyme’s financial performance; estimated market potential, future revenues and growth strategies for our products and businesses, including Myozyme/Lumizyme, Mozobil, Synvisc-One, Renagel/Renvela, our Hematology & Oncology products, Fabrazyme and other aspects of our PGH business; the effect of bundling, patent expiration and generic competition on our renal business; and plans to advance our late stage pipeline and existing products in new indications, including clinical development and regulatory approval plans and timetables for alemtuzumab for MS, eliglustat tartrate, mipomersen, Mozobil for tumor sensitization, Colar for adult AML and MDS, and our estimates of their respective potentials. These statements are subject to risks and uncertainties that could cause actual results to differ materially from those forecasted. These risks and uncertainties include, among others: that Genzyme does not repurchase any or all of the $2 billion worth of Genzyme stock on the timeframes indicated or that Genyzme is unable to incur debt in the timeframe indicated or in the anticipated amount or at all; that Genzyme is unable to generate cash from its planned business unit transactions or that the cash it does generate is less than expected, or that the timing of one of the transactions is later than expected; that Genzyme cannot obtain and maintain regulatory approvals for its products and manufacturing facilities; that Genzyme cannot manufacture its products in a timely and cost effective manner and in sufficient quantities to meet demand; that Genzyme is unable to secure regulatory approval for Lumizyme in the expected timeframe or at all; that Genzyme is not able to successfully complete clinical development and obtain regulatory approvals of its product candidates within anticipated timeframes, including alemtuzumab for MS, eliglustat tartrate, mipomersen, and Mozobil and Clolar for new indications for any reason, including trial results that are not as favorable as expected and safety profiles that reduce the potential target population; Genzyme’s ability to compete against competitive products and maintain or grow market share for its products; the accuracy of estimates of the size and characteristics of the markets to be addressed by Genzyme’s products and services; that Genzyme is unable to secure reimbursement for products and services from third-party payors, the extent of coverage and the accuracy of estimates of the payor mix; that Genzyme is unable to successfully identify and market to new patients and to expand sales and marketing teams in existing and new markets; that Genzyme is unable to conclude negotiation of a consent decree with the FDA and the terms of such consent decree; and the risks and uncertainties described in Genzyme's SEC reports filed under the Securities Exchange Act of 1934, including the factors discussed under the caption "Risk Factors" in Genzyme's Annual Report on Form 10-K for the year ended December 31, 2009. Genzyme cautions investors not to place substantial reliance on the forward-looking statements contained in this presentation. These statements speak only as of May 6, 2010 and Genzyme undertakes no obligation to update or revise the statements. |
| Positioned for Value Creation Henri Termeer Chairman and CEO Analyst Day May 6, 2010 |

| Our Approach to Value Creation Important Therapies Find novel therapies that set new standards of care 12 market leading products 22 Phase 3 trials underway; 19 Phase 2 trials underway Global Access Unique capabilities from registration to patient and reimbursement support 26 US and 542 global approvals since 1999 Product availability in over 100 countries Business Excellence Operate 17 manufacturing facilities globally Best-in-class operational management: new Heads of Manufacturing, Quality, Regulatory, Medical Affairs, and Clinical Operations 2 |
| THE RESULT: Sustainable Financial Performance ($ in millions) (1) Excluding charges for major acquisitions and FAS 123R. Revenues Non-GAAP EPS(1) 23% CAGR 16% CAGR $4,516 $4,605 $3,814 $3,187 $2,735 $2,201 $1,575 $1,080 2002 2003 2004 2005 2006 2007 2008 2009 $2.27 $1.95 $2.60 $2.00 $1.74 $1.47 $1.12 $0.81 2002 2003 2004 2005 2006 2007 2008 2009 3 |
| Late-stage Development Growth Mature Launch Balanced Product Life Cycle Will Drive Future Growth Cerezyme Renagel Fludara Hectorol Synvisc-One Mozobil Renvela Myozyme Fabrazyme Aldurazyme Thyrogen Thymoglobulin Seprafilm Synvisc Campath Leukine Clolar Alemtuzumab – MS Mipomersen Lumizyme Eliglustat tartrate Ataluren for CF Clolar adult AML 4 |
| First in class therapy for Pompe disease with >$1B potential Approved in over 40 countries globally Opportunity: US PDUFA date on Lumizyme is June 17 Only single injection product approved in the US for osteoarthritic knee pain Market leading viscosupplement with >55% share Opportunity: less than 10% of market using a viscosupplement First-in-class stem cell mobilizer for bone marrow transplantation Significant benefits for the patient, provider, and payer Opportunity: chemosensitization trials underway in lymphoma Near-term opportunities 2010 Maximizing the Near-term Product Opportunities 5 |
| Three Product Launches Expected by YE:2013 Novel therapy for patients with uncontrolled LDL on maximally tolerated lipid lowering therapy Primary endpoint achieved in 2 Phase 3 trials; additional Phase 3 data expected in mid-10 Outcome studies will balance the investment with the opportunity to maximize ROI Transformative oral therapy with the potential for a rapid impact on bone disease Global Phase 3 program initiated in late 2009 Regulatory filings targeted in 2013 Transformative therapy with the potential for once yearly treatment Phase 3 program in naïve and treatment experienced patients fully enrolled Data expected in 2011; approval targeted for 2012 2013 Alemtuzumab for Multiple Sclerosis Mipomersen for Severe Hypercholesterolemia Eliglustat for Type 1 Gaucher Disease 2010 6 |
| Preparing for the Next Phase of Growth Created Chief Operating Officer position Appointed David Meeker, EVP Streamlines the commercial organization; maximizes synergy and optimizes operational efficiency New leadership – additional expertise and fresh perspectives Scott Canute, EVP, President of Global Manufacturing & Corporate Operations Ron Branning, SVP, Global Head of Quality Pamela Williamson, SVP, Global Head of Regulatory & Corporate Compliance Dr. Ulrich Goldmann, M.D., SVP, Global Head of Medical Affairs Andrew Lee, SVP, Global Head of Clinical Operations Organizational changes support business unit opportunity John Butler, SVP, President of Personalized Genetic Health Geoffrey McDonough, SVP, Regional President, Europe Rogerio Vivaldi, SVP, President of Renal and Endocrinology Alison Lawton, SVP, General Manager of Biosurgery 7 |
| Continuing to Enhance Corporate Governance Added Board members to enhance financial & manufacturing expertise Robert Bertolini, former CFO of Schering-Plough Ralph Whitworth, Principal, Relational Investors Process underway to add a member with manufacturing expertise Enhanced the role of the Lead Independent Director Restructured the short- and long-term executive compensation plan Focused on revenue growth, cash flow return on invested capital & relative stock performance Aligned with shareholder interests Created new Board committees to address areas of critical concern Risk Management (Gail Boudreaux, Chair) Strategic Planning and Capital Allocation (Ralph Whitworth, Chair) 8 |
| Our Action Plan for Shareholder Value Creation Capitalize on Near-term Opportunities 2 Balance Growth with CFROI 3 Improve Operating Margins 4 Myozyme, Synvisc-One, and Mozobil are early in launch Alemtuzumab, Mipomersen, and Eliglustat approvals by YE:13E Optimize business mix: disposition of non-core businesses Positioned to take advantage of core franchise strengths New COO’s mandate: increased focus on cost savings Goal is to perform best-in-class with our peer group Implement $2B stock buyback Transparency on existing financial & capital policies Focus on Key Businesses 1 Supplying impactful products that address unmet needs Establish operational excellence in manufacturing 5 Optimize Capital Structure 9 |

| Optimize Capital Structure & Business Mix Implement $2 billion stock buyback Incur $1 billion in debt Seek strategic alternatives for non-core businesses Genetic Testing Revenue: $371 million in 2009 Top 5 provider of reproductive and oncology testing in the US 9 laboratories and ~150 genetic counselors Diagnostics Revenue: $167 million in 2009 Leading provider of flu and LDL-c testing Pharmaceutical Intermediates Manufacturing facility located in Liestal, Switzerland New structure enables increased focus on therapeutics 10 |
| SUMMARY Positioned to Create Value Successful patient-centric business model that has produced sustainable returns Organizational and Board changes made to prepare for the next phase of growth Strategy in place to maximize shareholder returns Significant growth opportunities to realize through 2015 11 |
| Positioned for Value Creation Henri Termeer Chairman and CEO Analyst Day May 6, 2010 |
| Strategic Financial Overview Michael Wyzga Chief Financial Officer Analyst Day May 6, 2010 |

| 2 Components of Value Creation Seek Strong Earnings Growth while Maintaining Solid Return on Investment Maintain high return on invested capital Enforce strong financial criteria (focused revenue growth, improving margins and asset productivity) Invest only in the areas defined by our Core Business Criteria Benchmark all uses of capital against the highest risk adjusted returns available among the various alternatives Currently benchmarking all investments against share repurchases Core Business Criteria Strong Financial Criteria Capital Allocation Discipline |
| 3 Genzyme’s Key Criteria for Business Evaluation Commitment to the patient 1 Unmet medical need 2 Best in class, breakthrough therapies 3 Unique value to Genzyme and patients 4 Sustainable rates of growth with high financial returns 5 |
| 4 CFROI Economic Profitability Incorporates asset life, adjusts asset base for inflation, includes off balance sheet items, excludes non-cash and special items. Corporate Performance Measurement From Revenue Growth to CFROI ROE & ROA Profitability - net income return as a % of equity, assets but the company can create a semblance of rising profitability by increasing leverage EPS Profits - a portion of profit allocated to a common share outstanding but how much equity or asset utilization was required to generate the bottom line Revenue Growth - an increase in revenue year over year by how much did revenue grow and is expected to grow |
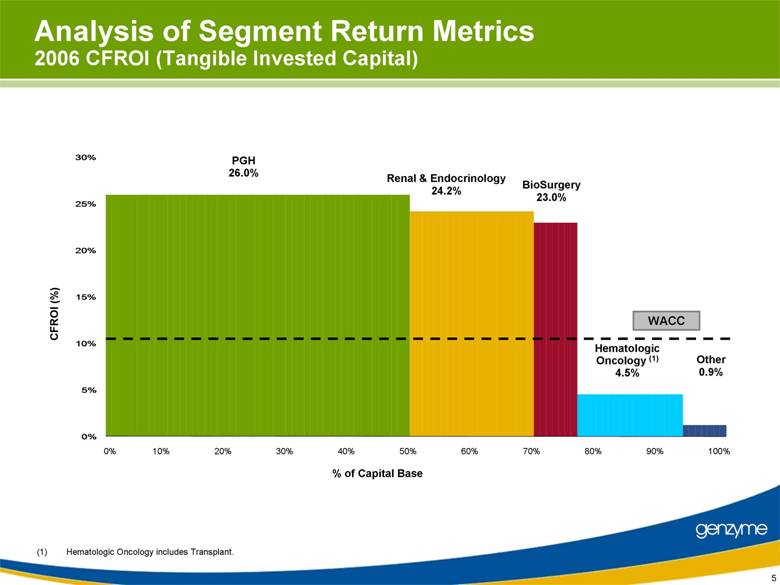
| 5 Analysis of Segment Return Metrics 2006 CFROI (Tangible Invested Capital) 0% 10% 20% 30% 40% 50% 60% 70% 80% 90% 100% % of Capital Base PGH 26.0% Renal & Endocrinology 24.2% BioSurgery 23.0% Other 0.9% Hematologic Oncology (1) 4.5% (1) Hematologic Oncology includes Transplant. CFROI (%) WACC 0% 5% 10% 15% 20% 25% 30% |
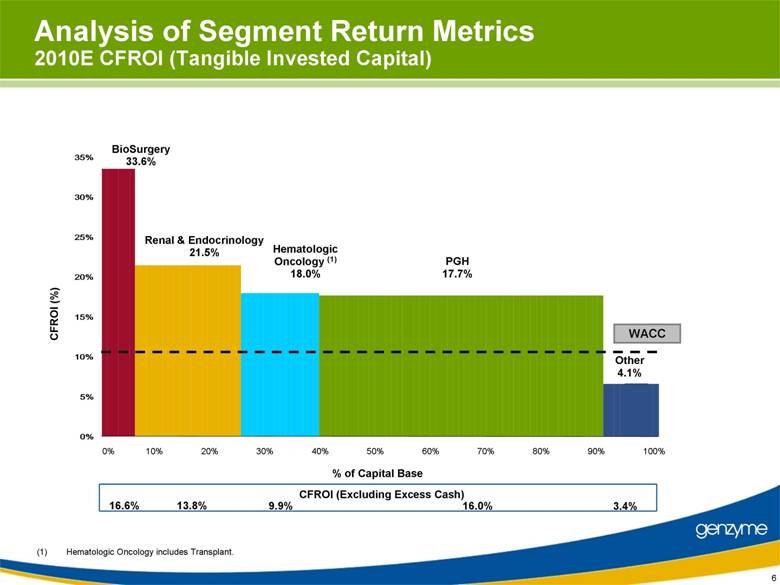
| 6 Analysis of Segment Return Metrics 2010E CFROI (Tangible Invested Capital) 0% 10% 20% 30% 40% 50% 60% 70% 80% 90% 100% % of Capital Base PGH 17.7% Renal & Endocrinology 21.5% BioSurgery 33.6% Other 4.1% Hematologic Oncology (1) 18.0% (1) Hematologic Oncology includes Transplant. CFROI (%) WACC CFROI (Excluding Excess Cash) 16.6% 13.8% 9.9% 16.0% 3.4% 0% 5% 10% 15% 20% 25% 30% 35% |
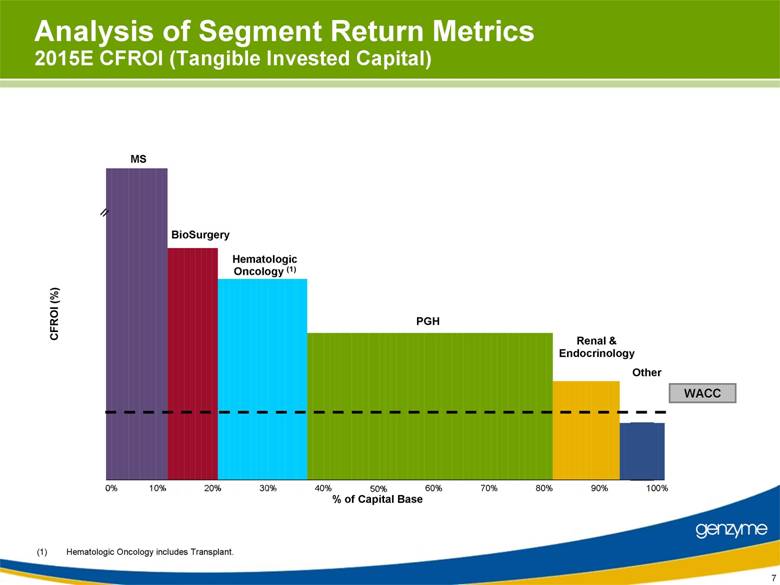
| 7 Analysis of Segment Return Metrics 2015E CFROI (Tangible Invested Capital) 0% 10% 20% 30% 40% 50% 60% 70% 80% 90% 100% % of Capital Base PGH Renal & Endocrinology BioSurgery Other Hematologic Oncology (1) (1) Hematologic Oncology includes Transplant. MS CFROI (%) WACC // MS BioSurgery Hematologic Oncology PGH PGH PGH PGH Renal Other |
| 8 Corporate Performance Measurement From Revenue Growth to CFROI ROE & ROA Profitability - net income return as a % of equity, assets but the company can create a semblance of rising profitability by increasing leverage EPS Profits - a portion of profit allocated to a common share outstanding but how much equity or asset utilization was required to generate the bottom line CFROI Economic Profitability Incorporates asset life, adjusts asset base for inflation, includes off balance sheet items, excludes non-cash and special items. Revenue Growth - an increase in revenue year over year by how much did revenue grow and is expected to grow |
| 9 Note: Size of bubble represents 2006 revenues. Revenue growth based on 2004-2006 revenue CAGR. Other Renal Hem. Onc. Biosurgery PGH WACC Genzyme Segment Return Profile 2006 0% 10% 20% 30% 40% 50% 0% 10% 20% 30% 40% Revenue Growth (%) CFROI (%) |
| 10 Note: Size of bubble represents 2006 and 2010 estimated revenues. Revenue growth based on 2004-2006 revenue CAGR and 2008-2010 estimated revenue CAGR. Other Renal Biosurgery PGH Hem. Onc. WACC Genzyme Segment Return Profile from 2006 to 2010E (25%) (13%) 0% 13% 25% 38% 50% 63% 75% 0% 10% 20% 30% 40% 50% Revenue Growth (%) CFROI (%) |
| 11 Note: Size of bubble represents 2006 and 2015 estimated revenues. Revenue growth based on 2004-2006 revenue CAGR and 2013 estimated -2015 estimated revenue CAGR. Genzyme Segment Return Profile from 2006 to 2015E WACC Other Renal Biosurgery Hem. Onc. PGH MS // 2015E 55% MS Not Risk Adjusted (25%) (13%) 0% 13% 25% 38% 50% 63% 75% 0% 10% 20% 30% 40% 55% Revenue Growth (%) CFROI (%) |
| 12 Genetic Testing Diagnostics WACC Note: Size of bubble represents 2006 and 2015 estimated revenues. Revenue growth based on 2004-2006 revenue CAGR and 2013 estimated - 2015 estimated revenue CAGR. // // (40%) (15%) Genzyme Segment Return Profile from 2006 to 2015E ‘Other’ Detail 10% 0% 10% 20% 30% 5% 0% 15% Revenue Growth (%) CFROI (%) (40%) (15%) |
| 13 Impact on Genzyme’s 2010E Transactions Pro Forma EPS DILUTIVE EPS ACCRETIVE Reduces CFROI Improves CFROI Note: Size of bubble represents 2010 estimated segment CFROI. Genzyme change in CFROI and accretion / (dilution) assumes sale at mid-point of illustrative segment valuation range. 2010E Pharma 2010E DX. 2010E Genetics |
| 14 Proposed Transactions Will Improve Margins and Operating Returns – Pro Forma 2009 (1) As percent of Revenue. Cost categories include allocations of admin, corporate initiative, corporate R&D, R&D indirect overhead and unabsorbed. (2) As percent of Revenue. Operating margin defined as gross margin less SG&A less R&D. Excludes stock-based compensation and amortization of intangibles. Revenue (millions) $4,516 $371 $167 $30 $3,948 Gross Margin(1) 70.8% 43.4% 38.6% 21.6% 75.2% SG&A as % of Revenue(1) 29.2% 39.3% 27.6% 24.5% 28.2% R&D as % of Revenue(1) 17.8% 5.7% 5.9% 9.0% 19.5% Operating Margin(2) 23.8% (1.6%) 5.1% (11.9%) 27.5% Cash Operating Return 18.3% 3.5% 9.3% 3.6% 19.4% Genzyme Standalone Genzyme PF Genetic Testing Diagnostics Pharmaceuticals # of Employees ~12,000 ~1,700 ~500 ~120 ~9,680 |
| 15 Genzyme’s Cash and Equivalents Discipline Target a cash level in the range of $800M - $1.0B ~$1.0B Access to additional cash - revolver facility of $350M - credit markets ($ in millions) $1,089 $1,286 $1,460 $974 $1,050 $0 $300 $600 $900 $1,200 $1,500 2005 2006 2007 2008 2009 2010E |
| 16 Genzyme’s Capital Structure Discipline Cash balance of $962 million in Q1 2010, with undrawn revolver Significant free cash flow generation with over $1 billion of cash flows annually by 2012 Limited current debt outstanding (Debt / 2009 EBITDA of 0.1x) Current S&P credit rating of A-, with significant debt capacity Goal is to create value for equity holders by optimizing the balance sheet Active Balance Sheet management to meet established credit objectives Maintain investment grade credit rating Total Debt/EBITDA goal not to exceed 1.5X Long term capital structure flexibility beyond 2010 Observations Credit Discipline |
| 17 Genzyme’s Capital Structure Status quo $1.0B Investment Grade Bond Used for Repurchase 2010E 2015E 2010E 2015E Debt / EBITDA 0.1X 0.0X 0.7X 0.3X Net Debt (Cash) / EBITDA (0.6)X (1.3)X (0.0)X (1.1)X EBITDA / Interest - - 32.0X 82.5X Debt / Total Capitalization 1.3% 0.5% 12.8% 7.1% Expected Credit Rating Investment Grade Investment Grade Note: Assumes segment marginal tax rate of 30%; free cash flow is not used to pay down debt; illustrative 5.25% interest rate incremental debt; cash interest rate 1%. Analysis does not include potential impact of Consent Decree liability. |
| In 2007 the Board approved purchase of Genzyme’s shares over 3 years Purchased to date: 18 Genzyme’s Current Share Repurchase Plan Year Shares (millions) Value ($ millions) Average Price 2007 3.5 $232 $66.14 2008 2.0 143 $71.49 2009 7.5 414 $55.16 Total 13.0 $789 $60.63 |
| Stock repurchase of $2.0B in two tranches $1.0B near term stock repurchase using debt $1.0B stock repurchase funded by excess cash, cash flows, debt and/or transactions Expected to be implemented over the next 12 months 19 Genzyme’s New Stock Repurchase Plan Note: Size of bubble represents 2010 estimated and 2015 estimated CFROI. Genzyme accretion / (dilution) assumes share repurchase in the amount of $2.0B at average price of $55 per share. 2010E Share Repurchase 2015E Share Repurchase Reduces CFROI Improves CFROI EPS DILUTIVE EPS ACCRETIVE ~11%-13% Estimated Accretion // |
| 20 Improve Operating Margins and Capital Expenses Genzyme has been evaluating its operating margins and expenses as part of its capital allocation review process Continuing oversight and direction by the Board and now by its Capital Allocation Committee Benchmarking against Peer group Outline of a detailed plan of our revised and reduced OPEX and CAPEX levels for our remaining businesses |
| 21 Genzyme’s Value Creation Commitment Provide transparent and objective: Capital Allocation Balance Sheet Efficiency Segment Operating Performance Transact non core business: Pharmaceutical Genetics Testing Diagnostic Products Continually monitor business and adjust for highest returns Implement $2.0B stock repurchase plan Optimize Balance Sheet Continue to build a portfolio of high return therapies Focus actions on low capital returns and deviations from financial and business criteria Strong financial discipline Maintain strong business criteria Deliver higher return on invested capital Benchmark uses of capital against highest returns available among alternatives |

| Sustainable Value Creation David Meeker Chief Operating Officer Analyst Day May 6, 2010 |

| Agenda Mission Priorities |

| Our Mission is Clear Value creation: improving patient outcomes 1 Responsibility: to ensure global access 2 Opportunity: think differently 3 |
| Developing Unique Solutions Delivering high value products #1 |
| Global Portfolio – Ensuring Global Patient Access Cerezyme® Fabrazyme® Aldurazyme® Myozyme® Personalized Genetic Health Renagel® Renvela® Hectorol® Thyrogen® Renal and Endocrinology Mozobil® Clolar® Campath® Fludara® Leukine® Thymoglobulin® Hematology and Oncology Genetics Diagnostics Other Synvisc® Synvisc-OneTM Carticel® MACI® Sepra® Products Biosurgery 19 major marketed products 85 locations in >40 countries Helping patients in 100 countries 5 |
| Creating Value Best in class therapies Focus: optimize disease management not selling a specific therapy Partner with the system and provider |
| VALUE CREATION Gaucher Disease: Transformative Therapy Rare disease awareness Access to expert management Research commitment: the disease the product the next generation therapy 1983 1991 2001 7 |
| VALUE CREATION MPS 1: Increasing Disease Awareness MPS patient Ocular manifestation - corneal clouding Nyhan and Ozand, 1998 Photo reproduced by permission of Hodder/Arnold Publishers. |
| 2008 DOCTORSDIALOG VALUE CREATION Aldurazyme Ophthalmology Awareness Program Mail Wave generated 12+ % response E-mail 3,000 Ophthalmologists link to web page mps1.doctorsdialog.com Fax-mail 5,000 Optometrists invited to visit web page Mail 4,600 Ophthalmologists (Wave 2: A/B test offer to visit web page) |

| VALUE CREATION Understanding the Problem Chronic degenerative joint disease Chronic Pain Osteoarthritis? 10 |

| VALUE CREATION Transforming the Disease Management Paradigm 11 |
| VALUE CREATION HeFH: Undertreated and Underdiagnosed Swelling in Achilles tendon; LDL-C = 300 mg/dl Formal diagnosis HeFH 40 41 15 20 38 35 30 25 Katherine Daughter Ella, age 3, also has HeFH, already elevated LDL-C |
| VALUE CREATION Commitment to MS Community Alemtuzumab: Best in class profile? Building that partnership Ongoing research mechanism of action? biomarkers for risk stratification? Pharmacoeconomic benefit? Next Generation molecule? Comprehensive, user friendly risk management |
| Conclusion: We understand value creation |
| Agenda Mission Priorities |

| Commercial Operations Team COO Resource Pool Shared Services HR Global Market Access Renal, Endo Transplant, Oncology, Genetics, MS Finance Medical Affairs International PGH, Cardio Biosurgery 16 |
| Optimize the Portfolio for Maximal Value Creation Transforming Lives vs. Participating in Markets Reinforce our commitment to our Genetic Disease business Eliglustat Mipomersen Alemtuzumab: ensure market access Enhance global operational effectiveness Manage our expenses |
| Enhancing Synergies 0 50 100 150 200 2005 2006 2007 2008 2009 Cumulative Patients Identified Close to 200 patients identified in Renal-Fabry collaboration 18 |
| REGIONAL OPTIMIZATION Latin America’s Diverse Portfolio Cerezyme® Fabrazyme® Aldurazyme® Myozyme® Genetic Diseases Renagel® Renvela® Hectorol® Thyrogen® Cardiometabolic & Renal Mozobil® Clolar® Campath® Fludara® Leukine® Celsior® Thymoglobulin® Hematologic Oncology Synvisc® Synvisc-OneTM Carticel® MACI® Sepra ® Products Biosurgery Marketed in LATAM |
| REGIONAL OPTIMIZATION Growth through Geographic Diversification Source: 2004 to 2008 data from Pillar Application; 2009 to 2014 data from December 2009 Long Range Plan. Chile VEN and CAC PEC Mexico Southern Cone M$ Sales by Country Brazil $0 $100 $200 $300 $400 $500 $600 $700 2004 2005 2006 2007 2008 2009 2010E 2011E 2012E 2013E 2014E 20 |
| REGIONAL OPTIMIZATION Product Diversity Continues to Increase in LATAM Markets 2004 2008 2014E Sales by Product Cerezyme Renagel / Renvela Aldurazyme Myozyme Thyrogen Transplant Oncology Others Fabrazyme Biosurgery 84% 7% 2% 2% 2% 2% 2% 53% 8% 20% 7% 3% 2% 3% 3% 0% 0% 38% 12% 7% 7% 4% 15% 4% 7% 5% 2% |

| SUMMARY Positioned for Success Creating value through improving patient outcomes Diverse portfolio of best in class products Unique ability to form partnerships with health care community Operating team positioned to optimize our global commercial portfolio |
| An Overview of Renal and Mipomersen John Butler SVP, President of Personalized Genetic Health Analyst Day May 6, 2010 |

| Thriving in renal Agenda Mipomersen opportunity |

| Patient- centered approach We Seek to Transform Markets, Not Merely Participate in Them Transform Markets |
| Transformed Market Renagel/Renvela: A Genzyme Success Story in Building Value for Patient, Physician & Payer Prove efficacy Build safety Identify calcium as risk factor Improve outcomes Hyperphosphatemia as bone-centric issue Phosphorus-centric disease mineral metabolism bone abnormalities cardiovascular calcification Marketed in > 60 countries >50% binder share 1998 2010 |
| Positioned for Success in 2011-2014 Horizon Maximize the brand opportunity Protect and extend market timeline Retain value post- patent expiry First 11 years 11 $4.5B Next 5 years 5 $4.7B Revenue |
| Renvela Building Clinical Value * Dollar value of prescriptions Source: IMS NPA Total Prescriptions vs. Value Relative Value Total Prescriptions Value* 3x Treatment Value calcium calcium sevelamer sevelamer |
| Key Market Opportunity: CKD* and Incident Dialysis Patients Source: US & EU Chart Audits (US incident from physician reported tracking study) Sevelamer Audited Patient Share * In applicable markets, pending regulatory approval % of patients 33 - 54% share jump 18 - 45% share jump 0% 10% 20% 30% 40% 50% 60% EU US CKD Prevalent 1st Line Dialysis Dialysis Prevalent |
| Financial Metrics Patient Care Clinical Attributes Position for Sustained Growth in a Bundled Environment Ensure patient quality of care whether binders are in or out of the bundle Innovate using contracts with providers to ensure access to Renvela & Hectorol IV Demonstrate clinical value message for both products to differentiate from lower cost alternatives Sustained Growth |
| Dynamics Contributing to Value Retention Post Patent Expiry Limited existing therapeutic polymer products Dedicated, specialist plant required to make large volumes economically Demonstration of in vitro bioequivalence uncertain for non-absorbed polymers Biosimilars Generic small molecules Polymers Complex Simple Significant metric ton volume requirements to meet worldwide demand (>500 MT) |
| Sevelamer Requires Dedicated, Specialized Manufacturing Average dialysis patient requires 150x dose versus average statin patient, meaning: Approximately the same total metric ton API capacity is required to fulfill current sevelamer requirements as what is required for the global statin market Haverhill, UK manufacturing facility |
| Brazil is #2 volume market behind US in 2009 totaling $41.4M in revenue Renagel Success Despite Market Challenges: Case Study – Brazil Success Government tender in 10/09 100% of business was at risk 35% growth Two “similars” approved 5/09 Genzyme won tender at lowest price globally to serve the market 67% margin preserved (vs. 85% pre-tender offer) Bottles Revenue ($M) Brazil Volume/Revenue 2007-2010 Bottles Revenue $0 $10 $20 $30 $40 $50 0 100,000 200,000 300,000 400,000 2007 Act 2008 Act 2009 Act 2010 Bud/Fcst |
| Thriving in renal Agenda Mipomersen opportunity |

| 13 Mipomersen: Potential to Transform the Market for Lipid-Lowering Drugs Powerful Therapy to Address a Significant Unmet Need Developing a first in class agent, allowing more patients to reach target goals & potentially reduce cardiac event risk Investigating improved diagnostic tools in line with growing importance of ApoB & Lp(a) Clinical experience in over 10 countries, 5 continents. Global commercialization plans in place Leveraging Genzyme commercial infrastructure Novel antisense platform |
| Transforming the Dyslipidemia Market Source: Decision Resources Dyslipidemia Report 2007, Genzyme CTI Analysis Lipidemia Market Today We are Creating a New Market The standard of care serves the majority of patients Statins Fibrates Niacin Cholesterol absorption inhibitors Bile acid sequestrants Omega-3 acid ethyl esters Addressing patients in need who have exhausted standard of care and are in desperate need of new options to further reduce risk We are not participating in this market |
| 15 Initial Focus on “Patients Left Behind” HoFH SH HeFH Statin intolerant First filing H1:11 US & EU ~1/mil 650* LDL>200 with CAD or >300 w/o CAD on max therapy 30,000* LDL>160 on max therapy 25,000 (EU only) Familial hypercholesterolemia (HoFH & HeFH): Under-diagnosed, under-treated Severe: FH or high risk with extreme LDL-C on max therapy Statin intolerant: Options limited to 2nd/3rd line agents *Patient #s US & EU |
| HeFH: Undertreated and Underdiagnosed Motivated to Use New Therapeutic Options Good health, swelling in Achilles tendon; LDL-C checked 300 mg/dl Started lipid lowering therapy No mention of FH No disease education Pain/swelling migrated to other joints; tested negative for lupus, RA; misdiagnosed with fibromyalgia Increased dose of statins with no impact on LDL Still no diagnosis of FH LDL skyrocketed >600 while on fertility treatment Increasing symptoms (shortness of breath, chest discomfort with excursion, trouble sleeping) Myocardial infarction (38) Had been turned away 2X at emergency room despite severe chest pains FH casually noted in chart No patient education Referred to lipid specialist Formal diagnosis HeFH Aggressive lipid mgmt Still above goal LDL-C 167 mg/dL 40 41 15 20 38 35 30 25 Katherine Daughter Ella, age 3, also has HeFH, already elevated LDL-C |
| Impact on Patients in Phase 3 Trials Avg. LDL at week 28: Avg. Change in LDL: Avg. Baseline LDL: p-value: 25% reduction versus 3% reduction with placebo Equates to >100 mg/dL reduction 326 mg/dL 439 mg/dL <0.001 28% reduction versus 5% increase with placebo 45% of patients achieved <100 mg/dL 104 mg/dL 153 mg/dL <0.001 *Patients received maximally tolerated lipid lowering background therapy throughout the study. HoFH* HeFH* |
| CV Risk Reduction Demonstrated with Decreasing LDL LDL-C (mg/dL) Reduction Cholesterol Treatment Trialists’ (CTT) Collaborators, Oxford, Lancet 2005, 366.1267-78 Data reflects findings from 14 randomized trials conducted since 1988 including >90,000 patients CV Event Risk Reduction Every 2 mg/dL reduction in LDL-C = 1% reduction in CHD event rate; A 50 mg/dL decrease = 25% reduced CV risk LDL-C & CV Event Rate Reduction Results from Statin Outcomes Studies ~ 20 ~ 40 ~ 60 ~ 80 50% 40% 30% 20% 10% HPS ALLHAT–LLT ASCOT– LLA LIPID WOSCOPS AFCAPS/ TexCAPS PROSPER 4S CARE GISSI Prevention ALERT LIPS Post- CAB |
| Improving Mipomersen’s Tolerability with Alternate Dose Regimens The most common adverse events: injection site reactions and flu-like symptoms AE-related discontinuations have been primarily due to tolerability (injection-site reactions and flu-like symptoms) Phase 1 alternate dose study 3 week pilot study initiated Q1:10 Safety & efficacy alternate dose study 26 week follow on design based on Phase 1 results |
| Positive Risk Benefit: Safety Profile Has Been Consistent & Generally Manageable Targets lipid synthesis in the liver, the origin of LDL-C Liver effects observed in some patients ALT elevations 3X > ULN increases in liver fat assessed through MRI scans no cases of Hy’s law ALT elevations 3X > ULN were associated with more significant lipid lowering (median 44% LDL-C reduction in HeFH trial) Current and future trials include approaches to understanding and managing ALT elevations dose adjustments and mechanistic studies |
| 21 Investing in Clinical Development, Maximizing Opportunities to Reach More Patients in Need To support second filing in HeFH (EU) one year global Phase 3 study Continued development committed to studying longer-term benefits and safety of mipomersen evolving clinical data will inform design of further studies outcome studies will balance the investment with the opportunity to maximize ROI |
| Targeting Physicians Who Serve the Patients in Need Treatment titration to reach LDL-C targets Statins Initial Rx Statins Dose or new statin or intolerant Other Agents Ezetimibe Fibrates, Niacin, BAS The Unmet Need No Treatment or Apheresis Based on patient willingness, treatment availability Uncontrolled Hypercholesterolemia Customer Call Point: Lipid Clinics LDL Apheresis Centers Standard of Care HC patient |
| Lipid Specialists: An Ideal Partner for Genzyme’s Commercialization Approach Focused on the highest risk patients, in need of new options Attuned to mechanism, connection to benefits beyond LDL-C Existing staff, structure prepared to support needs of SQ therapy Experienced in managing effects of most potent treatment regimens As a group, less prioritized by other companies in lipid space Source: Genzyme US lipid specialist market research 12/2009 and 3/2010 |
| Profile of the Mipomersen Patient “I would prescribe this drug to motivated patients, with results that did not even approach target, intractable in practice; statin intolerant; those who they never get to a good level, have CAD” Cardiologist, Chicago LDL levels on maximal therapy Motivation Level of risk / need for prevention |

| Transforming the Market, Leveraging Operational Experience & Our Patient Focused Heritage Powerful new option Lipid center focus Cascade family screening Diagnostics ApoB & Lp(a) Disease awareness, education Patient registries Redefine efficacy: atherogenic lipid reduction-LDL-C, ApoB, Lp(a) Raise relevance of lipid specialists Focus on cumulative exposure & risk reduction Introduce a first-in-class therapy: Mipomersen Provide an integrated patient partnership Transform market |
| Market Transformation & Operational Execution Sevelamer Mipomersen Renvela enhances safety profile and allows for expansion into CKD non-dialysis (EU; pending in US) Introduce a first-in-class new therapeutic option Value proposition has enabled global access for premium priced brand Provide an integrated patient partnership Strong commercial infrastructure complementing robust operational expertise Transform market for underserved patient group |
| Genzyme Transplant and Oncology Sustainable Innovation and Leadership Mark Enyedy President, GTO, MS and Genetics Analyst Day May 6, 2010 |

| Agenda GTO today Growth strategy 2015 drivers |

| GTO Is a Strategic Asset for Genzyme R&D pipeline Number of countries with presence Major marketed products Full time employees >500 6 >90 Robust 3 |
| Allo HSCT* Combination with Fludara, CLL CLL Subcut Combination Consolidation ALL 1st line Adult AML MDS Tumor Sensitization AML, CLL SOT, Ischemic Disease MDS* Antibody Solid Tumor Solid Tumor GTO Development Portfolio: Continued Innovation in Areas of High Unmet Need Pre-Clinical Phase I Phase II Phase III Mozobil Campath Campath Clolar Pedi Clolar Oral Clolar Mozobil Mozobil Thymoglobulin Anti-TGF Tasidotin Genz-644282 Drug Name Indication(s) >100 ISSs *Investigator Sponsored Study |
| 2009: Significant Operational and Financial Progress Operations Solidified base transplant and oncology integration acquisition of Campath, Fludara and Leukine Advanced product pipeline successful launches: Mozobil and Clolar/Evoltra timely recoveries: Campath and Fludara new data: 90 abstracts at ASH Financials: Significant revenue: >$500M (up 66%) Improved operating income up >$80M |
| 6 2010: Business Focused on Key Priorities Expand global access for Mozobil Strengthen recovery of Campath and Fludara Optimize price and improve competitive positioning for Thymoglobulin Raise awareness of Clolar/Evoltra data and expand access Execute on Leukine initiatives 1 2 3 4 5 |
| Mozobil Clolar Other* Thymoglobulin $252 $775-810 $310 $513 Delivering Significant Near-Term Growth Doubled the number of products commercially sold in ’09 Revenue growth in 2010: 60% in-licensed products 40% base products +23% +66% +52% Note: 2010 revenues assume € 1.00 per 1.50 USD *Other includes: Campath, Fludara, Leukine $M Revenues |
| Agenda GTO today Growth strategy 2015 drivers |

| Revenue Doubling by 2015 Adapt core business model Extend leadership in Hematologic Oncology Emphasize personalized medicine approaches Diversify into larger segments through: internal development partnering and M&A GTO Portfolio WW Revenue 2010-2015 in $M Note: 2010-2015 revenues assume € 1.00 per 1.50 USD. $780 Mozobil Clolar/Evoltra Other Thymoglobulin 2x |
| Extend Leadership in Hematologic Oncology Maximize Genzyme corporate presence Expand into new markets Pursue new indications for existing products Generate portfolio leverage Corporate Presence New Markets New Indications Leverage 10 |
| Extend Leadership Position in Hematologic Oncology – Portfolio Leverage: Multiple Products, One Call Point Establish durable relationships Gain customer insights Offer portfolio-based solutions Light Gray = Investigational use Diagnosis Treatment Post-transplant BMT Hematologic malignancy Leukine Fludara Campath Clolar Thymoglobulin Mozobil Thymoglobulin Prochymal Leukine Mozobil Thymoglobulin Campath Clolar Shared patients, shared solutions with complementary therapies Accelerate adoption and increase penetration |
| Extend Leadership Position in Hematologic Oncology – Developing New Indications for Existing Products Lower risk, higher value Proof-of-concept often established Near-term revenue generation extended customer interface Potential for proprietary combinations Key programs Mozobil in tumor sensitization combinations with 7+3, MEC*, Rituxan* and Clolar* Clolar in adult AML and MDS Multiple products in BMT *Investigator Sponsored Study |
| Extend Leadership Position in Hematologic Oncology – Lever Global Reach for Remaining Product Lines Number of Approved Products 6 5 4 3 2 1 Drivers New registrations Named-patient Build/expand infrastructure Market expansion |
| Extend Leadership Position in Hematologic Oncology– Maximize Corporate Presence Sales force infrastructure and commercial support more formal coordination increase joint initiatives and training conference presence: “One Genzyme” Global policy and patient advocacy Reimbursement $1,248 Worldwide Revenue in $M GTO PGH 2010E 2015E |
| Strategy Summary – Optimizing a Strategic Asset Adapt successful business model Extend existing leadership Demonstrate success in personalized medicine Diversify into larger segments |
| Agenda GTO today Growth strategy 2015 drivers |

| Key Growth Drivers 2010 - 2015 Note: 2010-2015 revenues assume € 1.00 per 1.50 USD Estimated Worldwide Revenue in $M 10E 11E 12E 13E 14E 15E Mozobil Clolar 3-4x growth |
| M O Z O B I L: A Platform Product The Product Novel mechanism of action Reliable stem cell mobilization Potential for: improved patient outcomes pharmacoeconomic benefit Status Global launch underway for stem cell transplantation Clinical trials for tumor sensitization on-going Wide Range of Applications Approved Phase I/II Trials Stem-cell transplant Hematological Malignancies 55,000 75,000 100,000 Preclinical Studies Tumor Sensitization Number of Patients Genzyme estimates |
| M O Z O B I L: Launch Progressing on Plan Launched Q1:09 in the US, Q3:09 in EU US price $6,562.50/vial (2 vials per patient on average) US customers in first year: >200 centers/physicians, >150 re-ordering broad adoption adoption in front-line significant and growing centers are generating algorithms for use and adding to clinical protocols EU is seeing similar trends in adoption growth will continue as more countries gain reimbursement Globally over 1,000 compassionate use patients in 40+ countries Additional approvals have been obtained Brazil, Korea, Mexico, Israel Project 80% revenue growth in 2010 |
| M O Z O B I L: Continued Innovation – Tumor Sensitization The CXCR4/SDF-1 interaction: anchors blasts to protective stromal cells inhibits pro-survival signaling in blasts involved in chemotaxis and metastasis is up-regulated during angiogenesis Inhibition may enhance current therapeutic options allowing for more remissions potentially longer survival Strong preclinical synergy data Stromal Cells Osteoblasts KL VLA-4 Osteopontin Fibronectin Collagen Hyaluronin Extracellular matrix SDF-1 CXCR4 Kit CD44 VCAM-1 CD62L Notch Cell cycling, p27Kip1 PI3K/Akt & MAPK signaling Bcl-2 expression Shh AML Blast |
| M O Z O B I L: Tumor Sensitization – Clinical Activity Encouraging signal of activity in relapsed / refractory AML ASH interim results (32 patients evaluated in ISS) 50% complete response compared to 25 - 35% historical response with MEC alone Final data expected in 2010 additional studies looking at alternate doses, addition of G-CSF |
| M O Z O B I L: Tumor Sensitization – Strategic Development Effort Relapsed / Refractory AML (with MEC ISS) Front-Line AML (with 7+3) Solid Tumors (Glioma, other) In Phase I/II Focused on three indications Increasing ISS Support (e.g., AML, CLL, MDS, MM, ALL) |
| C L O L A R / E V O L T R A: Multiple Growth Drivers Standard of Care in relapsed/refractory pediatric ALL new market expansion ongoing Potential near-term label expansion in adult AML expected 2012 adopted under NCCN guidelines multiple cooperative group studies underway Potential long-term expansion into MDS strong early clinical data oral formulation in development Portfolio leverage in HSCT 2004 2017+ Pediatric Acute Leukemia Adult Acute Leukemia Adult MDS HSCT Conditioning |
| C L O L A R / E V O L T R A: CLASSIC I Pivotal Trial to Support Adult AML Label Clofarabine AML Phase 2 and Phase 3 trials CLASSIC II CLASSIC I Phase 2 single agent trial in high risk older patients Efficacy and safety compelling NCCN guidelines: newly diagnosed AML patients > 60 Phase 3 trial required for regulatory approval Phase 3 double-blind, placebo controlled Design: Clo + Ara-C vs Ara-C Well defined relapsed/refractory population Overall survival endpoint Important secondary endpoints |
| C L O L A R / E V O L T R A: CLASSIC I On Track for 2011 Regulatory Submission H1:12E US & EU anticipated approvals Global filings to follow Nov. 09 H1:11E H2:10E Enrollment completed early Follow-up complete Submission to FDA and EMA CLASSIC I |
| C L O L A R / E V O L T R A: MDS Data Predict Future Growth Oral Clolar in MDS Response rates in relapsed MDS higher than response rates in front line with current standard of care early data signals a manageable safety profile Hypomethylating agent failures: 20,000 patients/year 2012 > 2015 Pedi ALL Adult AML MDS > $500M Total peak potential: > $100M Today: Anticipated approval: |
| I N S U M M A R Y GTO: Positioned for Sustained Leadership Continued innovation in an area of high unmet need >$1 billion potential Integral to corporate diversification strategy Proving ground for Rx/Dx paradigm Hematologic Oncology model well-suited for further expansion Market proximity: Medical Oncology and solid tumors Technical proximity: SOT, MS, and other IMDs |
| Alemtuzumab – A Clinical Profile Michael Panzara Group VP, Multiple Sclerosis & Immune Diseases Analyst Day May 6, 2010 |

| 2 A L E M T U Z U M A B: Agenda Emerging profile Risk mitigation Future opportunities |
| 3 Alemtuzumab vs. Interferon Beta-1a in Early Multiple Sclerosis N Engl J Med 359:1786, October 23, 2008 Original Article Risk Reduction 74% Risk Reduction 71% A L E M T U Z U M A B: Emerging Profile: Significant Efficacy |
| 4 A L E M T U Z U M A B: Emerging Profile: Reversal of Disability Coles, et al., NEJM 2008 Slows progression, improves pre-existing disability +0.38 (0.13, 0.63) P<0.005 Mean EDSS Score Over Time Months -0.39 (-0.55, -0.23) P<0.001 |
| 5 A L E M T U Z U M A B: Emerging Profile: Durable Efficacy Over 4 Years Khan, AAN 2010 90.7 90.2 76.8 77.5 |
| 6 Khan, AAN 2010 Proportion of patients with no clinical disease activity at 48 months A L E M T U Z U M A B: Emerging Profile: Freedom from Clinically Active Disease 70.5 71.7 |
| 7 Freedom From: A L E M T U Z U M A B: Emerging Profile: Freedom from Clinically Active Disease “Three years after I received my first series of doses, I woke up one morning and I, almost for a short period of time, forgot that I had MS.” D.G., US Phase 2 Trial Patient Relapse Disease progression Frequent injections “I don’t feel like an MS patient, because sometimes I even forget like I have MS. This is what the drug has done for me.” P.R., UK Phase 2 Trial Patient Patient Comments |
| 8 A L E M T U Z U M A B: Developing Safety Profile Mild to moderate infusion reactions Infections predominantly mild to moderate in severity no life-threatening or fatal infections Antibody-mediated autoimmunity ITP thyroid disorders Goodpasture’s disease Risk minimization strategy patient and investigator education laboratory monitoring signs and symptoms surveys Coles, et al, J Neurol 2006; Coles, et al., NEJM 2008; Clatworthy, et al., NEJM 2008; Kahn et al., AAN 2010 |
| 9 A L E M T U Z U M A B: Anti-GBM Disease (Goodpasture’s) Rare Event 1 event observed in Phase 2 patient was identified early, treated and recovered with near-normal renal function Two additional events reported outside of Genzyme-sponsored trials symptoms went unrecognized, identified late with end-stage renal failure Background incidence < 1/million person-years1 Early detection and treatment may prevent renal failure2 Following identification of event in Phase 2, intensified education and surveillance instituted in Genzyme-sponsored trials 1 Bolton, Kidney International 1996; 2 Levy et al., Ann Intern Med 2001 |
| 10 A L E M T U Z U M A B: Agenda Emerging profile Risk mitigation Future opportunities |
| 11 A L E M T U Z U M A B: Safety Profile: Phase 3 Risk Mitigation Investigator and patient education Monthly complete blood count, serum creatinine, urinalysis with microscopy specific instructions regarding ‘alert’ values Monthly patient survey (offset by 2 weeks) |
| 12 A L E M T U Z U M A B: Commitment to Elucidate Mechanism, Mitigate Risk 1 Hu Immunology, 2009, 2 Coles AAN 2010; 3 Turner, AAN, 2010 MS patients Depletes peripheral pools of T and B cell with relative sparing in lymphoid tissues1 Largely spares elements of innate immunity (e.g., neutrophils)2 CD52 transgenic mice Regulatory T cells preferentially spared relative to other CD4+ T cell populations2 Little depletion of developing T cells, B cells and stem cells2 Repopulation with enhanced expansion of CD8+ central memory cells and immature B cells3 Growing Understanding of Unique Mechanism of Action |
| 13 A L E M T U Z U M A B: Agenda Emerging profile Risk mitigation Future opportunities |

| 14 A L E M T U Z U M A B: Commitment to the Future Evaluating Candidate Risk Markers of Autoimmunity Jones et al., Journal of Clinical Investigation 119: p. 2052 (2009) Time after alemtuzumab Post alemtuzumab |
| 15 A L E M T U Z U M A B: Commitment to the Future In Vivo Cytolytic Activity of New Anti-CD52 Antibodies 1 mg/kg injected iv, depletion analyzed 3 days post-dosing CD4 T cells CD8 T cells B cells 0 500 1000 1500 2000 2500 3000 3500 vehicle Alemtuzumab antibody 1 antibody 2 antibody 3 |
| 16 A L E M T U Z U M A B: Potential Transformative Approach to MS Treatment Evolving and unique biological profile relative sparing of innate immunity potential to identify biomarkers of efficacy and safety Convenient dosing regimen potential for patients to “forget” about their disease Potential to ask core questions in MS treatment for the first time: can we change the course of the disease in those naïve to treatment? can we prevent or reverse existing disability in those failing existing treatment? can we induce a durable remission? |
| Alemtuzumab – A Promising New Standard of Care Terry L. Murdock Senior Vice President Analyst Day May 6, 2010 |

| 2 A L E M T U Z U M A B: Agenda Emerging profile Phase 3 program Preparing the market |
| 3 A L E M T U Z U M A B: A Promising New Standard of Care Efficacy Significantly superior to Rebif in Phase 2 study Improvement in disability Durability At 4 years Convenience Annual dosing Tolerability Manageable Potential new standard of care for an estimated $13B market in 2012* 3 *Cowen Report, October 2009 |
| 4 A L E M T U Z U M A B: Agenda Emerging profile Phase 3 program Preparing the market |

| 5 A L E M T U Z U M A B: The CARE-MS Program First pivotal trials comparing disability outcomes as a primary endpoint between an investigational agent alone and an active comparator One of the largest programs comparing disability outcomes between an investigational agent alone and an active comparator One of the largest programs to compare an investigational therapy to a currently marketed treatment in RRMS with more than 1,400 patients enrolled in more than 190 sites worldwide |
| 6 A L E M T U Z U M A B: Phase 3 Program on Track Comparison of Alemtuzumab and Rebif Efficacy in Multiple Sclerosis CARE-MS I CARE-MS II Patients 581 840 Study Duration 2 years 2 years Patient Population Treatment-naïve RRMS Onset within 5 yrs EDSS < 3.0 Treatment-experienced RRMS Onset within 10 yrs EDSS < 5.0 Treatment Arms Alemtuzumab 12 mg IFNB -1a 44 mcg 3x/week Alemtuzumab 12 mg Alemtuzumab 24 mg IFNB -1a 44 mcg 3x/week Randomization 2 : 1 2 : 2 : 1 Co-primary Outcomes Relapse Rate Disability Progression Relapse Rate Disability Progression Blinding Rater-blinded Rater-blinded |
| 7 A L E M T U Z U M A B: Extension Study Will Provide Long Term Follow-Up CARE-MS I CARE-MS II CARE-MS Extension Study An extension protocol for MS patients in Genzyme-sponsored studies of alemtuzumab CAMMS 223 Studies Long Term Follow-Up |
| 8 A L E M T U Z U M A B: Enrollment Completed Ahead of Plan Enrollment completed Sept ’09 versus plan of March ’10 sept oct now dec jan feb mar apr may jun jul aug sept oct nov dec jan feb mar apr may jun jul aug sept 340 1,080 0 500 1000 1500 2007 2008 2009 J F M A M J J A S O N D J F M A M J J A S S O N D CARE-MS I CARE-MS II |

| 9 Broad-based global interest, balanced enrollment A L E M T U Z U M A B: CARE-MS Global Enrollment from 26 Countries CARE-MS I CARE-MS II 190 sites |
| 10 2002 2003 2004 2005 2010 2011 2012 2006 2007 2008 2009 A L E M T U Z U M A B: Regulatory Timeline Enrollment period Follow-up period Phase 3, CARE-MS I Phase 3, CARE-MS II Expected Filing of BLA Estimated Approval Phase 2, CAMMS223 Complete Enrollment for: Regulatory action |
| 11 A L E M T U Z U M A B: Agenda Emerging profile Phase 3 program Preparing the market |

| 12 A L E M T U Z U M A B: Positioning as The New Standard of Care Alemtuzumab First Treatment naïve patients with active disease Drug Classes Therapeutic Effectiveness Sponsor Positioning Competitor Positioning Alemtuzumab Tysabri FTY-720 Cladribine ABCRs New benchmark Better efficacy Better efficacy Best convenience Safety experience High Low Rescue therapy – safety concerns Recent PML label update reinforces 2nd line placement Safety concerns Ineffective Inconvenient Alemtuzumab First Treatment experienced patients with active disease on therapy |
| 13 A L E M T U Z U M A B: Strategy: Establish Genzyme as a Committed Partner Clear Themes Focus of Messaging Patients first Science-oriented Strong heritage Innovative therapy Familiarity Commitment Product attributes Differentiation |
| 14 A L E M T U Z U M A B: Innovation, Science |
| 15 A L E M T U Z U M A B: Science, Innovation, Patient Support |
| 16 A L E M T U Z U M A B: Science, Innovation, Commitment, Patients |

| 17 A L E M T U Z U M A B: Application: Our AAN Booth |

| 18 A L E M T U Z U M A B: Price in MS Will Reflect Value Perceived value Expressed value Evidence- based value Price Band Research Health Economics and Outcomes Research |
| 19 Market-Specific Solutions = Successful Execution A L E M T U Z U M A B: Requires Market-Specific Solutions Transparent Conversations 2 Staged Process 4 Stakeholder Engagement 1 Region by Region Solutions 3 |
| 20 A L E M T U Z U M A B: Focus in Preparation for Global Launch - Four Key Countries MS prevalent populations across the 7 major pharmaceutical markets 100% = ~740k patients in 7 major markets; US, Germany, France, UK represent 89% or 660,000 Source: MS Atlas; GENZ market research Positive initial conversations with stakeholders 16% 9% Italy 7% Spain 3% Japan 1% 57% 7% 660,000 diagnosed patients 89% |
| 21 A L E M T U Z U M A B: Price in MS Will Reflect Value Value both on an absolute basis and relative to other therapies Risk / benefit profile created from pivotal studies Market specific solutions with governments and payers Continue availability in oncology; capture value creation in MS market Price Drivers |
| 22 S U M M A R Y: A Promising New Standard of Care Unprecedented efficacy and manageable safety profile in Phase 2 Pivotal trials remain on track for BLA filing in 2011E Mechanistic, biomarker, new antibody research in progress Market access activities underway Potential revenue beginning in 2012 |
| genzyme Personalized Genetic Health– Building our Future Geoff McDonough President, Genzyme Europe Analyst Day May 6, 2010 |

| 2 Accomplishments + Challenges in 2009 Myozyme® (alglucosidase alfa) – continued global growth Eliglustat (GENZ-112638) – potential to transform Gaucher Supply disruption – value of close stakeholder relationships Cerezyme® (imiglucerase) – clinical allocation possible Fabrazyme® (alfa-galactosidase beta) – reinforcement of value |
| 3 Agenda Personalized genetic health – building on our foundation The Gaucher portfolio: Cerezyme – gold standard leadership Eliglustat – the future of Gaucher therapy Fabrazyme – rebuilding momentum Myozyme / Lumizyme – enabling growth |

| 4 What Is Personalized Medicine? Right Medicine Right Patient Right Dose Right Time |
| 5 Diagnosis Treatment Data Capture Data Reporting Ongoing Management Health Outcomes Monitoring Personalized Health is a Broader Commitment Awareness Evaluation Undiagnosed Patient Diagnosis Treatment Long-term Commitment |
| 6 Personalized Medicine Is Not Enough Infantile Onset Pompe Disease, Results from Clinical Trial % Alive and Inv. Vent-Free Pivotal Trial Natural History Time Since Birth (Months) % 0 10 20 30 40 50 60 70 80 90 100 0 3 6 9 12 15 18 21 24 27 30 33 36 39 42 45 Kishnani PS, Corzo D, Leslie ND, et al. Early Treatment with Alglucosidase Alfa Prolongs Long Term Survival of Infants with Pompe Disease. Pediatric research 2009;66:329-55. p<0.001 |
| 7 Taipei Quemoy Personalized Health in Practice Newborn Screening for Pompe Disease Two successful newborn screening technology partnerships Taiwan was the ideal first newborn screening implementation 3 screening centers 22 referring hospitals public health nurse follow-up system Chien YH, Chiang SC, Zhang XK, et al. Early detection of Pompe disease by newborn screening is feasible: results from the Taiwan screening program. Pediatrics 2008;122:e39-45. Referral Hospital Collecting Institution 50 10 |
| 8 Personalized Medicine Is Not Enough Infantile Onset Pompe Disease, Results in Taiwan % Alive and Inv. Vent-Free Natural History Taiwan Taiwan NBS Pivotal Trial Natural History Time Since Birth (Months) % 0 10 20 30 40 50 60 70 80 90 100 0 3 6 9 12 15 18 21 24 27 30 33 36 39 42 45 Kishnani PS, Corzo D, Leslie ND, et al. Early Treatment with Alglucosidase Alfa Prolongs Long Term Survival of Infants with Pompe Disease. Pediatric research 2009;66:329-55.; Chien YH, Lee NC, Thurberg BL, et al. Pompe disease in infants: improving the prognosis by newborn screening and early treatment. Pediatrics 2009;124:e1116-25 |
| 9 Survival Improved Survival in Screened IOPD Patients Screened IOPD Patients Have Nearly Normal Motor Outcome Personalized Health Delivers Outcomes Infantile Onset Pompe Disease, Results in Taiwan Chien YH, Lee NC, Thurberg BL, et al. Pompe disease in infants: improving the prognosis by newborn screening and early treatment. Pediatrics 2009;124:e1116-25. Walk age analysis |
| 10 The Faces of Personalized Health Liberty Times Friday, October 28th, 2008 |

| 11 Demonstrating Personalized Health Outcomes Global Registries Enrollment Pompe 832 Patients 160 MDs 28 Countries Gaucher 5,828 Patients 714 MDs 62 Countries 26 Publications Pompe MPS I Fabry Gaucher 0 2,000 4,000 6,000 8,000 10,000 12,000 2001 2002 2003 2004 2005 2006 2007 2008 2009 April 2010 |
| 12 PGH Is a Comprehensive, Outcomes-Oriented Approach Integrates the decades of experience we have built in rare diseases Global Registries Diagnostic infrastructure Charitable programs Reimbursement/services Applies to all geographies, irrespective of development status ERT products available in >100 countries Positions us to meet the challenge of value-based reimbursement Data development and outcomes reporting to be integrated to business model Anticipates the needs of a broader portfolio of therapies building upon the LSD franchise, and can apply to other Genzyme products PGH pipeline Mipomersen Alemtuzumab MS |
| 13 PGH Portfolio Extends Our Reach... Neuro-Ophtho Genetic Disease LSD Development LSD 250,000+ 50,000 20,000 10,000 Worldwide Patients |
| 14 ...Into Several New Areas in Medium-Term Cerezyme Fabrazyme Aldurazyme Myozyme Elaprase 2010 Cystic Fibrosis eliglustat Cerezyme Fabrazyme Aldurazyme Myozyme Elaprase 2011 - 2013 5 7 DMD Hemophilia Niemann Pick B AMD Cystic Fibrosis eliglustat Cerezyme Fabrazyme Aldurazyme Myozyme Elaprase 2014 - 2017 11 Myotonic Dystrophy Parkinson’s Huntington ALS SRT Fabry neoGAA DMD Hemophilia Niemann Pick B AMD Cystic Fibrosis eliglustat Cerezyme Fabrazyme Aldurazyme 2018 and Beyond Neuro-Ophtho Genetic Disease LSD Development LSD |
| 15 Niemann-Pick B Will Complement Gaucher Presence Niemann-Pick B Disease An LSD like Gaucher hepatosplenomegaly pain and fatigue lung disease premature death Approx. 2,800 cases WW (like Aldurazyme) Niemann-Pick B Gaucher Type 1 |
| 16 Age Related Macular Degeneration – Gene Therapy Leading cause of blindness in persons of European descent (ages 65+) ~ 1.7 MM wet AMD patients in US(1) ~ 180,000 new tx eligible patients in US(2) Treated by retinal specialists (<2,000 in U.S.) Target one injection every 18+ months Ability to manufacture at scale Therapeutic Goal Images Courtesy of National Eye Institute, National Institutes of Health (1) Arch Ophthalmol. 2004; 122(4):564-572. (2) Annual incidence derived per Beaver Dam Eye Study five-year follow-up results |
| 17 Agenda Personalized genetic health – building on our foundation The Gaucher portfolio: Cerezyme – gold standard leadership Eliglustat – the future of Gaucher therapy Fabrazyme – rebuilding momentum Myozyme / Lumizyme – enabling growth |

| 18 Gaucher Treatment Market Landscape Has Changed Supply disruption a major challenge to the patient and physician community Genzyme has worked to maintain constructive relationships through this difficult period |
| 19 Cerezyme Makes a Difference in the Lives of Patients |
| 20 Cerezyme Remains the Market Leader Cerezyme is the only therapy with a 16-year history of reducing and reversing many Gaucher symptoms and risks 93% of patients meet 4 of 6 therapeutic goals within four years of initiating Cerezyme therapy Cerezyme European label updated to include differentiating benefits Safe for pregnant women Impact on bone Q4 week dosing as a therapeutic option Infusion rate of 1U/min/kg Cerezyme is the only approved treatment for Gaucher disease with extensive clinical evidence showing positive bone outcomes #1 Cerezyme imiglucerase for injection |
| 21 Cerezyme Is the Only ERT Labeled to Treat the Bone Dose-dependent improvements in bone mineral density Wenstrup et al. J Bone Min Res 2007; 22:119-26 Dose-dependent substrate clearance in bone marrow de Fost et al. Blood 2006; 108:830-835 Improved quality of life in patients with skeletal disease Weinreb et al. Clin Genet 2007; 71:576-588 Maintenance of therapeutic goals on q4 week dosing Kishnani PS et al., Mol Genet Metab 2009; 96:164 41% reduction in the risk of developing AVN for patients initiating Cerezyme therapy within two years of diagnosis Mistry et al., Br J Haematol 2009 Reduction in bone pain and bone crises Charrow et al. Clin Genet. 2007 Mar;71(3):205-11 |
| 22 Cerezyme Impacts the Most Debilitating Aspect of Gaucher Dose-dependent improvements in bone mineral density Wenstrup et al. J Bone Min Res 2007; 22:119-26 Dose-dependent substrate clearance in bone marrow de Fost et al. Blood 2006; 108:830-835 Improved quality of life in patients with skeletal disease Weinreb et al. Clin Genet 2007; 71:576-588 Maintenance of therapeutic goals on q4 week dosing Kishnani PS et al., Mol Genet Metab 2009; 96:164. 41% reduction in the risk of developing AVN for patients initiating Cerezyme therapy within two years of diagnosis Mistry et al., Br J Haematol 2009 22 Reduction in bone pain and bone crises Charrow et al. Clin Genet. 2007 Mar;71(3):205-11 Long-term Cerezyme treatment can normalize BMD Cerezyme improves bone pain as early as 3 months, decreases bone crisis within 12 months, and improves bone mineral density after 24 months Cerezyme delivers unparalleled bone results: Cerezyme improves growth in children, reduces bone crises and bone pain, reduces bone marrow infiltration by Gaucher cells, and improves bone mineral density in patients with documented skeletal disease |
| 23 Medical Expert Committee Provides Budget Reimburses Therapy Determines Coverage Advises Physician Global Reach and Partnering Approach Is Key Life-Saving Drugs Fund Department of Health and Aging Provides Patient Reports Collects Data |
| 24 Eliglustat tartrate Is Engaging the Gaucher Community Engaging more than 450 Type 1 Gaucher patients in eliglustat trials by end of 2011 Actively enrolling patients in the ENCORE and ENGAGE trials 16 active sites for ENCORE 17 active sites for ENGAGE EDGE trial is ramping up Investigators’ Meeting held March 19th, 2010 |
| 25 Two Year Data Comparable to Historical Experience with Cerezyme Percent Change 8.0 0.0 -2.0 -4.0 -6.0 -8.0 6.0 4.0 2.0 Change in g/dL -90 -60 -30 0 30 60 90 Baseline 1 year 2 years 18 months 6 months Platelets Hemoglobin Spleen Treatment Changes (compared to historical data) 22% -22% 81% 63% 40% -36% -47% -52% 0.9g/dL 1.6g/dL 1.8g/dL 2.1g/dL Grabowski GA, et al. Ann Intern Med. Jan 1 1995;122(1):33-39 Cerezyme clinical study RC92-051, Genzyme data on file ICGG Gaucher Registry 2009 Annual Report, data to Dec 31, 2008, Genzyme on file Lukina E et al. Blood. 2010;in press Peterschmitt M, et al. Mol Genet Metab. 2010;99(2):S30 |
| 26 2 Year Lumbar Spine DXA Z-Score by Baseline Value normal range at 2 years normal range at baseline -3.5 -3.0 -2.5 -2.0 -1.5 -1.0 -0.5 0.0 0.5 1.0 -3.5 -3 -2.5 -2 -1.5 -1 -0.5 0 0.5 1 Baseline Z-score 2 year Z-score Two Year Data on Bone Density Is Encouraging Peterschmitt M, et al. Mol Genet Metab. 2010;99(2):S30 |
| 27 Patient Three Year Experience – Perm, Russia Michael: pre-treatment (18 years), 3 years post-treatment (21 years) December 2006 December 2009 |
| 28 Eliglustat Could Expand Market & Become 1st Line 1,000+ Gaucher patients diagnosed but untreated in the Gaucher Registry as of December 2009 Infusions are difficult or undesirable for some patients Bone disease is the primary cause of morbidity and reduced quality of life for Gaucher patients Developing the evidence for value globally clinical trial presence in China, India & Russia |
| 29 Agenda Personalized genetic health – building on our foundation The Gaucher portfolio: Cerezyme – gold standard leadership Eliglustat – the future of Gaucher therapy Fabrazyme – rebuilding momentum Myozyme / Lumizyme – enabling growth |

| 30 Fabrazyme Value Increasingly Recognized Perceived value has increased during the supply disruption as physicians conserve supply Fabry treatment expectations are now linked to published measurable and achievable clinical outcomes “Change in GFR will ideally be < -1 ml/min/1.73 m2/year for baseline GFR < 135 ml/min/1.73 m2” Warnock, Daina, Remuzzi et al, C-JASN, December 2009 |
| 31 The Fabry Market Will Continue to Grow Progress in emerging markets First commercial sales in Russia Q1’10 1 2 3 Dried blood spot test, high risk screening, and family counselling are mutually supportive Fabry patient identification is accelerating Fabry demographics are changing We are evaluating the unmet clinical need of young women and children through biomarker development and registry studies |

| 32 We Are Focused on Remaining Unmet Needs Genzyme sponsored biomarker research will guide early diagnosis and intervention and introduce personalized health to Fabry disease The Fabrazyme Intervention Early at a Lower Dose (FIELD) study has recruited 30 subjects to investigate the benefit of early Fabrazyme intervention in young boys Genzyme-sponsored studies are evaluating the benefit of early intervention in women with Fabry disease |
| 33 Fabrazyme Summary Strong Fabrazyme growth prior to supply disruption indicates confidence in brand Fabrazyme value increasingly recognized and linked to treatment expectation We are strategically focused on remaining unmet needs, which will increasingly drive growth |
| 34 Agenda Personalized genetic health – building on our foundation The Gaucher portfolio: Cerezyme – gold standard leadership Eliglustat – the future of Gaucher therapy Fabrazyme – rebuilding momentum Myozyme / Lumizyme – enabling growth |

| 35 Myozyme: Our Most Successful Launch *Reflects the first full fiscal year after launch Aldurazyme Fabrazyme Cerezyme Myozyme Lumizyme $500M $400M $300M $200M $100M $M 0 1 year* 2 year 3 year genzyme |
| 36 Significant Opportunity Remains 1,800 1,300 18,700 Symptomatic Identified Treated genzyme |

| 37 A Billion Dollar Opportunity: Europe in 2008 Vials per million inhabitants Countries 50% penetration of “addressable” patients NL ≈ $1B |
| 38 Actual Progress in 2009 Vials per million inhabitants ≈ $1B NL Countries 50% penetration of “addressable” patients |
| 39 Growth Is Driven by Existing and New Markets 1 2 3 Patient identification and treatment in existing markets Lumizyme launch in the US Entry into new markets |
| 40 The Majority of the Existing & Future Market Are Adults Commercial Patients Diagnosed but Untreated (Patient Pipeline) + ATAP Adult 62% Infant 12% Juvenile 26% Adult 88% Infant 5% Juvenile 7% |
| 41 Keys to Unlocking the Adult Potential Data Upgrade labels in EU, US, and ROW Ability to promote with a claim of efficacy LOTS Manuscript Real-world effectiveness publications Pompe Registry Label Enhancement |
| 42 Diagnostic Testing Is Evolving Research & Learning Routine Application Blood testing infrastructure High-risk testing programs Sub-populations Publications Elevate Pompe in the differential diagnosis Recognize/suspect symptoms Rule out Pompe as a standard practice Patient Identification 1. 2. 3. 4. 1. 2. 3. |
| 43 High-Risk Testing for Pompe Is Taking Hold Worldwide Prospective (studies, projects) Retrospective (chart & biopsy reviews) Respiratory and/or Sleep disorders High CK, LGM Weakness +/- Respiratory Sx |
| 44 Example: PoPS (Pompe Prevalence Study) Evaluate the prevalence of Pompe disease among patients with progressive limb-girdle muscle weakness with or without respiratory insufficiency Study Objective Claude Desnuelle, MD, Centre Hospitalier Universitaire de Nice National multi-center study of 16 investigators in France Investigator/ Center Clinicaltrials.gov |
| 45 Lumizyme in the US – Large Growth Driver Lumizyme action date approaching PDUFA Date June 17th, 2010 Lumizyme launch Transition from ATAP Enables promotion If the US achieves the current actual penetration in Holland, there could be ~1,800 treated Pompe patients over time |
| 46 Extraordinary Awareness Created by Movie Media outreach >1,000 print and online stories ~200 broadcast stations Reached estimated audience of ~ 489 million Online presence Pompe disease made Yahoo top 10 www.pompe.com www.genzyme.com/pompemovie Increase in number of diagnosed patients in the US |
| 47 Myozyme Generating Sales in 43 countries Revenues in Q1:10 Expected to generate revenue by 2015 |
| 48 Personalizing the Approach to Treatment Elimination of Antibodies to Recombinant Enzyme in Pompe’s Disease |
| 49 GAA NeoGAA M6PR Maintaining Leadership with Next Generation ERT |
| 50 Vehicle GAA (20) NeoGAA (20) 6 Pompe mice per group received neoGAA (4, 12 or 20 mg/kg) or rhGAA (20, 60 or 100 mg/kg) once per week for 4 weeks Mice sacrificed 7 days after the last dose and tissues harvested Opportunity for Greater Efficacy at a Lower Dose 4x Weekly Dosing (Muscle) GAA NeoGAA 0 20 40 60 80 100 0 2 4 6 8 mg/kg GAA Glycogen, mg/g Tissue |

| 51 Summary: We’ve Only Just Begun Pompe disease potential is big > $1B We are in a good position to grow Strong data and tools to support growth Investing in efforts to improve upon Pompe treatment Our goal is to individually optimize the health of those with Pompe disease |
| 52 PGH Is Positioned to Drive Growth and Innovation Building on our foundation Advancing a broader portfolio Expanding our capabilities Adapting our business model for the future |
| Synvisc-One: A Life Changing Therapy Mark Twyman SVP, GM, Osteoarthritis |

| Agenda Status today Strategy for continued US growth |
| Synvisc® (Hylan G-F 20) Is One of a Kind Elastoviscous properties similar to natural synovial fluid Molecular weight similar to natural synovial fluid Enhanced intra-articular residence time 6 months of knee pain relief Only Synvisc® (hylan G-F 20) and Synvisc-One® (hylan G-F 20) are made from 2 cross-linked polymers |
| US Leadership Position Extended During 2009 Position in market Revenue increase in 2009 Unit volume increase in 2009 Share points gained since March 2009 launch Single-injection product approved for use in US YTD Synvisc-One % of franchise volume Only product 16 points 29% 31% Leader ~60% |
| The Market Is Large, Growing and Under-penetrated 10M Total Eligible Patients* 2009 Projected Synvisc franchise visco patients Competitor visco patients ~ 10%* penetration of current visco- supplementation eligible patients Only Untapped potential *USA-NHANES III database |
| Agenda Status today Strategy for continued US growth |

| 2010: A Clear Strategy for Continued Growth Drive shift in treatment paradigm establish knee OA as chronic disease requiring proactive ongoing management with Synvisc-One Generate patient demand intensify efforts to motivate the patient to seek treatment and request Synvisc-One 1 2 3 Differentiate from competition for existing and new visco supplement patients |

| STRATEGY #1: DIFFERENTIATE FROM COMPETITION Intra-articular Injections Are Not Insignificant! One injection = significant advantage |
| Number of Injections STRATEGY #1: DIFFERENTIATE FROM COMPETITION Dramatically Improved Patient Experience – Reduced Patient and Healthcare System Cost 1 3 5 5 8 9 |
| STRATEGY #1: DIFFERENTIATE FROM COMPETITION Potential US Single Injection Entrants Have Had Difficulty Getting to Market Durolane not recommended for approval by FDA Advisory Panel (Q2:09) January 2010 Seikagaku received not approvable letter from FDA for Gel-200 Anika-Monovisc under review three month primary endpoint |
| View knee OA as chronic disease that requires ongoing management Schedule Synvisc-One use as early as possible for the indicated treatment Manage patient to maximize pain-free lifestyle Physicians STRATEGY #2: DRIVE SHIFT IN TREATMENT PARADIGM Establishing Knee OA as a Chronic Disease that Is Proactively Managed with Synvisc-One Physicians Patients Payers |

| Understand that OA knee pain is treatable and manageable Aware of options, feel empowered to request Synvisc-One Proactive about managing their treatment to maximize pain-free lifestyle Patients STRATEGY #2: DRIVE SHIFT IN TREATMENT PARADIGM Establishing Knee OA as a Chronic Disease that Is Proactively Managed with Synvisc-One Physicians Patients Payers |
| Payers STRATEGY #2: DRIVE SHIFT IN TREATMENT PARADIGM Establishing Knee OA as a Chronic Disease that Is Proactively Managed with Synvisc-One Advocate for Synvisc-One as the mainstay of chronic treatment Partner with Genzyme around disease management Assure policy alignment with disease management objectives Physicians Patients Payers |
| STRATEGY #3: GENERATE PATIENT DEMAND Our Comprehensive DTC “Program” Engages the Patient In Home Website Direct Mail Email Community Senior Centers Patient Advocacy Mass Media TV Print Online PR “After getting Synvisc-One my knee felt great I felt like I could go out there and play another 23 years!” Ads Brochures DVD Dr. Office |
| STRATEGY #3: GENERATE PATIENT DEMAND The Synvisc-One DTC Campaign Is Strategic and Generates a Positive ROI TV Print Online Patient Segmentation High Priority Segment 1 Low Priority Segment 5 Patient Education 1st Time Repeat Cost per Qualified Lead ROI The DTC Program The Strong Metrics 3:1 3.6:1 2009 2010E $39 $29 2009 2010E |
| Synvisc-One Has Changed the Trajectory of the Performance Curve for the Franchise Units Sold (000’s) 6% 24% 25% 29% US Ex-US +20% +25% 351 368 397 511 640 290 248 236 249 309 2006 2007 2008 2009 2010E |
| SUMMARY Synvisc-One: A Life-Changing Therapy One-of-a-kind product unique formulation Extended market leadership position in 2009 grew franchise share 16 points Synvisc-One is the market leader Significant market opportunity large, growing, under-penetrated Clear strategy for continued growth differentiate chronic disease management patient demand |
Genzyme Corporation
Analyst Day
May 6, 2010
Appendix to Presentations of Henri Termeer and Michael Wyzga
Cash Flow Return on Invested Capital Calculation
Reconciliations of GAAP to Non-GAAP Earnings for 2002 through 2009
GENZYME CORPORATION
CASH FLOW RETURN ON INVESTED CAPITAL CALCULATION
(in millions, except percentages)
The company uses Cash Flow Return on Tangible Invested Capital (CFROI) as a measure of the efficiency and effectiveness of its use of capital. CFROI is not a measure of financial performance under generally accepted accounting principles (GAAP) and may not be defined and calculated by other companies in the same manner. This non-GAAP financial measure is not intended to be considered in isolation or as a substitute for GAAP measures.
We define CFROI as follows:
| Total Adjusted Cash Profits |
|
|
|
|
Average Tangible Invested Capital |
|
|
| ||
|
|
|
| ||
We define Adjusted Cash Profits as follows: |
| We define Tangible Invested Capital as follows: |
| ||
GAAP net income (loss) |
| Total assets |
| ||
+ Operating lease expense |
| - Non-interest bearing liabilities (d) |
| ||
+ Depreciation expense |
| - Deferred taxes |
| ||
+ Amortization expense, net of tax |
| + Capitalized research and development (e) |
| ||
- Other income (expenses), net of tax |
| + Capitalized operating leases (f) |
| ||
+ Other non-operating items, net of tax |
| + Accumulated depreciation |
| ||
+ Acquisition related expense, net of tax |
| - Goodwill and intangibles, net |
| ||
+ Non-GAAP research and development expense |
| - Excess cash (g) |
| ||
= Total Adjusted Cash Profits |
| - Long-term investments |
| ||
|
| =Total Tangible Invested Capital |
| ||
|
|
|
| ||
We define Average Tangible Invested Capital as follows: |
|
|
| ||
Prior year tangible invested capital |
|
|
| ||
+ Current year tangible invested capital |
|
|
| ||
= Average Tangible Invested Capital |
|
|
| ||
Consolidated CFROI Calculation |
|
|
|
|
|
|
| Consolidated |
| ||||
|
| 2006 |
| 2009 |
| ||
Adjusted Cash Profits |
|
|
|
|
| ||
GAAP net income (loss) |
| $ | (16.8 | ) | $ | 422.3 |
|
Operating lease expense |
| 60.9 |
| 81.8 |
| ||
Depreciation expense |
| 122.0 |
| 190.1 |
| ||
Amortization expense, net of tax (a) |
| 132.3 |
| 185.0 |
| ||
Other income (expenses), net of tax (a) |
| (87.7 | ) | (27.7 | ) | ||
Other non-operating items, net of tax (b) |
| 134.3 |
| 19.2 |
| ||
Acquisition related expense, net of tax |
| 404.3 |
| 48.5 |
| ||
Non-GAAP research and development (c) |
| 565.4 |
| 803.9 |
| ||
Total Adjusted Cash Profits |
| $ | 1,314.7 |
| $ | 1,723.1 |
|
|
|
|
|
|
| ||
Tangible Invested Capital |
|
|
|
|
| ||
Total assets |
| $ | 7,191.2 |
| $ | 10,060.7 |
|
Non-interesting bearing liabilities (d) |
| (714.4 | ) | (1,237.2 | ) | ||
Deferred taxes |
| (136.9 | ) | (555.2 | ) | ||
Capitalized research and development (e) |
| 2,747.0 |
| 3,910.0 |
| ||
Capitalized operating leases (f) |
| 730.8 |
| 981.6 |
| ||
Accumulated depreciation |
| 695.4 |
| 1,077.8 |
| ||
Goodwill and intangibles, net |
| (2,790.8 | ) | (3,716.6 | ) | ||
Excess cash (g) |
| (252.5 | ) | (402.8 | ) | ||
Long-term investments |
| (673.5 | ) | (143.8 | ) | ||
Total Tangible Invested Capital |
| $ | 6,796.30 |
| $ | 9,974.50 |
|
|
|
|
|
|
| ||
Average Tangible Invested Capital |
| 6,466.0 |
| 9,401.7 |
| ||
|
|
|
|
|
| ||
Cash Flow Return on Tangible Invested Capital |
| 20.3 | % | 18.3 | % | ||
Business Unit CFROI Calculation
Solely for purposes of management reporting of CFROI by business unit, certain of Genzyme’s corporate expenses, income, assets and liabilities have been distributed to the business units. A large portion of Genzyme’s fixed assets are considered corporate assets because the assets support the manufacturing of multiple products. Corporate G&A is distributed amongst the business units based on revenue. In addition, cash, long-term investments and investments in equity securities are also considered corporate assets and are distributed to the business units based on net income(loss). Business units incurring net losses were charged with negative cash, long-term investments and investments in equity securities balances. Genzyme has treated the total of cash, long-term investments and investments in equity securities, if negative, as a loan and charges interest expense to the borrowing business units and credits interest income to the loaning business units. Genzyme provides CFROI by business unit data for its significant business units only. Therefore, the individual CFROI by business unit calculations are not intended to aggregate to Genzyme’s overall CFROI calculation.
|
| 2006 |
| |||||||||||||
|
| Personalized |
| Renal & |
| Biosurgery |
| Hematology & |
| Other |
| |||||
Adjusted Cash Profits |
|
|
|
|
|
|
|
|
|
|
| |||||
Management reporting net income (loss) (h) |
| $ | 459 |
| $ | 124 |
| $ | 10 |
| $ | (443 | ) | $ | (176 | ) |
Operating lease expense |
| 27 |
| 13 |
| 7 |
| 4 |
| 8 |
| |||||
Depreciation expense |
| 54 |
| 29 |
| 9 |
| 16 |
| 14 |
| |||||
Amortization expense, net of tax |
| 2 |
| 52 |
| 44 |
| 27 |
| 8 |
| |||||
Other income (expenses), net of tax |
| — |
| — |
| — |
| — |
| — |
| |||||
Other non-operating items, net of tax |
| (46 | ) | (24 | ) | (13 | ) | (7 | ) | 137 |
| |||||
Acquisition related expense, net of tax |
| — |
| — |
| — |
| 404 |
| — |
| |||||
Non-GAAP research and development |
| 301 |
| 115 |
| 54 |
| 79 |
| 15 |
| |||||
Inter-divisional interest |
| 37 |
| 5 |
| (10 | ) | (30 | ) | (2 | ) | |||||
Total Adjusted Cash Profits |
| $ | 834 |
| $ | 314 |
| $ | 102 |
| $ | 50 |
| $ | 4 |
|
|
|
|
|
|
|
|
|
|
|
|
| |||||
Tangible Invested Capital |
|
|
|
|
|
|
|
|
|
|
| |||||
Total assets |
| $ | 4,405 |
| $ | 1,812 |
| $ | 568 |
| $ | 1,237 |
| $ | 513 |
|
Non-interesting bearing liabilities (d) |
| (256 | ) | (148 | ) | (109 | ) | (108 | ) | (137 | ) | |||||
Deferred taxes |
| (205 | ) | 226 |
| 33 |
| (115 | ) | (76 | ) | |||||
Capitalized research and development (e) |
| 1,047 |
| 478 |
| 211 |
| 912 |
| 100 |
| |||||
Capitalized operating leases (f) |
| 336 |
| 161 |
| 89 |
| 49 |
| 95 |
| |||||
Accumulated depreciation |
| 274 |
| 162 |
| 81 |
| 40 |
| 138 |
| |||||
Goodwill and intangibles, net |
| (553 | ) | (985 | ) | (366 | ) | (750 | ) | (136 | ) | |||||
Excess cash (g) |
| (216 | ) | (43 | ) | — |
| — |
| 6 |
| |||||
Long-term investments |
| (1,141 | ) | (189 | ) | — |
| — |
| — |
| |||||
Total Tangible Invested Capital |
| $ | 3,691 |
| $ | 1,474 |
| $ | 507 |
| $ | 1,265 |
| $ | 503 |
|
|
|
|
|
|
|
|
|
|
|
|
| |||||
Average Tangible Invested Capital |
| 3,213 |
| 1,296 |
| 444 |
| 1,113 |
| 440 |
| |||||
|
|
|
|
|
|
|
|
|
|
|
| |||||
Cash Flow Return on Tangible Invested Capital |
| 26.0 | % | 24.2 | % | 23.0 | % | 4.5 | % | 0.9 | % | |||||
|
| 2006 |
| 2009 |
|
|
|
|
|
|
|
|
Notes: |
|
|
|
|
|
|
|
|
|
|
|
|
(a) Tax effect on: |
|
|
|
|
|
|
|
|
|
|
|
|
Other income (expenses) |
| 50.2 |
| 12.3 |
|
|
|
|
|
|
|
|
Amortization expense |
| (77.0 | ) | (81.4 | ) |
|
|
|
|
|
|
|
(b) Represents in 2009, gain on acquisition of business of $24.2 net of tax of ($6.6) and minority interest of $2.5 net of tax of ($0.9) and in 2006, minority interest of $10.4 net of tax of ($3.8), equity in income of equity method investments of $15.7 net of tax of ($5.7), impairment of goodwill of $219.2 net of tax of ($69.8) and settlement of tax audits of ($31.7).
(c) For 2006, Non-GAAP research and development expense excludes $19.3 million of expenses related to Genzyme’s joint venture with Dyax.
(d) Non-interest bearing liabilities equals total liabilities less debt and contingent consideration obligations.
(e) Represents approximate cumulative capitalized research and development, net of applicable depreciation. R&D is capitalized because it is considered an investment that should generate returns in the future.
(f) Represents operating lease expense multiplied by 12.
(g) Represents cash and short-term investments less 5% of total assets. Business units’ excess cash represents an allocation of corporate excess cash to cash positive businesses.
(h) Management reporting net income (loss) is derived solely for the purpose of calculating CFROI. It is not intended to represent GAAP net income (loss).
GENZYME CORPORATION
RECONCILIATION OF GAAP TO NON-GAAP EARNINGS
For the Year Ended December 31, 2009
(Amounts in thousands, except percentage and per share data)
|
|
|
|
|
|
|
|
|
|
|
|
|
|
|
|
|
|
|
|
|
|
|
|
|
|
|
|
|
|
|
|
|
|
|
|
|
|
|
|
| OTHER DISCRETE ITEMS |
| |||||||||||
|
|
|
|
|
| Bayer |
|
|
|
|
|
|
| (included in GAAP and Non-GAAP results) |
| |||||||||||
|
|
|
| GAAP |
| Acquisition |
| FAS 123R |
|
|
|
|
| Manufacturing |
| Technology |
| Q2 Inventory |
| |||||||
|
|
|
| As Reported |
| Related (2) |
| Expense |
|
|
| NON-GAAP (1) |
| Related |
| Purchase |
| Fair Value Step-up (2) |
| |||||||
Income Statement Classification: |
|
|
|
|
|
|
|
|
|
|
|
|
|
|
|
|
|
|
| |||||||
|
|
|
|
|
|
|
|
|
|
|
|
|
|
|
|
|
|
|
| |||||||
Total revenues |
|
|
| $ | 4,515,525 |
|
|
|
|
|
|
| $ | 4,515,525 |
|
|
|
|
|
|
| |||||
|
|
|
|
|
|
|
|
|
|
|
|
|
|
|
|
|
|
|
| |||||||
Cost of products and services sold |
|
|
| $ | (1,386,076 | ) | $ | 36,822 |
| $ | 32,314 |
|
|
| $ | (1,316,940 | ) | $ | 76,398 |
|
|
| $ | 6,639 |
| |
Gross margin |
| 69 | % | $ | 3,129,449 |
| $ | 36,822 |
| $ | 32,314 |
| 71 | % | $ | 3,198,585 |
| $ | 76,398 |
|
|
| $ | 6,639 |
| |
|
|
|
|
|
|
|
|
|
|
|
|
|
|
|
|
|
|
|
| |||||||
Selling, general and administrative |
|
|
| $ | (1,428,596 | ) |
|
| $ | 110,410 |
|
|
| $ | (1,318,186 | ) |
|
|
|
|
|
| ||||
|
|
|
|
|
|
|
|
|
|
|
|
|
|
|
|
|
|
|
| |||||||
Research and development |
|
|
| $ | (865,257 | ) |
|
| $ | 61,391 |
|
|
| $ | (803,866 | ) |
|
| $ | 25,180 |
|
|
| |||
|
|
|
|
|
|
|
|
|
|
|
|
|
|
|
|
|
|
|
| |||||||
Amortization of intangibles |
|
|
| $ | (266,305 | ) |
|
|
|
|
|
| $ | (266,305 | ) |
|
|
|
|
|
| |||||
|
|
|
|
|
|
|
|
|
|
|
|
|
|
|
|
|
|
|
| |||||||
Contingent consideration expense |
|
|
| $ | (65,584 | ) | $ | 65,584 |
|
|
|
|
| $ | — |
|
|
|
|
|
|
| ||||
|
|
|
|
|
|
|
|
|
|
|
|
|
|
|
|
|
|
|
| |||||||
Gains (losses) on investments in equity securities |
|
|
| $ | (56 | ) |
|
|
|
|
|
| $ | (56 | ) |
|
|
|
|
|
| |||||
|
|
|
|
|
|
|
|
|
|
|
|
|
|
|
|
|
|
|
| |||||||
Gain on acquisition of business |
|
|
| $ | 24,159 |
| $ | (24,159 | ) |
|
|
|
| $ | — |
|
|
|
|
|
|
| ||||
|
|
|
|
|
|
|
|
|
|
|
|
|
|
|
|
|
|
|
| |||||||
Other |
|
|
| $ | (1,719 | ) |
|
|
|
|
|
| $ | (1,719 | ) | $ | 1,484 |
|
|
|
|
| ||||
|
|
|
|
|
|
|
|
|
|
|
|
|
|
|
|
|
|
|
| |||||||
Investment income |
|
|
| $ | 17,642 |
|
|
|
|
|
|
| $ | 17,642 |
|
|
|
|
|
|
| |||||
|
|
|
|
|
|
|
|
|
|
|
|
|
|
|
|
|
|
|
| |||||||
Interest expense |
|
|
| $ | — |
|
|
|
|
|
|
| $ | — |
|
|
|
|
|
|
| |||||
|
|
|
|
|
|
|
|
|
|
|
|
|
|
|
|
|
|
|
| |||||||
Summary: |
|
|
|
|
|
|
|
|
|
|
|
|
|
|
|
|
|
|
| |||||||
|
|
|
|
|
|
|
|
|
|
|
|
|
|
|
|
|
|
|
| |||||||
Income (loss) before income taxes | �� |
|
| $ | 543,733 |
| $ | 78,247 |
| $ | 204,115 |
|
|
| $ | 826,095 |
| $ | 77,882 |
| $ | 25,180 |
| $ | 6,639 |
|
|
|
|
|
|
|
|
|
|
|
|
|
|
|
|
|
|
|
|
| |||||||
(Provision for) benefit from income taxes |
| 22 | % | $ | (121,433 | ) | $ | (29,739 | ) | $ | (53,434 | ) | 25 | % | $ | (204,606 | ) | $ | (17,956 | ) | $ | (8,118 | ) | $ | (1,302 | ) |
|
|
|
|
|
|
|
|
|
|
|
|
|
|
|
|
|
|
|
| |||||||
Net income (loss) |
|
|
| $ | 422,300 |
| $ | 48,508 |
| $ | 150,681 |
|
|
| $ | 621,489 |
| $ | 59,926 |
| $ | 17,062 |
| $ | 5,337 |
|
|
|
|
|
|
|
|
|
|
|
|
|
|
|
|
|
|
|
|
| |||||||
Net income (loss) per share: |
|
|
|
|
|
|
|
|
|
|
|
|
|
|
|
|
|
|
| |||||||
Basic |
|
|
| $ | 1.57 |
| $ | 0.18 |
| $ | 0.56 |
|
|
| $ | 2.31 |
| $ | 0.22 |
| $ | 0.06 |
| $ | 0.02 |
|
|
|
|
|
|
|
|
|
|
|
|
|
|
|
|
|
|
|
|
| |||||||
Diluted |
|
|
| $ | 1.54 |
| $ | 0.18 |
| $ | 0.55 |
|
|
| $ | 2.27 |
| $ | 0.22 |
| $ | 0.06 |
| $ | 0.02 |
|
|
|
|
|
|
|
|
|
|
|
|
|
|
|
|
|
|
|
|
| |||||||
Weighted average shares outstanding: |
|
|
|
|
|
|
|
|
|
|
|
|
|
|
|
|
|
|
| |||||||
Basic |
|
|
| 268,841 |
| 268,841 |
| 268,841 |
|
|
| 268,841 |
|
|
|
|
|
|
| |||||||
|
|
|
|
|
|
|
|
|
|
|
|
|
|
|
|
|
|
|
| |||||||
Diluted |
|
|
| 274,071 |
| 274,071 |
| 274,071 |
|
|
| 274,071 |
|
|
|
|
|
|
| |||||||
Notes:
(1) Represents the Non-GAAP results of operations for Genzyme Corporation for the year ended December 31, 2009. We believe that certain Non-GAAP financial measures, when considered together with the GAAP figures, can enhance the overall understanding of the company’s past financial performance and its prospects for the future. The Non-GAAP financial measures are included with the intent of providing investors with a more complete understanding of the trends underlying our operating results and financial position and are among the primary indicators management uses for planning and forecasting purposes and measuring the company’s performance. Such Non-GAAP financial measures should not be considered in isolation or used as a substitute for GAAP. Earnings per share are calculated as net income (loss) divided by weighted average shares outstanding. Therefore, earnings per share may not add across due to rounding.
(2) “Bayer Acquisition Related” includes the gain on acquisition, contingent consideration expense and, beginning with Q3 2009, the inventory fair value step-up associated with our acquisition from Bayer. The initial inventory fair value step-up in Q2 for the Bayer transaction was presented as “Other Discrete Items”.
GENZYME CORPORATION
RECONCILIATION OF GAAP TO NON-GAAP EARNINGS
For the Year Ended December 31, 2008
(Amounts in thousands, except percentage and per share data)
|
|
|
|
|
|
|
|
|
|
|
| Items Formerly Excluded from Non-GAAP [(Income)/Expense] |
| ||||||||||||||||
|
|
|
|
|
|
|
|
|
|
|
| Dilution |
|
|
|
|
|
|
|
|
| ||||||||
|
|
|
|
|
|
|
|
|
|
|
| Due to |
| Validation/ |
|
|
|
|
|
|
| ||||||||
|
|
|
| GAAP |
| FAS 123R |
|
|
| NON-GAAP |
| Common Stock |
| Inventory |
| (Gain) Loss on |
| License |
|
|
| ||||||||
|
|
|
| As Reported |
| Expense |
|
|
| As Adjusted (1) |
| Equivalents |
| Write-offs |
| Investments |
| Fees |
| Amortization |
| ||||||||
Income Statement Classification: |
|
|
|
|
|
|
|
|
|
|
|
|
|
|
|
|
|
|
|
|
| ||||||||
|
|
|
|
|
|
|
|
|
|
|
|
|
|
|
|
|
|
|
|
|
| ||||||||
Total revenues |
|
|
| $ | 4,605,039 |
|
|
|
|
| $ | 4,605,039 |
|
|
|
|
|
|
|
|
|
|
| ||||||
|
|
|
|
|
|
|
|
|
|
|
|
|
|
|
|
|
|
|
|
|
| ||||||||
Cost of products and services sold |
|
|
| $ | (1,148,562 | ) | $ | 27,555 |
|
|
| $ | (1,121,007 | ) |
|
| $ | 12,614 |
|
|
|
|
|
|
| ||||
Gross margin |
| 75 | % | $ | 3,456,477 |
| $ | 27,555 |
| 76 | % | $ | 3,484,032 |
|
|
| $ | 12,614 |
|
|
|
|
|
|
| ||||
|
|
|
|
|
|
|
|
|
|
|
|
|
|
|
|
|
|
|
|
|
| ||||||||
Selling, general and administrative |
|
|
| $ | (1,338,190 | ) | $ | 102,745 |
|
|
| $ | (1,235,445 | ) |
|
|
|
|
|
|
|
|
|
| |||||
|
|
|
|
|
|
|
|
|
|
|
|
|
|
|
|
|
|
|
|
|
| ||||||||
Research and development |
|
|
| $ | (1,308,330 | ) | $ | 56,673 |
|
|
| $ | (1,251,657 | ) |
|
| $ | 11,039 |
|
|
| $ | 490,900 |
|
|
| |||
|
|
|
|
|
|
|
|
|
|
|
|
|
|
|
|
|
|
|
|
|
| ||||||||
Amortization of intangibles |
|
|
| $ | (226,442 | ) |
|
|
|
| $ | (226,442 | ) |
|
|
|
|
|
|
|
| $ | 226,442 |
| |||||
|
|
|
|
|
|
|
|
|
|
|
|
|
|
|
|
|
|
|
|
|
| ||||||||
Charge for impaired assets |
|
|
| $ | (2,036 | ) |
|
|
|
| $ | (2,036 | ) |
|
|
|
|
|
|
|
|
|
| ||||||
|
|
|
|
|
|
|
|
|
|
|
|
|
|
|
|
|
|
|
|
|
| ||||||||
Equity in income (loss) of equity method investments |
|
|
| $ | 201 |
|
|
|
|
| $ | 201 |
|
|
|
|
|
|
|
|
|
|
| ||||||
|
|
|
|
|
|
|
|
|
|
|
|
|
|
|
|
|
|
|
|
|
| ||||||||
Minority interest |
|
|
| $ | 2,217 |
|
|
|
|
| $ | 2,217 |
|
|
|
|
|
|
|
|
|
|
| ||||||
|
|
|
|
|
|
|
|
|
|
|
|
|
|
|
|
|
|
|
|
|
| ||||||||
Gains (losses) on investments in equity securities |
|
|
| $ | (3,340 | ) |
|
|
|
| $ | (3,340 | ) |
|
|
|
| $ | 5,253 |
|
|
|
|
| |||||
|
|
|
|
|
|
|
|
|
|
|
|
|
|
|
|
|
|
|
|
|
| ||||||||
Other |
|
|
| $ | (1,861 | ) |
|
|
|
| $ | (1,861 | ) |
|
|
|
|
|
|
|
|
|
| ||||||
|
|
|
|
|
|
|
|
|
|
|
|
|
|
|
|
|
|
|
|
|
| ||||||||
Investment income |
|
|
| $ | 51,260 |
|
|
|
|
| $ | 51,260 |
|
|
|
|
|
|
|
|
|
|
| ||||||
|
|
|
|
|
|
|
|
|
|
|
|
|
|
|
|
|
|
|
|
|
| ||||||||
Interest Expense |
|
|
| $ | (4,418 | ) |
|
|
|
| $ | (4,418 | ) |
|
|
|
|
|
|
|
|
|
| ||||||
|
|
|
|
|
|
|
|
|
|
|
|
|
|
|
|
|
|
|
|
|
| ||||||||
Summary: |
|
|
|
|
|
|
|
|
|
|
|
|
|
|
|
|
|
|
|
|
| ||||||||
|
|
|
|
|
|
|
|
|
|
|
|
|
|
|
|
|
|
|
|
|
| ||||||||
Income (loss) before income taxes |
|
|
| $ | 625,538 |
| $ | 186,973 |
|
|
| $ | 812,511 |
| $ | — |
| $ | 23,653 |
| $ | 5,253 |
| $ | 490,900 |
| $ | 226,442 |
|
|
|
|
|
|
|
|
|
|
|
|
|
|
|
|
|
|
|
|
|
|
| ||||||||
(Provision for) benefit from income taxes |
| 33 | % | $ | (204,457 | ) | $ | (56,740 | ) | 32 | % | $ | (261,197 | ) | $ | — |
| $ | (5,724 | ) | $ | (390 | ) | $ | (108,328 | ) | $ | (75,399 | ) |
|
|
|
|
|
|
|
|
|
|
|
|
|
|
|
|
|
|
|
|
|
| ||||||||
Net income (loss) |
|
|
| $ | 421,081 |
| $ | 130,233 |
|
|
| $ | 551,314 |
| $ | — |
| $ | 17,929 |
| $ | 4,863 |
| $ | 382,572 |
| $ | 151,043 |
|
|
|
|
|
|
|
|
|
|
|
|
|
|
|
|
|
|
|
|
|
|
| ||||||||
Net income (loss) per share: |
|
|
|
|
|
|
|
|
|
|
|
|
|
|
|
|
|
|
|
|
| ||||||||
Basic |
|
|
| $ | 1.57 |
| $ | 0.50 |
|
|
| $ | 2.07 |
| $ | — |
| $ | 0.07 |
| $ | 0.02 |
| $ | 1.42 |
| $ | 0.56 |
|
|
|
|
|
|
|
|
|
|
|
|
|
|
|
|
|
|
|
|
|
|
| ||||||||
Diluted (2) |
|
|
| $ | 1.50 |
| $ | 0.45 |
|
|
| $ | 1.95 |
| $ | 0.11 |
| $ | 0.06 |
| $ | 0.01 |
| $ | 1.34 |
| $ | 0.53 |
|
|
|
|
|
|
|
|
|
|
|
|
|
|
|
|
|
|
|
|
|
|
| ||||||||
Weighted average shares outstanding: |
|
|
|
|
|
|
|
|
|
|
|
|
|
|
|
|
|
|
|
|
| ||||||||
Basic |
|
|
| 268,490 |
|
|
|
|
| 268,490 |
|
|
|
|
|
|
|
|
|
|
| ||||||||
|
|
|
|
|
|
|
|
|
|
|
|
|
|
|
|
|
|
|
|
|
| ||||||||
Diluted (2) |
|
|
| 285,595 |
|
|
|
|
| 285,595 |
|
|
|
|
|
|
|
|
|
|
| ||||||||
Notes:
(1) Represents the adjusted Non-GAAP results of operations and financial position for Genzyme Corporation for the year ended December 31, 2008. All other amounts presented herein represent previously reported amounts. We believe that certain Non-GAAP financial measures, when considered together with the GAAP figures, can enhance the overall understanding of the company’s past financial performance and its prospects for the future. The Non-GAAP financial measures are included with the intent of providing investors with a more complete understanding of the trends underlying our operating results and financial position and are among the primary indicators management uses for planning and forecasting purposes and measuring the company’s performance. Such Non-GAAP financial measures should not be considered in isolation or used as a substitute for GAAP.
(2) Diluted earnings per share and diluted weighted average shares outstanding reflect the adoption of EITF 04-8. In accordance with the provisions of EITF 04-8, interest and debt fees related to our 1.25% convertible senior notes of $6,915K, net of tax, have been added back to net income and approximately 8,851K shares have been added to diluted weighted average shares outstanding for purposes of computing GAAP and Non-GAAP diluted earnings per share.
GENZYME CORPORATION
RECONCILIATION OF GAAP TO NON-GAAP EARNINGS
For the Year Ended December 31, 2007
(Amounts in thousands, except percentage and per share data)
|
|
|
|
|
|
|
|
|
|
|
|
|
|
|
|
|
|
|
|
|
|
|
|
|
|
|
| |||||||||||
|
|
|
|
|
|
|
|
|
|
|
|
|
| Items Formerly Excluded From Non-GAAP [(Income)/Expense] |
| |||||||||||||||||||||||
|
|
|
|
|
|
|
|
|
|
|
|
|
| Dilution |
| (Gain) on |
|
|
|
|
|
|
|
|
|
|
| |||||||||||
|
|
|
|
|
|
|
|
|
|
|
|
|
| Due to |
| Investments |
|
|
|
|
|
|
|
|
|
|
| |||||||||||
|
|
|
| GAAP |
| FAS 123R |
| Acquisition |
|
|
| NON-GAAP |
| Common Stock |
| in Equity |
| Litigation |
| Milestone |
| Manufacturing |
|
|
| Effect of |
| |||||||||||
|
|
|
| As Reported |
| Expense |
| Related |
|
|
| As Adjusted (1) |
| Equivalents |
| Securities |
| Settlement |
| Payment |
| Related |
| Amortization |
| FIN 46 |
| |||||||||||
Income Statement Classification: |
|
|
|
|
|
|
|
|
|
|
|
|
|
|
|
|
|
|
|
|
|
|
|
|
|
|
| |||||||||||
|
|
|
|
|
|
|
|
|
|
|
|
|
|
|
|
|
|
|
|
|
|
|
|
|
|
|
| |||||||||||
Total revenues |
|
|
| $ | 3,813,519 |
|
|
|
|
|
|
| $ | 3,813,519 |
|
|
|
|
|
|
|
|
|
|
|
|
|
|
| |||||||||
|
|
|
|
|
|
|
|
|
|
|
|
|
|
|
|
|
|
|
|
|
|
|
|
|
|
|
| |||||||||||
Cost of products and services sold |
|
|
| $ | (927,330 | ) | $ | 25,677 |
|
|
|
|
| $ | (901,653 | ) |
|
|
|
|
|
|
|
| $ | 20,916 |
|
|
|
|
| |||||||
Gross margin |
| 76 | % | $ | 2,886,189 |
| $ | 25,677 |
|
|
| 76 | % | $ | 2,911,866 |
|
|
|
|
|
|
|
|
| $ | 20,916 |
|
|
|
|
| |||||||
|
|
|
|
|
|
|
|
|
|
|
|
|
|
|
|
|
|
|
|
|
|
|
|
|
|
|
| |||||||||||
Selling, general and administrative |
|
|
| $ | (1,186,438 | ) | $ | 106,172 |
|
|
|
|
| $ | (1,080,266 | ) |
|
|
|
| $ | 64,000 |
|
|
|
|
|
|
| $ | 200 |
| ||||||
|
|
|
|
|
|
|
|
|
|
|
|
|
|
|
|
|
|
|
|
|
|
|
|
|
|
|
| |||||||||||
Research and development |
|
|
| $ | (731,950 | ) | $ | 58,101 |
|
|
|
|
| $ | (673,849 | ) |
|
|
|
|
|
| $ | 25,000 |
|
|
|
|
| $ | 7,461 |
| ||||||
|
|
|
|
|
|
|
|
|
|
|
|
|
|
|
|
|
|
|
|
|
|
|
|
|
|
|
| |||||||||||
Amortization of intangibles |
|
|
| $ | (201,105 | ) |
|
|
|
|
|
| $ | (201,105 | ) |
|
|
|
|
|
|
|
|
|
| $ | 201,105 |
|
|
| ||||||||
|
|
|
|
|
|
|
|
|
|
|
|
|
|
|
|
|
|
|
|
|
|
|
|
|
|
|
| |||||||||||
Purchase of in-process research and development |
|
|
| $ | (106,350 | ) |
|
| $ | 106,350 |
|
|
| $ | — |
|
|
|
|
|
|
|
|
|
|
|
|
|
|
| ||||||||
|
|
|
|
|
|
|
|
|
|
|
|
|
|
|
|
|
|
|
|
|
|
|
|
|
|
|
| |||||||||||
Equity in income (loss) of equity method investments |
|
|
| $ | 7,398 |
|
|
| $ | 19,150 |
|
|
| $ | 26,548 |
|
|
|
|
|
|
|
|
|
|
| $ | 830 |
| $ | (3,830 | ) | ||||||
|
|
|
|
|
|
|
|
|
|
|
|
|
|
|
|
|
|
|
|
|
|
|
|
|
|
|
| |||||||||||
Minority interest |
|
|
| $ | 3,932 |
|
|
|
|
|
|
| $ | 3,932 |
|
|
|
|
|
|
|
|
|
|
|
|
| $ | (3,831 | ) | ||||||||
|
|
|
|
|
|
|
|
|
|
|
|
|
|
|
|
|
|
|
|
|
|
|
|
|
|
|
| |||||||||||
Gains (losses) on investments in equity securities |
|
|
| $ | 13,067 |
|
|
|
|
|
|
| $ | 13,067 |
|
|
| $ | (10,848 | ) |
|
|
|
|
|
|
|
|
|
| ||||||||
|
|
|
|
|
|
|
|
|
|
|
|
|
|
|
|
|
|
|
|
|
|
|
|
|
|
|
| |||||||||||
Other |
|
|
| $ | (7,118 | ) |
|
|
|
|
|
| $ | (7,118 | ) |
|
|
|
|
|
|
|
| $ | 5,735 |
|
|
|
|
| ||||||||
|
|
|
|
|
|
|
|
|
|
|
|
|
|
|
|
|
|
|
|
|
|
|
|
|
|
|
| |||||||||||
Investment income |
|
|
| $ | 70,196 |
|
|
|
|
|
|
| $ | 70,196 |
|
|
|
|
|
|
|
|
|
|
|
|
|
|
| |||||||||
|
|
|
|
|
|
|
|
|
|
|
|
|
|
|
|
|
|
|
|
|
|
|
|
|
|
|
| |||||||||||
Interest Expense |
|
|
| $ | (12,147 | ) |
|
|
|
|
|
| $ | (12,147 | ) |
|
|
|
|
|
|
|
|
|
|
|
|
|
| |||||||||
|
|
|
|
|
|
|
|
|
|
|
|
|
|
|
|
|
|
|
|
|
|
|
|
|
|
|
| |||||||||||
Summary: |
|
|
|
|
|
|
|
|
|
|
|
|
|
|
|
|
|
|
|
|
|
|
|
|
|
|
| |||||||||||
|
|
|
|
|
|
|
|
|
|
|
|
|
|
|
|
|
|
|
|
|
|
|
|
|
|
|
| |||||||||||
Income (loss) before income taxes |
|
|
| $ | 735,674 |
| $ | 189,950 |
| $ | 125,500 |
|
|
| $ | 1,051,124 |
| $ | — |
| $ | (10,848 | ) | $ | 64,000 |
| $ | 25,000 |
| $ | 26,651 |
| $ | 201,935 |
| $ | — |
|
|
|
|
|
|
|
|
|
|
|
|
|
|
|
|
|
|
|
|
|
|
|
|
|
|
|
|
| |||||||||||
(Provision for) benefit from income taxes |
| 35 | % | $ | (255,481 | ) | $ | (58,148 | ) | (15,781 | ) | 31 | % | $ | (329,410 | ) | $ | — |
| $ | 2,698 |
| $ | — |
| $ | (9,069 | ) | $ | (9,702 | ) | $ | (72,449 | ) | $ | — |
| |
|
|
|
|
|
|
|
|
|
|
|
|
|
|
|
|
|
|
|
|
|
|
|
|
|
|
|
| |||||||||||
Net income (loss) |
|
|
| $ | 480,193 |
| $ | 131,802 |
| $ | 109,719 |
|
|
| $ | 721,714 |
| $ | — |
| $ | (8,150 | ) | $ | 64,000 |
| $ | 15,931 |
| $ | 16,949 |
| $ | 129,486 |
| $ | — |
|
|
|
|
|
|
|
|
|
|
|
|
|
|
|
|
|
|
|
|
|
|
|
|
|
|
|
|
| |||||||||||
Net income (loss) per share: |
|
|
|
|
|
|
|
|
|
|
|
|
|
|
|
|
|
|
|
|
|
|
|
|
|
|
| |||||||||||
Basic |
|
|
| $ | 1.82 |
| $ | 0.50 |
| $ | 0.41 |
|
|
| $ | 2.73 |
| $ | — |
| $ | (0.03 | ) | $ | 0.24 |
| $ | 0.06 |
| $ | 0.06 |
| $ | 0.49 |
| $ | — |
|
|
|
|
|
|
|
|
|
|
|
|
|
|
|
|
|
|
|
|
|
|
|
|
|
|
|
|
| |||||||||||
Diluted (2) |
|
|
| $ | 1.74 |
| $ | 0.47 |
| $ | 0.39 |
|
|
| $ | 2.60 |
| $ | 0.09 |
| $ | (0.03 | ) | $ | 0.23 |
| $ | 0.06 |
| $ | 0.06 |
| $ | 0.46 |
| $ | — |
|
|
|
|
|
|
|
|
|
|
|
|
|
|
|
|
|
|
|
|
|
|
|
|
|
|
|
|
| |||||||||||
Weighted average shares outstanding: |
|
|
|
|
|
|
|
|
|
|
|
|
|
|
|
|
|
|
|
|
|
|
|
|
|
|
| |||||||||||
Basic |
|
|
| 263,895 |
|
|
|
|
|
|
| 263,895 |
|
|
|
|
|
|
|
|
|
|
|
|
|
|
| |||||||||||
|
|
|
|
|
|
|
|
|
|
|
|
|
|
|
|
|
|
|
|
|
|
|
|
|
|
|
| |||||||||||
Diluted (2) |
|
|
| 280,767 |
|
|
|
|
|
|
| 280,767 |
|
|
|
|
|
|
|
|
|
|
|
|
|
|
| |||||||||||
Notes:
(1) Represents the adjusted Non-GAAP results of operations and financial position for Genzyme Corporation for the year ended December 31, 2007. All other amounts presented herein represent previously reported amounts. We believe that certain Non-GAAP financial measures, when considered together with the GAAP figures, can enhance the overall understanding of the company’s past financial performance and its prospects for the future. The Non-GAAP financial measures are included with the intent of providing investors with a more complete understanding of the trends underlying our operating results and financial position and are among the primary indicators management uses for planning and forecasting purposes and measuring the company’s performance. Such Non-GAAP financial measures should not be considered in isolation or used as a substitute for GAAP.
(2) Diluted earnings per share and diluted weighted average shares outstanding reflect the adoption of EITF 04-8. In accordance with the provisions of EITF 04-8, interest and debt fees related to our 1.25% convertible senior notes of $7,543K, net of tax, have been added back to net income and approximately 9,686K shares have been added to diluted weighted average shares outstanding for purposes of computing GAAP and Non-GAAP diluted earnings per share.
GENZYME CORPORATION
RECONCILIATION OF GAAP TO NON-GAAP EARNINGS
For the Year Ended December 31, 2006
(Amounts in thousands, except percentage and per share data)
|
|
|
|
|
|
|
|
|
|
|
|
|
|
|
|
|
|
|
|
|
|
|
|
|
|
|
|
|
|
|
|
|
|
|
|
|
|
|
|
|
|
|
|
|
|
|
|
| Dilution |
|
|
|
|
|
|
|
|
|
|
|
|
|
|
|
|
| |||||||||||
|
|
|
|
|
|
|
|
|
| Due to |
|
|
|
|
| Items Formerly Excluded From Non-GAAP [(Income)/Expense] |
| |||||||||||||||||||||
|
|
|
|
|
|
|
|
|
| Transition |
|
|
|
|
|
|
| (Gain)/Loss |
|
|
|
|
|
|
|
|
| |||||||||||
|
|
|
|
|
|
|
|
|
| from |
|
|
|
|
|
|
| on Investments |
|
|
|
|
|
|
|
|
| |||||||||||
|
|
|
| GAAP |
| FAS 123R |
|
|
| (Net Loss) to |
|
|
| NON-GAAP |
| OFT |
| in Equity |
| Settlement of |
| Impairment of |
|
|
| Effect of |
| |||||||||||
|
|
|
| As Reported |
| Expense |
| IPR&D |
| Net Income |
|
|
| As Adjusted (1) |
| Settlement |
| Securities |
| Tax Audits |
| Goodwill |
| Amortization |
| FIN 46 |
| |||||||||||
Income Statement Classification: |
|
|
|
|
|
|
|
|
|
|
|
|
|
|
|
|
|
|
|
|
|
|
|
|
|
|
| |||||||||||
|
|
|
|
|
|
|
|
|
|
|
|
|
|
|
|
|
|
|
|
|
|
|
|
|
|
|
| |||||||||||
Total revenues |
|
|
| $ | 3,187,013 |
|
|
|
|
|
|
|
|
| $ | 3,187,013 |
|
|
|
|
|
|
|
|
|
|
|
|
| |||||||||
|
|
|
|
|
|
|
|
|
|
|
|
|
|
|
|
|
|
|
|
|
|
|
|
|
|
|
| |||||||||||
Cost of products and services sold |
|
|
| $ | (735,671 | ) | $ | 21,430 |
|
|
|
|
|
|
| $ | (714,241 | ) |
|
|
|
|
|
|
|
|
|
|
|
| ||||||||
Gross margin |
| 77 | % | $ | 2,451,342 |
| $ | 21,430 |
|
|
|
|
| 78 | % | $ | 2,472,772 |
|
|
|
|
|
|
|
|
|
|
|
|
| ||||||||
|
|
|
|
|
|
|
|
|
|
|
|
|
|
|
|
|
|
|
|
|
|
|
|
|
|
|
| |||||||||||
Selling, general and administrative |
|
|
| $ | (1,010,400 | ) | $ | 121,822 |
|
|
|
|
|
|
| $ | (888,578 | ) | $ | 7,936 |
|
|
|
|
|
|
|
|
| $ | 1,376 |
| ||||||
|
|
|
|
|
|
|
|
|
|
|
|
|
|
|
|
|
|
|
|
|
|
|
|
|
|
|
| |||||||||||
Research and development |
|
|
| $ | (649,951 | ) | $ | 65,248 |
|
|
|
|
|
|
| $ | (584,703 | ) |
|
|
|
|
|
|
|
|
|
| $ | 19,328 |
| |||||||
|
|
|
|
|
|
|
|
|
|
|
|
|
|
|
|
|
|
|
|
|
|
|
|
|
|
|
| |||||||||||
Amortization of intangibles |
|
|
| $ | (209,355 | ) |
|
|
|
|
|
|
|
| $ | (209,355 | ) |
|
|
|
|
|
|
|
| $ | 209,355 |
|
|
| ||||||||
|
|
|
|
|
|
|
|
|
|
|
|
|
|
|
|
|
|
|
|
|
|
|
|
|
|
|
| |||||||||||
Purchase of in-process research and development |
|
|
| $ | (552,900 | ) |
|
| $ | 552,900 |
|
|
|
|
| $ | — |
|
|
|
|
|
|
|
|
|
|
|
|
| ||||||||
|
|
|
|
|
|
|
|
|
|
|
|
|
|
|
|
|
|
|
|
|
|
|
|
|
|
|
| |||||||||||
Charge for impaired goodwill |
|
|
| $ | (219,245 | ) |
|
|
|
|
|
|
|
| $ | (219,245 | ) |
|
|
|
|
|
| $ | 219,245 |
|
|
|
|
| ||||||||
|
|
|
|
|
|
|
|
|
|
|
|
|
|
|
|
|
|
|
|
|
|
|
|
|
|
|
| |||||||||||
Equity in income (loss) of equity method investments |
|
|
| $ | 15,705 |
|
|
|
|
|
|
|
|
| $ | 15,705 |
|
|
|
|
|
|
|
|
|
|
| $ | (10,348 | ) | ||||||||
|
|
|
|
|
|
|
|
|
|
|
|
|
|
|
|
|
|
|
|
|
|
|
|
|
|
|
| |||||||||||
Minority interest |
|
|
| $ | 10,418 |
|
|
|
|
|
|
|
|
| $ | 10,418 |
|
|
|
|
|
|
|
|
|
|
| $ | (10,352 | ) | ||||||||
|
|
|
|
|
|
|
|
|
|
|
|
|
|
|
|
|
|
|
|
|
|
|
|
|
|
|
| |||||||||||
Gains (losses) on investments in equity securities |
|
|
| $ | 73,230 |
|
|
|
|
|
|
|
|
| $ | 73,230 |
|
|
| $ | (66,466 | ) |
|
|
|
|
|
|
|
| ||||||||
|
|
|
|
|
|
|
|
|
|
|
|
|
|
|
|
|
|
|
|
|
|
|
|
|
|
|
| |||||||||||
Other |
|
|
| $ | (2,045 | ) |
|
|
|
|
|
|
|
| $ | (2,045 | ) |
|
|
|
|
|
|
|
|
|
|
|
| |||||||||
|
|
|
|
|
|
|
|
|
|
|
|
|
|
|
|
|
|
|
|
|
|
|
|
|
|
|
| |||||||||||
Investment income |
|
|
| $ | 56,001 |
|
|
|
|
|
|
|
|
| $ | 56,001 |
|
|
|
|
|
|
|
|
|
|
| $ | (4 | ) | ||||||||
|
|
|
|
|
|
|
|
|
|
|
|
|
|
|
|
|
|
|
|
|
|
|
|
|
|
|
| |||||||||||
Interest Expense |
|
|
| $ | (15,478 | ) |
|
|
|
|
|
|
|
| $ | (15,478 | ) |
|
|
|
|
|
|
|
|
|
|
|
| |||||||||
|
|
|
|
|
|
|
|
|
|
|
|
|
|
|
|
|
|
|
|
|
|
|
|
|
|
|
| |||||||||||
Summary: |
|
|
|
|
|
|
|
|
|
|
|
|
|
|
|
|
|
|
|
|
|
|
|
|
|
|
| |||||||||||
|
|
|
|
|
|
|
|
|
|
|
|
|
|
|
|
|
|
|
|
|
|
|
|
|
|
|
| |||||||||||
Income (loss) before income taxes |
|
|
| $ | (52,678 | ) | $ | 208,500 |
| $ | 552,900 |
| $ | — |
|
|
| $ | 708,722 |
| $ | 7,936 |
| $ | (66,466 | ) | $ | — |
| $ | 219,245 |
| $ | 209,355 |
| $ | — |
|
|
|
|
|
|
|
|
|
|
|
|
|
|
|
|
|
|
|
|
|
|
|
|
|
|
|
|
| |||||||||||
(Provision for) benefit from income taxes |
| 68 | % | $ | 35,881 |
| $ | (66,331 | ) | $ | (148,565 | ) | $ | — |
| 25 | % | $ | (179,015 | ) | $ | (2,920 | ) | $ | 24,459 |
| $ | (31,748 | ) | $ | (69,823 | ) | $ | (77,043 | ) | $ | — |
|
|
|
|
|
|
|
|
|
|
|
|
|
|
|
|
|
|
|
|
|
|
|
|
|
|
|
|
| |||||||||||
Net income (loss) |
|
|
| $ | (16,797 | ) | $ | 142,169 |
| $ | 404,335 |
| $ | — |
|
|
| $ | 529,707 |
| $ | 5,016 |
| $ | (42,007 | ) | $ | (31,748 | ) | $ | 149,422 |
| $ | 132,312 |
| $ | — |
|
|
|
|
|
|
|
|
|
|
|
|
|
|
|
|
|
|
|
|
|
|
|
|
|
|
|
|
| |||||||||||
Net income (loss) per share: |
|
|
|
|
|
|
|
|
|
|
|
|
|
|
|
|
|
|
|
|
|
|
|
|
|
|
| |||||||||||
Basic |
|
|
| $ | (0.06 | ) | $ | 0.54 |
| $ | 1.54 |
| $ | — |
|
|
| $ | 2.02 |
| $ | 0.02 |
| $ | (0.16 | ) | $ | (0.12 | ) | $ | 0.57 |
| $ | 0.51 |
| $ | — |
|
|
|
|
|
|
|
|
|
|
|
|
|
|
|
|
|
|
|
|
|
|
|
|
|
|
|
|
| |||||||||||
Diluted (2) |
|
|
| $ | (0.06 | ) | $ | 0.52 |
| $ | 1.54 |
| $ | — |
|
|
| $ | 2.00 |
| $ | 0.02 |
| $ | (0.15 | ) | $ | (0.11 | ) | $ | 0.54 |
| $ | 0.48 |
| $ | — |
|
|
|
|
|
|
|
|
|
|
|
|
|
|
|
|
|
|
|
|
|
|
|
|
|
|
|
|
| |||||||||||
Weighted average shares outstanding: |
|
|
|
|
|
|
|
|
|
|
|
|
|
|
|
|
|
|
|
|
|
|
|
|
|
|
| |||||||||||
Basic |
|
|
| 261,124 |
|
|
|
|
|
|
|
|
| 261,124 |
|
|
|
|
|
|
|
|
|
|
|
|
| |||||||||||
|
|
|
|
|
|
|
|
|
|
|
|
|
|
|
|
|
|
|
|
|
|
|
|
|
|
|
| |||||||||||
Diluted (2) |
|
|
| 261,124 |
|
|
|
|
| 6,892 |
|
|
| 268,016 |
|
|
|
|
|
|
|
|
|
|
|
|
| |||||||||||
Notes:
(1) Represents the adjusted Non-GAAP results of operations and financial position for Genzyme Corporation for the year ended December 31, 2006. All other amounts presented herein represent previously reported amounts. We believe that certain Non-GAAP financial measures, when considered together with the GAAP figures, can enhance the overall understanding of the company’s past financial performance and its prospects for the future. The Non-GAAP financial measures are included with the intent of providing investors with a more complete understanding of the trends underlying our operating results and financial position and are among the primary indicators management uses for planning and forecasting purposes and measuring the company’s performance. Such Non-GAAP financial measures should not be considered in isolation or used as a substitute for GAAP.
(2) Common stock equivalents are included in the calculation of diluted earnings per share to the extent they are dilutive. Due to the significant IPR&D charge for AnorMED of $552,900K, Genzyme had a GAAP net loss for the year ended December 31, 2006 and, therefore, the effect of options, stock purchase rights and warrants to purchase shares of Genzyme Stock, which we refer to collectively as common stock equivalents, and the potentially dilutive effect of our 1.25% convertible notes are excluded from the calculation of GAAP diluted net loss per share because the effect would be anti-dilutive. Conversely, on a Non-GAAP basis, Genzyme produced a net profit and, therefore, the common stock equivalents are included in the calculation of Non-GAAP diluted net income per share because the effect is dilutive. Non-GAAP diluted earnings per share excludes the potentially dilutive effect of our 1.25% convertible notes.
GENZYME CORPORATION
RECONCILIATION OF GAAP TO NON-GAAP EARNINGS
For the Year Ended December 31, 2005
(Amounts in thousands, except percentage and per share data)
|
|
|
|
|
|
|
|
|
|
|
|
|
|
|
|
|
|
|
|
|
|
|
|
| |||||
|
|
|
|
|
|
|
|
|
|
|
| Items Formerly Excluded From Non-GAAP [(Income)/Expense] |
| ||||||||||||||||
|
|
|
|
|
|
|
|
|
|
|
| Dilution |
|
|
|
|
|
|
|
|
| ||||||||
|
|
|
|
|
|
|
|
|
|
|
| Due to |
| Validation/ |
|
|
|
|
|
|
| ||||||||
|
|
|
| GAAP |
|
|
|
|
| NON-GAAP |
| Common Stock |
| Manufacturing |
| Acquisition |
|
|
|
|
| ||||||||
|
|
|
| As Reported |
| IPR&D |
|
|
| As Adjusted (1) |
| Equivalents |
| Related |
| Related |
| Amortization |
| FIN 46 |
| ||||||||
Income Statement Classification: |
|
|
|
|
|
|
|
|
|
|
|
|
|
|
|
|
|
|
|
|
| ||||||||
|
|
|
|
|
|
|
|
|
|
|
|
|
|
|
|
|
|
|
|
|
| ||||||||
Total revenues |
|
|
| $ | 2,734,842 |
|
|
|
|
| $ | 2,734,842 |
|
|
|
|
|
|
|
|
|
|
| ||||||
|
|
|
|
|
|
|
|
|
|
|
|
|
|
|
|
|
|
|
|
|
| ||||||||
Cost of products and services sold |
|
|
| $ | (632,652 | ) |
|
|
|
| $ | (632,652 | ) |
|
| $ | 16,912 |
| $ | 15,214 |
|
|
|
|
| ||||
Gross margin |
| 77 | % | $ | 2,102,190 |
|
|
| 77 | % | $ | 2,102,190 |
|
|
| $ | 16,912 |
| $ | 15,214 |
|
|
|
|
| ||||
|
|
|
|
|
|
|
|
|
|
|
|
|
|
|
|
|
|
|
|
|
| ||||||||
Selling, general and administrative |
|
|
| $ | (787,839 | ) |
|
|
|
| $ | (787,839 | ) |
|
|
|
|
|
|
|
| $ | 790 |
| |||||
|
|
|
|
|
|
|
|
|
|
|
|
|
|
|
|
|
|
|
|
|
| ||||||||
Research and development |
|
|
| $ | (502,657 | ) |
|
|
|
| $ | (502,657 | ) |
|
|
|
|
|
|
|
| $ | 23,112 |
| |||||
|
|
|
|
|
|
|
|
|
|
|
|
|
|
|
|
|
|
|
|
|
| ||||||||
Amortization of intangibles |
|
|
| $ | (181,632 | ) |
|
|
|
| $ | (181,632 | ) |
|
|
|
|
|
| $ | 181,632 |
|
|
| |||||
|
|
|
|
|
|
|
|
|
|
|
|
|
|
|
| $ | 7,000 |
|
|
|
|
| |||||||
Purchase of in-process research and development |
|
|
| $ | (29,200 | ) | $ | 22,200 |
|
|
| $ | (7,000 | ) |
|
|
|
|
|
|
|
|
|
| |||||
|
|
|
|
|
|
|
|
|
|
|
|
|
|
|
|
|
|
|
|
|
| ||||||||
Equity in income (loss) of equity method investments |
|
|
| $ | 151 |
|
|
|
|
| $ | 151 |
|
|
|
|
|
|
|
|
| $ | (11,948 | ) | |||||
|
|
|
|
|
|
|
|
|
|
|
|
|
|
|
|
|
|
|
|
|
| ||||||||
Minority interest |
|
|
| $ | 11,952 |
|
|
|
|
| $ | 11,952 |
|
|
|
|
|
|
|
|
| $ | (11,952 | ) | |||||
|
|
|
|
|
|
|
|
|
|
|
|
|
|
|
|
|
|
|
|
|
| ||||||||
Other |
|
|
| $ | 4,163 |
|
|
|
|
| $ | 4,163 |
|
|
|
|
|
|
|
|
|
|
| ||||||
|
|
|
|
|
|
|
|
|
|
|
|
|
|
|
|
|
|
|
|
|
| ||||||||
Investment income |
|
|
| $ | 31,429 |
|
|
|
|
| $ | 31,429 |
|
|
|
|
|
|
|
|
| $ | (2 | ) | |||||
|
|
|
|
|
|
|
|
|
|
|
|
|
|
|
|
|
|
|
|
|
| ||||||||
Interest Expense |
|
|
| $ | (19,638 | ) |
|
|
|
| $ | (19,638 | ) |
|
|
|
|
|
|
|
|
|
| ||||||
|
|
|
|
|
|
|
|
|
|
|
|
|
|
|
|
|
|
|
|
|
| ||||||||
Summary: |
|
|
|
|
|
|
|
|
|
|
|
|
|
|
|
|
|
|
|
|
| ||||||||
|
|
|
|
|
|
|
|
|
|
|
|
|
|
|
|
|
|
|
|
|
| ||||||||
Income (loss) before income taxes |
|
|
| $ | 628,919 |
| $ | 22,200 |
|
|
| $ | 651,119 |
| $ | — |
| $ | 16,912 |
| $ | 22,214 |
| $ | 181,632 |
| $ | — |
|
|
|
|
|
|
|
|
|
|
|
|
|
|
|
|
|
|
|
|
|
|
| ||||||||
(Provision for) benefit from income taxes |
| 30 | % | $ | (187,430 | ) | $ | — |
| 29 | % | $ | (187,430 | ) | $ | — |
| $ | (6,224 | ) | $ | (8,175 | ) | $ | (66,841 | ) | $ | — |
|
|
|
|
|
|
|
|
|
|
|
|
|
|
|
|
|
|
|
|
|
|
| ||||||||
Net income (loss) |
|
|
| $ | 441,489 |
| $ | 22,200 |
|
|
| $ | 463,689 |
| $ | — |
| $ | 10,688 |
| $ | 14,039 |
| $ | 114,791 |
| $ | — |
|
|
|
|
|
|
|
|
|
|
|
|
|
|
|
|
|
|
|
|
|
|
| ||||||||
Net income (loss) per share: |
|
|
|
|
|
|
|
|
|
|
|
|
|
|
|
|
|
|
|
|
| ||||||||
Basic |
|
|
| $ | 1.73 |
| $ | 0.09 |
|
|
| $ | 1.82 |
| $ | — |
| $ | 0.04 |
| $ | 0.05 |
| $ | 0.45 |
| $ | — |
|
|
|
|
|
|
|
|
|
|
|
|
|
|
|
|
|
|
|
|
|
|
| ||||||||
Diluted (2) |
|
|
| $ | 1.65 |
| $ | 0.09 |
|
|
| $ | 1.74 |
| $ | 0.03 |
| $ | 0.04 |
| $ | 0.05 |
| $ | 0.42 |
| $ | — |
|
|
|
|
|
|
|
|
|
|
|
|
|
|
|
|
|
|
|
|
|
|
| ||||||||
Weighted average shares outstanding: |
|
|
|
|
|
|
|
|
|
|
|
|
|
|
|
|
|
|
|
|
| ||||||||
Basic |
|
|
| 254,758 |
|
|
|
|
| 254,758 |
|
|
|
|
|
|
|
|
|
|
| ||||||||
|
|
|
|
|
|
|
|
|
|
|
|
|
|
|
|
|
|
|
|
|
| ||||||||
Diluted (2) |
|
|
| 272,224 |
|
|
|
|
| 272,224 |
|
|
|
|
|
|
|
|
|
|
| ||||||||
Notes:
(1) Represents the adjusted Non-GAAP results of operations and financial position for Genzyme Corporation for the year ended December 31, 2005. All other amounts presented herein represent previously reported amounts. We believe that certain Non-GAAP financial measures, when considered together with the GAAP figures, can enhance the overall understanding of the company’s past financial performance and its prospects for the future. The Non-GAAP financial measures are included with the intent of providing investors with a more complete understanding of the trends underlying our operating results and financial position and are among the primary indicators management uses for planning and forecasting purposes and measuring the company’s performance. Such Non-GAAP financial measures should not be considered in isolation or used as a substitute for GAAP.
(2) Diluted earnings per share and diluted weighted average shares outstanding reflect the adoption of EITF 04-8. In accordance with the provisions of EITF 04-8, interest and debt fees related to our 1.25% convertible senior notes of $7,496K, net of tax, have been added back to net income and approximately 9,686K shares have been added to diluted weighted average shares outstanding for purposes of computing GAAP and Non-GAAP diluted earnings per share.
GENZYME CORPORATION
RECONCILIATION OF GAAP TO NON-GAAP EARNINGS
For the Year Ended December 31, 2004
(Amounts in thousands, except percentage and per share data)
|
|
|
|
|
|
|
|
|
|
|
|
|
|
|
|
|
|
|
|
|
|
|
|
|
|
|
|
|
|
|
|
|
|
|
|
|
|
|
|
|
|
|
|
|
|
|
| Items Formerly Excluded From Non-GAAP [(Income)/Expense] |
| ||||||||||||||||||||||
|
|
|
|
|
|
|
|
|
|
|
| SangStat |
|
|
|
|
| Exit Costs |
|
|
|
|
| ||||||||||||
|
|
|
| GAAP |
|
|
|
|
| NON-GAAP |
| Inventory |
| Convert |
| Convert |
| Oklahoma |
| Generic |
|
|
|
|
| ||||||||||
|
|
|
| As Reported |
| IPR&D |
|
|
| As Adjusted(1) |
| Step Up |
| Premium |
| Fees |
| City |
| Cyclosporine |
| Amortization |
| FIN 46 |
| ||||||||||
Income Statement Classification: |
|
|
|
|
|
|
|
|
|
|
|
|
|
|
|
|
|
|
|
|
|
|
|
|
| ||||||||||
|
|
|
|
|
|
|
|
|
|
|
|
|
|
|
|
|
|
|
|
|
|
|
|
|
| ||||||||||
Total revenues |
|
|
| $ | 2,201,145 |
|
|
|
|
| $ | 2,201,145 |
|
|
|
|
|
|
|
|
|
|
|
|
|
|
| ||||||||
|
|
|
|
|
|
|
|
|
|
|
|
|
|
|
|
|
|
|
|
|
|
|
|
|
| ||||||||||
Cost of products and services sold |
|
|
| $ | (588,586 | ) |
|
|
|
| $ | (588,586 | ) | $ | 3,937 |
|
|
|
|
|
|
| $ | 8,067 |
|
|
|
|
| ||||||
Gross margin |
| 73 | % | $ | 1,612,559 |
|
|
| 73 | % | $ | 1,612,559 |
| $ | 3,937 |
|
|
|
|
|
|
| $ | 8,067 |
|
|
|
|
| ||||||
|
|
|
|
|
|
|
|
|
|
|
|
|
|
|
|
|
|
|
|
|
|
|
|
|
| ||||||||||
Selling, general and administrative |
|
|
| $ | (599,388 | ) |
|
|
|
| $ | (599,388 | ) |
|
|
|
|
|
|
|
|
|
|
|
| $ | 225 |
| |||||||
|
|
|
|
|
|
|
|
|
|
|
|
|
|
|
|
|
|
|
|
|
|
|
|
|
| ||||||||||
Research and development |
|
|
| $ | (391,802 | ) |
|
|
|
| $ | (391,802 | ) |
|
|
|
|
|
| $ | 2,079 |
|
|
|
|
| $ | 11,779 |
| ||||||
|
|
|
|
|
|
|
|
|
|
|
|
|
|
|
|
|
|
|
|
|
|
|
|
|
| ||||||||||
Amortization of intangibles |
|
|
| $ | (109,473 | ) |
|
|
|
| $ | (109,473 | ) |
|
|
|
|
|
|
|
|
|
| $ | 109,473 |
|
|
| |||||||
|
|
|
|
|
|
|
|
|
|
|
|
|
|
|
|
|
|
|
|
|
|
|
|
|
| ||||||||||
Purchase of in-process research and development |
|
|
| $ | (254,520 | ) | $ | 254,520 |
|
|
| $ | — |
|
|
|
|
|
|
|
|
|
|
|
|
|
|
| |||||||
|
|
|
|
|
|
|
|
|
|
|
|
|
|
|
|
|
|
|
|
|
|
|
|
|
| ||||||||||
Charge for impaired assets |
|
|
| $ | (4,463 | ) |
|
|
|
| $ | (4,463 | ) |
|
|
|
|
|
| $ | 4,463 |
|
|
|
|
|
|
| |||||||
|
|
|
|
|
|
|
|
|
|
|
|
|
|
|
|
|
|
|
|
|
|
|
|
|
| ||||||||||
Equity in income (loss) of equity method investments |
|
|
| $ | (15,624 | ) |
|
|
|
| $ | (15,624 | ) |
|
|
|
|
|
|
|
|
|
|
|
| $ | (5,997 | ) | |||||||
|
|
|
|
|
|
|
|
|
|
|
|
|
|
|
|
|
|
|
|
|
|
|
|
|
| ||||||||||
Minority interest |
|
|
| $ | 5,999 |
|
|
|
|
| $ | 5,999 |
|
|
|
|
|
|
|
|
|
|
|
|
| $ | (5,999 | ) | |||||||
|
|
|
|
|
|
|
|
|
|
|
|
|
|
|
|
|
|
|
|
|
|
|
|
|
| ||||||||||
Gains (losses) on investments in equity securities |
|
|
| $ | (1,252 | ) |
|
|
|
| $ | (1,252 | ) |
|
|
|
|
|
|
|
|
|
|
|
|
|
| ||||||||
|
|
|
|
|
|
|
|
|
|
|
|
|
|
|
|
|
|
|
|
|
|
|
|
|
| ||||||||||
Other |
|
|
| $ | (357 | ) |
|
|
|
| $ | (357 | ) |
|
|
|
|
|
|
|
|
|
|
|
|
|
| ||||||||
|
|
|
|
|
|
|
|
|
|
|
|
|
|
|
|
|
|
|
|
|
|
|
|
|
| ||||||||||
Investment income |
|
|
| $ | 24,244 |
|
|
|
|
| $ | 24,244 |
|
|
|
|
|
|
|
|
|
|
|
|
| $ | (8 | ) | |||||||
|
|
|
|
|
|
|
|
|
|
|
|
|
|
|
|
|
|
|
|
|
|
|
|
|
| ||||||||||
Interest Expense |
|
|
| $ | (38,227 | ) |
|
|
|
| $ | (38,227 | ) |
|
| $ | 4,313 |
| $ | 5,329 |
|
|
|
|
|
|
|
|
| ||||||
|
|
|
|
|
|
|
|
|
|
|
|
|
|
|
|
|
|
|
|
|
|
|
|
|
| ||||||||||
Summary: |
|
|
|
|
|
|
|
|
|
|
|
|
|
|
|
|
|
|
|
|
|
|
|
|
| ||||||||||
|
|
|
|
|
|
|
|
|
|
|
|
|
|
|
|
|
|
|
|
|
|
|
|
|
| ||||||||||
Income (loss) before income taxes |
|
|
| $ | 227,696 |
| $ | 254,520 |
|
|
| $ | 482,216 |
| $ | 3,937 |
| $ | 4,313 |
| $ | 5,329 |
| $ | 6,542 |
| $ | 8,067 |
| $ | 109,473 |
| $ | — |
|
|
|
|
|
|
|
|
|
|
|
|
|
|
|
|
|
|
|
|
|
|
|
|
|
|
| ||||||||||
(Provision for) benefit from income taxes |
| 62 | % | $ | (141,169 | ) | $ | — |
| 29 | % | $ | (141,169 | ) | $ | (1,449 | ) | $ | (1,587 | ) | $ | (1,961 | ) | $ | (2,407 | ) | $ | (2,969 | ) | $ | (40,286 | ) | $ | — |
|
|
|
|
|
|
|
|
|
|
|
|
|
|
|
|
|
|
|
|
|
|
|
|
|
|
| ||||||||||
Net income (loss) |
|
|
| $ | 86,527 |
| $ | 254,520 |
|
|
| $ | 341,047 |
| $ | 2,488 |
| $ | 2,726 |
| $ | 3,368 |
| $ | 4,135 |
| $ | 5,098 |
| $ | 69,187 |
| $ | — |
|
|
|
|
|
|
|
|
|
|
|
|
|
|
|
|
|
|
|
|
|
|
|
|
|
|
| ||||||||||
Net income (loss) per share: |
|
|
|
|
|
|
|
|
|
|
|
|
|
|
|
|
|
|
|
|
|
|
|
|
| ||||||||||
Basic |
|
|
| $ | 0.38 |
| $ | 1.11 |
|
|
| $ | 1.49 |
| $ | 0.01 |
| $ | 0.01 |
| $ | 0.01 |
| $ | 0.02 |
| $ | 0.02 |
| $ | 0.30 |
| $ | — |
|
|
|
|
|
|
|
|
|
|
|
|
|
|
|
|
|
|
|
|
|
|
|
|
|
|
| ||||||||||
Diluted (2) |
|
|
| $ | 0.37 |
| $ | 1.10 |
|
|
| $ | 1.47 |
| $ | 0.01 |
| $ | 0.01 |
| $ | 0.01 |
| $ | 0.02 |
| $ | 0.02 |
| $ | 0.28 |
| $ | — |
|
|
|
|
|
|
|
|
|
|
|
|
|
|
|
|
|
|
|
|
|
|
|
|
|
|
| ||||||||||
Weighted average shares outstanding: |
|
|
|
|
|
|
|
|
|
|
|
|
|
|
|
|
|
|
|
|
|
|
|
|
| ||||||||||
Basic |
|
|
| 228,175 |
|
|
|
|
| 228,175 |
|
|
|
|
|
|
|
|
|
|
|
|
|
|
| ||||||||||
|
|
|
|
|
|
|
|
|
|
|
|
|
|
|
|
|
|
|
|
|
|
|
|
|
| ||||||||||
Diluted (2) |
|
|
| 234,318 |
|
|
|
|
| 234,318 |
|
|
|
|
|
|
|
|
|
|
|
|
|
|
| ||||||||||
Notes:
(1) Represents the adjusted Non-GAAP results of operations and financial position for Genzyme Corporation for the year ended December 31, 2004. All other amounts presented herein represent previously reported amounts. We believe that certain Non-GAAP financial measures, when considered together with the GAAP figures, can enhance the overall understanding of the company’s past financial performance and its prospects for the future. The Non-GAAP financial measures are included with the intent of providing investors with a more complete understanding of the trends underlying our operating results and financial position and are among the primary indicators management uses for planning and forecasting purposes and measuring the company’s performance. Such Non-GAAP financial measures should not be considered in isolation or used as a substitute for GAAP.
(2) Diluted earnings per share and diluted weighted average shares outstanding reflect the adoption of EITF 04-8. In accordance with the provisions of EITF 04-8, interest and debt fees related to our 1.25% convertible senior notes of$7,487K, net of tax, and approximately 9,686K shares have been excluded from the computation of GAAP and Non-GAAP diluted earnings per share and diluted weighted average shares outstanding because the effect of the assumed conversion of these notes would be anti-dilutive.
GENZYME CORPORATION
RECONCILIATION OF GAAP TO NON-GAAP EARNINGS
For the Year Ended December 31, 2003
(Amounts in thousands, except percentage and per share data)
|
|
|
|
|
|
|
|
|
|
|
|
|
|
|
|
|
|
|
|
|
|
|
|
|
|
|
|
|
|
|
|
|
|
|
|
|
|
|
|
|
|
|
|
|
|
|
|
|
|
| Items Formerly Excluded From Non-GAAP [(Income)/Expense] |
| ||||||||||||||
|
|
|
|
|
|
|
|
|
|
|
|
|
|
|
|
|
|
|
|
|
|
|
|
|
|
|
|
|
|
|
|
|
|
|
|
|
|
|
|
|
|
|
|
|
|
|
|
|
|
|
|
|
|
|
|
|
|
|
|
|
|
|
|
|
|
|
|
|
|
|
|
|
|
|
|
|
|
|
|
|
|
|
|
|
|
|
|
|
|
|
|
|
|
|
|
|
|
|
|
|
|
|
|
|
|
|
| ||||
|
|
|
|
|
|
|
|
|
|
|
|
|
|
|
|
|
|
|
|
|
|
|
| ||||
|
|
|
|
|
|
|
|
|
|
|
| Items Formerly Excluded From Non-GAAP [(Income)/Expense] |
| |||||||||||||||||||||||||
|
|
|
|
|
|
|
|
|
|
|
| Tracking Stock |
|
|
|
|
|
|
|
|
|
|
|
|
|
|
| |||||||||||
|
|
|
|
|
|
|
|
|
|
|
| Tax Benefit for |
|
|
|
|
|
|
|
|
|
|
|
|
|
|
| |||||||||||
|
|
|
|
|
|
|
|
|
|
|
| Genzyme Biosurgery |
| Impact of |
| SangStat |
| TKT |
| Impaired |
|
|
|
|
|
|
| |||||||||||
|
|
|
| GAAP |
|
|
|
|
| NON-GAAP |
| Disposition of |
| UK Judicial |
| Acquisition- Related |
| Settlement |
| Equity |
| Focal |
| CT Devices |
|
|
| |||||||||||
|
|
|
| As Reported |
| IPR&D |
|
|
| As Adjusted (1) |
| CT Business |
| Decision |
| Costs |
| Costs |
| Investment |
| Restructuring |
| Exit Costs |
| Amortization |
| |||||||||||
Income Statement Classification: |
|
|
|
|
|
|
|
|
|
|
|
|
|
|
|
|
|
|
|
|
|
|
|
|
|
|
| |||||||||||
|
|
|
|
|
|
|
|
|
|
|
|
|
|
|
|
|
|
|
|
|
|
|
|
|
|
|
| |||||||||||
Total revenues |
|
|
| $ | 1,574,817 |
|
|
|
|
| $ | 1,574,817 |
|
|
| $ | 5,064 |
|
|
|
|
|
|
|
|
|
|
|
|
| ||||||||
|
|
|
|
|
|
|
|
|
|
|
|
|
|
|
|
|
|
|
|
|
|
|
|
|
|
|
| |||||||||||
Cost of products and services sold |
|
|
| $ | (418,969 | ) |
|
|
|
| $ | (418,969 | ) |
|
| $ | — |
| $ | 2,550 |
|
|
|
|
| $ | 3,858 |
| $ | 308 |
|
|
| |||||
Gross margin |
| 73 | % | $ | 1,155,848 |
|
|
| 73 | % | $ | 1,155,848 |
|
|
| $ | 5,064 |
| $ | 2,550 |
|
|
|
|
| $ | 3,858 |
| $ | 308 |
|
|
| |||||
|
|
|
|
|
|
|
|
|
|
|
|
|
|
|
|
|
|
|
|
|
|
|
|
|
|
|
| |||||||||||
Selling, general and administrative |
|
|
| $ | (455,395 | ) |
|
|
|
| $ | (455,395 | ) |
|
| $ | 5,843 |
| $ | 258 |
| $ | 1,550 |
|
|
| $ | 1,958 |
| $ | 1,897 |
|
|
| ||||
|
|
|
|
|
|
|
|
|
|
|
|
|
|
|
|
|
|
|
|
|
|
|
|
|
|
|
| |||||||||||
Research and development |
|
|
| $ | (295,725 | ) |
|
|
|
| $ | (295,725 | ) |
|
|
|
| $ | 137 |
| $ | 1,500 |
|
|
|
|
|
|
|
|
| |||||||
|
|
|
|
|
|
|
|
|
|
|
|
|
|
|
|
|
|
|
|
|
|
|
|
|
|
|
| |||||||||||
Amortization of intangibles |
|
|
| $ | (64,720 | ) |
|
|
|
| $ | (64,720 | ) |
|
|
|
|
|
|
|
|
|
|
|
|
|
| $ | 64,720 |
| ||||||||
|
|
|
|
|
|
|
|
|
|
|
|
|
|
|
|
|
|
|
|
|
|
|
|
|
|
|
| |||||||||||
Purchase of in-process research and development |
|
|
| $ | (158,000 | ) | $ | 158,000 |
|
|
| $ | — |
|
|
|
|
|
|
|
|
|
|
|
|
|
|
|
|
| ||||||||
|
|
|
|
|
|
|
|
|
|
|
|
|
|
|
|
|
|
|
|
|
|
|
|
|
|
|
| |||||||||||
Charge for impaired assets |
|
|
| $ | (7,996 | ) |
|
|
|
| $ | (7,996 | ) |
|
|
|
|
|
|
|
|
|
| $ | 7,996 |
|
|
|
|
| ||||||||
|
|
|
|
|
|
|
|
|
|
|
|
|
|
|
|
|
|
|
|
|
|
|
|
|
|
|
| |||||||||||
Equity in income (loss) of equity method investments |
|
|
| $ | (16,743 | ) |
|
|
|
| $ | (16,743 | ) |
|
|
|
|
|
|
|
|
|
|
|
|
|
|
|
| |||||||||
|
|
|
|
|
|
|
|
|
|
|
|
|
|
|
|
|
|
|
|
|
|
|
|
|
|
|
| |||||||||||
Minority interest |
|
|
| $ | 2,232 |
|
|
|
|
| $ | 2,232 |
|
|
|
|
|
|
|
|
|
|
|
|
|
|
|
|
| |||||||||
|
|
|
|
|
|
|
|
|
|
|
|
|
|
|
|
|
|
|
|
|
|
|
|
|
|
|
| |||||||||||
Gains (losses) on investments in equity securities |
|
|
| $ | (1,201 | ) |
|
|
|
| $ | (1,201 | ) |
|
|
|
|
|
|
|
| $ | 3,620 |
|
|
|
|
|
|
| ||||||||
|
|
|
|
|
|
|
|
|
|
|
|
|
|
|
|
|
|
|
|
|
|
|
|
|
|
|
| |||||||||||
Other |
|
|
| $ | 2,703 |
|
|
|
|
| $ | 2,703 |
|
|
|
|
|
|
|
|
|
|
|
|
|
|
|
|
| |||||||||
|
|
|
|
|
|
|
|
|
|
|
|
|
|
|
|
|
|
|
|
|
|
|
|
|
|
|
| |||||||||||
Investment income |
|
|
| $ | 42,312 |
|
|
|
|
| $ | 42,312 |
|
|
|
|
|
|
|
|
|
|
|
|
|
|
|
|
| |||||||||
|
|
|
|
|
|
|
|
|
|
|
|
|
|
|
|
|
|
|
|
|
|
|
|
|
|
|
| |||||||||||
Interest Expense |
|
|
| $ | (22,380 | ) |
|
|
|
| $ | (22,380 | ) |
|
|
|
|
|
|
|
|
|
|
|
|
|
|
|
| |||||||||
|
|
|
|
|
|
|
|
|
|
|
|
|
|
|
|
|
|
|
|
|
|
|
|
|
|
|
| |||||||||||
Summary: |
|
|
|
|
|
|
|
|
|
|
|
|
|
|
|
|
|
|
|
|
|
|
|
|
|
|
| |||||||||||
|
|
|
|
|
|
|
|
|
|
|
|
|
|
|
|
|
|
|
|
|
|
|
|
|
|
|
| |||||||||||
Income (loss) before income taxes |
|
|
| $ | 180,935 |
| $ | 158,000 |
|
|
| $ | 338,935 |
| $ | — |
| $ | 10,907 |
| $ | 2,945 |
| $ | 3,050 |
| $ | 3,620 |
| $ | 13,812 |
| $ | 2,205 |
| $ | 64,720 |
|
|
|
|
|
|
|
|
|
|
|
|
|
|
|
|
|
|
|
|
|
|
|
|
|
|
|
|
| |||||||||||
(Provision for) benefit from income taxes |
| 48 | % | $ | (86,652 | ) | $ | — |
| 26 | % | $ | (86,652 | ) | $ | (4,032 | ) | $ | (1,863 | ) | $ | (1,084 | ) | $ | (1,122 | ) | $ | (1,332 | ) | $ | (5,083 | ) | $ | (812 | ) | $ | (23,817 | ) |
|
|
|
|
|
|
|
|
|
|
|
|
|
|
|
|
|
|
|
|
|
|
|
|
|
|
|
| |||||||||||
Net income (loss) (2) |
|
|
| $ | 94,283 |
| $ | 158,000 |
|
|
| $ | 252,283 |
| $ | (4,032 | ) | $ | 9,044 |
| $ | 1,861 |
| $ | 1,928 |
| $ | 2,288 |
| $ | 8,729 |
| $ | 1,393 |
| $ | 40,903 |
|
|
|
|
|
|
|
|
|
|
|
|
|
|
|
|
|
|
|
|
|
|
|
|
|
|
|
|
| |||||||||||
Net income (loss) per share: |
|
|
|
|
|
|
|
|
|
|
|
|
|
|
|
|
|
|
|
|
|
|
|
|
|
|
| |||||||||||
Basic |
|
|
| $ | 0.44 |
| $ | 0.71 |
|
|
| $ | 1.15 |
| $ | (0.02 | ) | $ | 0.04 |
| $ | 0.01 |
| $ | 0.01 |
| $ | 0.01 |
| $ | 0.04 |
| $ | 0.01 |
| $ | 0.19 |
|
|
|
|
|
|
|
|
|
|
|
|
|
|
|
|
|
|
|
|
|
|
|
|
|
|
|
|
| |||||||||||
Diluted (2,3) |
|
|
| $ | 0.42 |
| $ | 0.70 |
|
|
| $ | 1.12 |
| $ | (0.02 | ) | $ | 0.04 |
| $ | 0.01 |
| $ | 0.01 |
| $ | 0.01 |
| $ | 0.04 |
| $ | 0.01 |
| $ | 0.18 |
|
|
|
|
|
|
|
|
|
|
|
|
|
|
|
|
|
|
|
|
|
|
|
|
|
|
|
|
| |||||||||||
Weighted average shares outstanding: |
|
|
|
|
|
|
|
|
|
|
|
|
|
|
|
|
|
|
|
|
|
|
|
|
|
|
| |||||||||||
Basic |
|
|
| 219,376 |
|
|
|
|
| 219,376 |
|
|
|
|
|
|
|
|
|
|
|
|
|
|
|
|
| |||||||||||
|
|
|
|
|
|
|
|
|
|
|
|
|
|
|
|
|
|
|
|
|
|
|
|
|
|
|
| |||||||||||
Diluted (2,3) |
|
|
| 225,976 |
|
|
|
|
| 225,976 |
|
|
|
|
|
|
|
|
|
|
|
|
|
|
|
|
| |||||||||||
Notes:
(1) Represents the adjusted Non-GAAP results of operations and financial position of Genzyme Corporation for the year ended December 31, 2003. All other amounts presented herein represent previously reported amounts. We believe that certain Non-GAAP financial measures, when considered together with the GAAP figures, can enhance the overall understanding of the company’s past financial performance and its prospects for the future. The Non-GAAP financial measures are included with the intent of providing investors with a more complete understanding of the trends underlying our operating results and financial position and are among the primary indicators management uses for planning and forecasting purposes and measuring the company’s performance. Such Non-GAAP financial measures should not be considered in isolation or used as a substitute for GAAP.
(2) Represents the operations of Genzyme General Division for January 1, 2003 through June 30, 2003 and the operations of Genzyme Corporation from July 1, 2003 through December 31, 2003.
(3) Diluted earnings per share and diluted weighted average shares outstanding reflect the adoption of EITF 04-8. In accordance with the provisions of EITF 04-8, interest and debt fees related to our 1.25% convertible senior notes of $497K, net of tax, have been added back to net income and approximately 557K shares have been added to diluted weighted average shares outstanding for purposes of computing GAAP and Non-GAAP diluted earnings per share.
GENZYME GENERAL
RECONCILIATION OF GAAP TO NON-GAAP EARNINGS
For the Year Ended December 31, 2002
(Amounts in thousands, except percentage and per share data)
|
|
|
|
|
|
|
|
|
|
|
|
|
|
|
|
|
|
|
|
|
|
|
|
|
|
|
|
|
|
|
|
|
|
|
|
|
|
|
|
|
|
|
|
|
|
|
|
|
|
|
|
|
|
|
|
|
|
|
|
|
|
|
| Items Formerly Excluded From Non-GAAP [(Income)/Expense] |
| ||||||||||||||||||||||||||||||||||||||||||
|
|
|
|
|
|
|
|
|
|
|
|
|
|
|
|
|
| Tax Benefit of |
|
|
|
|
|
|
|
|
|
|
|
|
|
|
|
|
|
|
| ||||||||||||||||
|
|
|
|
|
|
|
|
|
|
|
|
|
|
|
| Recovery of |
| Genzyme |
|
|
| Failed |
|
|
|
|
|
|
|
|
| Reverse Excess |
|
|
|
|
| ||||||||||||||||
|
|
|
|
|
|
|
|
|
|
|
|
|
| Pompe |
| Note Receivable |
| Biosurgery |
|
|
| Production |
| Plant |
| Damaged |
| Impaired |
|
|
| Future Funding |
| Write Off |
|
|
| ||||||||||||||||
|
|
|
| GAAP |
|
|
| NON-GAAP |
| Novazyme |
| Diagnostic |
| CHO/Synpac |
| Previously |
| Asset |
| Argentina |
| Runs by |
| Shutdown |
| In-Transit |
| Equity |
|
|
| Obligation for |
| Engineering |
|
|
| ||||||||||||||||
|
|
|
| As Reported |
|
|
| As Adjusted (1) |
| Restructuring |
| Restructuring |
| Program |
| Written Off |
| Impairment |
| Bad Debt |
| Joint Venture |
| Maintenance |
| Inventory |
| Investment |
| Severance |
| Trans |
| Costs |
| Amortization |
| ||||||||||||||||
Income Statement Classification: |
|
|
|
|
|
|
|
|
|
|
|
|
|
|
|
|
|
|
|
|
|
|
|
|
|
|
|
|
|
|
|
|
|
|
|
|
| ||||||||||||||||
|
|
|
|
|
|
|
|
|
|
|
|
|
|
|
|
|
|
|
|
|
|
|
|
|
|
|
|
|
|
|
|
|
|
|
|
|
| ||||||||||||||||
Total revenues |
|
|
| $ | 1,080,185 |
|
|
| $ | 1,080,185 |
|
|
|
|
|
|
|
|
|
|
|
|
|
|
|
|
|
|
|
|
|
|
|
|
|
|
|
|
| ||||||||||||||
|
|
|
|
|
|
|
|
|
|
|
|
|
|
|
|
|
|
|
|
|
|
|
|
|
|
|
|
|
|
|
|
|
|
|
|
|
| ||||||||||||||||
Cost of products and services sold |
|
|
| $ | (265,818 | ) |
|
| $ | (265,818 | ) |
|
| $ | 2,856 |
|
|
|
|
|
|
|
|
|
|
| $ | 2,832 |
| $ | 2,214 |
|
|
|
|
|
|
|
|
|
|
| |||||||||||
Gross margin |
| 75 | % | $ | 814,367 |
| 75 | % | $ | 814,367 |
|
|
| $ | 2,856 |
|
|
|
|
|
|
|
|
|
|
| $ | 2,832 |
| $ | 2,214 |
|
|
|
|
|
|
|
|
|
|
| |||||||||||
|
|
|
|
|
|
|
|
|
|
|
|
|
|
|
|
|
|
|
|
|
|
|
|
|
|
|
|
|
|
|
|
|
|
|
|
|
| ||||||||||||||||
Selling, general and administrative |
|
|
| $ | (323,683 | ) |
|
| $ | (323,683 | ) |
|
|
|
|
|
|
|
|
|
| $ | 2,500 |
|
|
|
|
|
|
|
|
| $ | 3,300 |
| $ | (5,497 | ) |
|
|
|
| |||||||||||
|
|
|
|
|
|
|
|
|
|
|
|
|
|
|
|
|
|
|
|
|
|
|
|
|
|
|
|
|
|
|
|
|
|
|
|
|
| ||||||||||||||||
Research and development |
|
|
| $ | (230,043 | ) |
|
| $ | (230,043 | ) | $ | 1,968 |
|
|
| $ | 8,786 |
|
|
|
|
|
|
|
|
|
|
|
|
|
|
| $ | 927 |
|
|
|
|
|
|
| |||||||||||
|
|
|
|
|
|
|
|
|
|
|
|
|
|
|
|
|
|
|
|
|
|
|
|
|
|
|
|
|
|
|
|
|
|
|
|
|
| ||||||||||||||||
Amortization of intangibles |
|
|
| $ | (38,998 | ) |
|
| $ | (38,998 | ) |
|
|
|
|
|
|
|
|
|
|
|
|
|
|
|
|
|
|
|
|
|
|
|
|
|
| $ | 38,998 |
| |||||||||||||
|
|
|
|
|
|
|
|
|
|
|
|
|
|
|
|
|
|
|
|
|
|
|
|
|
|
|
|
|
|
|
|
|
|
|
|
|
| ||||||||||||||||
Charge for impaired assets |
|
|
| $ | (13,986 | ) |
|
| $ | (13,986 | ) |
|
|
|
|
|
|
|
|
|
|
|
|
|
|
|
|
|
|
|
|
|
|
|
| $ | 13,986 |
|
|
| |||||||||||||
|
|
|
|
|
|
|
|
|
|
|
|
|
|
|
|
|
|
|
|
|
|
|
|
|
|
|
|
|
|
|
|
|
|
|
|
|
| ||||||||||||||||
Equity in income (loss) of equity method investments |
|
|
| $ | (16,858 | ) |
|
| $ | (16,858 | ) |
|
|
|
|
|
|
|
|
|
|
|
| $ | 3,604 |
|
|
|
|
|
|
|
|
|
|
|
|
|
|
| |||||||||||||
|
|
|
|
|
|
|
|
|
|
|
|
|
|
|
|
|
|
|
|
|
|
|
|
|
|
|
|
|
|
|
|
|
|
|
|
|
| ||||||||||||||||
Gains (losses) on investments in equity securities |
|
|
| $ | (14,497 | ) |
|
| $ | (14,497 | ) |
|
|
|
|
|
|
|
|
|
|
|
|
|
|
|
|
|
| $ | 15,367 |
|
|
|
|
|
|
|
|
| |||||||||||||
|
|
|
|
|
|
|
|
|
|
|
|
|
|
|
|
|
|
|
|
|
|
|
|
|
|
|
|
|
|
|
|
|
|
|
|
|
| ||||||||||||||||
Other |
|
|
| $ | (152 | ) |
|
| $ | (152 | ) |
|
|
|
|
|
| $ | (2,670 | ) |
|
|
|
|
|
|
|
|
|
|
|
|
|
|
|
|
|
|
|
| |||||||||||||
|
|
|
|
|
|
|
|
|
|
|
|
|
|
|
|
|
|
|
|
|
|
|
|
|
|
|
|
|
|
|
|
|
|
|
|
|
| ||||||||||||||||
Investment income |
|
|
| $ | 48,944 |
|
|
| $ | 48,944 |
|
|
|
|
|
|
|
|
|
|
|
|
|
|
|
|
|
|
|
|
|
|
|
|
|
|
|
|
| ||||||||||||||
|
|
|
|
|
|
|
|
|
|
|
|
|
|
|
|
|
|
|
|
|
|
|
|
|
|
|
|
|
|
|
|
|
|
|
|
|
| ||||||||||||||||
Interest Expense |
|
|
| $ | (17,847 | ) |
|
| $ | (17,847 | ) |
|
|
|
|
|
|
|
|
|
|
|
|
|
|
|
|
|
|
|
|
|
|
|
|
|
|
|
| ||||||||||||||
|
|
|
|
|
|
|
|
|
|
|
|
|
|
|
|
|
|
|
|
|
|
|
|
|
|
|
|
|
|
|
|
|
|
|
|
|
| ||||||||||||||||
Summary: |
|
|
|
|
|
|
|
|
|
|
|
|
|
|
|
|
|
|
|
|
|
|
|
|
|
|
|
|
|
|
|
|
|
|
|
|
| ||||||||||||||||
|
|
|
|
|
|
|
|
|
|
|
|
|
|
|
|
|
|
|
|
|
|
|
|
|
|
|
|
|
|
|
|
|
|
|
|
|
| ||||||||||||||||
Income (loss) before income taxes |
|
|
| $ | 207,247 |
|
|
| $ | 207,247 |
| $ | 1,968 |
| $ | 2,856 |
| $ | 8,786 |
| $ | (2,670 | ) | $ | — |
| $ | 2,500 |
| $ | 3,604 |
| $ | 2,832 |
| $ | 2,214 |
| $ | 15,367 |
| $ | 4,227 |
| $ | (5,497 | ) | $ | 13,986 |
| $ | 38,998 |
|
|
|
|
|
|
|
|
|
|
|
|
|
|
|
|
|
|
|
|
|
|
|
|
|
|
|
|
|
|
|
|
|
|
|
|
|
|
| ||||||||||||||||
(Provision for) benefit from income taxes |
| 14 | % | $ | (28,721 | ) | 14 | % | $ | (28,721 | ) | $ | (724 | ) | $ | (1,051 | ) | $ | (3,233 | ) | $ | 983 |
| $ | (3,297 | ) | $ | (920 | ) | $ | (1,326 | ) | $ | (1,042 | ) | $ | (815 | ) | $ | (5,655 | ) | $ | (1,556 | ) | $ | 2,023 |
| $ | (5,147 | ) | $ | (14,351 | ) |
|
|
|
|
|
| �� |
|
|
|
|
|
|
|
|
|
|
|
|
|
|
|
|
|
|
|
|
|
|
|
|
|
|
|
|
|
|
| ||||||||||||||||
Net income (loss) (2) |
|
|
| $ | 178,526 |
|
|
| $ | 178,526 |
| $ | 1,244 |
| $ | 1,805 |
| $ | 5,553 |
| $ | (1,687 | ) | $ | (3,297 | ) | $ | 1,580 |
| $ | 2,278 |
| $ | 1,790 |
| $ | 1,399 |
| $ | 9,712 |
| $ | 2,671 |
| $ | (3,474 | ) | $ | 8,839 |
| $ | 24,647 |
|
|
|
|
|
|
|
|
|
|
|
|
|
|
|
|
|
|
|
|
|
|
|
|
|
|
|
|
|
|
|
|
|
|
|
|
|
|
| ||||||||||||||||
Net income (loss) per share: |
|
|
|
|
|
|
|
|
|
|
|
|
|
|
|
|
|
|
|
|
|
|
|
|
|
|
|
|
|
|
|
|
|
|
|
|
| ||||||||||||||||
Basic (2) |
|
|
| $ | 0.83 |
|
|
| $ | 0.83 |
| $ | 0.006 |
| $ | 0.008 |
| $ | 0.026 |
| $ | (0.008 | ) | $ | (0.015 | ) | $ | 0.007 |
| $ | 0.011 |
| $ | 0.008 |
| $ | 0.007 |
| $ | 0.045 |
| $ | 0.012 |
| $ | (0.016 | ) | $ | 0.041 |
| $ | 0.115 |
|
|
|
|
|
|
|
|
|
|
|
|
|
|
|
|
|
|
|
|
|
|
|
|
|
|
|
|
|
|
|
|
|
|
|
|
|
|
| ||||||||||||||||
Diluted (2) |
|
|
| $ | 0.81 |
|
|
| $ | 0.81 |
| $ | 0.006 |
| $ | 0.008 |
| $ | 0.025 |
| $ | (0.008 | ) | $ | (0.015 | ) | $ | 0.007 |
| $ | 0.010 |
| $ | 0.008 |
| $ | 0.006 |
| $ | 0.044 |
| $ | 0.012 |
| $ | (0.016 | ) | $ | 0.040 |
| $ | 0.112 |
|
|
|
|
|
|
|
|
|
|
|
|
|
|
|
|
|
|
|
|
|
|
|
|
|
|
|
|
|
|
|
|
|
|
|
|
|
|
| ||||||||||||||||
Weighted average shares outstanding: |
|
|
|
|
|
|
|
|
|
|
|
|
|
|
|
|
|
|
|
|
|
|
|
|
|
|
|
|
|
|
|
|
|
|
|
|
| ||||||||||||||||
Basic (2) |
|
|
| 214,038 |
|
|
| 214,038 |
|
|
|
|
|
|
|
|
|
|
|
|
|
|
|
|
|
|
|
|
|
|
|
|
|
|
|
|
| ||||||||||||||||
|
|
|
|
|
|
|
|
|
|
|
|
|
|
|
|
|
|
|
|
|
|
|
|
|
|
|
|
|
|
|
|
|
|
|
|
|
| ||||||||||||||||
Diluted (2) |
|
|
| 219,388 |
|
|
| 219,388 |
|
|
|
|
|
|
|
|
|
|
|
|
|
|
|
|
|
|
|
|
|
|
|
|
|
|
|
|
| ||||||||||||||||
Notes:
(1) Represents the adjusted Non-GAAP results of operations and financial position of Genzyme General Division for the year ended December 31, 2002. All other amounts presented herein represent previously reported amounts. We believe that certain Non-GAAP financial measures, when considered together with the GAAP figures, can enhance the overall understanding of the company’s past financial performance and its prospects for the future. The Non-GAAP financial measures are included with the intent of providing investors with a more complete understanding of the trends underlying our operating results and financial position and are among the primary indicators management uses for planning and forecasting purposes and measuring the company’s performance. Such Non-GAAP financial measures should not be considered in isolation or used as a substitute for GAAP.
(2) Represents the results of operations, net income per share and weighted average shares outstanding for Genzyme General Division.