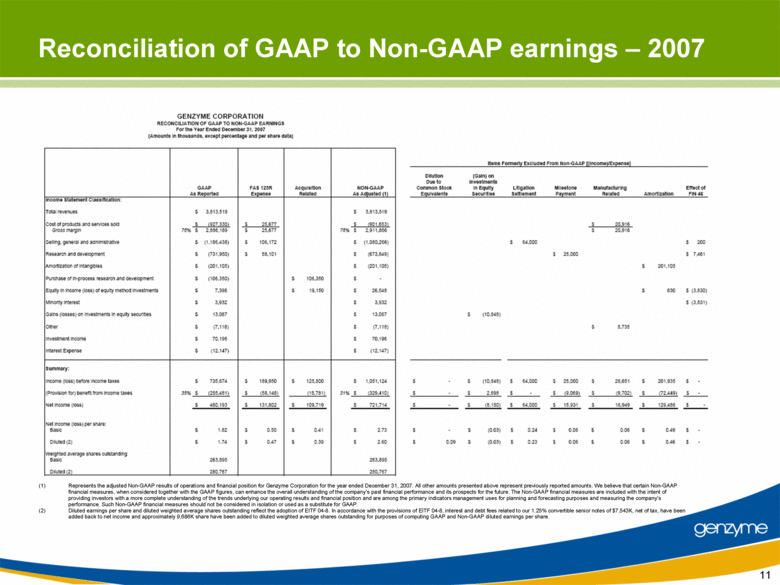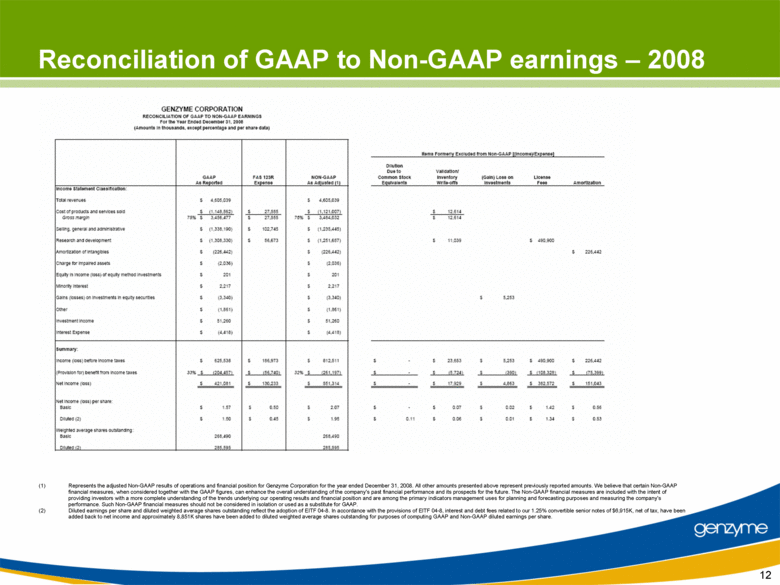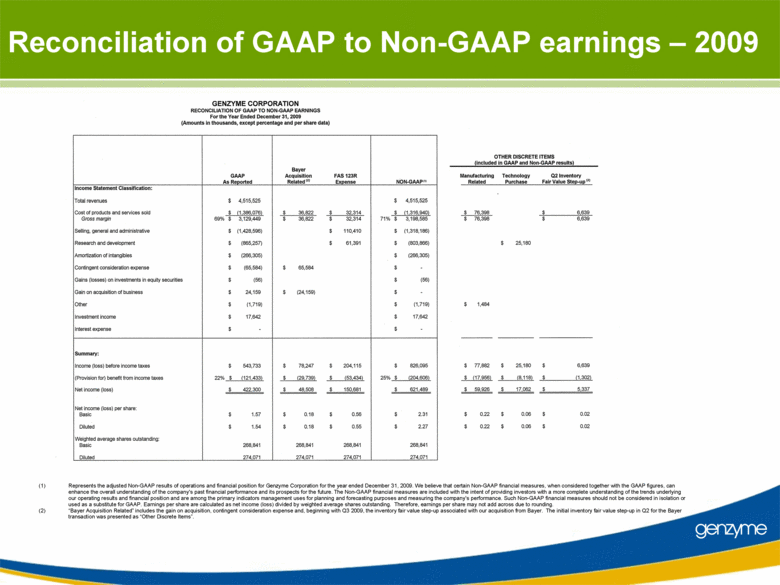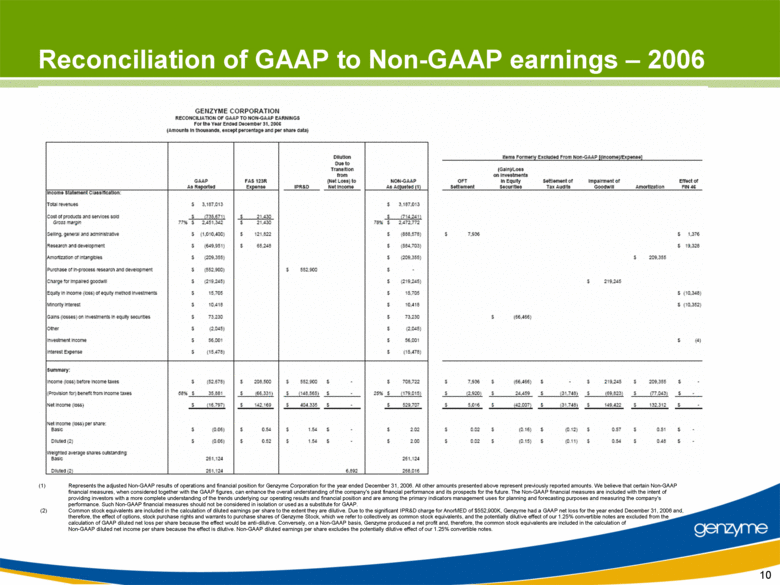
| Reconciliation of GAAP to Non-GAAP earnings — 2006 (1) Represents the adjusted Non-GAAP results of operations and financial position for Genzyme Corporation for the year ended December 31, 2006. All other amounts presented above represent previously reported amounts. We believe that certain Non-GAAP financial measures, when considered together with the GAAP figures, can enhance the overall understanding of the company’s past financial performance and its prospects for the future. The Non-GAAP financial measures are included with the intent of providing investors with a more complete understanding of the trends underlying our operating results and financial position and are among the primary indicators management uses for planning and forecasting purposes and measuring the company’s performance. Such Non-GAAP financial measures should not be considered in isolation or used as a substitute for GAAP. (2) Common stock equivalents are included in the calculation of diluted earnings per share to the extent they are dilutive. Due to the significant IPR&D charge for AnorMED of $552,900K, Genzyme had a GAAP net loss for the year ended December 31, 2006 and, therefore, the effect of options, stock purchase rights and warrants to purchase shares of Genzyme Stock, which we refer to collectively as common stock equivalents, and the potentially dilutive effect of our 1.25% convertible notes are excluded from the calculation of GAAP diluted net loss per share because the effect would be anti-dilutive. Conversely, on a Non-GAAP basis, Genzyme produced a net profit and, therefore, the common stock equivalents are included in the calculation of Non-GAAP diluted net income per share because the effect is dilutive. Non-GAAP diluted earnings per share excludes the potentially dilutive effect of our 1.25% convertible notes. GENZYME CORPORATION RECONCILIATION OF GAAP TO NON-GAAP EARNINGS For the Year Ended December 31, 2006 (Amounts in thousands, except percentage and per share data) GAAP As Reported FAS 123R Expense IPR&D Dilution Due to Transition from (Net Loss) to Net Income NON-GAAP As Adjusted (1) Items Formerly Excluded From Non-GAAP [(Income)/Expense] Income Statement Classification: Total revenues $3,157,013 $3,187,013 Cost of products and services sold Gross margin $(735,671) $21,430 $(714,241) 77% $2,451,342 $21,430 78% 2,472,772 Selling, general and administrative $(1,010,400) $121,822 $(888,578) $7,936 $1,376 Research and development $(649,951) $65,248 $(584,703) $19,328 Amortization of intangibles $(209,355) $(209,355) $209,355 Purchase of in-process research and development $(552,900) $552,900 $- Charge for impaired goodwill $(219,245) $(219,245) $219,245 Equity in income (loss) of equity method investments $15,705 $15,705 $(10,348) Minority interest $10,418 $10,418 $(10,352) Gains (losses) on investments in equity securities $73,230 $73,230 $(66,466) Other $(2,045) $(2,045) Investment Income $56,001 $56,001 $(4) Interest Expense $(15,478) $(15,478) Summary: Income (loss) before income taxes $(52,678) $208,500 $552,900 $- $708,722 $7,936 $(66,466) $- $219,245 $209,355 $- (Provision for) benefit from income taxes 68% $35,881 $(66,331) $(148,565) $- 25% $(179,015) $(2,920) $24,459 $(31,748) $(69,823) $(77,043) $- Net income (loss) $(16,797) $142,169 $404,335 $- $529,707 $5,016 $(42,007) $(31,748) $149,422 $132,312 $- Net income (loss) per share: Basic $(0.06) $0.54 $1.54 $- $2.02 $0.02 $(0.16) $(0.12) $0.57 $0.51 $- Diluted (2) $0.06) $0.52 $1.54 $- $2.00 $0.02 $(0.15) $(0.11) $0.54 $0.48 $- Weighted average shares outstanding: Basic 251,124 251,124 Diluted (2) 251 ,124 6,892 268,016 10 OFT Settlement (Gain)/Loss on Investments in Equity Securities Settlement of Tax Audits Impairment of Goodwill Amortization Effect of FIN 46 |

