Exhibit 99.1
Genzyme Reports Financial Results for the Third Quarter of 2010
Growth Driven by Cerezyme Recovery
Expects Q4 Non-GAAP EPS of $0.90 – $0.95
CAMBRIDGE, Mass.--(BUSINESS WIRE)--October 20, 2010--Genzyme Corp. (NASDAQ: GENZ) today reported third-quarter earnings growth driven by increased shipments of Cerezyme® (imiglucerase for injection). Patients in the United States began returning to normal dosing levels last month, and patients globally are expected to be able to do so this quarter. Earnings growth in the third quarter was also driven by strong revenue from Lumizyme™ (alglucosidase alfa) and cost reduction measures.
Third-quarter revenue was $1.0 billion, compared with $923.8 million in the same period last year. Operating results for the third quarter of 2009 have been revised to exclude the Genetics and Diagnostics businesses, which the company is planning to divest by the end of this year.
GAAP net income was $69.0 million, or $0.26 per diluted share, compared with $16.0 million, or $0.06 per diluted share, in the third quarter of 2009. Non-GAAP net income was $111.5 million, or $0.42 per diluted share, in line with the company’s guidance, compared with $77.9 million, or $0.28 per diluted share, in the same period last year. Non-GAAP net income excludes stock compensation expenses, costs associated with the acquisition of oncology products from Bayer, and the operations of the Genetics and Diagnostics businesses, as they meet the criteria of discontinued operations. At the end of the third quarter, Genzyme’s cash balance was approximately $1.2 billion.
“In the third quarter we saw our financial recovery start to take effect, and we expect that this will accelerate during the fourth quarter as Cerezyme patients are able to return to normal dosing levels and we begin to increase shipments of Fabrazyme,” said Henri A. Termeer, Genzyme’s chairman and chief executive officer. “We are also implementing measures to reduce our operating costs, while remaining focused on the priorities of transforming our manufacturing operations, strengthening our core genetic disease business, and advancing key pipeline programs to ensure sustainable long-term growth.”
During the third quarter, Genzyme made progress in executing its plan to increase shareholder value. The company last month announced that it entered into an asset purchase agreement under which Laboratory Corporation of America Holdings will acquire Genzyme Genetics for $925 million in cash. Plans to divest the Diagnostics and Pharmaceuticals businesses remain on track.
Genzyme completed the first half of a planned $2 billion share repurchase, financed by a $1 billion debt offering. The company has repurchased approximately 15.7 million shares at an approximate average price of $63.90. At the end of the second quarter, the company had 265.3 million basic weighted average shares outstanding. As a result of the buyback, this was reduced to 255.4 million at the end of the third quarter. Approximately 4 million shares of the repurchase were offset by the exercise of stock options. Proceeds from the divestitures of the Genetics, Diagnostics and Pharmaceuticals businesses may be used to finance the second half of the repurchase.
Cerezyme revenue in the fourth quarter is expected to be $235 – $245 million and Fabrazyme® (agalsidase beta) revenue is expected to be $70 – $75 million, based on currently anticipated product release dates. Non-GAAP EPS is expected to be $0.90 - $0.95 per diluted share in the fourth quarter.
Product Supply and Consent Decree Updates
Cerezyme’s recovery passed a major milestone with the return to full supply. Patients in the United States were able to begin returning to normal dosing levels in September, and patients globally are expected to be able to do so during the fourth quarter. Genzyme has begun the process of doubling allocations of Fabrazyme, starting in the United States, and will do so globally throughout the fourth quarter. The company expects to be able to fully supply the global market during the first half of 2011.
Since levels of demand, ordering patterns and dose regimens vary by region, Genzyme staff in countries around the world will provide patients and physicians with more information on the local impact of this guidance for each product. Because inventories remain limited, any manufacturing disruptions or delays in product release can impact availability of Cerezyme and Fabrazyme.
Genzyme is on schedule to meet the November consent-decree deadlines for ceasing fill/finish at its Allston plant for products sold in the United States. The company has transferred a significant portion of this work to its state-of-the-art facility in Waterford, Ireland, and is in the process of transferring the remainder to a third-party manufacturer, where initial lot release has begun.
The company’s new Framingham manufacturing facility is operational with Fabrazyme engineering runs underway, and approval is anticipated in late 2011. Engineering runs are ongoing at the newly expanded fill/finish operations in Waterford, and regulatory approval is expected in the second half of 2011.
Third Quarter Results and Business Updates
Within the Personalized Genetic Health segment, third-quarter sales of Myozyme/Lumizyme increased 24 percent to $106.2 million from $86.0 million in the same period in 2009, reflecting the recent U.S. launch of Lumizyme. Third-quarter revenue increased 15 percent from second-quarter sales of $92.1 million. U.S. Myozyme/Lumizyme sales increased from $4.4 million in the second quarter to $19.1 million in the third quarter, and are expected to reach $30 million in the fourth quarter.
Third-quarter sales of Cerezyme nearly doubled to $179.8 million from $93.6 million in the same period in 2009, and grew 30 percent from $138.7 in the second quarter of this year, reflecting increasing shipments. Sales of Fabrazyme were $33.9 million, compared with $115.2 million in the third quarter of last year, reflecting supply constraints and the timing of lot releases during the quarter.
Within the Biosurgery segment, sales of Synvisc® (hylan G-F 20) increased 14 percent to $100.0 million from $87.5 million in last year’s third quarter. Synvisc, which is impacted by seasonal variability, continues to gain market share, and now represents 46 percent of the U.S. viscosupplement market. The single injection product, Synvisc-One® (hylan G-F 20), was launched in March 2009 and currently comprises more than two-thirds of all U.S. Synvisc revenue. During the third quarter, Genzyme also received regulatory approval of Synvisc in Japan, the largest market in the world for viscosupplement products.
Total revenue for the Renal and Endocrinology segment grew to $270.4 million from $260.4 million in the same period last year. Within this segment, sales of Genzyme’s sevelamer therapies, Renvela® (sevelamer carbonate) and Renagel® (sevelamer hydrochloride), were $178.8 million, compared with $181.7 million during the third quarter of 2009, reflecting the product mix shift from Renagel to Renvela.
U.S. sevelamer volume increased by nearly 8 percent compared to the third quarter of 2009. Genzyme remains the market leader in the United States, with approximately 52 percent of the phosphate binder market. In July, U.S. Medicare and Medicaid Services issued its final rule regarding bundling; oral medications without IV equivalents, including Renvela, will not be included in the bundle until January 1, 2014.
Genzyme recently won a highly competitive, $28 million tender over generic manufacturers in Brazil, the second-largest market for Renagel outside of the United States. This is the second consecutive year that Genzyme has won this federal tender, which will begin impacting revenue starting this quarter. The European launch of Renvela continues to progress well; the product was introduced in Spain last month and in the key markets of France, Italy and the U.K. this month.
Sales of Thyrogen were $42.3 million compared with $41.7 million in the third quarter of 2009, despite the limitations on the promotion of Thyrogen in the U.S. that are contained in the consent decree. Once fill/finish operations are successfully transferred to a third-party manufacturer and fill/finish for Thyrogen for the U.S market is no longer occurring at the Allston facility, the promotional limitations will no longer be in effect and Genzyme will resume normal U.S. promotional work. This is expected to occur by the end of next month.
Total revenue for the Hematology and Oncology segment increased 17 percent to $167.3 million from $143.6 million in last year’s third quarter. Growth was driven by sales of Mozobil® (plerixafor injection), which increased 83 percent to $23.6 million from $12.9 million in the third quarter last year, reflecting a strong increase in U.S. sales and the ongoing launch in Europe.
Third-quarter growth in this segment was also driven by sales of Clolar® (clofarabine injection), which increased 23 percent to $26.1 million from $21.2 million in the third quarter of 2009, led by a 31 percent increase in U.S. volume.
Gross Margin
The GAAP gross margin for the third quarter was 69 percent of revenue, compared with 70 percent in the third quarter of 2009, and the non-GAAP gross margin was 70 percent of revenue, compared with 72 percent in the same quarter last year. Gross margin reflects changes in product mix and investments made to improve the company’s quality operations, including costs associated with Genzyme’s third-party consultant, Quantic.
In the fourth quarter, non-GAAP gross margin is expected to be 74 percent of revenue, reflecting increased capacity utilization associated with the resupply of Cerezyme and Fabrazyme, and favorable product mix.
Operating Expenses
Genzyme’s GAAP SG&A was $337.9 million, or approximately 34 percent of revenue, compared with $323.5 million, or approximately 35 percent of revenue in the third quarter of 2009. Non-GAAP SG&A was $312.7 million, or approximately 31 percent of revenue, compared with $301.2 million, or approximately 33 percent of revenue, in the same period last year.
The company’s GAAP R&D was $207.1 million compared with $215.9 million in last year’s third quarter; non-GAAP R&D was $193.3 million compared with $202.2 million in the third quarter of 2009.
During the third quarter, Genzyme began reducing spending in advance of the implementation of the Value Improvement Program, which is beginning this quarter and intended to significantly reduce operating costs and improve margins over the next 15 months, with the full impact seen by 2012. Fourth-quarter savings resulting from this program are expected to be $0.05 per share, which is already accounted for in the fourth-quarter non-GAAP EPS guidance of $0.90 – $0.95.
Late-Stage R&D Programs
Genzyme’s late-stage pipeline features three novel treatments that are expected to help drive the company’s long-term growth:
- Genzyme last week presented five-year data from the phase 2 trial of alemtuzumab in multiple sclerosis at the Congress of the European Committee for Treatment and Research in Multiple Sclerosis. Data from a sub-group analysis showed that clinical outcomes persist at 60 months. Nearly 90 percent of alemtuzumab-treated patients were free of sustained accumulation of disability and maintained improved mean disability scores and a low risk of relapse over the 60-month follow-up period, with no changes in the safety profile. Two phase 3 studies are ongoing and data are expected beginning in mid-2011. The company expects to file for U.S. and E.U. approval in early 2012, and has been granted fast track status by the FDA for this submission.
- Genzyme and Isis Pharmaceuticals Inc. reported in August that phase 3 studies of mipomersen in severe hypercholesterolemia and high-risk patients met their primary endpoints with 36 and 37 percent LDL-C reductions. These two studies, along with two additional phase 3 trials that have already been completed, will contribute to the initial U.S. and E.U. regulatory filings for the product, which will seek approval for the treatment of patients with the genetic disease homozygous familial hypercholesterolemia (FH). These two filings may also include patients with severe heterozygous FH, and are anticipated in the first half of 2011.
- Enrollment is underway in three global, multi-center, phase 3 trials of eliglustat tartrate, Genzyme’s investigational oral therapy for patients with Gaucher disease type 1. There are currently a total of 65 active sites for these trials, with additional sites preparing to begin enrollment. Two-year follow-up data from the phase 2 clinical trial of the treatment were recently published in the journal Blood, and indicate continued improvements across all endpoints. Thirty-month data from the trial will be presented at the American Society of Human Genetics annual meeting next month. This therapy has the potential to transform the treatment experience for patients by providing an oral capsule option instead of bi-weekly infusions.
About Genzyme
One of the world's leading biotechnology companies, Genzyme is dedicated to making a major positive impact on the lives of people with serious diseases. Since 1981, the company has grown from a small start-up to a diversified enterprise with approximately 10,000 employees in locations spanning the globe and 2009 revenues of $4.5 billion. In 2010, Genzyme was named to the Fortune 500.
With many established products and services helping patients in 100 countries, Genzyme is a leader in the effort to develop and apply the most advanced technologies in the life sciences. The company's products and services are focused on rare inherited disorders, kidney disease, orthopaedics, cancer, transplant, and immune disease. Genzyme's commitment to innovation continues today with a substantial development program focused on these fields, as well as cardiovascular disease, neurodegenerative diseases, and other areas of unmet medical need.
Genzyme’s press releases and other company information are available at www.genzyme.com and by calling Genzyme’s investor information line at 1-800-905-4369 within the United States or 1-678-999-4572 outside the United States.
This press release contains forwarding-looking statements regarding Genzyme’s financial outlook and business plans including, without limitation: its financial expectations for the fourth quarter of 2010, including expected revenues for Cerezyme, Fabrazyme, and Myozyme/Lumizyme, expected non-GAAP EPS, and expected non-GAAP gross margin; its expectations regarding Cerezyme and Fabrazyme supply and patient dosing of Cerezyme; its expectation that its new Framingham manufacturing facility will be approved in late 2011 and that its expanded fill/finish operations in Waterford, Ireland will be approved in the second half of 2011; its expectation of the timing of the results from its two phase 3 studies of alemtuzumab in MS patients and its regulatory filing plans and timetables for the product; its assessment that the company is on track to meet its deadlines to transition all Allston fill/finish operations for products sold in the U.S. to a third party manufacturer; its plans to begin implementation of a plan to increase shareholder value and its expected fourth-quarter savings and the timing of margin improvements resulting from this program; its expectation regarding the sale of Genzyme Genetics; its expectations regarding mipomersen, including the anticipated regulatory filing strategy and timing; its expectations regarding the continued launch of Renvela in Europe; its assessment that the planned divestitures of its Diagnostics and Pharmaceuticals businesses are on-track; its anticipated timing for resumption of promotional activities for Thyrogen; and its assessment that eliglustat tartrate has the potential to transform the treatment experience for Gaucher patients. These statements are subject to risks and uncertainties that may cause actual results to differ materially. These risks and uncertainties include, among others: that production and shipment of Fabrazyme and Cerezyme does not continue as planned due to any reason, including contamination, equipment malfunctions, cell growth at lower than expected levels, fill-finish inefficiencies, power outages, human error or regulatory issues; that Genzyme is unable to meet its financial guidance for any reason, including due to lower than expected revenues attributable to further manufacturing issues or an inability to transition Lumizyme patients to commercial product as quickly as anticipated, or higher than expected operating expenses; that Genzyme cannot obtain on expected timetables or maintain regulatory approvals for its products and manufacturing facilities, including its Allston manufacturing facility, its new Framingham facility, and its expanded fill/finish operations in Waterford; that Genzyme is unable to successfully transition its fill/finish operations out of its Allston facility on planned timelines; that Genzyme is not able to successfully complete clinical development and obtain regulatory approvals of its product candidates within anticipated timeframes and for anticipated indications, including alemtuzumab-MS, mipomersen and eliglustat tartrate for any reason, including trial results that are not as favorable as expected and safety profiles that reduce the potential target population; that Genzyme is unable to complete the sale of Genzyme Genetics or complete its other planned business divestitures on the anticipated timeframes; that Genzyme will not be able to implement its plan to increase shareholder in a manner consistent with expectations, including an inability to reduce operating expenses to the extent expected; and the risks and uncertainties described in Genzyme's SEC reports filed under the Securities Exchange Act of 1934, including the factors discussed under the caption "Risk Factors" in Management’s Discussion and Analysis of Financial Condition and Results of Operations in Genzyme's Quarterly Report on Form 10-Q for the quarter ended June 30, 2010. Genzyme cautions investors not to place substantial reliance on the forward-looking statements contained in this press release. These statements speak only as of October 20, 2010 and Genzyme undertakes no obligation to update or revise them.
Important Information
Genzyme has filed with the Securities and Exchange Commission a Solicitation/Recommendation Statement on Schedule 14D-9. Genzyme shareholders are advised to read the company's Solicitation/Recommendation Statement on Schedule 14D-9 because it contains important information. Shareholders may obtain a free copy of the Solicitation/Recommendation Statement on Schedule 14D-9, as well as any other documents filed by Genzyme in connection with the tender offer by Sanofi-Aventis, free of charge at the SEC's website at http://www.sec.gov. In addition, investors can obtain free copies of these documents from Genzyme by directing a request to Genzyme at 500 Kendall Street, Cambridge, MA 02142, Attention: Shareholder Relations Department, or by calling 617-252-7500 and asking for the Shareholder Relations Department.
Genzyme®, Cerezyme®, Fabrazyme®, Myozyme®, Synvisc®, Synvisc-One®, Renvela®, Renagel®, Thyrogen®, Mozobil®, Clolar®, and Thymoglobulin® are registered trademarks and Lumizyme™ is a trademark of Genzyme Corporation or its subsidiaries. All rights reserved.
Conference Call Information
Genzyme will host a conference call today at 11 a.m. Eastern. To participate in the call, please dial 773-799-3828 and refer to pass code “Genzyme.” A replay of this call will be available by dialing 203-369-3645. This call will also be Webcast live on the investor events section of www.genzyme.com. Replays of the call and the Webcast will be available until midnight on October 27, 2010.
Upcoming Events
Genzyme’s board and management are initiating a program to communicate with shareholders regarding the company’s value and the Sanofi-Aventis tender offer. On October 22, Genzyme will hold an Analyst and Investor meeting in New York to provide a financial outlook, including 2011 guidance, an update on its progress in executing its shareholder value plan, and other pertinent information. The meeting will be Webcast on the investor events section of www.genzyme.com. Following this event, Genzyme’s management will begin a series of meetings with shareholders.
Genzyme will host a conference call on February 16, 2011 at 11:00 a.m. Eastern to discuss financial results for the fourth quarter of 2010. To participate in the call, please dial 773-799-3828 and refer to pass code “Genzyme.” A replay of this call will be available by dialing 203-369-3598. This call will also be Webcast live on the investor events section of www.genzyme.com. Replays of the call and the Webcast will be available until midnight on February 23, 2011.
| |
| |
| GENZYME CORPORATION (GENZ) |
| Consolidated Statements of Operations | Three Months Ended | | Nine Months Ended |
| (Unaudited, amounts in thousands, except per share amounts) | September 30, | | September 30, |
| | | 2010 | | | | 2009 (2) | | | | 2010 | | | | 2009 (2) | |
| | | | | | | | |
| Total revenues | | $ | 1,001,800 | | | $ | 923,766 | | | $ | 2,896,855 | | | $ | 3,038,998 | |
| | | | | | | | |
| Operating costs and expenses: | | | | | | | | |
| Cost of products and services sold | | | 309,273 | | | | 279,882 | | | | 856,474 | | | | 774,212 | |
| Selling, general and administrative | | | 337,883 | | | | 323,513 | | | | 1,203,918 | | | | 904,024 | |
| Research and development | | | 207,051 | | | | 215,925 | | | | 645,187 | | | | 608,935 | |
| Amortization of intangibles | | | 61,761 | | | | 68,078 | | | | 194,327 | | | | 183,270 | |
| Contingent consideration expense | | | (3,134 | ) | | | 28,197 | | | | 69,436 | | | | 37,287 | |
| Total operating costs and expenses | | | 912,834 | | | | 915,595 | | | | 2,969,342 | | | | 2,507,728 | |
| Operating income (loss) | | | 88,966 | | | | 8,171 | | | | (72,487 | ) | | | 531,270 | |
| | | | | | | | |
| Other income (expenses): | | | | | | | | |
| Equity in loss of equity method investments | | | (643 | ) | | | - | | | | (2,210 | ) | | | - | |
| Gains (losses) on investments in equity securities, net | | | 4,648 | | | | (651 | ) | | | (26,750 | ) | | | (1,332 | ) |
| Gain on acquisition of business | | | - | | | | - | | | | - | | | | 24,159 | |
| Other | | | (385 | ) | | | 614 | | | | (643 | ) | | | (2,347 | ) |
| Investment income | | | 2,403 | | | | 4,543 | | | | 8,787 | | | | 14,038 | |
| Interest expense | | | (3,358 | ) | | | - | | | | (3,358 | ) | | | - | |
| Total other income (expenses) | | | 2,665 | | | | 4,506 | | | | (24,174 | ) | | | 34,518 | |
| Income (loss) from continuing operations before taxes | | | 91,631 | | | | 12,677 | | | | (96,661 | ) | | | 565,788 | |
| (Provision for) benefit from income taxes | | | (17,385 | ) | | | 965 | | | | 58,493 | | | | (160,305 | ) |
| Income (loss) from continuing operations, net of tax | | | 74,246 | | | | 13,642 | | | | (38,168 | ) | | | 405,483 | |
| Income (loss) from discontinued operations, net of tax | | | (5,292 | ) | | | 2,353 | | | | (11,599 | ) | | | (6,428 | ) |
| Net income (loss) | | $ | 68,954 | | | $ | 15,995 | | | $ | (49,767 | ) | | $ | 399,055 | |
| | | | | | | | |
Net income (loss) per share-basic: | | | | | | | | |
| Income (loss) from continuing operations, net of tax | | $ | 0.29 | | | $ | 0.05 | | | $ | (0.15 | ) | | $ | 1.50 | |
Income (loss) from discontinued operations, net of tax | | $ | (0.02 | ) | | $ | 0.01 | | | $ | (0.04 | ) | | $ | (0.02 | ) |
| Net income (loss) | | $ | 0.27 | | | $ | 0.06 | | | $ | (0.19 | ) | | $ | 1.48 | |
| | | | | | | | |
| Net income (loss) per share-diluted: (1) | | | | | | | | |
| Income (loss) from continuing operations, net of tax | | $ | 0.28 | | | $ | 0.05 | | | $ | (0.15 | ) | | $ | 1.47 | |
Income (loss) from discontinued operations, net of tax | | $ | (0.02 | ) | | $ | 0.01 | | | $ | (0.04 | ) | | $ | (0.02 | ) |
| Net income (loss) | | $ | 0.26 | | | $ | 0.06 | | | $ | (0.19 | ) | | $ | 1.45 | |
| | | | | | | |
| Weighted average shares outstanding: | | | | | | | | |
| Basic | | | 255,359 | | | | 268,957 | | | | 262,293 | | | | 269,923 | |
| Diluted (1) | | | 263,786 | | | | 273,741 | | | | 262,293 | | | | 275,375 | |
| | | | | | | | |
| | | | | | | | |
| GENZYME CORPORATION (GENZ) | | | | | | | | |
| Condensed Consolidated Balance Sheets | | | | | | September 30, | | December 31, |
| (Unaudited, amounts in thousands) | | | | | | | 2010 | | | | 2009 (2) | |
| | | | | | | | |
| Cash and all marketable securities | | | | | | $ | 1,164,591 | | | $ | 1,049,700 | |
| Assets held for sale-current | | | | | | | 159,725 | | | | 190,292 | |
| Other current assets | | | | | | | 2,063,684 | | | | 1,706,635 | |
| Property, plant and equipment, net | | | | | | | 2,866,947 | | | | 2,627,231 | |
| Intangibles, net | | | | | | | 3,220,390 | | | | 3,625,126 | |
| Assets held for sale-noncurrent | | | | | | | 293,504 | | | | 274,039 | |
| Other noncurrent assets | | | | | | | 660,712 | | | | 587,701 | |
| Total assets | | | | | | $ | 10,429,553 | | | $ | 10,060,724 | |
| | | | | | | | |
| Liabilities associated with assets held for sale-current | | | | | | $ | 63,593 | | | $ | 55,206 | |
| Other current liabilities | | | | | | | 1,345,883 | | | | 1,024,924 | |
| Liabilities associated with assets held for sale-noncurrent | | | | | - | | | | 4,598 | |
| Other noncurrent liabilities | | | | | | | 2,018,840 | | | | 1,292,344 | |
| Stockholders' equity | | | | | | | 7,001,237 | | | | 7,683,652 | |
| Total liabilities and stockholders' equity | | | | | | $ | 10,429,553 | | | $ | 10,060,724 | |
| | | | | | | | |
| | | | | | | | | |
| All amounts herein are presented in accordance with GAAP and are provided for quantitative analysis only and should be read in conjunction with the text of the Earnings Release. Please refer to our Form 10-Q's and Form 10-K's for an in-depth discussion and analysis of our results of operations and financial position and for detailed information regarding specific material transactions in a particular period. |
| |
| In addition, we believe that certain Non-GAAP financial measures, when considered together with the GAAP figures, can enhance the overall understanding of the company's past financial performance and its prospects for the future. Please refer to our GAAP to Non-GAAP Reconciliations attached to the Earnings Releases for the above respective periods, which are filed as 8-K's with the Securities and Exchange Commission at www.sec.gov. The Non-GAAP financial measures are provided with the intent of providing investors with a more complete understanding of the trends underlying our operating results and financial position and are among the primary indicators management uses for planning and forecasting purposes and measuring the company's performance. |
| |
| (1) Diluted net loss per share and diluted weighted average shares outstanding for the nine months ended September 30, 2010 excludes the effect of all common stock equivalents because their effect would be anti-dilutive due to our net loss for the period. |
| | | | | | | | |
| (2) 2009 consolidated statements of operations and consolidated balance sheets have been revised to reflect discontinued operations (for Genzyme Genetics and Genzyme Diagnostics) and assets held for sale (for Genzyme Genetics, Genzyme Diagnostics and Genzyme Pharmaceuticals), respectively, in accordance with GAAP. |
| |
| |
| | | | | | | | | | | | | | | | | | | |
| | | | | | | | | | | | | | | | | | | |
| Genzyme Corporation (GENZ) | | | | | | | | | | | | | | | | | | | |
| Analyst Schedule | | | | | | | | | | | | | | | | | | | |
| (Amounts in thousands, except percentage amounts) | | | | | | | | | | | | | | | | | | |
| PRIOR PERIODS REVISED FOR DISCONTINUED OPERATIONS - UNAUDITED | | | Q3-10 | | | | | | |
| | | | | | | | | | | | | vs. | | | | | | |
| | | | | | | | | | | | | Q3-09 | | | | | | |
| | | Q3-09 | | Q4-09 | | Q1-10 | | Q2-10 | | Q3-10 | | % B/(W) | | FY 2008 | | FY 2009 | | YTD 9/30/10 |
| Total revenues: | | | | | | | | | | | | | | | | | | | |
| Personalized Genetic Health | | | | | | | | | | | | | | | | | | | |
| Cerezyme | | | $ | 93,599 | | $ | 105,368 | | $ | 179,147 | | $ | 138,736 | | $ | 179,781 | | 92 | % | | $ | 1,238,977 | | $ | 793,024 | | $ | 497,664 |
| Fabrazyme | | | | 115,161 | | | 58,026 | | | 53,241 | | | 39,484 | | | 33,882 | | (71 | %) | | | 494,260 | | | 429,690 | | | 126,607 |
| Myozyme | | | | 85,980 | | | 91,900 | | | 86,059 | | | 92,054 | | | 106,223 | | 24 | % | | | 296,176 | | | 324,545 | | | 284,336 |
| Aldurazyme | | | | 40,331 | | | 38,707 | | | 39,897 | | | 43,651 | | | 40,766 | | 1 | % | | | 151,664 | | | 155,065 | | | 124,314 |
Other Personalized Genetic Health | | | | 34,807 | | | 54,043 | | | 34,160 | | | 36,615 | | | 43,531 | | 25 | % | | | 114,950 | | | 147,286 | | | 114,306 |
Total Personalized Genetic Health product and service revenue | | | 369,878 | | | 348,044 | | | 392,504 | | | 350,540 | | | 404,183 | | 9 | % | | | 2,296,027 | | | 1,849,610 | | | 1,147,227 |
| R&D Revenue | | | | - | | | - | | | - | | | - | | | - | | | | | 110 | | | - | | | - |
| Total Personalized Genetic Health | | | | 369,878 | | | 348,044 | | | 392,504 | | | 350,540 | | | 404,183 | | 9 | % | | | 2,296,137 | | | 1,849,610 | | | 1,147,227 |
| | | | | | | | | | | | | | | | | | | |
| Renal and Endocrinology | | | | | | | | | | | | | | | | | | | |
| Renagel and Renvela (including Sevelamer) | | | | 181,702 | | | 178,890 | | | 164,607 | | | 170,066 | | | 178,755 | | (2 | %) | | | 677,729 | | | 706,589 | | | 513,428 |
| Hectorol | | | | 36,869 | | | 31,877 | | | 42,025 | | | 41,863 | | | 49,285 | | 34 | % | | | 128,153 | | | 130,757 | | | 133,173 |
| Subtotal | | | | 218,571 | | | 210,767 | | | 206,632 | | | 211,929 | | | 228,040 | | 4 | % | | | 805,882 | | | 837,346 | | | 646,601 |
| Thyrogen | | | | 41,691 | | | 47,267 | | | 45,625 | | | 46,300 | | | 42,257 | | 1 | % | | | 148,448 | | | 170,644 | | | 134,182 |
| Other Renal and Endocrinology | | | | - | | | - | | | - | | | - | | | - | | | | | - | | | 30 | | | - |
| Total Renal and Endocrinology product and service revenue | | | 260,262 | | | 258,034 | | | 252,257 | | | 258,229 | | | 270,297 | | 4 | % | | | 954,330 | | | 1,008,020 | | | 780,783 |
| R&D revenue | | | | 156 | | | 155 | | | 166 | | | 150 | | | 134 | | (14 | %) | | | 90 | | | 332 | | | 450 |
| Total Renal and Endocrinology | | | | 260,418 | | | 258,189 | | | 252,423 | | | 258,379 | | | 270,431 | | 4 | % | | | 954,420 | | | 1,008,352 | | | 781,233 |
| | | | | | | | | | | | | | | | | | | |
| Biosurgery | | | | | | | | | | | | | | | | | | | |
| Synvisc | | | | 87,526 | | | 95,419 | | | 79,507 | | | 107,686 | | | 99,998 | | 14 | % | | | 263,094 | | | 328,533 | | | 287,191 |
| Sepra products | | | | 37,831 | | | 40,365 | | | 37,177 | | | 38,935 | | | 40,858 | | 8 | % | | | 133,663 | | | 148,538 | | | 116,970 |
| Other Hyaluronic Acid products | | | | 8,800 | | | 6,698 | | | 8,984 | | | 4,818 | | | 5,908 | | (33 | %) | | | 45,587 | | | 34,597 | | | 19,710 |
| Total Hyaluronic Acid product and service revenue | | | 134,157 | | | 142,482 | | | 125,668 | | | 151,439 | | | 146,764 | | 9 | % | | | 442,344 | | | 511,668 | | | 423,871 |
| Cell-Based Therapy | | | | 10,449 | | | 14,080 | | | 10,645 | | | 11,839 | | | 9,510 | | (9 | %) | | | 42,547 | | | 45,788 | | | 31,994 |
| Other Biosurgery | | | | 394 | | | 343 | | | 494 | | | 300 | | | 258 | | (35 | %) | | | 3,564 | | | 1,866 | | | 1,052 |
| Total Biosurgery product and service revenue | | | 145,000 | | | 156,905 | | | 136,807 | | | 163,578 | | | 156,532 | | 8 | % | | | 488,455 | | | 559,322 | | | 456,917 |
| R&D revenue | | | | 647 | | | 414 | | | 559 | | | 404 | | | 200 | | (69 | %) | | | 2,645 | | | 2,493 | | | 1,163 |
| Total Biosurgery | | | | 145,647 | | | 157,319 | | | 137,366 | | | 163,982 | | | 156,732 | | 8 | % | | | 491,100 | | | 561,815 | | | 458,080 |
| | | | | | | | | | | | | | | | | | | |
| Hematology and Oncology | | | | | | | | | | | | | | | | | | | |
| Mozobil | | | | 12,896 | | | 19,267 | | | 18,966 | | | 22,141 | | | 23,630 | | 83 | % | | | 639 | | | 54,650 | | | 64,737 |
| Thymoglobulin | | | | 53,412 | | | 58,265 | | | 52,910 | | | 58,232 | | | 56,891 | | 7 | % | | | 183,296 | | | 215,964 | | | 168,033 |
| Clolar | | | | 21,182 | | | 22,230 | | | 24,688 | | | 25,520 | | | 26,129 | | 23 | % | | | 64,044 | | | 81,280 | | | 76,337 |
| Other Hematology and Oncology | | | | 56,096 | | | 68,978 | | | 59,727 | | | 70,597 | | | 60,645 | | 8 | % | | | 47,120 | | | 158,659 | | | 190,969 |
| Total Hematology and Oncology product and service revenue | | | 143,586 | | | 168,740 | | | 156,291 | | | 176,490 | | | 167,295 | | 17 | % | | | 295,099 | | | 510,553 | | | 500,076 |
| R&D revenue | | | | 7 | | | 24 | | | 19 | | | 7 | | | 1 | | (86 | %) | | | 14,439 | | | 2,367 | | | 27 |
| Total Hematology and Oncology | | | | 143,593 | | | 168,764 | | | 156,310 | | | 176,497 | | | 167,296 | | 17 | % | | | 309,538 | | | 512,920 | | | 500,103 |
| | | | | | | | | | | | | | | | | | | |
| Multiple Sclerosis R&D revenue | | | | - | | | 110 | | | - | | | - | | | - | | | | | 21,709 | | | 12,467 | | | - |
| | | | | | | | | | | | | | | | | | | |
| Other | | | | | | | | | | | | | | | | | | | |
| Other product and service revenue | | | | 3,648 | | | 5,137 | | | 3,099 | | | 3,399 | | | 2,848 | | (22 | %) | | | 51,473 | | | 29,441 | | | 9,346 |
| Total Other product and service revenue | | | 3,648 | | | 5,137 | | | 3,099 | | | 3,399 | | | 2,848 | | (22 | %) | | | 51,473 | | | 29,441 | | | 9,346 |
| R&D revenue | | | | 582 | | | 727 | | | 189 | | | 367 | | | 310 | | (47 | %) | | | 3,048 | | | 2,683 | | | 866 |
| Total Other | | | | 4,230 | | | 5,864 | | | 3,288 | | | 3,766 | | | 3,158 | | (25 | %) | | | 54,521 | | | 32,124 | | | 10,212 |
| | | | | | | | | | | | | | | | | | | |
| Total revenues | | | $ | 923,766 | | $ | 938,290 | | $ | 941,891 | | $ | 953,164 | | $ | 1,001,800 | | 8 | % | | $ | 4,127,425 | | $ | 3,977,288 | | $ | 2,896,855 |
| | | | | | | | | | | | | | | | | | | |
| All amounts herein are presented in accordance with GAAP and are provided for quantitative analysis only and should be read in conjunction with the text of the Earnings Release and our audited financial statements filed with the Securities and Exchange Commission. Please refer to our Form 10-Q's and Form 10-K's for an in-depth discussion and analysis of our results of operations and financial position and for detailed information regarding specific material transactions in a particular period. |
| | |
| | |
| | | | | | | | | | | | | | | | | | | | | | | | | | | | | | | |
| | | | | | | | | | | | | | | | | | | | | | | | | | | | | | | |
| GENZYME CORPORATION | | | | | | | | |
| RECONCILIATION OF GAAP TO NON-GAAP EARNINGS | | | | | | | | |
| For the Three Months Ended September 30, 2010 | | | | | | | | |
| (Amounts in thousands, except percentage and per share data) | | | | | | | | |
| UNAUDITED | | | | | | | | |
| | | | | | | | | | | | | | | | | | | | | | | | | | | | | | | |
| | | | | | | | | | | | | | | | | | | | | | | | | | | | | | | |
| | | | | | | | | | | | | | | | | | | | | | | | | | | | | | | |
| | | | | | | | | | | | | | | | | | | | | | | | | | | | | OTHER DISCRETE ITEMS |
| | | | | | | | | | | | | | | | | | | | | | | | | | | | | (included in GAAP and Non-GAAP results) |
| | | | | | | | Bayer | | | | Stock | | | | | | | | | | | | | | | | | | | |
| | GAAP | | | | | Acquisition | | | | Compensation | | | | Restructuring / | | | | Discontinued | | | | | | | | | Manufacturing | | Genzyme |
| | | As Reported | | | | | Related | | | | Expense | | | | Severance | | | | Operations (3) | | NON-GAAP (1) | | | | | | Related (2) | | Pharmaceuticals |
| Income Statement Classification: | | | | | | | | | | | | | | | | | | | | | | | | | | | | | | | |
| | | | | | | | | | | | | | | | | | | | | | | | | | | | | | | |
| Total revenues | | | $ | 1,001,800 | | | | | | $ | - | | | | | $ | - | | | | | $ | - | | | | | $ | - | | | $ | 1,001,800 | | | | | | | $ | - | | | $ | (3,082 | ) |
| | | | | | | | | | | | | | | | | | | | | | | | | | | | | | | |
| Cost of products and services sold | | | $ | (309,273 | ) | | | | | $ | 8,351 | | | | | $ | 5,023 | | | | | $ | - | | | | | $ | - | | | $ | (295,899 | ) | | | | | | $ | 5,629 | | | $ | 3,200 | |
| Gross margin | | 69 | % | $ | 692,527 | | | | | | $ | 8,351 | | | | | $ | 5,023 | | | | | | | | | | | 70 | % | $ | 705,901 | | | | | | | $ | 5,629 | | | $ | 118 | |
| | | | | | | | | | | | | | | | | | | | | | | | | | | | | | | |
| Selling, general and administrative | | | $ | (337,883 | ) | | | | | $ | - | | | | | $ | 22,003 | | | | | $ | 3,207 | | | | | $ | - | | | $ | (312,673 | ) | | | | | | $ | - | | | $ | 625 | |
| | | | | | | | | | | | | | | | | | | | | | | | | | | | | | | |
| Research and development | | | $ | (207,051 | ) | | | | | $ | - | | | | | $ | 13,781 | | | | | $ | - | | | | | $ | - | | | $ | (193,270 | ) | | | | | | $ | - | | | $ | 686 | |
| | | | | | | | | | | | | | | | | | | | | | | | | | | | | | | |
| Amortization of intangibles | | | $ | (61,761 | ) | | | | | $ | - | | | | | $ | - | | | | | $ | - | | | | | $ | - | | | $ | (61,761 | ) | | | | | | $ | - | | | $ | - | |
| | | | | | | | | | | | | | | | | | | | | | | | | | | | | | | |
| Contingent consideration expense | | | $ | 3,134 | | | | | | $ | (3,134 | ) | | | | $ | - | | | | | $ | - | | | | | $ | - | | | $ | - | | | | | | | $ | - | | | $ | - | |
| | | | | | | | | | | | | | | | | | | | | | | | | | | | | | | |
| Equity in loss of equity method investments | | | $ | (643 | ) | | | | | $ | - | | | | | $ | - | | | | | $ | - | | | | | $ | - | | | $ | (643 | ) | | | | | | $ | - | | | $ | - | |
| | | | | | | | | | | | | | | | | | | | | | | | | | | | | | | |
| Other | | | $ | 4,263 | | | | | | $ | - | | | | | $ | - | | | | | $ | - | | | | | $ | - | | | $ | 4,263 | | | | | | | $ | - | | | $ | - | |
| | | | | | | | | | | | | | | | | | | | | | | | | | | | | | | |
| Investment income | | | $ | 2,403 | | | | | | $ | - | | | | | $ | - | | | | | $ | - | | | | | $ | - | | | $ | 2,403 | | | | | | | $ | - | | | $ | - | |
| | | | | | | | | | | | | | | | | | | | | | | | | | | | | | | |
| Interest expense | | | $ | (3,358 | ) | | | | | $ | - | | | | | $ | - | | | | | $ | - | | | | | $ | - | | | $ | (3,358 | ) | | | | | | $ | - | | | $ | - | |
| | | | | | | | | | | | | | | | | | | | | | | | | | | | | | | | |
| | | | | | | | | | | | | | | | | | | | | | | | | | | | | | | |
| | | | | | | | | | | | | | | | | | | | | | | | | | | | | | | |
| Summary: | | | | | | | | | | | | | | | | | | | | | | | | | | | | | | | |
| | | | | | | | | | | | | | | | | | | | | | | | | | | | | | | |
| Income (loss) from continuing operations before income taxes | | | $ | 91,631 | | | | | | $ | 5,217 | | | | | $ | 40,807 | | | | | $ | 3,207 | | | | | $ | - | | | $ | 140,862 | | | | | | | $ | 5,629 | | | $ | 1,429 | |
| | | | | | | | | | | | | | | | | | | | | | | | | | | | | | | |
| (Provision for) benefit from income taxes | | 18.97 | % | $ | (17,385 | ) | | | | | $ | 2,126 | | | | | $ | (13,366 | ) | | | | $ | (744 | ) | | | | $ | - | | 20.85 | % | $ | (29,369 | ) | | | | | | $ | (1,860 | ) | | $ | (362 | ) |
| | | | | | | | | | | | | | | | | | | | | | | | | | | | | | | |
| Income (loss) from continuing operations | | | $ | 74,246 | | | | | | $ | 7,343 | | | | | $ | 27,441 | | | | | $ | 2,463 | | | | | $ | - | | | $ | 111,493 | | | | | | | $ | 3,769 | | | $ | 1,067 | |
| | | | | | | | | | | | | | | | | | | | | | | | | | | | | | | |
| Income (loss) from discontinued operations, net of tax | | | $ | (5,292 | ) | | | | | $ | - | | | | | $ | - | | | | | $ | - | | | | | $ | 5,292 | | | $ | - | | | | | | | $ | - | | | $ | - | |
| | | | | | | | | | | | | | | | | | | | | | | | | | | | | | | |
Net income (loss) | | | $ | 68,954 | | | | | | $ | 7,343 | | | | | $ | 27,441 | | | | | $ | 2,463 | | | | | $ | 5,292 | | | $ | 111,493 | | | | | | | $ | 3,769 | | | $ | 1,067 | |
| | | | | | | | | | | | | | | | | | | | | | | | | | | | | | | |
| | | | | | | | | | | | | | | | | | | | | | | | | | | | | | | |
| Net income (loss) per share-basic: | | | | | | | | | | | | | | | | | | | | | | | | | | | | | | | |
| Income (loss) from continuing operations, net of tax | | | $ | 0.29 | | | | | | $ | 0.03 | | | | | $ | 0.11 | | | | | $ | 0.01 | | | | | $ | - | | | $ | 0.44 | | | | | | | $ | 0.01 | | | $ | 0.00 | |
Income (loss) from discontinued operations, net of tax | | | $ | (0.02 | ) | | | | | $ | - | | | | | $ | - | | | | | $ | - | | | | | $ | 0.02 | | | $ | - | | | | | | | $ | - | | | $ | - | |
| Net income (loss) | | | $ | 0.27 | | | | | | $ | 0.03 | | | | | $ | 0.11 | | | | | $ | 0.01 | | | | | $ | 0.02 | | | $ | 0.44 | | | | | | | $ | 0.01 | | | $ | 0.00 | |
| | | | | | | | | | | | | | | | | | | | | | | | | | | | | | | |
| Net income (loss) per share-diluted: | | | | | | | | | | | | | | | | | | | | | | | | | | | | | | | |
| Income (loss) from continuing operations, net of tax | | | $ | 0.28 | | | | | | $ | 0.03 | | | | | $ | 0.10 | | | | | $ | 0.01 | | | | | $ | - | | | $ | 0.42 | | | | | | | $ | 0.01 | | | $ | 0.00 | |
Income (loss) from discontinued operations, net of tax | | | $ | (0.02 | ) | | | | | $ | - | | | | | $ | - | | | | | $ | - | | | | | $ | 0.02 | | | $ | - | | | | | | | $ | - | | | $ | - | |
| Net income (loss) | | | $ | 0.26 | | | | | | $ | 0.03 | | | | | $ | 0.10 | | | | | $ | 0.01 | | | | | $ | 0.02 | | | $ | 0.42 | | | | | | | $ | 0.01 | | | $ | 0.00 | |
| | | | | | | | | | | | | | | | | | | | | | | | | | | | | | | |
| | | | | | | | | | | | | | | | | | | | | | | | | | | | | | | |
| Weighted average shares outstanding: | | | | | | | | | | | | | | | | | | | | | | | | | | | | | | | |
| Basic | | | | 255,359 | | | | | | | 255,359 | | | | | | 255,359 | | | | | | 255,359 | | | | | | 255,359 | | | | 255,359 | | | | | | | | 255,359 | | | | 255,359 | |
| Diluted | | | | 263,786 | | | | | | | 263,786 | | | | | | 263,786 | | | | | | 263,786 | | | | | | 263,786 | | | | 263,786 | | | | | | | | 263,786 | | | | 263,786 | |
| | | | | | | | | | | | | | | | | | | | | | | | | | | | | | | |
| | | | | | | | | | | | | | | | | | | | | | | | | | | | | | | |
Notes: | | | | | | | | | | | | | | | | | | | | | | | | | | | | | | | |
| | | | | | | | | | | | | | | | | | | | | | | | | | | | | | | |
(1) Represents the Non-GAAP results of operations for Genzyme Corporation for the three months ended September 30, 2010. We believe that certain Non-GAAP financial measures, when considered together with the GAAP figures, can enhance the overall understanding of the company's past financial performance and its prospects for the future. The Non-GAAP financial measures are included with the intent of providing investors with a more complete understanding of the trends underlying our operating results and financial position and are among the primary indicators management uses for planning and forecasting purposes and measuring the company's performance. Such Non-GAAP financial measures should not be considered in isolation or used as a substitute for GAAP. Earnings per share are calculated as net income (loss) divided by weighted average shares outstanding. Therefore, earnings per share may not add across due to rounding. | |
| |
| (2) Represents write-offs of inventory that did not meet the necessary quality specifications. | | | | | | | |
| | | | | | | |
| (3) Discontinued Operations represents the operations of Genzyme Genetics and Genzyme Diagnostics, net of tax. | | | | | | | |
| | | | | | | |
| | | | | | | |
| | | | | | | | | | | | | | | | | | | | | | | | | | | | |
| | | | | | | | | | | | | | | | | | | | | | | | | | | | |
| GENZYME CORPORATION | | | | | | | | | |
| RECONCILIATION OF GAAP TO NON-GAAP EARNINGS | | | | | | | | | |
| For the Three Months Ended September 30, 2009 | | | | | | | | | |
| (Amounts in thousands, except percentage and per share data) | | | | | | | | | |
| REVISED FOR DISCONTINUED OPERATIONS - UNAUDITED | | | | | | | | | |
| | | | | | | | | | | | | | | | | | | | | | | | | | | | |
| | | | | | | | | | | | | | | | | | | | | | | | | | | | |
| | | | | | | | | | | | | | | | | | | | | | | | | | | | |
| | | | | | | | | | | | | | | | | | | | | | | | | | OTHER DISCRETE ITEMS |
| | | | | | | | | | | | | | | | | | | | | | | | | | (included in GAAP and Non-GAAP results) |
| | | | | | | | Bayer | | | | | | | | | | | | | | | | | | | | |
| | GAAP | | | | | Acquisition | | | | FAS 123R | | | | Discontinued | | | | | | | | | | Allston | | Technology |
| | | As Reported | | | | | Related | | | | Expense | | | | Operations (2) | | | NON-GAAP (1) | | | | | | | Remediation | | Purchase |
| Income Statement Classification: | | | | | | | | | | | | | | | | | | | | | | | | | | | | |
| | | | | | | | | | | | | | | | | | | | | | | | | | | | |
| Total revenues | | | $ | 923,766 | | | | | | $ | - | | | | | $ | - | | | | | $ | - | | | | $ | 923,766 | | | | | | | | $ | - | | | $ | - | |
| | | | | | | | | | | | | | | | | | | | | | | | | | | | |
| Cost of products and services sold | | | $ | (279,882 | ) | | | | | $ | 17,740 | | | | | $ | 5,015 | | | | | $ | - | | | | $ | (257,127 | ) | | | | | | | $ | 23,735 | | | |
| Gross margin | | 70 | % | $ | 643,884 | | | | | | $ | 17,740 | | | | | $ | 5,015 | | | | | $ | - | | | 72 | % | $ | 666,639 | | | | | | | | $ | 23,735 | | | $ | - | |
| | | | | | | | | | | | | | | | | | | | | | | | | | | | |
| Selling, general and administrative | | | $ | (323,513 | ) | | | | | $ | - | | | | | $ | 22,333 | | | | | $ | - | | | | $ | (301,180 | ) | | | | | | | $ | - | | | $ | - | |
| | | | | | | | | | | | | | | | | | | | | | | | | | | | |
| Research and development | | | $ | (215,925 | ) | | | | | $ | - | | | | | $ | 13,741 | | | | | $ | - | | | | $ | (202,184 | ) | | | | | | | $ | - | | | $ | 7,000 | |
| | | | | | | | | | | | | | | | | | | | | | | | | | | | |
| Amortization of intangibles | | | $ | (68,078 | ) | | | | | $ | - | | | | | $ | - | | | | | $ | - | | | | $ | (68,078 | ) | | | | | | | $ | - | | | $ | - | |
| | | | | | | | | | | | | | | | | | | | | | | | | | | | |
| Contingent consideration expense | | | $ | (28,197 | ) | | | | | $ | 28,197 | | | | | $ | - | | | | | $ | - | | | | $ | - | | | | | | | | $ | - | | | $ | - | |
| | | | | | | | | | | | | | | | | | | | | | | | | | | | |
| Gains (losses) on investments in equity securities | | | $ | (651 | ) | | | | | $ | - | | | | | $ | - | | | | | $ | - | | | | $ | (651 | ) | | | | | | | $ | - | | | $ | - | |
| | | | | | | | | | | | | | | | | | | | | | | | | | | | |
| Other | | | $ | 614 | | | | | | $ | - | | | | | $ | - | | | | | $ | - | | | | $ | 614 | | | | | | | | $ | - | | | $ | - | |
| | | | | | | | | | | | | | | | | | | | | | | | | | | | |
| Investment income | | | $ | 4,543 | | | | | | $ | - | | | | | $ | - | | | | | $ | - | | | | $ | 4,543 | | | | | | | | $ | - | | | $ | - | |
| | | | | | | | | | | | | | | | | | | | | | | | | | | | | |
| | | | | | | | | | | | | | | | | | | | | | | | | | | | |
| Summary: | | | | | | | | | | | | | | | | | | | | | | | | | | | | |
| | | | | | | | | | | | | | | | | | | | | | | | | | | | |
| Income (loss) from continuing operations before income taxes | | | $ | 12,677 | | | | | | $ | 45,937 | | | | | $ | 41,089 | | | | | $ | - | | | | $ | 99,703 | | | | | | | | $ | 23,735 | | | $ | 7,000 | |
| | | | | | | | | | | | | | | | | | | | | | | | | | | | |
| (Provision for) benefit from income taxes | | -7.61 | % | $ | 965 | | | | | | $ | (11,667 | ) | | | | $ | (11,151 | ) | | | | $ | - | | | 21.92 | % | $ | (21,853 | ) | | | | | | | $ | (4,186 | ) | | $ | (1,576 | ) |
| | | | | | | | | | | | | | | | | | | | | | | | | | | | |
| Income (loss) from continuing operations | | | $ | 13,642 | | | | | | $ | 34,270 | | | | | $ | 29,938 | | | | | $ | - | | | | $ | 77,850 | | | | | | | | $ | 19,549 | | | $ | 5,424 | |
| | | | | | | | | | | | | | | | | | | | | | | | | | | | |
| Income (loss) from discontinued operations, net of tax | | | $ | 2,353 | | | | | | $ | - | | | | | $ | - | | | | | $ | (2,353 | ) | | | $ | - | | | | | | | | $ | - | | | $ | - | |
| | | | | | | | | | | | | | | | | | | | | | | | | | | | |
| Net income (loss) | | | $ | 15,995 | | | | | | $ | 34,270 | | | | | $ | 29,938 | | | | | $ | (2,353 | ) | | | $ | 77,850 | | | | | | | | $ | 19,549 | | | $ | 5,424 | |
| | | | | | | | | | | | | | | | | | | | | | | | | | | | |
| | | | | | | | | | | | | | | | | | | | | | | | | | | | |
| Net income (loss) per share-basic: | | | | | | | | | | | | | | | | | | | | | | | | | | | | |
| Income (loss) from continuing operations, net of tax | | | $ | 0.05 | | | | | | $ | 0.13 | | | | | $ | 0.11 | | | | | $ | - | | | | $ | 0.29 | | | | | | | | $ | 0.07 | | | $ | 0.02 | |
Income (loss) from discontinued operations, net of tax | | | $ | 0.01 | | | | | | $ | - | | | | | $ | - | | | | | $ | (0.01 | ) | | | $ | - | | | | | | | | $ | - | | | $ | - | |
| Net income (loss) | | | $ | 0.06 | | | | | | $ | 0.13 | | | | | $ | 0.11 | | | | | $ | (0.01 | ) | | | $ | 0.29 | | | | | | | | $ | 0.07 | | | $ | 0.02 | |
| | | | | | | | | | | | | | | | | | | | | | | | | | | | |
| Net income (loss) per share-diluted: | | | | | | | | | | | | | | | | | | | | | | | | | | | | |
| Income (loss) from continuing operations, net of tax | | | $ | 0.05 | | | | | | $ | 0.13 | | | | | $ | 0.11 | | | | | $ | - | | | | $ | 0.28 | | | | | | | | $ | 0.07 | | | $ | 0.02 | |
Income (loss) from discontinued operations, net of tax | | | $ | 0.01 | | | | | | $ | - | | | | | $ | - | | | | | $ | (0.01 | ) | | | $ | - | | | | | | | | $ | - | | | $ | - | |
| Net income (loss) | | | $ | 0.06 | | | | | | $ | 0.13 | | | | | $ | 0.11 | | | | | $ | (0.01 | ) | | | $ | 0.28 | | | | | | | | $ | 0.07 | | | $ | 0.02 | |
| | | | | | | | | | | | | | | | | | | | | | | | | | | | |
| | | | | | | | | | | | | | | | | | | | | | | | | | | | |
| Weighted average shares outstanding: | | | | | | | | | | | | | | | | | | | | | | | | | | | | |
| Basic | | | | 268,957 | | | | | | | 268,957 | | | | | | 268,957 | | | | | | 268,957 | | | | | 268,957 | | | | | | | | | 268,957 | | | | 268,957 | |
| Diluted | | | | 273,741 | | | | | | | 273,741 | | | | | | 273,741 | | | | | | 273,741 | | | | | 273,741 | | | | | | | | | 273,741 | | | | 273,741 | |
| | | | | | | | | | | | | | | | | | | | | | | | | | | | |
| | | | | | | | | | | | | | | | | | | | | | | | | | | | |
Notes: | | | | | | | | | | | | | | | | | | | | | | | | | | | | |
| | | | | | | | | | | | | | | | | | | | | | | | | | | | |
| (1) Represents the Non-GAAP results of operations for Genzyme Corporation for the three months ended September 30, 2009. We believe that certain Non-GAAP financial measures, when considered together with the GAAP figures, can enhance the overall understanding of the company's past financial performance and its prospects for the future. The Non-GAAP financial measures are included with the intent of providing investors with a more complete understanding of the trends underlying our operating results and financial position and are among the primary indicators management uses for planning and forecasting purposes and measuring the company's performance. Such Non-GAAP financial measures should not be considered in isolation or used as a substitute for GAAP. Earnings per share are calculated as net income (loss) divided by weighted average shares outstanding. Therefore, earnings per share may not add across due to rounding. | | |
| | | | | | | | | | | | | | | | | | | | | | | | | | | | |
| (2) Discontinued Operations represents the operations of Genzyme Genetics and Genzyme Diagnostics, net of tax. | | | | | | | | | |
| | | | | | | | | | | | | | | | | | | | | | | | | | | | |
| | | | | | | | | | | | | | | | | | | | | | | | | | | | |
Photos/Multimedia Gallery Available: http://www.businesswire.com/cgi-bin/mmg.cgi?eid=6475677&lang=en
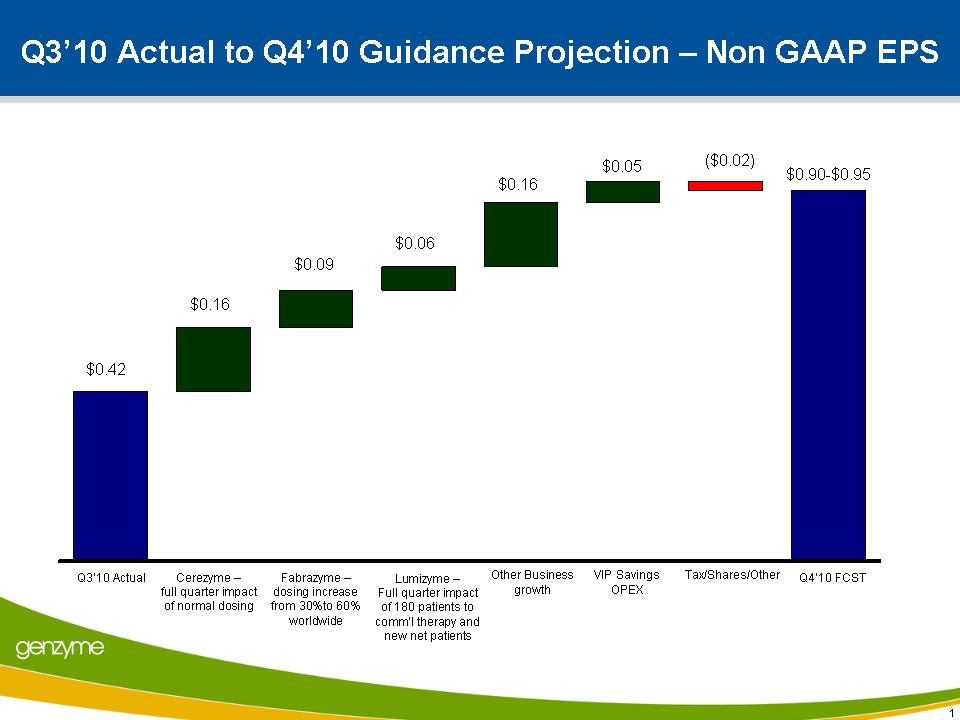
Q3’10 Actual to Q4’10 Guidance Projection – Non GAAP EPS $0.16 $0.06 $0.16 Cerezyme – full quarter impact of normal dosing Q3’10 Actual Q4’10 FCST Fabrazyme – dosing increase from 30%to 60% worldwide Tax/Shares/Other $0.42 $0.90-$0.95 1 Other Business growth ($0.02) $0.09 $0.05 Lumizyme – Full quarter impact of ATAP plus new patients VIP Savings OPEX
CONTACT:
Genzyme Corp.
Media Contact:
Erin Emlock, 617-768-6923
or
Investor Contact:
Patrick Flanigan, 617-768-6563