
Verizon 2.0 Segment Reporting Webcast June 18, 2019

“Safe Harbor” statement NOTE: In this presentation we have made forward-looking statements. These statements are based on our estimates and assumptions and are subject to risks and uncertainties. Forward-looking statements include the information concerning our possible or assumed future results of operations. Forward-looking statements also include those preceded or followed by the words “anticipates,” “believes,” “estimates,” “expects,” “hopes” or similar expressions. For those statements, we claim the protection of the safe harbor for forward-looking statements contained in the Private Securities Litigation Reform Act of 1995. We undertake no obligation to revise or publicly release the results of any revision to these forward-looking statements, except as required by law. Given these risks and uncertainties, readers are cautioned not to place undue reliance on such forward-looking statements. The following important factors, along with those discussed in our filings with the Securities and Exchange Commission (the “SEC”), could affect future results and could cause those results to differ materially from those expressed in the forward-looking statements: adverse conditions in the U.S. and international economies; the effects of competition in the markets in which we operate; material changes in technology or technology substitution; disruption of our key suppliers’ provisioning of products or services; changes in the regulatory environment in which we operate, including any increase in restrictions on our ability to operate our networks; breaches of network or information technology security, natural disasters, terrorist attacks or acts of war or significant litigation and any resulting financial impact not covered by insurance; our high level of indebtedness; an adverse change in the ratings afforded our debt securities by nationally accredited ratings organizations or adverse conditions in the credit markets affecting the cost, including interest rates, and/or availability of further financing; material adverse changes in labor matters, including labor negotiations, and any resulting financial and/or operational impact; significant increases in benefit plan costs or lower investment returns on plan assets; changes in tax laws or treaties, or in their interpretation; changes in accounting assumptions that regulatory agencies, including the SEC, may require or that result from changes in the accounting rules or their application, which could result in an impact on earnings; the inability to implement our business strategies; and the inability to realize the expected benefits of strategic transactions. As required by SEC rules, we have provided a reconciliation of the non-GAAP financial measures included in this presentation to the most directly comparable GAAP measures in materials on our website at www.verizon.com/about/investors. 2
Hans Vestberg Chairman and Chief Executive Officer
Today’s Agenda Verizon’s Strategy Verizon 2.0 VZ 1.0 to VZ 2.0 Comparisons and Recast Financials 4
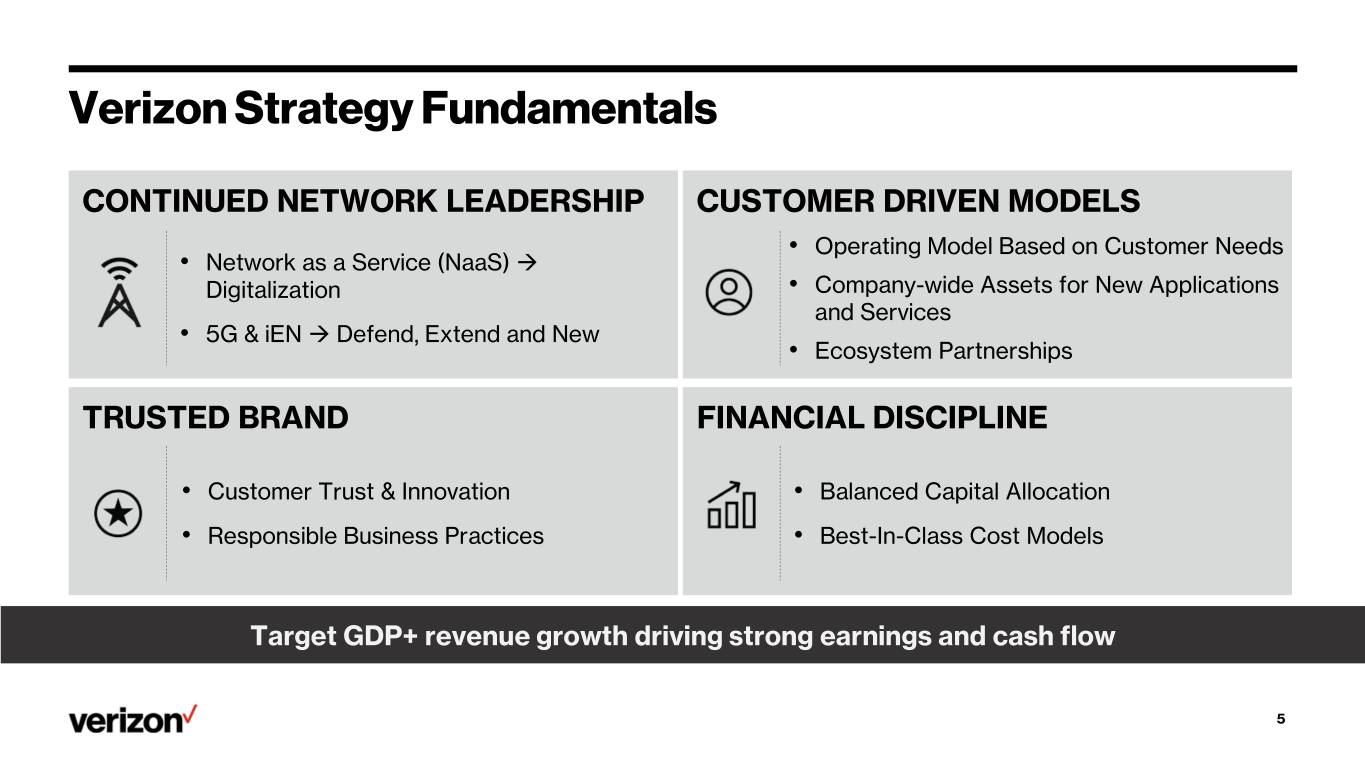
Verizon Strategy Fundamentals CONTINUED NETWORK LEADERSHIP CUSTOMER DRIVEN MODELS • Operating Model Based on Customer Needs • Network as a Service (NaaS) Digitalization • Company-wide Assets for New Applications and Services • 5G & iEN Defend, Extend and New • Ecosystem Partnerships TRUSTED BRAND FINANCIAL DISCIPLINE • Customer Trust & Innovation • Balanced Capital Allocation • Responsible Business Practices • Best-In-Class Cost Models Target GDP+ revenue growth driving strong earnings and cash flow 5
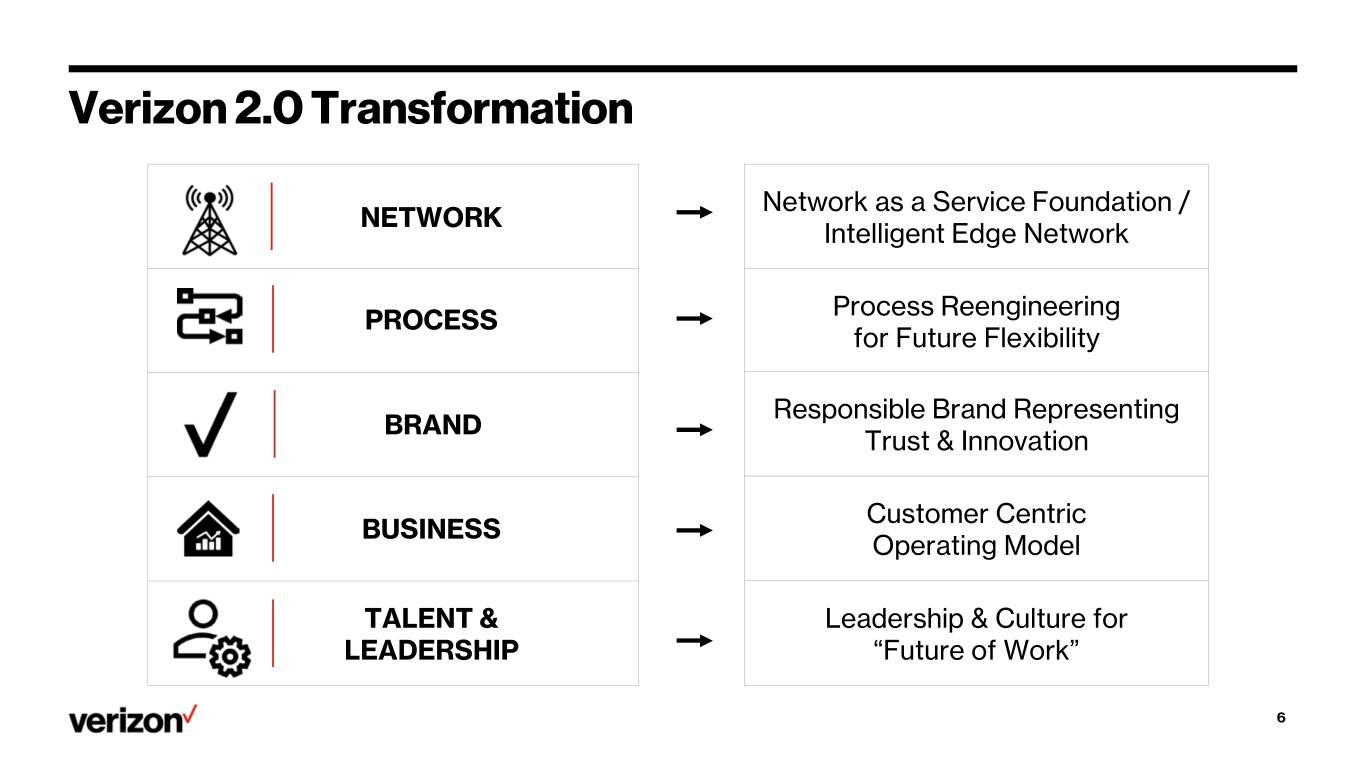
Verizon 2.0 Transformation Network as a Service Foundation / NETWORK Intelligent Edge Network Process Reengineering PROCESS for Future Flexibility Responsible Brand Representing BRAND Trust & Innovation Customer Centric BUSINESS Operating Model TALENT & Leadership & Culture for LEADERSHIP “Future of Work” 6
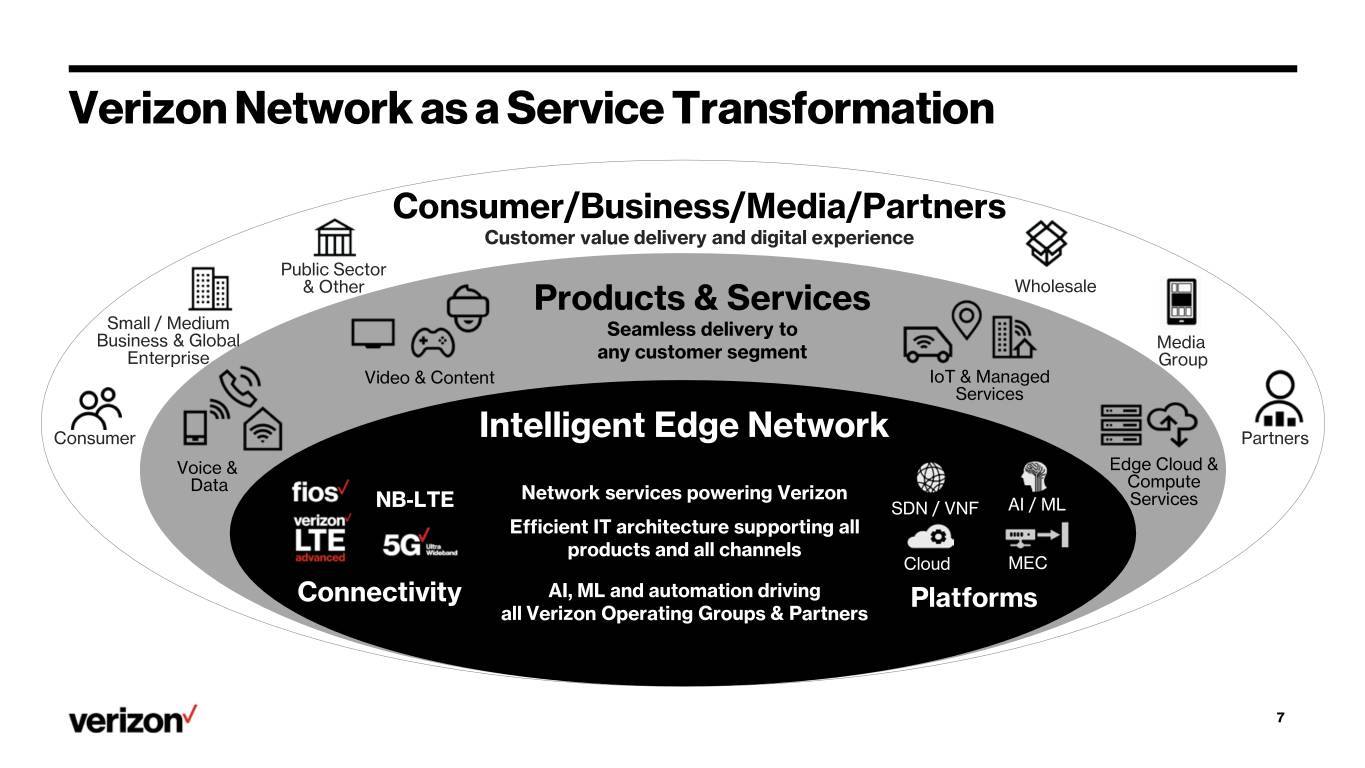
Verizon Network as a Service Transformation Consumer/Business/Media/Partners Customer value delivery and digital experience Public Sector & Other Products & Services Wholesale Small / Medium Seamless delivery to Business & Global Media Enterprise any customer segment Group Video & Content IoT & Managed Services Consumer Intelligent Edge Network Partners Voice & Edge Cloud & Data Compute Network services powering Verizon Services NB-LTE SDN / VNF AI / ML Efficient IT architecture supporting all products and all channels Cloud MEC Connectivity AI, ML and automation driving Platforms all Verizon Operating Groups & Partners 7

Verizon 2.0 Operating Model Effective as of April 1, 2019 Consumer Verizon Consumer Wireless Retail Group Wholesale Products Small & Medium Public Sector Verizon Business Business & Other Group Products Global Wholesale Enterprise Verizon Media Intelligent Edge Network Media Ad Group Products Verticals Platforms 8

Matt Ellis Chief Financial Officer
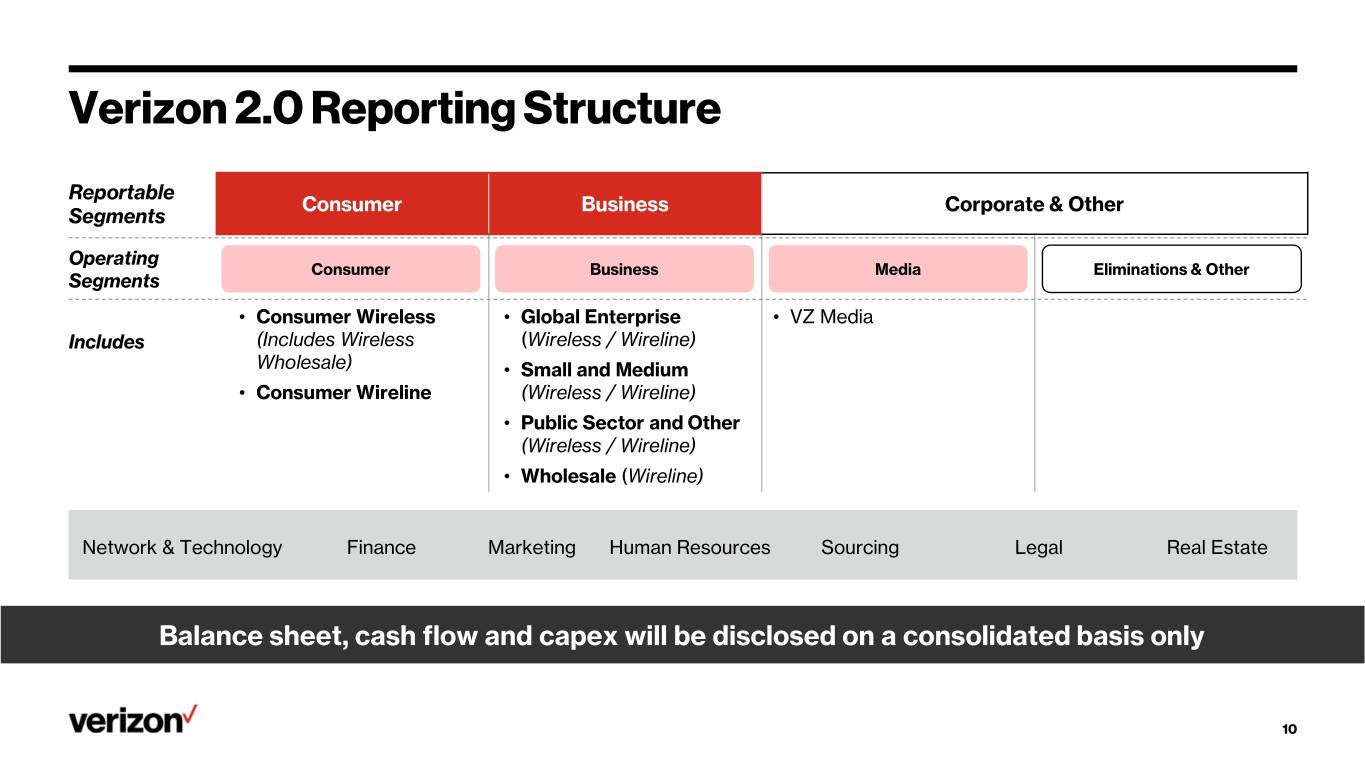
Verizon 2.0 Reporting Structure Reportable Consumer Business Corporate & Other Segments Operating Consumer Business Media Eliminations & Other Segments • Consumer Wireless • Global Enterprise • VZ Media Includes (Includes Wireless (Wireless / Wireline) Wholesale) • Small and Medium • Consumer Wireline (Wireless / Wireline) • Public Sector and Other (Wireless / Wireline) • Wholesale (Wireline) Network & Technology Finance Marketing Human Resources Sourcing Legal Real Estate Balance sheet, cash flow and capex will be disclosed on a consolidated basis only 10
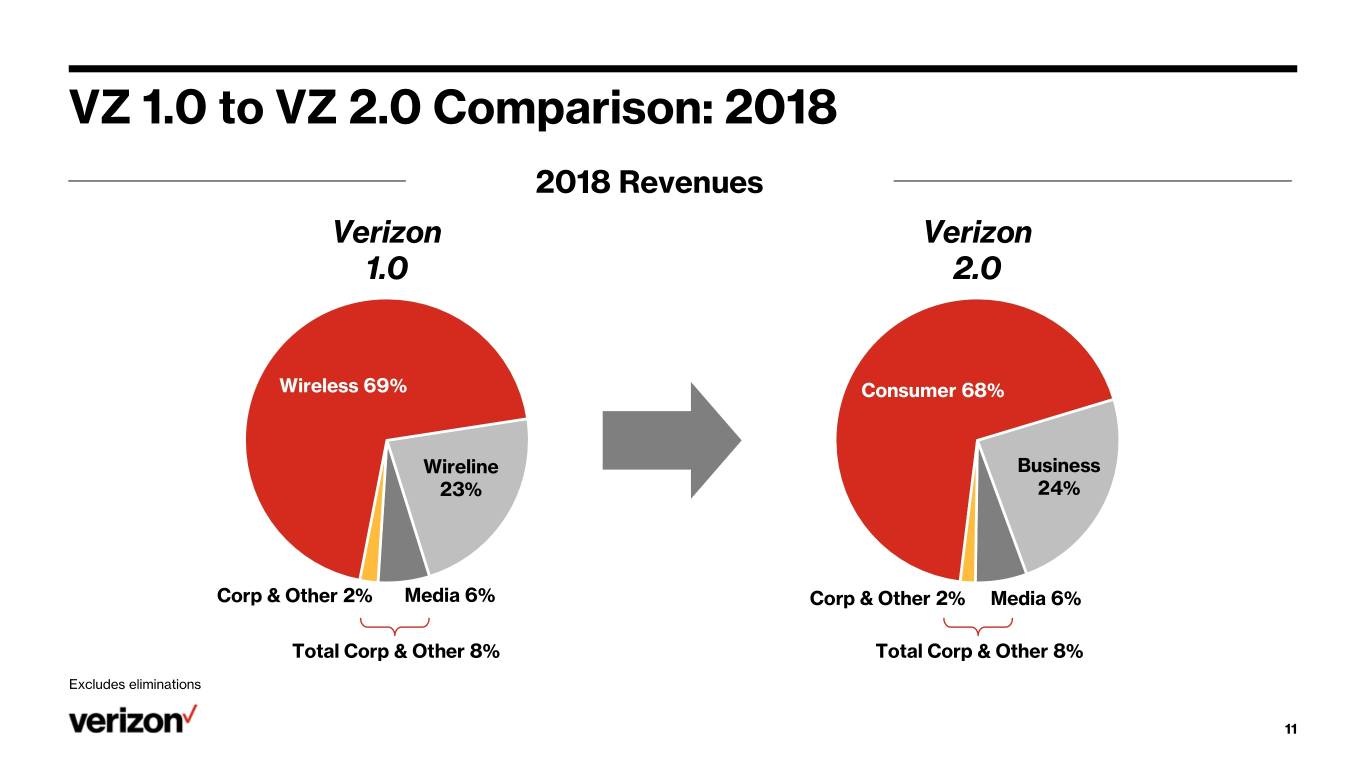
VZ 1.0 to VZ 2.0 Comparison: 2018 2018 Revenues Verizon Verizon 1.0 2.0 Wireless 69% Consumer 68% Wireline Business 23% 24% Corp & Other 2% Media 6% Corp & Other 2% Media 6% Total Corp & Other 8% Total Corp & Other 8% Excludes eliminations 11
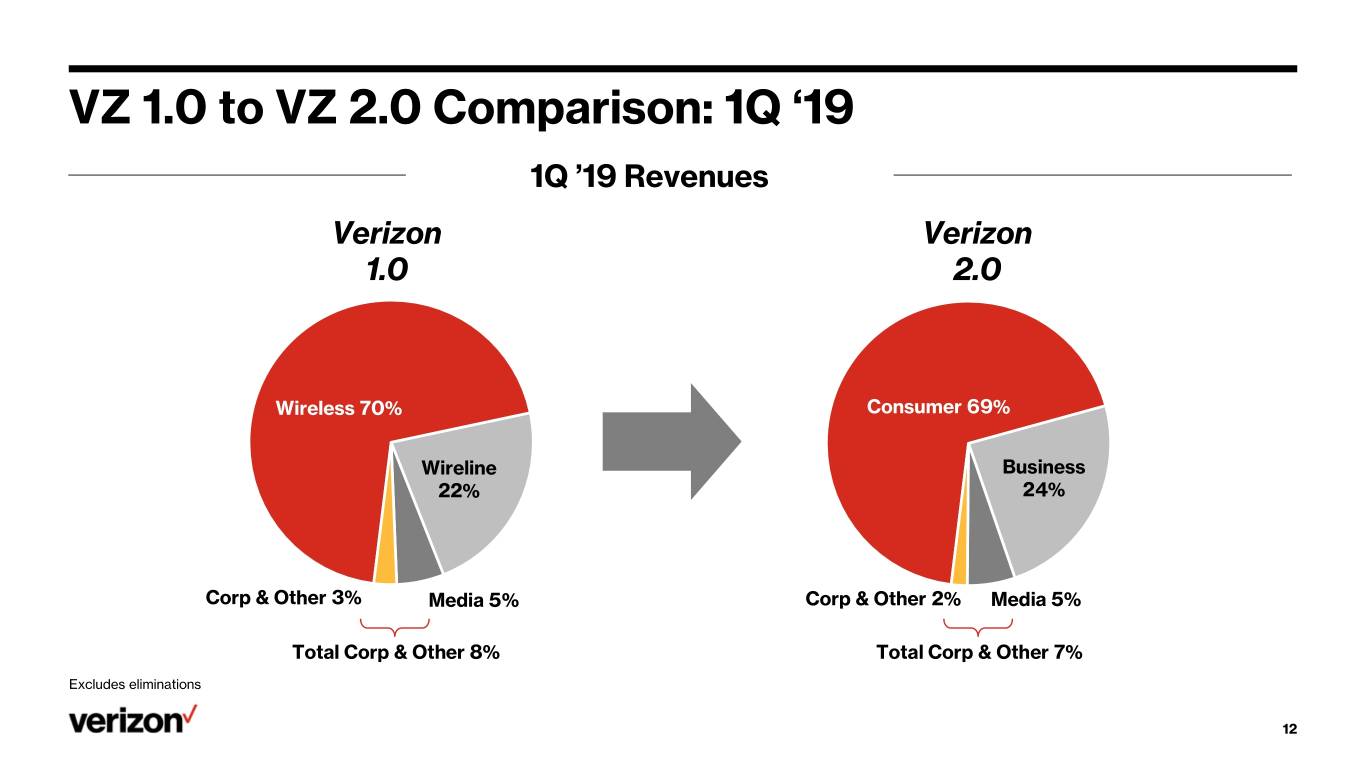
VZ 1.0 to VZ 2.0 Comparison: 1Q ‘19 1Q ’19 Revenues Verizon Verizon 1.0 2.0 Wireless 70% Consumer 69% Wireline Business 22% 24% Corp & Other 3% Media 5% Corp & Other 2% Media 5% Total Corp & Other 8% Total Corp & Other 7% Excludes eliminations 12

VZ 1.0 to VZ 2.0 Reconciliation: 2018 Consumer Revenue ($B) VZ 1.0 VZ 2.0 ($14.6) $91.7 $12.8 ($0.1) $89.8 Total Wireless Consumer Wireline Business Wireless Eliminations Total Consumer EBITDA* $42.6 $40.0 Margin %* 46.4% 44.5% Business Revenue ($B) $0.9 ($12.8) $14.6 ($1.0) $29.8 $31.5 EBITDA 42.6 2.1 (5.9) 1.2 40.0 MarginTotal % Wireline46.4% 16.8%Business40.4% WirelessNM VZ44.6% Connect Consumer Wireline Eliminations Total Business EBITDA* $5.9 $8.4 Margin %* 19.9% 26.7% * Non-GAAP measure 13
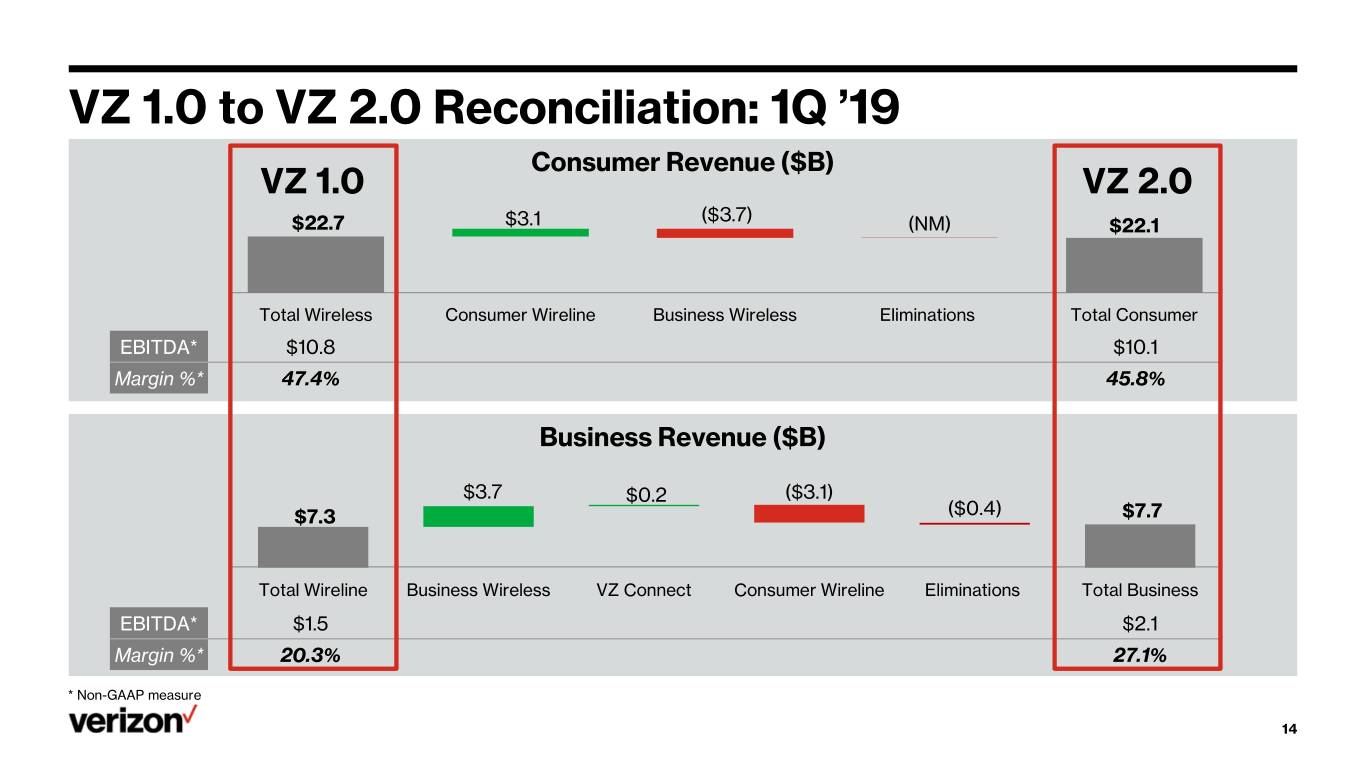
VZ 1.0 to VZ 2.0 Reconciliation: 1Q ’19 Consumer Revenue ($B) VZ 1.0 VZ 2.0 ($3.7) $22.7 $3.1 (NM) $22.1 Total Wireless Consumer Wireline Business Wireless Eliminations Total Consumer EBITDA* $10.8 $10.1 Margin %* 47.4% 45.8% Business Revenue ($B) $3.7 $0.2 ($3.1) $7.3 ($0.4) $7.7 EBITDA 42.6 2.1 (5.9) 1.2 40.0 MarginTotal % Wireline46.4% 16.8%Business40.4% WirelessNM VZ44.6% Connect Consumer Wireline Eliminations Total Business EBITDA* $1.5 $2.1 Margin %* 20.3% 27.1% * Non-GAAP measure 14

Wireless Trends: Consumer vs. Business Confidence in service revenue outlook Consumer Business Financials 2018 1Q ’19 2018 1Q ’19 Total Wireless Revenue ~$77B ~$19B ~$15B ~$4B Service Revenue YoY Growth 1.0%* 3.7% 5.0%* 7.7% Segment Characteristics Service revenue impacted in 2017; SMB follows Consumer trends, distinct from Move to Unlimited return to growth in 2018 Global Enterprise and Public Sector Retail seasonality Impacted by large Volumes / Activity in 4th quarter customer movement Device Payment Migration from 2014-2018 Subsidy model still prevalent (excluding SMB) Minimal wireless service Significant wireless service ASC 606 Accounting Change revenue impact revenue impact Wireless Service Revenue Growth Driven by ARPA Driven by volume * Excluding ASC 606 15

Consumer Trends: Annual Revenue growth in wireless, strong stable margins Total Revenue ($B) Wireless Service Revenue ($B) $89.5 $87.1 $89.8 $55.6 10.0% Wireline $13.0 $13.0 $12.8 $52.0 $52.5 50.0 0.0% Wireless $76.5 $74.1 $77.0 30.0 -10.0% 2016 2017 2018 2016 2017 2018 YoY % Growth (2.7%) 3.1% YoY % Growth (6.6%) 1.0% YoY % Growth 2.8% YoY % Growth 1.0% (Excluding ASC 606) (Excluding ASC 606) Operating Income ($B) EBITDA* ($B) 32.0 31.2% 44.5% 29.6% 29.6% 42.6% 41.7% $40.0 $26.5 $25.8 $28.0 $37.3 $37.1 22.0 23.0% 30.0 35.0% 2016 2017 2018 2016 2017 2018 YoY % Growth (2.9%) 8.7% YoY % Growth (0.7%) 7.8% Operating Income Margin % 29.5% Segment EBITDA Margin %* 42.9% (Excluding ASC 606) (Excluding ASC 606) . Operating Income Margin % . Segment EBITDA Margin %* * Non-GAAP measure 16
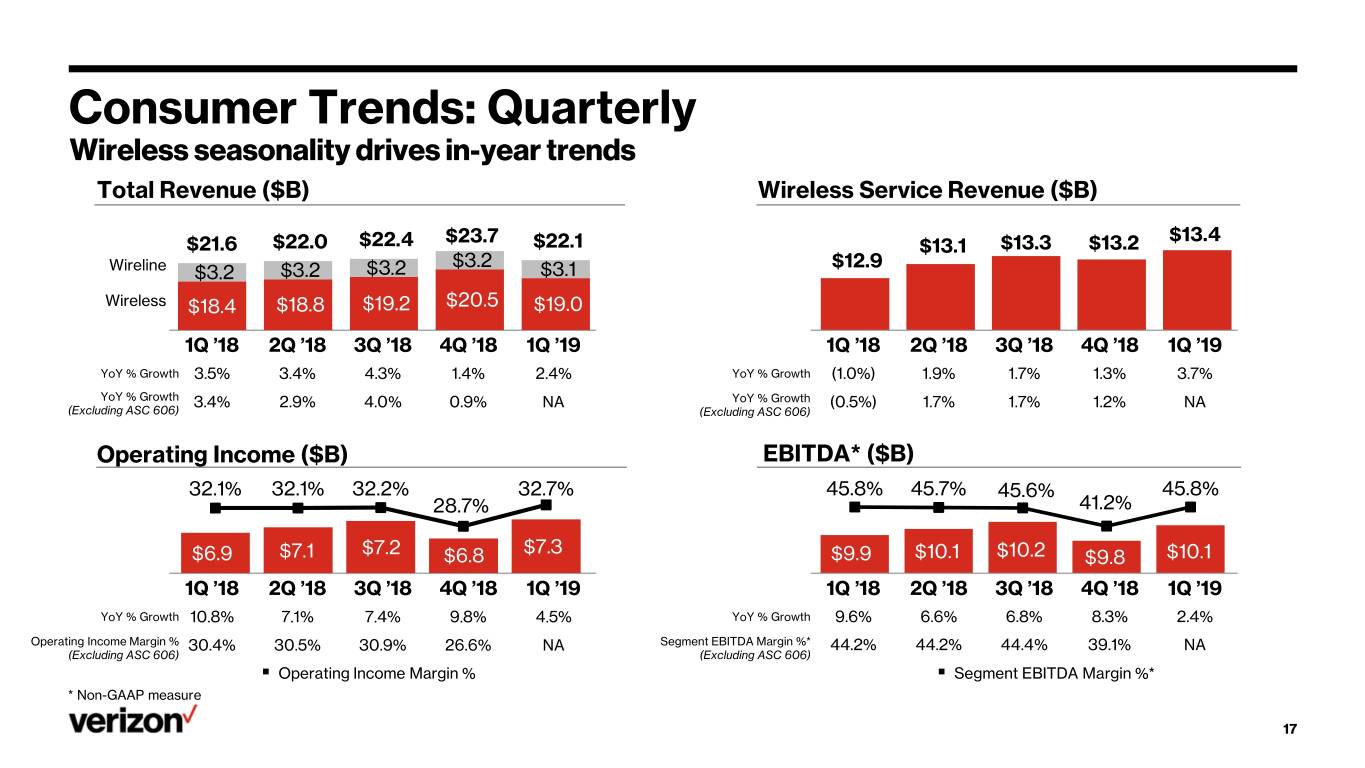
Consumer Trends: Quarterly Wireless seasonality drives in-year trends Total Revenue ($B) Wireless Service Revenue ($B) $23.7 $13.4 $21.6 $22.0 $22.4 $22.1 $13.1 $13.3 $13.2 $3.2 $12.9 Wireline $3.2 $3.2 $3.2 $3.1 Wireless $18.4 $18.8 $19.2 $20.5 $19.0 1Q ’18 2Q ’18 3Q ’18 4Q ’18 1Q ’19 1Q ’18 2Q ’18 3Q ’18 4Q ’18 1Q ’19 YoY % Growth 3.5% 3.4% 4.3% 1.4% 2.4% YoY % Growth (1.0%) 1.9% 1.7% 1.3% 3.7% YoY % Growth 3.4% 2.9% 4.0% 0.9% NA YoY % Growth (0.5%) 1.7% 1.7% 1.2% NA (Excluding ASC 606) (Excluding ASC 606) Operating Income ($B) EBITDA* ($B) 8,000 32.1% 32.1% 32.2% 32.7% 11,000 45.8% 45.7% 45.6% 45.8% 50.0% 28.7% 41.2% $7.2 $7.3 $6.9 $7.1 $6.8 $9.9 $10.1 $10.2 $9.8 $10.1 6,000 20.0% 9,000 30.0% 1Q ’18 2Q ’18 3Q ’18 4Q ’18 1Q ’19 1Q ’18 2Q ’18 3Q ’18 4Q ’18 1Q ’19 YoY % Growth 10.8% 7.1% 7.4% 9.8% 4.5% YoY % Growth 9.6% 6.6% 6.8% 8.3% 2.4% Operating Income Margin % 30.4% 30.5% 30.9% 26.6% NA Segment EBITDA Margin %* 44.2% 44.2% 44.4% 39.1% NA (Excluding ASC 606) (Excluding ASC 606) . Operating Income Margin % . Segment EBITDA Margin %* * Non-GAAP measure 17

Consumer Trends: Key Wireless Metrics Retail Postpaid Gross Adds (K) Retail Postpaid Activations (K) 3,643 6.6% 7.00% 14 ,000 2,850 5.0% 5.1% 5.1% 6.00% 2,634 2,617 2,714 12,000 4.4% 5.00% 10,000 9,492 4.00% 8,000 7,093 7,127 7,402 6,652 3.00% 6,000 2.00% 4,000 1.00% 2,000 0 0.00% 1Q ’18 2Q ’18 3Q ’18 4Q ’18 1Q ’19 1Q ’18 2Q ’18 3Q ’18 4Q ’18 1Q ’19 . Postpaid Upgrade Rate % Retail Postpaid Net Adds (K) Retail Postpaid Phone Net Adds (K) 1.00% 1,9 00 0.90% 1.4 0% 2,000 0.81% 1,4 00 0.77% 0.77% 0.77% 1.20% 1.03% 0.80% 1,500 1.01% 1.01% 1.08% 0.93% 0.71% 1.00% 900 1,000 886 0.70% 0.80% 522 500 400 0.60% 147 151 0.60% 17 112 0 (100) 0.40% 0.50% (55) (500) (153) (201) 0.20% (163) (600) 0.40% (1,000) 1Q ’18 2Q ’18 3Q ’18 4Q ’18 1Q ’19 0.00% 1Q ’18 2Q ’18 3Q ’18 4Q ’18 1Q ’19 . Postpaid Churn % . Postpaid Phone Churn % 18
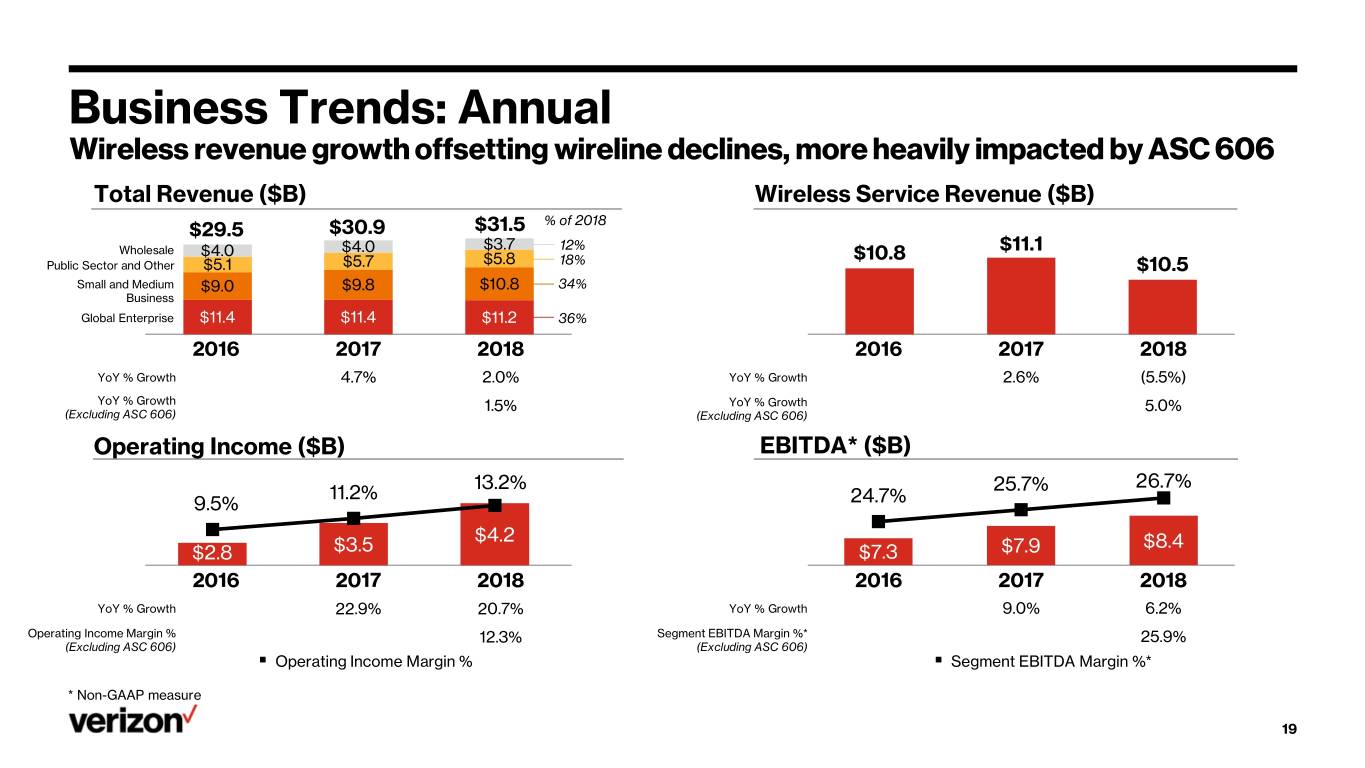
Business Trends: Annual Wireless revenue growth offsetting wireline declines, more heavily impacted by ASC 606 Total Revenue ($B) Wireless Service Revenue ($B) % of 2018 $29.5 $30.9 $31.5 Wholesale $4.0 $4.0 $3.7 12% $11.1 $5.8 18% $10.8 Public Sector and Other $5.1 $5.7 $10.5 Small and Medium $9.0 $9.8 $10.8 34% Business Global Enterprise $11.4 $11.4 $11.2 36% 2016 2017 2018 2016 2017 2018 YoY % Growth 4.7% 2.0% YoY % Growth 2.6% (5.5%) YoY % Growth 1.5% YoY % Growth 5.0% (Excluding ASC 606) (Excluding ASC 606) Operating Income ($B) EBITDA* ($B) 13.2% 26.7% 11.2% 25.7% 9.5% 24.7% $4.2 $8.4 $2.8 $3.5 $7.3 $7.9 2.0 4.0% 6.0 21.0% 2016 2017 2018 2016 2017 2018 YoY % Growth 22.9% 20.7% YoY % Growth 9.0% 6.2% Operating Income Margin % 12.3% Segment EBITDA Margin %* 25.9% (Excluding ASC 606) (Excluding ASC 606) . Operating Income Margin % . Segment EBITDA Margin %* * Non-GAAP measure 19

Business Trends: Quarterly Strong growth in wireless service revenue Total Revenue ($B) Wireless Service Revenue ($B) $7.8 $7.9 $7.9 $8.0 $7.7 Wholesale $1.0 $1.0 $0.9 $0.9 $0.8 $1.5 $2.6 $2.7 $2.7 $2.7 Public Sector and Other $1.4 $1.4 $1.5 $1.5 $2.5 Small and Medium $2.5 $2.6 $2.7 $2.8 $2.7 Business Global Enterprise $2.8 $2.8 $2.8 $2.8 $2.7 1Q ’18 2Q ’18 3Q ’18 4Q ’18 1Q ’19 1Q ’18 2Q ’18 3Q ’18 4Q ’18 1Q ’19 YoY % Growth 2.7% 2.3% 2.5% 0.6% (0.8%) YoY % Growth (9.2%) (3.8%) (3.7%) (5.4%) 7.7% YoY % Growth 2.1% 1.5% 2.2% 0.1% NA YoY % Growth 2.2% 6.4% 6.6% 5.1% NA (Excluding ASC 606) (Excluding ASC 606) Operating Income ($B) EBITDA* ($B) 3,000 2,000 14.3% 14.0% 14.6% 13.6% 20.0% 27.9% 27.5% 28.2% 27.1% 35.0% 2,500 30.0% 1,500 10.0% 15.0% 23.3% 25.0% 2,000 1,000 10.0% 20.0% 500 5.0% 1,500 $2.2 $2.2 $2.2 $2.1 $1.1 $1.1 $1.2 $0.8 $1.0 $1.9 15.0% - 0.0% 1,000 10.0% 1Q ’18 2Q ’18 3Q ’18 4Q ’18 1Q ’19 1Q ’18 2Q ’18 3Q ’18 4Q ’18 1Q ’19 YoY % Growth 23.0% 38.5% 34.5% (10.7%) (5.9%) YoY % Growth 8.2% 12.4% 11.9% (7.5%) (3.8%) Operating Income Margin % 13.5% 12.8% 14.0% 9.2% NA Segment EBITDA Margin %* 27.1% 26.4% 27.6% 22.6% NA (Excluding ASC 606) (Excluding ASC 606) . Operating Income Margin % . Segment EBITDA Margin %* Note: Amounts may not add due to rounding. * Non-GAAP measure 20
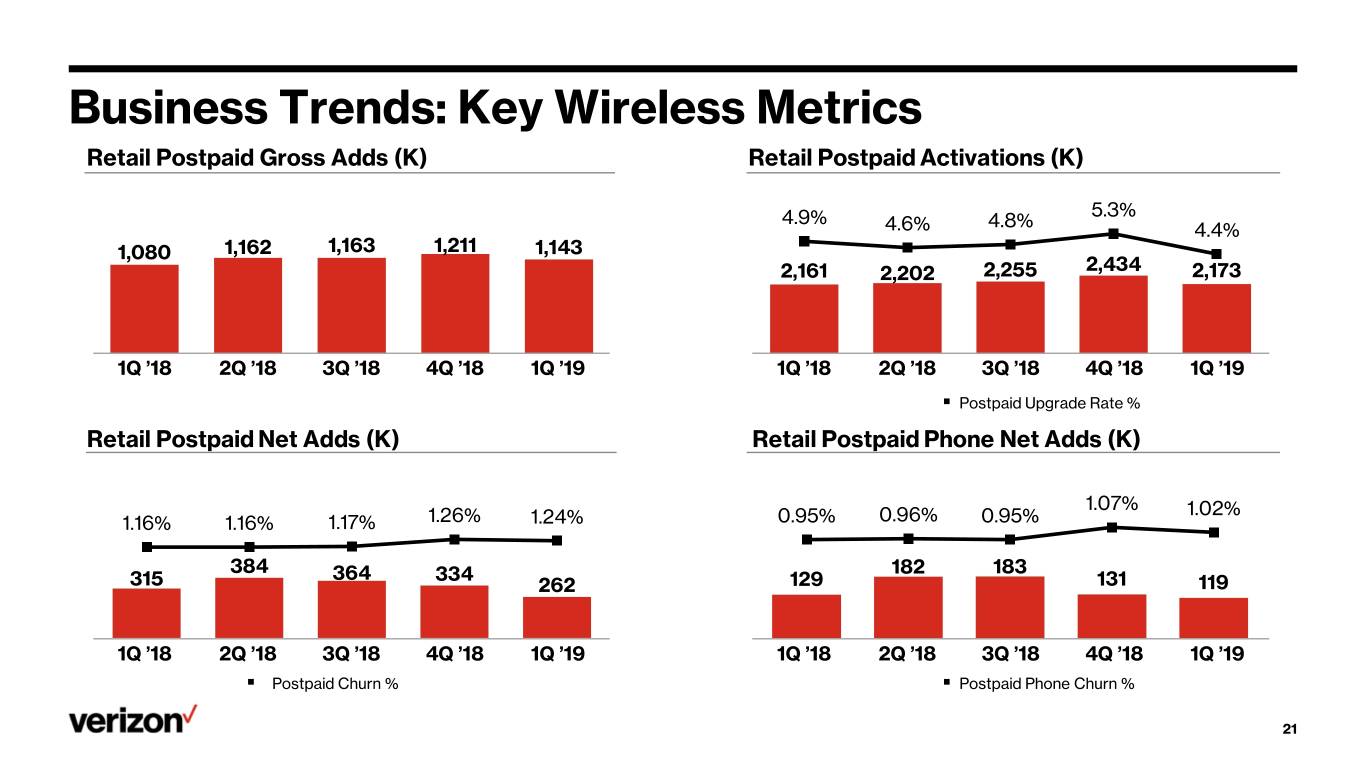
Business Trends: Key Wireless Metrics Retail Postpaid Gross Adds (K) Retail Postpaid Activations (K) 5,000 7.00% 4,9 00 4,8 00 4,700 4,6 00 4,500 4,4 00 4,3 00 5.3% 6.00% 4,200 4,1 00 4,000 4.9% 3,9 00 4.8% 3,8 00 4.6% 3,700 3,6 00 4.4% 5.00% 3,500 3,4 00 3,300 3,200 1,162 1,163 1,211 1,143 3,1 00 3,000 1,080 2,900 4.00% 2,800 2,700 2,600 2,500 2,434 2,400 2,255 2,300 2,161 2,202 2,173 2,200 3.00% 2,100 2,000 1,9 00 1,8 00 1,700 1,6 00 1,500 1,4 00 2.00% 1,3 00 1,200 1,1 00 1,000 900 800 700 1.00% 600 500 400 300 200 100 0 0.00% 1Q ’18 2Q ’18 3Q ’18 4Q ’18 1Q ’19 1Q ’18 2Q ’18 3Q ’18 4Q ’18 1Q ’19 . Postpaid Upgrade Rate % Retail Postpaid Net Adds (K) Retail Postpaid Phone Net Adds (K) 2.00% 1.4 0% 1.07% 1.02% 1.20% 1.16% 1.16% 1.17% 1.26% 1.24% 1.50% 0.95% 0.96% 0.95% 1.00% 0.80% 384 1.00% 364 334 182 183 0.60% 315 262 129 131 119 0.40% 0.50% 0.20% 0.00% 0.00% 1Q ’18 2Q ’18 3Q ’18 4Q ’18 1Q ’19 1Q ’18 2Q ’18 3Q ’18 4Q ’18 1Q ’19 . Postpaid Churn % . Postpaid Phone Churn % 21
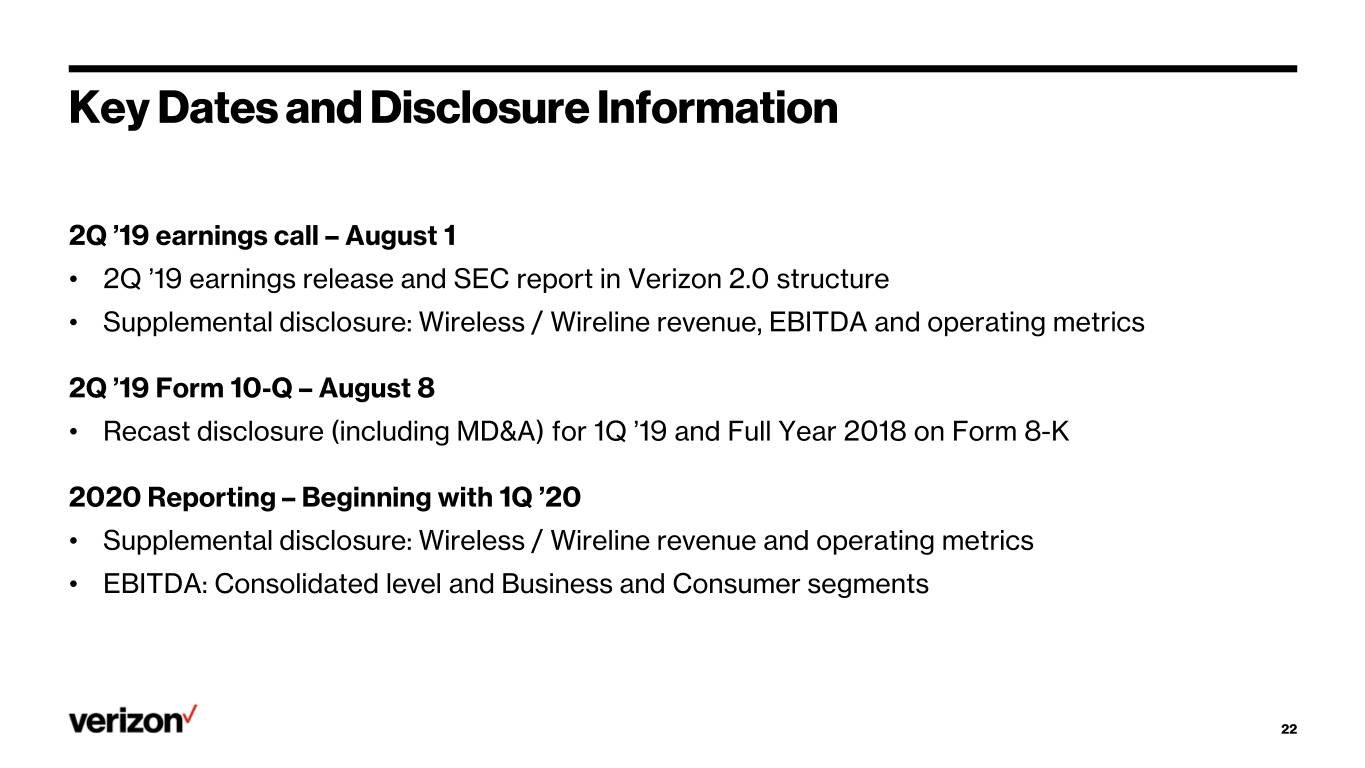
Key Dates and Disclosure Information 2Q ’19 earnings call – August 1 • 2Q ’19 earnings release and SEC report in Verizon 2.0 structure • Supplemental disclosure: Wireless / Wireline revenue, EBITDA and operating metrics 2Q ’19 Form 10-Q – August 8 • Recast disclosure (including MD&A) for 1Q ’19 and Full Year 2018 on Form 8-K 2020 Reporting – Beginning with 1Q ’20 • Supplemental disclosure: Wireless / Wireline revenue and operating metrics • EBITDA: Consolidated level and Business and Consumer segments 22
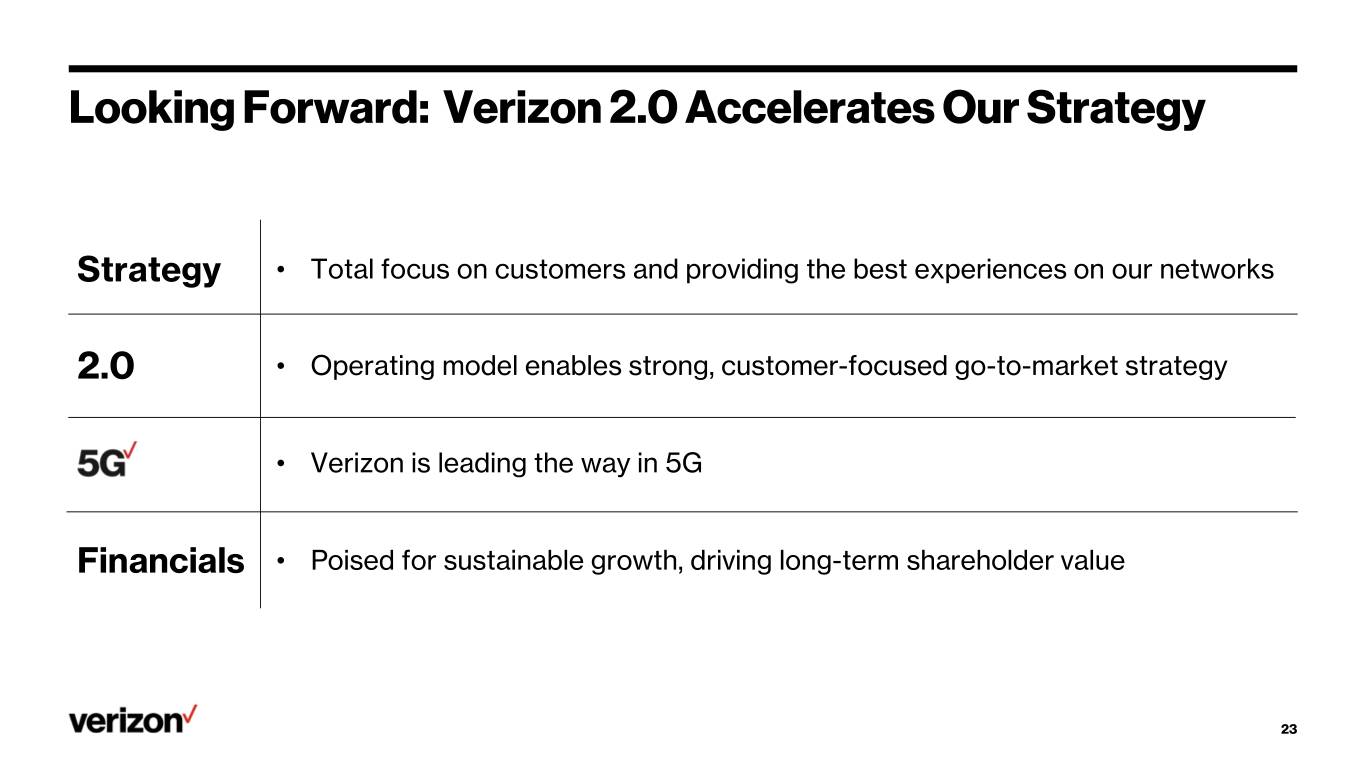
Looking Forward: Verizon 2.0 Accelerates Our Strategy Strategy • Total focus on customers and providing the best experiences on our networks 2.0 • Operating model enables strong, customer-focused go-to-market strategy • Verizon is leading the way in 5G Financials • Poised for sustainable growth, driving long-term shareholder value 23

Q&A


VZ 2.0 Reporting VZ 2.0 Supplemental Revenue Consumer Business Wireless Wireline Wireless Service Wireless Equipment Wireless Other Total Revenue Operating Metrics Wireless Postpaid Net Adds Wireless Postpaid Phone Net Adds Wireless Postpaid Churn Wireless Postpaid Phone Churn Fios Video Net Adds Fios Internet Net Adds