This supplemental information regarding the financial and operating results of Verizon Communications Inc. (Verizon) for the third quarter ended September 30, 2023 contains statements about expected future events and financial results that are forward-looking and subject to risks and uncertainties. Discussion of factors that may affect future results is included at the end of this document and is also contained in Verizon's filings with the US Securities and Exchange Commission.
Consolidated Financial Results
* Non-GAAP financial measure.
** Total Wireless service revenue represents the sum of Consumer and Business segments.
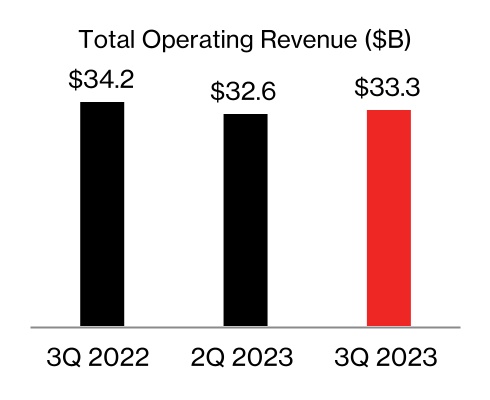
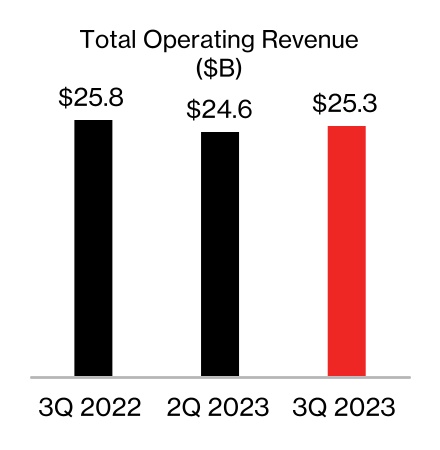
Consolidated total operating revenue for the third quarter was $33.3 billion, down 2.6% year over year.
•Service and other revenue was $27.5 billion, down 0.5% year over year, as the growth of Wireless service revenue was offset by wireline declines and lower Other revenue due to the reallocation of certain fees.
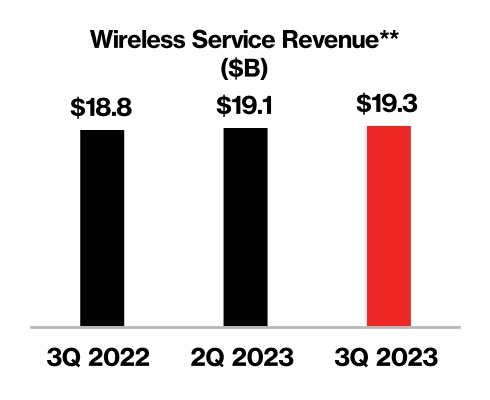
◦Total Wireless service revenue2 was $19.3 billion, up 2.9% year over year, driven primarily by pricing actions implemented in recent quarters, the larger allocation of our administrative and telco recovery fees from Other revenue into Wireless service revenue, and growth from our fixed wireless access (FWA) offerings.
◦Total Fios revenue was $3.2 billion, relatively flat year over year.
Page 2
VlpHU09DSUQyMDE5UTE=
•Wireless equipment revenue was $5.8 billion, down 11.6% year over year, predominantly due to lower upgrade rates.
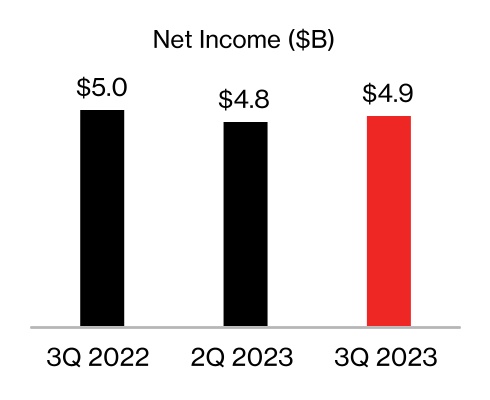
Consolidated net income for the third quarter was $4.9 billion, down 2.8% year over year.
Consolidated adjusted EBITDA1 for the third quarter was $12.2 billion, up 0.2% year over year, driven by Wireless service revenue growth and lower upgrade rates.
Consolidated operating expenses for the third quarter were $25.9 billion, down 1.8% year over year. Consolidated operating expenses, excluding depreciation and amortization and special items,1 were $21.1 billion, down 4.2% year over year.
Interest expense for the third quarter was $1.4 billion compared to $1.3 billion for the second quarter 2023 due to lower capitalized interest and higher interest rates on our outstanding debt balance.
Earnings per share (EPS) was $1.13, down 3.4% year over year.
•Third quarter 2023 earnings reflected a pre-tax loss from special items of approximately $579 million. This includes the impacts of amortization of intangible assets related to Tracfone and other acquisitions of $224 million, a pre-tax non-strategic business shutdown charge of $179 million related to the shutdown of our BlueJeans business offering, and pre-tax business transformation costs of $176 million primarily related to costs incurred in connection with strategic partnership initiatives in our managed network support services for certain Business customers.
Adjusted EPS1 was $1.22, down 7.6% year over year.
Page 3
VlpHU09DSUQyMDE5UTE=
Cash Flow Summary
* Non-GAAP financial measure.
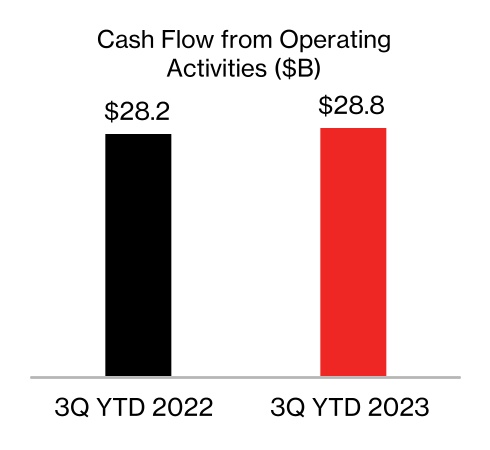
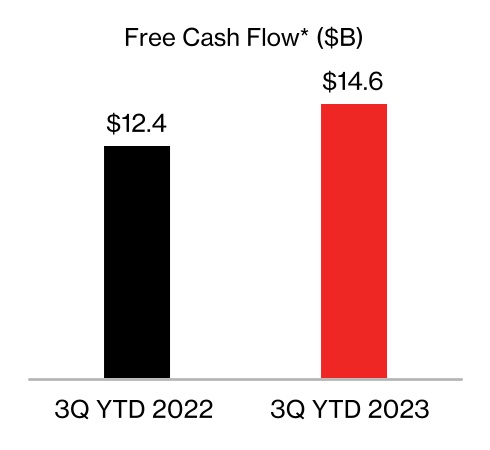
Cash flow from operating activities for the nine months ended September 30, 2023 was $28.8 billion compared to $28.2 billion in the prior year period driven by working capital improvements as a result of lower receivables and lower inventory levels tied to fewer upgrades, which were offset by higher interest payments.
•Capital spending for the nine months ended September 30, 2023 was $14.2 billion.
•We now expect 2023 capital spending to be at the higher end of the previously guided range of $18.25 billion to $19.25 billion.
Free cash flow1 for the nine months ended September 30, 2023 was $14.6 billion.
Total unsecured debt as of the end of the third quarter was $126.4 billion, a $4.9 billion improvement compared to the prior quarter and $5.0 billion lower year over year. Unsecured debt to net income (LTM) ratio was 5.9x as of the end of the third quarter, a decrease of 0.2x compared to the prior quarter and a 0.7x improvement year over year.
Net unsecured debt1 as of the end of the third quarter was $122.2 billion, a $4.3 billion improvement compared to the prior quarter and $7.1 billion lower year over year. Net unsecured debt to adjusted EBITDA ratio1 was 2.6x as of the end of the third quarter, flat compared to the prior quarter and a 0.1x improvement year over year.
Page 4
VlpHU09DSUQyMDE5UTE=
Mobility Highlights
Note: Where applicable, the operating results reflect certain adjustments
Consolidated
Total retail postpaid net additions for the third quarter were 581 thousand, up from 388 thousand in the prior year period, driven by continued FWA momentum, wearables adoption, and strong Business and improved Consumer postpaid phone performance.
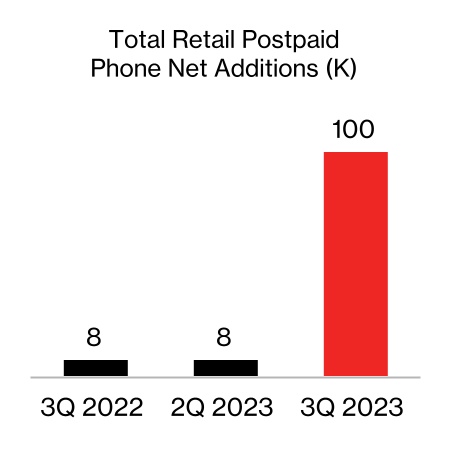
Total postpaid phone net additions for the third quarter were 100 thousand, up from 8 thousand in the prior year period.
•Postpaid phone gross additions were 2.6 million, up 0.8% year over year.
•Postpaid phone churn was 0.90%, down 2 basis points year over year.
Consumer Group
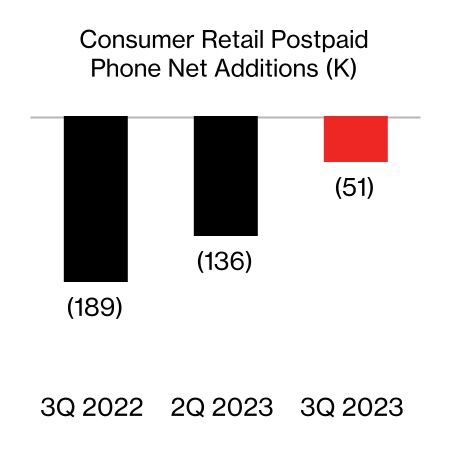
Postpaid net additions for the third quarter were 251 thousand, up from 28 thousand in the prior year period, as growth in FWA and wearables was partially offset by phone and tablet losses.
•Postpaid phone net losses were 51 thousand compared to 189 thousand net losses in the prior year period.
◦Postpaid phone gross additions were 1.8 million, up 2.3% year over year, continuing the momentum that began building in the second half of last year.
◦Postpaid phone churn was 0.85%, down 3 basis points year over year.
•Prepaid net losses were 207 thousand compared to 39 thousand net additions in the prior year period.
◦Prepaid churn was 4.39%, up 49 basis points year over year.
Business Group
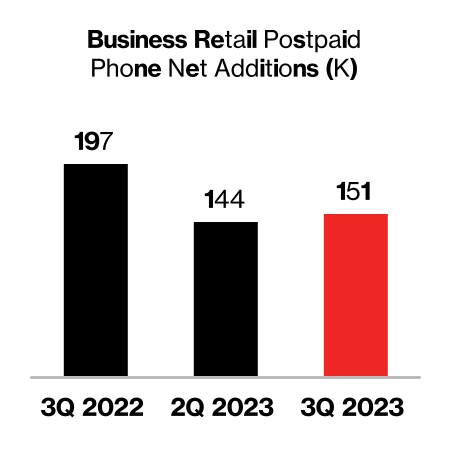
Postpaid phone net additions for the third quarter were 151 thousand, down from 197 thousand in the prior year period.
•Postpaid phone churn was 1.14%, up 4 basis points year over year.
Broadband Highlights
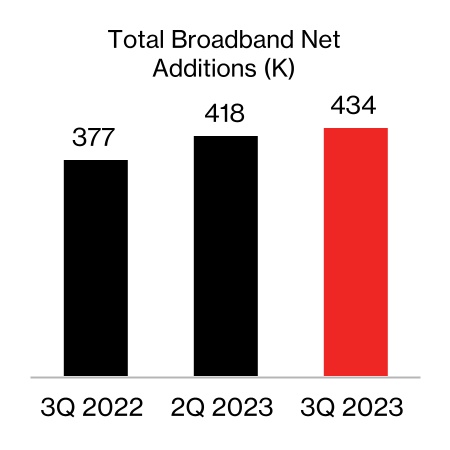
Total broadband net additions were 434 thousand for the third quarter, up from 377 thousand in the prior year period, driven by strong demand and good retention rates for both Fios and FWA products.
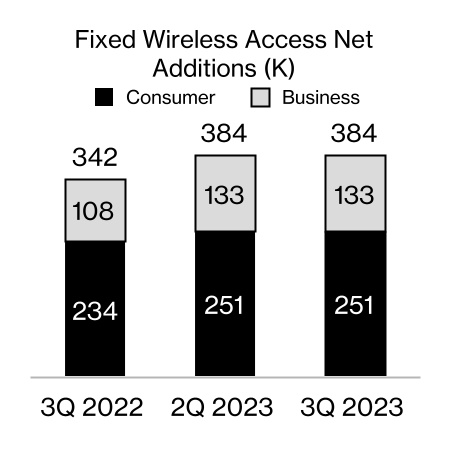
•FWA net additions were 384 thousand, up from 342 thousand in the prior year period.
◦Consumer FWA net additions were 251 thousand, up 17 thousand year over year.
◦Business FWA net additions were 133 thousand, up 25 thousand year over year.
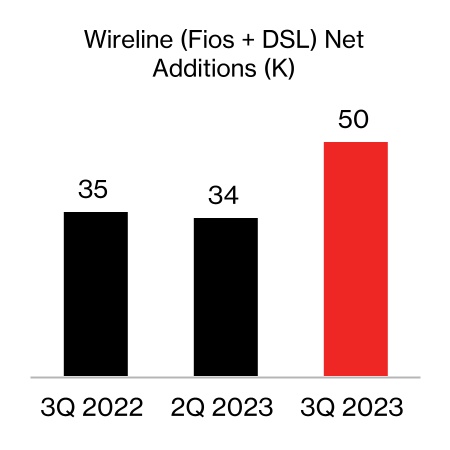
•Fios internet net additions were 72 thousand, up from 61 thousand in the prior year period.
Consumer Financial Results
Page 6
VlpHU09DSUQyMDE5UTE=
Total Consumer revenue for the third quarter was $25.3 billion, down 2.3% year over year, as gains in Service and other revenue were offset by Wireless equipment revenue declines.
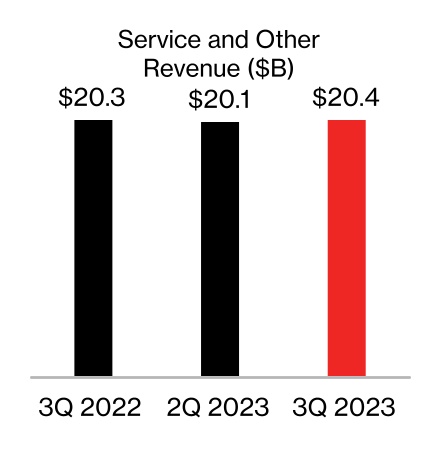
•Consumer Service and other revenue was $20.4 billion, up 0.4% year over year.
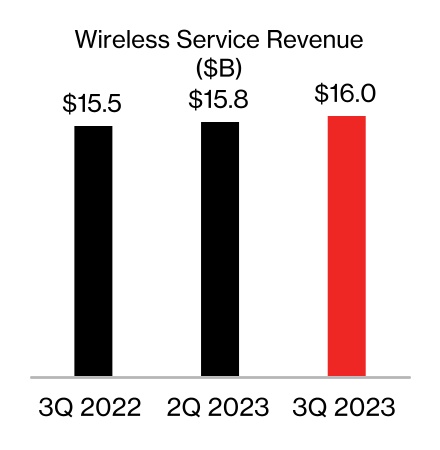
•Consumer Wireless service revenue was $16.0 billion, up 2.9% year over year, driven by Consumer wireless postpaid average revenue per account (ARPA) growth, which was partially offset by decline in retail postpaid phone connections and prepaid connections.
•Consumer Fios revenue was $2.9 billion, down 0.2% year over year.
•Consumer Wireless equipment revenue was $4.9 billion, down 11.8% year over year, driven primarily by a 29.6% year over year decline in upgrades.
Consumer wireless postpaid ARPA was $133.47 for the third quarter, up 4.5% year over year, driven by pricing actions implemented in recent quarters, more customers selecting premium Unlimited plans, the larger allocation of our administrative and telco recovery fees from Other revenue into Wireless service revenue, and an increase in our FWA subscriber base and device protection revenue, partially offset by the amortization impact on service revenue from promotional costs.
Consumer operating income was $7.5 billion, up 2.7% year over year, resulting in operating income margin of 29.9%.
Consumer segment EBITDA1 was $10.8 billion, up 2.2% year over year. This improvement can be attributed to service revenue growth and lower upgrade volumes. Consumer segment EBITDA margin1 for the third quarter was 42.8%.
Page 7
VlpHU09DSUQyMDE5UTE=
Business Financial Results
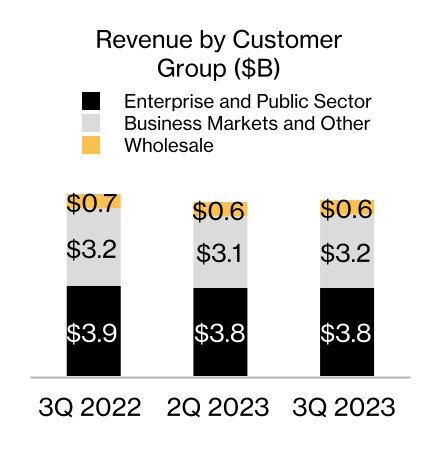
Note: Revenue by customer group may not add due to rounding.
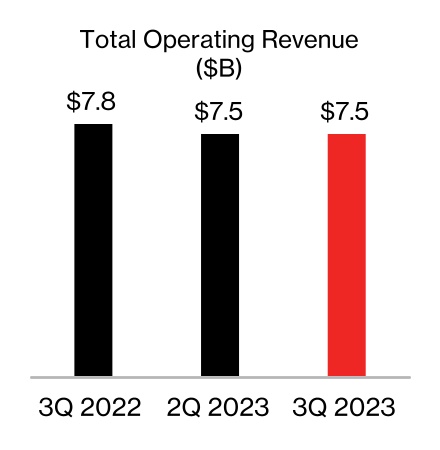
Total Business revenue was $7.5 billion, down 4.0% year over year, driven by lower Wireline revenue and lower Wireless equipment revenue, partially offset by higher Wireless service revenue.
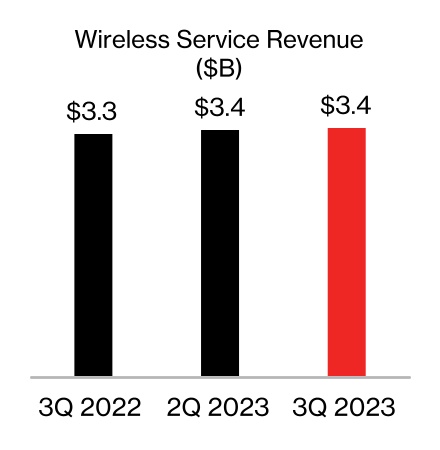
•Business Wireless service revenue was $3.4 billion, up 2.9% year over year, driven by continued strong net additions and pricing actions implemented in recent quarters.
•Business wireline results reflect continued secular declines in the prevailing wireline market and our rationalization of certain legacy wireline products, consistent with prior periods.
Business operating income was $539 million, down 22.8% year over year, resulting in operating income margin of 7.2%.
Business segment EBITDA1 was $1.7 billion, down 6.2% year over year, driven by continued declines in high margin Wireline revenues. Business segment EBITDA margin1 for the third quarter was 22.1%.
Notes
1 Non-GAAP financial measure. See the accompanying schedules and www.verizon.com/about/investors for reconciliations of non-GAAP financial measures cited in this document to most directly comparable financial measures under generally accepted accounting principles (GAAP).
2 Total Wireless service revenue represents the sum of Consumer and Business segments.
Forward-looking statements
In this communication we have made forward-looking statements. These statements are based on our estimates and assumptions and are subject to risks and uncertainties. Forward-looking statements include the information concerning our possible or assumed future results of operations. Forward-looking statements also include those preceded or
Page 8
VlpHU09DSUQyMDE5UTE=
followed by the words “anticipates,” “believes,” “estimates,” “expects,” “forecasts,” “hopes,” “plans” or similar expressions. For those statements, we claim the protection of the safe harbor for forward-looking statements contained in the Private Securities Litigation Reform Act of 1995. We undertake no obligation to revise or publicly release the results of any revision to these forward-looking statements, except as required by law. Given these risks and uncertainties, readers are cautioned not to place undue reliance on such forward-looking statements. The following important factors, along with those discussed in our filings with the Securities and Exchange Commission (the “SEC”), could affect future results and could cause those results to differ materially from those expressed in the forward-looking statements: the effects of competition in the markets in which we operate, including any inability to successfully respond to competitive factors such as prices, promotional incentives and evolving consumer preferences; failure to take advantage of, or respond to competitors' use of, developments in technology and address changes in consumer demand; performance issues or delays in the deployment of our 5G network resulting in significant costs or a reduction in the anticipated benefits of the enhancement to our networks; the inability to implement our business strategy; adverse conditions in the U.S. and international economies, including inflation in the markets in which we operate; cyber attacks impacting our networks or systems and any resulting financial or reputational impact; damage to our infrastructure or disruption of our operations from natural disasters, extreme weather conditions, acts of war, terrorist attacks or other hostile acts and any resulting financial or reputational impact; the impact of public health crises on our operations, our employees and the ways in which our customers use our networks and other products and services; disruption of our key suppliers’ or vendors' provisioning of products or services, including as a result of geopolitical factors, public health crises or the potential impacts of global climate change; material adverse changes in labor matters and any resulting financial or operational impact; changes in the regulatory environment in which we operate, including any increase in restrictions on our ability to operate our networks or businesses; allegations regarding the release of hazardous materials or pollutants into the environment from our, or our predecessors’, network assets and any related government investigations, regulatory developments, litigation, penalties and other liability, remediation and compliance costs, operational impacts or reputational damage; our high level of indebtedness; significant litigation and any resulting material expenses incurred in defending against lawsuits or paying awards or settlements; an adverse change in the ratings afforded our debt securities by nationally accredited ratings organizations or adverse conditions in the credit markets affecting the cost, including interest rates, and/or availability of further financing; significant increases in benefit plan costs or lower investment returns on plan assets; changes in tax laws or treaties, or in their interpretation; and changes in accounting assumptions that regulatory agencies, including the SEC, may require or that result from changes in the accounting rules or their application, which could result in an impact on earnings.
Page 9
VlpHU09DSUQyMDE5UTE=
Page 10
VlpHU09DSUQyMDE5UTE=
Verizon Communications Inc.
Non-GAAP Reconciliations - Consolidated Verizon
Consolidated EBITDA and Consolidated Adjusted EBITDA
| | | | | | | | | | | | | | | | | | | | | | | | | | | | | | | | | | | | | | | | | | | | | | | | | | | | | | | | |
| (dollars in millions) | | |
| Unaudited | | | | 3 Mos. Ended 9/30/23 | | 3 Mos. Ended 6/30/23 | | 3 Mos. Ended 3/31/23 | | 3 Mos. Ended 12/31/22 | | 3 Mos. Ended 9/30/22 | | 3 Mos. Ended 6/30/22 | | 3 Mos. Ended 3/31/22 | | 3 Mos. Ended 12/31/21 | | | | |
| | | | | | | | | | | | | | | | | | | | | | |
| Consolidated Net Income | | | | $ | 4,884 | | | $ | 4,766 | | | $ | 5,018 | | | $ | 6,698 | | | $ | 5,024 | | | $ | 5,315 | | | $ | 4,711 | | | $ | 4,737 | | | | | |
| Add: | | | | | | | | | | | | | | | | | | | | | | |
| Provision for income taxes | | | | 1,308 | | | 1,346 | | | 1,482 | | | 2,113 | | | 1,496 | | | 1,542 | | | 1,372 | | | 1,407 | | | | | |
| Interest expense | | | | 1,433 | | | 1,285 | | | 1,207 | | | 1,105 | | | 937 | | | 785 | | | 786 | | | 739 | | | | | |
Depreciation and amortization expense (1) | | | | 4,431 | | | 4,359 | | | 4,318 | | | 4,218 | | | 4,324 | | | 4,321 | | | 4,236 | | | 4,051 | | | | | |
| Consolidated EBITDA | | | | $ | 12,056 | | | $ | 11,756 | | | $ | 12,025 | | | $ | 14,134 | | | $ | 11,781 | | | $ | 11,963 | | | $ | 11,105 | | | $ | 10,934 | | | | | |
| | | | | | | | | | | | | | | | | | | | | | |
| Add/(subtract): | | | | | | | | | | | | | | | | | | | | | | |
Other (income) expense, net (2) | | | | $ | (170) | | | $ | (210) | | | $ | (114) | | | $ | (2,687) | | | $ | 439 | | | $ | (49) | | | $ | 924 | | | $ | 860 | | | | | |
Equity in losses (earnings) of unconsolidated businesses (3) | | | | 18 | | | 33 | | | (9) | | | (4) | | | (2) | | | (41) | | | 3 | | | (135) | | | | | |
| | | | | | | | | | | | | | | | | | | | | | |
| Severance charges | | | | — | | | 237 | | | — | | | 304 | | | — | | | — | | | — | | | 106 | | | | | |
| Asset rationalization | | | | — | | | 155 | | | — | | | — | | | — | | | — | | | — | | | — | | | | | |
| Business transformation costs | | | | 176 | | | — | | | — | | | — | | | — | | | — | | | — | | | — | | | | | |
| Non-strategic business shutdown | | | | 158 | | | — | | | — | | | — | | | — | | | — | | | — | | | — | | | | | |
| | | | | | | | | | | | | | | | | | | | | | |
| | | | | | | | | | | | | | | | | | | | | | |
| | | | | | | | | | | | | | | | | | | | | | |
| | | | | | | | | | | | | | | | | | | | | | |
| | | | | | | | | | | | | | | | | | | | | | |
| | | | 182 | | | 215 | | | (123) | | | (2,387) | | | 437 | | | (90) | | | 927 | | | 831 | | | | | |
| | | | | | | | | | | | | | | | | | | | | | |
| Consolidated Adjusted EBITDA | | | | $ | 12,238 | | | $ | 11,971 | | | $ | 11,902 | | | $ | 11,747 | | | $ | 12,218 | | | $ | 11,873 | | | $ | 12,032 | | | $ | 11,765 | | | | | |
| | | | | | | | | | | | | | | | | | | | | | |
| | | | | | | | | | | | | | | | | | | | | | |
| | | | | | | | | | | | | | | | | | | | | | |
| | | | | | | | | | | | | | | | | | | | | | |
| | | | | | | | | | | | | | | | | | | | | | |
| | | | | | | | | | | | | | | | | | | | | | |
| | | | | | | | | | | | | | | | | | | | | | |
| | | | | | | | | | | | | | | | | | | | | | |
| Consolidated Adjusted EBITDA - Year over year change % | | | | 0.2 | % | | | | | | | | | | | | | | | | | | |
| | | | | | | | | | | | | | | | | | | | | | |
| | | | | | | | | | | | | | | | | | | | | | |
| | | | | | | | | | | | | | | | | | | | | | |
| | | | | | | | | | | | | | | | | | | | | | |
| | | | | | | | | | | | | | | | | | | | | | |
| | | | | | | | | | | | | | | | | | | | | | |
| | | | | | | | | | | | | | | | | | | | | | |
| | | | | | | | | | | | | | | | | | | | | | |
| | | | | | | | | | | | | | | | | | | | | | |
| | | | | | | | | | | | | | | | | | | | | | |
Footnotes:
(1) Includes Amortization of acquisition-related intangible assets and a portion of the Non-strategic business shutdown, where applicable.
(2) Includes Pension and benefits remeasurement adjustments and Early debt redemption costs, where applicable.
(3) Includes Net gain from disposition of assets, where applicable.
Consolidated EBITDA and Consolidated Adjusted EBITDA (LTM)
| | | | | | | | | | | | | | | | | | | | | | | | | | | | |
| Unaudited | | 12 Mos. Ended 9/30/23 | | 12 Mos. Ended 6/30/23 | | | | | | 12 Mos. Ended 9/30/22 | | | | |
| | | | | | | | | | | | | | |
| Consolidated Net Income | | $ | 21,366 | | | $ | 21,506 | | | | | | | $ | 19,787 | | | | | |
| Add: | | | | | | | | | | | | | | |
| Provision for income taxes | | 6,249 | | | 6,437 | | | | | | | 5,817 | | | | | |
| Interest expense | | 5,030 | | | 4,534 | | | | | | | 3,247 | | | | | |
Depreciation and amortization expense (1) | | 17,326 | | | 17,219 | | | | | | | 16,932 | | | | | |
| Consolidated EBITDA | | $ | 49,971 | | | $ | 49,696 | | | | | | | $ | 45,783 | | | | | |
| | | | | | | | | | | | | | |
| Add/(subtract): | | | | | | | | | | | | | | |
Other (income) expense, net (2) | | $ | (3,181) | | | $ | (2,572) | | | | | | | $ | 2,174 | | | | | |
Equity in losses (earnings) of unconsolidated businesses (3) | | 38 | | | 18 | | | | | | | (175) | | | | | |
| | | | | | | | | | | | | | |
| Severance charges | | 541 | | | 541 | | | | | | | 106 | | | | | |
| Asset rationalization | | 155 | | | 155 | | | | | | | — | | | | | |
| Business transformation costs | | 176 | | | — | | | | | | | — | | | | | |
| Non-strategic business shutdown | | 158 | | | — | | | | | | | — | | | | | |
| | | | | | | | | | | | | | |
| | | | | | | | | | | | | | |
| | | | | | | | | | | | | | |
| | | | | | | | | | | | | | |
| | | | | | | | | | | | | | |
| | | | | | | | | | | | | | |
| | (2,113) | | | (1,858) | | | | | | | 2,105 | | | | | |
| | | | | | | | | | | | | | |
| Consolidated Adjusted EBITDA | | $ | 47,858 | | | $ | 47,838 | | | | | | | $ | 47,888 | | | | | |
Footnotes:
(1) Includes Amortization of acquisition-related intangible assets and a portion of the Non-strategic business shutdown, where applicable.
(2) Includes Pension and benefits remeasurement adjustments and Early debt redemption costs, where applicable.
(3) Includes Net gain from disposition of assets, where applicable.
Verizon Communications Inc.
Net Unsecured Debt and Net Unsecured Debt to Consolidated Adjusted EBITDA Ratio | | | | | | | | | | | | | | | | | | | | | | | | | | | | |
| (dollars in millions) |
| Unaudited | | 9/30/23 | | 6/30/23 | | 9/30/22 | | | | | | | | |
| | | | | | | | | | | | | | |
| Debt maturing within one year | | $ | 12,950 | | | $ | 14,827 | | | $ | 14,995 | | | | | | | | | |
| Long-term debt | | 134,441 | | | 137,871 | | | 132,912 | | | | | | | | | |
| Total Debt | | 147,391 | | | 152,698 | | | 147,907 | | | | | | | | | |
| Less Secured debt | | 20,951 | | | 21,342 | | | 16,510 | | | | | | | | | |
| Unsecured Debt | | 126,440 | | | 131,356 | | | 131,397 | | | | | | | | | |
| Less Cash and cash equivalents | | 4,210 | | | 4,803 | | | 2,082 | | | | | | | | | |
| Net Unsecured Debt | | $ | 122,230 | | | $ | 126,553 | | | $ | 129,315 | | | | | | | | | |
| Consolidated Net Income (LTM) | | $ | 21,366 | | | $ | 21,506 | | | $ | 19,787 | | | | | | | | | |
| Consolidated Adjusted EBITDA (LTM) | | $ | 47,858 | | | $ | 47,838 | | | $ | 47,888 | | | | | | | | | |
| Unsecured Debt to Consolidated Net Income Ratio | | 5.9 | x | | 6.1 | x | | 6.6 | x | | | | | | | | |
| Net Unsecured Debt to Consolidated Adjusted EBITDA Ratio | | 2.6 | x | | 2.6 | x | | 2.7 | x | | | | | | | | |
| Net Unsecured Debt - Quarter over quarter change | | $ | (4,323) | | | | | | | | | | | | | |
| Net Unsecured Debt - Year over year change | | $ | (7,085) | | | | | | | | | | | | | |
| | | | | | | | | | | | | | |
| Net Unsecured Debt to Consolidated Adjusted EBITDA Ratio - Quarter over quarter change | | — | x | | | | | | | | | | | | |
| Net Unsecured Debt to Consolidated Adjusted EBITDA Ratio - Year over year change | | (0.1) | x | | | | | | | | | | | | |
| | | | | | | | | | | | | | |
| | | | | | | | | | | | | | |
| | | | | | | | | | | | | | |
Adjusted Earnings per Common Share (Adjusted EPS)
| | | | | | | | | | | | | | | | | | | | | | | | | | | | | | | | |
| (dollars in millions, except per share amounts) |
| Unaudited | | 3 Mos. Ended 9/30/23 | | 3 Mos. Ended 9/30/22 |
| | Pre-tax | Tax | After-Tax | | | Pre-tax | Tax | After-Tax | |
| EPS | | | | | $ | 1.13 | | | | | | $ | 1.17 | |
| Amortization of acquisition-related intangible assets | | $ | 224 | | $ | (56) | | $ | 168 | | 0.04 | | | $ | 236 | | $ | (58) | | $ | 178 | | 0.04 | |
| | | | | | | | | | |
| Business transformation costs | | 176 | | (45) | | 131 | | 0.03 | | | — | | — | | — | | — | |
| Non-strategic business shutdown | | 179 | | (83) | | 96 | | 0.02 | | | — | | — | | — | | — | |
| Severance, pension and benefits charges | | — | | — | | — | | — | | | 645 | | (162) | | 483 | | 0.11 | |
| | | | | | | | | | |
| | | | | | | | | | |
| | | | | | | | | | |
| | | | | | | | | | |
| | | | | | | | | | |
| | | | | | | | | | |
| | | | | | | | | | |
| | | | | | | | | | |
| | | | | | | | | | |
| | | | | | | | | | |
| | | | | | | | | | |
| | | | | | | | | | |
| | $ | 579 | | $ | (184) | | $ | 395 | | $ | 0.09 | | | $ | 881 | | $ | (220) | | $ | 661 | | $ | 0.16 | |
| Adjusted EPS | | | | | $ | 1.22 | | | | | | $ | 1.32 | |
| Year over year change % | | | | | (7.6) | % | | | | | |
Footnotes:
Adjusted EPS may not add due to rounding.
| | | | | | | | | | | | | | | |
| | | | | |
| Free Cash Flow | | | | | |
| (dollars in millions) | |
| Unaudited | | 9 Mos. Ended 9/30/23 | | 9 Mos. Ended 9/30/22 | |
| | | | | |
| Net Cash Provided by Operating Activities | | $ | 28,798 | | | $ | 28,199 | | |
| Capital expenditures (including capitalized software) | | (14,164) | | | (15,811) | | |
| Free Cash Flow | | $ | 14,634 | | | $ | 12,388 | | |
| | | | | |
| | | | | |
| | | | | |
| | | | | |
| | | | | | | | | | | | | | | |
| | | | | |
| Consolidated Operating Expenses Excluding Depreciation and Amortization and Special Items | | | | | |
| (dollars in millions) |
| Unaudited | | 3 Mos. Ended 9/30/23 | | | 3 Mos. Ended 9/30/22 |
| | | | | |
| Consolidated Operating Expenses | | $ | 25,863 | | | | $ | 26,347 | |
Depreciation and amortization expense (1) | | 4,431 | | | | 4,324 | |
| | | | | |
| Business transformation costs | | 176 | | | | — | |
| Non-strategic business shutdown | | 158 | | | | — | |
| | | | | |
| Consolidated Operating Expenses Excluding Depreciation and Amortization and Special Items | | $ | 21,098 | | | | $ | 22,023 | |
| Year over year change % | | (4.2) | % | | | |
| | | | | |
| | | | | |
Footnotes:
(1) Includes Amortization of acquisition-related intangible assets and a portion of the Non-strategic business shutdown, where applicable.
Verizon Communications Inc.
Non-GAAP Reconciliations - Segments
Segment EBITDA and Segment EBITDA Margin
Consumer
| | | | | | | | | | | | | | | | | | |
| (dollars in millions) |
| Unaudited | | 3 Mos. Ended 9/30/23 | | 3 Mos. Ended 9/30/22 | | | | |
| | | | | | | | |
| Operating Income | | $ | 7,547 | | | $ | 7,349 | | | | | |
| Add Depreciation and amortization expense | | 3,272 | | | 3,232 | | | | | |
| Segment EBITDA | | $ | 10,819 | | | $ | 10,581 | | | | | |
| Year over year change % | | 2.2 | % | | | | | | |
| | | | | | | | |
| Total operating revenues | | $ | 25,257 | | | $ | 25,840 | | | | | |
| Operating Income Margin | | 29.9 | % | | 28.4 | % | | | | |
| Segment EBITDA Margin | | 42.8 | % | | 40.9 | % | | | | |
| | | | | | | | |
| | | | | | | | |
Business
| | | | | | | | | | | | | | | | | | |
| (dollars in millions) |
| Unaudited | | 3 Mos. Ended 9/30/23 | | 3 Mos. Ended 9/30/22 | | | | |
| | | | | | | | |
| Operating Income | | $ | 539 | | | $ | 698 | | | | | |
| Add Depreciation and amortization expense | | 1,127 | | | 1,079 | | | | | |
| Segment EBITDA | | $ | 1,666 | | | $ | 1,777 | | | | | |
| Year over year change % | | (6.2) | % | | | | | | |
| | | | | | | | |
| Total operating revenues | | $ | 7,527 | | | $ | 7,837 | | | | | |
| Operating Income Margin | | 7.2 | % | | 8.9 | % | | | | |
| Segment EBITDA Margin | | 22.1 | % | | 22.7 | % | | | | |
| | | | | | | | |
| | | | | | | | |