 May 13, 2009 Verizon to Divest Wireline Businesses in 14 States Verizon to Divest Wireline Businesses in 14 States Ivan Seidenberg, Chairman & CEO John Killian, EVP & CFO Exhibit 99.2 |
 2 “Safe Harbor” Statement “Safe Harbor” Statement Throughout this presentation, results shown are adjusted for special items. Results reflect the reclassifications of revenues, expenses and operating income in the Wireline segment following the completion, on March 31, 2008, of the spin-off of our local exchange and related business assets in Maine, New Hampshire and Vermont. Reconciliations to generally accepted accounting principles (GAAP) for non-GAAP financial measures included in this presentation can be found on our website at www.verizon.com/investor. NOTE: This presentation contains statements about expected future events and financial results that are forward- looking and subject to risks and uncertainties. For those statements, we claim the protection of the safe harbor for forward-looking statements contained in the Private Securities Litigation Reform Act of 1995. The following important factors could affect future results and could cause those results to differ materially from those expressed in the forward-looking statements: the effects of adverse conditions in the U.S. and international economies; the effects of competition in our markets; materially adverse changes in labor matters, including workforce levels and labor negotiations, and any resulting financial and/or operational impact, in the markets served by us or by companies in which we have substantial investments; the effect of material changes in available technology; any disruption of our suppliers' provisioning of critical products or services; significant increases in benefit plan costs or lower investment returns on plan assets; the impact of natural or man-made disasters or existing or future litigation and any resulting financial impact not covered by insurance; technology substitution; an adverse change in the ratings afforded our debt securities by nationally accredited ratings organizations or adverse conditions in the credit markets impacting the cost, including interest rates, and/or availability of financing; any changes in the regulatory environments in which we operate, including any loss of or inability to renew wireless licenses, and the final results of federal and state regulatory proceedings and judicial review of those results; the timing, scope and financial impact of our deployment of fiber-to-the-premises broadband technology; changes in our accounting assumptions that regulatory agencies, including the SEC, may require or that result from changes in the accounting rules or their application, which could result in an impact on earnings; our ability to successfully integrate Alltel Corporation into Verizon Wireless’s business and achieve anticipated benefits of the acquisition; and the inability to implement our business strategies. |
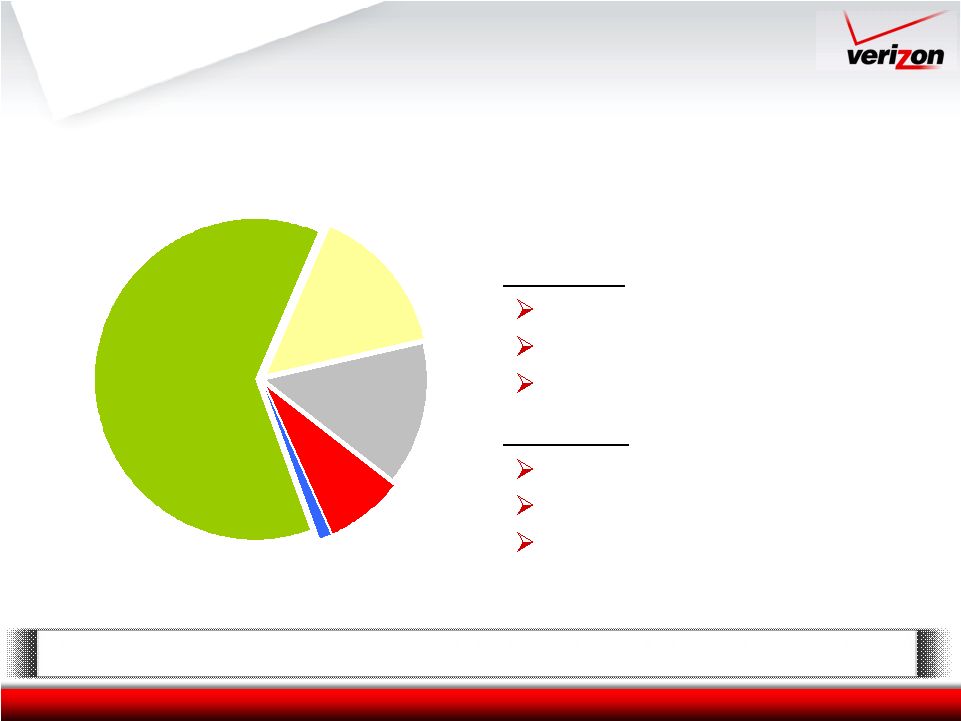 3 Focus on growth areas Strategic Transformation Over the last several years, Verizon has… Divested 8M access lines International Directories Acquired 14M wireless subscribers Spectrum Global IP network & services Wireless 62% Mass Markets 15% Global Enterprise 14% Global Wholesale 8% Other 1% Post-transaction Verizon Revenues* * Based on analyst estimates for 2011E adjusted for transaction |
 4 Creating value for shareholders Strategic Benefits * 2008 revenue is pro forma for Alltel Revenue ($B)* Cash Flow From Continuing Operations ($B) $23 $27 19.4% 17.8% 2006 2008 Capex/ Revenue $106 $87 55% 44% 2006 2008 Wireless as % of Revenue Special distribution through transaction Improving growth profile Focus on wireless, FiOS and global IP Driving cash flow growth |
 5 Transaction Overview ~$8.6B total value in Divested Operations to Verizon & shareholders Approximately 68% ownership by Verizon shareholders in Frontier Tax-free distribution ~$3.3B debt reduction for Verizon Collar around $7.75 +/- $0.75 Exact distribution to be determined prior to closing Transaction benefits customers, employees and shareholders |
 6 Divested Operations Overview 69K 110K 900K 4.8M FiOS TV FiOS Internet High Speed Internet Access lines 37% Wire centers 4% FiOS customers 43% 11K Square miles Employees Operational $0.6B Capex $1.8B EBITDA $4.4B Revenue Financial Based on 2008 results Predominantly rural wireline operations in 14 states |
 7 Summary Enhancing growth profile and focus Significant opportunities for cost reduction Strong Free Cash Flow outlook Maintaining dividend policy Clear strategic, operational and financial benefits |