 Private & Confidential 2007 Energy & Utilities Conference Deutsche Bank Securities May 31, 2007 Exhibit 99.3 |
 1 Private & Confidential Forward Looking Statements This presentation includes forward-looking information that are subject to a number of risks and uncertainties, many of which are beyond our control. All information, other than historical facts included in this presentation, regarding our strategy, future operations, drilling plans, estimated reserves, future production, estimated capital expenditures, projected costs, the potential of drilling prospects and other plans and objectives of management are forward-looking information. All forward-looking statements speak only as of the date of this presentation. Although the Company believes that the plans, intentions and expectations reflected in or suggested by the forward- looking statements are reasonable, there is no assurance that these plans, intentions or expectations will be achieved. Actual results may differ materially from those anticipated due to many factors, including oil and natural gas prices, industry conditions, drilling results, uncertainties in estimating reserves, uncertainties in estimating future production from enhanced recovery operations, availability of drilling rigs and other services, availability of oil and natural gas transportation capacity, availability of capital resources and other factors listed in reports we have filed or may file with the Securities and Exchange Commission. |
 2 Private & Confidential Company Overview Completed IPO on May 14 at $15 (CLR on NYSE) – $2.5 billion market capitalization Founded 1967 by Harold Hamm, Chairman & CEO Organic growth strategy focused on unconventional resource plays – 99% of proved reserve adds through drill bit over last 3 years – 78% of proved reserves located in unconventional resources – 738,000 net undeveloped acres concentrated in emerging plays Strong financial position – $130 million of bank debt outstanding – 2007E cash flows to substantially fund $437mm capital budget Unhedged asset base |
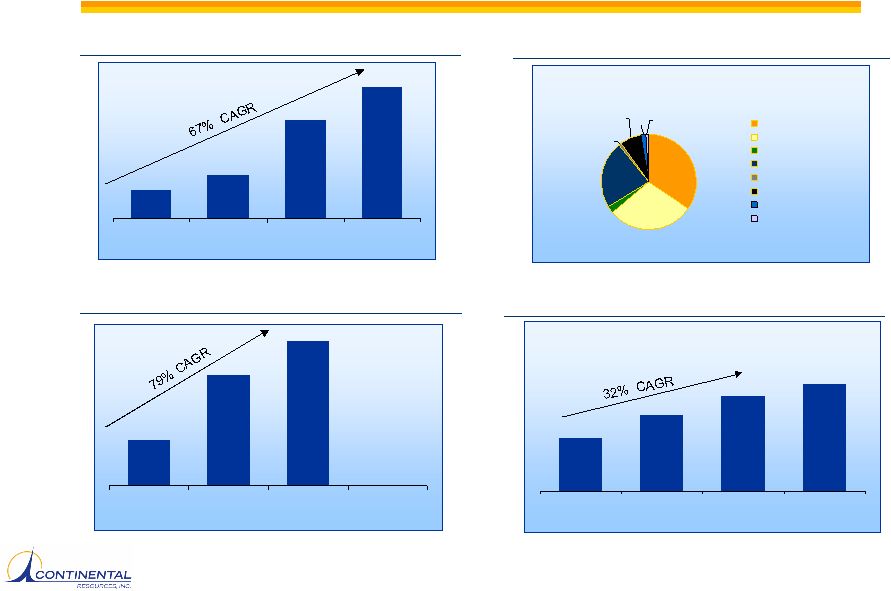 3 Private & Confidential $94 $145 $327 $437 2004 2005 2006 2007E Investment in Asset Base Capex ($mm) 14,121 19,751 24,707 27,911 2004 2005 2006 Q1 '07 Production (Boe/d) $116 $285 2004 2005 2006 EBITDAX 1 ($mm) 1 See page 9 of the prospectus and first quarter 2007 earnings release for a reconciliation of net income to EBITDAX. $372 Total = $437mm $151 $128 $10 $101 $4 $32 $7 $4 Red River Units Bakken Field Other Rockies Mid-Continent Gulf Coast Land Seismic Other 2007 Capex by Region ($mm) |
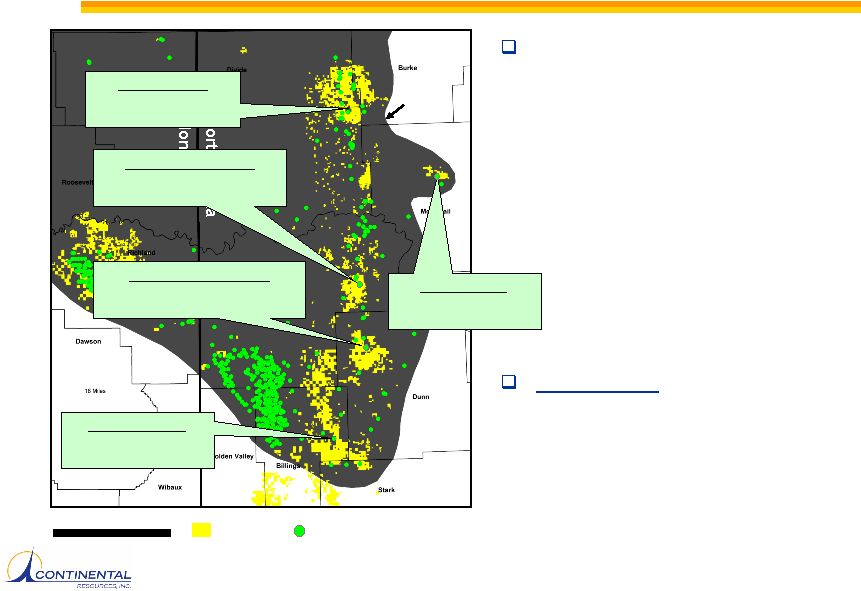
 4 Private & Confidential Mid-Continent Proved reserves: 16.9 MMBoe 762 drilling locations Gulf Coast Proved reserves: 0.2 MMBoe 7 drilling locations 1,589 gross wells / 1,772 drilling locations Rockies Proved reserves: 101.2 MMBoe 1,003 drilling locations Operational Overview Red River Units 56% Bakken Field 22% Other Rockies 8% Mid-Continent 14% Gulf Coast <1% Total proved reserves (12/31/06) = 118.3 MMBoe 74% PDP / 83% oil / 13.1 R/P / Operate 95% of PV-10% Unconventional 78% Red River Units 45% Bakken Field 29% Other Rockies 6% Mid-Continent 17% Gulf Coast 3% Avg. daily production (Q1 2007) = 27.9 MBoe/d Unconventional 74% Counties with acreage holdings are highlighted Regional office Headquarters Proved Reserves by Geography Production by Geography |
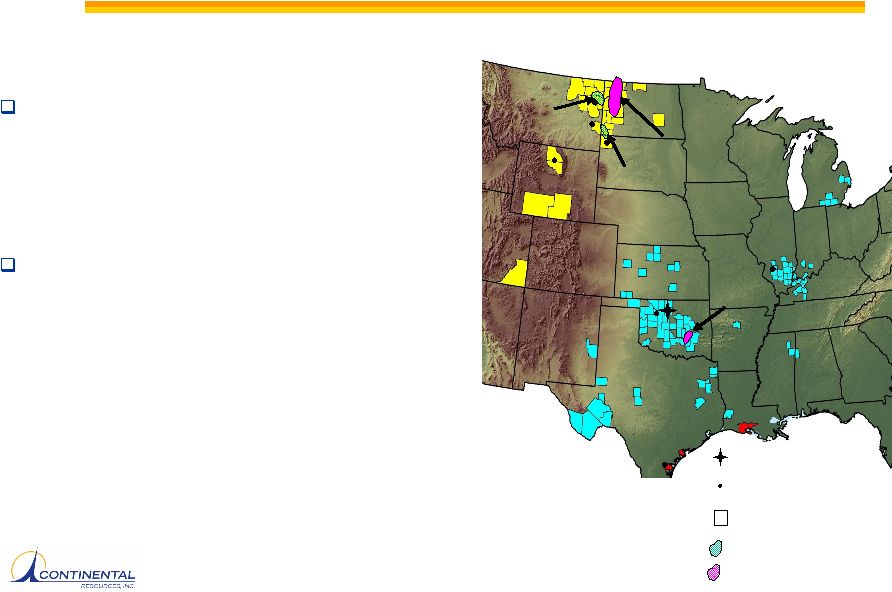 5 Private & Confidential Key 2007 Drilling Projects Development (50% drilling capex) – Red River Units • 56% proved reserves / 45% production – Montana Bakken Shale • 20% proved reserves / 29% production Emerging Plays (42% drilling capex) – North Dakota Bakken • 263,000 net undeveloped acres – Oklahoma Woodford Shale • 44,000 net undeveloped acres Red River Units MT Bakken ND Bakken Woodford Counties with acreage holdings are highlighted Regional office Headquarters Development Emerging Plays |
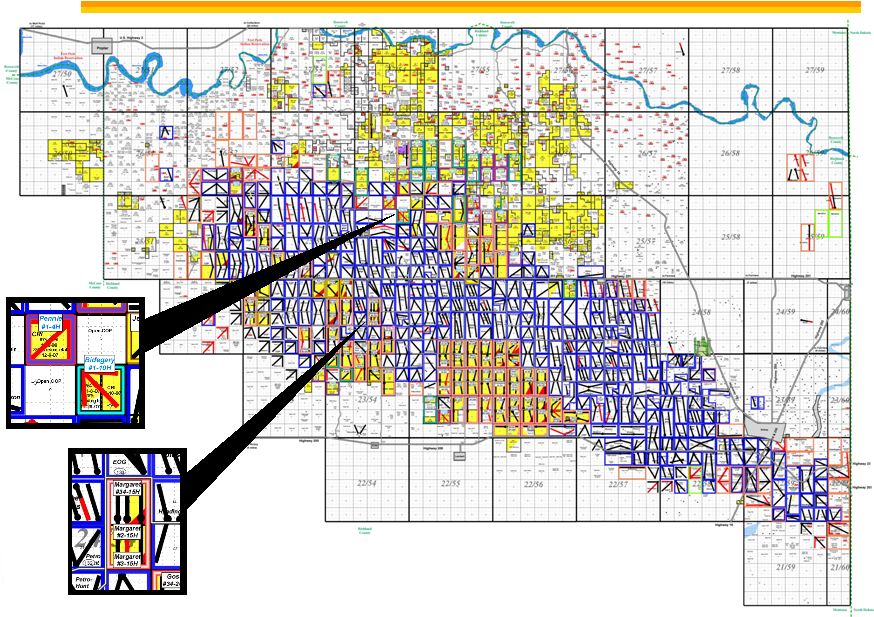
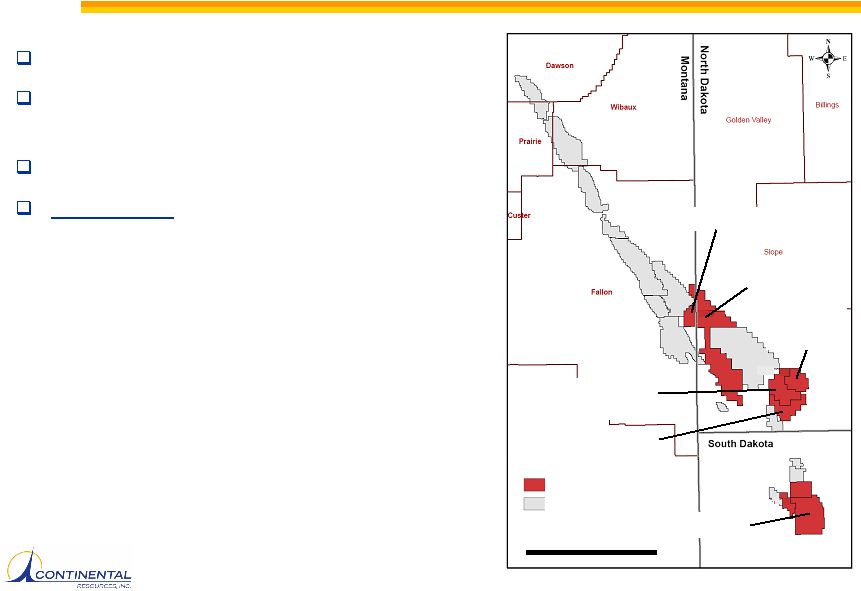 6 Private & Confidential Red River Enhanced Recovery Units 66.5 MMBoe proved reserves 12,599 Boe/d net production in 1st quarter 2007 Developed with horizontal drilling 2007 Plans – $151MM 2007E capex – Infield drilling program to accelerate production and enhance sweep efficiency – Developing CHNU/CHWU on 320 acre spacing per producer – Developing MPHU-West and MPHU- South on 640 acre spacing per producer – Developing un-swept oil in MPHU and Buffalo with horizontal re-entry drilling Cedar Hills North Unit Cedar Hills West Unit Buffalo Units Medicine Pole Hills West Unit Medicine Pole Hills South Unit Medicine Pole Hills Unit 25 Miles CLR operated units Others units |
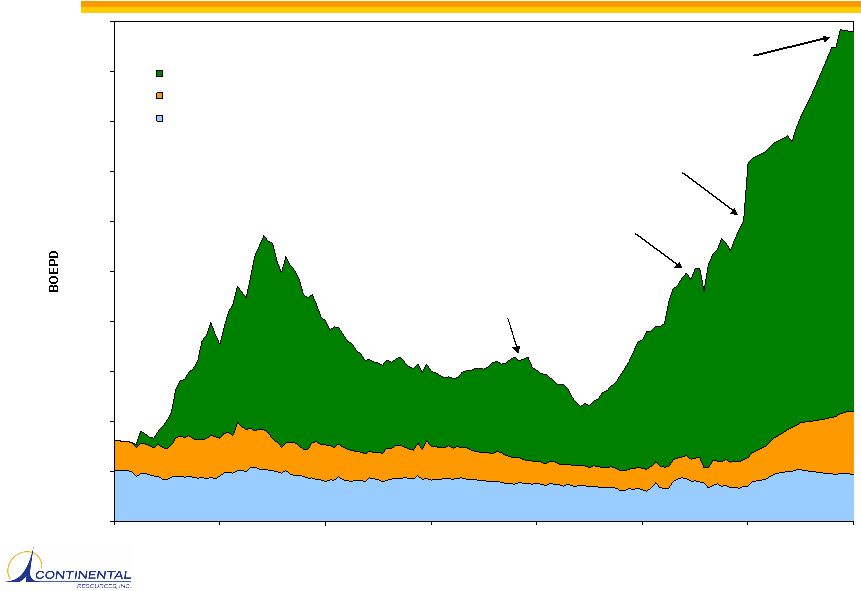 7 Private & Confidential Red River Enhanced Recovery Units Note: Red River production forecast per 12/31/06 proved reserve report. 0 2,000 4,000 6,000 8,000 10,000 12,000 14,000 16,000 18,000 20,000 Jan-95 Jan-97 Jan-99 Jan-01 Jan-03 Jan-05 Jan-07 Jan-09 Cedar Hills Field Medicine Pole Hills Field Buffalo Field Red River Peak Rate Forecast 19,668 BOEPD 10/08 Began conversion to Injection Begin infill program Net Production December 31, 2006 |
 8 Private & Confidential Montana Bakken Shale Significant unconventional oil resource play – Represents ½ of Montana’s oil production – CLR is largest producer (7,685 boepd) – Developed through horizontal drilling and advanced fracture stimulation 2007 Plans – $57 million 2007E drilling capex – Complete 640-acre development – Test un-booked upside • 320-acre infill drilling • North expansion of field with tri-lateral 640-acre wells • Enhanced recovery – Four drilling rigs CLR acreage 35 miles Bakken producer Williston Basin MT Bakken 21 wells $57 mm Outline of potential Bakken Production |
 9 Private & Confidential Richland County, Montana Infills |
 10 Private & Confidential North Dakota Bakken Shale Emerging unconventional oil resource play – 478,000 gross (263,000 net) undeveloped acres strategically located on Nesson Anticline – Significant reserve and production growth potential – 23 industry-operated drilling rigs • Amerada Hess • Conoco Phillips • Marathon 2007 Plans – $71 million 2007E drilling capex – 37 wells on 1280-acre locations in each of 6 prospect areas – Five drilling rigs (two operated and three Conoco Phillips JV) CLR acreage 35 miles Bakken producer Filkowski 1-11H ( 63% WI ) 300 bopd Williston Basin Outline of potential Bakken Production State Weydahl 44-36H ( 33% WI ) 560 bopd Nelson Farms ( 13% WI ) 350 bopd State Veeder 44-36H ( 38% WI ) 380 bopd Lovdahl 1-16H ( 36% WI ) 250 bopd |
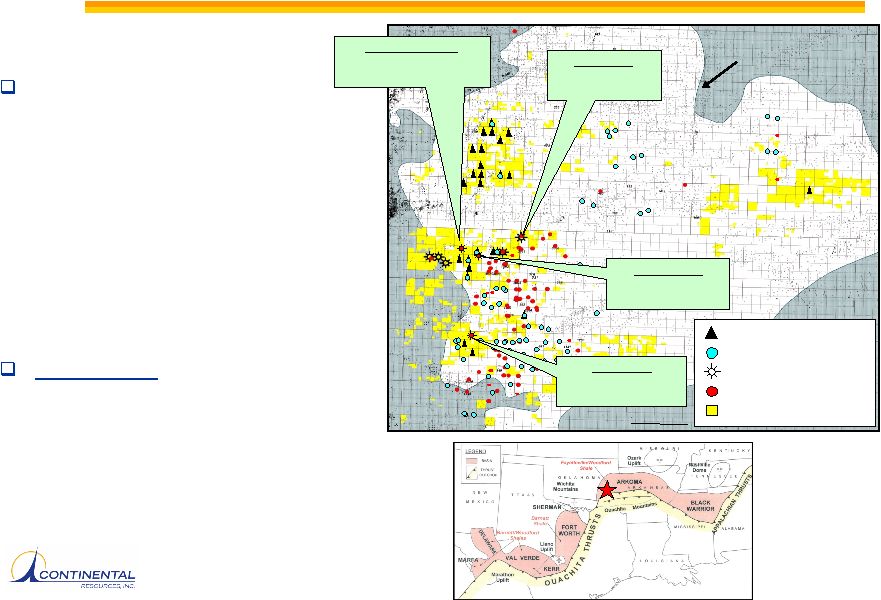 11 Private & Confidential New unconventional gas resource play – 40 industry-operated rigs • Newfield • Antero • Devon – 44,000 net undeveloped acres – Significant reserve and production growth potential 2007 Plans – $82 million 2007E drilling capex – 123 gross (17 net) wells – Four drilling rigs now • Fifth to be added Oklahoma Woodford Shale Project 6 miles Outline of potential Woodford production 07 CLR Locations 07 Woodford Horiz Spud CLR Producer Woodford Producer CLR Acreage Meyer Trust 1-13H (34% WI) 3,700 Mcfd Foster 1-6H (17% WI) 2,600 Mcfd Harden 1-20H (32% WI) 2,500 Mcfd Holder 1-5H (52% WI) 675 Mcfd |
 12 Private & Confidential Other ongoing and emerging plays Counties with acreage holdings are highlighted Regional office Headquarters Rockies: 66 scheduled locations 213,500 net undeveloped acres Red River, Winnipegosis, Fryburg, Phosphoria, Lewis Shale Midcontinent: 52 scheduled locations 146,000 undeveloped acres Morrow-Springer, Atoka, Mississipian, Hunton, New Albany Shale, Barnett Shale Gulf Coast: 7 scheduled locations 6,400 net undeveloped acres 365,900 net undeveloped acres (50% of total undeveloped acreage) |
 13 Private & Confidential 2006 Highlights Grew production by 25% to 24,707 boepd – 26,503 boepd for fourth quarter 2006 – 27,911 boepd for first quarter 2007 Increased EBITDAX 1 by 30% to $372 million Maintained operating expense discipline – Reduced per-unit production expenses (excl. production taxes) by 5% Drilled 159 productive wells (87% success rate) Increased scheduled drilling locations to 1,772 Continued to build acreage in our emerging resource plays 1 See page 9 of the prospectus for a reconciliation of net income to EBITDAX. |
 14 Private & Confidential Financial and Operating Summary 1 See page 9 of the prospectus and first quarter 2007 earnings release for a reconciliation of net income to EBITDAX. 2 Operating statistics for 2006 computed on Boe sold. Oil sales volumes are 21 MBbls less than oil production volumes for 2006. Year ended December 31, 2004 2005 2006 Realized oil price ($/Bbl) $37.12 $52.45 $55.30 Realized natural gas price ($/Mcf) $5.06 $6.93 $6.08 Oil production (MBbls) 3,688 5,708 7,480 Natural g as production (MMcf) 8,794 9,006 9,225 Total production (MBoe) 5,154 7,209 9,018 EBITDAX ($ thousands) 1 $116,498 $285,344 $372,115 Cash flow from operations ($ thousands) $93,854 $265,265 $417,041 Key Operational Statistics ($/ Boe)² Oil and gas revenue $35.20 $50.1 9 $52.09 Production expense 8.49 7.32 6.99 Production tax 2.39 2.22 2.48 G&A (excluding non -cash equity compensation) 2.02 2.43 2.24 Total cash costs $12.90 $11.97 $11.71 EBITDAX 1 $22.60 $ 39.58 $41.36 |
 15 Private & Confidential Summary High quality, proved reserve base – Crude oil-concentrated, long-lived, unhedged Track record of drill bit growth at low cost – Annual EBITDAX > Capex over past 3 years Low risk production growth in Red River Units – Production growth is 7,936 Boe/d over next 2 years (32% of 2006 average daily production for entire company) Significant future production and reserve growth in two emerging unconventional plays – Over 1,500 unbooked locations Low cash costs with one of highest net operating margins among E&P companies – $41.36 per Boe ($6.89 per Mcfe) EBITDAX for 2006 |