 Merrill Lynch Global Energy Conference November 7, 2007 Exhibit 99.1 |
 1 Forward Looking Statements This presentation includes forward-looking information that are subject to a number of risks and uncertainties, many of which are beyond our control. All information, other than historical facts included in this presentation, regarding our strategy, future operations, drilling plans, estimated reserves, future production, estimated capital expenditures, projected costs, the potential of drilling prospects and other plans and objectives of management are forward-looking information. All forward-looking statements speak only as of the date of this presentation. Although the Company believes that the plans, intentions and expectations reflected in or suggested by the forward- looking statements are reasonable, there is no assurance that these plans, intentions or expectations will be achieved. Actual results may differ materially from those anticipated due to many factors, including oil and natural gas prices, industry conditions, drilling results, uncertainties in estimating reserves, uncertainties in estimating future production from enhanced recovery operations, availability of drilling rigs and other services, availability of oil and natural gas transportation capacity, availability of capital resources and other factors listed in reports we have filed or may file with the Securities and Exchange Commission. |
 2 Company Overview Completed IPO on May 14 at $15 (CLR on NYSE) – $3 billion market capitalization Founded 1967 by Harold Hamm, Chairman & CEO – Harold Hamm, family and management own 82% Organic growth strategy focused on unconventional resource plays – 99% of proved reserve adds through drill bit over last 3 years – >500 hz wells drilled targeting unconventional formations – 15 operated rigs – 14 drilling horizontal – >700,000 net undeveloped acres concentrated in emerging plays Strong financial position – $156 million of bank debt outstanding – 9M 2007 cash operating margin of $42/Boe ($7/Mcfe) - $66 NYMEX |
 3 $94 $145 $327 $482 $616 2004 2005 2006 2007E 2008E Investment in Asset Base Capex ($mm) 14,121 19,751 24,707 29,474 2004 2005 2006 Q3 '07 Production (boe/d) Total = $482mm $148 $95 $73 $18 $79 $21 $37 $11 Red River Units MT Bakken ND Bakken Other Rockies Woodford Other Mid-Con Land Other 2007 Capex by Region ($mm) Total = $616mm $168 $55 $125 $29 $103 $46 $13 $21 $56 Red River Units MT Bakken ND Bakken Other Rockies Woodford Other Mid-Con Gulf Coast Land & Seismic Other 2008 Capex by Region ($mm) |
 4 Operational Overview Mid-Continent Proved reserves: 16.9 MMboe 762 drilling locations Gulf Coast Proved reserves: 0.2 MMboe 7 drilling locations Red River Units 56% Bakken Field 22% Other Rockies 8% Mid-Continent 14% Gulf Coast <1% Total proved reserves (12/31/06) = 118.3 MMboe 74% PDP / 83% oil / 13.1 R/P / Operate 95% of PV-10% Unconventional 78% Red River Units 46% Bakken Field 30% Other Rockies - 6% Mid-Continent 14% Gulf Coast 1% Avg. daily production (Q3 2007) = 29.5 Mboe/d Unconventional 79% 1,589 gross wells / 1,772 drilling locations Rockies Proved reserves: 101.2 MMboe 1,003 drilling locations Counties with acreage holdings are highlighted Regional office Headquarters Proved Reserves by Geography Production by Geography Woodford - 3% |
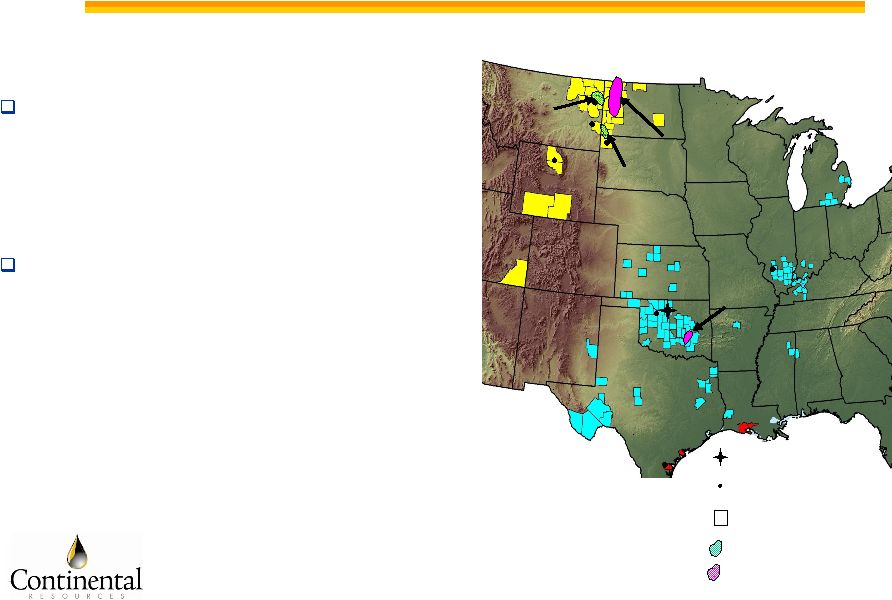 5 Key Drilling Projects Development (54% 2007 / 41% 2008 capex) – Red River Units • 56% proved reserves / 46% production – Montana Bakken Shale • 20% proved reserves / 26% production Emerging Plays (37% 2007 / 42% 2008 capex) – North Dakota Bakken Shale • 311,000 net acres – Oklahoma Woodford Shale • 45,000 net acres Red River Units MT Bakken ND Bakken Woodford Counties with acreage holdings are highlighted Regional office Headquarters Development Emerging Plays |
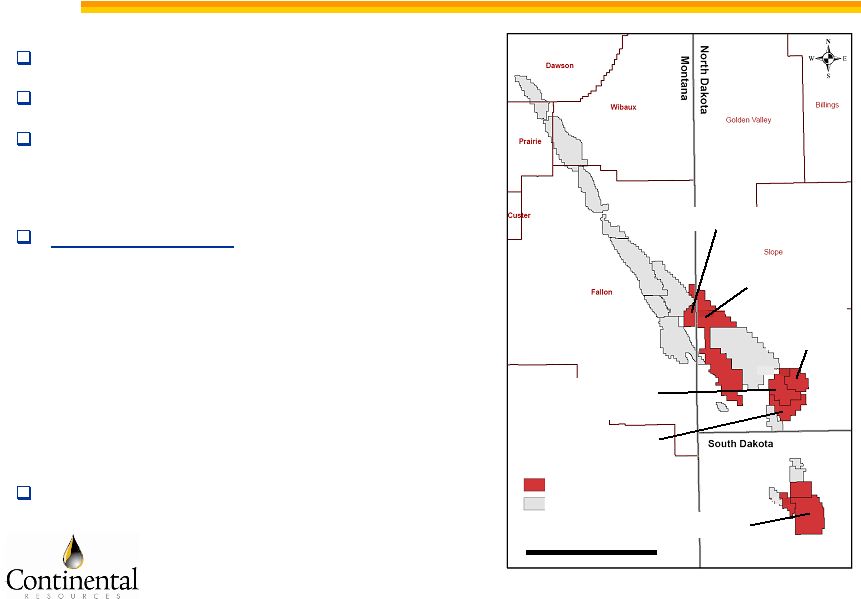 6 Red River Enhanced Recovery Units 66.5 MMboe proved reserves 13,524 net boepd in 3Q 2007 Cedar Hills discovered in 1995, developed with hz drilling, 2003 enhanced recovery operations 2007/2008 Plans – $148MM 2007E capex – $168MM 2008E capex – Infield horizontal drilling and re-entry drilling program to accelerate production and enhance sweep efficiency – Develop Cedar Hills on 320 acre / producer – Badlands Plant began in August Forecast 2009 peak at ~ 19 net Mboe/d Cedar Hills North Unit Cedar Hills West Unit Buffalo Units Medicine Pole Hills West Unit Medicine Pole Hills South Unit Medicine Pole Hills Unit 25 Miles CLR operated units Others units |
 7 Montana Bakken Shale Significant unconventional oil resource play – Represents ½ of Montana’s oil production – CLR largest producer (7,637 net boepd) – Developed through horizontal drilling and advanced fracture stimulation 2007/2008 Plans – $95MM 2007E capex – $55MM 2008E capex – Continue 640-acre development – Test un-booked upside • 320-acre infill drilling • Expansion of field with tri-lateral 640-acre wells • Enhanced recovery – Three drilling rigs CLR acreage 35 miles Bakken producer Williston Basin Richland Co., MT Bakken Outline of potential Bakken Production |
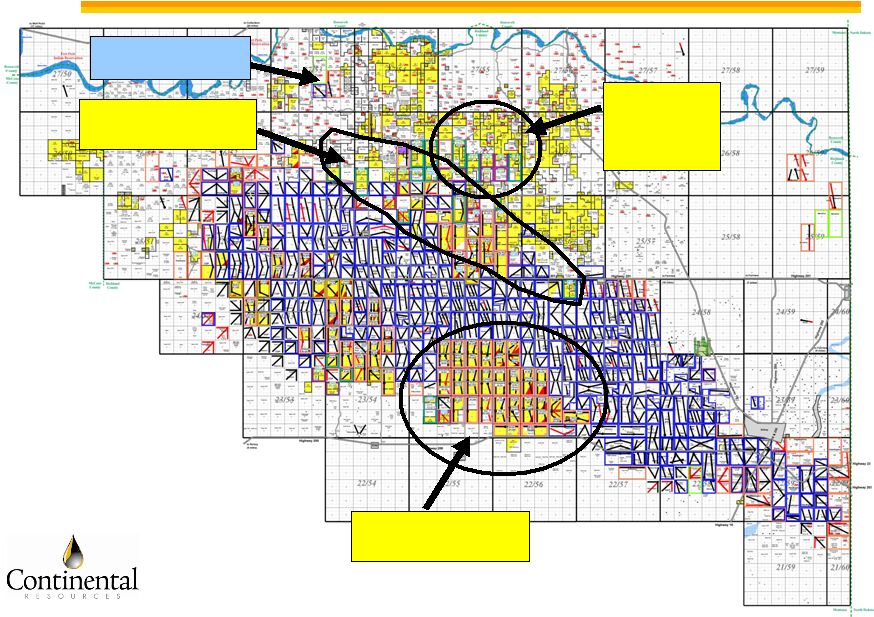 8 Richland County, Montana Bakken Focus of 320-acre spacing drilling Focus of Tri-lateral drilling 3-D defined Red River C drilling Sinclair Discovery 300 bopd |
 9 North Dakota Bakken Shale CLR acreage Bakken producer 35 miles Williston Basin Emerging unconventional oil resource play – 589,000 gross (311,000 net) acres strategically located on Nesson Anticline – Significant reserve and production growth potential – ND oil prod. highest in 20 years – 30+ industry-operated rigs • Amerada Hess • Marathon • EOG Resources • ConocoPhillips 2007/2008 Plans – $73MM 2007E capex – $125MM 2008E capex – 20 net wells in 2008 – Six drilling rigs (three operated and three Conoco Phillips JV) Outline of potential Bakken production |
 10 LEGEND CRI OPERATED CRI NONOPERATED NO CRI INTEREST Normandy Rocket Galaxy Norse Valhalla Pontiac North Dakota Bakken Focus of 2008 drilling (consistent economic results) Encouraging results using un-cemented liners and multi-staged fracs Testing un-cemented liner and multi-staged fracs 3 CLR rigs 3 COP rigs Dev/Step-outs 1 CLR rig Bakken, Fryburg 1 CLR rig Bakken, Winnipegosis EOG Parshall Area |
 11 Oklahoma Woodford Shale 6 miles Outline of potential Woodford production 07 CLR Locations 07 Woodford hz Spud CLR Producer Woodford Producer CLR Acreage Exploration Development step-outs/ downspacing New unconventional gas resource play – 30+ industry-operated rigs • Newfield • Antero • Devon – 45,000 net acres – Significant reserve and production growth potential – Caney Shale upside 2007/2008 Plans – $79MM 2007E capex – $103MM 2008E capex – 20 net wells in 2008 – Five drilling rigs |
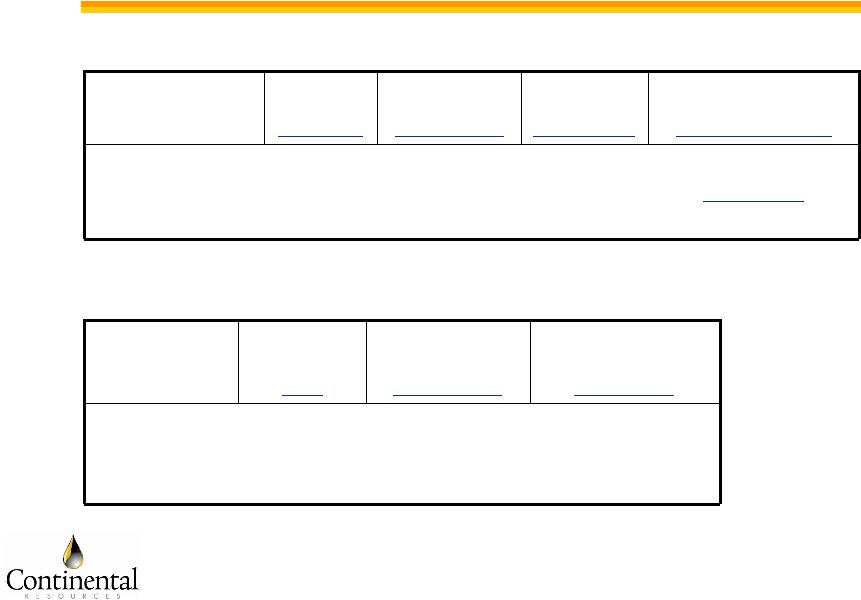 12 ND Bakken and OK Woodford Shale potential 225 MMboe 562 400,000 45,000 OK Woodford Total ND Bakken 124 MMboe 486 256,000 311,000 449 MMboe Reserve potential Potential locations (1) Net boe/well Net acres (1) Assumed 640 acre spacing for ND Bakken and 80 acre for Woodford Shale 34% 400,000 $5,000,000 OK Woodford ND Bakken 27% 256,000 $4,750,000 $70/bbl & $6/Mcf Pre-tax IRR Net boe/well Estimated average D&C |
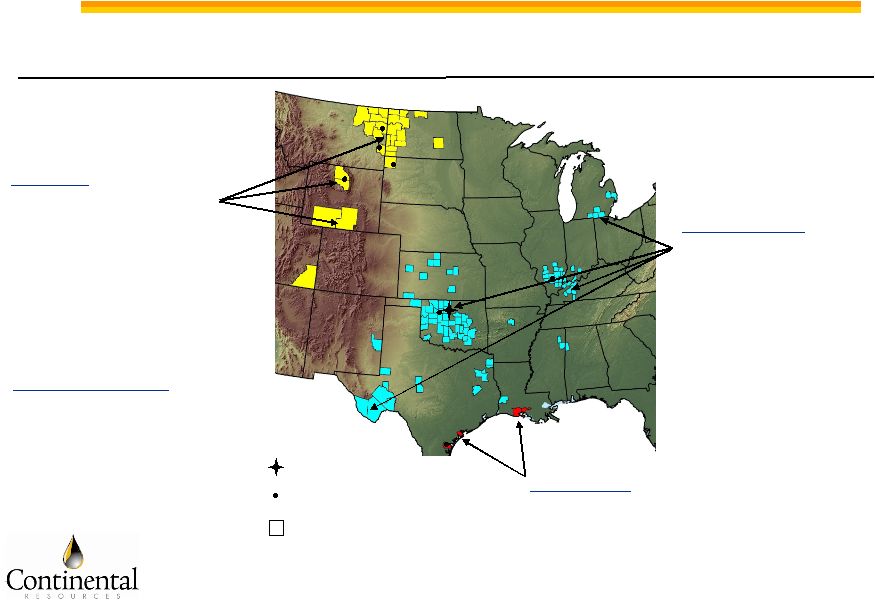 13 Other ongoing and emerging plays Rockies: 66 scheduled locations 185,000 net undeveloped acres Red River, Winnipegosis, Fryburg, Phosphoria, Lewis Shale Midcontinent: 52 scheduled locations 176,000 undeveloped acres Morrow-Springer, Atoka, Mississipian, Hunton, Barnett Shale, Trenton/Black River Gulf Coast: 7 scheduled locations 5,000 net undeveloped acres 366,000 net undeveloped acres (~50% of total undeveloped acreage) 2007 discoveries: MT – Red River C ND – Winnipegosis SD – Red River B MI – Trenton/Black River Regional office Headquarters Counties with acreage holdings are highlighted |
 14 Financial and Operating Summary 1 See page 9 of the prospectus and third quarter 2007 earnings release for a reconciliation of net income to EBITDAX. 2 Operating statistics per Boe sold. Oil sales volumes are 96 MBbls and 47 MBbls less than oil production volumes for 2006 and 2007, respectively. Year ended December 31, 2004 2005 2006 9M 2007 Realized oil price ($/Bbl) $37.12 $52.45 $55.30 $58.92 Realized natural gas price ($/Mcf) $5.06 $6.93 $6.08 $5.82 Oil production (boepd) 10,104 15,638 20,493 24,224 Natural gas production (Mcfd) 24,093 24,674 25,274 31,499 Total production (boed) 14,121 19,751 24,707 29,474 EBITDAX ($ thousands)¹ $116,498 $285,344 $372,115 $332,472 Key Operational Statistics ($/boe)² Oil and gas revenue $35.20 $50.19 $52.09 $54.68 Production expense 8.49 7.32 6.99 7.53 Production tax 2.39 2.22 2.48 2.89 G&A (excluding non-cash equity compensation) 2.02 2.43 2.24 1.95 Total cash costs $12.90 $11.97 $11.71 $12.37 Net operating margin $22.30 $38.22 $40.38 $42.31 |
 15 Summary High quality, proved reserve base – Crude oil-concentrated, long-lived, high operated % Track record of drill bit growth at low cost – Annual EBITDAX > Capex over past 3 years Low risk production growth in Red River Units – ~6,000 boe/d expected production growth over next 1+ year (~20% of current daily production for entire company) Significant future production and reserve growth opportunities in two large emerging plays – ND Bakken and OK Woodford Shales – Over 1,500 unbooked locations Low cash costs with one of highest net operating margins – Significant valuation and competitive advantage |
 16 Appendix |
 17 Crude oil fundamentals Growing demand – – 86 million bopd current world oil demand – Estimated to grow to 88 million bopd in 2008 – Non-OECD growing 3.5% per year • Chinese economy growing 10%+ per year • Only 8% of China’s population currently owns an automobile • China’s per capita usage is 2.1 bbls per year and India 1.9 bbs per year • Versus 16.3 bbls in South Korea and 26 bbls in United States Low surplus capacity – – 31 million bopd supplied by OPEC (36%) – Spare OPEC capacity estimated at 2 million bopd (EIA) – 2.3% of world demand Non-OPEC supply – – Forecasted growth not meeting expectations – Intensifying resource nationalization – Declines in North Sea, Mexico’s Cantarell Field, North Slope, etc. |
 18 Crude oil advantages Good, intrinsic value. – On BTU content 6 to 1 with nat gas. Selling for ~11 to 1 w/ nat gas, due primarily to fact raw material for all transportation fuels in world, accounting for 98%. OPEC capable of managing production levels should demand prove weaker than expected Alternative fuels cost $30 to $40 trillion to transition from oil Easily transported to market – pipeline infra-structure not required with inherent delays in construction Less competitive -- 1790 rigs operating only 300 are drilling for oil – Acreage costs less – Horizontal drilling and frac technology works well Secondary re-pressurization EOR techniques yield 2 to 3 times primary production (example of CHF) |