Exhibit 13
| | 2002 | | 2001 | | % CHANGE | |
| |
| |
| |
| |
FOR THE YEAR | | | | | | | |
| | | | | | | | | | |
Net sales | | $ | 4,801,776,537 | | $ | 4,333,706,754 | | | +11 | % |
Earnings: | | | | | | | |
Earnings before income taxes | | | 230,053,015 | | | 179,369,007 | | | +28 | % |
Provision for income taxes | | | 67,973,000 | | | 66,408,000 | | | +2 | % |
| |
|
| |
|
| | | | |
Net earnings | | | 162,080,015 | | | 112,961,007 | | | +43 | % |
Per share: | | | | | | | |
Basic | | | 2.08 | | | 1.45 | | | +43 | % |
Diluted | | | 2.07 | | | 1.45 | | | +43 | % |
Dividends per share | | | .76 | | | .68 | | | +12 | % |
Percentage of earnings to sales | | | 3.4 | % | | 2.6 | % | | +31 | % |
Percentage of earnings to average equity | | | 7.2 | % | | 5.2 | % | | +38 | % |
Capital expenditures | | | 243,598,096 | | | 261,145,658 | | | -7 | % |
Depreciation | | | 307,101,032 | | | 289,063,213 | | | +6 | % |
Sales per employee | | | 527,581 | | | 530,961 | | | -1 | % |
| |
|
| |
|
| |
|
| |
AT YEAR END | | | | | | | |
| | | | | | | | | | |
Working capital | | $ | 832,602,872 | | $ | 889,507,190 | | | -6 | % |
Property, plant and equipment | | | 2,932,058,102 | | | 2,365,655,061 | | | +24 | % |
Long-term debt | | | 878,550,000 | | | 460,450,000 | | | +91 | % |
Stockholders’ equity | | | 2,322,989,489 | | | 2,201,460,329 | | | +6 | % |
Per share | | | 29.71 | | | 28.29 | | | +5 | % |
Shares outstanding | | | 78,180,108 | | | 77,814,511 | | | — | |
Employees | | | 9,800 | | | 8,400 | | | +17 | % |
| |
|
| |
|
| |
|
| |
Certain amounts for the prior year have been reclassified to conform to the 2002 presentation.
FORWARD-LOOKING STATEMENTS Certain statements made in this annual report are forward-looking statements that involve risks and uncertainties. These forward-looking statements reflect the Company’s best judgment based on current information, and although we base these statements on circumstances that we believe to be reasonable when made, there can be no assurance that other factors will not affect the accuracy of such forward-looking information. As such, the forward-looking statements are not guarantees of future performance, and actual results may vary materially from the results and expectations discussed herein. Factors that might cause the Company’s actual results to differ materially from those anticipated in forward-looking statements include, but are not limited to: (1) the sensitivity of the results of our operations to prevailing steel prices and the changes in the supply and cost of raw materials, including steel scrap; (2) availability and cost of electricity and natural gas; (3) competitive pressure on sales and pricing, including pressure from imports and substitute materials; (4) uncertainties surrounding the global economy including excess world capacity for steel production; (5) U.S. and foreign trade policy affecting steel imports or exports including adjustments, repeals or lapses of existing U.S. tariffs on imported steel and adverse outcomes of pending and future trade cases alleging unlawful practices in connection with the importing of steel into the U.S.; (6) changes in significant government regulations affecting environmental compliance; (7) the cyclical nature of the domestic steel industry; (8) capital investments and their impact on the Company’s performance; (9) our safety performance; and (10) other factors described in the Company’s filings with the Securities and Exchange Commission.
AT A GLANCE
STEEL MILLS
BAR MILLS
Products: Steel bars, angles and other products for automotive, construction, farm machinery, metal buildings, furniture and recreational equipment.
Darlington, South Carolina
Norfolk, Nebraska
Jewett, Texas
Plymouth, Utah
Auburn, New York
(Nucor Steel Auburn, Inc.)
Birmingham, Alabama
(Nucor Steel Birmingham, Inc.)
Kankakee, Illinois
(Nucor Steel Kankakee, Inc.)
Jackson, Mississippi
(Nucor Steel Jackson, Inc.)
Seattle, Washington
(Nucor Steel Seattle, Inc.)
Pompano Beach, Florida
(Nucor Steel Services of Florida, Inc.)
SHEET MILLS
Products: Flat-rolled steel for automotive, appliances, pipes and tubes, construction and other industries.
Crawfordsville, Indiana
Hickman, Arkansas
Berkeley County, South Carolina
Decatur, Alabama
(Nucor Steel Decatur, LLC) | | NUCOR-YAMATO STEEL COMPANY
Products: Super-wide flange steel beams, pilings, heavy structural steel products for fabricators, construction companies, manufacturers and steel service centers.
Blytheville, Arkansas
BEAM MILL
Products: Wide flange steel beams, pilings, heavy structural steel products for fabricators, construction companies, manufacturers and steel service centers.
Berkeley County, South Carolina
PLATE MILL
Products: Steel plate for manufacturers of heavy equipment, rail cars, ships and barges, refinery tanks and others.
Hertford County, North Carolina
STEEL PRODUCTS
VULCRAFT
Products: Steel joists, joist girders and steel deck for buildings.
Florence, South Carolina
Norfolk, Nebraska
Fort Payne, Alabama
Grapeland, Texas
St. Joe, Indiana
Brigham City, Utah
Chemung, New York
(Vulcraft of New York, Inc.) | | COLD FINISH
Products: Cold finished steel bars for shafting and precision machined parts.
Norfolk, Nebraska
Darlington, South Carolina
Brigham City, Utah
BUILDING SYSTEMS
Products: Metal buildings and metal building components for commercial, industrial and institutional building markets.
Waterloo, Indiana
Swansea, South Carolina
Terrell, Texas
FASTENER
Products: Steel hexhead cap screws, structural bolts and hex bolts for automotive, machine tools, farm implements, construction and military applications.
St. Joe, Indiana
NUCON STEEL COMMERCIAL CORPORATION
Products: Load bearing light gauge steel framing systems for the commercial and residential construction markets.
Denton, Texas (headquarters)
Dallas, Georgia
CORPORATE OFFICE
Charlotte, North Carolina | |
9
OPERATIONS REVIEW
STEEL MILLS
|
|
BAR MILLS, SHEET MILLS, STRUCTURAL MILLS AND PLATE MILL Nucor operates scrap-based steel mills in sixteen facilities. These mills utilize modern steelmaking techniques and produce steel at a cost competitive with steel manufactured anywhere in the world. |
|
BAR MILLS
Nucor has nine bar mills located in South Carolina, Nebraska, Texas, Utah, New York, Alabama, Illinois, Mississippi and Washington that produce bars, angles and light structural shapes in carbon and alloy steels. These products have wide usage including automotive, construction, farm equipment, metal buildings, furniture and recreational equipment. In constructing Nucor steel mills, capital cost per ton of capacity has been lower than the capital cost generally required for other steel mills. Four of the bar mills were constructed by Nucor between 1969 and 1981. Over the years, Nucor has completed extensive capital projects to keep these facilities modernized, including a modernization of the rolling mill at the Nebraska facility, a new melt shop at the Texas facility, and a new finishing end at the South Carolina facility that are currently underway. In 2001, Nucor purchased substantially all of the assets of Auburn Steel Company, Inc.’s steel bar facility in Auburn, New York for approximately $115,000,000. This facility has the capacity to produce up to 450,000 tons of merchant and special bar quality (SBQ) steel shapes and rebar. On December 9, 2002, Nucor completed the acquisition of substantially all the assets of Birmingham Steel Corporation for a cash purchase price of approximately $615,000,000. The four bar mills acquired from Birmingham can produce up to 2,000,000 tons annually. The total capacity of our nine bar mills is approximately 5,800,000 tons per year.
SHEET MILLS
The sheet mills produce flat-rolled steel for automotive, appliances, pipes and tubes, construction and other industries. The four sheet mills are located in Indiana, Arkansas, South Carolina and Alabama. Nucor constructed three of the sheet mills between 1989 and 1996. The constructed sheet mills utilize thin slab casters to produce hot rolled sheet, which can be further processed through cold rolling and galvanizing. In July 2002, Nucor completed the purchase of substantially all the assets of Trico Steel Company, LLC, for a cash purchase price of $117,700,000. This sheet mill is located in Decatur, Alabama, and has an annual capacity of approximately 1,900,000 tons. The Decatur mill utilizes a medium slab caster, but is still very similar to our sheet mills equipped with thin slab casters. The restart of this acquired mill has progressed quickly, and we expect it to operate at the rated capacity by the fourth quarter of 2003. Total capacity of the four sheet mills is about 8,400,000 tons per year.
STRUCTURAL MILLS
The structural mills produce wide flange steel beams, pilings and heavy structural steel products for fabricators, construction companies, manfacturers and steel service centers. In 1988, Nucor and Yamato Kogyo, one of Japan’s major producers of wide-flange beams, completed construction of a beam mill located near Blytheville, Arkansas. Nucor owns a 51% interest in Nucor-Yamato Steel Company. During 1999, Nucor started operations at its 700,000 tons-per-year steel beam mill in South Carolina. Both mills use a special continuous casting method that produces a beam blank closer in shape to that of the finished beam than traditional methods. Current annual production capacity of our two structural mills is approximately 3,200,000 tons.
PLATE MILL
Nucor’s plate mill is located in North Carolina and produces steel plate for manufacturers of heavy equipment, rail cars, ships, barges, refinery tanks and others. During 2000, Nucor substantially completed construction and began operating the 1,200,000 tons-per-year steel plate mill. The start-up has been successful and the mill is producing high quality plate. With the competitive advantages of new, more efficient production technology and Nucor’s strong customer service orientation, we expect to build a profitable market share position in the plate market.
10
OPERATIONS REVIEW
OPERATIONS Nucor’s steel mills are among the most modern and efficient mills in the United States. Steel scrap is melted in electric arc furnaces and poured into continuous casting systems. Highly sophisticated rolling mills convert the billets and slabs into rebar, angles, rounds, channels, flats, sheet, beams, plate and other products.
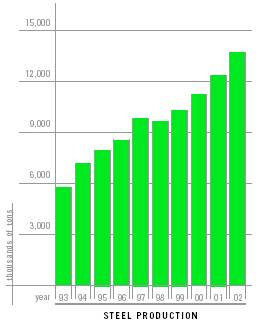
Production in 2002 was a record 13,622,000 tons, an 11% increase from 12,316,000 tons in 2001. Annual production capacity has grown from 120,000 tons in 1970 to a present total of about 18,600,000 tons.
The operations in the rolling mills are highly automated and require fewer operating employees than older mills. All Nucor steel mills have high productivity, which results in employment costs of approximately 11% of the sales dollar. This is lower than the employment costs of integrated steel companies producing comparable products. Employee turnover in our mills is extremely low. All employees have a significant part of their compensation based on their productivity. Production employees work under group incentives that provide increased earnings for increased production. This additional compensation is paid weekly.
Steel mills are large consumers of electricity and gas. However, because of the high efficiency of Nucor steel mills, these energy costs were less than 10% of the sales dollar in 2002.
Scrap and scrap substitutes are the most significant element in the total cost of steel. Their average cost increased to $110 per ton in 2002 from $101 per ton in 2001.
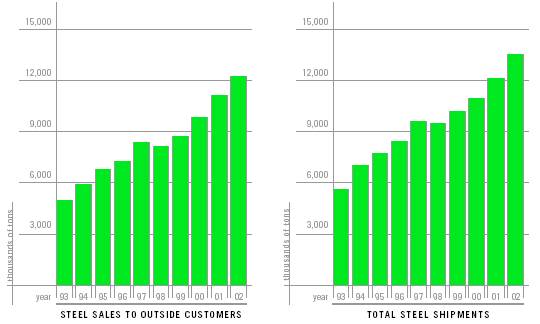
MARKETS AND MARKETING Approximately 90% of the sixteen steel mills’ production in 2002 was sold to outside customers and the balance was used internally by Vulcraft, Cold Finish, Building Systems and Fastener divisions. Steel sales to outside customers in 2002 were a record 12,314,000 tons, 12% higher than the 11,032,000 tons in 2001.
Our steel mill customers are primarily manufacturers, steel service centers and fabricators. An increased focus in our marketing effort is to build long-term relationships with contract customers who purchase more value added products. The basis for these relationships is outstanding quality and service, competitive pricing and the ability to meet our commitments.
TRADE ISSUES Nucor’s continued involvement in trade issues is a critical part of our efforts to support the long-term success of our steel-making operations. Unfairly traded, illegally dumped steel imports have devastated the U.S. steel industry and its workers. As the largest and most open steel market in the world, the U.S. has become the dumping ground for excess steel production. The root causes of the import surges experienced in recent years are foreign overcapacity, foreign government subsidies and foreign anti-competitive practices.
Nucor devoted significant resources to this issue in 2002 in an effort to help the Administration and Congress craft a sensible long-term solution to these critical issues, and will continue our involvement going forward in 2003.
NEWER FACILITIES AND EXPANSIONS During 2000, Nucor started operations of the second caster addition at the steel sheet mill in Berkeley County, South Carolina. This addition cost more than $40,000,000 and increased this mill’s hot-band capacity from 1,500,000 tons to 2,400,000 tons per year. During 2001, Nucor started operations of the second cold rolling facility at the South Carolina sheet mill, increasing this mill’s cold rolled steel capacity from 750,000 tons to 1,500,000 tons per year, at a cost of more than $40,000,000.
The steel plate mill in North Carolina started casting and rolling in October 2000. This facility, which has an annual capacity of 1,200,000 tons, cost about $480,000,000.
At the end of the first quarter of 2001, Nucor completed the acquisition of the assets of Auburn Steel’s merchant bar, rebar, and SBQ steel mill. Nucor Steel Auburn, Inc. is an important addition to our bar mills, as it gives Nucor a merchant bar presence in the Northeast and is also an excellent strategic fit with our new Vulcraft facility in New York. The transition and integration of this business has been extremely successful and has helped us develop our planning for more recent acquisitions.
In February 2002, Nucor announced that over $200,000,000 would be spent on bar mill capital projects over the next three years. The projects include a modernization of the rolling mill at the Nebraska facility, a new melt shop at the Texas mill, and a new finishing end at the South Carolina facility. We expect that these investments will improve efficiencies, lower costs and improve the product quality for the related bar mills.
11
OPERATIONS REVIEW
On July 22, 2002 Nucor’s wholly owned subsidiary, Nucor Steel Decatur, LLC, purchased substantially all the assets of Trico Steel Company, LLC for a purchase price of $117,700,000 million. This 1,900,000-ton sheet mill, located in Decatur, Alabama, began operations in 1997 but had been shut down as the result of bankruptcy. The purchase strategy called for a major renovation of the facility including: the scrap handling system, both electric arc furnaces, the alloy system, the water systems, the tunnel furnace, rolling mill gearing and the finished coil handling equipment. The related capital investment was over $68,000,000 in 2002. Within 60 days of acquisition, our team at Decatur successfully produced its first heat and cast its first slabs. The restart of this mill has continued at a very fast pace, and we expect to produce approximately 1,500,000 tons at Decatur in 2003.
On December 9, 2002, we completed the acquisition of substantially all the assets of Birmingham Steel Corporation for a cash purchase price of approximately $615,000,000, including $116,900,000 in inventory and receivables. Primary assets purchased were four operating steel mills that produce rebar and other bar products and have combined annual capacity of about 2,000,000 tons. These plants are very similar to the ones we have operated, and the employees are not represented by unions. The compatibility of the four purchased bar mills has helped to facilitate what has been a very smooth transition and integration process.
COMMERCIALIZATION OF NEW TECHNOLOGIES Nucor began operations of its 100% owned Castrip facility in Crawfordsville, Indiana in May 2002. This facility uses the breakthrough technology of strip casting, to which Nucor holds exclusive rights in the United States and Brazil. Strip casting involves the direct casting of molten steel into final shape and thickness without further hot or cold rolling. This process allows lower investment and operating costs, reduced energy consumption and smaller scale plants than can be economically built with current technology. This process also reduces the overall environmental impact of producing steel by generating significantly lower emissions, particularly NOx. Our team at Crawfordsville has succeeded in producing prime, saleable coils, and the plant is now staffed to operate 24 hours a day, seven days a week.
In April 2002, Nucor entered a joint venture with The Rio Tinto Group, Mitsubishi Corporation and Chinese steel maker Shougang Corporation, to construct a commercial HIsmelt plant in Kwinana, Western Australia. Demolition of the pilot plant is completed and construction of the commercial facility has begun. The HIsmelt process converts iron ore fines and coal fines to liquid metal, eliminating the need for a blast furnace, sinter/pellet plants and coke ovens. Nucor has a 25% interest in the joint venture that owns the HIsmelt commercial plant.
OUTLOOK FOR THE FUTURE The manufacture of steel will continue to be a key factor in Nucor’s future performance. Total steel production is anticipated to increase significantly over the next several years from the 13,622,000 tons produced in 2002. Nucor expects to obtain additional capacity through expansions at our existing steel mills, greenfield construction or acquisitions. We expect to generate above-average earnings from our steelmaking operations in the future, but recognize that uncertainty in external factors such as the economy and the level of imports will have a significant impact on our results. While we cannot control these outside forces, Nucor has a long-standing tradition of emerging from cyclical downturns stronger than before entering them. We will take advantage of the economic downturn to gain market share, penetrate new markets and emphasize cost reduction and quality improvement initiatives.
12
OPERATIONS REVIEW
13
OPERATIONS REVIEW
STEEL PRODUCTS
|
|
VULCRAFT is the nation’s largest producer of open-web steel joists, joist girders and steel deck, which are used for building construction. |
|
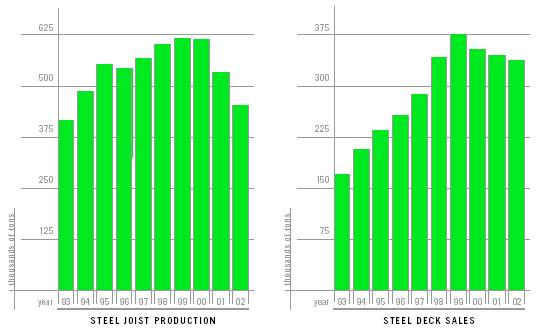
OPERATIONS Steel joists and joist girders are produced and marketed nationally through seven Vulcraft facilities located in South Carolina, Nebraska, Alabama, Texas, Indiana, Utah and New York. Current annual production capacity is more than 685,000 tons. In 2002,Vulcraft produced 462,000 tons of steel joists and joist girders, a decrease of 13% from the 532,000 tons produced in 2001.
Materials, primarily steel, were 51% of the joist sales dollar in 2002. Vulcraft obtained 97% of its steel requirements for joists and joist girders from the Nucor bar mills. For 2002, freight costs for joists and joist girders were less than 10% of the sales dollar. Vulcraft maintains an extensive fleet of trucks to ensure and control on-time delivery.
The Vulcraft facilities in South Carolina, Nebraska, Alabama, Texas, Indiana and New York produce steel deck. Current deck annual production capacity is in excess of 400,000 tons. Vulcraft steel deck sales decreased 4% from 344,000 tons in 2001 to 330,000 tons in 2002. Coiled sheet steel was about 69% of the steel deck sales dollar in 2002. Vulcraft obtained 96% of its steel requirements for steel deck production from the Nucor sheet mills. For 2002, freight costs for deck were less than 10% of the sales dollar.
Almost all of the production employees of Vulcraft work with a group incentive system, which provides increased compensation each week for increased performance.
MARKETS AND MARKETING Steel joists, joist girders and steel decking are used extensively as part of the roof and floor support systems in manufacturing buildings, retail stores, shopping centers, warehouses, schools, churches, hospitals and, to a lesser extent, in multi-story buildings and apartments. Building support systems using joists, joist girders and steel deck are frequently more economical than other systems.
Steel joists and joist girder sales are obtained by competitive bidding. Vulcraft quotes on a significant percentage of the domestic buildings using steel joists and joist girders as part of the support systems. In 2002, Vulcraft supplied more than 40% of total domestic sales of steel joists. Steel deck is specified in the majority of buildings using steel joists and joist girders. In 2002, Vulcraft supplied more than 30% of total domestic sales of steel deck.
Sales of steel joists, joist girders and steel deck are dependent on the non-residential building construction market.
NEWER FACILITIES Nucor began construction on a Vulcraft facility in Chemung, New York (Vulcraft of New York, Inc.) in 2000. Start-up of the facility began in the second half of 2001. This facility produces steel joists, joist girders and steel deck and cost about $50,000,000. The majority of the raw materials for this facility are supplied by Nucor’s steel mills in Auburn, New York and Crawfordsville, Indiana. The Chemung Vulcraft facility represents a continuation of our successful value-added strategy, as well as expansion into a new geographic market for Vulcraft.
OUTLOOK FOR THE FUTURE The depressed level of construction over the past two years has unfavorably impacted the volume of non-residential buildings supplied by Vulcraft. Prevailing economic projections call for continued slow-down of building construction in 2003, which will affect the sales of steel joists, joist girders and steel deck and the earnings of Vulcraft.
14
OPERATIONS REVIEW
15
OPERATIONS REVIEW
|
|
COLD FINISH AND FASTENER Nucor manufactures a variety of products using steel from Nucor mills. |
|
COLD FINISH
Nucor Cold Finish has facilities in Nebraska, South Carolina and Utah. These facilities produce cold drawn and turned, ground and polished steel bars that are used extensively for shafting and precision machined parts. Nucor Cold Finish produces rounds, hexagons, flats and squares in carbon and alloy steels. These bars, in turn, are purchased by the automotive, farm machinery, hydraulic, appliance and electric motor industries, as well as by service centers. Nucor Cold Finish bars are used in tens of thousands of products. A few examples include anchor bolts, farm machinery, hydraulic cylinders, and shafting for air conditioner compressors, ceiling fan motors, garage door openers, electric motors and lawn mowers.
The total capacity of the three facilities is about 350,000 tons per year. All three facilities are among the most modern in the world and use in-line electronic testing to ensure outstanding quality. Nucor Cold Finish obtains most of its steel from the Nucor bar mills. This factor, along with the efficient facilities using the latest technology, results in highly competitive pricing.
In 2002, sales of cold finished steel products were 226,000 tons, an increase of 11% from 2001’s 203,000 tons. The total cold finish market is estimated to be more than 1,800,000 tons. Nucor Cold Finish anticipates opportunities for significant increases in sales and earnings during the next several years.
FASTENER
Nucor Fastener’s state-of-the-art steel bolt-making facility in Indiana produces standard steel hexhead cap screws, hex bolts, structural bolts and custom engineered fasteners. Fasteners are used in a broad range of markets, including automotive, machine tools, farm implements, construction and military applications.
Annual capacity is more than 75,000 tons, which is less than an estimated 20% of the total market for these products. The modern facility allows Nucor Fastener to maintain highly competitive pricing in a market currently dominated by foreign suppliers. This operation is highly automated and has fewer employees than comparable facilities. The Fastener division obtains much of its steel from the Nucor bar mills.

16
OPERATIONS REVIEW
|
|
BUILDING SYSTEMS AND LIGHT GAUGE STEEL FRAMING Nucor manufactures metal buildings and steel framing systems for commercial, industrial and residential construction markets. |
|
BUILDING SYSTEMS
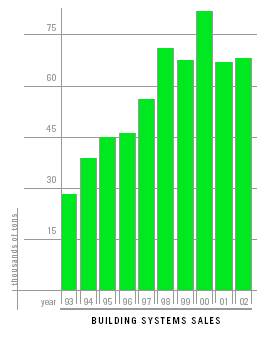
Nucor Building Systems produces pre-engineered metal building systems and components in Indiana, South Carolina and Texas. With the start-up of the building systems facility in Terrell, Texas during 2000, the annual capacity is now more than 145,000 tons. The size of the buildings that can be produced ranges from less than 500 square feet to more than 1,000,000 square feet.
Complete metal building packages can be customized and combined with other materials such as glass, wood and masonry to produce a cost effective, aesthetically pleasing building designed for customers’ special requirements. The buildings are sold through a builder distribution network in order to provide fast-track, customized solutions for building owners.
Building systems sales in 2002 were approximately 68,000 tons, an increase of 5% from the 65,000 tons sold in 2001. The primary markets are commercial, industrial and institutional buildings, including distribution centers, automobile dealerships, retail centers, schools, warehouses and manufacturing facilities. Nucor Building Systems obtains a significant portion of its steel requirements from the Nucor bar and sheet mills.
LIGHT GAUGE STEEL FRAMING
In November 2001, Nucor acquired ITEC Steel, Inc. (now called NUCON STEEL Commercial Corporation). NUCON STEEL specializes in light gauge steel framing systems for the commercial and residential construction markets with facilities in Texas and Georgia. As a leader in the emerging load bearing light gauge steel framing industry, NUCON STEEL will provide Nucor with a platform to enter this rapidly expanding new market. Nucor plans to aggressively broaden NUCON STEEL’s opportunities through geographic expansion and the introduction of new products.
In January 2002, Nucor announced that the company had entered into a strategic alliance with Truswal Systems Corporation. The alliance includes a software development and license agreement for proprietary design, engineering and layout software. NUCON STEEL will use Truswal’s software in its operations and Truswal will market NUCON STEEL’s light gauge steel framing products through its fabricator network.
17
MANAGEMENT’S DISCUSSION AND ANALYSIS OF FINANCIAL CONDITION AND RESULTS OF OPERATIONS
OPERATIONS
Nucor’s business is the manufacture and sale of steel and steel products. During the last five years, the sales of Nucor have increased 11% from $4,340,000,000 in 1997 to $4,802,000,000 in 2002. Total tons sold by Nucor have increased 37% from 9,786,000 tons in 1997 to 13,442,000 tons in 2002. This growth has been generated through acquisitions, continual improvement of existing operations, and greenfield projects using new technologies.
While Nucor has historically grown through greenfield projects and the continual improvement of existing operations, 2002 was noteworthy for two critical acquisitions: the assets of Trico Steel Company, LLC in Decatur, Alabama purchased in July 2002 and the assets of Birmingham Steel Corporation purchased in December 2002. Both of these acquisitions are in the early stages of operating as part of Nucor; however, we are very pleased by the transition progress at these facilities. Since these acquisitions occurred in the latter part of the year, the impact on sales in 2002 was minimal.
Nucor reports its results in two segments, steel mills and steel products. The steel mills segment includes carbon and alloy steel in sheet, bars, structural and plate. The steel products segment includes steel joists and joist girders, steel deck, cold finished steel, steel fasteners, metal building systems and light gauge steel framing.
NET SALES Net sales for 2002 increased 11% to $4,802,000,000, compared with $4,334,000,000 in 2001. The average sales price per ton increased less than 1% from $354 in 2001 to $357 in 2002, while total shipments to outside customers increased 10%. The increase in steel shipments to outside customers occurred in the steel mills segment as imports subsided after March 5, 2002, when President Bush imposed a series of tariffs relating to dumped imported steel. Our steel products segment weakened further in 2002 with lower selling prices and volumes reflecting a depressed non-residential construction market.
Net sales for 2001 decreased 9% to $4,334,000,000, compared with $4,757,000,000 in 2000. The decrease was primarily due to a 17% decrease in average sales price per ton from $425 in 2000 to $354 in 2001. Sales prices were unfavorably impacted at our steel mills segment by increased imports, while the downturn in the economy impacted our steel products segment. The strong sales experienced in 2000 were primarily due to the performance in the first half of the year. In the second half of 2000, demand decreased and import levels increased significantly – a trend that continued in 2001. The decrease in net sales in 2001 was mitigated to some extent by increased volume in our steel mills segment.
Nucor established new annual tonnage records in the steel mills segment for total shipments and shipments to outside customers in 2002. Total shipments were 13,438,000 tons in 2002, compared with 12,141,000 tons in 2001 and 10,980,000 tons in 2000. Steel sales to outside customers were 12,314,000 tons in 2002, compared with 11,032,000 tons in 2001 and 9,779,000 tons in 2000. In the steel products segment, production and shipment volumes were generally lower. Steel joist production for 2002 was 462,000 tons, compared with 532,000 tons in 2001 and 613,000 tons in 2000. Steel deck sales were 330,000 tons in 2002, compared with 344,000 tons in 2001 and 353,000 tons in 2000. Cold finish steel sales were 226,000 tons in 2002, compared with 203,000 tons in 2001 and 250,000 tons in 2000.
COST OF PRODUCTS SOLD The major component of cost of products sold is raw material costs. The average price of raw materials increased 8% from 2001 to 2002. The average price of raw materials in the steel mills segment and the steel products segment increased 9% and 1%, respectively, in 2002. The average scrap and scrap substitute cost per ton used in our steel mills segment was $110 in 2002, an increase of 9% from $101 in 2001. By the fourth quarter of 2002, the average scrap cost per ton used had increased to $118.
The average price of raw materials decreased 13% from 2000 to 2001. The average price of raw materials in the steel mills segment and the steel products segment decreased by 14% and 10%, respectively, in 2001. The average scrap and scrap substitute cost per ton used in our steel mills segment decreased 16% to $101 in 2001 from $120 in 2000.
In December 2000, Nucor entered into a consent decree with the United States Environmental Protection Agency (“USEPA”) and certain states in order to resolve alleged environmental violations. Under the terms of this decree, Nucor will conduct testing at some of its facilities, perform corrective action where necessary, and pilot certain pollution control technologies. In conjunction with the consent decree, and other necessary facility remediation, Nucor increased environmental reserves by approximately $36,000,000 in 2000.
During 2001, Nucor made $21,000,000 in cash payments for remedial efforts including a $9,000,000 penalty payment to the USEPA in conjunction with the consent decree and $6,000,000 as a minimum settlement for a particular cleanup. Nucor also made net reductions to reserves of approximately $4,000,000 in 2001. As part of the consent decree, Resource Conservation and Recovery Act site initial assessments were nearly completed which more clearly defined probable exposures.
18
MANAGEMENT’S DISCUSSION AND ANALYSIS OF FINANCIAL CONDITION AND RESULTS OF OPERATIONS
During 2002, Nucor revised estimates for environmental reserves as additional information became available. Nucor made approximately $6,000,000 in cash payments for remedial efforts during 2002 and made approximately $23,000,000 in net reductions to reserves. The most significant components of the decrease related to an agreement with the USEPA that certain technologies identified in the consent decree were not feasible and a favorable court ruling that implicated additional potentially responsible parties for the cleanup of an off-site waste-recycling facility.
GROSS MARGIN Gross margins were 10% in 2002 and 2001 and 17% in 2000. In addition to the net sales and cost of products sold factors discussed above, gross margins were affected by pre-operating and start-up costs at several Nucor facilities. Pre-operating and start-up costs of new facilities were $84,400,000 in 2002, compared with $97,800,000 in 2001 and $50,900,000 in 2000. In 2002, these costs primarily related to the start-up of the newly acquired sheet mill in Decatur, Alabama ($31,400,000) and the new Castrip facility at our sheet mill in Crawfordsville, Indiana ($23,500,000). In 2001, these costs primarily related to the start-up of the new plate mill in Hertford County, North Carolina and the new Vulcraft facility in Chemung, New York.
We expect our Decatur facility to operate near full capacity by the fourth quarter of 2003 and start-up expenses to be completed in that period. Our Castrip facility is an experimental implementation of a new steel making technology; therefore, it is uncertain when start-up expenses for that operation will end.
MARKETING, ADMINISTRATIVE AND OTHER EXPENSES The major components of marketing, administrative and other expenses are freight and profit sharing costs. Unit freight costs were unchanged from 2001 to 2002. Profit sharing costs, which are based upon and fluctuate with pre-tax earnings, increased by 69% from 2001 to 2002. Unit freight costs increased less than 5% from 2000 to 2001. Profit sharing costs decreased 73% from 2000 to 2001. In 2000, profit sharing costs included over $6,200,000 for an extraordinary bonus paid to employees for the achievement of record earnings during the year. Every employee except for senior officers received $800.
INTEREST EXPENSE (INCOME) Interest expense, net of interest income, increased in 2002 and 2001 as a result of increased average long-term debt and decreased average interest rates earned on short-term investments.
MINORITY INTERESTS Minority interests represent the income attributable to the minority partners of Nucor’s less than 100% owned joint venture, Nucor-Yamato Steel Company. Income attributable to minority interests was approximately $79,500,000 in 2002, $103,100,000 in 2001 and $151,500,000 in 2000. Cash distributions to minority interests were $146,700,000 in 2002, $120,500,000 in 2001 and $119,900,000 in 2000. Under the partnership agreement, the minimum amount of cash to be distributed each year to the partners of Nucor-Yamato Steel Company is the amount needed by each partner to pay applicable U.S. federal and state income taxes. In 2002 and 2001, the amount of cash distributed to minority interests exceeded amounts allocated to minority interests based on mutual agreement of the general partners; however, the cumulative amount of cash distributed to partners was less than the cumulative net earnings of the partnership.
OTHER INCOME In the second quarter of 2002, Nucor received $29,900,000 related to a graphite electrodes anti-trust settlement. In 2001, Nucor sold Nucor Iron Carbide, Inc. in Trinidad, resulting in a pre-tax gain of $20,200,000.
PROVISION FOR INCOME TAXES The effective tax rate was 29.55% in 2002 compared with 37.02% in 2001 and 37.00% in 2000. The lower tax rate in 2002 is primarily due to state income tax credits recognized in 2002. In the fourth quarter of 2002, Nucor recorded state income tax credits of $16,200,000, of which $6,100,000 is non-recurring.
NET EARNINGS The increase in 2002 net earnings resulted primarily from increased volume in the steel mills segment, partly offset by a decline in volume and earnings in the steel products segment caused by a depressed non-residential construction market. In addition, the increase in net earnings in 2002 compared to 2001 was attributable to decreased pre-operating and start-up costs, increased other income related to the graphite electrodes anti-trust settlement, and reductions in environmental reserves due to changes in estimates.
The decrease in 2001 earnings resulted primarily from decreased margins and increased pre-operating and start-up costs, partially offset by decreased profit sharing costs and decreased income taxes. Nucor’s net earnings were also favorably affected in the fourth quarter of 2001 by a gain of $20,200,000 related to the sale of Nucor Iron Carbide, Inc.
Earnings were 7% of average equity in 2002, compared with 5% in 2001 and 14% in 2000.
19
MANAGEMENT’S DISCUSSION AND ANALYSIS OF FINANCIAL CONDITION AND RESULTS OF OPERATIONS
LIQUIDITY AND CAPITAL RESOURCES
In 2002, working capital decreased 6% from $889,500,000 to $832,600,000. The current ratio was 2.4 in 2002, 2.8 in 2001 and 2.5 in 2000. We have a simple capital structure with no off-balance sheet arrangements or relationships with unconsolidated special purpose entities. Nucor sometimes uses natural gas purchase contracts to partially manage its exposure to the price risk of natural gas which is used during the manufacturing process. The use of these contracts is immaterial for all periods presented.
OPERATING ACTIVITIES Nucor generated cash provided by operating activities of $497,200,000 in 2002, compared with $495,100,000 in 2001 and $820,800,000 in 2000. Gross margins deteriorated in 2002 and 2001 due to depressed market conditions and increased pre-operating and start-up costs of new facilities. Additionally, in 2002, changes in operating assets and liabilities (exclusive of acquisitions and dispositions) used cash of $82,600,000, compared with changes in operating assets and liabilities using cash of $2,700,000 in 2001 and providing cash of $79,000,000 in 2000.
INVESTING ACTIVITIES Cash used in investing activities increased to $901,400,000 in 2002 compared with $360,400,000 in 2001 and $410,300,000 in 2000. Capital expenditures for new facilities and expansion of existing facilities decreased to $243,600,000 in 2002 compared with $261,100,000 in 2001 and $415,400,000 in 2000.
On July 22, 2002, Nucor acquired substantially all of the assets of Trico Steel Company, LLC (“Trico”) for a purchase price of $117,700,000. On December 9, 2002, Nucor acquired substantially all of the assets of Birmingham Steel Corporation (“Birmingham Steel”) for a cash purchase price excluding transaction costs of approximately $615,000,000, including $116,900,000 in inventory and receivables. In connection with these acquisitions, Nucor assumed $86,000,000 in bonds and $17,400,000 in other liabilities.
During 2001, Nucor sold Nucor Iron Carbide, Inc. and sold the assets of the Nucor Bearing Products facility. Total proceeds from these two sales as well as the sale of other equipment at existing facilities were $22,700,000 in 2001. Also in 2001, Nucor purchased substantially all of the assets of Auburn Steel Company, Inc.’s steel bar facility in Auburn, New York for approximately $115,000,000 and acquired ITEC Steel, Inc. (now called NUCON STEEL Commercial Corporation) for approximately $7,000,000 (excluding liabilities assumed).
FINANCING ACTIVITIES Cash provided by financing activities was $160,800,000 in 2002, compared with cash used in financing activities of $162,900,000 in 2001 and $492,100,000 in 2000. On October 1, 2002, Nucor issued $350,000,000 aggregate principal amount of 4.875% notes due 2012. During 2002 Nucor retired $1,900,000 aggregate principal amount of industrial revenue bonds. No additional long-term debt was incurred in 2001. Net long-term debt borrowings were $70,000,000 in 2000. Existing cash and short-term investments, and the $350,000,000 in new notes, funded the acquisition of the assets of Trico and Birmingham Steel in 2002. The acquisitions of the bar mill in Auburn, New York and of ITEC Steel, Inc. in 2001 were funded by Nucor’s existing cash and short-term investments. Unused long-term credit facilities total $425,000,000 at the end of 2002. The percentage of long-term debt to total capital (long-term debt plus minority interests plus stockholders’ equity) was 26% in 2002 and 16% in both 2001 and 2000.
Nucor’s directors have approved the purchase of up to 15,000,000 shares of Nucor common stock. There were no repurchases during 2002 or 2001. Since the inception of the stock repurchase program in 1998, a total of approximately 10,800,000 shares have been repurchased at a cost of about $444,500,000.
MARKET RISK Some of Nucor’s industrial revenue bonds have variable interest rates that are adjusted weekly, monthly or annually. Future changes in interest rates are not expected to significantly impact earnings. Additionallly, Nucor entered into an interest rate swap agreement, converting a note payable of $175,000,000 from a fixed rate obligation to a variable rate obligation. Nucor’s remaining debt is at fixed rates. Nucor’s investment practice is to invest in securities that are highly liquid with short maturities. As a result, we do not expect changes in interest rates to have a significant impact on the value of our investment securities.
20
MANAGEMENT’S DISCUSSION AND ANALYSIS OF FINANCIAL CONDITION AND RESULTS OF OPERATIONS
CONTRACTUAL OBLIGATIONS AND OTHER COMMERCIAL COMMITMENTS The following table sets forth our contractual obligations and other commercial commitments as of December 31, 2002, not including related interest expense, if any, for the periods presented.
| | Payments Due By Period | |
| |
| |
Contractual Obligations | | Total | | Less than 1 year | | 1-3 years | | 4-5 years | | After 5 years | |
| |
| |
| |
| |
| |
| |
Long-term debt | | $ | 894,550,000 | | $ | 16,000,000 | | $ | 1,250,000 | | $ | — | | $ | 877,300,000 | |
Operating leases | | 4,013,000 | | 1,083,000 | | 2,679,000 | | 251,000 | | — | |
Unconditional purchase obligations(1) | | 60,736,000 | | 60,003,000 | | 733,000 | | — | | — | |
Other long-term obligations(2) | | 45,897,000 | | 34,653,000 | | 11,244,000 | | — | | — | |
| |
| |
| |
| |
| |
| |
Total contractual cash obligations | | $ | 1,005,196,000 | | $ | 111,739,000 | | $ | 15,906,000 | | $ | 251,000 | | $ | 877,300,000 | |
| |
|
| |
|
| |
|
| |
|
| |
|
| |
| | Amount of Commitment Expiration Per Period | |
| |
| |
Other Commercial Commitments | | Total Amounts
Committed | | Less than 1 year | | 1-3 years | | 4-5 years | | After 5 years | |
| |
| |
| |
| |
| |
| |
Guarantees(3) | | $ | 3,500,000 | | $ | 3,500,000 | | $ | — | | $ | — | | $ | — | |
| |
|
| |
|
| |
|
| |
|
| |
|
| |
(1) Purchase obligations on operating machinery and equipment.
(2) Our share of estimated costs to construct and start-up the joint venture HIsmelt mill in Western Australia.
(3) Financial guarantees on environmental remediation.
OUTLOOK Nucor’s objective is to maintain a strong balance sheet. Capital expenditures are currently projected to be less than $300,000,000 in 2003. Funds provided from operations, existing credit facilities and new borrowings are expected to be adequate to meet future capital expenditure and working capital requirements for existing operations. Nucor believes that it has the financial ability to borrow significant additional funds and still maintain reasonable leverage in order to finance major acquisitions.
The past year was one of the toughest that the steel industry has experienced in decades. Nucor’s earnings in 2003 will be impacted by the state of the economy, specifically the construction industry, and the maintenance and implementation of remedies for relief from dumped steel imports.
CRITICAL ACCOUNTING POLICIES AND ESTIMATES
Our discussion and analysis of our financial condition and results of operations are based upon our consolidated financial statements, which have been prepared in accordance with accounting principles generally accepted in the United States of America. The preparation of these financial statements requires us to make estimates and assumptions that affect the reported amounts of assets and liabilities, the disclosure of contingent assets and liabilities at year-end, and the reported amount of revenues and expenses during the year. On an ongoing basis, we evaluate our estimates, including those related to the valuation allowances for receivables, the carrying value of property, plant and equipment and environmental obligations. Our estimates are based on historical experience and various other assumptions that we believe to be reasonable under the circumstances, the results of which form the basis for making judgments about the carrying values of assets and liabilities that are not readily apparent from other sources. Accordingly, actual costs could differ materially from these estimates under different assumptions or conditions.
We believe the following critical accounting policies affect our significant judgments and estimates used in the preparation of our consolidated financial statements
ALLOWANCES FOR DOUBTFUL ACCOUNTS We maintain allowances for doubtful accounts for estimated losses resulting from the inability of our customers to make required payments. If the financial condition of our customers were to deteriorate, resulting in an impairment of their ability to make payments, additional allowances may be required.
ASSET IMPAIRMENTS We evaluate the impairment of our property, plant and equipment on an individual asset basis or by logical groupings of assets. Asset impairments are recognized whenever changes in circumstances indicate that the carrying amount of those productive assets exceeds their aggregate projected undiscounted cash flows.
ENVIRONMENTAL REMEDIATION We are subject to environmental laws and regulations established by federal, state and local authorities, and make provision for the estimated costs related to compliance. Undiscounted remediation liabilities are accrued based on estimates of known environmental exposures. The accruals are reviewed periodically and, as investigations and remediation proceed, adjustments are made as we believe are necessary. The accruals are not reduced by possible recoveries from insurance carriers or other third parties, and do not reflect anticipated allocations among potentially responsible parties at federal Superfund sites or similar state-managed sites after an assessment is made of the likelihood that such parties will fulfill their obligations at such sites. Our measurement of environmental liabilities is based on currently available facts, present laws and regulations, and current technology.
21
SIX-YEAR FINANCIAL REVIEW
| | 2002 | | 2001 | | 2000 | | 1999 | | 1998 | | 1997 | |
| |
| |
| |
| |
| |
| |
| |
FOR THE YEAR | | | | | | | | | | | | | |
Net sales | | $ | 4,801,776,537 | | $ | 4,333,706,754 | | $ | 4,756,521,134 | | $ | 4,158,293,140 | | $ | 4,305,450,408 | | $ | 4,339,951,794 | |
Costs and expenses: | | | | | | | | | | | | | |
Cost of products sold | | 4,332,277,330 | | 3,914,278,371 | | 3,929,181,904 | | 3,531,896,413 | | 3,632,637,842 | | 3,625,212,399 | |
Marketing, administrative and other expenses | | 175,588,347 | | 150,665,488 | | 183,175,557 | | 154,773,600 | | 147,973,101 | | 145,409,693 | |
Interest expense (income) | | 14,285,934 | | 6,525,057 | | (816,104 | ) | (5,095,299 | ) | (3,832,252 | ) | (35,318 | ) |
Minority interests | | 79,471,911 | | 103,068,831 | | 151,461,789 | | 85,783,332 | | 91,641,121 | | 90,516,580 | |
Other income | | (29,900,000 | ) | (20,200,000 | ) | — | | — | | — | | — | |
| |
| |
| |
| |
| |
| |
| |
| | 4,571,723,522 | | 4,154,337,747 | | 4,263,003,146 | | 3,767,358,046 | | 3,868,419,812 | | 3,861,103,354 | |
Earnings before income taxes | | 230,053,015 | | 179,369,007 | | 493,517,988 | | 390,935,094 | | 437,030,596 | | 478,848,440 | |
Provision for income taxes | | 67,973,000 | | 66,408,000 | | 182,610,000 | | 146,346,000 | | 173,322,000 | | 184,366,000 | |
| |
| |
| |
| |
| |
| |
| |
Net earnings | | 162,080,015 | | 112,961,007 | | 310,907,988 | | 244,589,094 | | 263,708,596 | | 294,482,440 | |
Net earnings per share: | | | | | | | | | | | | | |
Basic | | 2.08 | | 1.45 | | 3.80 | | 2.80 | | 3.00 | | 3.35 | |
Diluted | | 2.07 | | 1.45 | | 3.80 | | 2.80 | | 3.00 | | 3.35 | |
Dividends declared per share | | .76 | | .68 | | .60 | | .52 | | .48 | | .40 | |
Percentage of earnings to sales | | 3.4 | % | 2.6 | % | 6.5 | % | 5.9 | % | 6.1 | % | 6.8 | % |
Return on average equity | | 7.2 | % | 5.2 | % | 14.2 | % | 11.3 | % | 13.4 | % | 16.9 | % |
Capital expenditures | | 243,598,096 | | 261,145,658 | | 415,404,602 | | 374,717,759 | | 502,910,263 | | 306,749,422 | |
Depreciation | | 307,101,032 | | 289,063,213 | | 259,365,173 | | 256,637,460 | | 264,038,622 | | 218,764,101 | |
Sales per employee | | 527,581 | | 530,961 | | 619,379 | | 568,112 | | 613,574 | | 645,682 | |
| |
| |
| |
| |
| |
| |
| |
| | | | | | | | | | | | | |
AT YEAR END | | | | | | | | | | | | | |
Current assets | | $ | 1,424,138,700 | | $ | 1,373,665,916 | | $ | 1,379,529,050 | | $ | 1,538,508,511 | | $ | 1,129,467,383 | | $ | 1,125,508,464 | |
Current liabilities | | 591,535,828 | | 484,158,726 | | 558,068,452 | | 531,030,898 | | 486,897,157 | | 524,453,610 | |
| |
| |
| |
| |
| |
| |
| |
Working capital | | 832,602,872 | | 889,507,190 | | 821,460,598 | | 1,007,477,613 | | 642,570,226 | | 601,054,854 | |
Current ratio | | 2.4 | | 2.8 | | 2.5 | | 2.9 | | 2.3 | | 2.1 | |
Property, plant and equipment | | 2,932,058,102 | | 2,365,655,061 | | 2,329,420,798 | | 2,180,419,463 | | 2,086,158,459 | | 1,858,874,894 | |
Total assets | | 4,381,001,217 | | 3,759,348,176 | | 3,710,867,705 | | 3,718,927,974 | | 3,215,625,842 | | 2,984,383,358 | |
Long-term debt | | 878,550,000 | | 460,450,000 | | 460,450,000 | | 390,450,000 | | 215,450,000 | | 167,950,000 | |
Percentage of debt to capital | | 26.0 | % | 15.6 | % | 15.9 | % | 13.4 | % | 8.4 | % | 7.2 | % |
Stockholders’ equity | | 2,322,989,489 | | 2,201,460,329 | | 2,130,951,640 | | 2,262,247,906 | | 2,072,551,781 | | 1,876,425,866 | |
Per share | | 29.71 | | 28.29 | | 27.47 | | 25.96 | | 23.73 | | 21.32 | |
Shares outstanding | | 78,180,108 | | 77,814,511 | | 77,582,948 | | 87,133,737 | | 87,352,906 | | 87,996,583 | |
Stockholders | | 64,000 | | 47,000 | | 51,000 | | 55,000 | | 62,000 | | 50,000 | |
Employees | | 9,800 | | 8,400 | | 7,900 | | 7,500 | | 7,200 | | 6,900 | |
| |
| |
| |
| |
| |
| |
| |
Certain amounts for prior years have been reclassified to conform to the 2002 presentation.
25
CONSOLIDATED STATEMENTS OF EARNINGS AND STOCKHOLDERS’ EQUITY
CONSOLIDATED STATEMENTS OF EARNINGS
Year Ended December 31, | | 2002 | | 2001 | | 2000 | |
| |
| |
| |
| |
| | | | | | | |
NET SALES | | $ | 4,801,776,537 | | $ | 4,333,706,754 | | $ | 4,756,521,134 | |
| |
|
| |
|
| |
|
| |
COSTS AND EXPENSES: | | | | | | | |
Cost of products sold | | 4,332,277,330 | | 3,914,278,371 | | 3,929,181,904 | |
Marketing, administrative and other expenses | | 175,588,347 | | 150,665,488 | | 183,175,557 | |
Interest expense (income), net (Note 10) | | 14,285,934 | | 6,525,057 | | (816,104 | ) |
Minority interests | | 79,471,911 | | 103,068,831 | | 151,461,789 | |
Other income (Note 11) | | (29,900,000 | ) | (20,200,000 | ) | — | |
| |
| |
| |
| |
| | 4,571,723,522 | | 4,154,337,747 | | 4,263,003,146 | |
| |
| |
| |
| |
EARNINGS BEFORE INCOME TAXES | | 230,053,015 | | 179,369,007 | | 493,517,988 | |
PROVISION FOR INCOME TAXES (Note 12) | | 67,973,000 | | 66,408,000 | | 182,610,000 | |
| |
| |
| |
| |
NET EARNINGS | | $ | 162,080,015 | | $ | 112,961,007 | | $ | 310,907,988 | |
| |
|
| |
|
| |
|
| |
NET EARNINGS PER SHARE (Note 13): | | | | | | | |
| | | | | | | |
Basic | | $ | 2.08 | | $ | 1.45 | | $ | 3.80 | |
| |
|
| |
|
| |
|
| |
Diluted | | $ | 2.07 | | $ | 1.45 | | $ | 3.80 | |
| |
|
| |
|
| |
|
| |
See notes to consolidated financial statements.
CONSOLIDATED STATEMENTS OF STOCKHOLDERS’ EQUITY
| | COMMON STOCK | | | | | | TREASURY STOCK
(at cost) | |
| |
| | | | | |
| |
| | Shares | | Amount | | ADDITIONAL
PAID-IN
CAPITAL | | RETAINED
EARNINGS | | Shares | | Amount | |
|
|
| |
| |
| |
| |
| |
| |
BALANCES, December 31, 1999 | | 90,102,518 | | $ | 36,041,007 | | $ | 70,906,567 | | $ | 2,216,091,023 | | 2,968,781 | | $ | 60,790,691 | |
| |
| |
|
| |
|
| |
|
| |
| |
|
| |
Net earnings in 2000 | | | | | | | | 310,907,988 | | | | | |
Employee stock options | | 9,620 | | 3,848 | | 409,508 | | | | | | | |
Employee stock compensation and service awards | | | | | | 401,879 | | | | (108,647 | ) | (3,921,444 | ) |
Treasury stock acquired | | | | | | (223,284 | ) | | | 9,669,056 | | 398,504,348 | |
Cash dividends ($.60 per share) | | | | | | | | (48,213,301 | ) | | | | |
| |
| |
| |
| |
| |
| |
| |
BALANCES, December 31, 2000 | | 90,112,138 | | 36,044,855 | | 71,494,670 | | 2,478,785,710 | | 12,529,190 | | 455,373,595 | |
| |
| |
| |
| |
| |
| |
| |
Net earnings in 2001 | | | | | | | | 112,961,007 | | | | | |
Employee stock options | | 214,253 | | 85,701 | | 8,830,541 | | | | | | | |
Employee stock compensation and service awards | | | | | | 864,944 | | | | (17,310 | ) | (629,219 | ) |
Cash dividends ($.68 per share) | | | | | | | | (52,862,723 | ) | | | | |
| |
| |
| |
| |
| |
| |
| |
BALANCES, December 31, 2001 | | 90,326,391 | | 36,130,556 | | 81,190,155 | | 2,538,883,994 | | 12,511,880 | | 454,744,376 | |
| |
| |
| |
| |
| |
| |
| |
Net earnings in 2002 | | | | | | �� | | 162,080,015 | | | | | |
Employee stock options | | 352,242 | | 140,897 | | 16,088,074 | | | | | | | |
Employee stock compensation and service awards | | | | | | 2,117,577 | | | | (13,355 | ) | (485,454 | ) |
Cash dividends ($.76 per share) | | | | | | | | (59,382,857 | ) | | | | |
| |
| |
| |
| |
| |
| |
| |
BALANCES, December 31, 2002 | | | 90,678,633 | | $ | 36,271,453 | | $ | 99,395,806 | | $ | 2,641,581,152 | | 12,498,525 | | $ | 454,258,922 | |
| |
|
| |
|
| |
|
| |
|
| |
| |
|
| |
See notes to consolidated financial statements.
26
CONSOLIDATED BALANCE SHEETS
December 31, | | 2002 | | 2001 | |
| |
| |
| |
| | | | | |
ASSETS | | | | | |
CURRENT ASSETS: | | | | | |
Cash and short-term investments | | $ | 219,004,868 | | $ | 462,348,547 | |
Accounts receivable (Note 2) | | 483,607,972 | | 330,855,074 | |
Inventories (Note 3) | | 588,989,548 | | 466,690,217 | |
Other current assets | | 132,536,312 | | 113,772,078 | |
| |
| |
| |
Total current assets | | 1,424,138,700 | | 1,373,665,916 | |
PROPERTY, PLANT AND EQUIPMENT (Note 4) | | 2,932,058,102 | | 2,365,655,061 | |
OTHER ASSETS | | 24,804,415 | | 20,027,199 | |
| |
| |
| |
| | $ | 4,381,001,217 | | $ | 3,759,348,176 | |
| |
|
| |
|
| |
| | | | | |
LIABILITIES AND STOCKHOLDERS’ EQUITY | | | | | |
CURRENT LIABILITIES: | | | | | |
Long-term debt due within one year (Note 5) | | $ | 16,000,000 | | $ | — | |
Accounts payable | | 247,229,067 | | 189,235,046 | |
Federal income taxes | | 8,948,999 | | — | |
Salaries, wages and related accruals | | 116,246,817 | | 92,769,688 | |
Accrued expenses and other current liabilities (Note 8) | | 203,110,945 | | 202,153,992 | |
| |
| |
| |
Total current liabilities | | 591,535,828 | | 484,158,726 | |
| |
| |
| |
LONG-TERM DEBT DUE AFTER ONE YEAR (Note 5) | | 878,550,000 | | 460,450,000 | |
| |
| |
| |
DEFERRED CREDITS AND OTHER LIABILITIES (Notes 8, 9 and 12) | | 371,271,399 | | 329,392,145 | |
| |
| |
| |
MINORITY INTERESTS | | 216,654,501 | | 283,886,976 | |
| |
| |
| |
STOCKHOLDERS’ EQUITY (Note 6): | | | | | |
Common stock | | 36,271,453 | | 36,130,556 | |
Additional paid-in capital | | 99,395,806 | | 81,190,155 | |
Retained earnings | | 2,641,581,152 | | 2,538,883,994 | |
| |
| |
| |
| | 2,777,248,411 | | 2,656,204,705 | |
Treasury stock | | (454,258,922 | ) | (454,744,376 | ) |
| |
| |
| |
Total stockholders’ equity | | 2,322,989,489 | | 2,201,460,329 | |
| |
| |
| |
| | $ | 4,381,001,217 | | $ | 3,759,348,176 | |
| |
|
| |
|
| |
See notes to consolidated financial statements.
27
CONSOLIDATED STATEMENTS OF CASH FLOWS
Year Ended December 31, | | 2002 | | 2001 | | 2000 | |
| |
| |
| |
| |
| | | | | | | |
OPERATING ACTIVITIES | | | | | | | |
Net earnings | | $ | 162,080,015 | | $ | 112,961,007 | | $ | 310,907,988 | |
Adjustments: | | | | | | | |
Depreciation | | 307,101,032 | | 289,063,213 | | 259,365,173 | |
Gain on sale of facility | | — | | (20,200,000 | ) | — | |
Deferred income taxes | | 31,200,000 | | 13,000,000 | | 20,200,000 | |
Minority interests | | 79,468,625 | | 103,034,717 | | 151,275,438 | |
Changes in (exclusive of acquisitions and dispositions): | | | | | | | |
Accounts receivable | | (99,777,898 | ) | 33,788,641 | | 43,579,322 | |
Inventories | | (58,371,867 | ) | 26,302,845 | | 3,831,738 | |
Accounts payable | | 57,994,021 | | (20,991,631 | ) | (51,895,123 | ) |
Accrued environmental costs | | (22,192,000 | ) | (25,187,000 | ) | 30,932,000 | |
Other | | 39,717,977 | | (16,656,467 | ) | 52,558,131 | |
| |
| |
| |
| |
Cash provided by operating activities | | 497,219,905 | | 495,115,325 | | 820,754,667 | |
| |
| |
| |
| |
| | | | | | | |
INVESTING ACTIVITIES | | | | | | | |
Capital expenditures | | (243,598,096 | ) | (261,145,658 | ) | (415,404,602 | ) |
Investment in affiliates | | (5,573,268 | ) | — | | — | |
Disposition of plant and equipment | | 448,546 | | 22,650,119 | | 5,128,217 | |
Acquisitions (net of cash acquired) | | (652,688,811 | ) | (121,904,000 | ) | — | |
| |
| |
| |
| |
Cash used in investing activities | | (901,411,629 | ) | (360,399,539 | ) | (410,276,385 | ) |
| |
| |
| |
| |
| | | | | | | |
FINANCING ACTIVITIES | | | | | | | |
Increase in long-term debt | | 350,000,000 | | — | | 70,000,000 | |
Repayment of long-term debt | | (1,900,000 | ) | — | | — | |
Issuance of common stock | | 18,832,002 | | 10,410,405 | | 4,736,679 | |
Distributions to minority interests | | (146,701,100 | ) | (120,491,200 | ) | (119,883,200 | ) |
Cash dividends | | (59,382,857 | ) | (52,862,723 | ) | (48,213,301 | ) |
Acquisition of treasury stock | | — | | — | | (398,727,632 | ) |
| |
| |
| |
| |
Cash provided by (used in) financing activities | | 160,848,045 | | (162,943,518 | ) | (492,087,454 | ) |
| |
| |
| |
| |
| | | | | | | |
DECREASE IN CASH AND SHORT-TERM INVESTMENTS | | (243,343,679 | ) | (28,227,732 | ) | (81,609,172 | ) |
CASH AND SHORT-TERM INVESTMENTS – BEGINNING OF YEAR | | 462,348,547 | | 490,576,279 | | 572,185,451 | |
| |
| |
| |
| |
CASH AND SHORT-TERM INVESTMENTS – END OF YEAR | | $ | 219,004,868 | | $ | 462,348,547 | | $ | 490,576,279 | |
| |
|
| |
|
| |
|
| |
See notes to consolidated financial statements.
28
NOTES TO CONSOLIDATED FINANCIAL STATEMENTS
YEARS ENDED DECEMBER 31, 2002, 2001 AND 2000
1. SUMMARY OF SIGNIFICANT ACCOUNTING POLICIES:
NATURE OF OPERATIONS Nucor is a domestic manufacturer of steel products whose customers are located primarily in the United States of America.
PRINCIPLES OF CONSOLIDATION The consolidated financial statements include Nucor and all of its subsidiaries. All significant intercompany transactions are eliminated. Investments in joint ventures with ownership of 50% or less are accounted for under the equity method. Distributions are made to minority interest partners in Nucor-Yamato Steel Company in accordance with the limited partnership agreement by mutual agreement of the general partners. At a minimum, sufficient cash is distributed so that each partner may pay applicable U.S. federal and state income taxes payable.
CASH AND SHORT-TERM INVESTMENTS Short-term investments are recorded at cost plus accrued interest, which approximates market, and have original maturities of three months or less at the date of purchase. Cash and short-term investments are maintained primarily with a few high-credit quality financial institutions.
INVENTORIES VALUATION Inventories are stated at the lower of cost or market. Cost is determined principally using the last-in, first-out (LIFO) method of accounting.
PROPERTY, PLANT AND EQUIPMENT Property, plant and equipment are stated at cost. Depreciation is provided on a straight-line basis over the estimated useful lives of the assets. Repairs and maintenance are expensed on a pro-rata basis throughout the year. Long-lived assets are reviewed for impairment whenever changes in circumstances indicate that the carrying amount of the assets may not be recoverable.
NATURAL GAS CONTRACTS Nucor sometimes uses natural gas purchase contracts to partially manage its exposure to the price risk of natural gas used during the manufacturing process. The use of these contracts is immaterial for all periods presented.
REVENUE RECOGNITION Revenue is recognized at the time products are shipped to customers. Prior to 2002, some of the shipping costs incurred were recorded in net sales as an offset to the amounts billed to customers for the shipping costs. Nucor has reclassified the shipping costs as cost of products sold for all years presented. The effect of the reclassifications increased net sales and cost of products sold by $233,500,854, $194,458,176 and $170,375,153 in 2002, 2001 and 2000, respectively. Operating results were not affected by the reclassification. Internal fleet and some common carrier costs are included in marketing, administrative and other expenses. These costs included in marketing, administrative and other expenses were $43,917,530 in 2002, $48,282,035 in 2001 and $52,949,732 in 2000.
ACCOUNTING FOR STOCK OPTIONS Nucor accounts for stock options granted to employees and directors using the intrinsic value method, under which no compensation expense is recorded since the exercise price of the stock options is equal to the market price of the underlying stock on the grant date. Had compensation cost for the stock options issued been determined consistent with FASB Statement No. 123, “Accounting for Stock-Based Compensation” (“SFAS No. 123”), net earnings and net earnings per share would have been reduced to the following pro forma amounts:
Year Ended December 31, | | 2002 | | 2001 | | 2000 | |
| |
| |
| |
| |
Net earnings – as reported | | $ | 162,080,015 | | $ | 112,961,007 | | $ | 310,907,988 | |
Pro forma stock-based compensation cost | | (5,172,756 | ) | (4,463,762 | ) | (4,324,257 | ) |
| |
| |
| |
| |
Net earnings – pro forma | | $ | 156,907,259 | | $ | 108,497,245 | | $ | 306,583,731 | |
| |
|
| |
|
| |
|
| |
Net earnings per share – as reported: | | | | | | | |
Basic | | $ | 2.08 | | $ | 1.45 | | $ | 3.80 | |
Diluted | | 2.07 | | 1.45 | | 3.80 | |
Net earnings per share – pro forma: | | | | | | | |
Basic | | 2.02 | | 1.40 | | 3.75 | |
Diluted | | | 2.01 | | | 1.40 | | | 3.75 | |
USE OF ESTIMATES The preparation of financial statements in conformity with generally accepted accounting principles in the United States of America requires management to make estimates and assumptions that affect the amounts reported in the financial statements and accompanying notes. Actual costs could differ from these estimates.
RECLASSIFICATIONS Certain amounts for prior years have been reclassified to conform to the 2002 presentation.
29
NOTES TO CONSOLIDATED FINANCIAL STATEMENTS, CONTINUED
2. ACCOUNTS RECEIVABLE:
An allowance for doubtful accounts is maintained for estimated losses resulting from the inability of our customers to make required payments. Accounts receivable are stated net of the allowance for doubtful accounts of $20,040,651 in 2002 ($20,182,830 in 2001 and $27,573,485 in 2000).
3. INVENTORIES:
Inventories consist of approximately 40% raw materials and supplies, and 60% finished and semi-finished products in 2002 and 2001. Nucor’s manufacturing process consists of a continuous, vertically integrated process from which products are sold to customers at various stages throughout the process. Since most steel products can be classified as either finished or semi-finished products, these two categories of inventory are combined.
Inventories valued using the last-in, first-out (LIFO) method of accounting represent approximately 77% of total inventories in 2002 (85% in 2001). If the first-in, first-out (FIFO) method of accounting had been used, inventories would have been $42,607,667 higher in 2002 ($8,291,126 higher in 2001). Use of the lower of cost or market reduced inventories by $1,319,314 in 2002 ($6,319,664 in 2001).
4. PROPERTY, PLANT AND EQUIPMENT:
December 31, | | 2002 | | 2001 | |
| |
| |
| |
Land and improvements | | $ | 122,624,444 | | $ | 99,960,257 | |
Buildings and improvements | | 452,382,223 | | 387,104,084 | |
Machinery and equipment | | 4,475,430,898 | | 3,605,131,629 | |
Construction in process and equipment deposits | | 43,793,154 | | 134,370,438 | |
| |
| |
| |
| | 5,094,230,719 | | 4,226,566,408 | |
Less accumulated depreciation | | 2,162,172,617 | | 1,860,911,347 | |
| |
| |
| |
| | $ | 2,932,058,102 | | $ | 2,365,655,061 | |
| |
|
| |
|
| |
The estimated useful lives range from 10 to 20 years for buildings and land improvements and range from 3 to 12 years for machinery and equipment.
5. LONG-TERM DEBT AND FINANCING ARRANGEMENTS:
December 31, | | 2002 | | 2001 | |
| |
| |
| |
Industrial revenue bonds: | | | | | |
1.63% to 2.475%, variable, due from 2014 to 2033 | | $ | 292,300,000 | | $ | 206,300,000 | |
5.75% to 8%, fixed, due from 2003 to 2023 | | 77,250,000 | | 79,150,000 | |
Notes, 6%, due 2009 | | 175,000,000 | | 175,000,000 | |
Notes, 4.875%, due in 2012 | | 350,000,000 | | — | |
| |
| |
| |
| | 894,550,000 | | 460,450,000 | |
Less current maturities | | (16,000,000 | ) | — | |
| |
| |
| |
| | $ | 878,550,000 | | $ | 460,450,000 | |
| |
|
| |
|
| |
30
NOTES TO CONSOLIDATED FINANCIAL STATEMENTS, CONTINUED
At December 31, 2002, Nucor had an interest rate swap agreement of $175,000,000 outstanding that is accounted for as a fair value hedge. Under the agreement, Nucor pays a variable rate of interest and receives a fixed rate of interest over the term of the interest rate swap agreement. The interest rate swap agreement converted the $175,000,000 note payable from a fixed rate obligation to a variable rate obligation. The change in the fair value of this agreement is recorded in earnings as an equal offset to the change in fair value of the underlying debt obligation. Since this fair value hedge is 100% effective, there is no impact to net earnings. The variable interest rate is the six-month LIBOR rate in arrears plus 1.495%.
In October 2002, Nucor entered into an unsecured revolving credit facility that provides for up to $425,000,000 in revolving loans. The credit facility consists of (a) a $125,000,000 364-day revolver with an option to convert amounts outstanding under this facility to a one-year term loan, and (b) a $300,000,000 five-year multi-currency revolver. This new facility replaced the previous credit facilities that provided up to $248,000,000 in revolving loans. No borrowings were outstanding under the former credit facilities as of the date they were replaced, and no borrowings are outstanding under the new credit facility at December 31, 2002. The new credit facility includes customary financial and other covenants, including a limit on the ratio of debt to total capital of 50% and a limit on Nucor’s ability to pledge the Company’s assets.
Annual aggregate long-term debt maturities are: $16,000,000 in 2003; none in 2004; none in 2005; $1,250,000 in 2006; and none in 2007.
The fair value of Nucor’s long-term debt approximates the carrying value.
In January 2003, approximately $45,000,000 aggregate principal amounts of the fixed rate industrial revenue bonds outstanding at December 31, 2002 were redeemed and reissued in the form of new variable rate industrial revenue bonds in like principal amount.
6. CAPITAL STOCK:
The par value of Nucor’s common stock is $.40 per share and there are 200,000,000 shares authorized.
Nucor’s Key Employees’ Incentive Stock Option Plans provide that common stock options may be granted to key employees and officers with exercise prices at 100% of the market value on the date of the grant. Outstanding options are exercisable six months after grant date and have a term of seven years. At December 31, 2002, 1,291,962 shares (1,737,789 in 2001 and 2,180,737 in 2000) were reserved for future grants.
Effective January 1, 2001, Nucor established a Non-Employee Director Equity Plan that provides that common stock options may be granted to members of the Board of Directors of Nucor who are not employees of Nucor. The Plan grants options to purchase Nucor’s common stock with exercise prices at 100% of the market value on the date of the grant. Outstanding options are exercisable six months after grant date and have a term of seven years. At December 31, 2002, 291,525 shares (295,689 in 2001) were reserved for future grants.
250,000 shares of preferred stock, par value of $4.00 per share, are authorized, with preferences, rights and restrictions as may be fixed by Nucor’s Board of Directors. No shares of preferred stock have been issued since their authorization in 1964.
A summary of Nucor’s stock option plans is as follows:
Year Ended December 31, | | 2002 | | 2001 | | 2000 | |
| |
| |
| |
| |
| | Shares | | Weighted Average
Exercise Price | | Shares | | Weighted Average
Exercise Price | | Shares | | Weighted Average
Exercise Price | |
| |
| |
| |
| |
| |
| |
| |
Number of shares under option: | | | | | | | | | | | | | |
Outstanding at beginning of year | | 1,154,864 | | $ | 45.48 | | 990,630 | | $ | 44.60 | | 685,317 | | $ | 48.35 | |
Granted | | 458,810 | | 52.66 | | 470,338 | | 46.64 | | 482,431 | | 41.33 | |
Exercised | | (352,242 | ) | 46.07 | | (214,253 | ) | 41.62 | | (9,620 | ) | 42.60 | |
Canceled | | (15,346 | ) | 54.88 | | (91,851 | ) | 51.02 | | (167,498 | ) | 50.65 | |
| |
| |
| |
| |
| |
| |
| |
Outstanding at end of year | | 1,246,086 | | $ | 47.84 | | 1,154,864 | | $ | 45.48 | | 990,630 | | $ | 44.60 | |
| |
| |
|
| |
| |
|
| |
| |
|
| |
| | | | | | | | | | | | | | | | |
Options exercisable at end of year | | 993,331 | | $ | 47.54 | | 924,932 | | $ | 44.61 | | 710,386 | | $ | 47.93 | |
| |
| |
|
| |
| |
|
| |
| |
|
| |
31
NOTES TO CONSOLIDATED FINANCIAL STATEMENTS, CONTINUED
The following table summarizes information about stock options outstanding at December 31, 2002:
| | Options Outstanding | | Options Exercisable | |
| |
| |
| |
Range of Exercise Prices | | Number Outstanding | | Weighted-
Average Remaining
Contractual Life | | Weighted-Average
Exercise Price | | Number Exercisable | | Weighted-Average
Exercise Price | |
| |
| |
| |
| |
| |
| |
| | | | | | | | | | | |
$36.01 –$42.00 | | 161,434 | | 4.2 years | | $ | 36.59 | | 161,434 | | $ | 36.59 | |
42.01 – 48.00 | | 279,277 | | 4.4 years | | 44.89 | | 279,277 | | 44.89 | |
48.01 – 54.00 | | 605,893 | | 5.5 years | | 49.09 | | 353,138 | | 49.16 | |
54.01 – 60.00 | | 199,482 | | 6.1 years | | 57.25 | | 199,482 | | 57.25 | |
| |
| | | | | |
| | | |
36.01 – 60.00 | | | 1,246,086 | | | 5.2 years | | | 47.84 | | | 993,331 | | | 47.54 | |
| |
|
| | | | | | | |
|
| | | | |
The pro forma net earnings and pro forma net earnings per share amounts calculated according to SFAS No. 123 are disclosed in Note 1, above. The weighted-average fair value of options granted was $18.69 in 2002 ($14.59 in 2001 and $16.54 in 2000). The fair value of each option grant is estimated on the date of the grant using the Black-Scholes option-pricing model with the following assumptions:
Year Ended December 31, | | 2002 | | 2001 | | 2000 | |
| |
| |
| |
| |
| | | | | | | |
Expected dividend yield | | 1.55 | % | 1.39 | % | 1.66 | % |
Expected stock price volatility | | 49.03 | % | 41.02 | % | 40.57 | % |
Risk-free interest rate | | 2.32% – 4.14 | % | 3.45% – 4.43 | % | 6.02% – 6.53 | % |
Expected life of options (in years) | | 3.5 | | 3.5 | | 3.5 | |
7. STOCKHOLDER RIGHTS PLAN:
On March 8, 2001, the Board of Directors adopted a Stockholder Rights Plan (“Plan”) in which one right (“Right”) was declared as a dividend for each Nucor common share outstanding. Each Right entitles Nucor common stockholders to purchase, under certain conditions, one five-thousandth of a share of newly authorized Series A Junior Participating Preferred Stock (“Preferred Stock”), with one five-thousandth of a share of Preferred Stock intended to be the economic equivalent of one share of Nucor common stock. Until the occurrence of certain events, the Rights are represented by and traded in tandem with Nucor common stock. Rights will be exercisable only if a person or group acquires beneficial ownership of 15 percent (15%) or more of the Nucor common shares or commences a tender or exchange offer, upon the consummation of which such person or group would beneficially own 15 percent (15%) or more of the common shares. Upon such an event, the Rights enable dilution of the acquiring person’s or group’s interest by providing that other holders of Nucor common stock may purchase, at an exercise price of $150.00, Nucor common stock, or in the discretion of the Board of Directors, Preferred Stock, having double the value of such exercise price. Nucor will be entitled to redeem the Rights at $.001 per Right under certain circumstances set forth in the Plan. The Rights themselves have no voting power and will expire on March 8, 2011, unless earlier exercised, redeemed or exchanged. Each one five-thousandth of a share of Preferred Stock has the same voting rights as one share of Nucor common stock, and each share of Preferred Stock has 5,000 times the voting power of one share of Nucor common stock.
32
NOTES TO CONSOLIDATED FINANCIAL STATEMENTS, CONTINUED
8. CONTINGENCIES:
Nucor is subject to environmental laws and regulations established by federal, state and local authorities; and makes provision for the estimated costs related to compliance. Of the undiscounted total $82,768,000 of accrued environmental costs at December 31, 2002 ($104,960,000 in 2001 and $130,147,000 in 2000), $37,418,000 was classified in accrued expenses and other current liabilities ($49,210,000 in 2001 and $63,097,000 in 2000) and $45,350,000 was classified in deferred credits and other liabilities ($55,750,000 in 2001 and $67,050,000 in 2000). During the year ended December 31, 2002, Nucor revised estimates as additional information was obtained. Environmental reserves included in deferred credits and other liabilities decreased by $22,943,000 during the year as a result of the revised estimates. In December 2000, the United States Environmental Protection Agency and the Department of Justice announced an agreement with Nucor and certain states that resolved alleged environmental violations. Nucor continues to implement the various components of the consent decree, which involve air and water pollution control technology demonstrations along with other environmental management practices. The accrued environmental costs include the expenses that we expect to incur as a result of the consent decree.
Other contingent liabilities with respect to product warranties, legal proceedings and other matters arise in the normal course of business. In the opinion of management, no such matters exist which would have a material effect on the consolidated financial statements.
9. EMPLOYEE BENEFIT PLAN:
Nucor has a Profit Sharing and Retirement Savings Plan for qualified employees. Nucor’s expense for these benefits was $25,898,823 in 2002 ($18,998,950 in 2001 and $49,280,977 in 2000). Nucor also has a medical plan covering certain eligible early retirees. The unfunded obligation, included in deferred credits and other liabilities in the balance sheet, totaled $38,211,081 in 2002 ($33,256,696 in 2001). Expense associated with this plan was $1,753,035 in 2002 ($1,085,758 in 2001 and $3,038,714 in 2000). The discount rate used was 6.5% in 2002 (7% in 2001 and 7.5% in 2000). The health care cost trend rate used was 12% in 2002 (13% in 2001 and 9.5% in 2000). The health care cost trend rate is projected to decline gradually to 5% by 2011.
10. INTEREST EXPENSE (INCOME):
Interest expense is stated net of interest income of $8,632,181 in 2002 ($15,476,840 in 2001 and $23,264,824 in 2000). Interest paid was $19,886,247 in 2002 ($22,028,671 in 2001 and $21,625,267 in 2000).
11. OTHER INCOME:
In 2002, Nucor received $29,900,000 related to a graphite electrodes anti-trust settlement. In 2001, Nucor sold Nucor Iron Carbide, Inc. in Trinidad, resulting in a pre-tax gain of $20,200,000.
12. INCOME TAXES:
The provision for income taxes consists of the following:
Year Ended December 31, | | 2002 | | 2001 | | 2000 | |
| |
| |
| |
| |
| | | | | | | |
Current: | | | | | | | |
Federal | | $ | 54,000,000 | | $ | 49,900,000 | | $ | 148,000,000 | |
State | | (17,227,000 | ) | 3,508,000 | | 14,410,000 | |
| |
| |
| |
| |
Total current | | 36,773,000 | | 53,408,000 | | 162,410,000 | |
| |
| |
| |
| |
| | | | | | | |
Deferred: | | | | | | | |
Federal | | 31,400,000 | | 11,000,000 | | 19,400,000 | |
State | | (200,000 | ) | 2,000,000 | | 800,000 | |
| |
| |
| |
| |
Total deferred | | 31,200,000 | | 13,000,000 | | 20,200,000 | |
| |
| |
| |
| |
| | | | | | | |
Total provision for income taxes | | $ | 67,973,000 | | $ | 66,408,000 | | $ | 182,610,000 | |
| |
|
| |
|
| |
|
| |
33
NOTES TO CONSOLIDATED FINANCIAL STATEMENTS, CONTINUED
A reconciliation of the federal statutory tax rate (35%) to the total provision is as follows:
Year Ended December 31, | | 2002 | | 2001 | | 2000 | |
| |
| |
| |
| |
| | | | | | | |
Taxes computed at statutory rate | | 35.00 | % | 35.00 | % | 35.00 | % |
State income taxes, net of federal income tax benefit | | (4.92 | ) | 2.00 | | 2.00 | |
Penalties | | — | | 1.77 | | — | |
Other, net | | (.53 | ) | (1.75 | ) | — | |
| |
| |
| |
| |
| | | | | | | |
Provision for income taxes | | 29.55 | % | 37.02 | % | 37.00 | % |
| |
| |
| |
| |
Deferred tax assets and liabilities resulted from the following:
December 31, | | 2002 | | 2001 | |
| |
| |
| |
| | | | | |
Deferred tax assets: | | | | | |
Accrued liabilities and reserves | | $ | 114,759,338 | | $ | 106,829,351 | |
Allowance for doubtful accounts | | 6,271,704 | | 6,457,742 | |
Inventory | | 69,957,269 | | 68,725,327 | |
Post retirement benefits | | 13,878,074 | | 12,078,666 | |
| |
| |
| |
Total deferred tax assets | | 204,866,385 | | 194,091,086 | |
| | | | | |
Deferred tax liabilities: | | | | | |
Property, plant and equipment | | (273,173,385 | ) | (237,091,086 | ) |
| |
| |
| |
| | | | | |
Total net deferred tax liabilities | | $ | (68,307,000 | ) | $ | (43,000,000 | ) |
| |
|
| |
|
| |
Net federal and state income taxes paid were $31,693,000 in 2002 ($20,397,000 in 2001 and $162,339,000 in 2000).
13. EARNINGS PER SHARE:
The computations of basic and diluted earnings per share are as follows:
Year Ended December 31, | | 2002 | | 2001 | | 2000 | |
| |
| |
| |
| |
| | | | | | | |
Basic earnings per share: | | | | | | | |
Basic net earnings | | $ | 162,080,015 | | $ | 112,961,007 | | $ | 310,907,988 | |
| |
|
| |
|
| |
|
| |
| | | | | | | |
Average shares outstanding | | 78,089,501 | | 77,707,832 | | 81,762,429 | |
| |
| |
| |
| |
| | | | | | | |
Basic net earnings per share | | $ | 2.08 | | $ | 1.45 | | $ | 3.80 | |
| |
|
| |
|
| |
|
| |
| | | | | | | |
Diluted earnings per share: | | | | | | | |
Diluted net earnings | | $ | 162,080,015 | | $ | 112,961,007 | | $ | 310,907,988 | |
| |
|
| |
|
| |
|
| |
| | | | | | | |
Diluted average shares outstanding: | | | | | | | |
Basic shares outstanding | | 78,089,501 | | 77,707,832 | | 81,762,429 | |
Dilutive effect of stock options | | 160,039 | | 75,412 | | 14,825 | |
| |
| |
| |
| |
| | 78,249,540 | | 77,783,244 | | 81,777,254 | |
| |
| |
| |
| |
| | | | | | | |
Diluted net earnings per share | | $ | 2.07 | | $ | 1.45 | | $ | 3.80 | |
| |
|
| |
|
| |
|
| |
34
NOTES TO CONSOLIDATED FINANCIAL STATEMENTS, CONTINUED
14. SEGMENTS:
Nucor reports its results in two segments, steel mills and steel products. The steel mills segment includes carbon and alloy steel in sheet, bars, structural and plate. The steel products segment includes steel joists and joist girders, steel deck, cold finished steel, steel fasteners, metal building systems and light gauge steel framing. The segments are consistent with the way Nucor manages its business, which is primarily based upon the similarity of the types of products produced and sold by each segment.
Management evaluates the operating performance of each of its segments based upon division contribution. The accounting policies of the reportable segments are the same as those described in the summary of significant accounting policies. Nucor accounts for intercompany sales at prices approximating current market value. Interest expense (income), minority interests, other income and certain marketing, administrative and other expenses, such as changes in the LIFO reserve and environmental accruals, are shown under Corporate/eliminations/other. Corporate assets primarily include cash and short-term investments, deferred income tax assets and investments in affiliates.
Year Ended December 31, | | 2002 | | 2001 | | 2000 | |
| |
| |
| |
| |
| | | | | | | |
Net sales to external customers: | | | | | | | |
Steel mills | | $ | 4,062,589,428 | | $ | 3,449,645,631 | | $ | 3,614,182,529 | |
Steel products | | 739,187,109 | | 884,061,123 | | 1,142,338,605 | |
| |
| |
| |
| |
| | $ | 4,801,776,537 | | $ | 4,333,706,754 | | $ | 4,756,521,134 | |
| |
|
| |
|
| |
|
| |
| | | | | | | |
Intercompany sales: | | | | | | | |
Steel mills | | $ | 355,586,154 | | $ | 337,776,416 | | $ | 429,505,350 | |
Steel products | | 5,350,019 | | 6,492,677 | | 7,463,767 | |
Corporate/eliminations/other | | (360,936,173 | ) | (344,269,093 | ) | (436,969,117 | ) |
| |
| |
| |
| |
| | $ | — | | $ | — | | $ | — | |
| |
|
| |
|
| |
|
| |
| | | | | | | |
Depreciation expense: | | | | | | | |
Steel mills | | $ | 288,879,257 | | $ | 274,015,541 | | $ | 248,139,764 | |
Steel products | | 18,221,775 | | 15,047,672 | | 11,225,409 | |
| |
| |
| |
| |
| | $ | 307,101,032 | | $ | 289,063,213 | | $ | 259,365,173 | |
| |
|
| |
|
| |
|
| |
| | | | | | | |
Earnings before income taxes: | | | | | | | |
Steel mills | | $ | 401,820,248 | | $ | 207,358,153 | | $ | 562,416,100 | |
Steel products | | (407,489 | ) | 98,405,118 | | 171,787,255 | |
Corporate/eliminations/other | | (171,359,744 | ) | (126,394,264 | ) | (240,685,367 | ) |
| |
| |
| |
| |
| | $ | 230,053,015 | | $ | 179,369,007 | | $ | 493,517,988 | |
| |
|
| |
|
| |
|
| |
| | | | | | | |
Segment assets: | | | | | | | |
Steel mills | | $ | 4,017,013,672 | | $ | 3,253,454,574 | | $ | 3,216,124,842 | |
Steel products | | 302,444,958 | | 297,581,986 | | 336,062,351 | |
Corporate/eliminations/other | | 61,542,587 | | 208,311,616 | | 158,680,512 | |
| |
| |
| |
| |
| | $ | 4,381,001,217 | | $ | 3,759,348,176 | | $ | 3,710,867,705 | |
| |
|
| |
|
| |
|
| |
| | | | | | | |
Capital expenditures: | | | | | | | |
Steel mills | | $ | 237,528,578 | | $ | 206,561,688 | | $ | 389,809,591 | |
Steel products | | 6,069,518 | | 53,482,338 | | 25,595,011 | |
Corporate/eliminations/other | | — | | 1,101,632 | | — | |
| |
| |
| |
| |
| | $ | 243,598,096 | | $ | 261,145,658 | | $ | 415,404,602 | |
| |
|
| |
|
| |
|
| |
35
NOTES TO CONSOLIDATED FINANCIAL STATEMENTS, CONTINUED
Net sales by product were as follows. Further product breakdown is impracticable.
Year Ended December 31, | | 2002 | | 2001 | | 2000 | |
| |
| |
| |
| |
| | | | | | | |
Net sales to external customers: | | | | | | | |
Sheet | | $ | 1,905,516,770 | | $ | 1,421,651,648 | | $ | 1,524,409,147 | |
Bars | | 863,373,558 | | 804,899,153 | | 745,676,938 | |
Structural | | 1,026,991,446 | | 1,073,351,752 | | 1,338,440,460 | |
Plate | | 266,707,654 | | 149,743,078 | | 5,655,984 | |
Steel products | | 739,187,109 | | 884,061,123 | | 1,142,338,605 | |
| |
| |
| |
| |
| | $ | 4,801,776,537 | | $ | 4,333,706,754 | | $ | 4,756,521,134 | |
| |
|
| |
|
| |
|
| |
15. ACQUISITIONS AND DISPOSITIONS:
On July 22, 2002, Nucor’s wholly owned subsidiary, Nucor Steel Decatur, LLC, purchased substantially all of the assets of Trico Steel Company, LLC (“Trico”) for a purchase price of $117,700,000. The purchase price included approximately $86,000,000 of Trico’s debt that was assumed by Nucor. Located in Decatur, Alabama, the sheet steel facility originally began operations in 1997 and has an annual capacity of approximately 1,900,000 tons. This acquisition was not material to the consolidated financial statements and did not result in material goodwill or other intangible assets.
On December 9, 2002, Nucor purchased substantially all of the assets of Birmingham Steel Corporation (“Birmingham Steel”) for a cash purchase price excluding transaction costs of approximately $615,000,000, including $116,900,000 in inventory and receivables. Primary assets purchased are Birmingham Steel’s four operating mills in Birmingham, Alabama; Kankakee, Illinois; Jackson, Mississippi; and Seattle, Washington with an estimated combined annual capacity of approximately 2,000,000 tons. Other included assets are the corporate office located in Birmingham, Alabama; the mill in Memphis, Tennessee, which is currently not in operation; the assets of Port Everglades Steel Corporation; the assets of the Klean Steel Division; and Birmingham Steel’s ownership in Richmond Steel Recycling Limited. This acquisition was financed with proceeds from the issuance of $350,000,000 of 4.875% notes due in 2012 and internal cash flows.
The following table summarizes the estimated fair values of the assets acquired and liabilities assumed of Birmingham Steel as of the date of acquisition:
Current assets | | $ | 122,868,464 | |
Property, plant and equipment | | 515,016,742 | |
Other assets | | 550,000 | |
| |
| |
Total assets acquired | | 638,435,206 | |
| |
| |
| | | |
Current liabilities | | (13,690,000 | ) |
Deferred credits and other liabilities | | (3,121,443 | ) |
| |
| |
Total liabilities assumed | | (16,811,443 | ) |
| |
| |
| | | |
| | $ | 621,623,763 | |
| |
|
| |
36
NOTES TO CONSOLIDATED FINANCIAL STATEMENTS, CONTINUED
The results of Birmingham Steel have been included in the consolidated financial statements from the date of acquisition. Unaudited pro forma operating results for Nucor, assuming the acquisition of Birmingham Steel occurred on January 1, 2001, are as follows:
Year Ended December 31, | | 2002 | | 2001 | |
| |
| |
| |
| | | | | |
Net sales | | $ | 5,292,505,537 | | $ | 4,884,697,754 | |
Net earnings | | 156,837,015 | | 128,994,007 | |
Net earnings per share: | | | | | |
Basic | | $ | 2.01 | | $ | 1.66 | |
| |
|
| |
|
| |
Diluted | | $ | 2.00 | | $ | 1.66 | |
| |
|
| |
|
| |
Non-cash investing and financing activities in 2002 included the assumption of $86,000,000 of bonds and $17,415,025 of other liabilities acquired with the purchase of substantially all of the assets of Trico and Birmingham Steel.
On March 31, 2001, Nucor purchased substantially all of the assets of Auburn Steel Company, Inc.’s steel bar facility in Auburn, New York for approximately $115,000,000. This facility produces merchant bar quality steel shapes, SBQ and rebar. On November 19, 2001, Nucor acquired ITEC Steel, Inc. and its wholly owned subsidiary, Steel Truss and Frame Corp., with facilities in Texas and Georgia, for approximately $11,000,000, including liabilities assumed. These facilities, now known as NUCON STEEL Commercial Corporation, produce light gauge steel framing. The acquisitions were not material to the consolidated financial statements and did not result in material goodwill or other intangible assets.
In February 2001, Nucor finalized the sale of the Bearing Products operation in North Carolina. In November 2001, Nucor sold Nucor Iron Carbide, Inc. in Trinidad, resulting in a pre-tax gain of $20,200,000. Both operations accounted for small percentages of Nucor’s sales.
37
NOTES TO CONSOLIDATED FINANCIAL STATEMENTS, CONTINUED
16. QUARTERLY INFORMATION (UNAUDITED):
Nucor has restated previously reported quarterly financial results for the years ended December 31, 2002 and 2001 to give effect to the reclassification of shipping costs (see Note 1), state income taxes, minority interests and other income (2001 only, see Note 11). There was no effect on any of the quarterly or annual periods’ net earnings or net earnings per share amounts. The effect of this restatement on the statement of earnings is as follows:
Year Ended
December 31, 2002 | | First Quarter | | Second Quarter | | Third Quarter | | Fourth Quarter | |
| |
| |
| |
| |
| |
| | Previously
Reported | | As Restated | | Previously
Reported | | As Restated | | Previously
Reported | | As Restated | | | |
| |
| |
| |
| |
| |
| |
| |
| |
Net sales | | $1,028,164,467 | | $1,080,636,981 | | $1,141,677,480 | | $1,198,032,206 | | $1,165,641,454 | | $1,228,529,423 | | $1,294,577,927 | |
| | | | | | | | | | | | | | | |
Gross margin | | 71,148,114 | | 100,899,364 | | 105,458,586 | | 128,386,346 | | 122,217,407 | | 121,930,407 | | 118,283,090 | |
| | | | | | | | | | | | | | | |
Net earnings(1) | | 20,262,295 | | 20,262,295 | | 59,748,302 | | 59,748,302 | | 39,178,800 | | 39,178,800 | | 42,890,618 | |
| | | | | | | | | | | | | | | |
Net earnings per share: | | | | | | | | | | | | | | | |
Basic | | .26 | | .26 | | .77 | | .77 | | .50 | | .50 | | .55 | |
Diluted | | .26 | | .26 | | .76 | | .76 | | .50 | | .50 | | .55 | |
Year Ended
December 31, 2001 | | First Quarter | | Second Quarter | | Third Quarter | | Fourth Quarter | |
| |
| |
| |
| |
| |
| | Previously
Reported | | As Restated | | Previously
Reported | | As Restated | | Previously
Reported | | As Restated | | Previously
Reported | | As Restated | |
| |
| |
| |
| |
| |
| |
| |
| |
| |
Net sales | | $1,028,017,720 | | $1,073,934,223 | | $1,078,574,872 | | $1,127,767,240 | | $1,053,088,039 | | $1,102,777,578 | | $979,567,947 | | $1,029,227,713 | |
| | | | | | | | | | | | | | | | | |
Gross margin | | 84,245,334 | | 114,901,904 | | 100,011,733 | | 116,827,348 | | 74,911,842 | | 100,009,495 | | 59,776,643 | | 87,689,636 | |
| | | | | | | | | | | | | | | | | |
| | | | | | | | | | | | | | | | | |
Net earnings (2) | | 32,738,976 | | 32,738,976 | | 33,292,863 | | 33,292,863 | | 20,463,277 | | 20,463,277 | | 26,465,891 | | 26,465,891 | |
| | | | | | | | | | | | | | | | | |
Net earnings per share: | | | | | | | | | | | | | | | | | |
Basic | | .42 | | .42 | | .43 | | .43 | | .26 | | .26 | | .34 | | .34 | |
Diluted | | .42 | | .42 | | .43 | | .43 | | .26 | | .26 | | .34 | | .34 | |
(1) The second quarter of 2002 includes a gain of $29,900,000 related to a graphite electrodes anti-trust settlement.
(2) The fourth quarter of 2001 includes a pre-tax gain of $20,200,000 resulting from the sale of Nucor Iron Carbide Inc. in Trinidad.
38
REPORT OF INDEPENDENT ACCOUNTANTS
|
|
REPORT OF INDEPENDENT ACCOUNTANTS |
|
PricewaterhouseCoopers LLP
February 6, 2003
Stockholders and Board of Directors
Nucor Corporation
In our opinion, the accompanying consolidated balance sheets and the related consolidated statements of earnings, stockholders’ equity and cash flows present fairly, in all material respects, the financial position of Nucor Corporation and its subsidiaries at December 31, 2002 and 2001, and the results of their operations and their cash flows for each of the three years in the period ended December 31, 2002 in conformity with accounting principles generally accepted in the United States of America. These financial statements are the responsibility of Nucor’s management; our responsibility is to express an opinion on these financial statements based on our audits. We conducted our audits of these statements in accordance with auditing standards generally accepted in the United States of America, which require that we plan and perform the audit to obtain reasonable assurance about whether the financial statements are free of material misstatement. An audit includes examining, on a test basis, evidence supporting the amounts and disclosures in the financial statements, assessing the accounting principles used and significant estimates made by management, and evaluating the overall financial statement presentation. We believe that our audits provide a reasonable basis for our opinion.
| | | |
/s/ PricewaterhouseCoopers LLP
| | |
|
Charlotte, North Carolina | | | |
39
CORPORATE AND STOCK DATA
EXECUTIVE OFFICES
2100 Rexford Road
Charlotte, North Carolina 28211
Phone 704/366-7000
Fax 704/362-4208
STOCK TRANSFERS
DIVIDEND DISBURSING
DIVIDEND REINVESTMENT
American Stock Transfer & Trust Company
59 Maiden Lane
New York, New York 10038
Phone 800/937-5449
Fax 718/236-2641
ANNUAL MEETING
Place –
The Park Hotel
2200 Rexford Road
Morrison A & B
Charlotte, North Carolina
Time/Date –
10:00 a.m., Thursday
May 8, 2003
STOCK LISTING
New York Stock Exchange
Trading Symbol – NUE
STOCK PRICE AND DIVIDENDS PAID
| | First
Quarter | | Second
Quarter | | Third
Quarter | | Fourth
Quarter | |
| |
| |
| |
| |
| |
2002 | | | | | | | | | |
Stock Price: | | | | | | | | | |
High | | $ | 66.35 | | $ | 70.15 | | $ | 65.31 | | $ | 51.36 | |
Low | | 49.86 | | 57.05 | | 38.80 | | 36.00 | |
Dividends Paid | | .17 | | .19 | | .19 | | .19 | |
| |
| |
| |
| |
| |
2001 | | | | | | | | | |
Stock Price: | | | | | | | | | |
High | | $ | 47.55 | | $ | 56.20 | | $ | 53.15 | | $ | 54.15 | |
Low | | 37.50 | | 38.48 | | 33.45 | | 35.80 | |
Dividends Paid | | .15 | | .17 | | .17 | | .17 | |
| |
| |
| |
| |
| |
FORM 10-K
A copy of Nucor’s 2002 annual report filed with the Securities and Exchange Commission (“SEC”) on Form 10-K is available to stockholders on request.
INTERNET ACCESS
Nucor’s annual report on Form 10-K, quarterly reports on Form 10-Q, current reports on Form 8-K and all amendments to these reports are available through our website, www.nucor.com, as soon as reasonably practicable after such material is electronically filed with, or furnished to, the SEC. Various other financial and statistical data is also available.
THIS ANNUAL REPORT HAS BEEN PRINTED ON RECYCLED PAPER. 
42