Exhibit 13
Nucor Corporation
2005 Form 10-K
FINANCIAL HIGHLIGHTS
3
FINANCIAL HIGHLIGHTS(dollar amounts in thousands, except per share data)
| | | | | | | | | | | |
| | | 2005 | | | 2004 | | | % CHANGE | |
| FOR THE YEAR | | | | | | | | | | | |
Net sales | | $ | 12,700,999 | | | $ | 11,376,828 | | | 12 | % |
Earnings: | | | | | | | | | | | |
Earnings before income taxes | | | 2,016,368 | | | | 1,731,276 | | | 16 | % |
Provision for income taxes | | | 706,084 | | | | 609,791 | | | 16 | % |
| | | | | | | | | | | |
Net earnings | | | 1,310,284 | | | | 1,121,485 | | | 17 | % |
Per share: | | | | | | | | | | | |
Basic | | | 8.34 | | | | 7.08 | | | 18 | % |
Diluted | | | 8.26 | | | | 7.02 | | | 18 | % |
Dividends declared per share | | | 1.85 | | | | 0.47 | | | 294 | % |
Percentage of net earnings to net sales | | | 10.3 | % | | | 9.9 | % | | 4 | % |
Return on average equity | | | 33.9 | % | | | 38.7 | % | | -12 | % |
Capital expenditures | | | 331,466 | | | | 285,925 | | | 16 | % |
Depreciation | | | 375,054 | | | | 383,305 | | | -2 | % |
Sales per employee | | | 1,159 | | | | 1,107 | | | 5 | % |
| | | |
AT YEAR END | | | | | | | | | | | |
Working capital | | $ | 2,815,854 | | | $ | 2,109,158 | | | 34 | % |
Property, plant and equipment, net | | | 2,855,717 | | | | 2,818,307 | | | 1 | % |
Long-term debt | | | 923,550 | | | | 923,550 | | | — | |
Stockholders’ equity | | | 4,279,788 | | | | 3,455,985 | | | 24 | % |
Per share | | | 27.59 | | | | 21.67 | | | 27 | % |
Shares outstanding | | | 155,110 | | | | 159,512 | | | -3 | % |
Employees | | | 11,300 | | | | 10,600 | | | 7 | % |
FORWARD-LOOKING STATEMENTS Certain statements made in this annual report are forward-looking statements that involve risks and uncertainties. These forward-looking statements reflect the Company’s best judgment based on current information, and although we base these statements on circumstances that we believe to be reasonable when made, there can be no assurance that future events will not affect the accuracy of such forward-looking information. As such, the forward-looking statements are not guarantees of future performance, and actual results may vary materially from the results and expectations discussed in this report. Factors that might cause the Company’s actual results to differ materially from those anticipated in forward-looking statements include, but are not limited to: (1) the sensitivity of the results of our operations to volatility in steel prices and changes in the supply and cost of raw materials, including scrap steel; (2) availability and cost of electricity and natural gas; (3) market demand for steel products; (4) competitive pressure on sales and pricing, including pressure from imports and substitute materials; (5) uncertainties surrounding the global economy, including excess world capacity for steel production and fluctuations in international conversion rates; (6) U.S. and foreign trade policy affecting steel imports or exports; (7) significant changes in government regulations affecting environmental compliance; (8) the cyclical nature of the steel industry; (9) capital investments and their impact on our performance; and (10) our safety performance.
AT A GLANCE
11
| | |
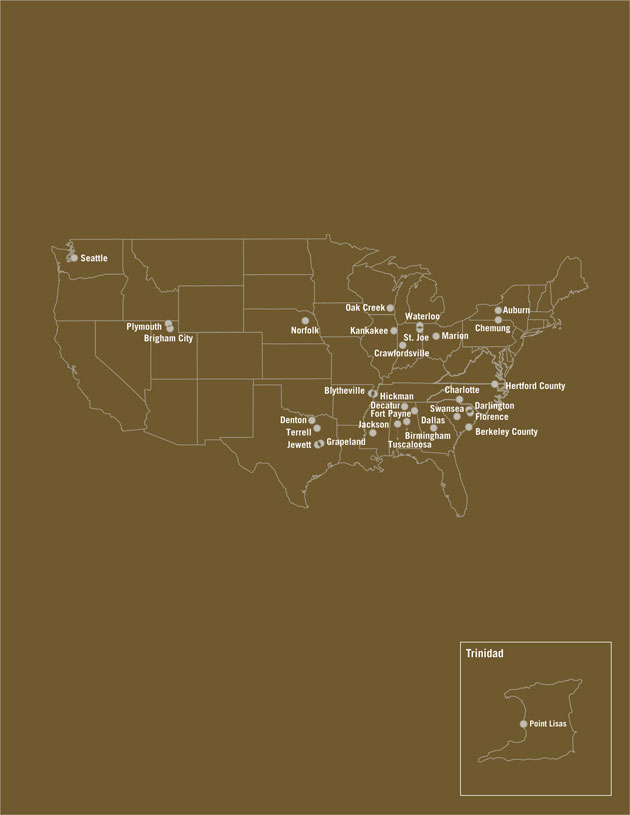
STEEL MILLS SEGMENT BAR MILLS Products: Steel bars, angles and other products for automotive, construction, farm machinery, metal buildings, furniture and recreational equipment. Darlington, South Carolina Norfolk, Nebraska Jewett, Texas Plymouth, Utah Auburn, New York (Nucor Steel Auburn, Inc.) Birmingham, Alabama (Nucor Steel Birmingham, Inc.) Kankakee, Illinois (Nucor Steel Kankakee, Inc.) Jackson, Mississippi (Nucor Steel Jackson, Inc.) Seattle, Washington (Nucor Steel Seattle, Inc.) Marion, Ohio (Nucor Steel Marion, Inc.) SHEET MILLS Products: Flat-rolled steel for automotive, appliance, pipe and tube, construction and other industries. Crawfordsville, Indiana Hickman, Arkansas Berkeley County, South Carolina Decatur, Alabama (Nucor Steel Decatur, LLC) NUCOR-YAMATO STEEL COMPANY Products: Super-wide flange steel beams, pilings and heavy structural steel products for fabricators, construction companies manufacturers and steel service centers. Blytheville, Arkansas BEAM MILL Products: Wide flange steel beams, pilings and heavy structural steel products for fabricators, construction companies, manufacturers and steel service centers. Berkeley County, South Carolina PLATE MILLS Products: Steel plate for manufacturers of heavy equipment, rail cars, ships, barges, refinery tanks, pipe and tube, pressure vessels, construction and others. Hertford County, North Carolina Tuscaloosa, Alabama (Nucor Steel Tuscaloosa, Inc.) | | STEEL PRODUCTS SEGMENT VULCRAFT Products: Steel joists, joist girders and steel deck for non-residential building construction. Florence, South Carolina Norfolk, Nebraska Fort Payne, Alabama Grapeland, Texas St. Joe, Indiana Brigham City, Utah Chemung, New York (Vulcraft of New York, Inc.) COLD FINISH Products: Cold finished steel bars for shafting and precision machined parts. Norfolk, Nebraska Darlington, South Carolina Brigham City, Utah Oak Creek, Wisconsin (Nucor Cold Finish Wisconsin, Inc.) BUILDING SYSTEMS Products: Metal buildings and metal building components for commercial, industrial and institutional building markets. Waterloo, Indiana Swansea, South Carolina Terrell, Texas FASTENER Products: Steel hexhead cap screws, structural bolts and hex bolts for automotive, machine tools, farm implements, construction and military applications. St. Joe, Indiana NUCON STEEL Products: Load bearing light gauge steel framing systems for the commercial and residential construction markets. Denton, Texas Dallas, Georgia OTHER NU-IRON UNLIMITED Products: Direct reduced iron for use as a charge material in our steelmaking operations. Point Lisas, Trinidad CORPORATE OFFICE Charlotte, North Carolina |
OPERATIONS REVIEW
12
STEEL MILLS SEGMENT
BAR MILLS, SHEET MILLS, STRUCTURAL MILLS AND PLATE MILLS
Nucor operates scrap-based steel mills in eighteen facilities. These mills utilize modern steelmaking techniques and produce steel at a cost competitive with steel manufactured anywhere in the world.
BAR MILLS
Nucor has ten bar mills located in South Carolina, Nebraska, Texas, Utah, New York, Alabama, Illinois, Mississippi, Washington and Ohio that produce bars, angles and light structural shapes in carbon and alloy steels. These products have wide usage including automotive, construction, farm equipment, metal buildings, furniture and recreational equipment. Four of the bar mills were constructed by Nucor between 1969 and 1981. Over the years, Nucor has completed extensive capital projects to keep these facilities modernized, including a modernization of the rolling mill at the Nebraska facility, a new melt shop at the Texas facility and a new finishing end at the South Carolina facility. In 2001, Nucor purchased substantially all of the assets of Auburn Steel Company, Inc.’s steel bar facility in Auburn, New York. This facility currently has the capacity to produce up to 480,000 tons of merchant and special bar quality (“SBQ”) steel shapes and rebar. In 2002, Nucor completed the acquisition of substantially all the assets of Birmingham Steel Corporation (“Birmingham Steel”). The four bar mills acquired from Birmingham Steel can produce in excess of 2,600,000 tons annually. In the second quarter of 2005, Nucor purchased substantially all of the assets of Marion Steel Company (“Marion Steel”), which has the capacity to produce up to 450,000 tons annually. The total capacity of our ten bar mills is approximately 7,700,000 tons per year.
SHEET MILLS
The sheet mills produce flat-rolled steel for automotive, appliance, pipe and tube, construction and other industries. The four sheet mills are located in Indiana, Arkansas, South Carolina and Alabama. Nucor constructed three of the sheet mills between 1989 and 1996. The constructed sheet mills utilize thin slab casters to produce hot rolled sheet. In 2002, Nucor’s wholly owned subsidiary Nucor Steel Decatur, LLC purchased substantially all the assets of Trico Steel Company, LLC (“Trico”). This sheet mill is located in Decatur, Alabama, and has an annual capacity of approximately 2,400,000 tons, initially expanding our sheet capacity by 30%. In 2004, Nucor Steel Decatur, LLC purchased the adjacent cold rolling mill of Worthington Industries, Inc. (“Worthington”). All four of our sheet mills are now equipped with cold rolling mills for further processing of hot rolled sheet. The three greenfield constructed mills are also equipped with galvanizing lines. The total capacity of the four sheet mills is approximately 10,800,000 tons per year.
STRUCTURAL MILLS
The structural mills produce wide flange steel beams, pilings and heavy structural steel products for fabricators, construction companies, manufacturers and steel service centers. In 1988, Nucor and Yamato Kogyo, one of Japan’s major producers of wide-flange beams, completed construction of a beam mill located near Blytheville, Arkansas. Nucor owns a 51% interest in Nucor-Yamato Steel Company. During 1999, Nucor started operations at its 1,000,000 tons-per-year steel beam mill in South Carolina. Both mills use a special continuous casting method that produces a beam blank closer in shape to that of the finished beam than traditional methods. Current annual production capacity of our two structural mills is approximately 3,700,000 tons.
PLATE MILLS
Nucor operates two plate mills. Nucor completed construction of its first plate mill, located in North Carolina, in 2000 with the competitive advantages of new, more efficient production technology. This mill produces plate for manufacturers of heavy equipment, rail cars, ships, barges, refinery tanks and others. In 2004, Nucor’s wholly owned subsidiary, Nucor Steel Tuscaloosa, Inc.,
OPERATIONS REVIEW
13
purchased substantially all the assets of Corus Tuscaloosa. The Tuscaloosa mill has an annual capacity of approximately 1,200,000 tons and complements our product offering with thinner gauges of coiled and cut-to-length plate used in the pipe and tube, pressure vessel, transportation and construction industries. Current annual production capacity of our two plate mills is approximately 2,800,000 tons.
OPERATIONS
Nucor’s steel mills are among the most modern and efficient mills in the United States. Recycled steel scrap and other metallics are melted in electric arc furnaces and poured into continuous casting systems. Highly sophisticated rolling mills convert the billets, blooms and slabs into rebar, angles, rounds, channels, flats, sheet, beams, plate and other products.
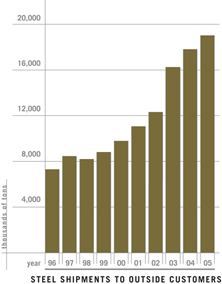
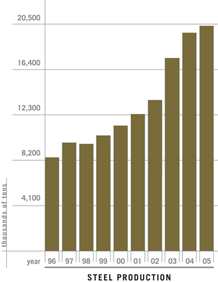
Production in 2005 was a record 20,332,000 tons, a 3% increase from 19,737,000 tons in 2004. Annual production capacity has grown from 120,000 tons in 1970 to a present total of approximately 25,000,000 tons.
The operations in the rolling mills are highly automated and require fewer operating employees than older mills. All Nucor steel mills have high productivity, which results in employment costs of approximately 8% of the sales dollar. This is lower than the employment costs of integrated steel companies producing comparable products. Employee turnover in Nucor mills is extremely low. All employees have a significant part of their compensation based on their productivity. Production employees work under group incentives that provide increased earnings for increased production. This additional compensation is paid weekly.
Steel mills are large consumers of electricity and gas. Total energy costs increased approximately $7 per ton from 2004 to 2005 due to higher natural gas and electricity prices. Because of the greater efficiency of Nucor steel mills, these energy costs were still less than 10% of the sales dollar in both 2005 and 2004. Nucor is partially hedged against exposure to increases in energy costs.
Scrap and scrap substitutes are the most significant element in the total cost of steel production. The average cost of scrap and scrap substitutes used increased 3% to $244 per ton in 2005 from $238 per ton in 2004. A raw material surcharge implemented in 2004 has allowed Nucor to maintain operating margins and to meet our commitments to customers in spite of highly volatile scrap and scrap substitute costs.
MARKETS AND MARKETING
Approximately 92% of the eighteen steel mills’ production in 2005 was sold to outside customers and the balance was used internally by the Vulcraft, Cold Finish, Building Systems and Fastener divisions. Steel shipments to outside customers in 2005 were a record 19,020,000 tons, 7% higher than the 17,787,000 tons in 2004.
Our steel mill customers are primarily manufacturers, steel service centers and fabricators. The sheet mills continue to build long-term relationships with contract customers who purchase more value added products. We enter 2006 with approximately 45% of our sheet mill volume committed to contract customers. Contract terms are typically six to twelve months in length with various renewal dates. These contracts are non-cancelable agreements with a pricing formula that varies based on raw material costs. Long term, the sheet mills will continue to pursue profitable contract business.
TRADE ISSUES
Nucor’s continued involvement in trade issues is a critical part of our efforts to support the long-term success of our steel-making operations. Unfairly traded, illegally dumped steel imports have devastated the U.S. steel industry and its workers. In 2002, the Bush Administration implemented Section 201 to help the domestic steel industry recover from the illegal and predatory trading practices of foreign competitors. In December 2003, the Administration chose to end prematurely the temporary steel safeguard tariffs; however, we are optimistic about the Administration’s commitment to the vigorous enforcement of U.S. trade laws and the President’s promise to work with Congress to achieve a long-term solution to illegal dumping and other unfair trade practices that necessitated Section 201. Nucor actively supports several organizations that promote free and fair trade and that oppose currency manipulation.
ENERGY
Historically, U.S.-based manufacturers have enjoyed competitive energy costs that have allowed them to compete on an equal footing in what is becoming more and more a global market. In recent decades, our government has allowed a growing over-reliance on natural gas for the generation of electricity, while at the same time preventing access to some of the most promising areas for natural gas exploration. As a result, natural gas prices have increased from less than $2.00 per mmbtu in the 1990’s (NYMEX Henry-Hub pricing) to a peak of more than $15.00 per mmbtu in December 2005. Since an increasing share of electricity is now generated using natural gas, higher natural gas prices are also increasing costs for consumers of electricity.
OPERATIONS REVIEW
14
Nucor actively supports several organizations that are promoting a more rational energy policy. We believe this is critical not only for our future business success, but also for the future of the U.S. economy.
NEWER FACILITIES AND EXPANSIONS
As part of our long-term growth strategy, Nucor continues to invest in existing operations, make greenfield investments utilizing advantageous new technologies and pursue acquisitions that are accretive to earnings. Capital expenditures in the steel mill segment totaled $201.1 million, $242.5 million and $216.0 million in 2003, 2004 and 2005, respectively.
In late 2003, the sheet mill in Berkeley County, South Carolina, completed construction and began trials of a vacuum degasser. The degasser has allowed Nucor to expand this facility’s product capacity into deep drawing steel grades. As a result of this successful project, in 2005 Nucor announced two additional vacuum degasser projects at the sheet mills in Decatur, Alabama, and in Hickman, Arkansas, with a capital budget of less than $20.0 million at each location. Nucor also operates vacuum degassers at its sheet mill in Crawfordsville, Indiana, and its SBQ bar mill in Norfolk, Nebraska. We expect to continue advancement and participation in more value-added business in the automotive, appliance, lawn and garden, and heating-ventilation-air conditioning markets in 2006.
During the third quarter of 2004, Nucor purchased substantially all of the assets of Corus Tuscaloosa for a cash purchase price of approximately $89.4 million. This plate mill had an initial annual capacity of about 800,000 tons and complements the product offering of our Hertford County plate mill with thinner gauges of coiled and cut-to-length plate. Our continued investments in this facility combined with the benefits of our incentive pay program have increased capacity to 1,200,000 tons currently. This acquisition was immediately accretive to earnings and made significant operating contributions in 2004 and 2005.
Also in the third quarter of 2004, Nucor purchased certain cold rolling assets from Worthington, located adjacent to our Decatur, Alabama sheet mill, for a cash purchase price of approximately $80.3 million. The purchased assets include all of the buildings, a pickle line, four-stand tandem mill, temper mill and annealing furnaces. This modern 1,000,000-ton cold mill with 600,000 tons of annealing capacity was constructed in 1998 and together with our vacuum degasser project described above complements our strategy to serve value-added customers in the Southeast market.
In September 2004, Nucor acquired the assets of an idled direct reduced iron (“DR1”) plant located in Louisiana. These assets have been moved to Trinidad and construction is well under way. We expect DRI production to begin in the fourth quarter of 2006 with an annual capacity of 1,800,000 metric tons per year. The Trinidad site benefits from a low cost supply of natural gas and favorable logistics for receipt of Brazilian iron ore and shipment of DRI to the U.S. This new entity is named Nu-lron Unlimited (“Nu-lron”) and has a capital budget of approximately $225.0 million.
In June 2005, Nucor’s wholly owned subsidiary, Nucor Steel Marion, Inc., purchased substantially all of the assets of Marion Steel for a cash purchase price of approximately $110.7 million. The facility is a bar products mill that manufactures angles, flats, rebar, rounds and signposts. Located in Marion, Ohio, the mill is in close proximity to 60% of the steel consumption in the United States. The facility has already grown its capacity from 400,000 tons to 450,000 tons largely as a result of our incentive-based compensation program.
COMMERCIALIZATION OF NEW TECHNOLOGIES
In April 2002, Nucor entered a joint venture with The Rio Tinto Group, Mitsubishi Corporation and Chinese steel maker Shougang Corporation to construct a commercial Hlsmelt® plant in Kwinana, Western Australia. The Hlsmelt process converts iron ore fines and coal fines to liquid metal, eliminating the need for a blast furnace, sinter/pellet plants and coke ovens. Nucor has a 25% interest in the joint venture that owns the Hlsmelt commercial plant. Construction was completed in 2005 and on January 24, 2006, the Hlsmelt team completed a 48 consecutive day campaign of iron-making. This plant has an initial annual capacity of 800,000 metric tons and is expandable to over 1,500,000 metric tons at a very attractive capital cost.
Nucor began operations of its 100% owned Castrip facility in Crawfordsville, Indiana, in May 2002. This facility uses the breakthrough technology of strip casting, to which Nucor holds exclusive rights in the United States and Brazil. Strip casting involves the direct casting of molten steel into final shape and thickness without further hot or cold rolling. This process allows lower investment and operating costs, reduced energy consumption and smaller scale plants than can be economically built with current technology. This process also reduces the overall environmental impact of producing steel by generating significantly lower emissions, particularly NOx. In 2005, Nucor announced that the Castrip process had achieved commercial viability and that Blytheville, Arkansas, had been selected as the second Nucor location for a Castrip operation in the United States. Nucor expects to establish at least one joint venture partner overseas in 2006 to utilize the Castrip technology.
OPERATIONS REVIEW
15
In April 2003, Nucor entered a joint venture with Companhia Vale do Rio Doce (“CVRD”) to construct and operate an environmentally friendly pig iron project in northern Brazil. The project, named Ferro Gusa Carajás S.A. (“FGC”), will utilize two conventional mini-blast furnaces to produce about 380,000 metric tons of pig iron per year in its initial phase, using iron ore from CVRD’s Carajás mine in northern Brazil. The charcoal source will be exclusively from eucalyptus trees grown in a cultivated forest of 82,000 acres with the total project encompassing approximately 200,000 acres in northern Brazil. The cultivated forest removes more carbon dioxide from the atmosphere than the blast furnace emits. Production of pig iron began in the fourth quarter of 2005. It is anticipated that Nucor will purchase all of the production of the plant.
The FGC project, together with the Nu-Iron and Hlsmelt projects discussed above, represent the initial steps in Nucor’s raw materials strategy to control 6,000,000 to 7,000,000 tons per year of our iron units consumption.
OPERATIONS REVIEW
16
STEEL PRODUCTS SEGMENT
VULCRAFT Nucor is the nation’s largest producer of open-web steel joists, joist girders and steel deck, which are used for non-residential building construction.
OPERATIONS
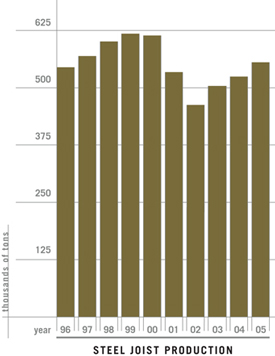
Steel joists and joist girders are produced and marketed nationally through seven Vulcraft facilities located in South Carolina, Nebraska, Alabama, Texas, Indiana, Utah and New York. Current annual production capacity is approximately 715,000 tons. In 2005, Vulcraft produced 554,000 tons of steel joists and joist girders, an increase of 6% from the 522,000 tons produced in 2004.
Material costs, primarily steel, were approximately 50% of the joist sales dollar in 2005 (53% in 2004). Vulcraft obtained 99% of its steel requirements for joists and joist girders from the Nucor bar mills in both 2005 and 2004. Freight costs for joists and joist girders were less than 10% of the sales dollar in 2005 and 2004. Vulcraft maintains an extensive fleet of trucks to ensure and control on-time delivery.
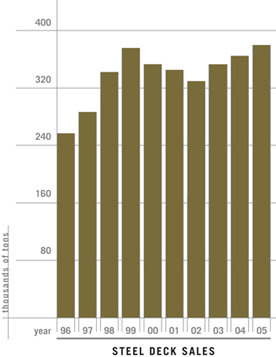
The Vulcraft facilities in South Carolina, Nebraska, Alabama, Texas, Indiana and New York produce steel deck. Current deck annual production capacity is approximately 430,000 tons. Vulcraft steel deck sales increased 4% from 364,000 tons in 2004 to a record 380,000 tons in 2005. Coiled sheet steel was approximately 62% of the steel deck sales dollar in 2005 (54% in 2004). In 2005 and 2004, Vulcraft obtained 99% of its steel requirements for steel deck production from the Nucor sheet mills. For 2005 and 2004, freight costs for deck were less than 10% of the sales dollar.
Production employees of Vulcraft work with a group incentive system that provides increased compensation each week for increased performance.
MARKETS AND MARKETING
Steel joists, joist girders and steel decking are used extensively as part of the roof and floor support systems in manufacturing buildings, retail stores, shopping centers, warehouses, schools, churches, hospitals and, to a lesser extent, in multi-story buildings and apartments. Building support systems using joists, joist girders and steel deck are frequently more economical than other systems.
Steel joists and joist girder sales are obtained by competitive bidding. Vulcraft quotes on a significant percentage of the domestic buildings using steel joists and joist girders as part of the support systems. In 2005, Vulcraft supplied more than 40% of total domestic sales of steel joists. Steel deck is specified in the majority of buildings using steel joists and joist girders. In 2005, Vulcraft supplied more than 30% of total domestic sales of steel deck.
Sales of steel joists, joist girders and steel deck are dependent on the non-residential building construction market.
OPERATIONS REVIEW
17
OPERATIONS REVIEW
18
COLD FINISH AND FASTENER Nucor manufactures a variety of products using steel from Nucor mills.
COLD FINISH
Nucor Cold Finish is the largest producer of cold finished bars in the United States and has facilities in Nebraska, South Carolina, Utah and Wisconsin. Three of these facilities were originally constructed by Nucor between 1978 and 1983. In February 2005, Nucor purchased the assets of Fort Howard Steel, Inc.’s (“Fort Howard Steel”) operations in Oak Creek, Wisconsin. This facility has approximately 140,000 tons of annual capacity. The total capacity of the four facilities is approximately 490,000 tons per year.
These facilities produce cold drawn and turned, ground and polished steel bars that are used extensively for shafting and precision machined parts. Nucor Cold Finish produces rounds, hexagons, flats and squares in carbon, alloy and leaded steels. These bars, in turn, are purchased by the automotive, farm machinery, hydraulic, appliance and electric motor industries, as well as by service centers. Nucor Cold Finish bars are used in tens of thousands of products. A few examples include anchor bolts, farm machinery, hydraulic cylinders, shafting for air conditioner compressors, ceiling fan motors, garage door openers, electric motors and lawn mowers.
All four facilities are among the most modern in the world and use in-line electronic testing to ensure outstanding quality. Nucor Cold Finish obtains most of its steel from the Nucor bar mills. This factor, along with the efficient facilities using the latest technology, results in a highly competitive cost structure.
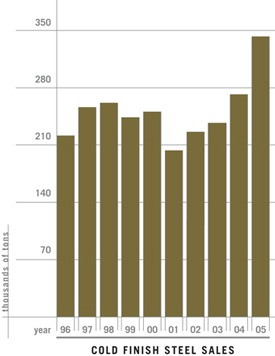
In 2005, sales of cold finished steel products were a record 342,000 tons, an increase of 26% from 2004’s 271,000 tons. The total cold finish market is estimated to be approximately 2,000,000 tons. The Wisconsin facility represents a continuation of our successful value-added strategy and expands our presence in the midwest market. Nucor Cold Finish anticipates opportunities for significant increases in sales and earnings during the next several years.
FASTENER
Nucor Fastener’s state-of-the-art steel bolt-making facility in Indiana produces standard steel hexhead cap screws, hex bolts, structural bolts and custom-engineered fasteners. Fasteners are used in a broad range of markets, including automotive, machine tools, farm implements, construction and military applications.
Annual capacity is more than 75,000 tons, which is less than an estimated 10% of the total market for these products. The modern facility allows Nucor Fastener to maintain competitive pricing in a market currently dominated by foreign suppliers. This operation is highly automated and has fewer employees than comparable facilities. Nucor Fastener obtains much of its steel from the Nucor bar mills.
OPERATIONS REVIEW
19
BUILDING SYSTEMS AND LIGHT GAUGE STEEL FRAMING Nucor manufactures metal buildings and steel framing systems for commercial, industrial and residential construction markets.
BUILDING SYSTEMS
Nucor Building Systems produces metal building systems and components in Indiana, South Carolina and Texas. The annual capacity is more than 145,000 tons. The size of the buildings that can be produced ranges from less than 500 square feet to more than 1,000,000 square feet.
Complete metal building packages can be customized and combined with other materials such as glass, wood and masonry to produce a cost effective, aesthetically pleasing building designed for customers’ special requirements. The buildings are sold primarily through an independent builder distribution network in order to provide fast-track, customized solutions for building owners.
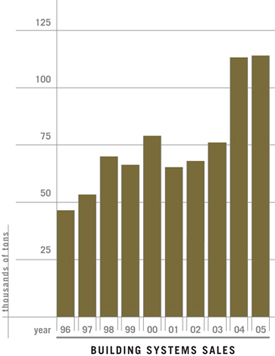
Building systems sales in 2005 were a record 114,000 tons (113,000 tons in 2004). The primary markets are commercial, industrial and institutional buildings, including distribution centers, automobile dealerships, retail centers, schools, warehouses and manufacturing facilities. Nucor Building Systems obtains a significant portion of its steel requirements from the Nucor bar and sheet mills.
LIGHT GAUGE STEEL FRAMING
Nucon Steel specializes in load bearing light gauge steel framing systems for the commercial and residential construction markets with fabrication facilities in Texas and Georgia. Nucon also sells its proprietary products through a growing network of authorized fabricators located throughout the United States.
In 2004, Nucon introduced two new low cost automated fabrication systems for residential construction: the NuWall automated wall panel system and the NuTruss automated truss system. Nucon uses these systems in its residential wall panel and truss fabrication facility in Texas and has formed a separate group within Nucon to sell and license the systems to third parties. Nucor plans to continue to aggressively broaden Nucon Steel’s opportunities through geographic expansion and the introduction of new products.
MANAGEMENT’S DISCUSSION AND ANALYSIS OF FINANCIAL CONDITION AND RESULTS OF OPERATIONS
20
OVERVIEW
Nucor is a domestic manufacturer of steel and steel products whose customers are located primarily in the United States. Additionally, Nucor is the nation’s largest recycler. Nucor reports its results in two segments, steel mills and steel products.
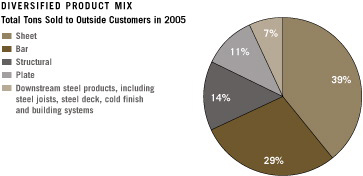
Principal products from the steel mills segment are hot-rolled steel (angles, rounds, flats, channels, sheet, wide-flange beams, pilings, billets, blooms, beam blanks and plate) and cold-rolled steel. Principal products from the steel products segment are steel joists and joist girders, steel deck, cold finished steel, steel fasteners, metal building systems and light gauge steel framing. Hot-rolled steel is manufactured principally from scrap, utilizing electric arc furnaces, continuous casting and automated rolling mills. Cold-rolled steel, cold finished steel, steel joists and joist girders, and steel fasteners are manufactured by further processing of hot-rolled steel. Steel deck is manufactured from cold-rolled steel. In 2005, approximately 92% of the steel mills segment production was sold to non-affiliated customers; the remainder was used internally by the steel products segment.
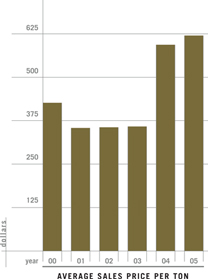
During the last five years, Nucor’s sales have increased 167% from $4.76 billion in 2000 to $12.70 billion in 2005. Average sales price per ton has increased 46% from $425 in 2000 to $621 in 2005. Total tons sold to external customers have increased 83% from 11,189,000 tons in 2000 to 20,465,000 tons in 2005. This growth has been generated through acquisitions, optimizing existing operations and developing traditional greenfield projects using new technologies. Nucor achieved record sales and net earnings in 2005 due to historically high selling prices, margins and shipments, which were aided by our product line diversity.
| | |
| | 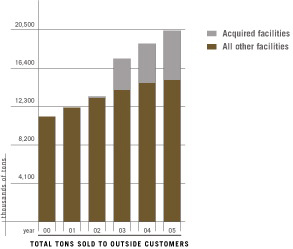 |
In addition to Nucor’s traditional strategy of growing by developing greenfield projects and continually improving existing operations, Nucor’s focus over the past several years has included growing profitably through acquisitions. In the steel mills segment, the capacity of our bar mills has more than doubled over the past five years, increasing from 3,000,000 tons in 2000 to 7,700,000 tons in 2005. This growth was driven by the acquisition of the assets of Auburn Steel in 2001, the assets of Birmingham Steel’s four bar mills in late 2002, and the assets of Marion Steel in 2005. These acquisitions were complemented by ongoing productivity gains obtained at existing bar mills.
The capacity of our sheet mills has increased more than 80% from 5,900,000 tons in 2000 to 10,800,000 tons in 2005 due to the acquisition and start-up in late 2002 of our sheet mill in Decatur, Alabama, as well as by continued productivity advances at our three other sheet mills. The sheet mills are well positioned to advance our strategic plan for greater participation in higher value-added sheet markets.
MANAGEMENT’S DISCUSSION AND ANALYSIS OF FINANCIAL CONDITION AND RESULTS OF OPERATIONS
21
In 2000, Nucor’s plate mill in Hertford County, North Carolina, was in the early stages of start-up and produced 20,000 tons. With the successful start-up of the North Carolina facility and the acquisition of the assets of the Corus Tuscaloosa plate mill in 2004, Nucor’s plate capacity is now approximately 2,800,000 tons, allowing us to continue to benefit from the current robust plate market conditions.
Nucor has also increased its participation in downstream steel products via acquisitions and joint ventures. With the acquisition of Fort Howard Steel’s operations in Oak Creek, Wisconsin, in 2005, Nucor became the largest U.S. producer of cold finished bars.
Nucor established rebar fabrication joint ventures in 2004 and 2005, forming partnerships to grow in the reinforcing steel construction markets with two leaders in the rebar fabrication industry – Harris Steel Group, Inc. and Ambassador Steel Corporation. In 2004, we formed a joint venture with Harris Steel Group to serve the western and northeastern U.S. rebar fabrication markets. This joint venture continues to grow and to generate strong returns. In 2005, we entered into a rebar fabrication joint venture with Ambassador Steel that will allow us to expand Nucor’s rebar fabrication presence into the central and southern regions of the country. This venture, Nufab Rebar, completed its first acquisition last May, purchasing a rebar fabricator serving Louisiana, Mississippi and the Florida panhandle region.
Over the past five years, we have strengthened Nucor’s position as North America’s most diversified steel producer.
COMPARISON OF 2005 TO 2004
NET SALES
Net sales for 2005 increased 12% to $12.70 billion, compared with $11.38 billion in 2004. The average sales price per ton increased 4% from $595 in 2004 to $621 in 2005, while total shipments to outside customers increased 7%. In the steel mills segment, net sales to external customers increased 9% from $10.11 billion in 2004 to $11.06 billion in 2005. Approximately 75% of the sales increase was due to higher sales volume resulting from stronger business conditions for bar, plate and structural products, as well as acquisitions made in 2004 and 2005. The remaining 25% of the increase in sales was due to higher average selling prices. Net sales to external customers in the steel products segment increased 29% from $1.27 billion in 2004 to $1.64 billion in 2005. Approximately 60% of the increase was due to higher average selling prices and approximately 40% of the increase was due to increased volume, reflecting a stronger non-residential construction market.
Nucor established new annual tonnage records in the steel mills segment for total steel shipments and steel shipments to outside customers in 2005. Total steel shipments, including those to the steel products segment, increased 6% to 20,669,000 tons in 2005, compared with 19,464,000 tons in the previous year. Steel sales to outside customers increased 7% to 19,020,000 tons in 2005, compared with 17,787,000 tons in 2004. In the steel products segment, production and shipment volumes increased over the prior year across all major product lines. Steel joist production for 2005 was 554,000 tons, compared with 522,000 tons in the previous year. Steel deck sales were a record 380,000 tons in 2005, compared with 364,000 tons in 2004. Cold finished steel sales were a record 342,000 tons in 2005, compared with 271,000 tons in the previous year aided by the successful integration of the Fort Howard Steel acquisition.
MANAGEMENT’S DISCUSSION AND ANALYSIS OF FINANCIAL CONDITION AND RESULTS OF OPERATIONS
22
COST OF PRODUCTS SOLD
The major component of cost of products sold is raw material costs. The average volume of raw materials used increased approximately 5% from 2004 to 2005, consisting of an increase of 4% in the steel mills segment and an increase of 14% in the steel products segment. The average price of raw materials increased approximately 5% from 2004 to 2005. The average price of raw materials in the steel mills segment and the steel products segment increased 3% and 25%, respectively, from 2004 to 2005. The average scrap and scrap substitute cost per ton used in our steel mills segment was $244 in 2005, an increase of 3% from $238 in 2004. By the fourth quarter of 2005, the average scrap and scrap substitute cost per ton used had decreased to $240 compared with the quarterly high of $278 in the fourth quarter of 2004. The average scrap cost per ton purchased decreased $40 (14%) from December 2004 to December 2005.
Primarily as a result of the decreases in the cost of scrap and scrap substitutes during the year, Nucor incurred a credit to value inventories using the last-in, first-out (“LIFO”) method of accounting of $151.6 million in 2005, compared with a charge of $375.9 million in 2004 when scrap prices were increasing.

Another significant component of cost of products sold for the steel mills segment is energy costs, since steel mills are large consumers of electricity and natural gas. Total energy costs increased approximately $7 per ton from 2004 to 2005 as natural gas prices increased approximately 31% and electricity prices increased approximately 19%. Due to the efficiency of Nucor’s steel mills, however, energy costs remained less than 10% of the sales dollar in 2005 and 2004. We expect that our total energy costs will remain high in 2006. Nucor is hedging a portion of its exposure to the variability of future cash flows for forecasted natural gas purchases over various time periods not exceeding two years. In 2005, the settlement of these hedging transactions reduced cost of products sold by approximately $12.4 million. In addition to these hedges, Nucor has entered into natural gas purchase contracts that commit Nucor to purchase $17.6 million, $22.7 million and $21.5 million of natural gas for production in 2006, 2007 and 2008, respectively, and $562.3 million between 2009 and 2028. These natural gas purchase contracts will primarily supply our direct reduced iron (“DRI”) facility in Trinidad.
In December 2000, Nucor entered into a consent decree with the United States Environmental Protection Agency (“USEPA”) and certain states in order to resolve alleged environmental violations. Under the terms of this decree, Nucor is conducting testing at some of its facilities, performing corrective action where necessary and piloting certain pollution control technologies.
Nucor revises estimates for environmental reserves as additional information becomes available and projects are completed. In 2005, Nucor made approximately $12.2 million in cash payments for remedial efforts and reduced reserves by approximately $9.4 million ($0.4 million and $10.0 million, respectively, in 2004). The most significant components of the decreases of reserves in 2005 are related to successful implementation of alternate environmental technologies that achieve full compliance with the agreement between Nucor and the USEPA through minor operational changes. The most significant components of the decreases in 2004 related to an agreement with the USEPA that certain technologies identified in the consent decree are not feasible and a favorable court ruling that implicated additional potentially responsible parties for the cleanup of an off-site waste-recycling facility.
GROSS MARGIN
Gross margins increased slightly from 20% in 2004 to 21% in 2005. In addition to the events and trends discussed above, gross margins are affected by pre-operating and start-up costs. Nucor defines pre-operating and start-up costs, all of which are expensed, as the losses attributable to facilities or major projects that are either under construction or in the early stages of operation. Once these facilities or projects have attained a utilization rate that is consistent with our similar operating facilities, they are no longer considered by Nucor to be in start-up. Pre-operating and start-up costs of new facilities decreased to $14.4 million in 2005, compared with $28.8 million in 2004. In 2005, these costs primarily related to the relocation of our DRI facility to Trinidad and its refurbishment and to our Hlsmelt project in Australia. In 2004, these costs primarily related to the continuing start-up of the Castrip facility at our sheet mill in Crawfordsville, Indiana. Late in 2004, the Castrip process achieved commercial viability; therefore, the costs associated with this facility have not been included in start-up costs in 2005.
MANAGEMENT’S DISCUSSION AND ANALYSIS OF FINANCIAL CONDITION AND RESULTS OF OPERATIONS
23
MARKETING, ADMINISTRATIVE AND OTHER EXPENSES
The major components of marketing, administrative and other expenses are freight and profit sharing costs. Unit freight costs increased 12% from 2004 to 2005 primarily due to higher fuel costs. Profit sharing costs, which are based upon and fluctuate with pre-tax earnings, increased approximately 6% from 2004 to 2005. In 2005, profit sharing costs included $206.0 million for contributions to a Profit Sharing and Retirement Savings Plan for qualified employees, compared with $172.3 million in 2004. In both 2004 and 2005, all employees except for senior officers received a special cash bonus of $2,000 in addition to their regular profit-sharing payments. These extraordinary bonuses were paid to employees for the achievement of record earnings during the year, resulting in additional profit sharing costs of approximately $22.6 million in 2005 and $21.0 million in 2004. Profit sharing costs also fluctuate based on Nucor’s achievement of certain financial performance goals, including comparisons of Nucor’s financial performance to peers in the steel industry and to other high performing companies.
INTEREST EXPENSE
Net interest expense is detailed below (in thousands):
| | | | | | | | |
Year Ended December 31, | | 2005 | | | 2004 | |
Interest expense | | $ | 36,571 | | | $ | 29,335 | |
Interest income | | | (32,370 | ) | | | (6,983 | ) |
| | | | | | | | |
Interest expense, net | | $ | 4,201 | | | $ | 22,352 | |
| | | | | | | | |
Gross interest expense increased approximately 25% primarily due to increased average interest rates, accompanied by an increase in average long-term debt. Gross interest income increased more than fourfold due to increases in average short-term investments and to a lesser extent due to increases in average interest rates.
MINORITY INTERESTS
Minority interests represent the income attributable to the minority partners of Nucor’s joint venture, Nucor-Yamato Steel Company. Income attributable to minority interests increased from $80.9 million in 2004 to $110.7 million in 2005. Cash distributions to minority interests increased from $84.9 million in 2004 to $89.9 million in 2005. Under the partnership agreement, the minimum amount of cash to be distributed each year to the partners of Nucor-Yamato Steel Company is the amount needed by each partner to pay applicable U.S. federal and state income taxes. In some years, such as 2004, the amount of cash distributed to minority interests exceeds amounts allocated to minority interests based on mutual agreement of the general partners; however, the cumulative amount of cash distributed to partners is less than the cumulative net earnings of the partnership.
OTHER INCOME
In 2005, Nucor received $9.2 million in settlement of claims against third parties related to environmental matters. Nucor has made claims for reimbursement of additional amounts. No amounts have been recorded for such reimbursements, if any, that may be received. In 2004, Nucor sold equipment resulting in pre-tax gains of $1.6 million.
PROVISION FOR INCOME TAXES
Nucor had an effective tax rate of 35.02% in 2005 compared with 35.22% in 2004. In both 2005 and 2004, Nucor recorded refundable state income tax credits of $10.4 million. The Internal Revenue Service is currently examining Nucor’s 2002 and 2003 federal income tax returns. Management believes that it has adequately provided for any adjustments that may arise from this audit.
NET EARNINGS AND RETURN ON EQUITY
Net earnings and earnings per share for 2005 increased 17% and 18%, respectively, to a record $1.31 billion and $8.26 per diluted share, compared with $1.12 billion and $7.02 per diluted share in 2004. Net earnings as a percentage of net sales were 10.3% in 2005 compared with 9.9% in 2004. The 18% increase in earnings per share also reflects the effect of repurchasing approximately 5.6 million shares of outstanding common stock during 2005. Return on average stockholders’ equity was 33.9% and 38.7% in 2005 and 2004, respectively.

MANAGEMENT’S DISCUSSION AND ANALYSIS OF FINANCIAL CONDITION AND RESULTS OF OPERATIONS
24
COMPARISON OF 2004 TO 2003
NET SALES
Net sales for 2004 increased 82% to $11.38 billion, compared with $6.27 billion in 2003. The average sales price per ton increased 66% from $359 in 2003 to $595 in 2004, while total shipments to outside customers increased 9%. In the steel mills segment, net sales to external customers increased 86% from $5.45 billion in 2003 to $10.11 billion in 2004. Approximately 85% of the increase was due to higher average selling prices resulting from increased demand for our products, which affected base prices, and the implementation of a raw materials surcharge to address historically high scrap costs. The remaining 15% of the sales increase was due to higher sales volume resulting from increased demand and the additional production capacity obtained from the acquisition of assets from Corus Tuscaloosa and Worthington in the second half of 2004 and the ramp-up of production at Nucor Steel Decatur, LLC throughout the year. Net sales to external customers in the steel products segment were $819.7 million in 2003, compared with $1.27 billion in 2004, an increase of 55%. Approximately 75% of the increase was due to higher average selling prices, and approximately 25% of the increase was due to increased volume, reflecting an improved non-residential construction market.
Total steel shipments, including those to the steel products segment, increased 10% to 19,464,000 tons in 2004, compared with 17,656,000 tons in the previous year. Steel sales to outside customers increased 9% to 17,787,000 tons in 2004, compared with 16,263,000 tons in 2003. In the steel products segment, production and shipment volumes increased in 2004 over 2003 across all major product lines. Steel joist production for 2004 was 522,000 tons, compared with 503,000 tons in the previous year. Steel deck sales were 364,000 tons, compared with 353,000 tons in 2003. Cold finished steel sales were 271,000 tons in 2004, compared with 237,000 tons in the previous year.
COST OF PRODUCTS SOLD
The average volume of raw materials used increased 12% from 2003 to 2004, consisting of an increase of 12% in the steel mills segment and an increase of 14% in the steel products segment. The average price of raw materials increased 67% from 2003 to 2004. The average price of raw materials in the steel mills segment and the steel products segment increased 71% and 24%, respectively, from 2003 to 2004. The average scrap and scrap substitute cost per ton used in our steel mills segment was $238 in 2004, an increase of 74% from $137 in 2003.
As a result of the increases in the cost of scrap and scrap substitutes, Nucor incurred a charge to value inventories using the LIFO method of accounting of $375.9 million in 2004, compared with a charge of $115.0 million in 2003.
Total energy costs per ton were flat from 2003 to 2004 as higher natural gas prices of approximately 8% were offset by increased production efficiency at our steel mills. These energy costs were less than 10% of the sales dollar in 2004 and 2003.
Nucor made approximately $19.0 million in cash payments for environmental remedial efforts during 2003 and reduced reserves by approximately $8.3 million. In 2004, Nucor made approximately $0.4 million in cash payments for remedial efforts and reduced reserves by approximately $10.0 million. The most significant components of the decreases of reserves in 2003 and 2004 related to an agreement with the USEPA that certain technologies identified in the consent decree are not feasible and a favorable court ruling that implicated additional potentially responsible parties for the cleanup of an off-site waste-recycling facility.
GROSS MARGIN
Gross margins increased from 4% in 2003 to 20% in 2004. In addition to the events and trends discussed above, gross margins improved due to the turnaround achieved at our sheet mill in Decatur, Alabama, and the plate mill in Hertford County, North Carolina, and to the acquisitions we made in the third quarter of 2004. Pre-operating and start-up costs of new facilities decreased to $28.8 million in 2004, compared with $117.5 million in 2003. In 2004, these costs primarily related to the continuing start-up of the Castrip facility at our sheet mill in Crawfordsville, Indiana. In 2003, these costs primarily related to the start-up of the sheet mill in Decatur, Alabama, and the Castrip facility.
MARKETING, ADMINISTRATIVE AND OTHER EXPENSES
Unit freight costs increased 2% from 2003 to 2004. Profit sharing costs, which are based upon and fluctuate with pre-tax earnings, increased fifteen-fold from 2003 to 2004. In 2004, profit sharing costs included $172.3 million for contributions to a Profit Sharing and Retirement Savings Plan for qualified employees, compared with $8.9 million in 2003. Profit sharing costs in 2004 included an additional $21.0 million in extraordinary bonuses paid to employees for the achievement of record earnings during the year. All employees except for senior officers received two special cash bonuses of $1,000 each in July and November in addition to their regular profit-sharing payments.
MANAGEMENT’S DISCUSSION AND ANALYSIS OF FINANCIAL CONDITION AND RESULTS OF OPERATIONS
25
INTEREST EXPENSE
Net interest expense is detailed below(in thousands):
| | | | | | | | |
Year Ended December 31, | | 2004 | | | 2003 | |
Interest expense | | $ | 29,335 | | | $ | 27,152 | |
Interest income | | | (6,983 | ) | | | (2,525 | ) |
| | | | | | | | |
Interest expense, net | | $ | 22,352 | | | $ | 24,627 | |
| | | | | | | | |
Interest expense, net of interest income, decreased from 2003 to 2004 primarily due to an increase in average short-term investments, partially offset by an increase in average long-term debt.
MINORITY INTERESTS
Income attributable to minority interests increased from $23.9 million in 2003 to $80.9 million in 2004. Cash distributions to minority interests increased from $63.3 million in 2003 to $84.9 million in 2004.
OTHER INCOME
In 2004 and 2003, Nucor sold equipment resulting in pre-tax gains of $1.6 million and $4.4 million, respectively. In 2003, Nucor received $7.1 million, related to graphite electrodes anti-trust settlements. Producers of graphite electrodes, which are used by Nucor to deliver energy in electric arc furnaces, have entered into several settlement agreements with their customers as the result of a price fixing investigation by the Department of Justice that became public in 1997. No settlements have been received since 2003, and we do not expect to receive any further graphite electrodes settlements.
PROVISION FOR INCOME TAXES
Nucor had an effective tax rate of 35.22% in 2004 compared with 6.12% in 2003. The higher tax rate in 2004 is primarily due to the effect of increased pre-tax earnings, partially offset by the resolution of certain tax issues in the second half of 2004. In 2004 and 2003, Nucor recorded refundable state income tax credits of $10.4 million and $10.5 million, respectively.
NET EARNINGS AND RETURN ON EQUITY
Net earnings and earnings per share for 2004 increased approximately eighteen-fold to $1.12 billion and $7.02 per diluted share, respectively, compared with $62.8 million and $0.40 per diluted share in 2003. Net earnings as a percentage of net sales were 9.9% in 2004 compared with 1.0% in 2003. Return on average equity was 38.7% and 2.7% in 2004 and 2003, respectively.
LIQUIDITY AND CAPITAL RESOURCES
Cash flows provided by operating activities provide us with a significant source of liquidity. When needed, we also have external short-term financing sources available including the issuance of commercial paper and borrowings under our bank credit facilities. We also issue long-term debt from time to time. We have earned long-term debt ratings of A+ by Standard and Poor’s and Al by Moody’s Investors Services, the highest ratings of any metals and mining company in North America. We believe our strong financial position and our industry-high credit rating provide us with flexibility and significant capacity to obtain additional capital on a cost-effective basis.
We anticipate that cash flows from operations and our existing borrowing capacity will be sufficient to fund expected normal operating costs, working capital, dividends and capital expenditures for our existing facilities. Any future significant acquisitions could require additional financing from external sources.
During 2005, cash and short-term investments increased 136% from $779.0 million to $1.84 billion and working capital increased 34% from $2.11 billion to $2.82 billion. The current ratio increased from 3.0 at December 31, 2004 to 3.2 at December 31, 2005. Approximately $144.1 million and $71.1 million of the cash and short-term investments position at December 31, 2005 and December 31, 2004, respectively, was held by our 51%-owned joint venture, Nucor-Yamato Steel Company. We have a simple capital structure with no off-balance sheet arrangements or relationships with unconsolidated special purpose entities. Nucor uses derivative financial instruments from time-to-time primarily to manage the exposure to price risk related to natural gas purchases used in the production process and to manage exposure to changes in interest rates on outstanding debt instruments.
MANAGEMENT’S DISCUSSION AND ANALYSIS OF FINANCIAL CONDITION AND RESULTS OF OPERATIONS
26
| | | | | | |
| | | 2005 | | (in thousands) 2004 |
December 31, | | |
Cash and short-term investments | | $ | 1,837,510 | | $ | 779,049 |
Cash and short-term investments held by Nucor-Yamato | | | 144,079 | | | 71,081 |
Working capital | | | 2,815,854 | | | 2,109,158 |
Current ratio | | | 3.2 | | | 3.0 |
OPERATING ACTIVITIES
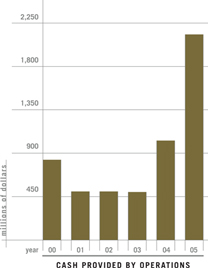
Nucor generated cash provided by operating activities of a record $2.14 billion in 2005 compared with $1.02 billion in 2004, an increase of 108%. This increase was the result of the 17% increase in net earnings and the increase in changes in operating assets and liabilities (exclusive of acquisitions) that provided cash of $357.6 million in 2005 compared with using cash of $580.8 million in 2004. Accounts receivable increased $19.4 million in 2005 versus an increase of $354.9 million in 2004. Net sales in the fourth quarter of 2004 were significantly higher than in the fourth quarter of the previous year, resulting in more accounts receivable at year-end. In 2004, inventories increased to a record high level due to increased quantities and increased purchase costs. Inventories decreased in 2005 due to reduced inventory levels accompanied by purchase costs declining from the record highs experienced in the fourth quarter of 2004.
INVESTING ACTIVITIES
Our business is capital intensive; therefore, cash used in investing activities primarily represents capital expenditures for new facilities, the expansion and upgrading of existing facilities and the acquisition of the assets of other companies. Cash used in investing activities decreased slightly to $527.5 million in 2005 compared with $534.9 million in 2004. Nucor invested $331.5 million in new facilities (exclusive of acquisitions) and expansion or upgrading of existing facilities in 2005 compared with $285.9 million in 2004.
Existing cash and short-term investments funded the acquisitions of the assets of Fort Howard Steel and Marion Steel in 2005 and of Corus Tuscaloosa and Worthington in 2004. Nucor expects to continue to pursue profitable growth through acquisitions.
FINANCING ACTIVITIES
Cash used in financing activities increased to $550.7 million in 2005 compared with $61.1 million in 2004. In 2005, Nucor increased its base dividend and paid a quarterly supplemental dividend, resulting in dividend payments tripling from $69.7 million in 2004 to $209.8 million in 2005. In 2004, Nucor issued $20.0 million aggregate principal amount of variable rate industrial revenue bonds due 2020.
During 2005, the board of directors reactivated the previously approved stock repurchase program, and Nucor repurchased approximately 5.6 million shares of common stock at a cost of approximately $291.2 million. In December 2005, the board approved the repurchase of up to an additional 10.0 million shares. A total of approximately 12.9 million shares remains authorized for repurchase. There were no repurchases during 2004.
The percentage of long-term debt to total capital (long-term debt plus minority interests plus stockholders’ equity) was 17% and 20% at year-end 2005 and 2004, respectively.
In 2005, Nucor entered into a new five-year unsecured revolving credit facility maturing in June 2010 that provides for up to $700.0 million in revolving loans. Up to the equivalent of $600.0 million of the new credit facility will be available for foreign currency loans, and up to $450.0 million is available for the issuance of letters of credit. The new credit facility
MANAGEMENT’S DISCUSSION AND ANALYSIS OF FINANCIAL CONDITION AND RESULTS OF OPERATIONS
27
may be increased by up to $300.0 million at the election of the Company in accordance with the terms set forth in the credit agreement. No borrowings were outstanding under the credit facility as of December 31, 2005. In connection with the new credit facility, in 2005 Nucor terminated (a) a $125.0 million 364-day revolver maturing in September 2005, and (b) a $300.0 million multi-currency revolver maturing October 2007. At the date of termination, there were no borrowings under either terminated credit facility.
MARKET RISK
All of Nucor’s industrial revenue bonds have variable interest rates that are adjusted weekly or annually. These industrial revenue bonds represent 43% of Nucor’s long-term debt outstanding at December 31, 2005. The remaining 57% of Nucor’s long-term debt is at fixed rates. Future changes in interest rates are not expected to significantly impact earnings. From time to time, Nucor makes use of interest rate swaps to manage interest rate risk. As of December 31, 2005, there were no such contracts outstanding. Nucor’s investment practice is to invest in securities that are highly liquid with short maturities. As a result, we do not expect changes in interest rates to have a significant impact on the value of our investment securities.
Nucor also uses derivative financial instruments from time to time primarily to manage its exposure to price risk related to natural gas purchases used in the production process. Nucor, generally, does not enter into derivative instruments for any purpose other than hedging the cash flows associated with specific volumes of commodities that will be purchased and consumed in future periods and hedging the exposures related to changes in the fair value of outstanding fixed rate debt instruments. Nucor recognizes all derivative instruments in the consolidated balance sheets at fair value.
Nucor has ventures in Brazil and Australia that are in the early stages of operations and owns the DRI facility in Trinidad that is currently under construction. Accordingly, Nucor is exposed to the effects of currency fluctuations in those countries. Nucor presently does not hedge its exposure to foreign currency risk.
CONTRACTUAL OBLIGATIONS AND OTHER COMMERCIAL COMMITMENTS
The following table sets forth our contractual obligations and other commercial commitments as of December 31, 2005 for the periods presented(in thousands).
| | | | | | | | | | | | | | | |
| | | Payments Due By Period |
Contractual Obligations | | Total | | 2006 | | 2007 - 2008 | | 2009 - 2010 | | 2011 and
thereafter |
Long-term debt | | $ | 923,550 | | $ | 1,250 | | $ | — | | $ | 180,400 | | $ | 741,900 |
Estimated interest on long-term debt(1) | | | 514,778 | | | 42,048 | | | 84,051 | | | 62,776 | | | 325,903 |
Operating leases | | | 13,402 | | | 3,041 | | | 1,976 | | | 660 | | | 7,725 |
Raw material purchase commitments(2) | | | 2,724,388 | | | 769,146 | | | 561,575 | | | 603,921 | | | 789,746 |
Utility purchase commitments(2) | | | 928,999 | | | 170,972 | | | 148,710 | | | 73,625 | | | 535,692 |
Other unconditional purchase obligations(3) | | | 142,842 | | | 140,601 | | | 2,241 | | | — | | | — |
Other long-term obligations(4) | | | 118,233 | | | 7,247 | | | 6,309 | | | 1,947 | | | 102,730 |
| | | | | | | | | | | | | | | |
Total contractual obligations | | $ | 5,366,192 | | $ | 1,134,305 | | $ | 804,862 | | $ | 923,329 | | $ | 2,503,696 |
| | | | | | | | | | | | | | | |
| (1) | Interest is estimated using applicable rates at December 31, 2005 for Nucor’s outstanding fixed and variable rate debt. |
| (2) | Nucor enters into contracts for the purchase of scrap and scrap substitutes, iron-ore, electricity, natural gas and other raw materials and related services, a significant portion of which pertain to our DRI facility in Trinidad. These contracts include multi-year commitments and minimum annual purchase requirements and are valued at prices in effect on December 31, 2005 or according to the contract terms. These contracts are part of normal operations and are reflected in historical operating cash flow trends. We do not believe such commitments will adversely affect our liquidity position. |
| (3) | Purchase obligations include commitments for capital expenditures on operating machinery and equipment. |
| (4) | Other long-term obligations include amounts associated with Nucor’s early retiree medical benefits and management compensation. |
DIVIDENDS
Nucor has increased its cash dividend every year since it began paying dividends in 1973. In 2005, in addition to raising the base dividend, the board of directors implemented a supplemental dividend based on Nucor’s strong performance in 2004.
MANAGEMENT’S DISCUSSION AND ANALYSIS OF FINANCIAL CONDITION AND RESULTS OF OPERATIONS
28
Nucor paid dividends of $1.33 per share in 2005 compared with $0.44 per share in 2004. In February 2006, the board of directors announced an increase in the base dividend to $0.20 per share and in the supplemental dividend to $0.50 per share, resulting in an annualized dividend rate of $2.80 per share. The supplemental dividend of $0.50 per share represents a portion of a total supplemental dividend estimated to be $2.00 per share to be paid over the next four quarterly dividend payments. The payment of any future supplemental dividends will depend upon many factors, including Nucor’s earnings, cash flows and financial position.
OUTLOOK
Our objective is to maintain a strong balance sheet while pursuing profitable growth. We expect to obtain additional capacity through expansions at our existing steel mills, greenfield construction utilizing advantageous new technologies and future acquisitions. Capital expenditures are currently projected to be approximately $400.0 million in 2006, an increase of 21% over 2005. This expected increase in capital expenditures is primarily due to the cost of construction and refurbishment of the DRI plant that we have relocated to Trinidad. Funds provided from operations, existing credit facilities and new borrowings are expected to be adequate to meet future capital expenditure and working capital requirements for existing operations. Nucor believes that it has the financial ability to borrow significant additional funds and still maintain reasonable leverage in order to finance major acquisitions.
In the steel mills segment, total steel production is anticipated to increase over the next several years from the record 20,332,000 tons produced in 2005. Our current estimated annual capacity is approximately 25,000,000 tons, and additional capacity may be obtained through upgrading existing facilities as well as through acquisitions. We expect that demand in non-residential construction will continue to strengthen throughout 2006 and that Nucor will continue to benefit from product line diversification. Although scrap prices remain at high levels, higher average selling prices, achieved through increased demand and the raw material surcharge, will continue to provide appropriate margins for our products. This surcharge will continue to ensure that we will be able to purchase the scrap needed to fill our customers’ needs.
Nucor continues to build market leadership positions in attractive downstream steel products businesses. We anticipate that the continued improvement in non-residential building will increase sales and the volume supplied by Vulcraft and Nucor Building Systems in 2006. Cold Finish sales will increase as additional capacity from our recent acquisition expands our presence in the midwest market and as our product line expands to include larger sizes and more leaded bars.
We recognize that uncertainty in external factors such as raw materials costs, growth rate of the economy, the level of imports and consolidation in the industry will have a significant impact on our results. In 2006, we will continue working towards our goal of controlling approximately 6,000,000 to 7,000,000 tons of our supply of high-quality scrap substitutes. Our raw materials strategy is driven by Nucor’s ongoing expansion of our steel product portfolio into higher quality grades. We will continue our defense of fair trade and will continue to point out examples of unfair trade policies and practices until they are fixed. We will continue to pursue strategic acquisitions that expand our platform for generating earnings and attractive returns on our stockholders’ capital. While we cannot control these outside forces, Nucor will continue to be at the forefront of anticipating and addressing the issues that this uncertainty in external factors raises for us and other steel producers.
CRITICAL ACCOUNTING POLICIES AND ESTIMATES
Our discussion and analysis of our financial condition and results of operations are based upon our consolidated financial statements, which have been prepared in accordance with accounting principles generally accepted in the United States of America. The preparation of these financial statements requires us to make estimates and assumptions that affect the reported amounts of assets and liabilities, the disclosure of contingent assets and liabilities at year end and the reported amount of revenues and expenses during the year. On an ongoing basis, we evaluate our estimates, including those related to the valuation allowances for receivables; the carrying value of property, plant and equipment; reserves for environmental obligations; and income taxes. Our estimates are based on historical experience and various other assumptions that we believe to be reasonable under the circumstances, the results of which form the basis for making judgments about the carrying values of assets and liabilities that are not readily apparent from other sources. Accordingly, actual costs could differ materially from these estimates under different assumptions or conditions.
We believe the following critical accounting policies affect our significant judgments and estimates used in the preparation of our consolidated financial statements.
MANAGEMENT’S DISCUSSION AND ANALYSIS OF FINANCIAL CONDITION AND RESULTS OF OPERATIONS
29
REVENUE RECOGNITION
We recognize revenue when title passes to the customer, which is typically upon shipment.
ALLOWANCES FOR DOUBTFUL ACCOUNTS
We maintain allowances for doubtful accounts for estimated losses resulting from the inability of our customers to make required payments. If the financial condition of our customers were to deteriorate, resulting in an impairment of their ability to make payments, additional allowances may be required.
INVENTORIES
Inventories are stated at the lower of cost or market. The cost of most inventories is measured on the LIFO method of accounting. The LIFO method allocates the most recent costs to cost of products sold, thereby recognizing into operating results fluctuations in raw material, energy and other capitalizable costs more quickly than other methods. The cost of other inventories is determined on the first-in, first-out (“FIFO”) method.
ASSET IMPAIRMENTS
We evaluate the impairment of our property, plant and equipment on an individual asset basis or by logical groupings of assets. Asset impairments are recognized whenever changes in circumstances indicate that the carrying amounts of those productive assets exceed their projected undiscounted cash flows. When it is determined that an impairment exists, the related assets are written down to estimated fair market value.
ENVIRONMENTAL REMEDIATION
We are subject to environmental laws and regulations established by federal, state and local authorities, and we make provision for the estimated costs related to compliance. Undiscounted remediation liabilities are accrued based on estimates of known environmental exposures. The accruals are reviewed periodically and, as investigations and remediation proceed, adjustments are made as we believe are necessary. The accruals are not reduced by possible recoveries from insurance carriers or other third parties. Our measurement of environmental liabilities is based on currently available facts, present laws and regulations, and current technology.
INCOME TAXES
We account for income taxes in accordance with Statement of Financial Accounting Standards (“SFAS”) No. 109, “Accounting for Income Taxes.” We estimate our actual current tax expense and assess temporary differences that exist due to differing treatments of items for tax and financial statement purposes. These differences result in the recognition of deferred tax assets and liabilities. The deferred tax assets and liabilities are measured using tax rates expected to apply to taxable income in the years in which those temporary differences are expected to be recovered or settled. The effect on deferred tax assets and liabilities of a change in tax rates is recognized in the period in which the change is enacted. We assess the realizability of deferred tax assets on an ongoing basis by considering whether it is more likely than not that some portion of the deferred tax assets will not be realized. If it is more likely than not, in our judgment, that the deferred tax assets will not be realized, we provide a valuation allowance.
RECENT ACCOUNTING PRONOUNCEMENTS
The Financial Accounting Standards Board (“FASB”) has issued SFAS No. 123(R), “Share Based Payment,” which requires all share-based payments to employees, including grants of employee stock options, to be recognized in the financial statements based on their fair values. As required by SFAS No. 123(R), Nucor will begin recognizing compensation costs in the Consolidated Statements of Earnings for all of the equity-based compensation plans in the first quarter of 2006. Compensation cost will be determined using the modified prospective method. Management believes the effect of the adoption of SFAS No. 123(R) on our earnings will be comparable to the pro forma disclosures included in Note 1 to our Consolidated Financial Statements and does not expect the adoption to have a material impact on Nucor’s consolidated financial position.
The FASB has issued SFAS No. 151, “Inventory Costs, an amendment of ARB No. 43, Chapter 4,” which clarifies that abnormal amounts of idle facility expense, freight, handling costs and spoilage should be recognized as current period charges and requires the allocation of fixed production overheads to inventory based on the normal capacity of the production facilities. We are required to adopt the provisions of this statement in the first quarter of 2006. Management does not expect the adoption of SFAS No. 151 to have a material impact on Nucor’s consolidated financial position and results of operations.
SIX-YEAR FINANCIAL REVIEW
33
(dollar amounts in thousands, except per share data)
| | | | | | | | | | | | | | | | | | | | | | | | |
| | | 2005 | | | 2004 | | | 2003 | | | 2002 | | | 2001 | | | 2000 | |
FOR THE YEAR | | | | | | | | | | | | | | | | | | | | | | | | |
Net sales | | $ | 12,700,999 | | | $ | 11,376,828 | | | $ | 6,265,823 | | | $ | 4,801,777 | | | $ | 4,333,707 | | | $ | 4,756,521 | |
Costs, expenses and other: | | | | | | | | | | | | | | | | | | | | | | | | |
Cost of products sold | | | 10,085,396 | | | | 9,128,872 | | | | 5,996,547 | | | | 4,332,277 | | | | 3,914,278 | | | | 3,929,182 | |
Marketing, administrative and other expenses | | | 493,560 | | | | 415,030 | | | | 165,369 | | | | 175,589 | | | | 150,666 | | | | 183,175 | |
Interest expense (income), net | | | 4,201 | | | | 22,352 | | | | 24,627 | | | | 14,286 | | | | 6,525 | | | | (816 | ) |
Minority interests | | | 110,674 | | | | 80,894 | | | | 23,950 | | | | 79,472 | | | | 103,069 | | | | 151,462 | |
Other income | | | (9,200 | ) | | | (1,596 | ) | | | (11,547 | ) | | | (29,900 | ) | | | (20,200 | ) | | | — | |
| | | | | | | | | | | | | | | | | | | | | | | | |
| | | 10,684,631 | | | | 9,645,552 | | | | 6,198,946 | | | | 4,571,724 | | | | 4,154,338 | | | | 4,263,003 | |
Earnings before income taxes | | | 2,016,368 | | | | 1,731,276 | | | | 66,877 | | | | 230,053 | | | | 179,369 | | | | 493,518 | |
Provision for income taxes | | | 706,084 | | | | 609,791 | | | | 4,096 | | | | 67,973 | | | | 66,408 | | | | 182,610 | |
| | | | | | | | | | | | | | | | | | | | | | | | |
Net earnings | | | 1,310,284 | | | | 1,121,485 | | | | 62,781 | | | | 162,080 | | | | 112,961 | | | | 310,908 | |
| | | | | | |
Net earnings per share: | | | | | | | | | | | | | | | | | | | | | | | | |
Basic | | | 8.34 | | | | 7.08 | | | | 0.40 | | | | 1.04 | | | | 0.73 | | | | 1.90 | |
Diluted | | | 8.26 | | | | 7.02 | | | | 0.40 | | | | 1.04 | | | | 0.73 | | | | 1.90 | |
Dividends declared per share | | | 1.85 | | | | 0.47 | | | | 0.40 | | | | 0.38 | | | | 0.34 | | | | 0.30 | |
Percentage of net earnings to net sales | | | 10.3 | % | | | 9.9 | % | | | 1.0 | % | | | 3.4 | % | | | 2.6 | % | | | 6.5 | % |
Return on average equity | | | 33.9 | % | | | 38.7 | % | | | 2.7 | % | | | 7.2 | % | | | 5.2 | % | | | 14.2 | % |
Capital expenditures | | | 331,466 | | | | 285,925 | | | | 215,408 | | | | 243,598 | | | | 261,146 | | | | 415,405 | |
Depreciation | | | 375,054 | | | | 383,305 | | | | 364,112 | | | | 307,101 | | | | 289,063 | | | | 259,365 | |
Sales per employee | | | 1,159 | | | | 1,107 | | | | 637 | | | | 528 | | | | 531 | | | | 619 | |
| | | | | | |
AT YEAR END | | | | | | | | | | | | | | | | | | | | | | | | |
Current assets | | $ | 4,071,553 | | | $ | 3,174,948 | | | $ | 1,620,560 | | | $ | 1,415,362 | | | $ | 1,373,666 | | | $ | 1,379,529 | |
Current liabilities | | | 1,255,699 | | | | 1,065,790 | | | | 629,595 | | | | 591,536 | | | | 484,159 | | | | 558,068 | |
| | | | | | | | | | | | | | | | | | | | | | | | |
Working capital | | | 2,815,854 | | | | 2,109,158 | | | | 990,965 | | | | 823,826 | | | | 889,507 | | | | 821,461 | |
Cash provided by operating activities | | | 2,136,615 | | | | 1,024,756 | | | | 493,801 | | | | 497,220 | | | | 495,115 | | | | 820,755 | |
Current ratio | | | 3.2 | | | | 3.0 | | | | 2.6 | | | | 2.4 | | | | 2.8 | | | | 2.5 | |
Property, plant and equipment | | | 2,855,717 | | | | 2,818,307 | | | | 2,817,135 | | | | 2,932,058 | | | | 2,365,655 | | | | 2,329,421 | |
Total assets | | | 7,138,787 | | | | 6,133,207 | | | | 4,492,353 | | | | 4,381,001 | | | | 3,759,348 | | | | 3,710,868 | |
Long-term debt | | | 923,550 | | | | 923,550 | | | | 903,550 | | | | 894,550 | | | | 460,450 | | | | 460,450 | |
Percentage of debt to capital | | | 17.1 | % | | | 20.3 | % | | | 26.4 | % | | | 26.0 | % | | | 15.6 | % | | | 15.9 | % |
Stockholders’ equity | | | 4,279,788 | | | | 3,455,985 | | | | 2,342,077 | | | | 2,322,990 | | | | 2,201,461 | | | | 2,130,952 | |
Per share | | | 27.59 | | | | 21.67 | | | | 14.90 | | | | 14.86 | | | | 14.15 | | | | 13.73 | |
Shares outstanding | | | 155,110 | | | | 159,512 | | | | 157,180 | | | | 156,360 | | | | 155,630 | | | | 155,166 | |
Stockholders | | | 120,000 | | | | 82,000 | | | | 61,000 | | | | 64,000 | | | | 47,000 | | | | 51,000 | |
Employees | | | 11,300 | | | | 10,600 | | | | 9,900 | | | | 9,800 | | | | 8,400 | | | | 7,900 | |
MANAGEMENT’S REPORT AND REPORT OF INDEPENDENT REGISTERED PUBLIC ACCOUNTING FIRM
34
MANAGEMENT’S REPORT on internal control over financial reporting
Nucor’s management is responsible for establishing and maintaining adequate internal control over financial reporting, as such term is defined in Rules 13a-15(f) and 15d-15(f) under the Securities and Exchange Act of 1934, as amended.
Because of its inherent limitations, internal control over financial reporting may not prevent or detect misstatements. Also, projections of any evaluation of effectiveness to future periods are subject to the risk that controls may become inadequate because of changes in conditions, or that the degree of compliance with the policies or procedures may deteriorate.
Management assessed the effectiveness of Nucor’s internal control over financial reporting as of December 31, 2005. In making this assessment, management used criteria set forth by the Committee of Sponsoring Organizations of the Treadway Commission (COSO) inInternal Control-Integrated Framework.
Based on its assessment, management concluded that Nucor’s internal control over financial reporting was effective as of December 31, 2005. PricewaterhouseCoopers LLP, an independent registered public accounting firm, has audited management’s assessment of Nucor’s internal control over financial reporting as stated in their report, which is included herein.
REPORTOF INDEPENDENT REGISTERED PUBLIC ACCOUNTING FIRM
PricewaterhouseCoopers LLP
March 7, 2006
To Stockholders and Board of Directors
Nucor Corporation:
We have completed integrated audits of Nucor Corporation’s 2005 and 2004 consolidated financial statements and of its internal control over financial reporting as of December 31, 2005, and an audit of its 2003 consolidated financial statements in accordance with the standards of the Public Company Accounting Oversight Board (United States). Our opinions on Nucor Corporation’s 2005, 2004 and 2003 consolidated financial statements and on its internal control over financial reporting as of December 31, 2005, based on our audits, are presented below.
CONSOLIDATED FINANCIAL STATEMENTS
In our opinion, the accompanying consolidated balance sheets and the related consolidated statements of earnings, stockholders’ equity and cash flows present fairly, in all material respects, the financial position of Nucor Corporation and its subsidiaries at December 31, 2005 and December 31, 2004, and the results of their operations and their cash flows for each of the three years in the period ended December 31, 2005 in conformity with accounting principles generally accepted in the United States of America. These financial statements are the responsibility of the Company’s management. Our responsibility is to express an opinion on these financial statements based on our audits. We conducted our audits of these statements in accordance with the standards of the Public Company Accounting Oversight Board (United States). Those standards require that we plan and perform the audit to obtain reasonable assurance about whether the financial statements are free of material misstatement. An audit of financial statements includes examining, on a test basis, evidence supporting the amounts and disclosures in the financial statements, assessing the accounting principles used and significant estimates made by management, and evaluating the overall financial statement presentation. We believe that our audits provide a reasonable basis for our opinion.
REPORT OF INDEPENDENT REGISTERED PUBLIC ACCOUNTING FIRM
35
INTERNAL CONTROL OVER FINANCIAL REPORTING
Also, in our opinion, management’s assessment, included in the accompanying Management’s Report on Internal Control Over Financial Reporting, that the Company maintained effective internal control over financial reporting as of December 31, 2005 based on criteria established inInternal Control -Integrated Framework issued by the Committee of Sponsoring Organizations of the Treadway Commission (COSO), is fairly stated, in all material respects, based on those criteria. Furthermore, in our opinion, the Company maintained, in all material respects, effective internal control over financial reporting as of December 31, 2005, based on criteria established inInternal Control -Integrated Framework issued by the COSO. The Company’s management is responsible for maintaining effective internal control over financial reporting and for its assessment of the effectiveness of internal control over financial reporting. Our responsibility is to express opinions on management’s assessment and on the effectiveness of the Company’s internal control over financial reporting based on our audit. We conducted our audit of internal control over financial reporting in accordance with the standards of the Public Company Accounting Oversight Board (United States). Those standards require that we plan and perform the audit to obtain reasonable assurance about whether effective internal control over financial reporting was maintained in all material respects. An audit of internal control over financial reporting includes obtaining an understanding of internal control over financial reporting, evaluating management’s assessment, testing and evaluating the design and operating effectiveness of internal control, and performing such other procedures as we consider necessary in the circumstances. We believe that our audit provides a reasonable basis for our opinions.
A company’s internal control over financial reporting is a process designed to provide reasonable assurance regarding the reliability of financial reporting and the preparation of financial statements for external purposes in accordance with generally accepted accounting principles. A company’s internal control over financial reporting includes those policies and procedures that (i) pertain to the maintenance of records that, in reasonable detail, accurately and fairly reflect the transactions and dispositions of the assets of the company; (ii) provide reasonable assurance that transactions are recorded as necessary to permit preparation of financial statements in accordance with generally accepted accounting principles, and that receipts and expenditures of the company are being made only in accordance with authorizations of management and directors of the company; and (iii) provide reasonable assurance regarding prevention or timely detection of unauthorized acquisition, use, or disposition of the company’s assets that could have a material effect on the financial statements.
Because of its inherent limitations, internal control over financial reporting may not prevent or detect misstatements. Also, projections of any evaluation of effectiveness to future periods are subject to the risk that controls may become inadequate because of changes in conditions, or that the degree of compliance with the policies or procedures may deteriorate.
/s/ PricewaterhouseCoopers LLP
Charlotte, North Carolina
CONSOLIDATED STATEMENTS OF EARNINGS
36
CONSOLIDATED STATEMENTS OF EARNINGS(in thousands, except per share data)
| | | | | | | | | | | | |
Year Ended December 31, | | 2005 | | | 2004 | | | 2003 | |
NET SALES | | $ | 12,700,999 | | | $ | 11,376,828 | | | $ | 6,265,823 | |
| | | | | | | | | | | | |
COSTS, EXPENSES AND OTHER: | | | | | | | | | | | | |
Cost of products sold | | | 10,085,396 | | | | 9,128,872 | | | | 5,996,547 | |
Marketing, administrative and other expenses | | | 493,560 | | | | 415,030 | | | | 165,369 | |
Interest expense, net (Note 12) | | | 4,201 | | | | 22,352 | | | | 24,627 | |
Minority interests | | | 110,674 | | | | 80,894 | | | | 23,950 | |
Other income (Note 13) | | | (9,200 | ) | | | (1,596 | ) | | | (11,547 | ) |
| | | | | | | | | | | | |
| | | 10,684,631 | | | | 9,645,552 | | | | 6,198,946 | |
| | | | | | | | | | | | |
EARNINGS BEFORE INCOME TAXES | | | 2,016,368 | | | | 1,731,276 | | | | 66,877 | |
PROVISION FOR INCOME TAXES(Note 14) | | | 706,084 | | | | 609,791 | | | | 4,096 | |
| | | | | | | | | | | | |
NET EARNINGS | | $ | 1,310,284 | | | $ | 1,121,485 | | | $ | 62,781 | |
| | | | | | | | | | | | |
NET EARNINGS PER SHARE (Note 15): | | | | | | | | | | | | |
Basic | | $ | 8.34 | | | $ | 7.08 | | | $ | 0.40 | |
| | | | | | | | | | | | |
Diluted | | $ | 8.26 | | | $ | 7.02 | | | $ | 0.40 | |
| | | | | | | | | | | | |
See notes to consolidated financial statements.
CONSOLIDATED STATEMENTS OF STOCKHOLDERS’ EQUITY
37
CONSOLIDATED STATEMENTS OF STOCKHOLDERS’ EQUITY(in thousands, except per share data)
| | | | | | | | | | | | | | | | | | | | | | | | | | | | | | | | |
| | | COMMON STOCK | | ADDITIONAL
PAID-IN
CAPITAL | | | RETAINED
EARNINGS | | | UNEARNED
COMPENSATION | | | ACCUMULATED OTHER
COMPREHENSIVE INCOME (LOSS) | | | TREASURY STOCK
(at cost) | | | TOTAL
STOCKHOLDERS’
EQUITY | |
| | | Shares | | Amount | | | | | | Shares | | | Amount | | |
BALANCES, December 31, 2002 | | 90,679 | | $ | 36,272 | | $ | 99,396 | | | $ | 2,641,581 | | | $ | — | | | $ | — | | | 12,499 | | | $ | (454,259 | ) | | $ | 2,322,990 | |
| | | | | | | | | | | | | | | | | | | | | | | | | | | | | | | | |
Comprehensive income: | | | | | | | | | | | | | | | | | | | | | | | | | | | | | | | | |
Net earnings in 2003 | | | | | | | | | | | | 62,781 | | | | | | | | | | | | | | | | | | | 62,781 | |
| | | | | | | | | | | | | | | | | | | | | | | | | | | | | | | | |
Total comprehensive income | | | | | | | | | | | | | | | | | | | | | | | | | | | | | | | 62,781 | |
Stock options | | 388 | | | 155 | | | 16,273 | | | | | | | | | | | | | | | | | | | | | | | 16,428 | |
Employee stock compensation and service awards | | | | | | | | 1,730 | | | | | | | | | | | | | | | (22 | ) | | | 802 | | | | 2,532 | |
Cash dividends ($0.40 per share) | | | | | | | | | | | | (62,654 | ) | | | | | | | | | | | | | | | | | | (62,654 | ) |
| | | | | | | | | | | | | | | | | | | | | | | | | | | | | | | | |
BALANCES, December 31, 2003 | | 91,067 | | | 36,427 | | | 117,399 | | | | 2,641,708 | | | | — | | | | — | | | 12,477 | | | | (453,457 | ) | | | 2,342,077 | |
| | | | | | | | | | | | | | | | | | | | | | | | | | | | | | | | |
Comprehensive income: | | | | | | | | | | | | | | | | | | | | | | | | | | | | | | | | |
Net earnings in 2004 | | | | | | | | | | | | 1,121,485 | | | | | | | | | | | | | | | | | | | 1,121,485 | |
Net unrealized loss on hedging derivatives, net of income taxes | | | | | | | | | | | | | | | | | | | | (1,177 | ) | | | | | | | | | | (1,177 | ) |
| | | | | | | | | | | | | | | | | | | | | | | | | | | | | | | | |
Total comprehensive income | | | | | | | | | | | | | | | | | | | | | | | | | | | | | | | 1,120,308 | |
Stock options | | 1,333 | | | 533 | | | 54,685 | | | | | | | | | | | | | | | | | | | | | | | 55,218 | |
Employee stock compensation and service awards | | | | | | | | 11,915 | | | | | | | | (592 | ) | | | | | | (43 | ) | | | 1,497 | | | | 12,820 | |
Amortization of unearned compensation | | | | | | | | | | | | | | | | 200 | | | | | | | | | | | | | | | 200 | |
2-for-1 stock split | | 91,983 | | | 36,793 | | | (36,793 | ) | | | | | | | | | | | | | | 12,437 | | | | | | | | — | |
Cash dividends ($0.47 per share) | | | | | | | | | | | | (74,638 | ) | | | | | | | | | | | | | | | | | | (74,638 | ) |
| | | | | | | | | | | | | | | | | | | | | | | | | | | | | | | | |
BALANCES, December 31, 2004 | | 184,383 | | | 73,753 | | | 147,206 | | | | 3,688,555 | | | | (392 | ) | | | (1,177 | ) | | 24,871 | | | | (451,960 | ) | | | 3,455,985 | |
| | | | | | | | | | | | | | | | | | | | | | | | | | | | | | | | |
Comprehensive income: | | | | | | | | | | | | | | | | | | | | | | | | | | | | | | | | |
Net earnings in 2005 | | | | | | | | | | | | 1,310,284 | | | | | | | | | | | | | | | | | | | 1,310,284 | |
Net unrealized gain on hedging derivatives, net of income taxes | | | | | | | | | | | | | | | | | | | | 55,842 | | | | | | | | | | | 55,842 | |
Reclassification adjustment for gain on settlement of hedging derivatives included in net income, net of income taxes | | | | | | | | | | | | | | | | | | | | (8,065 | ) | | | | | | | | | | (8,065 | ) |
| | | | | | | | | | | | | | | | | | | | | | | | | | | | | | | | |
Total comprehensive income | | | | | | | | | | | | | | | | | | | | | | | | | | | | | | | 1,358,061 | |
Stock options | | 916 | | | 367 | | | 26,709 | | | | | | | | | | | | | | | | | | | | | | | 27,076 | |
Employee stock compensation and service awards | | | | | | | | 17,935 | | | | | | | | (5,095 | ) | | | | | | (249 | ) | | | 4,598 | | | | 17,438 | |
Amortization of unearned compensation | | | | | | | | | | | | | | | | 2,200 | | | | | | | | | | | | | | | 2,200 | |
Treasury stock acquired | | | | | | | | | | | | | | | | | | | | | | | 5,567 | | | | (291,244 | ) | | | (291,244 | ) |
Cash dividends ($1.85 per share) | | | | | | | | | | | | (289,728 | ) | | | | | | | | | | | | | | | | | | (289,728 | ) |
| | | | | | | | | | | | | | | | | | | | | | | | | | | | | | | | |
BALANCES, December 31, 2005 | | 185,299 | | $ | 74,120 | | $ | 191,850 | | | $ | 4,709,111 | | | $ | (3,287 | ) | | $ | 46,600 | | | 30,189 | | | $ | (738,606 | ) | | $ | 4,279,788 | |
| | | | | | | | | | | | | | | | | | | | | | | | | | | | | | | | |
See notes to consolidated financial statements.
CONSOLIDATED BALANCE SHEETS
38
CONSOLIDATED BALANCE SHEETS(in thousands)
| | | | | | | | |
December 31, | | 2005 | | | 2004 | |
ASSETS | | | | | | | | |
CURRENT ASSETS: | | | | | | | | |
Cash and short-term investments | | $ | 1,837,510 | | | $ | 779,049 | |
Accounts receivable, net (Note 2) | | | 1,000,629 | | | | 962,755 | |
Inventories (Note 3) | | | 945,054 | | | | 1,239,888 | |
Other current assets (Notes 9, 14 and 17) | | | 288,360 | | | | 193,256 | |
| | | | | | | | |
Total current assets | | | 4,071,553 | | | | 3,174,948 | |
PROPERTY, PLANT AND EQUIPMENT, NET (Note 4) | | | 2,855,717 | | | | 2,818,307 | |
OTHER ASSETS (Notes 9 and 17) | | | 211,517 | | | | 139,952 | |
| | | | | | | | |
TOTAL ASSETS | | $ | 7,138,787 | | | $ | 6,133,207 | |
| | | | | | | | |
LIABILITIES AND STOCKHOLDERS’ EQUITY | | | | | | | | |
CURRENT LIABILITIES: | | | | | | | | |
Long-term debt due within one year (Note 6) | | $ | 1 ,250 | | | $ | — | |
Accounts payable (Note 5) | | | 501,624 | | | | 471,549 | |
Federal income taxes payable | | | — | | | | 28,957 | |
Salaries, wages and related accruals (Notes 7 and 11) | | | 368,568 | | | | 320,276 | |
Accrued expenses and other current liabilities (Notes 5 and 10) | | | 384,257 | | | | 245,008 | |
| | | | | | | | |
Total current liabilities | | | 1,255,699 | | | | 1,065,790 | |
| | | | | | | | |
LONG-TERM DEBT DUE AFTER ONE YEAR (Note 6) | | | 922,300 | | | | 923,550 | |
| | | | | | | | |
DEFERRED CREDITS AND OTHER LIABILITIES (Notes 7, 9, 10, 11 and 14) | | | 486,910 | | | | 514,569 | |
| | | | | | | | |
MINORITY INTERESTS | | | 194,090 | | | | 173,313 | |
| | | | | | | | |
STOCKHOLDERS’ EQUITY (Note 7): | | | | | | | | |
Common stock | | | 74,120 | | | | 73,753 | |
Additional paid-in capital | | | 191,850 | | | | 147,206 | |
Retained earnings | | | 4,709,111 | | | | 3,688,555 | |
Unearned compensation | | | (3,287 | ) | | | (392 | ) |
Accumulated other comprehensive income (loss), net of income taxes (Note 9) | | | 46,600 | | | | (1,177 | ) |
| | | | | | | | |
| | | 5,018,394 | | | | 3,907,945 | |
Treasury stock | | | (738,606 | ) | | | (451,960 | ) |
| | | | | | | | |
Total stockholders’ equity | | | 4,279,788 | | | | 3,455,985 | |
| | | | | | | | |
TOTAL LIABILITIES AND STOCKHOLDERS’ EQUITY | | $ | 7,138,787 | | | $ | 6,133,207 | |
| | | | | | | | |
See notes to consolidated financial statements.
CONSOLIDATED STATEMENTS OF CASH FLOWS
39
CONSOLIDATED STATEMENTS OF CASH FLOWS(in thousands)
| | | | | | | | | | | | |
Year Ended December 31, | | 2005 | | | 2004 | | | 2003 | |
OPERATING ACTIVITIES | | | | | | | | | | | | |
Net earnings | | $ | 1,310,284 | | | $ | 1,121,485 | | | $ | 62,781 | |
Adjustments: | | | | | | | | | | | | |
Depreciation | | | 375,054 | | | | 383,305 | | | | 364,112 | |
Impairment of assets | | | — | | | | 13,200 | | | | — | |
Deferred income taxes | | | (29,379 | ) | | | 6,693 | | | | 74,300 | |
Minority interests | | | 110,663 | | | | 80,892 | | | | 23,942 | |
Settlement of natural gas hedges | | | 12,365 | | | | — | | | | — | |
Changes in (exclusive of acquisitions): | | | | | | | | | | | | |
Accounts receivable | | | (19,425 | ) | | | (354,897 | ) | | | (88,871 | ) |
Inventories | | | 337,862 | | | | (635,641 | ) | | | 28,973 | |
Accounts payable | | | 17,259 | | | | 130,604 | | | | 82,634 | |
Federal income taxes | | | (68,331 | ) | | | 35,403 | | | | (15,396 | ) |
Salaries, wages and related accruals | | | 46,376 | | | | 228,203 | | | | (25,060 | ) |
Other | | | 43,887 | | | | 15,509 | | | | (13,614 | ) |
| | | | | | | | | | | | |
Cash provided by operating activities | | | 2,136,615 | | | | 1,024,756 | | | | 493,801 | |
| | | | | | | | | | | | |
| | | |
INVESTING ACTIVITIES | | | | | | | | | | | | |
Capital expenditures | | | (331,466 | ) | | | (285,925 | ) | | | (215,408 | ) |
Investment in affiliates | | | (41,903 | ) | | | (82,458 | ) | | | (22,125 | ) |
Disposition of plant and equipment | | | 752 | | | | 3,094 | | | | 11,634 | |
Acquisitions (net of cash acquired) | | | (154,864 | ) | | | (169,646 | ) | | | (34,941 | ) |
Other investing activities | | | — | | | | — | | | | (6,742 | ) |
| | | | | | | | | | | | |
Cash used in investing activities | | | (527,481 | ) | | | (534,935 | ) | | | (267,582 | ) |
| | | | | | | | | | | | |
| | | |
FINANCING ACTIVITIES | | | | | | | | | | | | |
Proceeds from long-term debt | | | — | | | | 20,000 | | | | 25,000 | |
Repayment of long-term debt | | | — | | | | — | | | | (16,000 | ) |
Issuance of common stock | | | 40,209 | | | | 68,630 | | | | 18,961 | |
Distributions to minority interests | | | (89,886 | ) | | | (84,858 | ) | | | (63,318 | ) |
Cash dividends | | | (209,752 | ) | | | (69,676 | ) | | | (61,835 | ) |
Acquisition of treasury stock | | | (291,244 | ) | | | — | | | | — | |
Termination of interest rate swap agreement | | | — | | | | 4,800 | | | | 2,300 | |
| | | | | | | | | | | | |
Cash used in financing activities | | | (550,673 | ) | | | (61,104 | ) | | | (94,892 | ) |
| | | | | | | | | | | | |
| | | |
INCREASE IN CASH AND SHORT-TERM INVESTMENTS | | | 1,058,461 | | | | 428,717 | | | | 131,327 | |
CASH AND SHORT-TERM INVESTMENTS–BEGINNING OF YEAR | | | 779,049 | | | | 350,332 | | | | 219,005 | |
| | | | | | | | | | | | |
CASH AND SHORT-TERM INVESTMENTS–END OF YEAR | | $ | 1,837,510 | | | $ | 779,049 | | | $ | 350,332 | |
| | | | | | | | | | | | |
See notes to consolidated financial statements.
NOTES TO CONSOLIDATED FINANCIAL STATEMENTS
40
YEARS ENDED DECEMBER 31, 2005, 2004 AND 2003
1. SUMMARY OF SIGNIFICANT ACCOUNTING POLICIES:
NATURE OF OPERATIONS Nucor is a domestic manufacturer of steel products whose customers are located primarily in the United States of America.
PRINCIPLES OF CONSOLIDATION The consolidated financial statements include Nucor and its controlled subsidiaries, including Nucor-Yamato Steel Company, a limited partnership of which Nucor owns 51%. Investments in joint ventures with ownership of 50% or less are accounted for under the equity method. All significant intercompany transactions are eliminated.
Distributions are made to minority interest partners in Nucor-Yamato Steel Company in accordance with the limited partnership agreement by mutual agreement of the general partners. At a minimum, sufficient cash is distributed so that each partner may pay applicable U.S. federal and state income taxes payable.
Other assets includes $161.0 million at December 31, 2005 ($125.5 million at December 31, 2004) of equity investments in less than 50%-owned domestic and foreign affiliated companies. The results of these investments are included in marketing, administrative and other expenses and are immaterial for all periods presented.
CASH AND SHORT-TERM INVESTMENTS Short-term investments are recorded at cost plus accrued interest, which approximates market, and have original maturities of three months or less at the date of purchase. Cash and short-term investments are maintained primarily with a few high-credit quality financial institutions.
INVENTORIES VALUATION Inventories are stated at the lower of cost or market. Cost is determined principally using the last-in, first-out (LIFO) method of accounting. Cost of other inventories is determined on the first-in, first-out (FIFO) method.
PROPERTY, PLANT AND EQUIPMENT Property, plant and equipment are stated at cost. Depreciation is provided on a straight-line basis over the estimated useful lives of the assets. Repairs and maintenance for planned major maintenance activities are accrued on a pro-rata basis prior to the next scheduled major maintenance activity. All other repairs and maintenance activities are expensed when incurred. Impairments of long-lived assets are recognized whenever changes in circumstances indicate that the carrying amount of those productive assets exceeds their projected undiscounted cash flows. When it is determined that an impairment exists, the related assets are written down to estimated fair market value.
DERIVATIVE FINANCIAL INSTRUMENTS Nucor uses derivative financial instruments from time to time primarily to partially manage its exposure to price risk related to natural gas purchases used in the production process and to partially manage its exposure to changes in interest rates on outstanding debt instruments. Nucor, generally, does not enter into derivative instruments for any purpose other than hedging the cash flows associated with specific volumes of commodities that will be purchased and processed in future periods and hedging the exposure related to changes in the fair value of outstanding fixed rate debt instruments.
REVENUE RECOGNITION Revenue is recognized when title passes to the customer, which is principally upon shipment.
FREIGHT COSTS Internal fleet and some common carrier costs are included in marketing, administrative and other expenses. These costs included in marketing, administrative and other expenses were $67.1 million in 2005 ($55.6 million in 2004 and $47.4 million in 2003). All other freight costs are included in cost of products sold.
STOCK-BASED COMPENSATION Nucor accounts for its stock-based compensation plans under the recognition and measurement provisions of Accounting Principles Board Opinion No. 25, “Accounting for Stock Issued to Employees,” and related Interpretations. Accordingly, no compensation expense is recorded, other than for restricted stock grants, since the exercise price of the stock options is equal to the market price of the underlying stock on the grant date. Had compensation cost for the stock options issued been determined consistent with Statement of Financial Accounting Standards (“SFAS”) No. 123, “Accounting for Stock-Based Compensation,” net earnings and net earnings per share would have been reduced to the following pro forma amounts:
NOTES TO CONSOLIDATED FINANCIAL STATEMENTS, CONTINUED
41
| | | | | | | | | | | | |
| | | (in thousands, except per share data) | |
Year Ended December 31, | | 2005 | | | 2004 | | | 2003 | |
Net earnings – as reported | | $ | 1,310,284 | | | $ | 1,121,485 | | | $ | 62,781 | |
Add: Stock-based employee compensation expense included in reported net earnings, net of income taxes | | | 12,717 | | | | 12,017 | | | | 362 | |
Deduct: Total stock-based employee compensation expense determined under fair value based method for all awards, net of income taxes | | | (21,305 | ) | | | (18,296 | ) | | | (7,738 | ) |
| | | | | | | | | | | | |
Net earnings – pro forma | | $ | 1,301,696 | | | $ | 1,115,206 | | | $ | 55,405 | |
| | | | | | | | | | | | |
Net earnings per share – as reported: | | | | | | | | | | | | |
Basic | | $ | 8.34 | | | $ | 7.08 | | | $ | 0.40 | |
Diluted | | | 8.26 | | | | 7.02 | | | | 0.40 | |
Net earnings per share – pro forma: | | | | | | | | | | | | |
Basic | | | 8.28 | | | | 7.04 | | | | 0.35 | |
Diluted | | | 8.21 | | | | 6.98 | | | | 0.35 | |
The assumptions used to calculate the fair value of options granted are evaluated and revised, as necessary, to reflect market conditions and experience.
COMPREHENSIVE INCOME (LOSS) Nucor reports comprehensive income (loss) in its consolidated statement of stockholders’ equity. Comprehensive income (loss) consists of net income and other gains and losses affecting stockholders’ equity that, under United States generally accepted accounting principles, are excluded from net income, such as gains and losses related to certain derivative instruments, which are presented net of tax, and the translation effect of foreign currency assets and liabilities of non-U.S. entities.
RECENT ACCOUNTING PRONOUNCEMENTS The Financial Accounting Standards Board (“FASB”) has issued SFAS No. 123(R), “Share Based Payment,” which requires all share-based payments to employees, including grants of employee stock options, to be recognized in the financial statements based on their fair values. As required by SFAS No. 123(R), Nucor will begin recognizing compensation costs in the Consolidated Statements of Earnings for all of the equity-based compensation plans in the first quarter of 2006. Compensation cost will be determined using the modified prospective method. Management believes the effect of the adoption of SFAS No. 123(R) on our earnings will be comparable to the pro forma disclosures included under the discussion of Stock-Based Compensation, above, and does not expect the adoption to have a material impact or Nucor’s consolidated financial position.
The FASB has issued SFAS No. 151, “Inventory Costs, an amendment of ARB No. 43, Chapter 4,” which clarifies that abnormal amounts of idle facility expense, freight, handling costs and spoilage should be recognized as current period charges and requires the allocation of fixed production overheads to inventory based on the normal capacity of the production facilities. We are required to adopt the provisions of this statement in the first quarter of 2006. Management does not expect the adoption of SFAS No. 151 to have a material impact on Nucor’s consolidated financial position and results of operations.
USE OF ESTIMATES The preparation of financial statements in conformity with accounting principles generally accepted in the United States of America requires management to make estimates and assumptions that affect the amounts reported in the financial statements and accompanying notes. Actual results could differ from these estimates.
RECLASSIFICATIONS Certain amounts for prior years have been reclassified to conform to the 2005 presentation.
NOTES TO CONSOLIDATED FINANCIAL STATEMENTS, CONTINUED
42
2. ACCOUNTS RECEIVABLE:
An allowance for doubtful accounts is maintained for estimated losses resulting from the inability of our customers to make required payments. Accounts receivable are stated net of the allowance for doubtful accounts of $39.2 million at December 31, 2005 ($40.4 million at December 31, 2004 and $22.7 million at December 31, 2003).
3. INVENTORIES:
Inventories consist of approximately 50% raw materials and supplies and 50% finished and semi-finished products at December 31, 2005 (55% and 45%, respectively, at December 31, 2004). Nucor’s manufacturing operations consist of a continuous, vertically integrated process from which products are sold to customers at various stages. Since most steel products can be classified as either finished or semi-finished products, these two categories of inventory are combined.
Inventories valued using the last-in, first-out (LIFO) method of accounting represent approximately 68% of total inventories at December 31, 2005 (78% at December 31, 2004). If the first-in, first-out (FIFO) method of accounting had been used, inventories would have been $381.9 million higher at December 31, 2005 ($533.5 million higher at December 31, 2004). Use of the lower of cost or market reduced inventories by $1.2 million at December 31, 2005 ($2.4 million at December 31, 2004).
Nucor has entered into supply agreements for certain raw materials, utilities and other items in the ordinary course of business. These agreements extend into 2028 and total approximately $3.7 billion at December 31, 2005.
4. PROPERTY, PLANT AND EQUIPMENT:
| | | | | | |
| | | | | (in thousands) |
December 31, | | 2005 | | 2004 |
Land and improvements | | $ | 146,471 | | $ | 142,276 |
Buildings and improvements | | | 500,526 | | | 478,157 |
Machinery and equipment | | | 5,183,241 | | | 4,980,775 |
Construction in process and equipment deposits | | | 226,698 | | | 92,411 |
| | | | | | |
| | | 6,056,936 | | | 5,693,619 |
Less accumulated depreciation | | | 3,201,219 | | | 2,875,312 |
| | | | | | |
| | $ | 2,855,717 | | $ | 2,818,307 |
| | | | | | |
The estimated useful lives range from 10 to 20 years for buildings and land improvements and range from 3 to 12 years for machinery and equipment.
5. CURRENT LIABILITIES:
Drafts payable, included in accounts payable in the balance sheet, was $76.3 million at December 31, 2005 ($91.6 million at December 31, 2004).
Dividends payable, included in accrued expenses and other current liabilities in the balance sheet, was $100.9 million at December 31, 2005 ($20.9 million at December 31, 2004).
NOTES TO CONSOLIDATED FINANCIAL STATEMENTS, CONTINUED
43
6. LONG-TERM DEBT AND FINANCING ARRANGEMENTS:
| | | | | | | |
| | | | | | (in thousands) |
December 31, | | 2005 | | | 2004 |
Industrial revenue bonds: | | | | | | | |
3.30% to 3.71%, variable, due from 2006 to 2038 | | $ | 398,550 | | | $ | 398,550 |
Notes, 6%, due 2009 | | | 175,000 | | | | 175,000 |
Notes, 4.875%, due 2012 | | | 350,000 | | | | 350,000 |
| | | | | | | |
| | | 923,550 | | | | 923,550 |
Less current maturities | | | (1,250 | ) | | | — |
| | | | | | | |
| | $ | 922,300 | | | $ | 923,550 |
| | | | | | | |
In 2005, Nucor entered into a new five-year unsecured revolving credit facility maturing in June 2010 that provides for up to $700.0 million in revolving loans. Up to the equivalent of $600.0 million of the new credit facility is available for foreign currency loans, and up to $450.0 million is available for the issuance of letters of credit. The new credit facility may be increased by up to $300.0 million at the election of the Company in accordance with the terms set forth in the credit agreement. No borrowings were outstanding under the credit facility as of December 31, 2005. The new credit facility provides for grid-based interest pricing based upon the credit rating of Nucor’s senior unsecured long-term debt and, alternatively, interest rates quoted by lenders in connection with competitive bidding. The credit facility includes customary financial and other covenants, including a limit on the ratio of debt to total capital of 60%, a limit on Nucor’s ability to pledge the Company’s assets, and a limit on consolidations, mergers and sales of assets.
In connection with the new credit facility, in June 2005 Nucor terminated (a) a $125.0 million 364-day revolver that was scheduled to mature in September 2005 and (b) a $300.0 million multi-currency revolver that was scheduled to mature in October 2007. At the date of termination, there were no borrowings under either terminated credit facility.
Annual aggregate long-term debt maturities are: $1.3 million in 2006; none in 2007; none in 2008; $180.4 million in 2009; and none in 2010.
The fair value of Nucor’s long-term debt approximates the carrying value.
NOTES TO CONSOLIDATED FINANCIAL STATEMENTS, CONTINUED
44
7. CAPITAL STOCK:
The par value of Nucor’s common stock is $0.40 per share and there are 400.0 million shares authorized. In addition, 250,000 shares of preferred stock, par value of $4.00 per share, are authorized, with preferences, rights and restrictions as may be fixed by Nucor’s Board of Directors. There are no shares of preferred stock issued or outstanding.
STOCK OPTIONS Nucor’s stock option plans provide that common stock options may be granted to key employees, officers and non-employee directors with exercise prices at 100% of the market value on the date of the grant. Outstanding options are exercisable six months after grant date and have a term of seven years.
A summary of Nucor’s stock option plans is as follows(shares in thousands):
| | | | | | | | | | | | | | | | | | |
Year Ended December 31, | | 2005 | | 2004 | | 2003 |
| | | Shares | | | Weighted Average
Exercise Price | | Shares | | | Weighted Average
Exercise Price | | Shares | | | Weighted Average
Exercise Price |
Number of shares under option: | | | | | | | | | | | | | | | | | | |
Outstanding at beginning of year | | 2,336 | | | $ | 29.37 | | 3,424 | | | $ | 24.04 | | 2,492 | | | $ | 23.92 |
Granted | | 776 | | | | 59.51 | | 1,184 | | | | 35.64 | | 1,741 | | | | 23.01 |
Exercised | | (916 | ) | | | 29.55 | | (2,250 | ) | | | 24.55 | | (776 | ) | | | 21.28 |
Canceled | | (13 | ) | | | 54.42 | | (22 | ) | | | 31.27 | | (33 | ) | | | 24.90 |
| | | | | | | | | | | | | | | | | | |
Outstanding at end of year | | 2,183 | | | $ | 39.86 | | 2,336 | | | $ | 29.37 | | 3,424 | | | $ | 24.04 |
| | | | | | | | | | | | | | | | | | |
Options exercisable at end of year | | 1,781 | | | $ | 35.83 | | 1,787 | | | $ | 26.29 | | 2,646 | | | $ | 23.57 |
| | | | | | | | | | | | | | | | | | |
Shares reserved for future grants | | 9,534 | | | | | | 10,298 | | | | | | 11,460 | | | | |
| | | | | | | | | | | | | | | | | | |
The following table summarizes information about stock options outstanding at December 31, 2005 (shares in thousands):
| | | | | | | | | | | | |
| | | Options Outstanding | | Options Exercisable |
Range of Exercise Prices | | Number Outstanding | | Weighted
Average Remaining
Contractual Life | | Weighted Average
Exercise Price | | Number Exercisable | | Weighted Average
Exercise Price |
$18.01 - $ 32.00 | | 808 | | 3.6 years | | $ | 24.35 | | 808 | | $ | 24.35 |
32.01 - 46.00 | | 621 | | 5.4 years | | | 36.21 | | 621 | | | 36.21 |
46.01 - 60.00 | | 402 | | 6.6 years | | | 57.72 | | — | | | — |
60.01 - 61.46 | | 352 | | 6.1 years | | | 61.46 | | 352 | | | 61.46 |
| | | | | | | | | | | | |
18.01 - 61.46 | | 2,183 | | 5.1 years | | | 39.86 | | 1,781 | | | 35.83 |
| | | | | | | | | | | | |
The pro forma net earnings and pro forma net earnings per share amounts calculated according to SFAS No. 123 are disclosed in Note 1, above. The weighted-average per share fair value of options granted was $18.15 in 2005 ($8.09 in 2004 and $7.19 in 2003). The fair value of each option grant is estimated on the date of the grant using the Black-Scholes option-pricing model with the following assumptions:
| | | | | | |
Year Ended December 31, | | 2005 | | 2004 | | 2003 |
Expected dividend yield | | 0.98% – 1.04% | | 1.30% – 1.32% | | 1.56% – 1.92% |
Expected stock price volatility | | 38.42% – 38.43% | | 29.18% – 31.08% | | 43.37% – 46. 51% |
Risk-free interest rate | | 3.76% – 3.80% | | 2.15% – 2.74% | | 1.91% – 2.62% |
Expected life of options (in years) | | 3.5 | | 3.5 | | 3.5 |
NOTES TO CONSOLIDATED FINANCIAL STATEMENTS, CONTINUED
45
RESTRICTED STOCK AWARDS Nucor’s Senior Officers Annual Incentive Plan (the “AIP”) and Long-Term Incentive Plan (the “LTIP”) authorize the award of shares of common stock to officers subject to certain conditions and restrictions. The LTIP provides for the award of shares of restricted common stock at the end of each LTIP performance measurement period at no cost to officers if certain financial performance goals are met during the period. One-third of the LTIP restricted stock award vests upon each of the first three anniversaries of the award date or, if earlier, upon the officer’s attainment of age 55 while employed by Nucor. Although participants are entitled to cash dividends and may vote such awarded shares, the sale or transfer of such shares is limited during the restricted period.
The AIP provides for the payment of annual cash incentive awards. An AIP participant may elect, however, to defer payment of up to one-half of an annual incentive award. In such event, the deferred AIP award is converted into common stock units and credited with a deferral incentive, in the form of additional common stock units, equal to 25% of the number of common stock units attributable to the deferred AIP award. Common stock units attributable to deferred AIP awards are fully vested. Common stock units credited as a deferral incentive vest upon the AIP participant’s attainment of age 55 while employed by Nucor. Vested common stock units are paid to AIP participants in the form of shares of common stock following their termination of employment with Nucor.
Compensation expense for common stock and common stock units awarded under the AIP and LTIP is recorded over the performance measurement and vesting periods based on the anticipated number and market value of shares of common stock and common stock units to be awarded. Compensation expense for anticipated awards based upon Nucor’s financial performance, exclusive of amounts payable in cash, was $16.8 million in 2005, $18.5 million in 2004 and $1.5 million in 2003, the year in which the AIP and LTIP were approved by the stockholders. Unearned compensation on restricted stock is recorded in a separate component of stockholders’ equity and is amortized to compensation expense over the vesting period.
A summary of Nucor’s restricted stock is as follows(shares in thousands):
| | | | | | | | | | | | | | |
Year Ended December 31, | | 2005 | | 2004 | | 2003 |
| | | Shares | | | Weighted
Average Price | | Shares | | | Weighted
Average Price | | Shares |
Restricted stock awards and units: | | | | | | | | | | | | | | |
Unvested at beginning of year | | 38 | | | $ | 28.05 | | — | | | | — | | |
Granted | | 292 | | | | 57.65 | | 52 | | | $ | 28.05 | | |
Vested | | (126 | ) | | | 53.58 | | (14 | ) | | | 28.05 | | |
Canceled | | — | | | | — | | — | | | | — | | |
| | | | | | | | | | | | | | |
Unvested at end of year | | 204 | | | $ | 54.65 | | 38 | | | $ | 28.05 | | |
| | | | | | | | | | | | | | |
Shares reserved for future grants | | 1,656 | | | | | | 1,948 | | | | | | 2,000 |
| | | | | | | | | | | | | | |
NOTES TO CONSOLIDATED FINANCIAL STATEMENTS, CONTINUED
46
8. STOCKHOLDER RIGHTS PLAN:
In 2001, the Board of Directors adopted a Stockholder Rights Plan (“Plan”) in which one right (“Right”) was declared as a dividend for each Nucor common share outstanding. Each Right entitles Nucor common stockholders to purchase, under certain conditions, one five-thousandth of a share of newly authorized Series A Junior Participating Preferred Stock (“Preferred Stock”), with one five-thousandth of a share of Preferred Stock intended to be the economic equivalent of one share of Nucor common stock. Until the occurrence of certain events, the Rights are represented by and traded in tandem with Nucor common stock. Rights will be exercisable only if a person or group acquires beneficial ownership of 15% or more of the Nucor common shares or commences a tender or exchange offer, upon the consummation of which such person or group would beneficially own 15% or more of the common shares. Upon such an event, the Rights enable dilution of the acquiring person’s or group’s interest by providing that other holders of Nucor common stock may purchase, at an exercise price of $75.00, Nucor common stock, or in the discretion of the Board of Directors, Preferred Stock, having double the value of such exercise price. Nucor will be entitled to redeem the Rights at $.0005 per Right under certain circumstances set forth in the Plan. The Rights themselves have no voting power and will expire on March 8, 2011, unless earlier exercised, redeemed or exchanged. Each one five-thousandth of a share of Preferred Stock has the same voting rights as one share of Nucor common stock, and each share of Preferred Stock has 5,000 times the voting power of one share of Nucor common stock.
9. FAIR VALUE OF DERIVATIVE FINANCIAL INSTRUMENTS:
In accordance with SFAS No. 133, “Accounting for Derivative Instruments and Hedging Activities,” as amended by SFAS No. 138, “Accounting for Certain Derivative Instruments and Certain Hedging Activities,” and SFAS 149, “Amendment of Statement 133 on Derivative Instruments and Hedging Activities,” Nucor recognizes all derivative instruments, such as natural gas forward purchase contracts and interest rate swaps, in the consolidated balance sheets at fair value. Amounts included in accumulated other comprehensive income related to cash flow hedges are reclassified into earnings when the related derivative instruments settle. Changes in fair-value hedges are reported currently in earnings along with changes in the fair value of the hedged items. When cash flow and fair value hedges affect net earnings, they are included on the same line as the underlying transaction (cost of products sold or interest expense).
During 2005, accumulated other comprehensive income increased by $55.8 million, net of deferred taxes of $30.0 million, due to unrealized gains on cash flow hedges on natural gas forward purchase contracts. The remaining change in accumulated other comprehensive income was due to the reclassification of net gains of approximately $8.1 million, net of deferred taxes of approximately $4.3 million, into earnings due to the settlement of transactions. During 2004, accumulated other comprehensive loss increased by $1.2 million, net of taxes of $0.6 million, due to unrealized losses on cash flow hedges on natural gas forward purchase contracts issued during the year.
Of the total $71.7 million fair value of cash flow hedges on natural gas forward purchase contracts at December 31, 2005, $53.6 million is included in other current assets and $18.1 million is included in other assets. At December 31, 2004, $1.8 million was included in deferred credits and other liabilities. At December 31, 2005, $34.8 million of net deferred gains on cash flow hedges on natural gas forward purchase contracts included in accumulated other comprehensive income are expected to be reclassified into earnings, due to the settlement of forecasted transactions, during the next twelve months assuming no change in the forward commodity prices from December 31, 2005. Nucor is hedging a portion of its exposure to the variability of future cash flows for forecasted natural gas purchases over various time periods not exceeding two years.
Nucor has also entered into various natural gas purchase contracts, which meet the normal purchase normal sale exclusion under SFAS No. 133. These instruments effectively commit Nucor to purchase $17.6 million, $22.7 million and $21.5 million of natural gas for production in 2006, 2007 and 2008, respectively, and $562.3 million between 2009 and 2028. These natural gas purchase contracts will primarily supply our direct reduced iron facility in Trinidad.
During 2004, Nucor entered into, and subsequently terminated, an interest rate swap agreement of $175.0 million that was accounted for as a fair value hedge. Under the agreement, Nucor paid a variable rate of interest and received a fixed rate of interest over the term of the interest rate swap agreement. The interest rate swap agreement converted the $175.0 million note payable from a 6% fixed rate obligation to a variable rate obligation. The change in the fair value of this agreement was recorded in earnings as an equal offset to the change in fair value of the underlying debt obligation. Since the fair value hedge was 100% effective, there was no impact to net earnings. The variable interest rate was the six-month LIBOR rate in arrears plus 1.25%. Nucor terminated this interest rate swap agreement in 2004, resulting in a gain of $4.8 million.
NOTES TO CONSOLIDATED FINANCIAL STATEMENTS, CONTINUED
47
At December 31, 2005, there was an aggregate credit of $4.7 million related to this and previous interest rate swaps included in deferred credits and other liabilities in the balance sheet, all of which will be amortized over the remaining life of the debt as adjustments to interest expense.
Nucor does not anticipate non-performance by the counterparties in any of these derivative instruments given their high credit ratings, and no material loss is expected from non-performance by any one of such counterparties.
10. CONTINGENCIES:
Nucor is subject to environmental laws and regulations established by federal, state and local authorities, and, accordingly, makes provision for the estimated costs of compliance. Of the undiscounted total $24.0 million of accrued environmental costs at December 31, 2005 ($44.7 million at December 31, 2004), $20.0 million was classified in accrued expenses and other current liabilities ($22.2 million at December 31, 2004) and $4.0 million was classified in deferred credits and other liabilities ($22.5 million at December 31, 2004). Inherent uncertainties exist in these estimates primarily due to unknown conditions,’ evolving remediation technology, and changing governmental regulations and legal standards regarding liability. During 2005 Nucor revised estimates as additional information was obtained and projects were completed, reducing environmental reserves by $9.4 million ($10.0 million in 2004 and $8.3 million in 2003). The revisions are included in cost of products sold. In December 2000, the United States Environmental Protection Agency and the Department of Justice announced an agreement with Nucor and certain states that resolved alleged violations of environmental laws and regulations. Nucor continues to implement the various components of the consent decree, which involve air and water pollution control technology demonstrations along with other environmental management practices. The accrued environmental costs include the expenses that Nucor expects to incur as a result of the consent decree.
Other contingent liabilities with respect to product warranties, legal proceedings and other matters arise in the normal course of business. In the opinion of management, no such matters exist that would have a material effect on the consolidated financial statements.
11. EMPLOYEE BENEFIT PLANS:
Nucor makes contributions to a Profit Sharing and Retirement Savings Plan for qualified employees based on the profitability of the company. Nucor’s expense for these benefits totaled $206.0 million in 2005 ($172.3 million in 2004 and $8.9 million in 2003). The related liability for these benefits is included in salaries, wages and related accruals at each year-end. Nucor also has a medical plan covering certain eligible early retirees. The unfunded obligation, included in deferred credits and other liabilities in the balance sheet, totaled $48.0 million at December 31, 2005 ($44.2 million at December 31, 2004). Expense associated with this plan totaled $2.9 million in 2005 ($3.0 million in 2004 and $2.3 million in 2003). The discount rate used was 5.50% in 2005 (5.75% in 2004 and 6% in 2003). The health care cost increase trend rate used was 9% in 2005 (10% in 2004 and 11% in 2003). The health care cost increase in the trend rate is projected to decline gradually to 5% by 2011.
12. INTEREST EXPENSE:
Interest expense is stated net of interest income of $32.4 million in 2005 ($7.0 million in 2004 and $2.5 million in 2003). Interest paid was $37.2 million in 2005 ($32.4 million in 2004 and $33.0 million in 2003).
13. OTHER INCOME:
In 2005, Nucor received $9.2 million in settlement of claims against third parties related to environmental matters. Nucor has made claims for reimbursement of additional amounts. No amounts have been recorded for such reimbursements, if any, that may be received. In 2004 and 2003, Nucor sold equipment resulting in a pre-tax gain of $1.6 million and $4.4 million, respectively. In 2003, Nucor also recognized $7.1 million related to graphite electrodes anti-trust settlements.
NOTES TO CONSOLIDATED FINANCIAL STATEMENTS, CONTINUED
48
14. INCOME TAXES:
The provision for income taxes consists of the following(in thousands):
| | | | | | | | | | | | |
Year Ended December 31, | | 2005 | | | 2004 | | | 2003 | |
Current: | | | | | | | | | | | | |
Federal | | $ | 685,479 | | | $ | 574,107 | | | $ | (58,500 | ) |
State | | | 49,984 | | | | 28,991 | | | | (11,704 | ) |
| | | | | | | | | | | | |
Total current | | | 735,463 | | | | 603,098 | | | | (70,204 | ) |
| | | | | | | | | | | | |
Deferred: | | | | | | | | | | | | |
Federal | | | (28,179 | ) | | | 7,193 | | | | 71,500 | |
State | | | (1,200 | ) | | | (500 | ) | | | 2,800 | |
| | | | | | | | | | | | |
Total deferred | | | (29,379 | ) | | | 6,693 | | | | 74,300 | |
| | | | | | | | | | | | |
Total provision for income taxes | | $ | 706,084 | | | $ | 609,791 | | | $ | 4,096 | |
| | | | | | | | | | | | |
A reconciliation of the federal statutory tax rate (35%) to the total provision is as follows:
| | | | | | | | | |
Year Ended December 31, | | 2005 | | | 2004 | | | 2003 | |
Taxes computed at statutory rate | | 35.00 | % | | 35.00 | % | | 35.00 | % |
State income taxes, net of federal income tax benefit | | 1.57 | | | 1.07 | | | (8.65 | ) |
Resolution of prior year contingencies | | — | | | (0.65 | ) | | (15.93 | ) |
Federal research credit | | (0.07 | ) | | (0.12 | ) | | (4.07 | ) |
Domestic manufacturing deduction | | (1.04 | ) | | — | | | — | |
Other, net | | (0.44 | ) | | (0.08 | ) | | (0.23 | ) |
| | | | | | | | | |
Provision for income taxes | | 35.02 | % | | 35.22 | % | | 6.12 | % |
| | | | | | | | | |
Deferred tax assets and liabilities resulted from the following(in thousands):
| | | | | | | | |
December 31, | | 2005 | | | 2004 | |
Deferred tax assets: | | | | | | | | |
Accrued liabilities and reserves | | $ | 85,629 | | | $ | 108,777 | |
Allowance for doubtful accounts | | | 12,142 | | | | 12,816 | |
Inventory | | | 137,587 | | | | 105,737 | |
Post retirement benefits | | | 18,753 | | | | 17,224 | |
| | | | | | | | |
Total deferred tax assets | | | 254,111 | | | | 244,554 | |
| | | | | | | | |
Deferred tax liabilities: | | | | | | | | |
Natural gas hedges | | | (25,541 | ) | | | (600 | ) |
Property, plant and equipment | | | (370,170 | ) | | | (390,754 | ) |
| | | | | | | | |
Total deferred tax liabilities | | | (395,711 | ) | | | (391,354 | ) |
| | | | | | | | |
Total net deferred tax liabilities | | $ | (141,600 | ) | | $ | (146,800 | ) |
| | | | | | | | |
NOTES TO CONSOLIDATED FINANCIAL STATEMENTS, CONTINUED
49
Current deferred tax assets were $153.0 million at December 31, 2005 ($163.0 million at December 31, 2004). Non-current deferred tax liabilities were $294.6 million at December 31, 2005 ($309.8 million at December 31, 2004). Nucor paid $806.7 million and $550.1 million in net federal and state income taxes in 2005 and 2004, respectively, and received $54.9 million in refunds in 2003. The Internal Revenue Service is currently examining Nucor’s 2002 and 2003 federal income tax returns. Management believes that it has adequately provided for any adjustments that may arise from this audit.
15. EARNINGS PER SHARE:
The computations of basic and diluted earnings per share are as follows(in thousands, except per share data):
| | | | | | | | | |
Year Ended December 31, | | 2005 | | 2004 | | 2003 |
Basic earnings per share: | | | | | | | | | |
Basic net earnings | | $ | 1,310,284 | | $ | 1,121,485 | | $ | 62,781 |
| | | | | | | | | |
Average shares outstanding | | | 157,128 | | | 158,383 | | | 156,531 |
| | | | | | | | | |
Basic net earnings per share | | $ | 8.34 | | $ | 7.08 | | $ | 0.40 |
| | | | | | | | | |
Diluted earnings per share: | | | | | | | | | |
Diluted net earnings | | $ | 1,310,284 | | $ | 1,121,485 | | $ | 62,781 |
| | | | | | | | | |
Diluted average shares outstanding: | | | | | | | | | |
Basic shares outstanding | | | 157,128 | | | 158,383 | | | 156,531 |
Dilutive effect of stock options and other | | | 1,437 | | | 1,371 | | | 302 |
| | | | | | | | | |
| | | 158,565 | | | 159,754 | | | 156,833 |
| | | | | | | | | |
Diluted net earnings per share | | $ | 8.26 | | $ | 7.02 | | $ | 0.40 |
| | | | | | | | | |
NOTES TO CONSOLIDATED FINANCIAL STATEMENTS, CONTINUED
50
16. SEGMENTS:
Nucor reports its results in two segments: steel mills and steel products. The steel mills segment includes carbon and alloy steel in sheet, bar, structural and plate. The steel products segment includes steel joists and joist girders, steel deck, cold finished steel, steel fasteners, metal building systems and light gauge steel framing. The segments are consistent with the way Nucor manages its business, which is primarily based upon the similarity of the types of products produced and sold by each segment.
Management evaluates the operating performance of each of its segments based upon division contribution. The accounting policies of the reportable segments are the same as those described in the summary of significant accounting policies. Nucor accounts for intercompany sales at prices approximating current market value. Interest expense, minority interests, other income, profit sharing expense and changes in the LIFO reserve and environmental accruals are shown under Corporate/eliminations/other. Corporate assets primarily include cash and short-term investments, deferred income tax assets and investments in affiliates.
Nucor’s segment results are as follows(in thousands):
| | | | | | | | | | | | |
Year Ended December 31, | | 2005 | | | 2004 | | | 2003 | |
Net sales to external customers: | | | | | | | | | | | | |
Steel mills | | $ | 11,063,681 | | | $ | 10,109,430 | | | $ | 5,446,127 | |
Steel products | | | 1,637,318 | | | | 1,267,398 | | | | 819,696 | |
| | | | | | | | | | | | |
| | $ | 12,700,999 | | | $ | 11,376,828 | | | $ | 6,265,823 | |
| | | | | | | | | | | | |
Intercompany sales: | | | | | | | | | | | | |
Steel mills | | $ | 896,432 | | | $ | 852,897 | | | $ | 520,207 | |
Steel products | | | 36,246 | | | | 9,857 | | | | 5,275 | |
Corporate/eliminations/other | | | (932,678 | ) | | | (862,754 | ) | | | (525,482 | ) |
| | | | | | | | | | | | |
| | $ | — | | | $ | — | | | $ | — | |
| | | | | | | | | | | | |
Depreciation expense: | | | | | | | | | | | | |
Steel mills | | $ | 355,887 | | | $ | 366,023 | | | $ | 346,136 | |
Steel products | | | 19,167 | | | | 17,282 | | | | 17,976 | |
| | | | | | | | | | | | |
| | $ | 375,054 | | | $ | 383,305 | | | $ | 364,112 | |
| | | | | | | | | | | | |
Earnings (loss) before income taxes: | | | | | | | | | | | | |
Steel mills | | $ | 2,207,621 | | | $ | 2,191,335 | | | $ | 209,400 | |
Steel products | | | 180,756 | | | | 149,610 | | | | (14,328 | ) |
Corporate/eliminations/other | | | (372,009 | ) | | | (609,669 | ) | | | (128,195 | ) |
| | | | | | | | | | | | |
| | $ | 2,016,368 | | | $ | 1,731,276 | | | $ | 66,877 | |
| | | | | | | | | | | | |
Segment assets: | | | | | | | | | | | | |
Steel mills | | $ | 4,623,462 | | | $ | 4,978,616 | | | $ | 3,927,392 | |
Steel products | | | 519,562 | | | | 488,571 | | | | 324,235 | |
Corporate/eliminations/other | | | 1,995,763 | | | | 666,020 | | | | 240,726 | |
| | | | | | | | | | | | |
| | $ | 7,138,787 | | | $ | 6,133,207 | | | $ | 4,492,353 | |
| | | | | | | | | | | | |
Capital expenditures: | | | | | | | | | | | | |
Steel mills | | $ | 216,047 | | | $ | 242,486 | | | $ | 201,134 | |
Steel products | | | 18,378 | | | | 7,253 | | | | 14,274 | |
Corporate/other | | | 97,041 | | | | 36,186 | | | | — | |
| | | | | | | | | | | | |
| | $ | 331,466 | | | $ | 285,925 | | | $ | 215,408 | |
| | | | | | | | | | | | |
NOTES TO CONSOLIDATED FINANCIAL STATEMENTS, CONTINUED
51
Net sales by product were as follows(in thousands). Further product group breakdown is impracticable.
| | | | | | | | | |
Year Ended December 31, | | 2005 | | 2004 | | 2003 |
Net sales to external customers: | | | | | | | | | |
Sheet | | $ | 4,805,391 | | $ | 4,856,469 | | $ | 2,371,611 |
Bar | | | 3,061,326 | | | 2,632,966 | | | 1,746,805 |
Structural | | | 1,702,720 | | | 1,500,878 | | | 1,005,859 |
Plate | | | 1,494,244 | | | 1,119,117 | | | 321,852 |
Steel products | | | 1,637,318 | | | 1,267,398 | | | 819,696 |
| | | | | | | | | |
| | $ | 12,700,999 | | $ | 11,376,828 | | $ | 6,265,823 |
| | | | | | | | | |
17. INVESTMENTS AND ACQUISITIONS:
In January 2005, Nucor entered into an agreement with Ambassador Steel Corporation to form Nufab Rebar LLC (“Nufab”), a rebar fabrication joint venture. Nucor owns 49% of the joint venture. At December 31, 2005, Nucor held a note receivable from Nufab in the amount of $6.9 million. This note receivable bears interest, payable quarterly, at a rate of LIBOR plus 120 basis points. The note was classified in other assets.
In February 2005, Nucor purchased the assets of Fort Howard Steel, Inc.’s operations in Oak Creek, Wisconsin, for a cash purchase price of approximately $44.1 million. This facility produces cold finish bar products.
In June 2005, Nucor’s wholly owned subsidiary, Nucor Steel Marion, Inc., purchased substantially all of the assets of Marion Steel Company for a cash purchase price of approximately $110.7 million. This facility produces angles, flats, rebar, rounds and signposts.
These acquisitions in 2005 were not material to the consolidated financial statements and did not result in material goodwill or other intangible assets.
In February 2004, Nucor purchased a one-half interest in Harris Steel, Inc., a wholly owned subsidiary of Harris Steel Group, Inc., for a cash purchase price of approximately $21.0 million. At December 31, 2005, Nucor held a note receivable from Harris Steel, Inc. in the amount of $10.0 million. This note receivable bears interest, payable upon maturity, at a rate of LIBOR plus 100 basis points. The note was classified in other current assets. In 2005, Harris Steel Group received an additional $1.2 million based upon the achievement of certain operating results. Harris Steel Group may receive up to an additional $4.8 million upon the achievement of certain operating results of the venture through 2008.
In July 2004, Nucor’s wholly owned subsidiary, Nucor Steel Tuscaloosa, Inc., purchased substantially all of the steelmaking assets of Corus Tuscaloosa for a price of approximately $89.4 million. The facility is a coiled plate mill that manufactures pressure vessel steel coil, discrete plate and cut-to-length plate products.
In August 2004, Nucor’s wholly owned subsidiary, Nucor Steel Decatur, LLC, purchased certain assets of Worthington Industries, Inc. cold rolling mill in Decatur, Alabama, for a cash purchase price of approximately $80.3 million. The assets include all of the buildings, the pickle line, four-stand tandem cold mill, temper mill and annealing furnaces adjacent to the current Nucor Steel Decatur, LLC steel plant.
In March 2003, Nucor’s wholly owned subsidiary, Nucor Steel Kingman, LLC, purchased substantially all of the assets of the Kingman, Arizona, steel facility of North Star Steel (“North Star”) for approximately $35.0 million. The purchase price did not include working capital and Nucor assumed no material liabilities of the North Star operation. Nucor Steel Kingman is currently not operating. After evaluating options for this facility, Nucor decided not to restart the melt shop. Accordingly, in 2004 Nucor recognized an impairment charge of $13.2 million based on appraised values. This charge has been reflected in cost of products sold.
Non-cash investing and financing activities included the assumption of $17.8 million of liabilities acquired with the purchase of Fort Howard Steel, Inc. and Marion Steel Company in 2005 and included the assumption of $27.2 million of liabilities acquired with the purchase of Corus Tuscaloosa in 2004.
NOTES TO CONSOLIDATED FINANCIAL STATEMENTS, CONTINUED
52
18. QUARTERLY INFORMATION (UNAUDITED):
| | | | | | | | | | | | |
| | | | | (in thousands except per share data) |
| | | First Quarter | | Second Quarter | | Third Quarter | | Fourth Quarter |
| 2005 | | | | | | | | | | | | |
Net sales | | $ | 3,322,621 | | $ | 3,145,003 | | $ | 3,025,911 | | $ | 3,207,464 |
Gross margin(1) | | | 701,993 | | | 624,911 | | | 590,635 | | | 698,064 |
Net earnings(2) | | | 354,666 | | | 322,707 | | | 291,877 | | | 341,034 |
Net earnings per share: | | | | | | | | | | | | |
Basic | | | 2.22 | | | 2.04 | | | 1.87 | | | 2.20 |
Diluted | | | 2.20 | | | 2.03 | | | 1.86 | | | 2.18 |
| | | | |
| 2004 | | | | | | | | | | | | |
Net sales | | $ | 2,286,416 | | $ | 2,761,822 | | $ | 3,239,592 | | $ | 3,088,998 |
Gross margin(3) | | | 270,047 | | | 527,906 | | | 806,074 | | | 643,929 |
Net earnings(4) | | | 113,238 | | | 251,442 | | | 415,387 | | | 341,418 |
Net earnings per share: | | | | | | | | | | | | |
Basic | | | 0.72 | | | 1.59 | | | 2.62 | | | 2.14 |
Diluted | | | 0.72 | | | 1.58 | | | 2.59 | | | 2.12 |
| (1) | LIFO credits totaled $26.1 million, $69.9 million, $52.0 million and $3.6 million in the first, second, third and fourth quarters of 2005, respectively. |
| (2) | The first quarter of 2005 includes $9.2 million for the settlement of claims against third parties related to environmental matters. |
| (3) | LIFO charges totaled $32.2 million, $67.1 million, $124.1 million and $152.5 million in the first, second, third and fourth quarters of 2004, respectively. |
| (4) | The first quarter of 2004 includes a gain of $1.6 million on the sale of equipment. |
CORPORATE AND STOCK DATA
56
EXECUTIVE OFFICES
2100 Rexford Road
Charlotte, North Carolina 28211
Phone 704/366-7000
Fax 704/362-4208
STOCK TRANSFERS
DIVIDEND DISBURSING
DIVIDEND REINVESTMENT
American Stock Transfer & Trust Company
59 Maiden Lane
New York, New York 10038
Phone 800/937-5449
Fax 718/236-2641
ANNUAL MEETING
Place
The Park Hotel
2200 Rexford Road
Morrison A & B
Charlotte, North Carolina
Time/Date
10:00 a.m., Thursday
May 11, 2006
STOCK LISTING
New York Stock Exchange
Trading Symbol – NUE
STOCK PRICE AND DIVIDENDS PAID
| | | | | | | | | | | | |
| | | First
Quarter | | Second
Quarter | | Third
Quarter | | Fourth
Quarter |
2005 | | | | | | | | | | | | |
Stock price: | | | | | | | | | | | | |
High | | $ | 65.53 | | $ | 59.35 | | $ | 61.40 | | $ | 70.21 |
Low | | | 47.05 | | | 45.55 | | | 46.29 | | | 51.83 |
Dividends paid | | | 0.13 | | | 0.40 | | | 0.40 | | | 0.40 |
| | | | |
2004 | | | | | | | | | | | | |
Stock price: | | | | | | | | | | | | |
High | | $ | 33.29 | | $ | 38.97 | | $ | 46.57 | | $ | 55.47 |
Low | | | 26.08 | | | 28.18 | | | 36.27 | | | 37.52 |
Dividends paid | | | 0.10 | | | 0.105 | | | 0.105 | | | 0.13 |
FORM 10-K
A copy of Nucor’s 2005 annual report filed with the Securities and Exchange Commission (“SEC”) on Form 10-K is available to stockholders on request.
The certifications of Nucor’s Chief Executive Officer and Chief Financial Officer regarding the quality of Nucor’s public disclosure that are required by Section 302 of The Sarbane’s-Oxley Act of 2002 are included as exhibits to Nucor’s annual report on Form 10-K. In addition, in 2005, Nucor’s Chief Executive Officer provided to the New York Stock Exchange (“NYSE”) the Annual CEO Certification regarding Nucor’s compliance with the NYSE’s corporate governance standards.
INTERNET ACCESS
Nucor’s annual report on Form 10-K, quarterly reports on Form 10-Q, current reports on Form 8-K and all amendments to these reports are available without charge through Nucor’s website, www.nucor.com, as soon as reasonably practicable after Nucor files these reports electronically with or furnishes them to the SEC. Additional information available on our website includes our Corporate Governance Principles, Board of Directors Committee Charters, Standards of Business Conduct and Ethics, and Code of Ethics for Senior Financial Professionals as well as various other financial and statistical data. Written copies are available to stockholders on request.
THIS ANNUAL REPORT HAS BEEN PRINTED ON RECYCLED PAPER.