| | | | |
| | | | Exhibit 13 |
4 | | | | FINANCIAL HIGHLIGHTS |
| | | | | | | | | | | | | | | |
FINANCIAL HIGHLIGHTS | | (dollar and share amounts in thousands, except per share data) |
| | | | | 2016 | | | | | 2015 | | | | | % CHANGE | |
FOR THE YEAR* | | | | | | | | | | | | | | | |
Net sales | | | | $16,208,122 | | | | | $16,439,276 | | | | | -1% | |
| | | |
Earnings: | | | | | | | | | | | | | | | |
| | | |
Earnings before income taxes and noncontrolling interests | | | | 1,298,659 | | | | | 241,866 | | | | | 437% | |
| | | |
Provision for income taxes | | | | 398,243 | | | | | 48,836 | | | | | 715% | |
| | | |
Net earnings | | | | 900,416 | | | | | 193,030 | | | | | 366% | |
| | | |
Earnings attributable to noncontrolling interests | | | | 104,145 | | | | | 112,306 | | | | | -7% | |
| | | |
Net earnings attributable to Nucor stockholders | | | | 796,271 | | | | | 80,724 | | | | | 886% | |
| | | |
Per share: | | | | | | | | | | | | | | | |
| | | |
Basic | | | | 2.48 | | | | | 0.25 | | | | | 892% | |
| | | |
Diluted | | | | 2.48 | | | | | 0.25 | | | | | 892% | |
| | | |
Dividends declared per share | | | | 1.5025 | | | | | 1.4925 | | | | | 1% | |
| | | |
Percentage of net earnings to net sales | | | | 4.9% | | | | | 0.5% | | | | | | |
| | | |
Return on average stockholders’ equity | | | | 10.4% | | | | | 1.0% | | | | | | |
| | | |
Capital expenditures | | | | 617,677 | | | | | 364,768 | | | | | 69% | |
| | | |
Depreciation | | | | 613,192 | | | | | 625,757 | | | | | -2% | |
| | | |
Acquisitions (net of cash acquired) | | | | 474,788 | | | | | 19,089 | | | | | not meaningful | |
| | | |
Sales per employee | | | | 690 | | | | | 690 | | | | | — | |
AT YEAR END | | | | | | | | | | | | | | | |
Working capital | | | | $4,116,427 | | | | | $4,469,232 | | | | | -8% | |
| | | |
Property, plant and equipment, net | | | | 5,078,650 | | | | | 4,891,153 | | | | | 4% | |
| | | |
Long-term debt (including current maturities) | | | | 4,339,141 | | | | | 4,337,145 | | | | | — | |
| | | |
Total Nucor stockholders’ equity | | | | 7,879,865 | | | | | 7,477,816 | | | | | 5% | |
| | | |
Per share | | | | 24.72 | | | | | 23.52 | | | | | 5% | |
| | | |
Shares outstanding | | | | 318,737 | | | | | 317,962 | | | | | — | |
| | | |
Employees | | | | 23,900 | | | | | 23,700 | | | | | 1% | |
| * | In the fourth quarter of 2016, Nucor changed its accounting method for valuing certain inventories from thelast-in,first-out (LIFO) inventory valuation method. All periods presented in the above table reflect this change in accounting principle. See Note 2 to the Consolidated Financial Statements for more information related to the change in accounting principle. |
FORWARD-LOOKING STATEMENTS Certain statements made in this annual report are forward-looking statements that involve risks and uncertainties. The words “believe,” “expect,” “project,” “will,” “should,” “could” and similar expressions are intended to identify those forward-looking statements. These forward-looking statements reflect the Company’s best judgment based on current information, and although we base these statements on circumstances that we believe to be reasonable when made, there can be no assurance that future events will not affect the accuracy of such forward-looking information. As such, the forward-looking statements are not guarantees of future performance, and actual results may vary materially from the projected results and expectations discussed in this report. Factors that might cause the Company’s actual results to differ materially from those anticipated in forward-looking statements include, but are not limited to: (1) competitive pressure on sales and pricing, including pressure from imports and substitute materials; (2) U.S. and foreign trade policies affecting steel imports or exports; (3) the sensitivity of the results of our operations to prevailing steel prices and changes in the supply and cost of raw materials, including pig iron, iron ore and scrap steel; (4) availability and cost of electricity and natural gas which could negatively affect our cost of steel production or could result in a delay or cancelation of existing or future drilling within our natural gas drilling programs; (5) critical equipment failures and business interruptions; (6) market demand for steel products, which, in the case of many of our products, is driven by the level of nonresidential construction activity in the U.S.; (7) impairment in the recorded value of inventory, equity investments, fixed assets, goodwill or other long-lived assets; (8) uncertainties surrounding the global economy, including the severe economic downturn in construction markets and excess world capacity for steel production; (9) fluctuations in currency conversion rates; (10) significant changes in laws or government regulations affecting environmental compliance, including legislation and regulations that result in greater regulation of greenhouse gas emissions that could increase our energy costs and our capital expenditures and operating costs or cause one or more of our permits to be revoked or make it more difficult to obtain permit modifications; (11) the cyclical nature of the steel industry; (12) capital investments and their impact on our performance; and (13) our safety performance.
| | | | |
26 | | | | MANAGEMENT’S DISCUSSION AND ANALYSIS OF FINANCIAL CONDITION AND RESULTS OF OPERATIONS |
OVERVIEW
STEEL INDUSTRY CONDITIONS
In spite of lackluster global economic and steel industry conditions, the economy in the United States continues to experience modest growth, and steel demand in this country is stronger than in many parts of the world. After several years of growth in nonresidential construction markets (the sector to which we are most closely tied and the largest end market for steel in the United States), demand stalled in 2015, and that trend continued in 2016. The domestic automotive market, which is the second largest end market for steel in the United States, had a second consecutive record year, with 17.6 million vehicles sold. With an improved labor market and low gasoline prices, we expect continued strength in vehicle sales in 2017. A steep drop in oil prices in 2015 had a significant negative impact on demand for energy-related steel, which is the third largest end market for steel in the United States. This low price environment remained throughout 2016, and we are only recently starting to see oil prices rise due to lower inventories and production from OPEC nations. Long-term, we believe that the domestic economy can benefit from globally competitive energy prices.
Although Nucor’s earnings increased in 2016, they were impacted significantly by continued extremely high levels of steel imports. Our industry remains greatly constrained by the impact of global overcapacity. Weak economic conditions in Europe, slow growth in China and a strong U.S. dollar relative to other foreign currencies continue to make the U.S. markets a prime target for foreign steel imports. While the steel industry has historically been characterized by periods of overcapacity and intense competition for sales among producers, we are currently experiencing an era of global overcapacity that is unprecedented. Despite ongoing domestic and global steel industry consolidation, the extraordinary increase in China’s steel production in the last decade, together with the excess capacity from other countries that have state-owned enterprises (SOEs) or export-focused steel industries, have exacerbated this overcapacity issue domestically as well as globally. According to the American Iron and Steel Institute, global steel overcapacity is estimated at approximately 770 million tons per year, with China’s overcapacity being the largest piece at approximately 470 million tons. Chinese overcapacity alone is estimated to be four times greater than the entire U.S. annual demand for steel. China is the world’s largest producer and exporter of steel, accounting for approximately 50% of the steel produced globally. We believe Chinese producers, many of which are government-owned in whole or in part, continue to benefit from their government’s manipulation of foreign currency exchange rates and from the receipt of government subsidies, which allow them to sell steel into our markets at artificially low prices.
Imported steel and steel products continue to present unique challenges for us because foreign producers often benefit from government subsidies, either directly through SOEs or indirectly through government-owned or controlled financial institutions. Foreign imports of finished and semi-finished steel were down approximately 15% in 2016 compared to 2015, but they still remain excessive with finished steel imports alone capturing 26% of the market despite significant unused cost-competitive domestic capacity. The surge comes from numerous countries and cuts across all product lines. Our products that experience the greatest amount of imports include: semi-finished steel, reinforcing bar, plate andhot-rolled, cold-rolled and galvanized sheet steel. Countries that contribute most significantly to the import total include South Korea, Turkey, Japan and China.
China is not only selling steel at artificially low prices into our domestic market but also across the globe. When it does so, steel products that would otherwise have been consumed by the local steel customers in other countries are displaced into global markets, compounding the issue. Nucor has joined three other domestic steelmakers in filing a petition alleging China is circumventing previously levied duties by shipping products through third-party countries. Also, in a more indirect manner, but still significant, is the import of fabricated steel products, such as oil country tubular goods, wind towers and other construction components that were produced in China.
The steel industry has always been cyclical in nature, but North American producers of steel and steel products have been facing, and are continuing to face, very challenging global market conditions. The average industry capacity utilization rate increased to approximately 73% in 2016 as compared to 71% in 2015. These rates compare unfavorably to capacity utilization rates that reached as high as 87% in 2007. Although domestic demand for steel and steel products is expected to remain healthy in 2017, we believe it is unlikely that average capacity utilization rates will increase significantly unless the U.S. government and world trade organizations continue to address global overcapacity and unfair trade practices. The average utilization rates of all operating facilities in our steel mills, steel products and raw materials segments were approximately 80%, 63% and 62%, respectively, in 2016, compared with 73%, 63% and 56%, respectively, in 2015. In spite of challenging market conditions, all of our product groups in the steel mills segment realized improved performance in 2016 over the prior year.
Macro-level uncertainties in world markets should continue to weigh on global and domestic growth in 2017. We believe our net sales and financial results will continue to be adversely affected by these general global economic factors as well as the global steel production overcapacity issue.
OUR CHALLENGES AND RISKS
Sales of many of our products are largely dependent upon capital spending in the nonresidential construction markets in the United States, including in the industrial and commercial sectors, as well as capital spending on infrastructure that is publicly funded, such as bridges, schools, prisons and hospitals. Unlike recoveries from past recessions, the recovery from the recession of 2008-2009 has not yet included a strong recovery in the severely depressed nonresidential construction market. While we have experienced a continued slightly positive trajectory in capital spending on nonresidential construction projects since 2009, we do not expect to see strong growth in our net sales until we see a more sustained increase in spending on these types of construction projects. Congress did pass a five-year surface transportation funding bill at the end of 2015, providing $305 billion for highway and public transportation projects. We are also encouraged by the new administration’s recent commentary on initiatives that should spur greater economic growth, including increased infrastructure spending, the rolling back of excessive regulations and encouraging domestic energy production.
The continued flow of artificially cheap exports by some of our major foreign competitors into the United States and elsewhere reduces our net sales and adversely impacts our financial results. Unfair trade practices have been challenged successfully as violating world trade rules. In 2016, the U.S. steel industry received positive determinations in trade cases involving three flat-rolled products – corrosion-resistant, cold-rolled andhot-rolled steel. In addition, the U.S. Department of Commerce announced preliminary duty determinations in investigations addressingcut-to-length plate from twelve countries. The U.S. Department of Commerce also announced the initiation of antidumping duty investigations of imports of steel concrete reinforcing bar from Japan, Taiwan and Turkey, and a countervailing duty (CVD) investigation of steel concrete reinforcing bar imports from Turkey. We expect the plate and rebar cases to conclude in 2017.
Efforts by foreign companies to evade duties by routing products through third-party countries is also a challenge. Artificially-priced imports and duty evasion schemes make it very difficult for Nucor to maintain sales prices and profit levels. As a result, Nucor joined three other steelmakers in filing a petition alleging China is circumventing coated steel sheet duties by shipping product through Vietnam. We continue to believe that assertive enforcement of world trade rules must be one of the highest priorities of the United States government.
Another important trade issue in 2017 is China’s continued treatment as anon-market economy in trade disputes. China was agovernment-run,non-market economy in 2001 when it entered its Protocol of Accession to the World Trade Organization (Protocol), and China remains agovernment-run,non-market economy today. The main objective of the Protocol was to encourage, and in some cases to require, China to make market-based economic reforms. China has argued that its accession agreement with the World Trade Organization requires it be treated as a market economy after 15 years, a milestone it surpassed in December 2016. However, over this period, China has failed to take the required steps to establish that it is a market economy under U.S. law. Therefore, we agree with the U.S. Department of Commerce’s decision to continue treating China as anon-market economy and we encourage other countries to support this position. By treating China as anon-market economy in antidumping cases, the U.S. Department of Commerce can assume that Chinese prices and costs are distorted, and it can use other methodologies to calculate antidumping duties. This treatment often results in appropriately higher duties against Chinese products, in order to offset its unfair trade practices.
A major uncertainty we continue to face in our business is the price of our principal raw material, ferrous scrap, which is volatile and often increases or decreases rapidly in response to changes in domestic demand, unanticipated events that affect the flow of scrap into scrap yards and changes in foreign demand for scrap. In periods of rapidly increasing raw material prices in the industry, which are often associated with periods of strong or rapidly improving steel market conditions, being able to increase our prices for the products we sell quickly enough to offset increases in the prices we pay for ferrous scrap is challenging but critical to maintaining our profitability. We attempt to mitigate the scrap price risk by managing scrap inventory levels at the steel mills to match the anticipated demand over the next several weeks. Certain scrap substitutes, including pig iron, have longer lead times for delivery than scrap, which can make this inventory management strategy difficult to achieve. Continued successful implementation of our raw material strategy, including key investments in Direct Reduced Iron (DRI) production coupled with the scrap brokerage and processing services performed by our team at the David J. Joseph Company (DJJ), gives us greater control over our metallic inputs and thus also helps us to mitigate this risk.
During periods of stronger or improving steel market conditions, we are more likely to be able to pass through to our customers, relatively quickly, the increased costs of ferrous scrap and scrap substitutes and to protect our gross margins from significant erosion. During weaker or rapidly deteriorating steel market conditions, including the global steel market environment of the past several years, weak steel demand, low industry utilization rates and the impact of imports create an even more intensified competitive environment. All of those factors, to some degree, impact pricing, which increases the likelihood that Nucor will experience lower gross margins.
Although the majority of our steel sales are to spot market customers who place their orders each month based on their business needs and our pricing competitiveness compared to both domestic and global producers and trading companies, we also sell contract tons, primarily in our sheet operations. Approximately 60% of our sheet sales were to contract customers in 2016 (60% and 50% in 2015 and 2014, respectively), with the balance in the spot market at the prevailing prices at the time of sale. Steel contract sales outside of our sheet operations are not significant. The amount of tons sold to contract customers depends on the overall market conditions at the time, how theend-use customers see the market moving forward and the strategy that Nucor management believes is appropriate to the upcoming period. Nucor management considerations include maintaining an appropriate balance of spot and
contract tons based on market projections and appropriately supporting our diversified customer base. The percentage of tons that is placed under contract also depends on the overall market dynamics and customer negotiations. In years of strengthening demand, we typically see an increase in the percentage of sheet sales sold under contract as our customers have an expectation that transaction prices will rapidly rise and available capacity will quickly be sold out. To mitigate this risk, customers prefer to enter into contracts in order to obtain committed volumes of supply from the mills. Our contracts include a method of adjusting prices on a periodic basis to reflect changes in the market pricing for steel and/or scrap. Market indices for steel generally trend with scrap pricing changes, but during periods of steel market weakness, the more intensified competitive steel market environment can cause the sales price indices to result in reduced gross margins and profitability. Furthermore, since the selling price adjustments are not immediate, there will always be a timing difference between changes in the prices we pay for raw materials and the adjustments we make to our contract selling prices. Generally, in periods of increasing scrap prices, we experience a short-term margin contraction on contract tons. Conversely, in periods of decreasing scrap prices, we typically experience a short-term margin expansion. Contract sales typically have terms ranging from six to twelve months.
Another significant uncertainty we face is the cost of energy. The availability and prices of electricity and natural gas are influenced today by many factors, including changes in supply and demand, advances in drilling technology and, increasingly, by changes in public policy relating to energy production and use. Proposed regulation of greenhouse gas emissions from new and refurbished power plants could increase our cost of electricity in future years, particularly if they are adopted in a form that requires deep reductions in greenhouse gas emissions. Adopting these regulations in an onerous form could lead to foreign producers that are not affected by them gaining a competitive advantage over us. We are monitoring these regulatory developments closely and will seek to educate public policy makers during the adoption process about their potential impact on our business and the U.S. manufacturing base.
OUR STRENGTHS AND OPPORTUNITIES
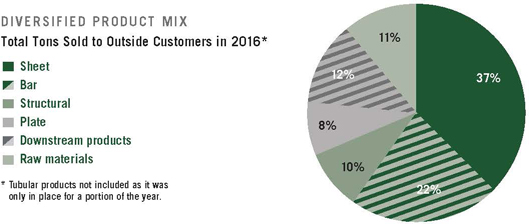
We are North America’s most diversified steel producer. As a result, our short-term performance is not tied to any one market. Since 2012, we have made investments of more than $6 billion on projects that are not only diversifying our product offerings but also the markets that we serve. These acquisitions and investments will grow our long-term earnings power by increasing our channels to market, expanding our product portfolio into higher value-added offerings that are less vulnerable to imports, improving our cost structure and further building upon our market leadership positions. The pie chart below shows the diversity of our product mix by total tons sold to outside customers in 2016.
Given the strategic emphasis in recent years of shifting our product mix to include a greater proportion of value-added steel mill products, we performed an analysis to understand the impact on our steel mills’ capacities in the fourth quarter of 2016. As a result of the analysis, we estimate Nucor’s total steelmaking annual capacity to be approximately 26.7 million tons. The estimate is a 7% decrease from our previous estimate of just under 29 million tons.
Nucor’s raw material supply chain is another important strength. Our investment in DRI production facilities and scrap brokerage and processing businesses provides Nucor with significant flexibility in optimizing our raw materials costs. Additionally, having a significant portion of our raw materials supply under our control minimizes risk associated with the global sourcing of raw materials, particularly since a considerable portion of scrap substitutes comes from regions of the world that have historically experienced greater political turmoil.
Our highly variable, low cost structure, combined with our financial strength and liquidity, has allowed us to successfully navigate cyclical, severely depressed steel industry market conditions in the past. In such times, our incentive-based pay system reduces our payroll costs, both hourly and salary, which helps to offset lower selling prices. Ourpay-for-performance system that is closely tied to our levels of production also allows us to keep our workforce intact and to continue operating our facilities when some of our competitors with greater fixed costs are forced to shut down some of their facilities. Because we use electric arc furnaces to produce our steel, we can easily vary our production levels to match short-term changes in demand, unlike our blast furnace-based integrated competitors. We believe these strengths also provide us further opportunities to gain market share during such times.
EVALUATING OUR OPERATING PERFORMANCE
We report our results of operations in three segments: steel mills, steel products and raw materials. Most of the steel we produce in our mills is sold to outside customers, but a significant percentage is used internally by some of the facilities in our steel products segment.
We begin measuring our performance by comparing our net sales, both in total and by individual segment, during a reporting period with our net sales in the corresponding period in the prior year. In doing so, we focus on changes in and the reasons for such changes in the two key variables that have the greatest influence on our net sales: average sales price per ton during the period and total tons shipped to outside customers.
We also focus on both dollar and percentage changes in gross margins, which are key drivers of our profitability, and the reasons for such changes. There are many factors from period to period that can affect our gross margins. One consistent area of focus for us is changes in “metal margins,” which is the difference between the selling price of steel and the cost of scrap and scrap substitutes. Increases or decreases in the cost of scrap and scrap substitutes that are not offset by changes in the selling price of steel can quickly compress or expand our margins and reduce our profitability.
Because energy is a key input to our manufacturing processes, material changes in energy costs per ton can significantly affect our gross margins as well. Lower energy costs per ton increase our gross margins. Generally, our energy costs per ton are lower when the average utilization rates of all operating facilities in our steel mills segment are higher.
Changes in marketing, administrative and other expenses, particularly profit sharing costs, can have a material effect on our results of operations for a reporting period as well. Profit sharing costs vary significantly from period to period as they are based upon changes in ourpre-tax earnings and are a reflection of ourpay-for-performance system that is closely tied to our levels of production.
EVALUATING OUR FINANCIAL CONDITION
We evaluate our financial condition each reporting period by focusing primarily on the amounts of and reasons for changes in cash provided by operating activities, our current ratio, the turnover rate of our accounts receivable and inventories, the amount and reasons for changes in cash used in or provided by investing activities and financing activities and our cash and cash equivalents and short-term investments position at period end. Our conservative financial practices have served us well in the past and are serving us well today. As a result, our financial position remains strong despite the negative effects on our business of global overcapacity and the continued weakness in the global economy.
2016 CHANGE IN ACCOUNTING PRINCIPLE
In the fourth quarter of 2016, we changed our accounting method for valuing inventories held by the parent company and Nucor-Yamato Steel Company to thefirst-in,first-out (FIFO) method of accounting from thelast-in,first-out (LIFO) method. All inventories held by other subsidiaries of the parent company were previously and continue to be valued using the FIFO method. The effects of the change in accounting principle from LIFO to FIFO have been retrospectively applied to all periods presented in all sections of this Annual Report to Stockholders, including Management’s Discussion and Analysis. See Note 2 to our Consolidated Financial Statements for more information related to the change in accounting principle.
COMPARISON OF 2016 TO 2015
RESULTS OF OPERATIONS
NET SALES
Net sales to external customers by segment for 2016 and 2015 were as follows:
| | | | | | | | | | |
| | | | | | | | | | (in thousands) |
Year Ended December 31, | | | 2016 | | | | 2015 | | | % Change |
| | | |
Steel mills | | | $ 11,312,048 | | | | $11,084,331 | | | 2% |
Steel products | | | 3,687,448 | | | | 3,966,895 | | | -7% |
Raw materials | | | 1,208,626 | | | | 1,388,050 | | | -13% |
Total net sales to external customers | | | $ 16,208,122 | | | | $16,439,276 | | | -1% |
| | | | | | | | | | | |
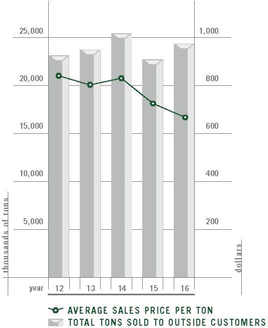
Net sales for 2016 decreased 1% from the prior year. Average sales price per ton decreased 8% from $725 in 2015 to $667 in 2016. Total tons shipped to outside customers increased 7% from 22.7 million tons in 2015 to 24.3 million tons in 2016.
In the steel mills segment, production and sales tons were as follows:
| | | | | | | | | | |
| | | | | | | | | (in thousands) |
| Year Ended December 31, | | 2016 | | | 2015 | | | % Change |
| | | |
Steel production | | | 21,282 | | | | 19,294 | | | 10% |
| | | |
Outside steel shipments | | | 18,846 | | | | 17,006 | | | 11% |
Inside steel shipments | | | 3,095 | | | | 2,854 | | | 8% |
Total steel shipments | | | 21,941 | | | | 19,860 | | | 10% |
| | | | | | | | | | | |
Net sales for the steel mills segment increased 2% in 2016 from the prior year primarily due to an 11% increase in total tons shipped to outside customers, which was partially offset by an 8% decrease in the average sales price per ton from $651 in 2015 to $601 in 2016.
Our sheet, bar, plate and structural products all experienced lower average selling prices in 2016 as compared to 2015. Overall steel market conditions remained challenging in 2016; however, volumes increased in 2016 compared to 2015 for all product groups within the steel mills segment, most notably in sheet. The improved volumes outweighed the decreased selling prices to result in increased sales for the steel mills segment in all but the first quarter of 2016, which had the lowest average sales price per ton of any quarter in 2015 and 2016, when compared to the respective prior year quarter. Service center inventory levels in 2016 continued the downward trend that was experienced in 2015. Energy, agricultural and heavy equipment markets were weak in both 2015 and 2016, while the automotive market was strong in both years. A positive factor impacting the steel mills segment in 2016 was decreased imports; however, imports remain at very high levels and accounted for an estimated 26% of the finished steel market in 2016.
The results of recent trade cases are having a positive impact as steel imports were down approximately 15% in 2016 compared to 2015. Inmid-2016, affirmative final determinations were announced in threeflat-rolled antidumping duty and countervailing duty cases involving corrosion-resistant, cold-rolled andhot-rolled steel products. These final determinations are an important step in returning fair trade to the U.S.flat-rolled steel market. In addition, thecut-to-length plate cases filed against twelve countries continue to progress through the trade case process. Affirmative final determinations have been announced on dumped steel from Brazil, South Africa and Turkey, and in January 2017, the U.S. Department of Commerce announced its final determinations against China for illegally subsidizing and dumping plate. We expect all plate cases to conclude in the coming months. The U.S. Department of Commerce also announced the initiation of antidumping duty investigations of imports of steel concrete reinforcing bar from Japan, Taiwan and Turkey, and a countervailing duty investigation of rebar imports from Turkey. We expect the rebar cases to conclude in 2017.
Outside sales tonnage data for the steel products segment was as follows:
| | | | | | | | |
| | | (in thousands) |
Year Ended December 31, | | 2016 | | 2015 | | | % Change |
| | | |
Joist sales | | 445 | | | 427 | | | 4% |
Deck sales | | 442 | | | 401 | | | 10% |
Cold finished sales | | 426 | | | 449 | | | -5% |
Fabricated concrete reinforcing steel sales | | 1,115 | | | 1,190 | | | -6% |
| | | |
| | | | | | | | | |
Net sales for the steel products segment decreased 7% from 2015 primarily due to a 3% decrease in tons sold to outside customers and a 6% decrease in the average sales price per ton from $1,374 in 2015 to $1,298 in 2016. Sales during 2016 followed the typical seasonal pattern that was also experienced in 2015. Total sales and volumes were lowest in the first quarter as winter weather conditions had their greatest impact on nonresidential construction markets. Conditions improved in the second quarter and remained relatively steady throughout the remainder of the year with a slight decline during the fourth quarter as winter weather conditions returned. Nonresidential construction markets remained generally flat during 2016 as full year nonresidential construction starts decreased in 2016 compared to 2015.
Net sales for the raw materials segment decreased 13% in 2016 from 2015 primarily due to decreased volumes and lower average selling prices in DJJ’s brokerage operations as well as decreased volumes in DJJ’s scrap processing operations. Approximately 89% of outside sales in the raw materials segment in 2016 were from DJJ’s brokerage operations and approximately 8% of outside sales were from DJJ’s scrap processing operations (88% and 8%, respectively, in 2015).
GROSS MARGIN
In 2016, Nucor recorded gross margins of $2.03 billion (12%) compared to $1.11 billion (7%) in 2015. Gross margins in 2016 benefitted from a 7% increase in tons shipped to outside customers and lower raw materials costs compared to 2015. The following factors also impacted gross margins:
| | |
· | | In the steel mills segment, the average scrap and scrap substitute cost per ton used decreased 16% from $270 in 2015 to $228 in 2016 and sales tons to outside customers increased 11%. These two factors combined to result in improved total metal margin dollars in 2016 as compared to 2015. Metal margin is the difference between the selling price of steel and the cost of scrap and scrap substitutes. The decline in average sales price contributed to the slight decline in metal margin per ton, but metal margin per ton as a percentage of average sales price per ton increased in 2016 as compared to 2015. The primary driver of the improved steel mill total metal margin dollars was the sheet mills’ 13% improvement in tons sold to outside customers in 2016 as compared to 2015. Metal margins per ton and total metal margin dollars in the fourth quarter of 2016 increased from the fourth quarter of 2015 due to higher average selling prices and increased volumes. |
| | | | | | |
| | | |
| | Scrap prices are driven by the global supply and demand for scrap and other iron-based raw materials used to make steel. Scrap prices were volatile throughout 2016 as the average cost of scrap and scrap substitutes used increased through the third quarter before decreasing during the fourth quarter of 2016. Despite the fourth quarter decrease from the third quarter, the average cost of scrap and scrap substitute used in the fourth quarter of 2016 increased 22% compared to the first quarter of 2016. As we begin 2017, we expect to see the scrap price increases in December and January tempered by some decline and leveling as the quarter progresses. | | | | 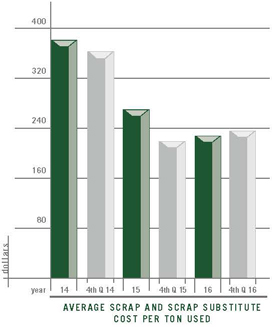
|
· | | Steel mill energy costs decreased approximately $4 per ton in 2016 compared with 2015 due to improved productivity and lower electricity and natural gas unit costs. Due to the efficiency of Nucor’s steel mills, energy costs were approximately 6% of the sales dollar in 2016 and 2015. | | | |
· | | As noted previously and elsewhere in our financial statements, we have continued to diversify into more value-added products which inherently have lower mill capacities. In the fourth quarter of 2016, we performed an analysis of the impact that the shift to value-added products had on steel mill capacity. As part of this analysis, we also revisited the impact that the shift in product mix had on our inventory costing. Based on this analysis, we changed our updated normal | | | |
| | capacity determination and the related full absorption costing. The impact of the change in estimate resulted in a netpre-tax benefit of $77.6 million, $83.0 million of which affected gross margin, being recorded in the fourth quarter of 2016. |
· | | Gross margins in the steel products segment for 2016 decreased compared to 2015 primarily due to decreased performance in our joist, deck, building systems and cold finish operations. Our combined joist and deck operations experienced the largest decrease in gross margins in 2016 as compared to 2015 due to higher steel input costs and lower average selling prices per ton. Gross margins in the steel products segment benefitted from the improved performance of our rebar fabrication businesses in 2016 as compared to 2015. |
· | | Gross margins related to DJJ’s scrap processing operations improved significantly during 2016 compared to 2015 due to significant and sustainable improvements in its cost structure, reducing both fixed and variable costs. |
· | | Gross margins in the raw materials segment in 2016 were adversely impacted by the performance of our DRI businesses. Although margins improved notably for the full year 2016 as compared to 2015, the DRI operations remained at a loss position. The depressed level of pricing for alternative raw materials in 2016 had an adverse impact on the pricing and margins of our DRI facilities. We believe there is a positive impact on our steel mills’ overall iron unit costs, including scrap and pig iron costs, when Nucor Steel Louisiana is producing high-quality DRI. |
| | Gross margins for our DRI businesses were higher in 2016 than in 2015, particularly at Nucor Steel Louisiana. Our Louisiana DRI facility was not in operation for much of the first quarter of 2015 as repairs related to an equipment failure that occurred in 2014 were completed. Following the resumption of operations, gross margins were negatively impacted by working through higher-cost iron ore inventory that could not be used as the necessary repairs caused by the equipment failure were being made. In the fourth quarter of 2015, following a planned maintenance outage, Nucor Steel Louisiana did not initially resume operations due to market conditions. The Louisiana DRI facility resumed operations in late January 2016. |
MARKETING, ADMINISTRATIVE AND OTHER EXPENSES
A major component of marketing, administrative and other expenses is profit sharing and other incentive compensation costs. These costs, which are based upon and fluctuate with Nucor’s financial performance, increased from 2015 to 2016 due to increased profitability in 2016. In 2016, profit sharing costs consisted of $129.0 million of contributions, including the Company’s matching contribution, made to the Company’s Profit Sharing and Retirement Savings Plan for qualified employees ($60.5 million in 2015). Other bonus costs also fluctuate based on Nucor’s achievement of certain financial performance goals, including comparisons of Nucor’s financial performance to peers in the steel industry and other companies. Stock-based compensation included in marketing, administrative and other expenses increased by 26% to $26.9 million in 2016 compared with $21.3 million in 2015 and includes costs associated with vesting of stock awards granted in prior years.
Marketing, administrative and other expenses increased in the fourth quarter of 2016 as compared to the fourth quarter of 2015 due to increased profit sharing and other incentive compensation costs as a result of increased earnings.
In the third quarter of 2016, there were charges related to legal settlements of $33.7 million included in marketing, administrative and other expenses. Also included in marketing, administrative and other expenses in the third quarter of 2016 was a net benefit of $11.1 million related to fair value adjustments to assets in the corporate/eliminations segment, the majority of which related to the acquisition of the remaining ownership interest in a joint venture.
EQUITY IN EARNINGS OF UNCONSOLIDATED AFFILIATES
Equity method investment earnings were $38.8 million in 2016 and $5.3 million in 2015. The increase in equity method investment earnings from 2015 to 2016 is primarily due to increased earnings at NuMit LLC (NuMit) and, to a lesser extent, a decrease in losses at Duferdofin Nucor S.r.l. (Duferdofin Nucor).
IMPAIRMENTS AND LOSSES ON ASSETS
In 2015, Nucor recorded $244.8 million in charges for impairments and losses on assets (none in 2016). During the fourth quarter of 2015, Nucor assessed its equity investment in Duferdofin Nucor for impairment due to unfavorable operating performance and deterioration in financial projections caused by increased global overcapacity in 2015. After completing its assessment, Nucor determined that the carrying amount exceeded its estimated fair value and was other than temporary. Nucor recorded a $153.0 million impairment charge against the Company’s investment in Duferdofin Nucor (see Note 9 to the Consolidated Financial Statements). The $153.0 million impairment charge was included in the steel mills segment.
Also during the fourth quarter of 2015, Nucor determined that certain assets, the majority of which were engineering and equipment related to a blast furnace project at our St. James Parish, Louisiana site, would not be utilized, resulting in an $84.1 million impairment charge (see Note 7 to the Consolidated Financial Statements). This charge was included in the raw materials segment.
INTEREST EXPENSE (INCOME)
Net interest expense is detailed below:
| | | | | | | | |
Year Ended December 31, | | 2016 | | | 2015 | |
| | |
Interest expense | | | $181,179 | | | | $177,543 | |
Interest income | | | (11,935 | ) | | | (4,012 | ) |
Interest expense, net | | | $169,244 | | | | $173,531 | |
| | |
| | | | | | | | | |
Gross interest expense increased in 2016 compared to 2015 primarily due to higher average interest rates on our variable rate debt. Gross interest income increased in 2016 due to increased average investment levels and higher average interest rates on investments.
EARNINGS BEFORE INCOME TAXES AND NONCONTROLLING INTERESTS
Earnings before income taxes and noncontrolling interests by segment for 2016 and 2015 were as follows:
| | | | | | | | | | |
Year Ended December 31, | | 2016 | | | 2015 | | | |
| | | | | | | | | | |
Steel mills | | | $ 1,724,168 | | | | $ 629,256 | | | |
Steel products | | | 249,970 | | | | 276,048 | | | |
Raw materials | | | (95,121 | ) | | | (283,938 | ) | | |
Corporate/eliminations | | | (580,358 | ) | | | (379,500 | ) | | |
Earnings before income taxes and noncontrolling interests | | | $ 1,298,659 | | | | $ 241,866 | | | |
| | | |
| | | | | | | | | | | |
Earnings before income taxes and noncontrolling interests in the steel mills segment for 2016 increased significantly from 2015 primarily due to improved total metal margin dollars resulting from increased sales volume and decreased input costs. The higher sales and production volumes in 2016 improved our energy and other production costs per ton as compared to 2015. The primary driver
of the improvement in the steel mills segment was our sheet mills, benefitting from the factors previously discussed. The improved results of our NuMit and Duferdofin Nucor equity method joint ventures also contributed to the increase in earnings in 2016 as compared to 2015. A positive factor benefitting the steel mills segment in 2016 was decreased imports; however, imports remain at very high levels and accounted for an estimated 26% of the finished steel market in 2016. During 2015, the $153.0 million impairment charge related to Duferdofin Nucor significantly impacted the steel mills segment, causing the segment to report a loss before income taxes and noncontrolling interests in the fourth quarter of 2015. Overall operating rates at our steel mills for the full year 2016 increased to 80% as compared to 73% for the full year 2015.
In the steel products segment, earnings before income taxes and noncontrolling interests decreased slightly in 2016 compared to 2015. The performance of our joist, deck, buildings systems and cold finish operations during 2016 declined compared to 2015, while the performance of our rebar fabrication businesses had strong year-over-year improvement despite a generally flat nonresidential construction market. Backlog tons for our joist, deck, building systems and rebar fabrication businesses were higher at the end of 2016 than at the end of 2015 as market demand seems to be improving.
Earnings before income taxes and noncontrolling interests in the raw materials segment for 2016 improved significantly from 2015, with the most significant driver being the improved performance of our DRI operations, particularly at Nucor Steel Louisiana. In 2015, Nucor Steel Louisiana’s performance was affected by the challenging conditions previously discussed. During 2016, the facility was able to run throughout the year and benefitted from improved pricing that led to a profitable third quarter of 2016. Also contributing to the increased performance of the raw materials segment was the significant improvement in profitability of DJJ’s scrap processing operations in 2016. Earnings before income taxes and noncontrolling interests for the raw materials segment in 2015 were negatively impacted by the $84.1 million impairment charge on assets related to a blast furnace project that will not be utilized in the future.
NONCONTROLLING INTERESTS
Noncontrolling interests represent the income attributable to the minority interest partners of Nucor’s joint ventures, primarily Nucor-Yamato Steel Company (NYS), of which Nucor owns 51%. The 7% decrease in earnings attributable to noncontrolling interests from 2016 to 2015 was primarily due to decreased metal margins as a result of lower selling prices, partially offset by increased volumes. Under the NYS limited partnership agreement, the minimum amount of cash to be distributed each year to the partners is the amount needed by each partner to pay applicable U.S. federal and state income taxes.
PROVISION FOR INCOME TAXES
The effective tax rate in 2016 was 30.7% compared with 20.2% in 2015. The increase in the rate between 2015 and 2016 is primarily due to the change in the relative proportions of net earnings attributable to noncontrolling interests to totalpre-tax earnings between the periods. The effective tax rate in 2015 also benefited from lower state income taxes caused by state tax credits and the reversal of previously unrecognized tax benefits. These decreases in the 2015 rate were somewhat offset by an increase as a result of the $153.0 million financial statement impairment of an investment in a foreign joint venture. Nucor has concluded U.S. federal income tax matters for years through 2012. Tax years 2013 through 2015 remain open to examination by the Internal Revenue Service. The Canada Revenue Agency has substantially concluded its examination of the 2012 Canadian returns for Harris Steel Group Inc. and certain related affiliates and is now examining the 2013 Canadian returns. The tax years 2009 through 2015 remain open to examination by other major taxing jurisdictions to which Nucor is subject (primarily Canada and other state and local jurisdictions).
| | |
NET EARNINGS AND RETURN ON EQUITY Nucor reported net earnings of $796.3 million, or $2.48 per diluted share, in 2016, compared to net earnings of $80.7 million, or $0.25 per diluted share, in 2015. Net earnings attributable to Nucor stockholders as a percentage of net sales was 4.9% and 0.5% in 2016 and 2015, respectively. Return on average stockholders’ equity was 10.4% and 1.0% in 2016 and 2015, respectively. | | 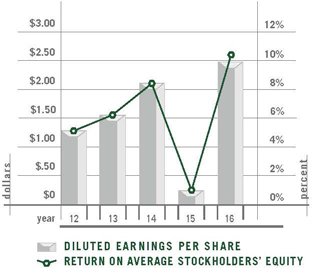 |
COMPARISON OF 2015 TO 2014
RESULTS OF OPERATIONS
NET SALES
Net sales to external customers by segment for 2015 and 2014 were as follows:
| | | | | | | | | | | | |
| | | | | | | | | (in thousands) | |
| Year Ended December 31, | | 2015 | | | 2014 | | | % Change | |
| | | |
Steel mills | | | $ 11,084,331 | | | | $ 14,723,642 | | | | -25% | |
Steel products | | | 3,966,895 | | | | 4,032,385 | | | | -2% | |
Raw materials | | | 1,388,050 | | | | 2,349,114 | | | | -41% | |
Total net sales to external customers | | | $ 16,439,276 | | | | $ 21,105,141 | | | | -22% | |
| | | |
| | | | | | | | | | | | | |
Net sales for 2015 decreased 22% from the prior year. The average sales price per ton decreased 13% from $830 in 2014 to $725 in 2015, while total tons shipped to outside customers decreased 11% from 25.4 million tons in 2014 to 22.7 million tons in 2015.
In the steel mills segment, production and sales tons were as follows:
| | | | | | | | | | | | |
| | | | | | | | | (in thousands) | |
| Year Ended December 31, | | 2015 | | | 2014 | | | % Change | |
| | | |
Steel production | | | 19,294 | | | | 21,135 | | | | -9% | |
| | | |
Outside steel shipments | | | 17,006 | | | | 18,681 | | | | -9% | |
Inside steel shipments | | | 2,854 | | | | 3,286 | | | | -13% | |
Total steel shipments | | | 19,860 | | | | 21,967 | | | | -10% | |
| | | |
| | | | | | | | | | | | | |
Net sales to external customers in the steel mills segment decreased 25% due to a 17% decrease in the average sales price per ton from $788 in 2014 to $651 in 2015 and a 9% decrease in tons sold to outside customers.
Outside sales tonnage for the steel products segment was as follows:
| | | | | | | | | | | | |
| | | | | | | | | (in thousands) | |
| Year Ended December 31, | | 2015 | | | 2014 | | | % Change | |
| | | |
Joist sales | | | 427 | | | | 421 | | | | 1% | |
Deck sales | | | 401 | | | | 396 | | | | 1% | |
Cold finished sales | | | 449 | | | | 504 | | | | -11% | |
Fabricated concrete reinforcing steel sales | | | 1,190 | | | | 1,185 | | | | — | |
Net sales to external customers in the steel products segment decreased 2% in 2015 from 2014 due to a 1% decrease in tons sold to outside customers and a 1% decrease in the average sales price per ton from $1,383 in 2014 to $1,374 in 2015.
Sales for the raw materials segment decreased 41% from 2014 primarily due to decreased volumes in DJJ’s brokerage and processing businesses. Approximately 88% of outside sales in the raw materials segment in 2015 were from DJJ’s brokerage operations and approximately 8% of the outside sales were from DJJ’s scrap processing operations (81% and 12%, respectively, in 2014).
GROSS MARGIN
In 2015, Nucor recorded gross margins of $1.11 billion (7%) compared to $1.85 billion (9%) in 2014. The year-over-year dollar decrease was primarily the result of the 13% decrease in the average sales price per ton and 11% decrease in tons shipped to outside customers. Gross margin during 2015 was also affected by the following factors:
| | |
· | | In the steel mills segment, the average scrap and scrap substitute cost per ton used decreased 29% from $381 in 2014 to $270 in 2015; however, overall metal margin decreased significantly in 2015 due to lower sales prices and volumes. |
· | | Total steel mill energy costs decreased approximately $3 per ton from 2014 to 2015 primarily due to lower natural gas and electricity unit costs. |
· | | Nucor’s 2014 gross margins were negatively impacted by $8.9 million in inventory-related purchase accounting adjustments associated with our acquisition of Gallatin Steel Company (Gallatin) in the fourth quarter of 2014 (none in 2015). |
· | | Gross margins in the steel products segment for 2015 increased significantly compared to 2014 primarily due to improved performance in our joist, deck, rebar and building systems operations. These operations experienced margin expansion in 2015 due to lower input costs caused by decreased steel prices and the successful execution of cost reduction strategies. |
· | | Our Nucor Steel Louisiana DRI facility experienced an equipment failure in the fourth quarter of 2014 that suspended production operations until late in the first quarter of 2015. The facility’s margins in 2015 were negatively impacted by working through higher-cost iron ore that was purchased at the end of 2014 but was unable to be used until the facility resumed operations. Following a planned maintenance outage that occurred in the fourth quarter of 2015, Nucor Steel Louisiana did not initially resume operations due to market conditions. The Louisiana DRI facility resumed operations in late January 2016. |
· | | Gross margins related to DJJ’s scrap processing and brokerage operations decreased during 2015 compared to 2014 due to weaker demand for scrap and other metallic commodities as steel mill utilization decreased. |
MARKETING, ADMINISTRATIVE AND OTHER EXPENSES
Profit sharing costs decreased from 2014 to 2015. In 2015, profit sharing costs consisted of $60.5 million of contributions, including the Company’s matching contribution, made to the Company’s Profit Sharing and Retirement Savings Plan for qualified employees ($110.1 million in 2014). Stock-based compensation included in marketing, administrative and other expenses decreased 3% to $21.3 million in 2015 compared with $21.9 million in 2014 and includes costs associated with vesting of stock awards granted in prior years.
EQUITY EARNINGS OF UNCONSOLIDATED AFFILIATES
Equity method investment earnings were $5.3 million in 2015 and $13.5 million in 2014. The decrease in equity method investment earnings from 2014 to 2015 is primarily due to decreased earnings at NuMit and 2015 losses at Hunter Ridge Energy Services LLC compared to earnings in 2014, partially offset by a decrease in losses at Duferdofin Nucor.
IMPAIRMENTS AND LOSSES ON ASSETS
In 2015, Nucor recorded $244.8 million in charges for impairments and losses on assets. The charges for impairments in 2015 related to the $153.0 million impairment charge against the Company’s investment in Duferdofin Nucor (see Note 9 to the Consolidated Financial Statements) and the $84.1 million charge related to a blast furnace project that will not be utilized in the future (see Note 7 to the Consolidated Financial Statements). These charges are included in the steel mills segment and the raw materials segment, respectively.
In 2014, Nucor recorded $25.4 million of impairments and losses on assets primarily related to a $9.0 million charge on the disposal of assets and a $12.5 million charge related to the partial write-down of assets, both in the steel mills segment.
INTEREST EXPENSE (INCOME)
Net interest expense is detailed below:
| | | | | | |
| | | (in thousands) |
Year Ended December 31, | | 2015 | | | 2014 |
| | |
Interest expense | | | $177,543 | | | $174,142 |
Interest income | | | (4,012) | | | (4,886) |
Interest expense, net | | | $173,531 | | | $169,256 |
| | |
| | | | | | | |
Gross interest expense increased in 2015 as compared to 2014 due primarily to lower capitalized interest during 2015. The decrease in 2015 as compared to 2014 in gross interest income is attributable to lower interest income received on credit facilities that Nucor extended to a joint venture as the joint venture fully repaid its credit facilities in 2014.
EARNINGS BEFORE INCOME TAXES AND NONCONTROLLING INTERESTS
Earnings before income taxes and noncontrolling interests by segment for 2015 and 2014 were as follows:
| | | | | | |
| | | | | | (in thousands) |
Year Ended December 31, | | 2015 | | | 2014 |
| | |
Steel mills | | | $ 629,256 | | | $1,594,352 |
Steel products | | | 276,048 | | | 166,323 |
Raw materials | | | (283,938) | | | (29,053) |
Corporate/eliminations | | | (379,500) | | | (584,334) |
Earnings before income taxes
and noncontrolling interests | | | $ 241,866 | | | $1,147,288 |
| | |
| | | | | | | |
Earnings before income taxes and noncontrolling interests in the steel mills segment for 2015 decreased significantly from 2014 due to significantly lower total metal margin dollars caused by lower sales volume and lower average sales prices resulting from the factors discussed above. The $153.0 million impairment charge related to Duferdofin Nucor significantly impacted the steel mills segment and caused the segment to report a loss before income taxes and noncontrolling interests in the fourth quarter of 2015. The steel mills segment’s profitability in 2014 was impacted by a $9.0 million charge on the disposal of assets and a $12.5 million charge related to the partial write-down of assets within the segment. Market conditions were much more challenging for the steel mills segment in 2015 as compared to 2014 due to the steep drop in oil prices and the significant negative impact on energy-related steel. Imports remained at historically high levels and accounted for an estimated 34% of the finished and semi-finished steel market in 2015.
In the steel products segment, earnings before income taxes and noncontrolling interests increased significantly in 2015 compared to 2014. Nonresidential construction markets experienced a slight decrease in demand as nonresidential building construction starts were lower in 2015 as compared to 2014. Despite this slight decrease in demand and only modest increases in volumes for our joist, deck, rebar fabrication and building systems operations, the steel products segment was able to expand its margins in 2015 due to lower steel costs.
Earnings before income taxes and noncontrolling interests in the raw materials segment for 2015 decreased significantly from 2014. DJJ’s brokerage and scrap processing operations had lower sales volumes and average selling prices in 2015 compared to 2014. Falling prices throughout 2015 caused margin compression at our scrap processing businesses. The raw materials segment was also impacted by the decreased performance of our DRI facilities in 2015 as previously discussed. Also negatively impacting the profitability of the raw materials segment in 2015 was the $84.1 million impairment charge for assets related to a blast furnace project.
NONCONTROLLING INTERESTS
The 13% increase in earnings attributable to noncontrolling interests from 2014 to 2015 was primarily due to increased metal margins as a result of lower raw materials costs, a more favorable product mix and the impact of a planned three-week outage associated with a capital project in the second quarter of 2014, partially offset by decreased volumes.
PROVISION FOR INCOME TAXES
The effective tax rate in 2015 was 20.2% compared with 32.1% in 2014. The decrease in the rate between 2014 and 2015 is primarily due to the change in the relative proportions of net earnings attributable to noncontrolling interests to totalpre-tax earnings between the periods. The effective tax rate in 2015 also benefited from lower state income taxes caused by state tax credits and the reversal of previously unrecognized tax benefits. These decreases in the 2015 rate were somewhat offset by an increase as a result of the $153.0 million financial statement impairment of an investment in a foreign joint venture.
NET EARNINGS AND RETURN ON EQUITY
Nucor reported net earnings of $80.7 million, or $0.25 per diluted share, in 2015, compared to net earnings of $679.3 million, or $2.11 per diluted share, in 2014. Net earnings attributable to Nucor stockholders as a percentage of net sales was 0.5% and 3.2% in 2015 and 2014, respectively. Return on average stockholders’ equity was 1.0% and 8.4% in 2015 and 2014, respectively.
LIQUIDITY AND CAPITAL RESOURCES
Nucor’s cash and cash equivalents and short-term investments position remained strong at $2.20 billion at the end of 2016. Approximately $348.8 million and $360.6 million of the cash and cash equivalents position at December 31, 2016 and December 31, 2015, respectively, was held by our majority-owned joint ventures. Cash flows provided by operating activities provide us with a significant source of liquidity. When needed, we have external short-term financing sources available, including the issuance of commercial paper and borrowings under our bank credit facilities. We also issue long-term debt from time to time.
Nucor has a $1.5 billion revolving credit facility that matures in April 2021 and was undrawn at December 31, 2016. We believe our financial strength is a key strategic advantage among domestic steel producers, particularly during recessionary business cycles. We carry the highest credit ratings of any steel producer headquartered in North America, with anA- long-term rating from Standard and Poor’s and a Baa1 long-term rating from Moody’s. Our credit ratings are dependent, however, upon a number of factors, both qualitative and quantitative, and are subject to change at any time. The disclosure of our credit ratings is made in order to enhance investors’ understanding of our sources of liquidity and the impact of our credit ratings on our cost of funds. Based upon the preceding factors, we expect to continue to have adequate access to the capital markets at a reasonable cost of funds for liquidity purposes when needed.
| | | | | | |
Selected Measures of Liquidity and Capital Resources | | | |
| | | (dollars in thousands) |
December 31, | | 2016 | | | 2015 |
| | |
Cash and cash equivalents | | | $ 2,045,961 | | | $ 1,939,469 |
Short-term investments | | | 150,000 | | | 100,000 |
Working capital | | | 4,116,427 | | | 4,469,232 |
Current ratio | | | 2.7 | | | 4.2 |
| | |
| | | | | | | |
The current ratio was 2.7 at year end 2016 compared with 4.2 at year end 2015. The current ratio was negatively impacted by the reclassification of $600.0 million of debt due in December 2017 fromnon-current to current liabilities, a 48% increase in accounts payable due primarily to a 24% rise in the value of scrap and scrap substitutes on hand from year end 2015 to year end 2016, as well as a 48% increase in salaries, wages and related accruals mainly due to greater performance-based bonus accruals resulting from Nucor’s improved profitability in 2016 over the prior year.
The current ratio was positively impacted by an 18% increase in accounts receivable and a 10% increase in inventory from year end 2015. The increase in accounts receivable was primarily due to a 14% increase in outside shipments in the fourth quarter of 2016 compared with the prior year fourth quarter. Inventories increased from year end 2015 due to the rise in the value of scrap and scrap substitutes previously mentioned. Finally, the 8% increase from 2015 in cash and cash equivalents and short-term investments was primarily due to the robust $1.74 billion of cash generated by operating activities during 2016, partially offset by cash used for capital expenditures, acquisitions and dividends.
In 2016, total accounts receivable turned approximately every five weeks and inventories turned approximately every eight weeks. These ratios compare with accounts receivable turnover of approximately every five weeks and inventory turnover of approximately every nine weeks in 2015.
Funds provided by operations, cash and cash equivalents, short-term investments and new borrowings under existing credit facilities are expected to be adequate to meet future capital expenditure and working capital requirements for existing operations for at least the next 24 months.
We have a simple capital structure with nooff-balance sheet arrangements or relationships with unconsolidated special purpose entities that we believe could have a material impact on our financial condition or liquidity.
CAPITAL ALLOCATION STRATEGY
Nucor’s strong cash and cash equivalents and short-term investments position provides many opportunities for prudent deployment of our capital. We have three approaches to allocating our capital. Nucor’s highest capital allocation priority is to invest for profitable long-term growth through our multi-pronged strategy of optimizing existing operations, acquisitions and greenfield expansions. Our second priority is to provide our stockholders with cash dividends that are consistent with our success in delivering long-term earnings growth. Our third priority is to opportunistically repurchase our stock when our cash position is strong and attractively priced growth opportunities are limited. In September 2015, Nucor’s Board of Directors authorized the repurchase of up to $900 million of the Company’s common stock. For the first time since 2008, Nucor repurchased approximately 1.7 million shares of stock for $66.5 million in December 2015 and approximately 0.1 million shares of stock for $5.2 million in February 2016.
| | |
OPERATING ACTIVITIES Cash provided by operating activities was $1.74 billion in 2016, a decrease of 19% compared with cash provided by operating activities of $2.16 billion in 2015. The primary reason for the change is decreased cash generated from changes in operating assets and liabilities of $20.9 million in 2016 compared with cash generated by changes in operating assets and liabilities of $1.21 billion in 2015. The decrease in cash generated from changes in operating assets and liabilities was partially offset by the $707.4 million increase in net earnings and the increase in deferred income taxes in 2016 over the prior year. The funding of working capital increased from the prior year due mainly to increases in accounts receivable and inventories, partially offset by increases in accounts payable and salaries, wages and related accruals. Accounts receivable increased due to a 14% increase in outside shipments in the fourth quarter of 2016 from the fourth quarter of 2015, while average sales price per ton remained consistent during those periods. Inventories and accounts payable increased due to a 24% increase in scrap and scrap substitutes cost per ton in inventory from year end 2015. The increase in salaries, wages and related accruals as compared with 2015 is mainly due to greater performance-based bonus accruals resulting from the Company’s increased profitability in 2016 over 2015. | | 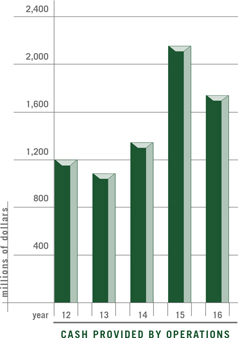
|
INVESTING ACTIVITIES
Our business is capital intensive; therefore, cash used in investing activities primarily represents capital expenditures for new facilities, the expansion and upgrading of existing facilities and the acquisition of other companies. Cash used in investing activities increased $583.4 million from 2015 to 2016. The largest factor contributing to the increase in cash used in investing activities was the $455.7 million increase in cash paid for the acquisition of other companies in 2016 over the prior year, mainly due to the use of $424.7 million of cash for the acquisition of Independence Tube Corporation in the fourth quarter of 2016. Nucor invested $604.8 million in new facilities and expansion or upgrading of existing facilities in 2016 compared with $374.1 million in 2015. The increase in capital expenditures is due to Nucor’s purchase of 49% of Encana Oil & Gas (USA) Inc.’s leasehold interest covering approximately 54,000 acres in the South Piceance Basin, NYS’s quench and self-tempering expansion, the addition of a cold mill complex at Nucor Steel Arkansas and various other capital expansion projects. These increases in cash used for investing activities were partially offset by the receipt of $135.0 million from the sale of our 50% equity interest in Hunter Ridge Energy Services LLC.
FINANCING ACTIVITIES
Cash used in financing activities in 2016 was $614.0 million compared with cash used in financing activities of $789.8 million in 2015. The majority of the change was due to the first quarter 2015 repayment of approximately $151 million of commercial paper that was issued in 2014 and outstanding at year end 2014 to partially fund the acquisition of Gallatin. Additionally, cash used to repurchase treasury stock decreased from $66.5 million in 2015 to $5.2 million in 2016.
In 2016, Nucor increased its quarterly base dividend, resulting in dividends paid of $481.1 million in 2016 compared with $479.4 million in 2015.
Our credit facility includes only one financial covenant, which is a limit of 60% on the ratio of funded debt to total capitalization. In addition, the credit facility contains customarynon-financial covenants, including a limit on Nucor’s ability to pledge the Company’s assets and a limit on consolidations, mergers and sales of assets. Our funded debt to total capital ratio was 35% at the end of 2016 and 36% at the end of 2015, and we were in compliance with all other covenants under our credit facility at the end of 2016.
MARKET RISK
Nucor’s largest exposure to market risk is in our steel mills and steel products segments. Our utilization rates for the steel mills and steel products’ facilities for the fourth quarter of 2016 were 74% and 60%, respectively. A significant portion of our steel mills and steel products segments sales are into the commercial, industrial and municipal construction markets. These markets continue to be depressed when compared to historical levels, and the domestic steel industry continues to be negatively affected by imported steel. Our largest single customer in 2016 represented approximately 4% of sales and consistently pays within terms. In the raw materials segment, we are exposed to price fluctuations related to the purchase of scrap steel and iron ore. Our exposure to market risk is mitigated by the fact that our steel mills use a significant portion of the products of this segment.
Nucor’stax-exempt industrial development revenue bonds (IDRBs), including the Gulf Opportunity Zone bonds, have variable interest rates that are adjusted weekly. These IDRBs represent 23% of Nucor’s long-term debt outstanding at December 31, 2016. The remaining 77% of Nucor’s long-term debt is at fixed rates. Future changes in interest rates are not expected to significantly impact earnings. From time to time, Nucor makes use of interest rate swaps to manage interest rate risk. As of December 31, 2016, there were no such contracts outstanding. Nucor’s investment practice is to invest in securities that are highly liquid with short maturities. As a result, we do not expect changes in interest rates to have a significant impact on the value of our investment securities recorded as short-term investments.
Nucor also uses derivative financial instruments from time to time to partially manage its exposure to price risk related to natural gas purchases used in the production process as well as scrap, copper and aluminum purchased for resale to its customers. In addition, Nucor uses forward foreign exchange contracts from time to time to hedge cash flows associated with certain assets and liabilities, firm commitments and anticipated transactions. Nucor generally does not enter into derivative instruments for any purpose other than hedging the cash flows associated with specific volumes of commodities that will be purchased and processed or sold in future periods and hedging the exposures related to changes in the fair value of outstanding fixed-rate debt instruments and foreign currency transactions. Nucor recognizes all derivative instruments in the consolidated balance sheets at fair value.
The Company is exposed to foreign currency risk primarily through its operations in Canada, Europe and Trinidad. We periodically use derivative contracts to mitigate the risk of currency fluctuations.
CONTRACTUAL OBLIGATIONS AND OTHER COMMERCIAL COMMITMENTS
The following table sets forth our contractual obligations and other commercial commitments as of December 31, 2016 for the periods presented:
| | | | | | | | | | | | | | | | | | | | | | | | | |
| | | | | (in thousands) |
| | | Payments Due By Period |
| | | | | |
| Contractual Obligations | | Total | | 2017 | | 2018 - 2019 | | 2020 - 2021 | | 2022 and thereafter |
| | | | | |
Long-term debt | | | | $ 4,360,600 | | | | | $ 600,000 | | | | | $ 500,000 | | | | | $ 20,000 | | | | | $3,240,600 | |
Estimated interest on long-term debt(1) | | | | 2,091,939 | | | | | 182,240 | | | | | 254,918 | | | | | 242,666 | | | | | 1,412,115 | |
Capital leases | | | | 31,868 | | | | | 3,597 | | | | | 7,194 | | | | | 7,194 | | | | | 13,883 | |
Operating leases | | | | 103,481 | | | | | 27,705 | | | | | 39,251 | | | | | 22,343 | | | | | 14,182 | |
Raw material purchase commitments(2) | | | | 1,697,564 | | | | | 1,045,836 | | | | | 430,295 | | | | | 115,738 | | | | | 105,695 | |
Utility purchase commitments(2) | | | | 945,515 | | | | | 224,339 | | | | | 217,632 | | | | | 153,700 | | | | | 349,844 | |
Other unconditional purchase obligations(3) | | | | 101,557 | | | | | 96,884 | | | | | 2,424 | | | | | 1,420 | | | | | 829 | |
Other long-term obligations(4) | | | | 513,938 | | | | | 341,776 | | | | | 53,774 | | | | | 11,758 | | | | | 106,630 | |
Total contractual obligations | | | | $ 9,846,462 | | | | | $2,522,377 | | | | | $1,505,488 | | | | | $ 574,819 | | | | | $5,243,778 | |
| | | | | |
| | | | | | | | | | | | | | | | | | | | | | | | | | |
| | (1) | Interest is estimated using applicable rates at December 31, 2016 for Nucor’s outstanding fixed and variable rate debt. |
| | (2) | Nucor enters into contracts for the purchase of scrap and scrap substitutes, iron ore, electricity, natural gas and other raw materials and related services. These contracts include multi-year commitments and minimum annual purchase requirements and are valued at prices in effect on December 31, 2016, or according to the contract language. These contracts are part of normal operations and are reflected in historical operating cash flow trends. We do not believe such commitments will adversely affect our liquidity position. |
| | (3) | Purchase obligations include commitments for capital expenditures on operating machinery and equipment. |
| | (4) | Other long-term obligations include amounts associated with Nucor’s early-retiree medical benefits, management compensation and guarantees. |
| Note: | In addition to the amounts shown in the table above, $44.1 million of unrecognized tax benefits have been recorded as liabilities, and we are uncertain as to if or when such amounts may be settled. Related to these unrecognized tax benefits, we have also recorded a liability for potential penalties and interest of $18.4 million at December 31, 2016. |
DIVIDENDS
Nucor has increased its base cash dividend every year since it began paying dividends in 1973. Nucor paid dividends of $1.50 per share in 2016, compared with $1.49 per share in 2015. In November 2016, the Board of Directors increased the base quarterly dividend to $0.3775 per share. The base quarterly dividend has more than tripled over the past ten years. In February 2017, the board of directors declared Nucor’s 176th consecutive quarterly cash dividend of $0.3775 per share payable on May 11, 2017 to stockholders of record on March 31, 2017.
OUTLOOK
In 2017, we expect to take advantage of our position of strength to grow Nucor’s long-term earnings power and stockholder value despite a U.S. economy burdened by a challenging regulatory and overall business environment. We have invested significant capital into our business since the last cyclical peak in 2008. We have done so over a broad range of strategic acquisitions and investments that we believe will further enhance our ability to grow Nucor’s long-term earnings power by increasing our channels to market, expanding our product portfolios into higher value-added offerings that are less vulnerable to imports, improving our highly variable low cost structure and building upon our market leadership positions. With many of these capital projects completed and ready to yield results, we will focus on execution in order to generate strong returns on these investments. We will also utilize our strong liquidity position to seek investment opportunities to further grow our long-term earnings capacity.
We are very encouraged regarding full year volume, pricing and profitability and believe our 2017 results could significantly exceed the prior year. We expect our sheet mills to perform more consistently in 2017 due to the full year benefit of recent trade actions. Our plate mills and bar mills are also expected to deliver improved profitability as the pending plate and rebar cases are expected to conclude in 2017. Additionally, improved conditions in energy markets are expected to result in higher drilling activity and rig counts, benefitting energy-related steel mill products. Consumer confidence has risen sharply in December 2016 and in January 2017 due to a more optimistic outlook for the economy and job growth during the year ahead. Subject to timing, proposed infrastructure bills should benefit not just our steel mills segment but a number of steel products as well. While utilization rates remained depressed in 2016 we have realized some increase in momentum early in 2017. Due to lower industry output, reduced inventory levels at our service center customers and slight decreases in import volumes, we have been able to realize significant price increases for certain products within our steel mills segment late in 2016, and this has continued in early 2017. We expect that our downstream steel products segment will continue to build on its positive results after the typical seasonal slow-down in construction that the winter season brings. We anticipate improvement in the performance of the raw materials segment due to demand-driven stronger margins at our DRI mills as well as our scrap recycling businesses.
We expect our first quarter operating results to increase compared to the fourth quarter of 2016. Spot prices on many of our products continue to improve and lead times are extending. Many sources predict healthy increases in nonresidential construction markets in 2017. The domestic automotive market experienced a second consecutive record year in 2016, with 17.6 million vehicles sold. With an improved labor market and stable gasoline prices, vehicle sales are expected to continue to be strong in 2017. The energy markets languished throughout much of 2016 after the collapse in global oil prices in 2015 triggered inventory reductions among pipe and tube producers serving those markets. The energy market, especially oil country tubular goods, is slowly recovering and we expect modest improvement throughout 2017. Backlogs in both the steel mills and steel products segments strengthened late in 2016, and we believe severalend-use markets such as nonresidential construction, automotive and energy will experience real demand improvement that may gain momentum throughout 2017. However, the effect this improvement in demand will have on our operating rates will be challenged by excess foreign steel capacity and the threat of continued increases in imported steel. We have aggressively fought to stem the tide of unfairly traded imports and we applaud recent trade legislation that puts our nation in a much stronger position to hold foreign governments accountable when violating U.S. trade laws. Trade cases initiated by the U.S. steel industry targeting several products groups are having a positive impact as steel imports decreased approximately 15% in 2016 when compared to 2015. We expect that scrap prices will increase slightly over the balance of 2017 and that we will continue to experience fluctuations in raw material costs throughout the year. We have made significant investments in our raw materials segment and will continue to utilize our unmatched global supply chain to optimize our raw material costs.
We are committed to executing on the opportunities we see ahead to reward Nucor stockholders with very attractive long-term returns on their valuable capital invested in our company. Nucor is the only steel producer headquartered in North America with the extremely important competitive advantage of an investment-grade credit rating. Our industry-leading financial strength allows us to support investments in our facilities that will prepare us for increased profitability as we enter into more favorable market conditions. In 2017, as we have in our past, we will allocate capital to investments that build our long-term earnings power. Capital expenditures are currently projected to be approximately $575 million in 2017. Included in this total are primarily investments in our core operations to expand our product offerings and keep themstate-of-the-art and globally cost-competitive.
CRITICAL ACCOUNTING POLICIES AND ESTIMATES
Our discussion and analysis of our financial condition and results of operations are based upon our consolidated financial statements, which have been prepared in accordance with accounting principles generally accepted in the United States of America. The preparation of these financial statements requires us to make estimates and assumptions that affect the reported amounts of assets and liabilities, the disclosure of contingent assets and liabilities at year end and the reported amount of revenues and expenses during the year. On an ongoing basis, we evaluate our estimates, including those related to the valuation allowances for receivables, the carrying value ofnon-current assets, reserves for environmental obligations and income taxes. Our estimates are based on historical experience and various other assumptions that we believe to be reasonable under the circumstances, the results of which form the basis for making judgments about the carrying values of assets and liabilities that are not readily apparent from other sources. Accordingly, actual costs could differ materially from these estimates under different assumptions or conditions. We believe the following critical accounting policies affect our significant judgments and estimates used in the preparation of our consolidated financial statements.
ALLOWANCES FOR DOUBTFUL ACCOUNTS
We maintain allowances for doubtful accounts for estimated losses resulting from the inability of our customers to make required payments. If the financial condition of our customers were to deteriorate, resulting in an impairment of their ability to make payments, additional allowances may be required.
INVENTORIES
Inventories are stated at the lower of cost or market. The Company records any amount required to reduce the carrying value of inventory to net realizable value as a charge to cost of products sold. In the fourth quarter of 2016, the Company changed its accounting method for valuing its inventories held by the parent company and NYS to thefirst-in,first-out (FIFO) method of accounting from thelast-in,first-out (LIFO) method. All inventories held by other subsidiaries of the parent company are also valued using the FIFO method. The Company believes that the FIFO method is preferable as it improves comparability with our most similar peers, it more closely resembles the physical flow of our inventory, it better matches revenue with expenses and it aligns with how the Company internally monitors the performance of our businesses.
If steel selling prices were to decline in future quarters, write-downs of inventory could result. Specifically, the valuation of raw material inventories purchased during periods of peak market pricing would most likely be impacted. Low utilization rates at our steel mills or raw materials facilities could hinder our ability to work through high-priced scrap and scrap substitutes (particularly pig iron and iron ore), leading toperiod-end exposure when comparing carrying value to net realizable value.
LONG-LIVED ASSET IMPAIRMENTS
We evaluate our property, plant and equipment and finite-lived intangible assets for potential impairment on an individual asset basis or at the lowest level asset grouping for which cash flows can be independently identified. Asset impairments are assessed whenever circumstances indicate that the carrying amounts of those productive assets could exceed their projected undiscounted cash flows. In developing estimated values for assets that we currently use in our operations, we utilize judgments and assumptions of future undiscounted cash flows that the assets will produce. When it is determined that an impairment exists, the related assets are written down to estimated fair market value.
Certain long-lived asset groupings were tested for impairment during the fourth quarter of 2016. Undiscounted cash flows for each asset grouping were estimated using management’s long-range estimates of market conditions associated with each asset grouping over the estimated useful life of the principal asset within the group. Our undiscounted cash flow analysis indicated that those long-lived asset groupings were recoverable as of December 31, 2016; however, if our projected cash flows are not realized, either because of an extended recessionary period or other unforeseen events, impairment charges may be required in future periods. A 5% decrease in the projected cash flows of each of our asset groupings would not result in an impairment.
Due to the current natural gas pricing environment, Nucor performed an impairment assessment of its proved producing natural gas well assets in December 2016. One of the main assumptions that most significantly affects the undiscounted cash flows determination is management’s estimate of future natural gas prices. The pricing used in this impairment assessment was developed by management based on projected natural gas market supply and demand dynamics, in conjunction with a review of projections by numerous sources of market data. This analysis was performed on each of Nucor’s three groups of wells, with each group defined by common geographic location. Each of Nucor’s three groups of wells passed the impairment test. One of the groups of wells had estimated undiscounted cash flows that were noticeably closer to its carrying value of $80.8 million as of December 31, 2016. Changes in the natural gas industry or a prolonged low price environment beyond what had already been assumed in the analysis could cause management to revise the natural gas price assumption, which could possibly result in an impairment of a portion or all of the groups of proved well assets.
In the fourth quarter of 2015, we determined that certain assets, the majority of which were engineering and equipment related to the blast furnace project at our St. James Parish, Louisiana site, would not be utilized in the future. As a result of this determination, Nucor recorded an $84.1 million impairment charge for the entire balance of those assets, which is included in the raw materials segment. The impairment charge is included in impairments and losses on assets in the consolidated statement of earnings in 2015. The assets that were impaired, the majority of which were acquired in 2008, were a viable option that were anticipated to be utilized up until the decision was made that such assets would not be utilized. The decision about whether or not to move forward with construction of the blast furnace utilizing these assets was delayed to focus on the construction of the DRI plant at the site. The decision was further delayed because of challenging conditions in domestic and global steel industries, particularly increased excess capacity, both domestically and globally. In the meantime, technology advances and supply and demand in the raw materials market led management to reconsider its plans for the previously proposed blast furnace. If we decide to proceed with a blast furnace at the site in the future, the project design will be evaluated at that time utilizing new equipment and engineering.
GOODWILL
Goodwill is tested annually for impairment and whenever events or circumstances change that would make it more likely than not that an impairment may have occurred. We perform our annual impairment analysis as of the first day of the fourth quarter each year. The evaluation of impairment involves comparing the current estimated fair value of each reporting unit to the recorded value, including goodwill.
When appropriate, Nucor performs a qualitative assessment to determine whether it is more likely than not that the fair value of a reporting unit is less than its carrying amount. For certain reporting units it is necessary to perform a quantitative analysis. In these instances, a discounted cash flow model is used to determine the current estimated fair value of these reporting units. Key assumptions used to determine the fair value of each reporting unit as part of our annual testing (and any required interim testing) include: (a) expected cash flow for thefive-year period following the testing date (including market share, sales volumes and prices, costs to produce and estimated capital needs); (b) an estimated terminal value using a terminal year growth rate determined based on the growth prospects of the reporting unit; (c) a discount rate based on management’s best estimate of theafter-tax weighted average cost of capital; and (d) a probability-weighted scenario approach by which varying cash flows are assigned to certain scenarios based on the likelihood of
| | |
| occurrence. Management considers historical and anticipated future results, general economic and market conditions, the impact of planned business and operational strategies and all available information at the time the fair values of its reporting units are estimated. | | |
| |
| Our fourth quarter 2016 annual goodwill impairment analysis did not result in an impairment charge. Management does not believe that future impairment of these reporting units is probable. However, the performance of certain businesses that comprise our reporting units requires continued improvement. An increase of approximately 50 basis points in the discount rate, a critical assumption in which a minor change can have a significant impact on the estimated fair value, would not result in an impairment charge. | | |
| |
| Nucor will continue to monitor operating results within all reporting units throughout the upcoming year in an effort to determine if events and circumstances warrant further interim impairment testing. Otherwise, all reporting units will again be subject to the required annual impairment test during our fourth quarter of 2017. Changes in the judgments and estimates underlying our analysis of goodwill for possible impairment, including expected future operating cash flows and discount rate, could decrease the estimated fair value of our reporting units in the future and could result in an impairment of goodwill. | | |
| |
| EQUITY METHOD INVESTMENTS | | |
| |
| Investments in joint ventures in which Nucor shares control over the financial and operating decisions but in which Nucor is not the primary beneficiary are accounted for under the equity method. Each of the Company’s equity method investments is subject to a review for impairment if, and when, circumstances indicate that an other-than-temporary decline in value below its carrying amount may have occurred. Examples of such circumstances include, but are not limited to, a significant deterioration in the earnings performance or business prospects of the investee; missed financial projections; a significant adverse change in the regulatory, tax, economic or technological environment of the investee; a significant adverse change in the general market condition of either the geographic area or the industry in which the investee operates; and recurring negative cash flows from operations. If management considers the decline to be other than temporary, the Company would write down the investment to its estimated fair market value. An other-than-temporary decline in carrying value is determined to have occurred when, in management’s judgment, a decline in fair value below carrying value is of such length of time and/or severity that it is considered long-term. | | |
| |
| In the event that an impairment review is necessary, we calculate the estimated fair value of our equity method investments using a probability-weighted multiple-scenario income approach. Management’s analysis includes three discounted cash flow scenarios (best case, base case and recessionary case), which contain forecasted near-term cash flows under each scenario. Generally, (i) the best case scenario contains estimates of future results ranging from slightly higher than recent operating performance to levels that are consistent with historical operating and financial performance (i.e., results experienced prior to the onset of the recessionary period that began in 2008); (ii) the base case scenario has estimates of future results ranging from generally in line with recent operating performance to levels that are more conservative than historical operating and financial performance; and (iii) the recessionary case scenario has estimates of future results which include limited growth resulting only from operational cost improvements and limited benefits of new higher-value product offerings. Management determines the probability that each cash flow scenario will come to fruition based on the specific facts and circumstances of each of the preceding scenarios, with the base case typically receiving the majority of the weighting. | | |
| |
| Key assumptions used to determine the fair value of our equity method investments include: (a) expected cash flow for thesix-year period following the testing date (including market share, sales volumes and prices, costs to produce and estimated capital needs); (b) an estimated terminal value using a terminal year growth rate determined based on the growth prospects of the reporting unit; (c) a discount rate based on management’s best estimate of theafter-tax weighted average cost of capital; and (d) a probability-weighted scenario approach by which varying cash flows are assigned to certain scenarios based on the likelihood of occurrence. While the assumptions that most significantly affect the fair value determination include projected revenues, metal margins and discount rate, the assumptions are often interdependent and no single factor predominates in determining the estimated fair value. Management considers historical and anticipated future results, general economic and market conditions, the impact of planned business and operational strategies and all available information at the time the fair values of its investments are estimated. Those estimates and judgments may or may not ultimately prove appropriate. | | |
| |
| In the fourth quarter of 2015, Nucor assessed its equity investment in Duferdofin Nucor for impairment due to the protracted challenging steel market conditions caused by global overcapacity, which increased in 2015, and the difficult economic environment in Europe. After completing its assessment, Nucor determined that the carrying amount exceeded its estimated fair value. The impairment condition was considered to be other than temporary, and, as a result, the Company recorded a $153.0 million impairment charge against the Company’s investment in Duferdofin Nucor in the fourth quarter of 2015. This charge is included in impairments and losses on assets in the consolidated statement of earnings for 2015. The assumptions that most significantly affect the fair value determination include projected revenues, metal margins and the discount rate. While the operating performance of Duferdofin Nucor showed meaningful improvement in 2016, steel market conditions in Europe continued to be challenging through the | | |
fourth quarter of 2016, and, therefore, it is reasonably possible that material deviation of future performance from the estimates used in our most recent valuation could result in further impairment of our investment in Duferdofin Nucor. We will continue to monitor for potential triggering events that could affect the carrying value of our investment in Duferdofin Nucor as a result of future market conditions and any changes in business strategy.
ENVIRONMENTAL REMEDIATION
We are subject to environmental laws and regulations established by federal, state and local authorities, and we make provisions for the estimated costs related to compliance. Undiscounted remediation liabilities are accrued based on estimates of known environmental exposures. The accruals are reviewed periodically and, as investigations and remediation proceed, adjustments are made as we believe are necessary. Our measurement of environmental liabilities is based on currently available facts, present laws and regulations and current technology.
INCOME TAXES
We utilize the liability method of accounting for income taxes. Under the liability method, deferred taxes are determined based on the temporary differences between the financial statement and tax basis of assets and liabilities using tax rates expected to be in effect during the years in which the basis differences reverse. A valuation allowance is recorded when it is more likely than not that some of the deferred tax assets will not be realized. We recognize the effect of income tax positions only if those positions are more likely than not of being sustained. Potential accrued interest and penalties related to unrecognized tax benefits within operations are recognized as a component of interest expense and other expenses.
RECENT ACCOUNTING PRONOUNCEMENTS
See Note 2 to the Consolidated Financial Statements for a discussion of new accounting pronouncements adopted by Nucor during 2016 and the expected financial impact of accounting pronouncements recently issued or proposed but not yet required to be adopted.
| | | | |
FIVE-YEAR FINANCIAL REVIEW | | | | 47 |
| | | | | | | | | | | | | | | | | | | | |
| | | (dollar and share amounts in thousands, except per share data) | |
| | | | | |
| | | | 2016 | | | | 2015 | | | | 2014 | | | | 2013 | | | | 2012 | |
| | | | | |
FOR THE YEAR** | | | | | | | | | | | | | | | | | | | | |
| | | | | |
Net sales | | $ | 16,208,122 | | | $ | 16,439,276 | | | $ | 21,105,141 | | | $ | 19,052,046 | | | $ | 19,429,273 | |
| | | | | |
Costs, expenses and other: | | | | | | | | | | | | | | | | | | | | |
| | | | | |
Cost of products sold | | | 14,182,215 | | | | 15,325,386 | | | | 19,255,904 | | | | 17,623,976 | | | | 18,071,671 | |
| | | | | |
Marketing, administrative and other expenses | | | 596,761 | | | | 458,989 | | | | 520,805 | | | | 467,904 | | | | 437,337 | |
| | | | | |
Equity in (earnings) losses of unconsolidated affiliates | | | (38,757 | ) | | | (5,329 | ) | | | (13,505 | ) | | | (9,297 | ) | | | 13,323 | |
| | | | | |
Impairments and losses on assets | | | — | | | | 244,833 | | | | 25,393 | | | | 14,000 | | | | 47,563 | |
| | | | | |
Interest expense, net | | | 169,244 | | | | 173,531 | | | | 169,256 | | | | 146,895 | | | | 162,375 | |
| | | | | | | | | | | | | | | | | | | | |
| | | | | |
| | | 14,909,463 | | | | 16,197,410 | | | | 19,957,853 | | | | 18,243,478 | | | | 18,732,269 | |
| | | | | |
Earnings before income taxes and noncontrolling interests | | | 1,298,659 | | | | 241,866 | | | | 1,147,288 | | | | 808,568 | | | | 697,004 | |
| | | | | |
Provision for income taxes | | | 398,243 | | | | 48,836 | | | | 368,724 | | | | 214,853 | | | | 204,312 | |
| | | | | | | | | | | | | | | | | | | | |
| | | | | |
Net earnings | | | 900,416 | | | | 193,030 | | | | 778,564 | | | | 593,715 | | | | 492,692 | |
| | | | | |
Earnings attributable to noncontrolling interests | | | 104,145 | | | | 112,306 | | | | 99,227 | | | | 94,330 | | | | 83,207 | |
| | | | | | | | | | | | | | | | | | | | |
| | | | | |
Net earnings attributable to Nucor stockholders | | | 796,271 | | | | 80,724 | | | | 679,337 | | | | 499,385 | | | | 409,485 | |
| | | | | |
Net earnings per share: | | | | | | | | | | | | | | | | | | | | |
| | | | | |
Basic | | | 2.48 | | | | 0.25 | | | | 2.12 | | | | 1.56 | | | | 1.28 | |
| | | | | |
Diluted | | | 2.48 | | | | 0.25 | | | | 2.11 | | | | 1.56 | | | | 1.28 | |
| | | | | |
Dividends declared per share | | | 1.5025 | | | | 1.4925 | | | | 1.4825 | | | | 1.4725 | | | | 1.4625 | |
| | | | | |
Percentage of net earnings to net sales | | | 4.9% | | | | 0.5% | | | | 3.2% | | | | 2.6% | | | | 2.1% | |
| | | | | |
Return on average stockholders’ equity | | | 10.4% | | | | 1.0% | | | | 8.4% | | | | 6.2% | | | | 5.1% | |
| | | | | |
Capital expenditures | | | 617,677 | | | | 364,768 | | | | 568,867 | | | | 1,230,418 | | | | 1,019,334 | |
| | | | | |
Acquisitions (net of cash acquired) | | | 474,788 | | | | 19,089 | | | | 768,581 | | | | — | | | | 760,833 | |
| | | | | |
Depreciation | | | 613,192 | | | | 625,757 | | | | 652,000 | | | | 535,852 | | | | 534,010 | |
| | | | | |
Sales per average employee | | | 690 | | | | 690 | | | | 921 | | | | 859 | | | | 906 | |
| | | | | |
AT YEAR END | | | | | | | | | | | | | | | | | | | | |
| | | | | |
Current assets | | $ | 6,506,393 | | | $ | 5,854,405 | | | $ | 6,808,805 | | | $ | 6,814,189 | | | $ | 6,057,321 | |
| | | | | |
Current liabilities | | | 2,389,966 | | | | 1,385,173 | | | | 2,097,776 | | | | 1,960,216 | | | | 2,029,568 | |
| | | | | | | | | | | | | | | | | | | | |
| | | | | |
Working capital | | | 4,116,427 | | | | 4,469,232 | | | | 4,711,029 | | | | 4,853,973 | | | | 4,027,753 | |
| | | | | |
Cash provided by operating activities | | | 1,737,533 | | | | 2,157,043 | | | | 1,342,898 | | | | 1,077,949 | | | | 1,200,385 | |
| | | | | |
Current ratio | | | 2.7 | | | | 4.2 | | | | 3.2 | | | | 3.5 | | | | 3.0 | |
| | | | | |
Property, plant and equipment, net | | | 5,078,650 | | | | 4,891,153 | | | | 5,287,639 | | | | 4,917,024 | | | | 4,283,056 | |
| | | | | |
Total assets | | | 15,223,518 | | | | 14,326,969 | | | | 15,956,467 | | | | 15,578,128 | | | | 14,524,972 | |
| | | | | |
Long-term debt (including current maturities) | | | 4,339,141 | | | | 4,337,145 | | | | 4,350,558 | | | | 4,350,902 | | | | 3,607,156 | |
| | | | | |
Percentage of debt to capital(1) | | | 34.5% | | | | 35.6% | | | | 34.0% | | | | 34.4% | | | | 30.3% | |
| | | | | |
Total Nucor stockholders’ equity | | | 7,879,865 | | | | 7,477,816 | | | | 8,110,342 | | | | 8,018,250 | | | | 8,002,692 | |
| | | | | |
Per share | | | 24.72 | | | | 23.52 | | | | 25.42 | | | | 25.19 | | | | 25.19 | |
| | | | | |
Shares outstanding | | | 318,737 | | | | 317,962 | | | | 319,033 | | | | 318,328 | | | | 317,663 | |
| | | | | |
Employees | | | 23,900 | | | | 23,700 | | | | 23,600 | | | | 22,300 | | | | 22,200 | |
| (1) | Long-term debt divided by total equity plus long-term debt. |
| ** | In the fourth quarter of 2016, Nucor changed its accounting method for valuing certain inventories from thelast-in,first-out (LIFO) inventory valuation method. All periods presented in the above table reflect this change in accounting principle. See Note 2 to the Consolidated Financial Statements for more information related to the change in accounting principle. |
| | | | |
| | | |
MANAGEMENT’S REPORT | | on internal control over financial reporting | | |
| | |
| Nucor’s management is responsible for establishing and maintaining adequate internal control over financial reporting, as such term is defined in Exchange Act Rules13a-15(f) and15d-15(f) under the Securities Exchange Act of 1934, as amended. | | |
| |
| Because of its inherent limitations, internal control over financial reporting may not prevent or detect misstatements. Also, projections of any evaluation of effectiveness to future periods are subject to the risk that controls may become inadequate because of changes in conditions, or that the degree of compliance with the policies or procedures may deteriorate. | | |
| |
| Management assessed the effectiveness of Nucor’s internal control over financial reporting as of December 31, 2016. In making this assessment, management used criteria set forth by the Committee of Sponsoring Organizations of the Treadway Commission (COSO) inInternal Control – Integrated Framework (2013). | | |
| |
| Our evaluation did not include the internal controls over financial reporting of Independence Tube Corporation, which was acquired on October 31, 2016. Total assets and total revenues for the acquisition represent 1.94% and 0.37%, respectively, of the related consolidated financial statement amounts as of and for the fiscal year ended December 31, 2016. | | |
| |
| Based on its assessment, management concluded that Nucor’s internal control over financial reporting was effective as of December 31, 2016. PricewaterhouseCoopers LLP, an independent registered public accounting firm, has audited the effectiveness of Nucor’s internal control over financial reporting as of December 31, 2016 as stated in their report which is included herein. | | |
| | | | |
REPORT OF INDEPENDENT REGISTERED PUBLIC ACCOUNTING FIRM | | | | 49 |
|
| |
REPORTOF INDEPENDENT REGISTERED PUBLIC ACCOUNTING FIRM |
| | |
To the Stockholders and Board of Directors Nucor Corporation: In our opinion, the accompanying consolidated balance sheets and the related consolidated statements of earnings, comprehensive income, stockholders’ equity and cash flows present fairly, in all material respects, the financial position of Nucor Corporation and its subsidiaries at December 31, 2016 and 2015, and the results of their operations and their cash flows for each of the three years in the period ended December 31, 2016 in conformity with accounting principles generally accepted in the United States of America. Also in our opinion, the Company maintained, in all material respects, effective internal control over financial reporting as of December 31, 2016, based on criteria established inInternal Control –Integrated Framework (2013) issued by the Committee of Sponsoring Organizations of the Treadway Commission (COSO). The Company’s management is responsible for these financial statements, for maintaining effective internal control over financial reporting and for its assessment of the effectiveness of internal control over financial reporting, included in the accompanying Management’s Report on Internal Control Over Financial Reporting. Our responsibility is to express opinions on these financial statements and on the Company’s internal control over financial reporting based on our integrated audits. We conducted our audits in accordance with the standards of the Public Company Accounting Oversight Board (United States). Those standards require that we plan and perform the audits to obtain reasonable assurance about whether the financial statements are free of material misstatement and whether effective internal control over financial reporting was maintained in all material respects. Our audits of the financial statements included examining, on a test basis, evidence supporting the amounts and disclosures in the financial statements, assessing the accounting principles used and significant estimates made by management and evaluating the overall financial statement presentation. Our audit of internal control over financial reporting included obtaining an understanding of internal control over financial reporting, assessing the risk that a material weakness exists and testing and evaluating the design and operating effectiveness of internal control based on the assessed risk. Our audits also included performing such other procedures as we considered necessary in the circumstances. We believe that our audits provide a reasonable basis for our opinions. As discussed in Note 2 to the consolidated financial statements, the Company changed the manner in which it accounts for certain inventory from the last in, first out (LIFO) method to the first in, first out (FIFO) method in 2016. A company’s internal control over financial reporting is a process designed to provide reasonable assurance regarding the reliability of financial reporting and the preparation of financial statements for external purposes in accordance with generally accepted accounting principles. A company’s internal control over financial reporting includes those policies and procedures that (i) pertain to the maintenance of records that, in reasonable detail, accurately and fairly reflect the transactions and dispositions of the assets of the company; (ii) provide reasonable assurance that transactions are recorded as necessary to permit preparation of financial statements in accordance with generally accepted accounting principles, and that receipts and expenditures of the company are being made only in accordance with authorizations of management and directors of the company; and (iii) provide reasonable assurance regarding prevention or timely detection of unauthorized acquisition, use or disposition of the company’s assets that could have a material effect on the financial statements. Because of its inherent limitations, internal control over financial reporting may not prevent or detect misstatements. Also, projections of any evaluation of effectiveness to future periods are subject to the risk that controls may become inadequate because of changes in conditions, or that the degree of compliance with the policies or procedures may deteriorate. As described in Management’s Report on Internal Control over Financial Reporting, management has excluded Independence Tube Corporation from its assessment of internal control over financial reporting as of December 31, 2016 because it was acquired by the Company in a purchase business combination during 2016. We have also excluded Independence Tube Corporation from our audit of internal control over financial reporting. Independence Tube Corporation is a wholly-owned subsidiary whose total assets and total revenues represent 1.94% and 0.37%, respectively, of the related consolidated financial statement amounts as of and for the year ended December 31, 2016. 
Charlotte, North Carolina February 28, 2017 | | |
| | | | |
50 | | | | CONSOLIDATED BALANCE SHEETS |
| | | | | | | | | | |
CONSOLIDATED BALANCE SHEETS | | | (in thousands) | | | |
December 31, | | | 2016 | | | | 2015 | | | |
| | | |
ASSETS | | | | | | | | | | |
| | | |
CURRENT ASSETS: | | | | | | | | | | |
| | | |
Cash and cash equivalents (Note 14) | | | $ 2,045,961 | | | | $ 1,939,469 | | | |
| | | |
Short-term investments (Notes 4 and 14) | | | 150,000 | | | | 100,000 | | | |
| | | |
Accounts receivable, net (Note 5) | | | 1,631,676 | | | | 1,383,823 | | | |
| | | |
Inventories, net (Notes 2 and 6) | | | 2,479,958 | | | | 2,245,469 | | | |
| | | |
Other current assets (Note 13) | | | 198,798 | | | | 185,644 | | | |
| | | |
Total current assets | | | 6,506,393 | | | | 5,854,405 | | | |
| | | |
| PROPERTY, PLANT AND EQUIPMENT, NET(Note 7) | | | 5,078,650 | | | | 4,891,153 | | | |
| | | |
| GOODWILL(Notes 3 and 8) | | | 2,052,728 | | | | 2,011,278 | | | |
| | | |
| OTHER INTANGIBLE ASSETS, NET(Notes 3 and 8) | | | 866,835 | | | | 770,672 | | | |
| | | |
| OTHER ASSETS(Note 9) | | | 718,912 | | | | 799,461 | | | |
| | | |
TOTAL ASSETS | | | $ 15,223,518 | | | | $ 14,326,969 | | | |
| | | | | | | | | | | |
| | | |
LIABILITIES AND EQUITY | | | | | | | | | | |
| | | |
CURRENT LIABILITIES: | | | | | | | | | | |
| | | |
Short-term debt (Notes 11 and 14) | | | $ 17,959 | | | | $ 51,315 | | | |
| | | |
Long-term debt due within one year (Notes 11 and 14) | | | 600,000 | | | | — | | | |
| | | |
Accounts payable (Note 10) | | | 838,109 | | | | 566,527 | | | |
| | | |
Salaries, wages and related accruals (Note 17) | | | 428,829 | | | | 289,004 | | | |
| | | |
Accrued expenses and other current liabilities (Notes 10, 13 and 15) | | | 505,069 | | | | 478,327 | | | |
| | | |
Total current liabilities | | | 2,389,966 | | | | 1,385,173 | | | |
| | | |
| LONG-TERM DEBT DUE AFTER ONE YEAR(Notes 2, 11 and 14) | | | 3,739,141 | | | | 4,337,145 | | | |
| | | |
| DEFERRED CREDITS AND OTHER LIABILITIES(Notes 2, 13, 15, 17 and 19) | | | 839,703 | | | | 754,774 | | | |
| | | |
TOTAL LIABILITIES | | | 6,968,810 | | | | 6,477,092 | | | |
| | | |
| COMMITMENTS AND CONTINGENCIES(Notes 13 and 15) | | | | | | | | | | |
| | | |
| EQUITY | | | | | | | | | | |
| | | |
| NUCOR STOCKHOLDERS’ EQUITY(Notes 12 and 16): | | | | | | | | | | |
| | | |
Common stock (800,000 shares authorized; 379,334 and 378,566 shares issued, respectively) | | | 151,734 | | | | 151,426 | | | |
| | | |
Additionalpaid-in capital | | | 1,974,672 | | | | 1,918,970 | | | |
| | | |
Retained earnings (Note 2) | | | 7,630,916 | | | | 7,316,910 | | | |
| | | |
Accumulated other comprehensive loss, net of income taxes (Notes 2, 13 and 20) | | | (317,843 | ) | | | (351,362 | ) | | |
| | | |
Treasury stock (60,597 and 60,604 shares, respectively) | | | (1,559,614 | ) | | | (1,558,128 | ) | | |
| | | |
Total Nucor stockholders’ equity | | | 7,879,865 | | | | 7,477,816 | | | |
| | | |
NONCONTROLLING INTERESTS | | | 374,843 | | | | 372,061 | | | |
| | | |
TOTAL EQUITY | | | 8,254,708 | | | | 7,849,877 | | | |
| | | |
TOTAL LIABILITIES AND EQUITY | | | $ 15,223,518 | | | | $ 14,326,969 | | | |
| | | | | | | | | | | |
See notes to consolidated financial statements.
| | | | |
CONSOLIDATED STATEMENTS OF EARNINGS | | | | 51 |
| | | | | | | | | | | | |
CONSOLIDATED STATEMENTS OF EARNINGS | | (in thousands, except per share data) | |
| | | | |
Year Ended December 31, | | | 2016 | | | | 2015 | | | | 2014 | |
| | | |
NET SALES | | $ | 16,208,122 | | | $ | 16,439,276 | | | $ | 21,105,141 | |
| | | |
COSTS, EXPENSES AND OTHER: | | | | | | | | | | | | |
| | | |
Cost of products sold (Notes 2, 6 and 20) | | | 14,182,215 | | | | 15,325,386 | | | | 19,255,904 | |
| | | |
Marketing, administrative and other expenses (Note 20) | | | 596,761 | | | | 458,989 | | | | 520,805 | |
| | | |
Equity in earnings of unconsolidated affiliates | | | (38,757 | ) | | | (5,329 | ) | | | (13,505 | ) |
| | | |
Impairments and losses on assets (Notes 7, 9 and 24) | | | — | | | | 244,833 | | | | 25,393 | |
| | | |
Interest expense, net (Notes 7, 18 and 19) | | | 169,244 | | | | 173,531 | | | | 169,256 | |
| | | | | | | | | | | | |
| | | |
| | | 14,909,463 | | | | 16,197,410 | | | | 19,957,853 | |
| | | | | | | | | | | | |
| | | |
EARNINGS BEFORE INCOME TAXES AND | | | | | | | | | | | | |
| | | |
NONCONTROLLING INTERESTS | | | 1,298,659 | | | | 241,866 | | | | 1,147,288 | |
| | | |
PROVISION FOR INCOME TAXES(Notes 2, 19 and 24) | | | 398,243 | | | | 48,836 | | | | 368,724 | |
| | | | | | | | | | | | |
| | | |
NET EARNINGS(Note 2) | | | 900,416 | | | | 193,030 | | | | 778,564 | |
| | | |
EARNINGS ATTRIBUTABLE TO NONCONTROLLING INTERESTS(Notes 2 and 6) | | | 104,145 | | | | 112,306 | | | | 99,227 | |
| | | | | | | | | | | | |
| | | |
NET EARNINGS ATTRIBUTABLE TO NUCOR STOCKHOLDERS(Note 2) | | $ | 796,271 | | | $ | 80,724 | | | $ | 679,337 | |
| | | | | | | | | | | | |
| | | |
NET EARNINGS PER SHARE(Notes 2 and 21): | | | | | | | | | | | | |
| | | |
Basic | | | $2.48 | | | | $0.25 | | | | $2.12 | |
| | | |
Diluted | | | $2.48 | | | | $0.25 | | | | $2.11 | |
See notes to consolidated financial statements.
| | | | |
52 | | | | CONSOLIDATED STATEMENTS OF COMPREHENSIVE INCOME |
| | | | | | | | | | | | | | |
CONSOLIDATED STATEMENTS OF COMPREHENSIVE INCOME | | | (in thousands) | |
Year Ended December 31, | | | | | 2016 | | | | 2015 | | | | 2014 | |
| | | | |
NET EARNINGS | | | | $ | 900,416 | | | $ | 193,030 | | | $ | 778,564 | |
| | | | | | | | | | | | | | |
| | | | |
OTHER COMPREHENSIVE INCOME (LOSS): | | | | | | | | | | | | | | |
| | | | |
Net unrealized income (loss) on hedging derivatives, net of income taxes of $1,500, ($5,600) and ($4,900) for 2016, 2015 and 2014, respectively | | | | | 2,570 | | | | (9,498 | ) | | | (8,542 | ) |
| | | | |
Reclassification adjustment for loss on settlement of hedging derivatives included in net earnings, net of income taxes of $5,800, $3,500 and $200 for 2016, 2015 and 2014, respectively | | | | | 9,880 | | | | 5,798 | | | | 542 | |
| | | | |
Foreign currency translation gain (loss), net of income taxes of $0, $0 and $400 for 2016, 2015 and 2014, respectively | | | | | 25,495 | | | | (205,397 | ) | | | (141,530 | ) |
| | | | |
Adjustment to early retiree medical plan, net of income taxes of ($1,291), $127 and ($1,921) for 2016, 2015 and 2014, respectively | | | | | (3,589 | ) | | | 1,485 | | | | (4,228 | ) |
| | | | |
Reclassification adjustment for gain on early retiree medical plan included in net earnings, net of income taxes of ($309), ($414) and ($557) for 2016, 2015 and 2014, respectively | | | | | (837 | ) | | | (742 | ) | | | (1,030 | ) |
| | | | |
Other, net of income taxes of $0, $1,500 and $0 for 2016, 2015 and 2014, respectively | | | | | — | | | | 2,700 | | | | — | |
| | | | | | | | | | | | | | |
| | | | |
| | | | | 33,519 | | | | (205,654 | ) | | | (154,788 | ) |
| | | | | | | | | | | | | | |
| | | | |
COMPREHENSIVE INCOME (LOSS) | | | | | 933,935 | | | | (12,624 | ) | | | 623,776 | |
| | | | |
COMPREHENSIVE INCOME ATTRIBUTABLE TO
NONCONTROLLING INTERESTS | | | | | (104,145 | ) | | | (112,306 | ) | | | (99,227 | ) |
| | | | | | | | | | | | | | |
| | | | |
COMPREHENSIVE INCOME (LOSS) ATTRIBUTABLE TO NUCOR STOCKHOLDERS | | | | $ | 829,790 | | | $ | (124,930 | ) | | $ | 524,549 | |
| | | | | | | | | | | | | | |
| | | | |
| | | | | | | | | | | | | | | |
See notes to consolidated financial statements.
| | | | |
CONSOLIDATED STATEMENTS OF STOCKHOLDERS’ EQUITY | | | | 53 |
| | | | | | | | | | | | | | | | | | | | | | | | | | | | | | | | | | | | | | | | |
| CONSOLIDATED STATEMENTS OF STOCKHOLDERS’ EQUITY | | | | (in thousands, except per share data) | |
| | | | | | COMMON STOCK | | | ADDITIONAL PAID-IN | | | RETAINED | | | ACCUMULATED OTHER COMPREHENSIVE | | | TREASURY STOCK (AT COST) | | | TOTAL NUCOR STOCKHOLDERS’ | | | NON- CONTROLLING | |
| | | TOTAL | | | SHARES | | | AMOUNT | | | CAPITAL | | | EARNINGS | | | INCOME (LOSS) | | | SHARES | | | AMOUNT | | | EQUITY | | | INTERESTS | |
BALANCES, December 31, 2013 | | | $8,314,422 | | | | 377,525 | | | | $151,010 | | | | $1,843,353 | | | | $7,512,922 | | | | $ 9,080 | | | | 59,197 | | | | $(1,498,114 | ) | | | $8,018,251 | | | | $296,171 | |
| | | | | | | | | | | |
Net earnings in 2014 | | | 778,564 | | | | | | | | | | | | | | | | 679,337 | | | | | | | | | | | | | | | | 679,337 | | | | 99,227 | |
| | | | | | | | | | |
Other comprehensive income (loss) | | | (154,788 | ) | | | | | | | | | | | | | | | | | | | (154,788 | ) | | | | | | | | | | | (154,788 | ) | | | | |
| | | | | | | | | | |
Stock options exercised | | | 5,614 | | | | 136 | | | | 54 | | | | 5,560 | | | | | | | | | | | | | | | | | | | | 5,614 | | | | | |
| | | | | | | | | | |
Stock option expense | | | 7,716 | | | | | | | | | | | | 7,716 | | | | | | | | | | | | | | | | | | | | 7,716 | | | | | |
| | | | | | | | | | |
| Issuance of stock under award plans, net of forfeitures | | | 29,667 | | | | 431 | | | | 173 | | | | 26,009 | | | | | | | | | | | | (138 | ) | | | 3,485 | | | | 29,667 | | | | | |
| | | | | | | | | | |
Amortization of unearned compensation | | | 718 | | | | | | | | | | | | 718 | | | | | | | | | | | | | | | | | | | | 718 | | | | | |
| | | | | | | | | | |
Cash dividends ($1.4825 per share) | | | (476,172 | ) | | | | | | | | | | | | | | | (476,172 | ) | | | | | | | | | | | | | | | (476,172 | ) | | | | |
| | | | | | | | | | |
Distributions to noncontrolling interests | | | (63,705 | ) | | | | | | | | | | | | | | | | | | | | | | | | | | | | | | | | | | | (63,705 | ) |
BALANCES, December 31, 2014 | | | 8,442,036 | | | | 378,092 | | | | 151,237 | | | | 1,883,356 | | | | 7,716,087 | | | | (145,708 | ) | | | 59,059 | | | | (1,494,629 | ) | | | 8,110,343 | | | | 331,693 | |
| | | | | | | | | | | |
Net earnings in 2015 | | | 193,030 | | | | | | | | | | | | | | | | 80,724 | | | | | | | | | | | | | | | | 80,724 | | | | 112,306 | |
| | | | | | | | | | |
Other comprehensive income (loss) | | | (205,654 | ) | | | | | | | | | | | | | | | | | | | (205,654 | ) | | | | | | | | | | | (205,654 | ) | | | | |
| | | | | | | | | | |
Stock options exercised | | | 424 | | | | 10 | | | | 4 | | | | 420 | | | | | | | | | | | | | | | | | | | | 424 | | | | | |
| | | | | | | | | | |
Stock option expense | | | 7,433 | | | | | | | | | | | | 7,433 | | | | | | | | | | | | | | | | | | | | 7,433 | | | | | |
| | | | | | | | | | |
| Issuance of stock under award plans, net of forfeitures | | | 30,120 | | | | 464 | | | | 185 | | | | 26,929 | | | | | | | | | | | | (119 | ) | | | 3,006 | | | | 30,120 | | | | | |
| | | | | | | | | | |
Amortization of unearned compensation | | | 832 | | | | | | | | | | | | 832 | | | | | | | | | | | | | | | | | | | | 832 | | | | | |
| | | | | | | | | | |
Treasury stock acquired | | | (66,505 | ) | | | | | | | | | | | | | | | | | | | | | | | 1,664 | | | | (66,505 | ) | | | (66,505 | ) | | | | |
| | | | | | | | | | |
Cash dividends ($1.4925 per share) | | | (479,901 | ) | | | | | | | | | | | | | | | (479,901 | ) | | | | | | | | | | | | | | | (479,901 | ) | | | | |
| | | | | | | | | | |
Distributions to noncontrolling interests | | | (71,938 | ) | | | | | | | | | | | | | | | | | | | | | | | | | | | | | | | | | | | (71,938 | ) |
BALANCES, December 31, 2015 | | | 7,849,877 | | | | 378,566 | | | | 151,426 | | | | 1,918,970 | | | | 7,316,910 | | | | (351,362 | ) | | | 60,604 | | | | (1,558,128 | ) | | | 7,477,816 | | | | 372,061 | |
| | | | | | | | | | | |
Net earnings in 2016 | | | 900,416 | | | | | | | | | | | | | | | | 796,271 | | | | | | | | | | | | | | | | 796,271 | | | | 104,145 | |
| | | | | | | | | | |
Other comprehensive income (loss) | | | 33,519 | | | | | | | | | | | | | | | | | | | | 33,519 | | | | | | | | | | | | 33,519 | | | | | |
| | | | | | | | | | |
Stock options exercised | | | 15,670 | | | | 400 | | | | 160 | | | | 15,510 | | | | | | | | | | | | | | | | | | | | 15,670 | | | | | |
| | | | | | | | | | |
Stock option expense | | | 7,833 | | | | | | | | | | | | 7,833 | | | | | | | | | | | | | | | | | | | | 7,833 | | | | | |
| | | | | | | | | | |
| Issuance of stock under award plans, net of forfeitures | | | 35,953 | | | | 368 | | | | 148 | | | | 32,118 | | | | | | | | | | | | (143 | ) | | | 3,687 | | | | 35,953 | | | | | |
| | | | | | | | | | |
Amortization of unearned compensation | | | 843 | | | | | | | | | | | | 843 | | | | | | | | | | | | | | | | | | | | 843 | | | | | |
| | | | | | | | | | |
Treasury stock acquired | | | (5,173 | ) | | | | | | | | | | | | | | | | | | | | | | | 136 | | | | (5,173 | ) | | | (5,173 | ) | | | | |
| | | | | | | | | | |
Cash dividends ($1.5025 per share) | | | (482,265 | ) | | | | | | | | | | | | | | | (482,265 | ) | | | | | | | | | | | | | | | (482,265 | ) | | | | |
| | | | | | | | | | |
Distributions to noncontrolling interests | | | (99,588 | ) | | | | | | | | | | | | | | | | | | | | | | | | | | | | | | | | | | | (99,588 | ) |
| | | | | | | | | | |
Other | | | (2,377 | ) | | | | | | | | | | | (602 | ) | | | | | | | | | | | | | | | | | | | (602 | ) | | | (1,775 | ) |
BALANCES, December 31, 2016 | | | $8,254,708 | | | | 379,334 | | | | $151,734 | | | | $1,974,672 | | | | $7,630,916 | | | | $(317,843 | ) | | | 60,597 | | | | $(1,559,614 | ) | | | $7,879,865 | | | | $374,843 | |
See notes to consolidated financial statements.
| | | | |
54 | | | | CONSOLIDATED STATEMENTS OF CASH FLOWS |
| | | | | | | | | | | | |
CONSOLIDATED STATEMENTS OF CASH FLOWS | | | | | | | | | | | (in thousands | ) |
Year Ended December 31, | | | 2016 | | | | 2015 | | | | 2014 | |
| | | |
OPERATING ACTIVITIES: | | | | | | | | | | | | |
| | | |
Net earnings | | $ | 900,416 | | | $ | 193,030 | | | $ | 778,564 | |
| | | |
Adjustments: | | | | | | | | | | | | |
| | | |
Depreciation | | | 613,192 | | | | 625,757 | | | | 652,000 | |
| | | |
Amortization | | | 73,862 | | | | 74,260 | | | | 72,423 | |
| | | |
Stock-based compensation | | | 56,511 | | | | 45,794 | | | | 46,384 | |
| | | |
Deferred income taxes | | | 71,455 | | | | (246,836 | ) | | | 70,801 | |
| | | |
Distributions from affiliates | | | 40,602 | | | | 15,132 | | | | 53,738 | |
| | | |
Equity in earnings of unconsolidated affiliates | | | (38,757 | ) | | | (5,329 | ) | | | (13,505 | ) |
| | | |
Impairments and losses on assets | | | — | | | | 244,833 | | | | 25,393 | |
| | | |
Changes in assets and liabilities (exclusive of acquisitions and dispositions): | | | | | | | | | | | | |
| | | |
Accounts receivable | | | (217,736 | ) | | | 655,489 | | | | (179,181 | ) |
| | | |
Inventories | | | (132,639 | ) | | | 1,061,202 | | | | 11,326 | |
| | | |
Accounts payable | | | 236,788 | | | | (438,788 | ) | | | (111,859 | ) |
| | | |
Federal income taxes | | | 3,555 | | | | 62,656 | | | | (111,687 | ) |
| | | |
Salaries, wages and related accruals | | | 133,544 | | | | (56,267 | ) | | | 67,973 | |
| | | |
Other operating activities | | | (3,260 | ) | | | (73,890 | ) | | | (19,472 | ) |
| | | |
| | | | | | | | | | | | |
| | | |
Cash provided by operating activities | | | 1,737,533 | | | | 2,157,043 | | | | 1,342,898 | |
| | | |
INVESTING ACTIVITIES: | | | | | | | | | | | | |
| | | |
Capital expenditures | | | (604,840 | ) | | | (374,123 | ) | | | (667,982 | ) |
| | | |
Investment in and advances to affiliates | | | (63,167 | ) | | | (80,409 | ) | | | (97,841 | ) |
| | | |
Divestiture of affiliates | | | 135,000 | | | | — | | | | — | |
| | | |
Repayment of advances to affiliates | | | — | | | | — | | | | 122,000 | |
| | | |
Disposition of plant and equipment | | | 18,571 | | | | 29,390 | | | | 36,563 | |
| | | |
Acquisitions (net of cash acquired) | | | (474,788 | ) | | | (19,089 | ) | | | (768,581 | ) |
| | | |
Purchases of investments | | | (650,000 | ) | | | (111,927 | ) | | | (100,000 | ) |
| | | |
Proceeds from the sale of investments | | | 600,000 | | | | 111,452 | | | | 27,529 | |
| | | |
Other investing activities | | | 14,106 | | | | 3,010 | | | | 10,250 | |
| | | |
| | | | | | | | | | | | |
| | | |
Cash used in investing activities | | | (1,025,118 | ) | | | (441,696 | ) | | | (1,438,062 | ) |
| | | |
FINANCING ACTIVITIES: | | | | | | | | | | | | |
| | | |
Net change in short-term debt | | | (33,360 | ) | | | (155,816 | ) | | | 178,308 | |
| | | |
Repayment of long-term debt | | | — | | | | (16,300 | ) | | | (5,358 | ) |
| | | |
Issuance of common stock | | | 15,751 | | | | 424 | | | | 5,614 | |
| | | |
Excess tax benefits from stock-based compensation | | | 2,784 | | | | 2,000 | | | | 3,400 | |
| | | |
Distributions to noncontrolling interests | | | (99,588 | ) | | | (71,938 | ) | | | (63,705 | ) |
| | | |
Cash dividends | | | (481,083 | ) | | | (479,432 | ) | | | (475,123 | ) |
| | | |
Acquisition of treasury stock | | | (5,173 | ) | | | (66,505 | ) | | | — | |
| | | |
Other financing activities | | | (13,297 | ) | | | (2,184 | ) | | | (2,183 | ) |
| | | |
| | | | | | | | | | | | |
| | | |
Cash used in financing activities | | | (613,966 | ) | | | (789,751 | ) | | | (359,047 | ) |
| | | |
Effect of exchange rate changes on cash | | | 8,043 | | | | (10,271 | ) | | | (4,897 | ) |
| | | |
| | | | | | | | | | | | |
| | | |
INCREASE (DECREASE) IN CASH AND CASH EQUIVALENTS | | | 106,492 | | | | 915,325 | | | | (459,108 | ) |
| | | |
CASH AND CASH EQUIVALENTS — BEGINNING OF YEAR | | | 1,939,469 | | | | 1,024,144 | | | | 1,483,252 | |
| | | |
| | | | | | | | | | | | |
| | | |
CASH AND CASH EQUIVALENTS — END OF YEAR | | $ | 2,045,961 | | | $ | 1,939,469 | | | $ | 1,024,144 | |
| | | |
| | | | | | | | | | | | |
| | | |
| | | | | | | | | | | | | |
| | | |
NON-CASH INVESTING ACTIVITY: | | | | | | | | | | | | |
| | | |
Change in accrued plant and equipment purchases | | $ | 12,837 | | | $ | (9,355 | ) | | $ | (99,115 | ) |
| | | |
| | | | | | | | | | | | |
| | | |
| | | | | | | | | | | | | |
See notes to consolidated financial statements.
| | | | |
NOTES TO CONSOLIDATED FINANCIAL STATEMENTS | | | | 55 |
YEARS ENDED DECEMBER 31, 2016, 2015 AND 2014
1. NATURE OF OPERATIONS AND BASIS OF PRESENTATION
Nature of Operations Nucor is principally a manufacturer of steel and steel products, as well as a scrap broker and processor, with operating facilities and customers primarily located in North America.
Principles of Consolidation The consolidated financial statements include Nucor and its controlled subsidiaries, including Nucor-Yamato Steel Company, a limited partnership of which Nucor owns 51%. All intercompany transactions are eliminated.
Distributions are made to noncontrolling interest partners in Nucor-Yamato Steel Company in accordance with the limited partnership agreement by mutual agreement of the general partners. At a minimum, sufficient cash is distributed so that each partner may pay their U.S. federal and state income taxes.
Use of Estimates The preparation of financial statements in conformity with generally accepted accounting principles in the United States of America requires management to make estimates and assumptions that affect the amounts reported in the financial statements and accompanying notes. Actual results could differ from these estimates.
Reclassifications Certain reclassifications of prior years’ data have been made to conform to current year presentation.
2. SUMMARY OF SIGNIFICANT ACCOUNTING POLICIES
Cash and Cash Equivalents Cash equivalents are recorded at cost plus accrued interest, which approximates fair value, and have original maturities of three months or less at the date of purchase. Cash and cash equivalents are maintained primarily with a few high-credit quality financial institutions.
Short-term Investments Short-term investments are recorded at cost plus accrued interest, which approximates fair value. Unrealized gains and losses on investments classified asavailable-for-sale are recorded as a component of accumulated other comprehensive income (loss). Management determines the appropriate classification of its investments at the time of purchase andre-evaluates such determination at each balance sheet date.
Inventories At December 31, 2016, inventories were stated at the lower of cost or market. In the fourth quarter of 2016, the Company changed its accounting method for valuing its inventories held by the parent company and Nucor-Yamato Steel Company to thefirst-in,first-out (FIFO) method of accounting from thelast-in,first-out (LIFO) method. All inventories held by other subsidiaries of the parent company were previously and continue to be valued using the FIFO method. The Company believes that the FIFO method is preferable as it improves comparability with our most similar peers, it more closely resembles the physical flow of our inventory, it better matches revenue with expenses and it aligns with how the Company internally monitors the performance of our businesses.
The effects of the change in accounting principle from LIFO to FIFO have been retrospectively applied to all periods presented. As a result of the retrospective application of the change in accounting principle, certain financial statement line items in the Company’s consolidated balance sheet as of December 31, 2015 and its consolidated statements of earnings and consolidated statements of cash flows for 2015 and 2014 were adjusted as follows.
| | | | | | |
| | | | (in thousands, except per share data) |
| | | As Originally Reported | | Effect of Change | | As Adjusted |
CONSOLIDATED STATEMENT OF EARNINGS Year Ended December 31, 2015 | | | | | | |
| | | |
Cost of products sold | | $ 14,858,014 | | $ 467,372 | | $ 15,325,386 |
| | | |
Provision for income taxes | | 213,154 | | (164,318) | | 48,836 |
| | | |
Net earnings | | 496,084 | | (303,054) | | 193,030 |
| | | |
Earnings attributable to noncontrolling interests | | 138,425 | | (26,119) | | 112,306 |
| | | |
Net earnings attributable to Nucor stockholders | | 357,659 | | (276,935) | | 80,724 |
| | | |
Net earnings per share: | | | | | | |
| | | |
Basic | | $1.11 | | $(0.86) | | $0.25 |
| | | |
Diluted | | $1.11 | | $(0.86) | | $0.25 |
CONSOLIDATED STATEMENT OF EARNINGS Year Ended December 31, 2014 | | | | | | |
| | | |
Cost of products sold | | $ 19,198,615 | | $ 57,289 | | $ 19,255,904 |
| | | |
Provision for income taxes | | 388,787 | | (20,063) | | 368,724 |
| | | |
Net earnings | | 815,790 | | (37,226) | | 778,564 |
| | | |
Earnings attributable to noncontrolling interests | | 101,844 | | (2,617) | | 99,227 |
| | | |
Net earnings attributable to Nucor stockholders | | 713,946 | | (34,609) | | 679,337 |
| | | |
Net earnings per share: | | | | | | |
| | | |
Basic | | $2.22 | | $(0.10) | | $2.12 |
| | | |
Diluted | | $2.22 | | $(0.11) | | $2.11 |
CONSOLIDATED BALANCE SHEET as of December 31, 2015 | | | | | | |
| | | |
Inventories, net | | $ 2,145,444 | | $ 100,025 | | $ 2,245,469 |
| | | |
Deferred credits and other liabilities | | 718,613 | | 36,161 | | 754,774 |
| | | |
Retained earnings | | 7,255,972 | | 60,938 | | 7,316,910 |
CONSOLIDATED STATEMENT OF CASH FLOWS Year Ended December 31, 2015 | | | | | | |
| | | |
Net earnings | | $ 496,084 | | $ (303,054) | | $ 193,030 |
| | | |
Changes in inventories | | 593,830 | | 467,372 | | 1,061,202 |
| | | |
Changes in deferred income taxes | | (82,518) | | (164,318) | | (246,836) |
CONSOLIDATED STATEMENT OF CASH FLOWS Year Ended December 31, 2014 | | | | | | |
| | | |
Net earnings | | $ 815,790 | | $ (37,226) | | $ 778,564 |
| | | |
Changes in inventories | | (45,963) | | 57,289 | | 11,326 |
| | | |
Changes in deferred income taxes | | 90,864 | | (20,063) | | 70,801 |
The effects of the change in accounting principle from LIFO to FIFO have been retrospectively applied to all periods presented in Notes 6, 19, 21, 22 and 24 of the consolidated financial statements.
The following table shows the effect of the change in accounting principle from LIFO to FIFO on net earnings, earnings attributable to noncontrolling interests, net earnings attributable to Nucor stockholders and the related basic and diluted earnings per share for the year ended December 31, 2016.
| | | | | | |
| | | | (in thousands, except per share data) |
| | | As Computed under LIFO | | As Computed under FIFO | | Effect of Change |
CONSOLIDATED STATEMENT OF EARNINGS Year Ended December 31, 2016 | | | | | | |
| | | |
Net earnings | | $ 810,304 | | $ 900,416 | | $ 90,112 |
| | | |
Earnings attributable to noncontrolling interests | | 99,500 | | 104,145 | | 4,645 |
| | | |
Net earnings attributable to Nucor stockholders | | 710,804 | | 796,271 | | 85,467 |
| | | |
Net earnings per share: | | | | | | |
| | | |
Basic | | $2.22 | | $2.48 | | $0.26 |
| | | |
Diluted | | $2.22 | | $2.48 | | $0.26 |
Property, Plant and Equipment Property, plant and equipment is stated at cost, except for property, plant and equipment acquired through acquisitions which is recorded at acquisition date fair value. With the exception of our natural gas wells, depreciation is provided on a straight-line basis over the estimated useful lives of the assets. Depletion of all capitalized costs associated with our natural gas producing properties is expensed on aunit-of-production basis by individual field as the gas from the proved developed reserves is produced. The costs of acquiring unproved natural gas leasehold acreage are capitalized. When proved reserves are found on unproved properties, the associated leasehold cost is transferred to proved properties. Unproved leases are reviewed periodically for any impairment triggering event, and a valuation allowance is provided for any estimated decline in value. The costs of planned major maintenance activities are capitalized as part of other current assets and amortized over the period until the next scheduled major maintenance activity. All other repairs and maintenance activities are expensed when incurred.
Goodwill and Other Intangibles Goodwill is the excess of cost over the fair value of net assets of businesses acquired. Goodwill is not amortized but is tested annually for impairment and whenever events or circumstances change that would make it more likely than not that an impairment may have occurred. We perform our annual impairment analysis as of the first day of the fourth quarter each year. The evaluation of impairment involves comparing the current estimated fair value of each reporting unit, which is a level below the reportable segment, to the recorded value, including goodwill. When appropriate, Nucor performs a qualitative assessment to determine whether it is more likely than not that the fair value of a reporting unit is less than its carrying amount. For certain reporting units, it is necessary to perform a quantitative analysis. In these instances, a discounted cash flow model is used to determine the current estimated fair value of these reporting units. A number of significant assumptions and estimates are involved in the application of the discounted cash flow model to forecast operating cash flows, including market growth and market share, sales volumes and prices, costs to produce, discount rate and estimated capital needs. Management considers historical experience and all available information at the time the fair values of its reporting units are estimated. Assumptions in estimating future cash flows are subject to a high degree of judgment and complexity. Changes in assumptions and estimates may affect the fair value of goodwill and could result in impairment charges in future periods.
Finite-lived intangible assets are amortized over their estimated useful lives.
Long-Lived Asset Impairments We evaluate our property, plant and equipment and finite-lived intangible assets for potential impairment on an individual asset basis or at the lowest level asset grouping for which independent cash flows can be separately identified. Asset impairments are assessed whenever circumstances indicate that the carrying amounts of those productive assets could exceed their projected undiscounted cash flows. When it is determined that impairment exists, the related assets are written down to their estimated fair market value.
Equity Method Investments Investments in joint ventures in which Nucor shares control over the financial and operating decisions but in which Nucor is not the primary beneficiary are accounted for under the equity method. Each of the Company’s equity method investments is subject to a review for impairment if, and when, circumstances indicate that a decline in value below its carrying amount may have occurred. Examples of such circumstances include, but are not limited to, a significant deterioration in the earnings performance or business prospects of the investee; missed financial projections; a significant adverse change in the regulatory, economic or technological environment of the investee; a significant adverse change in the general market condition of either the geographic area or the industry in which the investee operates and recurring negative cash flows from operations. If management considers the decline to be other than temporary, the Company would write down the investment to its estimated fair market value.
Derivative Financial InstrumentsNucor periodically uses derivative financial instruments primarily to partially manage its exposure to price risk related to natural gas purchases used in the production process as well as to scrap, copper and aluminum purchased for resale to its customers. In addition, Nucor periodically uses derivatives to partially manage its exposure to changes in interest rates on outstanding debt instruments and uses forward foreign exchange contracts to hedge cash flows associated with certain assets and liabilities, firm commitments and anticipated transactions.
Nucor recognizes all derivative instruments in the consolidated balance sheets at fair value. Amounts included in accumulated other comprehensive income (loss) related to cash flow hedges are reclassified into earnings when the underlying transaction is recognized in net earnings. Changes in fair value hedges are reported in earnings along with changes in the fair value of the hedged items. When cash flow and fair value hedges affect net earnings, they are included on the same financial statement line as the underlying transaction (cost of products sold or interest expense). If these instruments do not meet hedge accounting criteria or contain ineffectiveness, the change in fair value (or a portion thereof) is recognized immediately in earnings in the same financial statement line as the underlying transaction.
Revenue Recognition Nucor recognizes revenue when persuasive evidence of a contractual arrangement exists, delivery has occurred, the sales price is fixed or determinable and collection is reasonably assured. Product is considered delivered to the customer once it has been shipped and title and risk of loss has been transferred.
Income Taxes Nucor utilizes the liability method of accounting for income taxes. Under the liability method, deferred taxes are determined based on the temporary differences between the financial statement and tax basis of assets and liabilities using tax rates expected to be in effect during the years in which the basis differences reverse. A valuation allowance is recorded when it is more likely than not that some of the deferred tax assets will not be realized.
Nucor recognizes the effect of income tax positions only if those positions are more likely than not of being sustained. Potential accrued interest and penalties related to unrecognized tax benefits are recognized as a component of interest expense.
Nucor’s intention is to permanently reinvest the earnings of certain foreign investments. Accordingly, no provisions have been made for taxes that may be payable upon remittance of such earnings.
Stock-Based Compensation The Company recognizes the cost of stock-based compensation as an expense using fair value measurement methods. The assumptions used to calculate the fair value of stock-based compensation granted are evaluated and revised, as necessary, to reflect market conditions and experience.
Foreign Currency Translation For Nucor’s operations where the functional currency is other than the U.S. dollar, assets and liabilities have been translated atyear-end exchange rates, and income and expenses have been translated using average exchange rates for the respective periods. Adjustments resulting from the process of translating an entity’s financial statements into the U.S. dollar have been recorded in accumulated other comprehensive income (loss) and are included in net earnings only upon sale or liquidation of the underlying investments. Foreign currency transaction gains and losses are included in net earnings in the period they occur.
Recently Adopted Accounting Pronouncements In the first quarter of 2016, Nucor adopted new accounting guidance that requires debt issuance costs related to a recognized debt liability be presented in the balance sheet as a direct deduction from the carrying amount of that debt liability, consistent with debt discounts. This new guidance is applied retrospectively for the Company for all periods presented. As of December 31, 2015, the Company reclassified $23.5 million of deferred long-term debt issuance costs from other assets to long-term debt due after one year in the consolidated balance sheets.
In the first quarter of 2016, Nucor adopted new accounting guidance that requires an acquirer in a business combination to recognize adjustments to provisional amounts that are identified during the measurement period in the reporting period in which the adjustment amounts are determined. This standard is applied prospectively for the Company beginning January 1, 2016. The adoption of this standard did not have a material effect on the Company’s consolidated financial statements.
In the fourth quarter of 2016, Nucor adopted new accounting guidance that specifies the responsibility that an entity’s management has to evaluate whether there is substantial doubt about the entity’s ability to continue as a going concern. This standard is applied prospectively for the Company beginning with the annual and interim reporting periods ending December 31, 2016. The adoption of this standard did not have an effect on the Company’s consolidated financial statements.
Recently Issued Accounting Pronouncements In May 2014, new accounting guidance was issued that will supersede nearly all existing accounting guidance related to revenue recognition. The new guidance provides that an entity recognizes revenue when it transfers promised goods or services to customers in an amount that reflects the consideration to which the entity expects to be entitled in exchange for those goods or services. This update also requires additional disclosure about the nature, amount, timing and uncertainty of revenue and cash flows arising from customer contracts, including significant judgments and changes in judgments, and assets recognized from costs incurred to obtain or fulfill a contract. The Financial Accounting Standards Board has also issued a number of updates to this new accounting guidance. The standard is effective for the Company for annual and interim reporting periods beginning after December 15, 2017 and is not expected to have a material effect on the Company’s consolidated financial statements.
In January 2016, new accounting guidance was issued regarding the recognition and measurement of financial assets and financial liabilities. Changes to the current accounting guidance primarily affect the accounting for equity investments, financial liabilities under the fair value option, and the presentation and disclosure requirements for financial instruments. In addition, the Financial Accounting Standards Board clarified guidance related to the valuation allowance assessment when recognizing deferred tax assets resulting from unrealized losses onavailable-for-sale debt securities. The accounting for other financial instruments, such as loans, investments in debt securities, and financial liabilities, is largely unchanged. The standard is effective for the Company for annual and interim reporting periods beginning after December 15, 2017 and is not expected to have a material effect on the Company’s consolidated financial statements.
In February 2016, new accounting guidance was issued regarding the accounting for leases. The new guidance requires all lessees to recognize on the balance sheet right to use assets and lease liabilities for the rights and obligations created by lease arrangements with terms greater than 12 months. The standard is effective for the Company for annual and interim reporting periods beginning after December 15, 2018. The Company is evaluating the impact that the adoption of this new guidance will have on its consolidated financial statements.
In March 2016, new accounting guidance was issued regarding employee share-based payment accounting. The new guidance simplifies certain aspects of the accounting for share-based payment transactions, including income tax requirements, forfeitures and presentation on the balance sheet and statement of cash flows. The new guidance is effective for the Company for annual and interim reporting periods beginning after December 15, 2016 and is not expected to have a material effect on the Company’s consolidated financial statements.
In August 2016, new accounting guidance was issued regarding the presentation and classification of certain cash receipts and cash payments in the statement of cash flows. The new guidance addresses specific cash flow presentation issues in order to reduce diversity in existing practice. The new guidance is effective for the Company for annual and interim reporting periods beginning after December 15, 2017. The Company is evaluating the impact that the adoption of this new guidance will have on its consolidated financial statements.
In October 2016, new accounting guidance was issued regarding intra-entity transfers of assets other than inventory. The new guidance requires that an entity should recognize the income tax consequences of an intra-entity transfer of an asset other than inventory when the transfer occurs. The new guidance is effective for the Company for annual and interim reporting periods beginning after December 15, 2017. The Company is evaluating the impact that the adoption of this new guidance will have on its consolidated financial statements.
3. ACQUISITIONS AND DISPOSITIONS
On October 31, 2016, Nucor used cash on hand to acquire Independence Tube Corporation (ITC) for a purchase price of $430.1 million. ITC is a leading manufacturer of hollow structural section (HSS) tubing, which is primarily used in nonresidential construction markets. ITC has the ability to produce approximately 650,000 tons of HSS tubing annually at its four facilities, two of which are in Illinois and the other two are in Alabama. This acquisition not only further expands Nucor’s product portfolio to include the HSS tubing market but the Company also believes it will be an important, value-added channel to market for Nucor’shot-rolled sheet steel, as ITC’s plants are located in close proximity to Nucor’s sheet mills in Alabama, Indiana and Kentucky. ITC’s financial results are included as part of the steel mills segment (see Note 22).
We have allocated the purchase price for ITC to its individual assets acquired and liabilities assumed.
The following table summarizes the fair values of the assets acquired and liabilities assumed of ITC as of the date of acquision:
| | |
| | | (in thousands) |
| Cash | | $ 1,058 |
Accounts receivable | | 33,173 |
Inventory | | 94,400 |
Other current assets | | 1,743 |
Property, plant and equipment | | 177,668 |
Goodwill | | 29,522 |
Other intangible assets | | 130,900 |
Other assets | | 1,287 |
Total assets acquired | | 469,751 |
| | |
Current liabilities | | 39,633 |
Total liabilities assumed | | 39,633 |
| | |
Net assets acquired | | $430,118 |
| | | |
The following table summarizes the purchase price allocation to the identifiable intangible assets of ITC as of the date of acquisition:
| | | | | | | | | | | | |
| | | | | | (in thousands, except years) | |
| | | | |
| | | | | | | | | |
| Weighted-
Average Life |
|
| | | |
Customer relationships | | | | | | $ | 119,000 | | | | 15 years | |
Trademarks and trade names | | | | | | | 7,100 | | | | 15 years | |
Other | | | | | | | 4,800 | | | | 5 years | |
| | | | | | | | | | | | |
| | | | | | $ | 130,900 | | | | | |
| | | | | | | | | | | | |
| | | | | | | | | | | | |
The goodwill of $29.5 million is calculated as the excess of the purchase price over the fair values of the assets and liabilities acquired and has been allocated to the steel mills segment (see Note 8). Goodwill recognized for tax purposes was $30.5 million, all of which is deductible for tax purposes.
On October 8, 2014, Nucor acquired the entire equity interest in Gallatin Steel Company (Gallatin) for a cash purchase price of $779.1 million, including working capital adjustments. The acquisition was partially funded by the issuance of approximately $300 million of commercial paper with the remaining funds coming from cash on hand. Located on the Ohio River in Ghent, Kentucky, Gallatin has an annual sheet steel production capacity of approximately 1,600,000 tons. This acquisition is strategically important as it expands Nucor’s footprint in the midwestern United States market, and it will broaden Nucor’s product offerings. Gallatin’s financial results are included as part of the steel mills segment (see Note 22).
We have allocated the purchase price for Gallatin to its individual assets acquired and liabilities assumed.
The following table summarizes the fair values of the assets acquired and liabilities assumed of Gallatin as of the date of acquisition:
| | | | |
| | | | | (in thousands) |
| | | |
Cash | | | | $ 48,957 |
Accounts receivable | | | | 82,291 |
Inventory | | | | 101,692 |
Other current assets | | | | 5,117 |
Property, plant and equipment | | | | 483,007 |
Goodwill | | | | 94,737 |
Other intangible assets | | | | 67,150 |
Other assets | | | | 2,529 |
Total assets acquired | | | | 885,480 |
| | |
Current liabilities | | | | 104,315 |
Long-term debt | | | | 2,093 |
Total liabilities assumed | | | | 106,408 |
| | |
Net assets acquired | | | | $779,072 |
The following table summarizes the purchase price allocation to the identifiable intangible assets of Gallatin as of the date of acquisition:
| | | | | | | | |
(in thousands, except years) | |
| | | | | |
| Weighted-
Average Life |
|
Customer relationships | | $ | 58,250 | | | | 20 years | |
Trademarks and trade names | | | 8,900 | | | | 5 years | |
| | | | | | | | |
| | $ | 67,150 | | | | | |
| | | | | | | | |
| | | | | | | | | |
The goodwill of $94.7 million is calculated as the excess of the purchase price over the fair values of the assets and liabilities acquired and has been allocated to the steel mills segment (see Note 8). Goodwill recognized for tax purposes was $98.1 million, all of which is deductible for tax purposes.
Other minor acquisitions, exclusive of purchase price adjustments of acquisitions made and net of cash acquired, totaled $50.1 million in 2016, $19.1 million in 2015 and $38.5 million in 2014.
4. SHORT-TERM INVESTMENTS
Nucor held $150.0 million and $100.0 million of short-term investments as of December 31, 2016 and 2015, respectively. The investments held as of December 31, 2016 consisted of certificates of deposit (CDs). The investments held as of December 31, 2015 consisted of CDs and fixed term deposits. These investments are classified asavailable-for-sale. The interest rates on the fixed term deposits and CDs are fixed at inception and interest income is recorded as earned.
No realized or unrealized gains or losses were incurred in 2016, 2015 or 2014.
The contractual maturities of all of the fixed term deposits and CDs outstanding at December 31, 2016 are before December 31, 2017.
5. ACCOUNTS RECEIVABLE
An allowance for doubtful accounts is maintained for estimated losses resulting from the inability of our customers to make required payments. Accounts receivable are stated net of the allowance for doubtful accounts of $45.9 million at December 31, 2016 ($43.2 million at December 31, 2015 and $65.4 million at December 31, 2014).
6. INVENTORIES
Inventories consist of approximately 37% raw materials and supplies and 63% finished and semi-finished products at December 31, 2016 (38% and 62%, respectively, at December 31, 2015). Nucor’s manufacturing process consists of a continuous, vertically integrated process from which products are sold to customers at various stages throughout the process. Since most steel products can be classified as either finished or semi-finished products, these two categories of inventory are combined. Use of the lower of cost or market methodology reduced inventories by $2.2 million at December 31, 2016 ($5.7 million at December 31, 2015).
Previously, the Company utilized the LIFO method to account for a portion of its inventory, while the rest of the business was on the FIFO method. As described in Note 2, in the fourth quarter of 2016 the Company elected to change the method of accounting for all remaining inventory from LIFO to FIFO. The effects of this change in accounting principle have been retrospectively applied to all periods presented.
In the fourth quarter of 2016, the Company changed its estimates of FIFO inventory cost based on the updated normal capacity determination and related full absorption costing. As a result of this change in estimate, unabsorbed production costs decreased and the FIFO value of inventory on hand at year end increased by $77.6 million ($0.16 per diluted share). This change in estimate also had the effect of reducing cost of products sold in the fourth quarter of 2016 by $83.0 million with an offsetting $5.4 million recorded in earnings attributable to noncontrolling interests in the consolidated statements of earnings.
7. PROPERTY, PLANT AND EQUIPMENT
| | | | |
| | | | | (in thousands) |
| December 31, | | 2016 | | 2015 |
| | | |
Land and improvements | | $ 602,218 | | $ 585,057 |
Buildings and improvements | | 1,169,064 | | 1,033,610 |
Machinery and equipment | | 10,524,030 | | 10,229,602 |
Proved oil and gas properties | | 551,019 | | 586,362 |
Leasehold interest in unproved oil and gas properties | | 165,000 | | — |
Construction in process and equipment deposits | | 224,677 | | 197,278 |
| | 13,236,008 | | 12,631,909 |
Less accumulated depreciation | | (8,157,358) | | (7,740,756) |
| | $ 5,078,650 | | $ 4,891,153 |
| | | | | |
The estimated useful lives primarily range from 5 to 25 years for land improvements, 4 to 40 years for buildings and improvements and 2 to 15 years for machinery and equipment. The useful life for proved oil and gas properties is based on theunit-of-production method and varies by well.
Due to the current natural gas pricing environment, Nucor performed an impairment assessment of its proved producing natural gas well assets in December 2016. One of the main assumptions that most significantly affects the undiscounted cash flows determination is management’s estimate of future natural gas prices. The pricing used in this impairment assessment was developed by management based on projected natural gas market supply and demand dynamics, in conjunction with a review of projections by numerous sources of market data. This analysis was performed on each of Nucor’s three groups of wells, with each group defined by common geographic location. Each of Nucor’s three groups of wells passed the impairment test. One of the groups of wells had estimated undiscounted cash flows that were noticeably closer to its carrying value of $80.8 million as of December 31, 2016. Changes in the natural gas industry or a prolonged low price environment beyond what had already been assumed in the analysis could cause management to revise the natural gas price assumptions, which could possibly result in an impairment of a portion or all of the groups of proved well assets.
On October 1, 2016, Nucor purchased 49% of Encana Oil & Gas (USA) Inc.’s leasehold interest in unproved oil and gas properties covering approximately 54,000 acres in the South Piceance Basin for $165.0 million.
In the fourth quarter of 2015, we determined that certain assets, the majority of which were engineering and equipment related to a blast furnace project at our St. James Parish, Louisiana site, will not be utilized in the future. As a result of this determination, Nucor recorded an $84.1 million impairment charge for the entire balance of those assets, which is included in the raw materials segment. The impairment charge is included in impairments and losses on assets in the consolidated statement of earnings in 2015. The assets that were impaired, the majority of which were acquired in 2008, were a viable option that were anticipated to be utilized up until the decision was made that such assets would not be utilized. The decision about whether or not to move forward with construction of the blast furnace utilizing these assets was delayed to focus on the construction of the DRI plant at the site. The decision was further delayed because of challenging conditions in domestic and global steel industries, particularly increased excess capacity, both domestically and globally. In the meantime, technology advances and supply and demand in the raw materials market led management to reconsider its plans for the previously proposed blast furnace. If we decide to proceed with a blast furnace at the site in the future, the project design will be evaluated at that time utilizing new equipment and engineering.
Nucor capitalized $3.9 million of interest expense in 2016 ($0.3 million in 2015 and $2.9 million in 2014) related to the borrowing costs associated with various construction projects.
8. GOODWILL AND OTHER INTANGIBLE ASSETS
The change in the net carrying amount of goodwill for the years ended December 31, 2016 and 2015 by segment is as follows:
| | | | | | | | |
| | | | | | | | | (in thousands) |
| | Steel Mills | | Steel Products | | Raw Materials | | Total |
| | | | | |
Balance, December 31, 2014 | | $ 594,402 | | $ 744,685 | | $ 729,577 | | $ 2,068,664 |
Translation | | — | | (53,618) | | — | | (53,618) |
Other | | (3,768) | | — | | — | | (3,768) |
Balance, December 31, 2015 | | 590,634 | | 691,067 | | 729,577 | | 2,011,278 |
Acquisitions | | 29,522 | | — | | — | | 29,522 |
Translation | | — | | 11,928 | | — | | 11,928 |
Balance, December 31, 2016 | | $ 620,156 | | $ 702,995 | | $ 729,577 | | $ 2,052,728 |
| | | | | | | | | |
The majority of goodwill is not tax deductible.
Intangible assets with estimated lives of 5 to 22 years are amortized on a straight-line or accelerated basis and are comprised of the following:
| | | | | | | | |
| | | | | | | | | (in thousands) |
December 31, | | 2016 | | 2015 |
| | | Gross Amount | | Accumulated Amortization | | Gross Amount | | Accumulated Amortization |
| | | | |
Customer relationships | | $1,295,803 | | $566,884 | | $1,185,299 | | $517,817 |
Trademarks and trade names | | 161,851 | | 66,494 | | 155,864 | | 57,756 |
Other | | 62,807 | | 20,248 | | 23,025 | | 17,943 |
| | $1,520,461 | | $653,626 | | $1,364,188 | | $593,516 |
| | | | | | | | | |
During the third quarter of 2016, Nucor acquired the remaining ownership interest in a former joint venture entity that Nucor previously accounted for as an equity method investment. As a result of the transaction, Nucor obtained control and began to consolidate that entity. That entity’s intangible assets, the majority of which are patents, are included in other intangible assets, net in the consolidated balance sheet at December 31, 2016. The gross amount and related accumulated amortization of these assets were $36.3 million and $2.1 million, respectively, at December 31, 2016.
Intangible asset amortization expense was $73.9 million in 2016 ($74.3 million in 2015 and $72.4 million in 2014). Annual amortization expense is estimated to be $82.2 million in 2017, $79.0 million in 2018, $76.1 million in 2019, $73.7 million in 2020 and $72.5 million in 2021.
The Company completed its annual goodwill impairment testing as of the first day of the fourth quarters of 2016, 2015 and 2014 and concluded that as of such dates there was no impairment of goodwill for any of its reporting units. We do not believe there are any reporting units at significant risk of goodwill impairment in the next twelve months. However, assumptions in estimating reporting unit fair values are subject to a high degree of judgment and complexity. Changes in assumptions and estimates may affect the estimated reporting unit fair values and could result in impairment charges in future periods.
There are no significant historical accumulated impairment charges, by segment or in the aggregate, related to goodwill.
9. EQUITY INVESTMENTS
The carrying value of our equity investments in domestic and foreign companies was $663.4 million at December 31, 2016 ($746.6 million at December 31, 2015) and is recorded in other assets in the consolidated balance sheets.
Duferdofin Nucor Nucor owns a 50% economic and voting interest in Duferdofin Nucor S.r.l. (Duferdofin Nucor), an Italian steel manufacturer, and accounts for the investment (on aone-month lag basis) under the equity method, as control and risk of loss are shared equally between the members.
Nucor’s investment in Duferdofin Nucor at December 31, 2016 was $256.6 million ($258.2 million at December 31, 2015). Nucor’s 50% share of the total net assets of Duferdofin Nucor was $102.0 million at December 31, 2016, resulting in a basis difference of $154.6 million due to thestep-up to fair value of certain assets and liabilities attributable to Duferdofin Nucor as well as the identification of goodwill ($81.2 million) and finite-lived intangible assets. This basis difference, excluding the portion attributable to goodwill, is being amortized based on the remaining estimated useful lives of the various underlying net assets, as appropriate. Amortization expense associated with the fair valuestep-up was $8.8 million in 2016 ($8.8 million in 2015 and $10.5 million in 2014).
As of December 31, 2016, Nucor had outstanding notes receivable of€35.0 million ($36.9 million) from Duferdofin Nucor (€35.0 million, or $38.2 million, as of December 31, 2015). The notes receivable bear interest at 0.94% and will reset annually on September 30 to the twelve-month Euro Interbank Offered Rate (Euribor) plus 1% per year. The principal amounts are due on January 31, 2019. As of December 31, 2016 and December 31, 2015, the notes receivable were classified in other assets in the consolidated balance sheets.
Nucor has issued a guarantee, the fair value of which is immaterial, for its ownership percentage (50%) of Duferdofin Nucor’s borrowings under Facility A of a Structured Trade Finance Facilities Agreement (Facility A). The maximum amount Duferdofin Nucor could borrow under Facility A was€122.5 million ($129.1 million) at December 31, 2016. As of December 31, 2016, there was€107.0 million ($112.7 million) outstanding under that facility (€119.0 million, or $129.8 million, at December 31, 2015). Facility A was amended in 2015 to extend the maturity date to October 12, 2018. If Duferdofin Nucor fails to pay when due any amounts for which it is obligated under Facility A, Nucor could be required to pay 50% of such amounts pursuant to and in accordance with the terms of its guarantee. Any indebtedness of Duferdofin Nucor to Nucor is effectively subordinated to the indebtedness of Duferdofin Nucor under Facility A. Nucor has not recorded any liability associated with this guarantee.
NuMit Nucor has a 50% economic and voting interest in NuMit LLC (NuMit). NuMit owns 100% of the equity interest in Steel Technologies LLC, an operator of 25 sheet processing facilities located throughout the United States, Canada and Mexico. Nucor accounts for the investment in NuMit (on aone-month lag basis) under the equity method, as control and risk of loss are shared equally between the members. Nucor’s investment in NuMit at December 31, 2016 was $325.1 million ($314.5 million as of December 31, 2015). Nucor received distributions of $38.6 million, $13.1 million, and $52.7 million from NuMit during 2016, 2015 and 2014, respectively.
Hunter Ridge In the third quarter of 2016, Nucor sold its 50% economic and voting interest in Hunter Ridge Energy Services LLC (Hunter Ridge) for $135.0 million. Hunter Ridge provides services for the gathering, separation and compression of energy products, including natural gas produced by some of Nucor’s natural gas wells. Nucor accounted for the investment in Hunter Ridge (on aone-month lag basis) under the equity method, as control and risk of loss were shared equally between the members. Nucor’s investment in Hunter Ridge at the date of sale was $133.3 million ($135.9 million at December 31, 2015).
All Equity InvestmentsNucor reviews its equity investments for impairment if and when circumstances indicate that a decline in value below their carrying amounts may have occurred. In the fourth quarter of 2015, Nucor assessed its equity investment in Duferdofin Nucor for impairment due to the protracted challenging steel market conditions caused by excess global overcapacity, which increased in 2015, and the difficult economic environment in Europe. After completing its assessment, the Company determined that the carrying amount exceeded its estimated fair value. The impairment condition was considered to be other than temporary and, as a result, the Company recorded a $153.0 million impairment charge against the Company’s investment in Duferdofin Nucor in the fourth quarter of 2015. While the operating performance of Duferdofin Nucor showed meaningful improvement in 2016, steel market conditions in Europe have continued to be challenging. Therefore, it is reasonably possible that material deviation of future performance from the estimates used in our most recent valuation could result in further impairment of our investment in Duferdofin Nucor. We will continue to monitor for potential triggering events that could affect the carrying value of our investment in Duferdofin Nucor as a result of future market conditions and any changes in our business strategy.
10. CURRENT LIABILITIES
Book overdrafts, included in accounts payable in the consolidated balance sheets, were $61.3 million at December 31, 2016 ($62.8 million at December 31, 2015). Dividends payable, included in accrued expenses and other current liabilities in the consolidated balance sheets, were $121.3 million at December 31, 2016 ($120.2 million at December 31, 2015).
11. DEBT AND OTHER FINANCING ARRANGEMENTS
| | | | | | | | |
| | | | | | (in thousands) | |
December 31, | | 2016 | | | 2015 | |
Industrial revenue bonds: | | | | | | | | |
0.30% to 1.00%, variable, due from 2020 to 2040 | | | $1,010,600 | | | | $1,010,600 | |
Notes, 5.75%, due 2017 | | | 600,000 | | | | 600,000 | |
Notes, 5.85%, due 2018 | | | 500,000 | | | | 500,000 | |
Notes, 4.125%, due 2022 | | | 600,000 | | | | 600,000 | |
Notes, 4.0%, due 2023 | | | 500,000 | | | | 500,000 | |
Notes, 6.40%, due 2037 | | | 650,000 | | | | 650,000 | |
Notes, 5.20%, due 2043 | | | 500,000 | | | | 500,000 | |
Total long-term debt | | | 4,360,600 | | | | 4,360,600 | |
Less debt issuance costs | | | 21,459 | | | | 23,455 | |
Total amounts outstanding | | | 4,339,141 | | | | 4,337,145 | |
Less current maturities | | | 600,000 | | | | — | |
Total long-term debt due after one year | | | $3,739,141 | | | | $4,337,145 | |
| | | | | | | | | |
Annual aggregate long-term debt maturities are: $600.0 million in 2017, $500.0 million in 2018, none in 2019, $20.0 million in 2020, none in 2021 and $3.241 billion thereafter.
Nucor has a $1.50 billion unsecured revolving credit facility that matures in April 2021. The unsecured revolving credit facility provides up to $1.50 billion in revolving loans and allows up to $500.0 million in additional commitments at Nucor’s election in accordance with the terms set forth in the credit agreement. Up to the equivalent of $850.0 million of the credit facility is available for foreign currency loans, up to $100.0 million is available for the issuance of letters of credit and up to $500.0 million is available for the issuance of revolving loans for Nucor subsidiaries in accordance with terms set forth in the credit agreement. The credit facility provides for a pricing grid based upon the credit rating of Nucor’s senior unsecured long-term debt and, alternatively, interest rates quoted by lenders in connection with competitive bidding. The credit facility includes customary financial and other covenants, including a limit on the ratio of funded debt to capital of 60%, a limit on Nucor’s ability to pledge the Company’s assets and a limit on consolidations, mergers and sales of assets. As of December 31, 2016, Nucor’s funded debt to total capital ratio was 35%, and Nucor was in compliance with all covenants under the credit facility. No borrowings were outstanding under the credit facility as of December 31, 2016 and 2015.
Harris Steel has credit facilities totaling approximately $26.2 million, with no outstanding borrowings at December 31, 2016 ($25.1 million at December 31, 2015). In addition, the business of Nucor Trading S.A. is financed by uncommitted trade credit arrangements with a number of European banking institutions. As of December 31, 2016, Nucor Trading S.A. had outstanding borrowings of $18.0 million, which is presented in short-term debt in the consolidated balance sheets ($51.3 million at December 31, 2015).
Letters of credit totaling $41.2 million were outstanding as of December 31, 2016 ($58.0 million as of December 31, 2015), related to certain obligations, including workers’ compensation, utilities deposits and credit arrangements by Nucor Trading S.A. for commitments to purchase inventories.
12. CAPITAL STOCK
The par value of Nucor’s common stock is $0.40 per share and there are 800 million shares authorized. In addition, 250,000 shares of preferred stock, par value of $4.00 per share, are authorized, with preferences, rights and restrictions as may be fixed by Nucor’s Board of Directors. There are no shares of preferred stock issued or outstanding.
In September 2015, Nucor’s Board of Directors approved the repurchase of up to $900 million of the Company’s common stock. The Board of Directors also terminated any previously authorized repurchase programs. The Company repurchased $5.2 million of its common stock in 2016 ($66.5 million in 2015 and none in 2014).
13. DERIVATIVE FINANCIAL INSTRUMENTS
The following tables summarize information regarding Nucor’s derivative instruments:
Fair Value of Derivative Instruments
| | | | | | | | | | |
| | | | | | | | (in thousands) | |
| | | | | Fair Value | |
December 31, | | Consolidated Balance Sheet Location | | 2016 | | | 2015 | |
| | | |
Asset derivatives designated as hedging instruments: | | | | | | | | | | |
| | | |
Commodity contracts | | Other current assets | | $ | 1,250 | | | $ | — | |
| | | |
Asset derivatives not designated as hedging instruments: | | | | | | | | | | |
| | | |
Foreign exchange contracts | | Other current assets | | | 779 | | | | 909 | |
| | | | | | | | | | |
| | | |
Total asset derivatives | | | | $ | 2,029 | | | $ | 909 | |
| | | | | | | | | | |
| | | |
Liability derivatives designated as hedging instruments: | | | | | | | | | | |
| | | |
Commodity contracts | | Accrued expenses and other current liabilities | | $ | — | | | $ | (15,700 | ) |
Commodity contracts | | Deferred credits and other liabilities | | | — | | | | (2,800 | ) |
| | | | | | | | | | |
| | | |
Total liability derivatives designated as hedging instruments | | | | | — | | | | (18,500 | ) |
| | | | | | | | | | |
| | | |
Liability derivatives not designated as hedging instruments: | | | | | | | | | | |
| | | |
Commodity contracts | | Accrued expenses and other current liabilities | | | (605 | ) | | | (353 | ) |
| | | | | | | | | | |
| | | |
Total liability derivatives | | | | $ | (605 | ) | | $ | (18,853 | ) |
| | | | | | | | | | |
| | | | | | | | | | | |
The Effect of Derivative Instruments on the Consolidated Statements of Earnings
| | | | | | | | | | | | | | | | | | | | |
| Derivatives Designated as Hedging Instruments | | | | | | | | | | (in thousands) |
| | | | | | | | | | | | | | | | | | | | |
Derivatives in Cash Flow Hedging
Relationships | | Statement of Earnings Location | | Amount of Gain or (Loss), net of tax, Recognized in OCI on Derivatives (Effective Portion) | | Amount of Gain or (Loss), net of tax, Reclassified from
Accumulated OCI into Earnings
on Derivatives (Effective Portion) | | Amount of Gain or (Loss), net of tax, Recognized
in Earnings on Derivatives
(Ineffective Portion) |
Year Ended December 31, | | 2016 | | 2015 | | 2014 | | 2016 | | 2015 | | 2014 | | 2016 | | 2015 | | 2014 |
| | | | | | | | | | |
Commodity contracts | | Cost of products sold | | $2,570 | | $(9,498) | | $(8,542) | | $(9,880) | | $(5,798) | | $(542) | | $ — | | $ — | | $ — |
| | | | | | | | | | | | | | | | | | | | | |
| | | | | | | | |
| Derivatives Not Designated as Hedging Instruments | | | | (in thousands) |
| | | | | | | | |
Derivatives Not Designated as Hedging Instruments | | Statement of Earnings Location | | Amount of Gain or (Loss) Recognized in Earnings on Derivatives |
Year Ended December 31, | | 2016 | | 2015 | | 2014 |
| | | | |
Commodity contracts | | Cost of products sold | | $ (3,251) | | $2,894 | | $1,890 |
Foreign exchange contracts | | Cost of products sold | | 238 | | 2,392 | | 748 |
Total | | | | $ (3,013) | | $5,286 | | $2,638 |
| | | | | | | | | |
At December 31, 2016, natural gas swaps covering approximately 19.2 million MMBTUs (extending through December 2019) were outstanding.
14. FAIR VALUE MEASUREMENTS
The following table summarizes information regarding Nucor’s financial assets and liabilities that are measured at fair value as of December 31, 2016 and 2015. Nucor does not have anynon-financial assets or liabilities that are measured at fair value on a recurring basis.
| | | | | | | | | | | | | | | | |
| | | | | | | | | | | | (in thousands) | |
| | | | | | Fair Value Measurements at Reporting Date Using | |
| | | Carrying | | | Quoted Prices | | | Significant | | | Significant | |
| | | Amount in | | | in Active Markets | | | Other Observable | | | Unobservable | |
| | | Consolidated | | | for Identical Assets | | | Inputs | | | Inputs | |
| December 31, | | Balance Sheets | | | (Level 1) | | | (Level 2) | | | (Level 3) | |
| | | | |
2016 | | | | | | | | | | | | | | | | |
Assets: | | | | | | | | | | | | | | | | |
Cash equivalents | | | $1,609,523 | | | | $1,609,523 | | | | $ — | | | | | |
Short-term investments | | | 150,000 | | | | 150,000 | | | | — | | | | | |
Commodity and foreign exchange contracts | | | 2,029 | | | | — | | | | 2,029 | | | | — | |
Total assets | | | $1,761,552 | | | | $1,759,523 | | | | $ 2,029 | | | | — | |
Liabilities: | | | | | | | | | | | | | | | | |
Commodity contracts | | | $ (605 | ) | | | — | | | | $ (605 | ) | | | — | |
| | | | |
2015 | | | | | | | | | | | | | | | | |
Assets: | | | | | | | | | | | | | | | | |
Cash equivalents | | | $1,668,567 | | | | $1,668,567 | | | | $ — | | | | | |
Short-term investments | | | 100,000 | | | | 100,000 | | | | — | | | | | |
Foreign exchange contracts | | | 909 | | | | — | | | | 909 | | | | — | |
Total assets | | | $1,769,476 | | | | $1,768,567 | | | | $ 909 | | | | — | |
Liabilities: | | | | | | | | | | | | | | | | |
Commodity contracts | | | $ (18,853 | ) | | | — | | | | $ (18,853 | ) | | | — | |
| | | | | | | | | | | | | | | | | |
Fair value measurements for Nucor’s cash equivalents and short-term investments are classified under Level 1 because such measurements are based on quoted market prices in active markets for identical assets. Fair value measurements for Nucor’s derivatives are classified under Level 2 because such measurements are based on published market prices for similar assets or are estimated based on published market prices for similar assets or are estimated based on observable inputs such as interest rates, yield curves, credit risks, spot and future commodity prices and spot and future exchange rates. There were no transfers between levels in the fair value hierarchy for the periods presented.
The fair value of short-term and long-term debt, including current maturities, was approximately $4.70 billion at December 31, 2016 ($4.44 billion at December 31, 2015). The debt fair value estimates are classified under Level 2 because such estimates are based on readily available market prices of our debt at December 31, 2016 and 2015, or similar debt with the same maturities, ratings and interest rates.
Disclosures are required for certain assets and liabilities that are measured at fair value, but are recognized and disclosed on a nonrecurring basis in periods subsequent to initial recognition. For Nucor, our equity investment in Duferdofin Nucor was measured at fair value as a result of the impairment recorded in 2015 (see Note 9).
15. CONTINGENCIES
Nucor is subject to environmental laws and regulations established by federal, state and local authorities and, accordingly, makes provisions for the estimated costs of compliance. Of the undiscounted total of $21.9 million of accrued environmental costs at December 31, 2016 ($21.1 million at December 31, 2015), $9.5 million was classified in accrued expenses and other current
liabilities ($9.7 million at December 31, 2015) and $12.4 million was classified in deferred credits and other liabilities ($11.4 million at December 31, 2015). Inherent uncertainties exist in these estimates primarily due to unknown conditions, evolving remediation technology and changing governmental regulations and legal standards.
Since 2008, Nucor has been a defendant, along with other major steel producers, in several related antitrust class-action proceedings filed by Standard Iron Works and other steel purchasers in the United States District Court for the Northern District of Illinois. The majority of these complaints were filed in September and October of 2008, with two additional complaints being filed in July and December of 2010. Two of these complaints were voluntarily dismissed and are no longer pending. The plaintiffs allege that from April 1, 2005 through December 31, 2007, eight steel manufacturers, including Nucor, engaged in anticompetitive activities with respect to the production and sale of steel. Nucor denies those allegations. The plaintiffs sought monetary and other relief on behalf of themselves and classes of direct and indirect purchasers of steel products from the defendants in the U.S. between April 1, 2005 and December 31, 2007.
On September 30, 2016, Nucor entered into an agreement to settle the claims of the class of direct purchasers of steel products for the amount of $23.4 million, which was paid during the fourth quarter of 2016. Nucor believes the plaintiffs’ claims are without merit and did not admit liability or the validity of the plaintiffs’ claims as part of the settlement, but entered into the settlement in order to avoid the burden, expense and distraction of further litigation. The settlement was subject to court approval. On November 3, 2016, the court granted preliminary approval of the settlement. Direct purchasers of steel products were given notice of the settlement and the opportunity to object to the settlement or to opt out as class members. No purchasers timely objected to the settlement, and only two purchasers filed notices of intent to opt out. On February 16, 2017, the Court granted final approval of the settlement. The settlement does not resolve claims asserted by a separate putative class of indirect purchasers of steel products. Nucor and other Defendants have moved to dismiss those indirect purchaser claims. We will continue to vigorously defend against the indirect purchasers’ claims and any other claims relating to these allegations. We cannot at this time predict the outcome of the remaining litigation or estimate the range of Nucor’s potential exposure (if any) and, consequently, have not recorded any reserves or contingencies related to the class of indirect purchasers.
We are from time to time a party to various other lawsuits, claims and legal proceedings that arise in the ordinary course of business. With respect to all such lawsuits, claims and proceedings, we record reserves when it is probable a liability has been incurred and the amount of loss can be reasonably estimated. We do not believe that any of these proceedings, individually or in the aggregate, would be expected to have a material adverse effect on our results of operations, financial position or cash flows. Nucor maintains liability insurance for certain risks that is subject to certain self-insurance limits.
16. STOCK-BASED COMPENSATION
Stock Options Stock options may be granted to Nucor’s key employees, officers andnon-employee directors with exercise prices at 100% of the market value on the date of the grant. The stock options granted are generally exercisable at the end of three years and have a term of 10 years. New shares are issued upon exercise of stock options.
A summary of activity under Nucor’s stock option plans is as follows:
| | | | | | | | | | | | | | | | | | | | | | | | |
Year Ended December 31, | | 2016 | | | 2015 | | | 2014 | |
| | | | | | Weighted- | | | | | | Weighted- | | | | | | Weighted- | |
| | | | | | Average | | | | | | Average | | | | | | Average | |
| | | | | | Exercise | | | | | | Exercise | | | | | | Exercise | |
| | | Shares | | | Price | | | Shares | | | Price | | | Shares | | | Price | |
Number of shares under option: | | | | | | | | | | | | | | | | | | | | | | | | |
Outstanding at beginning of year | | | 3,092 | | | | $43.51 | | | | 2,422 | | | | $42.39 | | | | 2,089 | | | | $40.47 | |
Granted | | | 899 | | | | $48.80 | | | | 700 | | | | $47.59 | | | | 469 | | | | $50.63 | |
Exercised | | | (400 | ) | | | $39.19 | | | | (10 | ) | | | $42.34 | | | | (136 | ) | | | $41.30 | |
Canceled | | | — | | | | — | | | | (20 | ) | | | $50.63 | | | | — | | | | — | |
Outstanding at end of year | | | 3,591 | | | | $45.32 | | | | 3,092 | | | | $43.51 | | | | 2,422 | | | | $42.39 | |
| | | | | | |
Options exercisable at end of year | | | 1,557 | | | | $40.80 | | | | 1,531 | | | | $39.35 | | | | 1,263 | | | | $40.40 | |
| | | | | | | | | | | | | | | | | | | | | | | | | |
The shares reserved for future grants as of December 31, 2016, 2015 and 2014 are reflected in the restricted stock units table below. The total intrinsic value of stock options (the amount by which the stock price exceeded the exercise price of the stock option on the date of exercise) that were exercised during 2016 was $6.8 million ($0.1 million in 2015 and $2.0 million in 2014).
The following table summarizes information about stock options outstanding at December 31, 2016:
| | | | | | | | | | |
| | | | | | | | | (shares in thousands) |
| | | Options Outstanding |
| | | Options | | | Options | | | Weighted-Average Remaining |
Exercise Price | | Outstanding | | | Exercisable | | | Contractual Life |
| | | |
$35.76 | | | 531 | | | | 531 | | | 5.4 years |
$42.34 | | | 520 | | | | 520 | | | 4.4 years |
$44.51 | | | 506 | | | | 506 | | | 6.4 years |
$47.59 | | | 700 | | | | — | | | 8.4 years |
$48.80 | | | 899 | | | | — | | | 9.4 years |
$50.63 | | | 435 | | | | — | | | 7.4 years |
$35.76 – $50.63 | | | 3,591 | | | | 1,557 | | | 7.2 years |
| | | | | | | | | | | |
As of December 31, 2016, the total aggregate intrinsic value of stock options outstanding and stock options exercisable was $51.0 million and $29.2 million, respectively.
The grant date fair value of stock options granted was $9.12 per share in 2016 ($11.71 per share in 2015 and $17.48 per share in 2014). The fair value was estimated using the Black-Scholes option-pricing model with the following assumptions:
| | | | | | | | | | | | |
| | | 2016 | | | 2015 | | | 2014 | |
| | | |
Exercise price | | | $48.80 | | | | $47.59 | | | | $50.63 | |
| | | |
Expected dividend yield | | | 3.07 | % | | | 3.13 | % | | | 2.92% | |
| | | |
Expected stock price volatility | | | 26.14 | % | | | 33.32 | % | | | 45.00% | |
| | | |
Risk-free interest rate | | | 1.67 | % | | | 1.86 | % | | | 2.03% | |
| | | |
Expected life (in years) | | | 6.5 | | | | 6.5 | | | | 6.5 | |
| | | | | | | | | | | | | |
Stock options granted to employees who are eligible for retirement on the date of grant are expensed immediately since these awards vest upon retirement from the Company. Retirement, for purposes of vesting in these stock options, means termination of employment after satisfying age and years of service requirements. Similarly, stock options granted to employees who will become retirement-eligible prior to the end of the vesting term are expensed over the period through which the employee will become retirement-eligible. Compensation expense for stock options granted to employees who are not retirement-eligible is recognized on a straight-line basis over the vesting period. Compensation expense for stock options was $7.8 million in 2016 ($7.4 million in 2015 and $7.7 million in 2014). As of December 31, 2016, unrecognized compensation expense related to stock options was $1.6 million, which is expected to be recognized over a weighted-average period of two years.
Restricted Stock UnitsNucor annually grants restricted stock units (RSUs) to key employees, officers andnon-employee directors. The RSUs typically vest and are converted to common stock in three equal installments on each of the first three anniversaries of the grant date. A portion of the RSUs awarded to an officer vest upon the officer’s retirement. Retirement, for purposes of vesting in these RSUs only, means termination of employment with approval of the Compensation and Executive Development Committee of the Board of Directors after satisfying age and years of service requirements. RSUs granted tonon-employee directors are fully vested on the grant date and are payable to thenon-employee director in the form of common stock after the termination of the director’s service on the Board of Directors.
RSUs granted to employees who are eligible for retirement on the date of grant are expensed immediately, and RSUs granted to employees who will become retirement-eligible prior to the end of the vesting term are expensed over the period through which the employee will become retirement-eligible since these awards vest upon retirement from the Company. Compensation expense for RSUs granted to employees who are not retirement-eligible is recognized on a straight-line basis over the vesting period.
Cash dividend equivalents are paid to holders of RSUs each quarter. Dividend equivalents paid on RSUs expected to vest are recognized as a reduction in retained earnings.
The fair value of the RSUs is determined based on the closing stock price of Nucor’s common stock on the date of the grant. A summary of Nucor’s RSU activity is as follows:
| | | | | | | | | | | | | | | | | | | | | | | | |
| | | | | | | | | | | | | | | (shares in thousands) | |
Year Ended December 31, | | 2016 | | | 2015 | | | 2014 | |
| | | | | | Grant Date | | | | | | Grant Date | | | | | | Grant Date | |
| | | Shares | | | Fair Value | | | Shares | | | Fair Value | | | Shares | | | Fair Value | |
| | | | | | |
Restricted stock units: | | | | | | | | | | | | | | | | | | | | | | | | |
Unvested at beginning of year | | | 1,031 | | | | $47.93 | | | | 1,012 | | | | $45.98 | | | | 1,122 | | | | $42.51 | |
Granted | | | 723 | | | | $48.80 | | | | 790 | | | | $47.59 | | | | 655 | | | | $50.63 | |
Vested | | | (681) | | | | $48.09 | | | | (756) | | | | $44.99 | | | | (752) | | | | $44.90 | |
Canceled | | | (33) | | | | $46.44 | | | | (15) | | | | $46.61 | | | | (13) | | | | $42.66 | |
Unvested at end of year | | | 1,040 | | | | $48.47 | | | | 1,031 | | | | $47.93 | | | | 1,012 | | | | $45.98 | |
| | | | | | |
Shares reserved for future grants (stock options and RSUs) | | | 8,706 | | | | | | | | 10,349 | | | | | | | | 11,851 | | | | | |
| | | | | | | | | | | | | | | | | | | | | | | | | |
Compensation expense for RSUs was $33.9 million in 2016 ($34.8 million in 2015 and $32.6 million in 2014). The total fair value of shares vested during 2016 was $33.4 million ($35.8 million in 2015 and $38.1 million in 2014). As of December 31, 2016, unrecognized compensation expense related to unvested RSUs was $31.1 million, which is expected to be recognized over a weighted-average period of 2.1 years.
Restricted Stock Awards Nucor’s Senior Officers Long-Term Incentive Plan (LTIP) and Annual Incentive Plan (AIP) authorize the award of shares of common stock to officers subject to certain conditions and restrictions.
The LTIP provides for the award of shares of restricted common stock at the end of each LTIP performance measurement period at no cost to officers if certain financial performance goals are met during the period.One-third of the LTIP restricted stock award vests upon each of the first three anniversaries of the award date or, if earlier, upon the officer’s attainment of age 55 while employed by Nucor. Although participants are entitled to cash dividends and may vote such awarded shares, the sale or transfer of such shares is limited during the restricted period.
The AIP provides for the payment of annual cash incentive awards. An AIP participant may elect, however, to defer payment of up toone-half of an annual incentive award. In such event, the deferred AIP award is converted into common stock units and credited with a deferral incentive, in the form of additional common stock units, equal to 25% of the number of common stock units attributable to the deferred AIP award. Common stock units attributable to deferred AIP awards are fully vested. Common stock units credited as a deferral incentive vest upon the AIP participant’s attainment of age 55 while employed by Nucor. Vested common stock units are paid to AIP participants in the form of shares of common stock following their termination of employment with Nucor.
| | | | | | | | | | | | | | | | | | | | |
A summary of Nucor’s restricted stock activity under the AIP and the LTIP is as follows: | | | | |
| | | | | | | | | | | | | | | | | | | | | | | | | | | | | | | | | | | | |
| | | (shares in thousands) | |
Year Ended December 31, | | | 2016 | | | | 2015 | | | | 2014 | |
| | | Shares | | | Grant Date
Fair Value | | | Shares | | | Grant Date
Fair Value | | | Shares | | | Grant Date
Fair Value | |
| | | | | | | | | |
Restricted stock awards and units: | | | | | | | | | | | | | | | | | | | | | | | | | | | | | | | | | | | | |
| | | | | | | | | |
Unvested at beginning of year | | | | | | | 63 | | | | $48.07 | | | | | | | | 65 | | | | $48.20 | | | | | | | | 73 | | | | $45.49 | |
| | | | | | | | | |
Granted | | | | | | | 123 | | | | $44.03 | | | | | | | | 136 | | | | $47.07 | | | | | | | | 127 | | | | $50.35 | |
| | | | | | | | | |
Vested | | | | | | | (116 | ) | | | $45.16 | | | | | | | | (138 | ) | | | $47.15 | | | | | | | | (135 | ) | | | $48.76 | |
| | | | | | | | | |
Canceled | | | | | | | (3 | ) | | | $45.75 | | | | | | | | — | | | | — | | | | | | | | — | | | | — | |
| | | | | | | | | | | | | | | | | | | | | | | | | | | | | | | | | | | | |
| | | | | | | | | |
Unvested at end of year | | | | | | | 67 | | | | $45.77 | | | | | | | | 63 | | | | $48.07 | | | | | | | | 65 | | | | $48.20 | |
| | | | | | | | | | | | | | | | | | | | | | | | | | | | | | | | | | | | |
| | | | | | | | | |
Shares reserved for future grants | | | | | | | 855 | | | | | | | | | | | | 975 | | | | | | | | | | | | 1,111 | | | | | |
| | | | | | | | | | | | | | | | | | | | | | | | | | | | | | | | | | | | |
| | | | | | | | | | | | | | | | | | | | | | | | | | | | | | | | | | | | | |
Compensation expense for common stock and common stock units awarded under the AIP and the LTIP is recorded over the performance measurement and vesting periods based on the anticipated number and market value of shares of common stock and common stock units to be awarded. Compensation expense for anticipated awards based upon Nucor’s financial performance, exclusive of amounts payable in cash, was $14.8 million in 2016 ($3.4 million in 2015 and $6.1 million in 2014). The total fair value of shares vested during 2016 was $5.2 million ($6.5 million in 2015 and $6.8 million in 2014). As of December 31, 2016, unrecognized compensation expense related to unvested restricted stock awards was $0.7 million, which is expected to be recognized over a weighted-average period of 1.6 years.
17. EMPLOYEE BENEFIT PLANS
Nucor makes contributions to a Profit Sharing and Retirement Savings Plan for qualified employees based on the profitability of the Company. Nucor’s expense for these benefits totaled $129.0 million in 2016 ($60.5 million in 2015 and $110.1 million in 2014). The related liability for these benefits is included in salaries, wages and related accruals in the consolidated balance sheets.
Nucor also has a medical plan covering certain eligible early retirees. The unfunded obligation, included in deferred credits and other liabilities in the consolidated balance sheets, totaled $20.4 million at December 31, 2016 ($15.6 million at December 31, 2015). The expense associated with this early retiree medical plan totaled $0.6 million in 2016 (expense of $1.1 million in 2015 and benefit of $0.6 million in 2014).
The discount rate used was 4.2% in 2016 (4.4% in 2015 and 3.8% in 2014). The health care cost increase trend rate used was 6.8% in 2016 (7.1% in 2015 and 6.5% in 2014). The health care cost increase in the trend rate is projected to decline gradually to 4.5% by 2037.
18. INTEREST EXPENSE (INCOME)
The components of net interest expense are as follows:
| | | | | | | | | | | | | | | | | | | | | | | | |
| | | | | | | | | | | | | | | | | | | (in thousands) | |
Year Ended December 31, | | | | | | | 2016 | | | | | | | | 2015 | | | | | | | | 2014 | |
| | | | | | |
Interest expense | | | | | | $ | 181,179 | | | | | | | $ | 177,543 | | | | | | | $ | 174,142 | |
| | | | | | |
Interest income | | | | | | | (11,935 | ) | | | | | | | (4,012 | ) | | | | | | | (4,886 | ) |
| | | | | | | | | | | | | | | | | | | | | | | | |
| | | | | | |
Interest expense, net | | | | | | $ | 169,244 | | | | | | | $ | 173,531 | | | | | | | $ | 169,256 | |
| | | | | | | | | | | | | | | | | | | | | | | | |
| | | | | | |
| | | | | | | | | | | | | | | | | | | | | | | | | |
Interest paid was $183.4 million in 2016 ($180.0 million in 2015 and $180.5 million in 2014).
19. INCOME TAXES
Components of earnings (losses) from continuing operations before income taxes and noncontrolling interests are as follows:
| | | | | | |
| | | | | | (in thousands) |
| | | |
Year Ended December 31, | | 2016 | | 2015 | | 2014 |
| | | |
United States | | $ 1,241,117 | | $ 407,666 | | $ 1,104,664 |
Foreign | | 57,542 | | (165,800) | | 42,624 |
| | | $ 1,298,659 | | $ 241,866 | | $ 1,147,288 |
The provision for income taxes consists of the following:
| | | | | | |
| | | | | | (in thousands) |
| | | |
Year Ended December 31, | | 2016 | | 2015 | | 2014 |
| | | |
Current: | | | | | | |
Federal | | $ 286,224 | | $ 285,856 | | $ 247,898 |
State | | 27,353 | | 4,618 | | 30,790 |
Foreign | | 13,211 | | 5,198 | | 19,235 |
Total current | | 326,788 | | 295,672 | | 297,923 |
| | | |
Deferred: | | | | | | |
Federal | | 71,777 | | (213,601) | | 76,356 |
State | | 5,193 | | (21,240) | | 2,530 |
Foreign | | (5,515) | | (11,995) | | (8,085) |
Total deferred | | 71,455 | | (246,836) | | 70,801 |
| | | |
Total provision for income taxes | | $ 398,243 | | $ 48,836 | | $ 368,724 |
A reconciliation of the federal statutory tax rate (35%) to the total provision is as follows:
| | | | | | |
| | | |
Year Ended December 31, | | 2016 | | 2015 | | 2014 |
| | | |
Taxes computed at statutory rate | | 35.00% | | 35.00% | | 35.00% |
| | | |
State income taxes, net of federal income tax benefit | | 1.67% | | -5.02% | | 3.40% |
| | | |
Federal research credit | | -0.28% | | -1.47% | | -0.28% |
| | | |
Domestic manufacturing deduction | | -2.11% | | -9.98% | | -2.39% |
| | | |
Equity in losses of foreign joint venture | | 0.27% | | 2.88% | | 0.89% |
| | | |
Impairment on investment in foreign joint venture | | — | | 22.14% | | — |
| | | |
Foreign rate differential | | -1.05% | | -5.04% | | -0.97% |
| | | |
Noncontrolling interests | | -2.81% | | -16.27% | | -3.03% |
| | | |
Out-of-period correction | | -0.22% | | -4.02% | | -1.15% |
| | | |
Other, net | | 0.20% | | 1.97% | | 0.67% |
| | | |
Provision for income taxes | | 30.67% | | 20.19% | | 32.14% |
The 2015 and 2014 provisions includedout-of-periodnon-cash gains related to corrections to tax balances of $9.7 million and $13.2 million, respectively. Theseout-of-period adjustments were not material to the period of correction or any previously reported periods.
Deferred tax assets and liabilities resulted from the following:
| | | | |
| | | | (in thousands) |
| | |
December 31, | | 2016 | | 2015 |
| | |
Deferred tax assets: | | | | |
Accrued liabilities and reserves | | $ 195,787 | | $ 209,854 |
Allowance for doubtful accounts | | 15,511 | | 12,912 |
Inventory | | 75,550 | | 172,638 |
Post-retirement benefits | | 12,163 | | 9,773 |
Commodity hedges | | — | | 7,149 |
Net operating loss carryforward | | 11,544 | | 14,690 |
Tax credit carryforwards | | 18,358 | | 19,601 |
Total deferred tax assets | | 328,913 | | 446,617 |
| | |
Deferred tax liabilities: | | | | |
Holdbacks and amounts not due under contracts | | (9,999) | | (10,479) |
Commodity hedges | | (316) | | — |
Cumulative translation adjustments | | — | | (3,325) |
Intangibles | | (246,697) | | (244,496) |
Property, plant and equipment | | (630,500) | | (673,676) |
Total deferred tax liabilities | | (887,512) | | (931,976) |
| | |
Total net deferred tax liabilities | | $(558,599) | | $(485,359) |
Non-current deferred tax liabilities included in deferred credits and other liabilities were $558.6 million at December 31, 2016 ($485.4 million at December 31, 2015). Nucor paid $329.3 million in net federal, state and foreign income taxes in 2016 ($260.3 million and $398.7 million in 2015 and 2014, respectively).
Cumulative undistributed foreign earnings for which U.S. taxes have not been provided are included in consolidated retained earnings in the amount of $190.1 million at December 31, 2016 ($169.6 million at December 31, 2015). These earnings are considered to be indefinitely reinvested and, accordingly, no provisions for U.S. federal and state income taxes are required. It is not practicable to determine the amount of unrecognized deferred tax liability related to the unremitted earnings.
State net operating loss carryforwards were $573.4 million at December 31, 2016 ($487.9 million at December 31, 2015). If unused, they will expire between 2017 and 2036. Foreign net operating loss carryforwards were $18.5 million at December 31, 2016 ($22.3 million at December 31, 2015). If unused, they will expire between 2028 and 2036.
At December 31, 2016, Nucor had approximately $44.1 million of unrecognized tax benefits, of which $43.4 million would affect Nucor’s effective tax rate, if recognized. At December 31, 2015, Nucor had approximately $50.5 million of unrecognized tax benefits, of which $49.8 million would affect Nucor’s effective tax rate, if recognized.
A reconciliation of the beginning and ending amounts of unrecognized tax benefits recorded in deferred credits and other liabilities is as follows:
| | | | | | | | | | | | |
| | | (in thousands) | |
| | | |
Year Ended December 31, | | 2016 | | | 2015 | | | 2014 | |
| | | |
Balance at beginning of year | | $ | 50,510 | | | $ | 63,001 | | | $ | 65,975 | |
Additions based on tax positions related to current year | | | 6,157 | | | | 6,508 | | | | 6,295 | |
Reductions based on tax positions related to current year | | | — | | | | — | | | | — | |
Additions based on tax positions related to prior years | | | 147 | | | | 241 | | | | 5,673 | |
Reductions based on tax positions related to prior years | | | (8,201 | ) | | | (13,294 | ) | | | (7,449 | ) |
(Reductions) additions due to settlements with taxing authorities | | | (258 | ) | | | 930 | | | | — | |
Reductions due to statute of limitations lapse | | | (4,267 | ) | | | (6,876 | ) | | | (7,493 | ) |
| | | | | | | | | | | | |
| | | |
Balance at end of year | | $ | 44,088 | | | $ | 50,510 | | | $ | 63,001 | |
| | | | | | | | | | | | |
| | | |
| | | | | | | | | | | | | |
We estimate that in the next twelve months, our gross uncertain tax positions, exclusive of interest, could decrease by as much as $8.6 million, as a result of the expiration of the statute of limitations.
During 2016, Nucor recognized $2.8 million of benefit in interest and penalties ($7.0 million of benefit in 2015 and $9.0 million of benefit in 2014). The interest and penalties are included in interest expense and other expenses, respectively, in the consolidated statements of earnings. As of December 31, 2016, Nucor had approximately $18.4 million of accrued interest and penalties related to uncertain tax positions on the consolidated balance sheet (approximately $21.2 million at December 31, 2015).
Nucor has concluded U.S. federal income tax matters for years through 2012. The tax years 2013 through 2015 remain open to examination by the Internal Revenue Service. The Canada Revenue Agency has substantially concluded its examination of the 2012 Canadian returns for Harris Steel Group Inc. and certain related affiliates and is now examining the 2013 Canadian returns. The tax years 2009 through 2015 remain open to examination by other major taxing jurisdictions to which Nucor is subject (primarily Canada and other state and local jurisdictions).
20. ACCUMULATED OTHER COMPREHENSIVE INCOME (LOSS)
The following tables reflect the changes in accumulated other comprehensive income (loss) by component:
| | | | | | | | | | | | | | | | |
| | | (in thousands) | |
| | | | |
| | | Gains and Losses
on Hedging
Derivatives | | | Foreign Currency
Gain (Loss) | | | Adjustment to
Early Retiree
Medical Plan | | | Total | |
| | | | |
December 31, 2015 | | | $ (11,700 | ) | | | $ (351,665 | ) | | | $ 12,003 | | | | $ (351,362 | ) |
Other comprehensive income (loss) before reclassifications | | | 2,570 | | | | 25,495 | | | | (3,589 | ) | | | 24,476 | |
Amounts reclassified from accumulated other comprehensive (loss) income into earnings(1) | | | 9,880 | | | | — | | | | (837 | ) | | | 9,043 | |
Net current-period other comprehensive (loss) income | | | 12,450 | | | | 25,495 | | | | (4,426 | ) | | | 33,519 | |
| | | | |
December 31, 2016 | | | $ 750 | | | | $ (326,170 | ) | | | $ 7,577 | | | | $ (317,843 | ) |
| | | | |
| | | | | | | | | | | | | | | | | |
| (1) | Includes $9,880 and ($837)net-of-tax impact of accumulated other comprehensive income reclassifications into cost of products sold for net losses on commodity contracts and adjustment to early retiree medical plan, respectively. The tax impacts of these reclassifications were $5,800 and ($309), respectively. |
| | | | | | | | | | | | | | | | | | | | | | | | | | | | | | | | |
| | | | | | | | | | | | | | | | | | | | | (in thousands) | |
| | | Gains and Losses
on Hedging
Derivatives | | | Foreign Currency
Gain (Loss) | | | Adjustment to
Early Retiree
Medical Plan | | | Total | |
December 31, 2014 | | | | | | $ | (8,000 | ) | | | | | | $ | (148,968 | ) | | | | | | $ | 11,260 | | | | | | | $ | (145,708 | ) |
| | | | | | | | |
Other comprehensive income (loss) before reclassifications | | | | | | | (9,498 | ) | | | | | | | (205,397 | ) | | | | | | | 1,485 | | | | | | | | (213,410 | ) |
| | | | | | | | |
Amounts reclassified from accumulated other comprehensive (loss) income into earnings(2) | | | | | | | 5,798 | | | | | | | | 2,700 | | | | | | | | (742 | ) | | | | | | | 7,756 | |
| | | | | | | | | | | | | | | | | | | | | | | | | | | | | | | | |
| | | | | | | | |
Net current-period other comprehensive (loss) income | | | | | | | (3,700 | ) | | | | | | | (202,697 | ) | | | | | | | 743 | | | | | | | | (205,654 | ) |
| | | | | | | | | | | | | | | | | | | | | | | | | | | | | | | | |
| | | | | | | | |
December 31, 2015 | | | | | | $ | (11,700 | ) | | | | | | $ | (351,665 | ) | | | | | | $ | 12,003 | | | | | | | $ | (351,362 | ) |
| | | | | | | | | | | | | | | | | | | | | | | | | | | | | | | | |
| | | | | | | | | | | | | | | | | | | | | | | | | | | | | | | | | |
| (2) | Includes $5,798 and ($742)net-of-tax impact of accumulated other comprehensive income reclassifications into cost of products sold for net losses on commodity contracts and adjustment to early retiree medical plan, respectively. The tax impacts of these reclassifications were $3,500 and ($414), respectively. Also includes $2,700 of accumulated other comprehensive income reclassification into marketing, administrative and other expenses for net losses on translation. The tax impact of this reclassification was $1,500. |
21. EARNINGS PER SHARE
The computations of basic and diluted net earnings per share are as follows:
| | | | | | | | | | | | |
| | | (in thousands, except per share data) | |
| Year Ended December 31, | | 2016 | | | 2015 | | | 2014 | |
| | | |
Basic net earnings per share: | | | | | | | | | | | | |
Basic net earnings | | $ | 796,271 | | | $ | 80,724 | | | $ | 679,337 | |
Earnings allocated to participating securities | | | (2,632 | ) | | | (1,514 | ) | | | (2,321 | ) |
| | | | | | | | | | | | |
Net earnings available to common stockholders | | $ | 793,639 | | | $ | 79,210 | | | $ | 677,016 | |
| | | | | | | | | | | | |
| | | |
Average shares outstanding | | | 319,563 | | | | 320,565 | | | | 319,838 | |
| | | | | | | | | | | | |
| | | |
Basic net earnings per share | | $ | 2.48 | | | $ | 0.25 | | | $ | 2.12 | |
| | | | | | | | | | | | |
| | | |
Diluted net earnings per share: | | | | | | | | | | | | |
Diluted net earnings | | $ | 796,271 | | | $ | 80,724 | | | $ | 679,337 | |
Earnings allocated to participating securities | | | (2,631 | ) | | | (1,514 | ) | | | (2,321 | ) |
| | | | | | | | | | | | |
Net earnings available to common stockholders | | $ | 793,640 | | | $ | 79,210 | | | $ | 677,016 | |
| | | | | | | | | | | | |
| | | |
Diluted average shares outstanding: | | | | | | | | | | | | |
Basic shares outstanding | | | 319,563 | | | | 320,565 | | | | 319,838 | |
Dilutive effect of stock options and other | | | 259 | | | | 114 | | | | 289 | |
| | | | | | | | | | | | |
| | | 319,822 | | | | 320,679 | | | | 320,127 | |
Diluted net earnings per share | | $ | 2.48 | | | $ | 0.25 | | | $ | 2.11 | |
| | | | | | | | | | | | |
| | | | | | | | | | | | | |
The following stock options were excluded from the computation of diluted net earnings per share because their effect would have been anti-dilutive:
| | | | | | |
| | | | (shares in thousands) |
| | | |
Year Ended December 31, | | 2016 | | 2015 | | 2014 |
| | | |
Anti-dilutive stock options: | | | | | | |
Weighted-average shares | | 942 | | 1,226 | | — |
| | | |
Weighted-average exercise price | | $47.04 | | $47.20 | | $ — |
22. SEGMENTS
Nucor reports its results in the following segments: steel mills, steel products and raw materials. The steel mills segment includes carbon and alloy steel in sheet, bars, structural and plate; steel foundation distributors; tubular products businesses; steel trading businesses; rebar distribution businesses; and Nucor’s equity method investments in Duferdofin Nucor and NuMit. The steel products segment includes steel joists and joist girders, steel deck, fabricated concrete reinforcing steel, cold finished steel, steel fasteners, metal building systems, steel grating and wire and wire mesh. The raw materials segment includes The David J. Joseph Company and its affiliates (DJJ), primarily a scrap broker and processor;Nu-Iron Unlimited and Nucor Steel Louisiana, two facilities that produce Direct Reduced Iron (DRI) used by the steel mills; our natural gas production operations; and Nucor’s equity method investment in Hunter Ridge. Nucor sold its 50% interest in Hunter Ridge during the third quarter of 2016. The steel mills, steel products and raw materials segments are consistent with the way Nucor manages its business, which is primarily based upon the similarity of the types of products produced and sold by each segment.
Net interest expense, other income, profit sharing expense and stock-based compensation are shown under Corporate/eliminations. Corporate assets primarily include cash and cash equivalents, short-term investments, allowances to eliminate intercompany profit in inventory, deferred income tax assets, federal and state income taxes receivable and investments in and advances to affiliates. The balance of Corporate assets at December 31, 2015 and 2014 was adjusted due to the adoption of new accounting guidance requiring the reclassification of debt issuance costs into liabilities in the first quarter of 2016 (see Note 2). The balance of Corporate assets and earnings (loss) before income taxes and noncontrolling interests as of and for the periods ending December 31, 2015 and 2014 was adjusted due to the change in accounting principle from LIFO to FIFO for certain inventories (see Note 2), as previously the impact of LIFO was recognized in Corporate/eliminations consistent with our internal reporting.
Nucor’s results by segment are as follows:
| | | | | | | | | | | | | | | | | | | | | | | | |
| | | | | | | | | | | | | | | | | | (in thousands) | |
Year Ended December 31, | | | | | 2016 | | | | | | 2015 | | | | | | 2014 | |
| | | | | | |
Net sales to external customers: | | | | | | | | | | | | | | | | | | | | | | | | |
Steel mills | | | | | | $ | 11,312,048 | | | | | | | $ | 11,084,331 | | | | | | | $ | 14,723,642 | |
Steel products | | | | | | | 3,687,448 | | | | | | | | 3,966,895 | | | | | | | | 4,032,385 | |
Raw materials | | | | | | | 1,208,626 | | | | | | | | 1,388,050 | | | | | | | | 2,349,114 | |
| | | | | | | | | | | | | | | | | | | | | | | | |
| | | | | | $ | 16,208,122 | | | | | | | $ | 16,439,276 | | | | | | | $ | 21,105,141 | |
| | | | | | | | | | | | | | | | | | | | | | | | |
| | | | | | |
Intercompany sales: | | | | | | | | | | | | | | | | | | | | | | | | |
Steel mills | | | | | | $ | 2,070,077 | | | | | | | $ | 2,152,157 | | | | | | | $ | 2,904,317 | |
Steel products | | | | | | | 106,838 | | | | | | | | 90,969 | | | | | | | | 105,383 | |
Raw materials | | | | | | | 5,997,498 | | | | | | | | 6,279,316 | | | | | | | | 9,618,145 | |
Corporate/eliminations | | | | | | | (8,174,413 | ) | | | | | | | (8,522,442 | ) | | | | | | | (12,627,845 | ) |
| | | | | | | | | | | | | | | | | | | | | | | | |
| | | | | | $ | — | | | | | | | $ | — | | | | | | | $ | — | |
| | | | | | | | | | | | | | | | | | | | | | | | |
| | | | | | |
Depreciation expense: | | | | | | | | | | | | | | | | | | | | | | | | |
Steel mills | | | | | | $ | 377,627 | | | | | | | $ | 381,352 | | | | | | | $ | 366,568 | |
Steel products | | | | | | | 36,906 | | | | | | | | 39,512 | | | | | | | | 42,777 | |
Raw materials | | | | | | | 191,466 | | | | | | | | 198,705 | | | | | | | | 235,443 | |
Corporate | | | | | | | 7,193 | | | | | | | | 6,188 | | | | | | | | 7,212 | |
| | | | | | | | | | | | | | | | | | | | | | | | |
| | | | | | $ | 613,192 | | | | | | | $ | 625,757 | | | | | | | $ | 652,000 | |
| | | | | | | | | | | | | | | | | | | | | | | | |
| | | | | | |
Amortization expense: | | | | | | | | | | | | | | | | | | | | | | | | |
Steel mills | | | | | | $ | 22,479 | | | | | | | $ | 18,789 | | | | | | | $ | 15,269 | |
Steel products | | | | | | | 21,998 | | | | | | | | 23,932 | | | | | | | | 27,644 | |
Raw materials | | | | | | | 29,385 | | | | | | | | 31,539 | | | | | | | | 29,510 | |
| | | | | | | | | | | | | | | | | | | | | | | | |
| | | | | | $ | 73,862 | | | | | | | $ | 74,260 | | | | | | | $ | 72,423 | |
| | | | | | | | | | | | | | | | | | | | | | | | |
| | | | | | |
Earnings (loss) before income taxes and noncontrolling interests: | | | | | | | | | | | | | | | | | | | | | | | | |
Steel mills | | | | | | $ | 1,724,168 | | | | | | | $ | 629,256 | | | | | | | $ | 1,594,352 | |
Steel products | | | | | | | 249,970 | | | | | | | | 276,048 | | | | | | | | 166,323 | |
Raw materials | | | | | | | (95,121 | ) | | | | | | | (283,938 | ) | | | | | | | (29,053 | ) |
Corporate/eliminations | | | | | | | (580,358 | ) | | | | | | | (379,500 | ) | | | | | | | (584,334 | ) |
| | | | | | | | | | | | | | | | | | | | | | | | |
| | | | | | $ | 1,298,659 | | | | | | | $ | 241,866 | | | | | | | $ | 1,147,288 | |
| | | | | | | | | | | | | | | | | | | | | | | | |
| | | | | | |
Segment assets: | | | | | | | | | | | | | | | | | | | | | | | | |
Steel mills | | | | | | $ | 8,084,773 | | | | | | | $ | 7,318,169 | | | | | | | $ | 8,528,623 | |
Steel products | | | | | | | 2,544,344 | | | | | | | | 2,485,122 | | | | | | | | 2,731,320 | |
Raw materials | | | | | | | 3,235,237 | | | | | | | | 3,123,190 | | | | | | | | 3,858,254 | |
Corporate/eliminations | | | | | | | 1,359,164 | | | | | | | | 1,400,488 | | | | | | | | 838,270 | |
| | | | | | | | | | | | | | | | | | | | | | | | |
| | | | | | $ | 15,223,518 | | | | | | | $ | 14,326,969 | | | | | | | $ | 15,956,467 | |
| | | | | | | | | | | | | | | | | | | | | | | | |
| | | | | | |
Capital expenditures: | | | | | | | | | | | | | | | | | | | | | | | | |
Steel mills | | | | | | $ | 375,996 | | | | | | | $ | 248,532 | | | | | | | $ | 343,767 | |
Steel products | | | | | | | 30,698 | | | | | | | | 41,291 | | | | | | | | 27,262 | |
Raw materials | | | | | | | 194,112 | | | | | | | | 74,607 | | | | | | | | 197,252 | |
Corporate | | | | | | | 16,871 | | | | | | | | 338 | | | | | | | | 586 | |
| | | | | | | | | | | | | | | | | | | | | | | | |
| | | | | | $ | 617,677 | | | | | | | $ | 364,768 | | | | | | | $ | 568,867 | |
| | | | | | | | | | | | | | | | | | | | | | | | |
| | | | | | | | | | | | | | | | | | | | | | | | | |
Net sales by product were as follows. Further product group breakdown is impracticable.
| | | | | | | | | | | | | | | | | | | | | | | | | | | | |
| | | | | | | | | | | | | | | | | | (in thousands) | | | | |
| Year Ended December 31, | | | | | 2016 | | | | | | 2015 | | | | | | 2014 | | | | |
| | | | | | | |
Net sales to external customers: | | | | | | | | | | | | | | | | | | | | | | | | | | | | |
Sheet | | | | | | $ | 5,178,467 | | | | | | | $ | 4,628,805 | | | | | | | $ | 5,988,303 | | | | | |
Bar | | | | | | | 2,886,648 | | | | | | | | 3,005,450 | | | | | | | | 4,051,171 | | | | | |
Structural | | | | | | | 1,982,642 | | | | | | | | 2,137,413 | | | | | | | | 2,617,196 | | | | | |
Plate | | | | | | | 1,204,185 | | | | | | | | 1,312,663 | | | | | | | | 2,066,972 | | | | | |
Tubular products | | | | | | | 60,106 | | | | | | | | — | | | | | | | | — | | | | | |
Steel products | | | | | | | 3,687,448 | | | | | | | | 3,966,895 | | | | | | | | 4,032,385 | | | | | |
Raw materials | | | | | | | 1,208,626 | | | | | | | | 1,388,050 | | | | | | | | 2,349,114 | | | | | |
| | | | | | | | | | | | | | | | | | | | | | | | | | | | |
| | | | | | $ | 16,208,122 | | | | | | | $ | 16,439,276 | | | | | | | $ | 21,105,141 | | | | | |
| | | | | | | | | | | | | | | | | | | | | | | | | | | | |
| | | | | | | | | | | | | | | | | | | | | | | | | | | | | |
23. SUBSEQUENT EVENTS
On January 9, 2017, Nucor used cash on hand to acquire Southland Tube for a purchase price of approximately $130 million. Southland Tube is a manufacturer of HSS tubing, which is primarily used in nonresidential construction markets. Southland Tube had shipments of approximately 240,000 tons in 2016 and has one manufacturing facility in Birmingham, Alabama.
Nucor further expanded its value-added product offerings to its customers within the pipe and tube market through the January 20, 2017 acquisition of Republic Conduit for a purchase price of approximately $335 million. Republic Conduit produces steel electrical conduit primarily used to protect and route electrical wiring in various nonresidential structures such as hospitals, office buildings and stadiums. With its two facilities located in Kentucky and Georgia, Republic Conduit’s annual shipment volume has averaged 146,000 tons during the past two years.
24. QUARTERLY INFORMATION (UNAUDITED)
| | | | | | | | | | | | | | | | |
| | | | | | | | | | | | | (in thousands, except per share data) |
| | | | | | | | | | | | | | | | | | |
Year Ended December 31, | | First Quarter | | | Second Quarter | | | Third Quarter | | | Fourth Quarter | | | |
| | | | | |
2016 | | | | | | | | | | | | | | | | | | |
| | | | | |
Net sales | | | $3,715,576 | | | | $4,245,772 | | | | $4,290,236 | | | | $3,956,538 | | | |
| | | | | |
Gross margin(1) | | | 314,985 | | | | 585,260 | | | | 682,236 | | | | 443,426 | | | |
| | | | | |
Net earnings (loss)(2) | | | 122,497 | | | | 271,369 | | | | 331,365 | | | | 175,185 | | | |
| | | | | |
Net earnings (loss) attributable to Nucor stockholders(2) | | | 87,565 | | | | 243,620 | | | | 305,447 | | | | 159,639 | | | |
| | | | | |
Net earnings (loss) per share: | | | | | | | | | | | | | | | | | | |
Basic | | | $0.27 | | | | $0.76 | | | | $0.95 | | | | $0.50 | | | |
Diluted | | | $0.27 | | | | $0.76 | | | | $0.95 | | | | $0.50 | | | |
| | | | | | | | | | | | | | | | | | | |
| | | | | |
2015 | | | | | | | | | | | | | | | | | | |
| | | | | |
Net sales | | | $4,399,440 | | | | $4,357,609 | | | | $4,225,514 | | | | $3,456,713 | | | |
| | | | | |
Gross margin | | | 271,036 | | | | 291,552 | | | | 383,207 | | | | 168,095 | | | |
| | | | | |
Net earnings (loss)(3) | | | 72,764 | | | | 98,282 | | | | 177,090 | | | | (155,106 | ) | | |
| | | | | |
Net earnings (loss) attributable to Nucor stockholders(3) | | | 58,232 | | | | 67,613 | | | | 142,360 | | | | (187,481 | ) | | |
| | | | | |
Net earnings (loss) per share: | | | | | | | | | | | | | | | | | | |
Basic | | | $0.18 | | | | $0.21 | | | | $0.44 | | | | $(0.59 | ) | | |
Diluted | | | $0.18 | | | | $0.21 | | | | $0.44 | | | | $(0.59 | ) | | |
| | | | | | | | | | | | | | | | | | | |
| | | | |
| (1) | | Fourth quarter results include a benefit of $83.0 million related to the effects of a change in estimate related to the cost of certain inventories. | | |
| (2) | | First quarter results includeout-of-periodnon-cash gains totaling $13.4 million related to a noncontrolling interest adjustment and to tax adjustments. Third quarter results were impacted by charges related to legal settlements of $33.7 million and a net benefit of $11.1 million related to fair value adjustments to assets in the Corporate/eliminations segment. | | |
| (3) | | Second quarter results include a $9.3 million benefit related to state tax credits. Third quarter results were impacted by anout-of-periodnon-cash gain of $10.2 million related to a correction of deferred tax balances. Fourth quarter results were impacted by a $153.0 million impairment charge related to our Duferdofin Nucor S.r.l. joint venture and an $84.1 millionpre-tax impairment charge on assets related to the blast furnace project at the St. James Parish site. | | |
The following tables show quarterly information reflecting the effect of the change in inventory valuation method from LIFO to FIFO. Refer to Note 2 for more information related to the change in accounting principle the Company made in the fourth quarter of 2016.
| | | | | | | | |
| | | | | | | (in thousands, except per share data) |
Year Ended December 31, 2016 | | FIRST QUARTER | | SECOND QUARTER | | THIRD QUARTER | | FOURTH QUARTER |
Gross margin using previous inventory valuation method (LIFO) | | $286,948 | | $566,260 | | $624,336 | | $407,028 |
| | | | |
Effect of change | | 28,037 | | 19,000 | | 57,900 | | 36,398 |
| | | | |
Gross margin using current inventory valuation method (FIFO) | | | | | | | | |
| | $314,985 | | $585,260 | | $682,236 | | $443,426 |
| | | | | | | | |
| | | | | | | | |
Net earnings using previous inventory valuation method (LIFO) | | $104,461 | | $258,336 | | $294,484 | | $153,023 |
| | | | |
Effect of change | | 18,036 | | 13,033 | | 36,881 | | 22,162 |
| | | | |
Net earnings using current inventory valuation method (FIFO) | | | | | | | | |
| | $122,497 | | $271,369 | | $331,365 | | $175,185 |
| | | | | | | | |
Net earnings attributable to | | | | | | | | |
Nucor stockholders using previous inventory valuation method (LIFO) | | $ 70,754 | | $233,772 | | $270,036 | | $136,242 |
| | | | |
Effect of change | | 16,811 | | 9,848 | | 35,411 | | 23,397 |
| | | | |
Net earnings attributable to Nucor stockholders using current inventory valuation method (FIFO) | | | | | | | | |
| | | | | | | | |
| | $ 87,565 | | $243,620 | | $305,447 | | $159,639 |
| | | | | | | | |
Basic net earnings per share using previous inventory valuation method (LIFO) | | $0.22 | | $0.73 | | $0.84 | | $0.42 |
| | | | |
Effect of change | | $0.05 | | $0.03 | | $0.11 | | $0.08 |
| | | | |
Basic net earnings per share using current inventory valuation method (FIFO) | | $0.27 | | $0.76 | | $0.95 | | $0.50 |
| | | | | | | | | |
Diluted net earnings per share using previous inventory valuation method (LIFO) | | $0.22 | | $0.73 | | $0.84 | | $0.42 |
| | | | |
Effect of change | | $0.05 | | $0.03 | | $0.11 | | $0.08 |
| | | | |
Diluted net earnings per share using current inventory valuation method (FIFO) | | $0.27 | | $0.76 | | $0.95 | | $0.50 |
| | | | | | | | | |
| | | | | | | | |
| | | | | | (in thousands, except per share data) |
Year Ended December 31, 2015 | | FIRST QUARTER | | SECOND QUARTER | | THIRD QUARTER | | FOURTH QUARTER |
Gross margin using previous inventory
valuation method (LIFO) | | $288,282 | | $386,306 | | $523,836 | | $ 382,838 |
| | | | |
Effect of change | | (17,246) | | (94,754) | | (140,629) | | (214,743) |
| | | | |
Gross margin using current | | | | | | | | |
inventory valuation method (FIFO) | | $271,036 | | $291,552 | | $383,207 | | $ 168,095 |
| | | | | | | | | |
Net earnings (loss) using previous inventory valuation method (LIFO) | | $ 84,292 | | $159,344 | | $267,736 | | $ (15,288) |
| | | | |
Effect of change | | (11,528) | | (61,062) | | (90,646) | | (139,818) |
| | | | |
Net earnings (loss) using current inventory valuation method (FIFO) | | $ 72,764 | | $ 98,282 | | $177,090 | | $(155,106) |
| | | | | | | | | |
Net earnings (loss) attributable to | | | | | | | | |
Nucor stockholders using previous
inventory valuation method (LIFO) | | $ 67,800 | | $124,755 | | $227,126 | | $ (62,022) |
| | | | |
Effect of change | | (9,568) | | (57,142) | | (84,766) | | (125,459) |
| | | | |
Net earnings (loss) attributable to | | | | | | | | |
Nucor stockholders using current
inventory valuation method (FIFO) | | $ 58,232 | | $ 67,613 | | $142,360 | | $(187,481) |
| | | | | | | | | |
Basic net earnings (loss) per share using previous inventory
valuation method (LIFO) | | $0.21 | | $0.39 | | $0.71 | | $(0.19) |
| | | | |
Effect of change | | $(0.03) | | $(0.18) | | $(0.27) | | $(0.40) |
| | | | |
Basic net earnings (loss) per share using current inventory valuation
method (FIFO) | | $0.18 | | $0.21 | | $0.44 | | $(0.59) |
. | | | | | | | | |
Diluted net earnings (loss) per share using
previous inventory valuation method
(LIFO) | | $0.21 | | $0.39 | | $0.71 | | $(0.19) |
| | | | |
Effect of change | | $(0.03) | | $(0.18) | | $(0.27) | | $(0.40) |
| | | | |
Diluted net earnings (loss) per share using
current inventory valuation method
(FIFO) | | $0.18 | | $0.21 | | $0.44 | | $(0.59) |
| | | | | | | | | |
| | | | |
86 | | | | CORPORATE AND STOCK DATA |
|
CORPORATE OFFICE 1915 Rexford Road Charlotte, North Carolina 28211 Phone704/366-7000 Fax704/362-4208 STOCK TRANSFERS DIVIDEND DISBURSING DIVIDEND REINVESTMENT American Stock Transfer & Trust Company, LLC 6201 15th Avenue Brooklyn, New York 11219 Phone877/715-0504 Fax718/236-2641 ANNUAL MEETING The annual meeting of stockholders will be held at 10:00 a.m. on Thursday, May 11, 2017 at the Charlotte Marriott SouthPark, 2200 Rexford Road, Charlotte, NC 28211. STOCK LISTING Nucor’s common stock is traded on the New York Stock Exchange under the symbol NUE. As of January 31, 2017, there were approximately 16,000 stockholders of record. FORM10-K A copy of Nucor’s 2016 annual report filed with the Securities and Exchange Commission (SEC) on Form10-K is available to stockholders without charge upon request. INTERNET ACCESS Nucor’s annual report on Form10-K, quarterly reports on Form10-Q, current reports on Form8-K and all amendments to these reports are available without charge through Nucor’s website,www.nucor.com, as soon as reasonably practicable after Nucor files these reports electronically with or furnishes them to the SEC. Additional information available on our website includes our Corporate Governance Principles, Board of Directors Committee Charters, Standards of Business Conduct and Ethics and Code of Ethics for Senior Financial Professionals as well as various other financial and statistical data. |
STOCK PRICE AND DIVIDENDS PAID
| | | | | | | | |
| | | First | | Second | | Third | | Fourth |
| | | Quarter | | Quarter | | Quarter | | Quarter |
| | | | |
2016 | | | | | | | | |
| | | | |
Stock price: | | | | | | | | |
| | | | |
High | | $48.52 | | $51.99 | | $57.08 | | $68.00 |
| | | | |
Low | | 33.90 | | 45.32 | | 44.81 | | 45.30 |
| | | | |
Dividends paid | | 0.3750 | | 0.3750 | | 0.3750 | | 0.3750 |
| | | | |
2015 | | | | | | | | |
| | | | |
Stock price: | | | | | | | | |
| | | | |
High | | $49.48 | | $50.70 | | $47.00 | | $43.93 |
| | | | |
Low | | 42.93 | | 43.67 | | 36.76 | | 37.67 |
| | | | |
Dividends paid | | 0.3725 | | 0.3725 | | 0.3725 | | 0.3725 |
STOCK PERFORMANCE
This graphic comparison assumes the investment of $100 in Nucor Corporation common stock, $100 in the S&P 500 Index and $100 in the S&P 1500 Steel Group Index, all at the year end 2011. The resulting cumulative total return assumes that cash dividends were reinvested. Nucor common stock comprised 36% of the S&P 1500 Steel Group Index at year end 2016 (29% at year end in 2011).
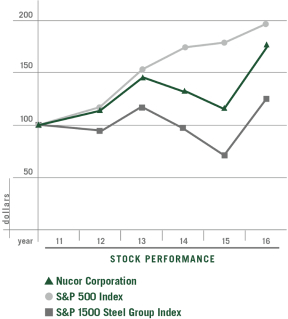
| | |
 | | THIS ANNUAL REPORT HAS BEEN PRINTED ON RECYCLED PAPER. |