Exhibit 99.2 THIRD QUARTER 2023 EARNINGS CALL LEON TOPALIAN Chair, President and CEO STEVE LAXTON Executive Vice President and CFO OCTOBER 24, 2023
FORWARD-LOOKING STATEMENTS Certain statements made in this presentation may constitute forward-looking statements within the meaning of the Private Securities Litigation Reform Act of 1995. These statements involve risks and uncertainties. The words “anticipate,” “believe,” “expect,” “intend,” “may,” “project,” “will,” “should,” “could” and similar expressions are intended to identify forward-looking statements. These forward-looking statements reflect the Company’s best judgment based on current information, and although we base these statements on circumstances that we believe to be reasonable when made, there can be no assurance that future events will not affect the accuracy of such forward-looking information. The Company does not undertake any obligation to update these statements. The forward-looking statements are not guarantees of future performance, and actual results may vary materially from the projected results and expectations discussed in this presentation. Factors that might cause the Company’s actual results to differ materially from those anticipated in forward-looking statements include, but are not limited to: (1) competitive pressure on sales and pricing, including pressure from imports and substitute materials; (2) U.S. and foreign trade policies affecting steel imports or exports; (3) the sensitivity of the results of our operations to general market conditions, and in particular, prevailing market steel prices and changes in the supply and cost of raw materials, including pig iron, iron ore and scrap steel; (4) the availability and cost of electricity and natural gas, which could negatively affect our cost of steel production or result in a delay or cancellation of existing or future drilling within our natural gas drilling programs; (5) critical equipment failures and business interruptions; (6) market demand for steel products, which, in the case of many of our products, is driven by the level of nonresidential construction activity in the United States; (7) impairment in the recorded value of inventory, equity investments, fixed assets, goodwill or other long-lived assets; (8) uncertainties and volatility surrounding the global economy, including excess world capacity for steel production, inflation and interest rate changes; (9) fluctuations in currency conversion rates; (10) significant changes in laws or government regulations affecting environmental compliance, including legislation and regulations that result in greater regulation of greenhouse gas emissions that could increase our energy costs, capital expenditures and operating costs or cause one or more of our permits to be revoked or make it more difficult to obtain permit modifications; (11) the cyclical nature of the steel industry; (12) capital investments and their impact on our performance; (13) our safety performance; (14) our ability to integrate businesses we acquire; (15) the impact of the COVID-19 pandemic, any variants of the virus, and any other similar public health situation; and (16) the risks discussed in “Item 1A. Risk Factors” of the Company’s Annual Report on Form 10-K for the year ended December 31, 2022 and elsewhere therein and in the other reports we file with the U.S. Securities and Exchange Commission. 2
NON-GAAP FINANCIAL MEASURES The Company uses certain non-GAAP (Generally Accepted Accounting Principles) financial measures in this news release, including EBITDA. Generally, a non-GAAP financial measure is a numerical measure of a company’s performance or financial position that either excludes or includes amounts that are not normally excluded or included in the most directly comparable financial measure calculated and presented in accordance with GAAP. We define EBITDA as net earnings before noncontrolling interests adding back the following items: interest expense, net; provision for income taxes; depreciation; and amortization. Please note that other companies might define their non-GAAP financial measures differently than we do. Management presents the non-GAAP financial measure of EBITDA in this news release because it considers it to be an important supplemental measure of performance. Management believes that this non-GAAP financial measure provides additional insight for analysts and investors evaluating the Company’s financial and operational performance by providing a consistent basis of comparison across periods. Non-GAAP financial measures have limitations as an analytical tool. Investors are encouraged to review the reconciliation of non-GAAP financial measures to their most directly comparable GAAP financial measures provided in this news release, including in the accompanying tables. 3
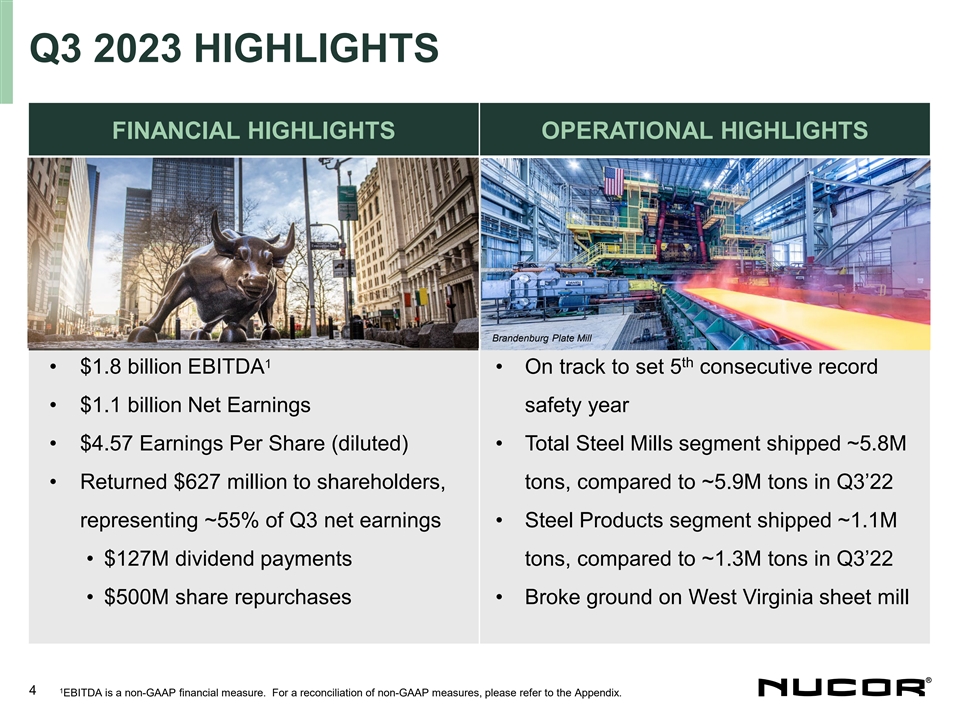
Q3 2023 HIGHLIGHTS FINANCIAL HIGHLIGHTS OPERATIONAL HIGHLIGHTS Brandenburg Plate Mill 1 th • $1.8 billion EBITDA consecutive record • On track to set 5 • $1.1 billion Net Earnings safety year • $4.57 Earnings Per Share (diluted) • Total Steel Mills segment shipped ~5.8M • Returned $627 million to shareholders, tons, compared to ~5.9M tons in Q3’22 representing ~55% of Q3 net earnings • Steel Products segment shipped ~1.1M • $127M dividend payments tons, compared to ~1.3M tons in Q3’22 • $500M share repurchases • Broke ground on West Virginia sheet mill 1 4 EBITDA is a non-GAAP financial measure. For a reconciliation of non-GAAP measures, please refer to the Appendix.
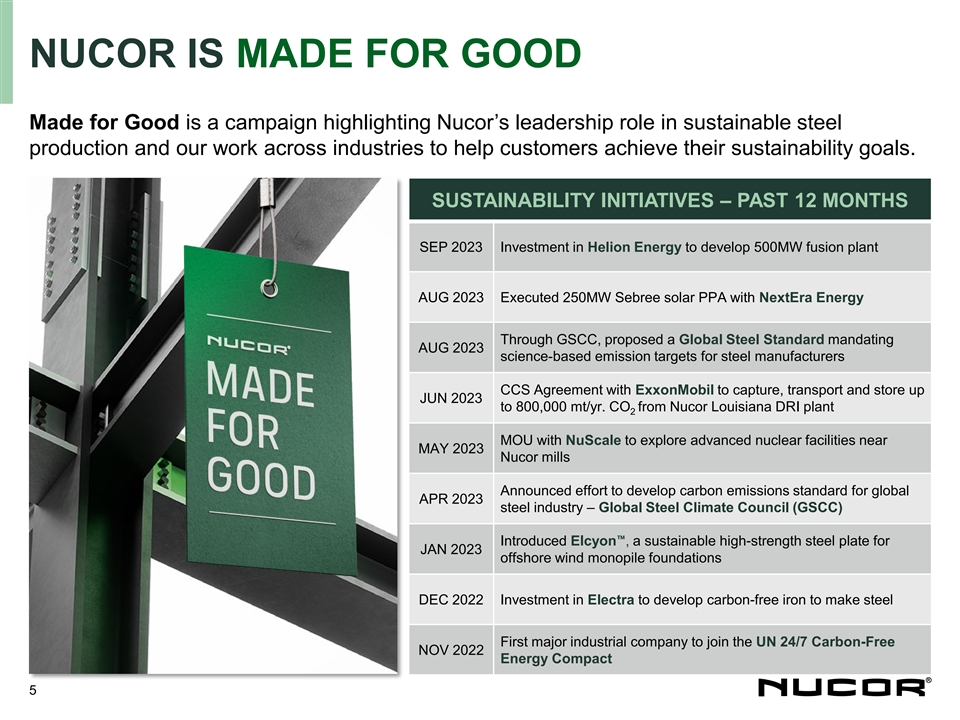
NUCOR IS MADE FOR GOOD Made for Good is a campaign highlighting Nucor’s leadership role in sustainable steel production and our work across industries to help customers achieve their sustainability goals. SUSTAINABILITY INITIATIVES – PAST 12 MONTHS SEP 2023 Investment in Helion Energy to develop 500MW fusion plant AUG 2023 Executed 250MW Sebree solar PPA with NextEra Energy Through GSCC, proposed a Global Steel Standard mandating AUG 2023 science-based emission targets for steel manufacturers CCS Agreement with ExxonMobil to capture, transport and store up JUN 2023 to 800,000 mt/yr. CO from Nucor Louisiana DRI plant 2 MOU with NuScale to explore advanced nuclear facilities near MAY 2023 Nucor mills Announced effort to develop carbon emissions standard for global APR 2023 steel industry – Global Steel Climate Council (GSCC) Introduced Elcyon™, a sustainable high-strength steel plate for JAN 2023 offshore wind monopile foundations DEC 2022 Investment in Electra to develop carbon-free iron to make steel First major industrial company to join the UN 24/7 Carbon-Free NOV 2022 Energy Compact 5

GROWING THE CORE TO CREATE SHAREHOLDER VALUE SHEET PLATE BAR BAR SHEET PLATE • Shift mix to higher margin, • Establish flagship mill in • Capitalize on growing value-added products largest plate consuming demand for rebar over next region in North America decade • Broaden geographic reach • Become leading supplier of • Improve margins and lower STRATEGIES specialty plate products for GHG intensity with • Diversify customer base wind, power transmission modernized equipment and military applications and processes • Leverage our GHG & cost advantages • Acquired 51% of • Completed construction • Completed micro mills in FL CSI (California) of Nucor Steel and MO Brandenburg (Kentucky), • Building new mill in the most versatile plate mill • Modernization projects in West Virginia in North America OH & IL INVESTMENTS • Adding 2+ Mtpa state of the art galvanizing capacity • Building new micro mill in NC • New paint and tube lines • Adding melt shop in AZ 6
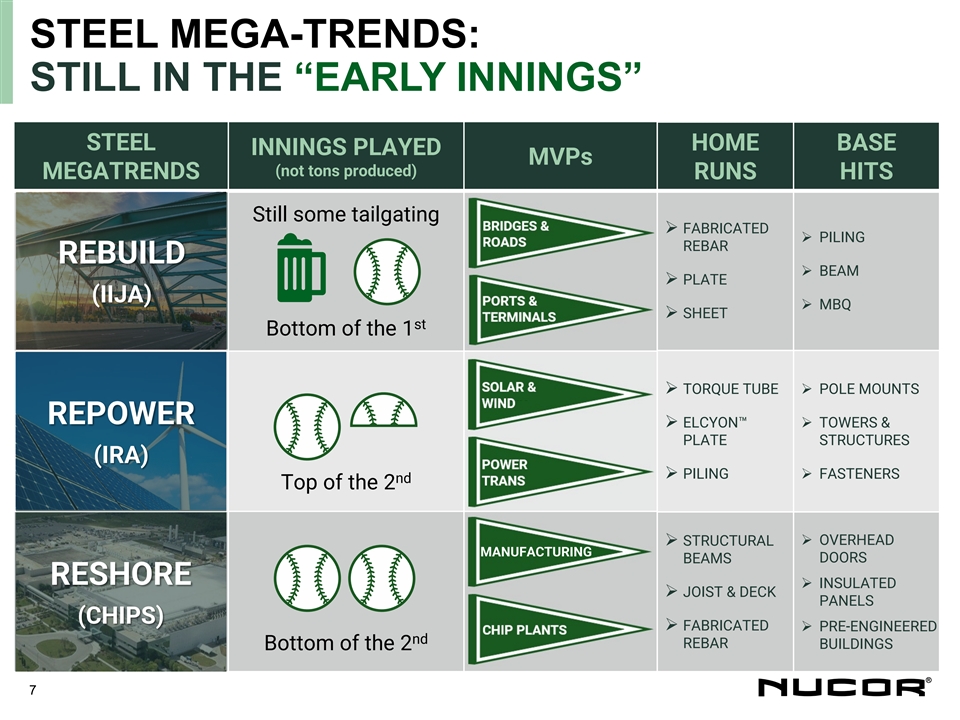
STEEL MEGA-TRENDS: STILL IN THE “EARLY INNINGS” STEEL HOME BASE INNINGS PLAYED MVPs (not tons produced) MEGATRENDS RUNS HITS Still some tailgating Ø FABRICATED Ø PILING REBAR REBUILD Ø BEAM Ø PLATE (IIJA) Ø MBQ Ø SHEET st Bottom of the 1 Ø TORQUE TUBEØ POLE MOUNTS REPOWER Ø ELCYON™ Ø TOWERS & PLATE STRUCTURES (IRA) Ø PILINGØ FASTENERS nd Top of the 2 Ø STRUCTURAL Ø OVERHEAD MANUFACTURING DOORS BEAMS RESHORE Ø INSULATED Ø JOIST & DECK PANELS (CHIPS) Ø FABRICATED Ø PRE-ENGINEERED nd REBAR BUILDINGS Bottom of the 2 7

Q3 2023 SEGMENT RESULTS STEEL MILLS SEGMENT Q3 2023 VS. Q2 2023 % Change Versus Q3 ‘23 Q2 ‘23 Q3 ‘22 Prior Qtr Prior Year Lower realized pricing, reduced metal margin • Shipments ( 5,746 5,979 5,869 -4% -2% tons in 000s) Modest decrease in shipments • 1 EBT ($M) 883 1,404 1,288 -37% -31% • Higher conversion costs driven by lower EBT/Ton ($) 154 235 219 -35% -30% operating rate STEEL PRODUCTS SEGMENT % Change Versus Q3 ‘23 Q2 ‘23 Q3 ‘22 Prior Qtr Prior Year Shipments (tons in 000s) 1,141 1,193 1,291 -4% -12% • Modest decrease in shipments 1 Lower realized pricing EBT ($M) 807 1,011 1,197 -20% -33%• Continued high profitability per ton • EBT/Ton ($) 707 847 927 -17% -24% RAW MATERIALS SEGMENT % Change Versus Q3 ‘23 Q2 ‘23 Q3 ‘22 Prior Qtr Prior Year Lower shipments 2• Production (tons in 000s) 1,997 2,103 1,932 -5% 3% Lower realized prices • 1 71 138 279 -49% -75% EBT ($M) 1 EBT ($M) refers to Earnings (loss) before income taxes and noncontrolling interests as disclosed in relevant 8 2 quarterly Nucor quarterly earnings news release. Excludes scrap brokerage activities
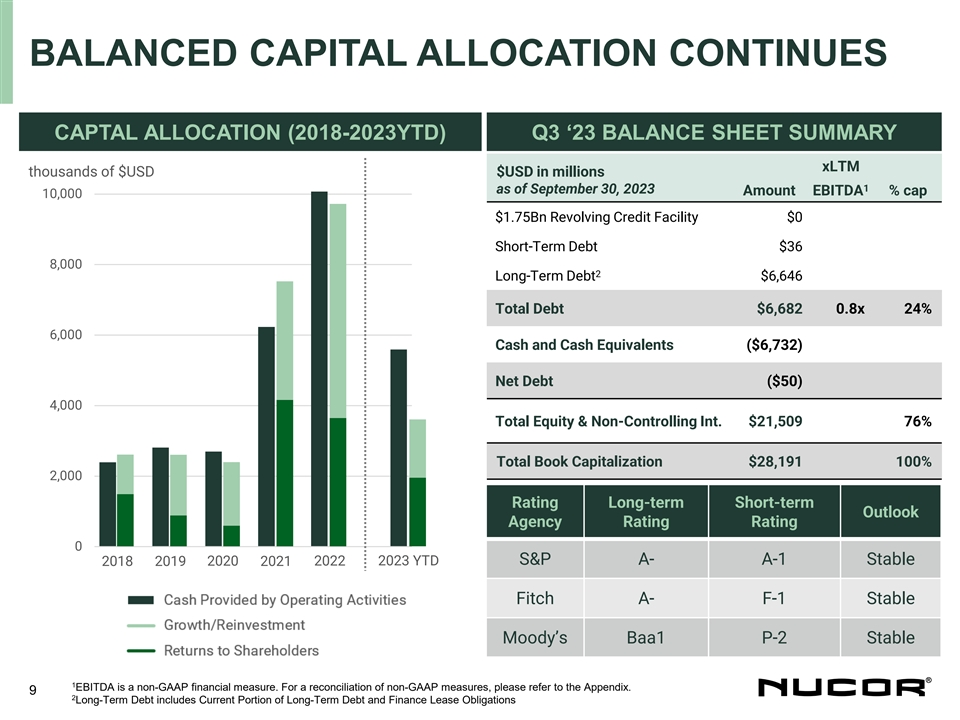
BALANCED CAPITAL ALLOCATION CONTINUES CAPTAL ALLOCATION (2018-2023YTD) Q3 ‘23 BALANCE SHEET SUMMARY xLTM thousands of $USD $USD in millions 1 as of September 30, 2023 Amount EBITDA % cap 10,000 $1.75Bn Revolving Credit Facility $0 Short-Term Debt $36 8,000 2 Long-Term Debt $6,646 Total Debt $6,682 0.8x 24% 6,000 Cash and Cash Equivalents ($6,732) Net Debt ($50) 4,000 Total Equity & Non-Controlling Int. $21,509 76% Total Book Capitalization $28,191 100% 2,000 Rating Long-term Short-term Outlook Agency Rating Rating 0 2020 2022 2023 YTD S&P A- A-1 Stable 2018 2019 2021 2018 2019 2020 2021 2022 2023 YTD Fitch A- F-1 Stable Moody’s Baa1 P-2 Stable 1 EBITDA is a non-GAAP financial measure. For a reconciliation of non-GAAP measures, please refer to the Appendix. 9 2 Long-Term Debt includes Current Portion of Long-Term Debt and Finance Lease Obligations
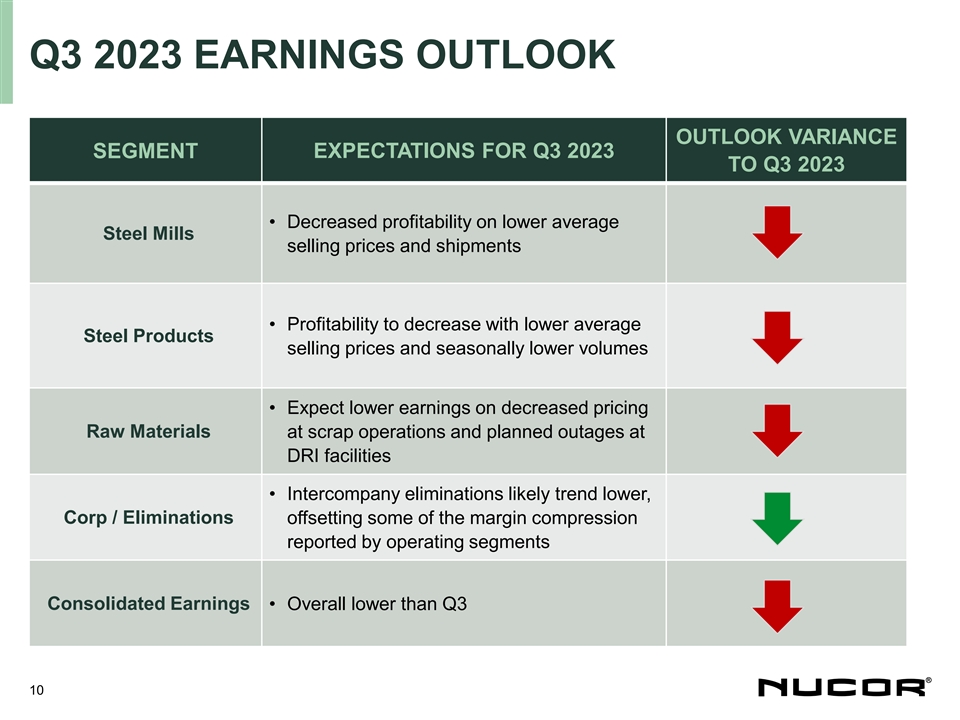
Q3 2023 EARNINGS OUTLOOK OUTLOOK VARIANCE SEGMENT EXPECTATIONS FOR Q3 2023 TO Q3 2023 • Decreased profitability on lower average Steel Mills selling prices and shipments • Profitability to decrease with lower average Steel Products selling prices and seasonally lower volumes • Expect lower earnings on decreased pricing Raw Materials at scrap operations and planned outages at DRI facilities • Intercompany eliminations likely trend lower, Corp / Eliminations offsetting some of the margin compression reported by operating segments Consolidated Earnings • Overall lower than Q3 10

APPENDIX 11

STRENGTH OF THE PORTFOLIO A DIVERSE MIX 2017-2023 EARNINGS MIX 2% 100.0% 5% 4% 4% 5% 6% 90.0% 22% 11% 11% 14% 80.0% 35% 48% 45% 70.0% 60.0% 50.0% 83% 84% 40.0% 81% 79% 30.0% 61% 51% 50% 20.0% 10.0% 0.0% -1% -10.0% FY 17 FY 18 FY 19 FY 20 FY 21 FY 22 YTD 23 Steel mills Steel products Raw materials Ø Transforming the earnings profile to On average, Steel Products accounted for ~16% of 2017-2019 EBT be more diverse through the cycle Ø Within the segments, shifting the Since 2020, Steel Products accounted for existing mix to focus on value added products ~35% of EBT, on average 12 (a) Operating segment earnings before income taxes and non-controlling interests. Excludes corporate, other and eliminations. % Contribution to Earnings Before Income Taxes & NCI
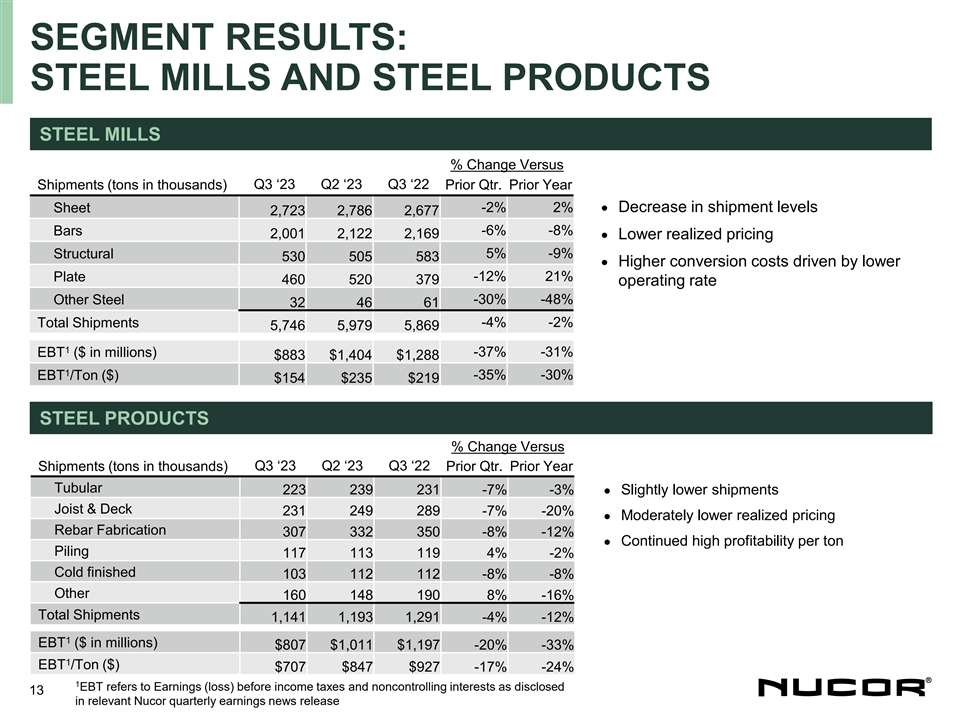
SEGMENT RESULTS: STEEL MILLS AND STEEL PRODUCTS STEEL MILLS % Change Versus Shipments (tons in thousands) Q3 ‘23 Q2 ‘23 Q3 ‘22 Prior Qtr. Prior Year -2% 2%• Decrease in shipment levels Sheet 2,723 2,786 2,677 Bars -6% -8% 2,001 2,122 2,169 • Lower realized pricing Structural 5% -9% 530 505 583 • Higher conversion costs driven by lower Plate -12% 21% 460 520 379 operating rate -30% -48% Other Steel 32 46 61 -4% -2% Total Shipments 5,746 5,979 5,869 1 EBT ($ in millions) -37% -31% $883 $1,404 $1,288 1 EBT /Ton ($) -35% -30% $154 $235 $219 STEEL PRODUCTS % Change Versus Shipments (tons in thousands) Q3 ‘23 Q2 ‘23 Q3 ‘22 Prior Qtr. Prior Year Tubular 223 239 231 -7% -3% Slightly lower shipments • Joist & Deck 231 249 289 -7% -20% Moderately lower realized pricing • Rebar Fabrication 307 332 350 -8% -12% Continued high profitability per ton • Piling 117 113 119 4% -2% Cold finished 103 112 112 -8% -8% Other 160 148 190 8% -16% Total Shipments 1,141 1,193 1,291 -4% -12% 1 EBT ($ in millions) $807 $1,011 $1,197 -20% -33% 1 EBT /Ton ($) $707 $847 $927 -17% -24% 1 EBT refers to Earnings (loss) before income taxes and noncontrolling interests as disclosed 13 in relevant Nucor quarterly earnings news release
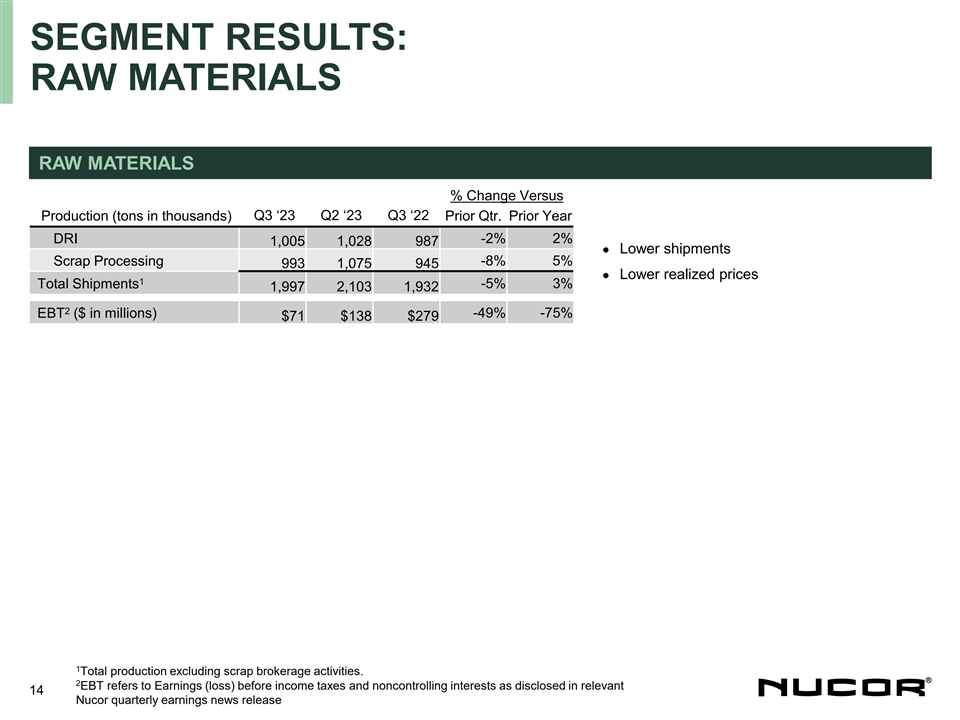
SEGMENT RESULTS: RAW MATERIALS RAW MATERIALS % Change Versus Q3 ‘23 Q2 ‘23 Q3 ‘22 Production (tons in thousands) Prior Qtr. Prior Year DRI -2% 2% 1,005 1,028 987 Lower shipments • Scrap Processing -8% 5% 993 1,075 945 • Lower realized prices 1 -5% 3% Total Shipments 1,997 2,103 1,932 2 -49% -75% EBT ($ in millions) $71 $138 $279 1 Total production excluding scrap brokerage activities. 2 EBT refers to Earnings (loss) before income taxes and noncontrolling interests as disclosed in relevant 14 Nucor quarterly earnings news release
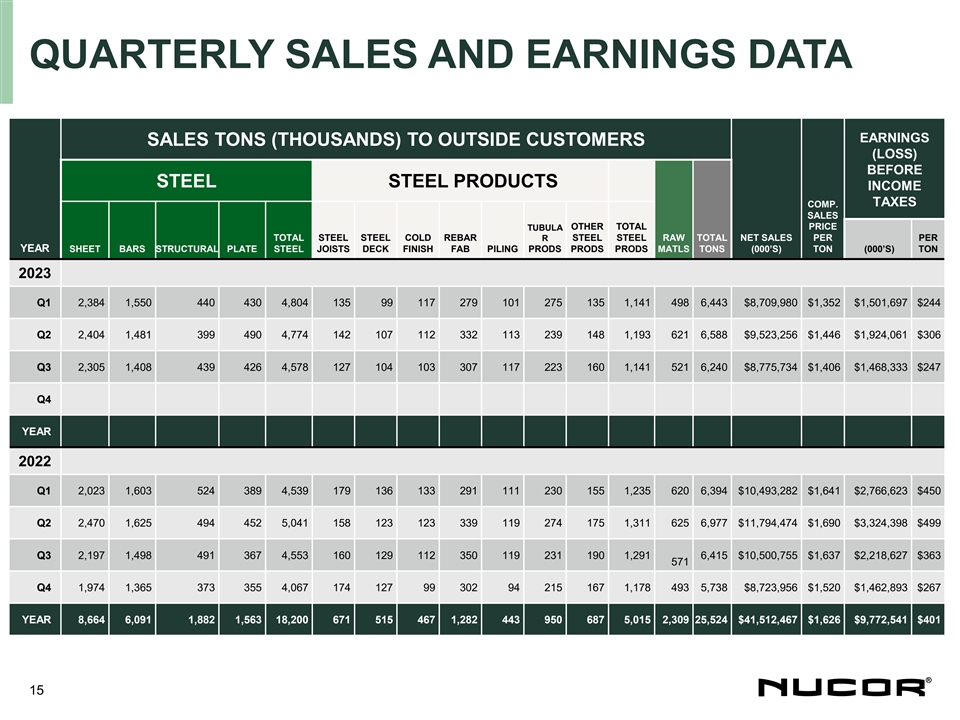
QUARTERLY SALES AND EARNINGS DATA EARNINGS SALES TONS (THOUSANDS) TO OUTSIDE CUSTOMERS (LOSS) BEFORE STEEL STEEL PRODUCTS INCOME TAXES COMP. SALES TUBULA OTHER TOTAL PRICE TOTAL STEEL STEEL COLD REBAR R STEEL STEEL RAW TOTAL NET SALES PER PER YEAR SHEET BARS STRUCTURAL PLATE STEEL JOISTS DECK FINISH FAB PILING PRODS PRODS PRODS MATLS TONS (000’S) TON (000’S) TON 2023 Q1 2,384 1,550 440 430 4,804 135 99 117 279 101 275 135 1,141 498 6,443 $8,709,980 $1,352 $1,501,697 $244 Q2 2,404 1,481 399 490 4,774 142 107 112 332 113 239 148 1,193 621 6,588 $9,523,256 $1,446 $1,924,061 $306 Q3 2,305 1,408 439 426 4,578 127 104 103 307 117 223 160 1,141 521 6,240 $8,775,734 $1,406 $1,468,333 $247 Q4 YEAR 2022 Q1 2,023 1,603 524 389 4,539 179 136 133 291 111 230 155 1,235 620 6,394 $10,493,282 $1,641 $2,766,623 $450 Q2 2,470 1,625 494 452 5,041 158 123 123 339 119 274 175 1,311 625 6,977 $11,794,474 $1,690 $3,324,398 $499 Q3 2,197 1,498 491 367 4,553 160 129 112 350 119 231 190 1,291 6,415 $10,500,755 $1,637 $2,218,627 $363 571 Q4 1,974 1,365 373 355 4,067 174 127 99 302 94 215 167 1,178 493 5,738 $8,723,956 $1,520 $1,462,893 $267 YEAR 8,664 6,091 1,882 1,563 18,200 671 515 467 1,282 443 950 687 5,015 2,309 25,524 $41,512,467 $1,626 $9,772,541 $401 15
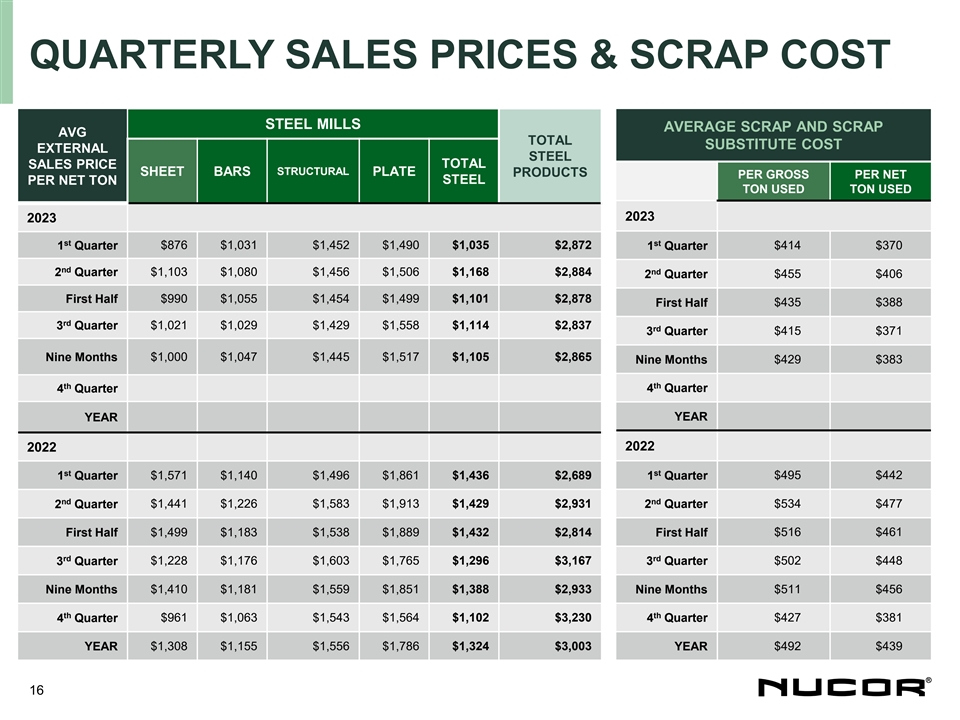
QUARTERLY SALES PRICES & SCRAP COST STEEL MILLS AVERAGE SCRAP AND SCRAP AVG TOTAL SUBSTITUTE COST EXTERNAL STEEL TOTAL SALES PRICE STRUCTURAL SHEET BARS PLATE PRODUCTS PER GROSS PER NET STEEL PER NET TON TON USED TON USED 2023 2023 st st 1 Quarter $876 $1,031 $1,452 $1,490 $1,035 $2,872 1 Quarter $414 $370 nd nd 2 Quarter $1,103 $1,080 $1,456 $1,506 $1,168 $2,884 2 Quarter $455 $406 First Half $990 $1,055 $1,454 $1,499 $1,101 $2,878 First Half $435 $388 rd 3 Quarter $1,021 $1,029 $1,429 $1,558 $1,114 $2,837 rd $415 $371 3 Quarter Nine Months $1,000 $1,047 $1,445 $1,517 $1,105 $2,865 Nine Months $429 $383 th th 4 Quarter 4 Quarter YEAR YEAR 2022 2022 st st 1 Quarter $1,571 $1,140 $1,496 $1,861 $1,436 $2,689 1 Quarter $495 $442 nd nd 2 Quarter $1,441 $1,226 $1,583 $1,913 $1,429 $2,931 2 Quarter $534 $477 $1,499 $1,183 $1,538 $1,889 $1,432 $2,814 $516 $461 First Half First Half rd rd 3 Quarter $1,228 $1,176 $1,603 $1,765 $1,296 $3,167 3 Quarter $502 $448 Nine Months $1,410 $1,181 $1,559 $1,851 $1,388 $2,933 Nine Months $511 $456 th th $961 $1,063 $1,543 $1,564 $1,102 $3,230 $427 $381 4 Quarter 4 Quarter YEAR $1,308 $1,155 $1,556 $1,786 $1,324 $3,003 YEAR $492 $439 16
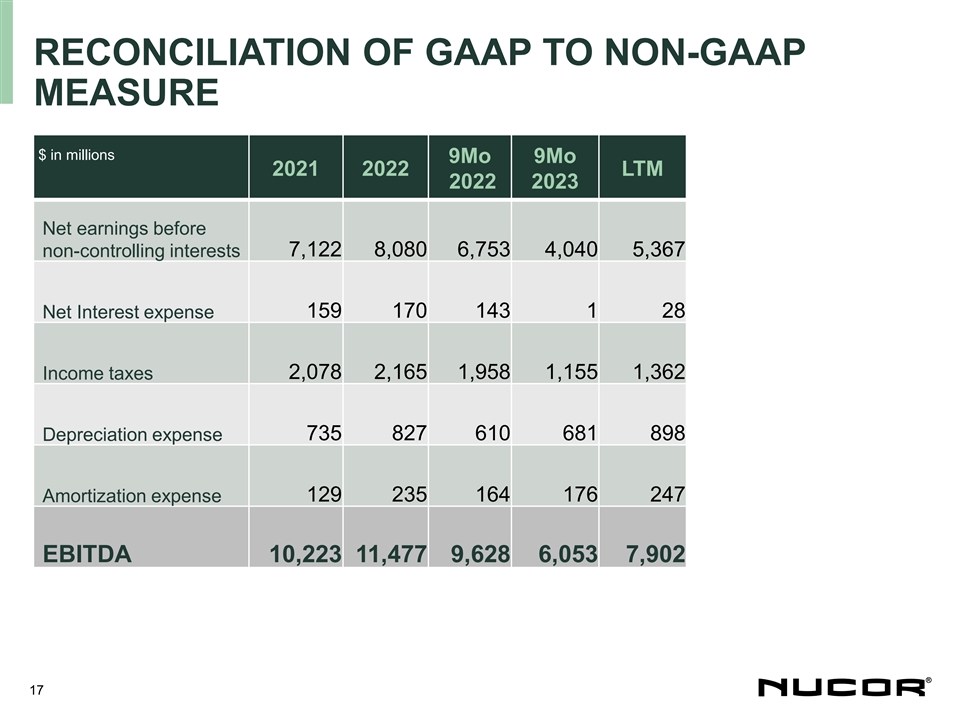
RECONCILIATION OF GAAP TO NON-GAAP MEASURE $ in millions 9Mo 9Mo 2021 2022 LTM 2022 2023 Net earnings before non-controlling interests 7,122 8,080 6,753 4,040 5,367 Net Interest expense 159 170 143 1 28 2,078 2,165 1,958 1,155 1,362 Income taxes 735 827 610 681 898 Depreciation expense 129 235 164 176 247 Amortization expense EBITDA 10,223 11,477 9,628 6,053 7,902 17
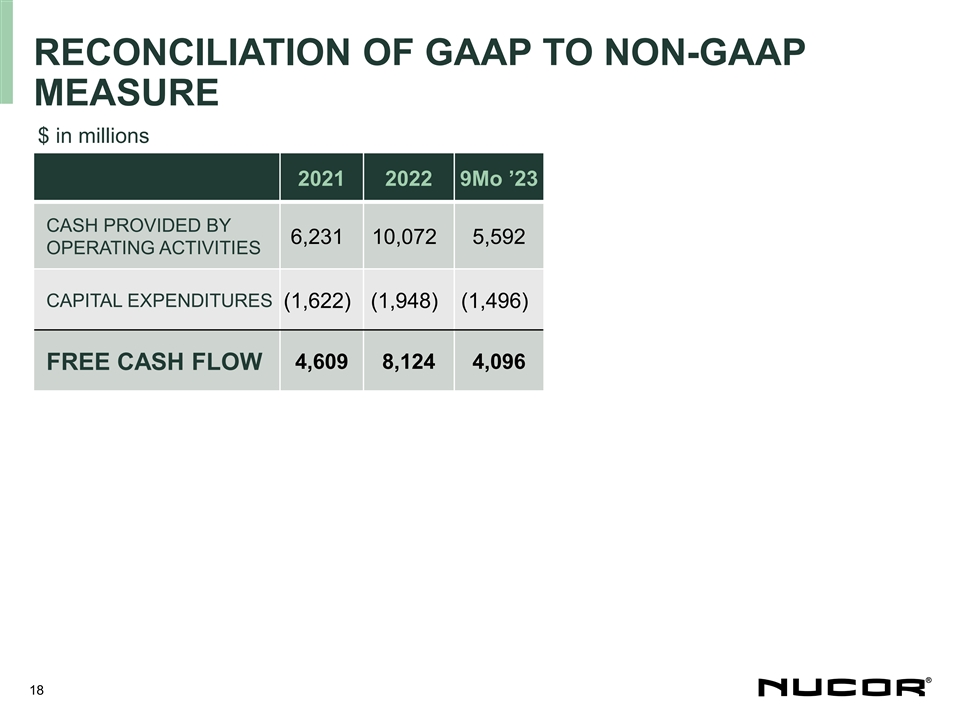
RECONCILIATION OF GAAP TO NON-GAAP MEASURE $ in millions 2021 2022 9Mo ’23 CASH PROVIDED BY 6,231 10,072 5,592 OPERATING ACTIVITIES CAPITAL EXPENDITURES (1,622) (1,948) (1,496) 4,609 8,124 4,096 FREE CASH FLOW 18