Exhibit 99.2 THIRD QUARTER 2024 EARNINGS CALL LEON TOPALIAN Chair, President and CEO STEVE LAXTON Executive Vice President and CFO October 22, 2024
FORWARD-LOOKING STATEMENTS Certain statements made in this presentation may constitute forward-looking statements within the meaning of the Private Securities Litigation Reform Act of 1995. These statements involve risks and uncertainties. The words “anticipate,” “believe,” “expect,” “intend,” “may,” “project,” “will,” “should,” “could” and similar expressions are intended to identify forward-looking statements. These forward-looking statements reflect the Company’s best judgment based on current information, and although we base these statements on circumstances that we believe to be reasonable when made, there can be no assurance that future events will not affect the accuracy of such forward-looking information. The Company does not undertake any obligation to update these statements. The forward-looking statements are not guarantees of future performance, and actual results may vary materially from the projected results and expectations discussed in this presentation. Factors that might cause the Company’s actual results to differ materially from those anticipated in forward- looking statements include, but are not limited to: (1) competitive pressure on sales and pricing, including pressure from imports and substitute materials; (2) U.S. and foreign trade policies affecting steel imports or exports; (3) the sensitivity of the results of our operations to general market conditions, and in particular, prevailing market steel prices and changes in the supply and cost of raw materials, including pig iron, iron ore and scrap steel; (4) the availability and cost of electricity and natural gas, which could negatively affect our cost of steel production or result in a delay or cancellation of existing or future drilling within our natural gas drilling programs; (5) critical equipment failures and business interruptions; (6) market demand for steel products, which, in the case of many of our products, is driven by the level of nonresidential construction activity in the United States; (7) impairment in the recorded value of inventory, equity investments, fixed assets, goodwill or other long- lived assets; (8) uncertainties and volatility surrounding the global economy, including excess world capacity for steel production, inflation and interest rate changes; (9) fluctuations in currency conversion rates; (10) significant changes in laws or government regulations affecting environmental compliance, including legislation and regulations that result in greater regulation of greenhouse gas emissions that could increase our energy costs, capital expenditures and operating costs or cause one or more of our permits to be revoked or make it more difficult to obtain permit modifications; (11) the cyclical nature of the steel industry; (12) capital investments and their impact on our performance; (13) our safety performance; (14) our ability to integrate businesses we acquire; (15) the impact of the COVID-19 pandemic, any variants of the virus, and any other similar public health situation; and (16) the risks discussed in “Item 1A. Risk Factors” of the Company’s Annual Report on Form 10-K for the year ended December 31, 2023 and elsewhere therein and in the other reports we file with the U.S. Securities and Exchange Commission. 2
NON-GAAP FINANCIAL MEASURES The Company uses certain non-GAAP (Generally Accepted Accounting Principles) financial measures in this news release, including EBITDA and Free Cash Flow (FCF). Generally, a non-GAAP financial measure is a numerical measure of a company’s performance or financial position that either excludes or includes amounts that are not normally excluded or included in the most directly comparable financial measure calculated and presented in accordance with GAAP. We define EBITDA as net earnings before noncontrolling interests adding back the following items: interest expense, net; provision for income taxes; depreciation; amortization; and losses and impairments of assets. We define Free Cash Flow (FCF) as Cash Provided by Operating Activities less Capital Expenditures. Please note that other companies might define their non-GAAP financial measures differently than we do. Management presents the non-GAAP financial measures of EBITDA and FCF in this news release because it considers them to be an important supplemental measure of performance. Management believes that these non-GAAP financial measures provide additional insight for analysts and investors evaluating the Company’s financial and operational performance by providing a consistent basis of comparison across periods. Non-GAAP financial measures have limitations as an analytical tool. Investors are encouraged to review the reconciliation of non-GAAP financial measures to their most directly comparable GAAP financial measures provided in this presentation, including in the accompanying tables located in the Appendix. 3
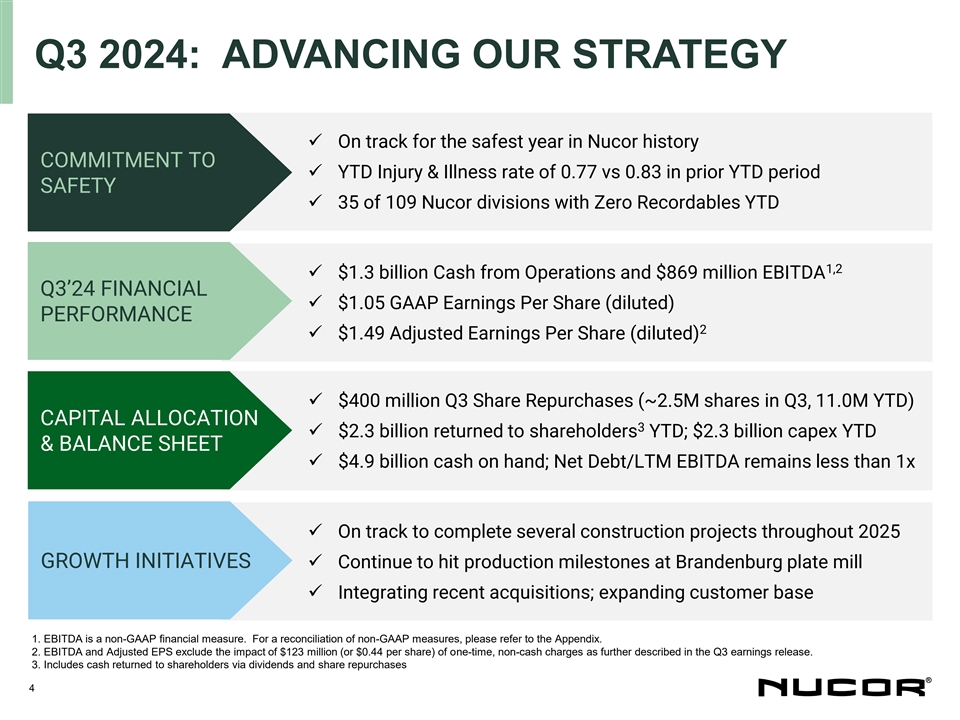
Q3 2024: ADVANCING OUR STRATEGY ✓ On track for the safest year in Nucor history COMMITMENT TO ✓ YTD Injury & Illness rate of 0.77 vs 0.83 in prior YTD period SAFETY ✓ 35 of 109 Nucor divisions with Zero Recordables YTD 1,2 ✓ $1.3 billion Cash from Operations and $869 million EBITDA Q3’24 FINANCIAL ✓ $1.05 GAAP Earnings Per Share (diluted) PERFORMANCE 2 ✓ $1.49 Adjusted Earnings Per Share (diluted) ✓ $400 million Q3 Share Repurchases (~2.5M shares in Q3, 11.0M YTD) CAPITAL ALLOCATION 3 ✓ $2.3 billion returned to shareholders YTD; $2.3 billion capex YTD & BALANCE SHEET ✓ $4.9 billion cash on hand; Net Debt/LTM EBITDA remains less than 1x ✓ On track to complete several construction projects throughout 2025 GROWTH INITIATIVES✓ Continue to hit production milestones at Brandenburg plate mill ✓ Integrating recent acquisitions; expanding customer base 1. EBITDA is a non-GAAP financial measure. For a reconciliation of non-GAAP measures, please refer to the Appendix. 2. EBITDA and Adjusted EPS exclude the impact of $123 million (or $0.44 per share) of one-time, non-cash charges as further described in the Q3 earnings release. 3. Includes cash returned to shareholders via dividends and share repurchases 4
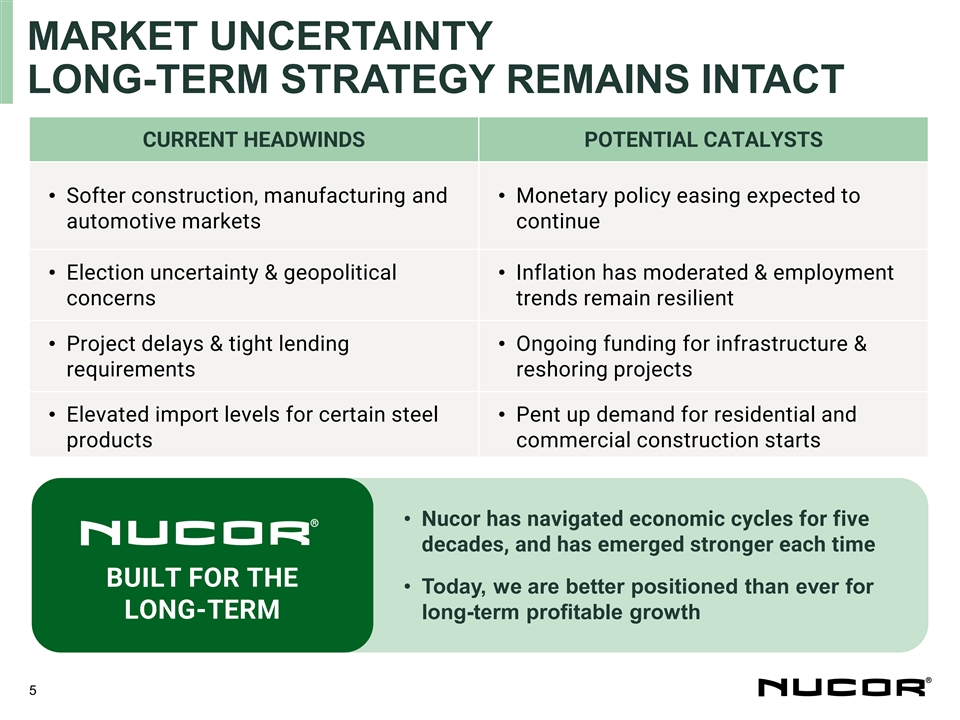
MARKET UNCERTAINTY LONG-TERM STRATEGY REMAINS INTACT CURRENT HEADWINDS POTENTIAL CATALYSTS • Softer construction, manufacturing and • Monetary policy easing expected to automotive markets continue • Election uncertainty & geopolitical • Inflation has moderated & employment concerns trends remain resilient • Project delays & tight lending • Ongoing funding for infrastructure & requirements reshoring projects • Elevated import levels for certain steel • Pent up demand for residential and products commercial construction starts • Nucor has navigated economic cycles for five decades, and has emerged stronger each time BUILT FOR THE • Today, we are better positioned than ever for LONG-TERM long-term profitable growth 5
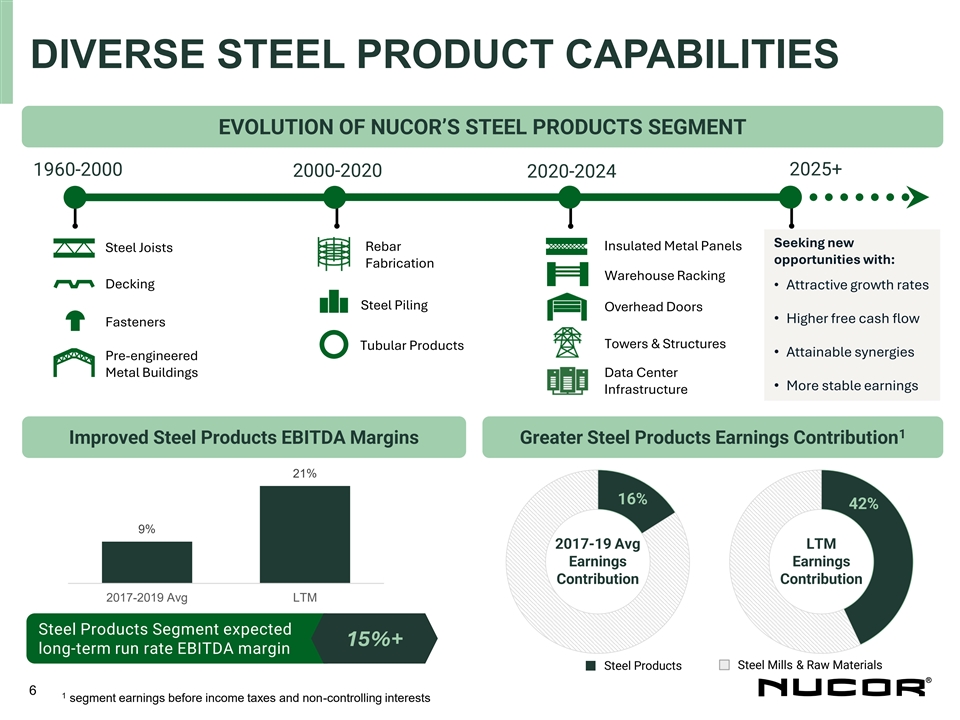
DIVERSE STEEL PRODUCT CAPABILITIES EVOLUTION OF NUCOR’S STEEL PRODUCTS SEGMENT 1960-2000 2025+ 2000-2020 2020-2024 Seeking new Rebar Insulated Metal Panels Steel Joists opportunities with: Fabrication Warehouse Racking Decking • Attractive growth rates Steel Piling Overhead Doors • Higher free cash flow Fasteners Towers & Structures Tubular Products • Attainable synergies Pre-engineered Metal Buildings Data Center • More stable earnings Infrastructure 1 Improved Steel Products EBITDA Margins Greater Steel Products Earnings Contribution 21% 16% 42% 9% 2017-19 Avg LTM Earnings Earnings Contribution Contribution 2017-2019 Avg LTM Steel Products Segment expected 15%+ long-term run rate EBITDA margin Steel Mills & Raw Materials Steel Products 6 1 segment earnings before income taxes and non-controlling interests

FAIR TRADE HAS BIPARTISAN SUPPORT, BUT MORE IS NEEDED • Lower domestic mill utilization rates IMPACTS OF • Lower domestic steel margins ELEVATED IMPORTS • Higher carbon footprint, on account of higher emissions imported steel • Corrosion Resistant Steel (CORE) trade case filed by domestic producers RECENT ACTIONS • DOC maintains Vietnam's Non-Market Economy status under U.S trade laws THAT ADDRESS • Mexico imposed Melted & Poured requirement IMPORTS • Canada imposed a 25% surtax on select steel imported from China • Nucor has thrived over the past five decades and 10 White House BIPARTISAN Administrations, regardless of party SUPPORT… • Trade enforcement has bipartisan support ‒ Section 232 tariffs supported by current and prior administration (R and D) BUT MORE IS NEEDED ‒ Leveling the Playing Field Act 2.0 is the next logical step 7
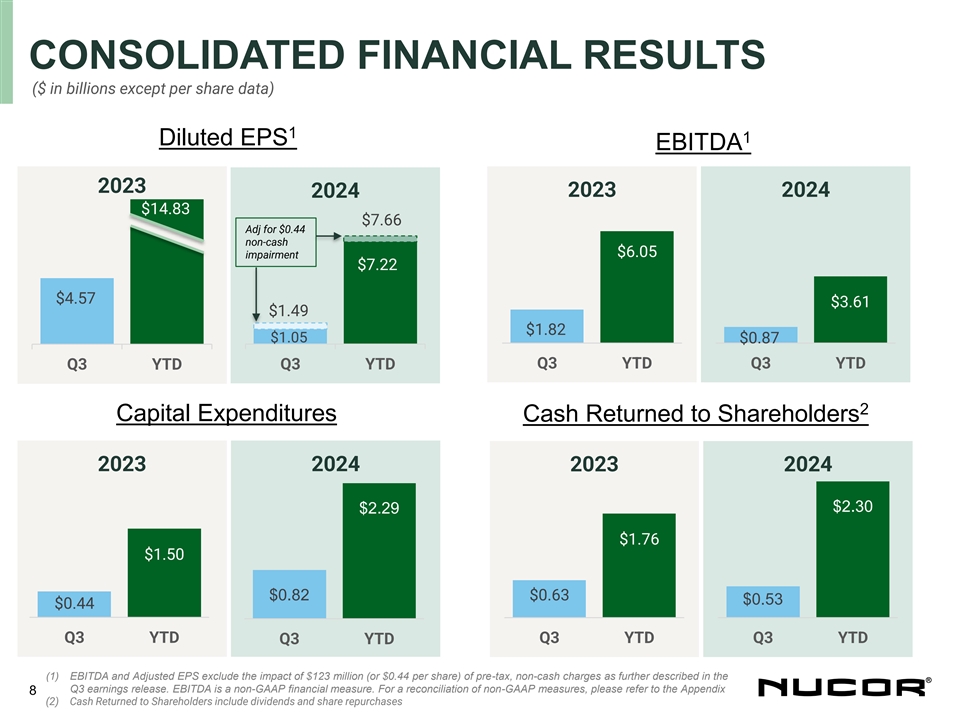
CONSOLIDATED FINANCIAL RESULTS ($ in billions except per share data) 1 1 Diluted EPS EBITDA 2023 2023 2024 2024 $14.83 $7.66 Adj for $0.44 non-cash $6.05 impairment $7.22 $4.57 $3.61 $1.49 $1.82 $1.05 $0.87 Q3 YTD Q3 YTD Q3 YTD Q3 YTD 2 Capital Expenditures Cash Returned to Shareholders 2023 2024 2023 2024 $2.30 $2.29 $1.76 $1.50 $0.82 $0.63 $0.53 $0.44 Q3 YTD Q3 YTD Q3 YTD Q3 YTD (1) EBITDA and Adjusted EPS exclude the impact of $123 million (or $0.44 per share) of pre-tax, non-cash charges as further described in the Q3 earnings release. EBITDA is a non-GAAP financial measure. For a reconciliation of non-GAAP measures, please refer to the Appendix 8 (2) Cash Returned to Shareholders include dividends and share repurchases
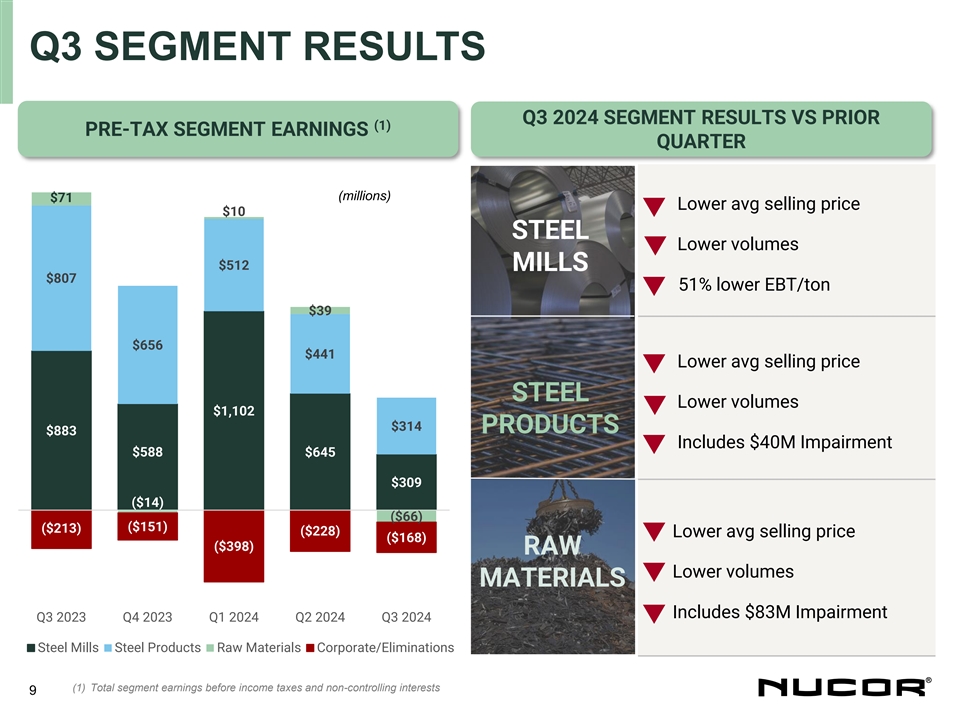
Q3 SEGMENT RESULTS Q3 2024 SEGMENT RESULTS VS PRIOR (1) PRE-TAX SEGMENT EARNINGS QUARTER (millions) $71 • Lower avg selling price $10 STEEL • Lower volumes $512 MILLS $807 • 51% lower EBT/ton $39 $656 $441 • Lower avg selling price STEEL • Lower volumes $1,102 $314 PRODUCTS $883 • Includes $40M Impairment $588 $645 $309 ($14) ($66) ($151) ($213) ($228) • Lower avg selling price ($168) ($398) RAW • Lower volumes MATERIALS • Includes $83M Impairment Q3 2023 Q4 2023 Q1 2024 Q2 2024 Q3 2024 Steel Mills Steel Products Raw Materials Corporate/Eliminations (1) Total segment earnings before income taxes and non-controlling interests 9
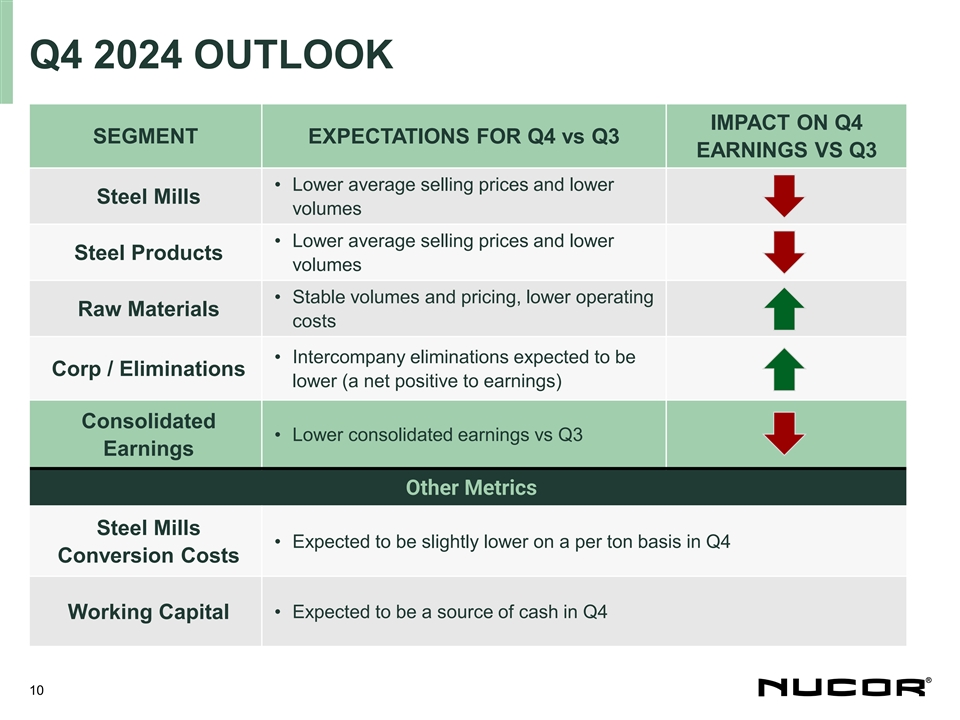
Q4 2024 OUTLOOK IMPACT ON Q4 SEGMENT EXPECTATIONS FOR Q4 vs Q3 EARNINGS VS Q3 • Lower average selling prices and lower Steel Mills volumes • Lower average selling prices and lower Steel Products volumes • Stable volumes and pricing, lower operating Raw Materials costs • Intercompany eliminations expected to be Corp / Eliminations lower (a net positive to earnings) Consolidated • Lower consolidated earnings vs Q3 Earnings Other Metrics Steel Mills • Expected to be slightly lower on a per ton basis in Q4 Conversion Costs • Expected to be a source of cash in Q4 Working Capital 10
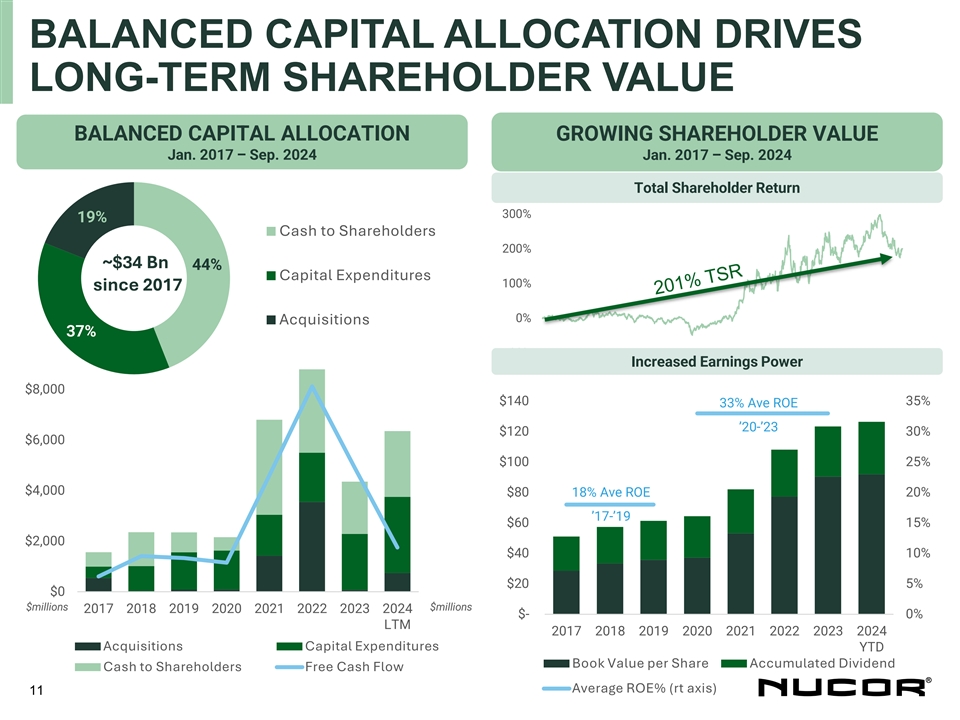
BALANCED CAPITAL ALLOCATION DRIVES LONG-TERM SHAREHOLDER VALUE BALANCED CAPITAL ALLOCATION GROWING SHAREHOLDER VALUE Jan. 2017 – Sep. 2024 Jan. 2017 – Sep. 2024 Total Shareholder Return 300% 19% Cash to Shareholders 200% ~$34 Bn 44% Capital Expenditures 100% since 2017 0% Acquisitions 37% -100% Increased Earnings Power $8,000 $140 35% 33% Ave ROE ’20-’23 $120 30% $6,000 $100 25% $4,000 $80 18% Ave ROE 20% ’17-’19 $60 15% $2,000 $40 10% $20 5% $0 $millions $millions 2017 2018 2019 2020 2021 2022 2023 2024 $- 0% LTM 2017 2018 2019 2020 2021 2022 2023 2024 Acquisitions Capital Expenditures YTD Book Value per Share Accumulated Dividend Cash to Shareholders Free Cash Flow Average ROE% (rt axis) 11

APPENDIX 12
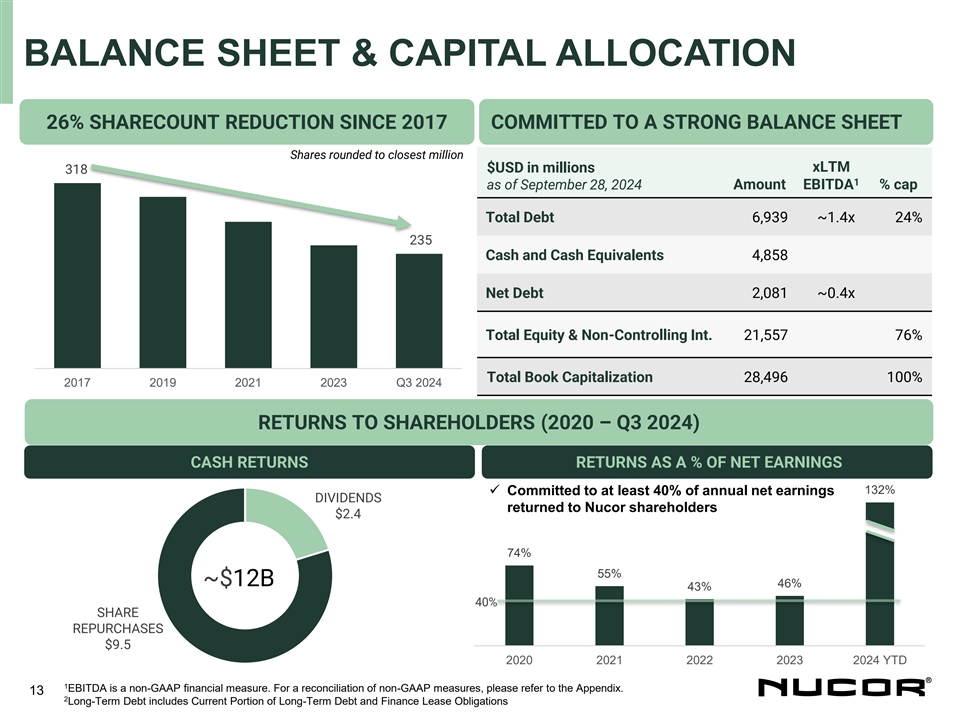
BALANCE SHEET & CAPITAL ALLOCATION 26% SHARECOUNT REDUCTION SINCE 2017 COMMITTED TO A STRONG BALANCE SHEET Shares rounded to closest million xLTM $USD in millions 318 1 as of September 28, 2024 Amount EBITDA % cap Total Debt 6,939 ~1.4x 24% 235 Cash and Cash Equivalents 4,858 Net Debt 2,081 ~0.4x Total Equity & Non-Controlling Int. 21,557 76% Total Book Capitalization 28,496 100% 2017 2019 2021 2023 Q3 2024 RETURNS TO SHAREHOLDERS (2020 – Q3 2024) CASH RETURNS RETURNS AS A % OF NET EARNINGS 132% ✓ Committed to at least 40% of annual net earnings DIVIDENDS returned to Nucor shareholders $2.4 74% 55% ~$12B 46% 43% 40% SHARE REPURCHASES $9.5 2020 2021 2022 2023 2024 YTD 1 EBITDA is a non-GAAP financial measure. For a reconciliation of non-GAAP measures, please refer to the Appendix. 13 2 Long-Term Debt includes Current Portion of Long-Term Debt and Finance Lease Obligations

CAPEX PLAN FUNDED WITH ROBUST OPERATING CASHFLOW AND HEALTHY BALANCE SHEET $3,000 FCF Line = Operating Cashflow minus Capex Annual Annual Annual Cash Period Operating (1) Capex FCF Balance Cashflow $2,500 2017 – 2019 $2.1B $1.0B $1.1B $1.4B (average) $2,000 2021 – 2023 $7.8B $1.9B $5.9B $4.9B (average) $1,500 LTM Q3 ’24 $4.8B $3.0B $1.8B $4.9B $1,000 Operating $500 Cashflow $0 -$500 Capex -$1,000 -$1,500 2017 2018 2019 2020 2021 2022 2023 ’24 YTD $millions QUARTERLY CAPEX QUARTERLY OPERATING CASH FLOW QUARTERLY FCF (1) Represents average year-end cash, cash equivalents and short-term investments during multi-year periods. For LTM period, represents balance at end of Q3 ‘24. 14
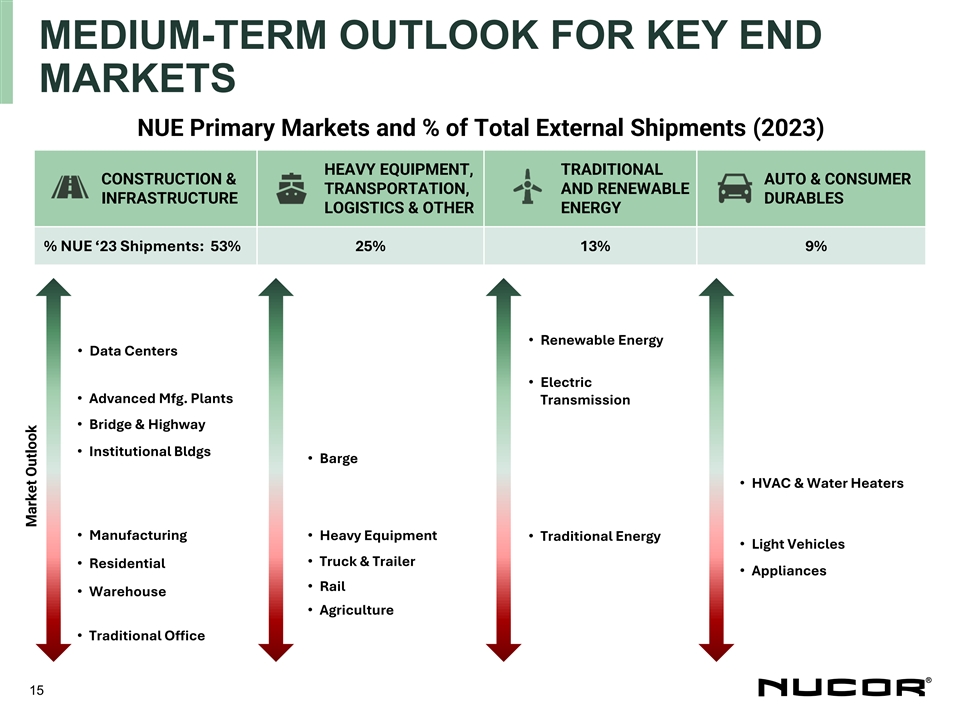
MEDIUM-TERM OUTLOOK FOR KEY END MARKETS NUE Primary Markets and % of Total External Shipments (2023) HEAVY EQUIPMENT, TRADITIONAL CONSTRUCTION & AUTO & CONSUMER TRANSPORTATION, AND RENEWABLE INFRASTRUCTURE DURABLES LOGISTICS & OTHER ENERGY % NUE ‘23 Shipments: 53% 25% 13% 9% • Renewable Energy • Data Centers • Electric • Advanced Mfg. Plants Transmission • Bridge & Highway • Institutional Bldgs • Barge • HVAC & Water Heaters • Manufacturing • Heavy Equipment • Traditional Energy • Light Vehicles • Truck & Trailer • Residential • Appliances • Rail • Warehouse • Agriculture • Traditional Office 15 Market Outlook
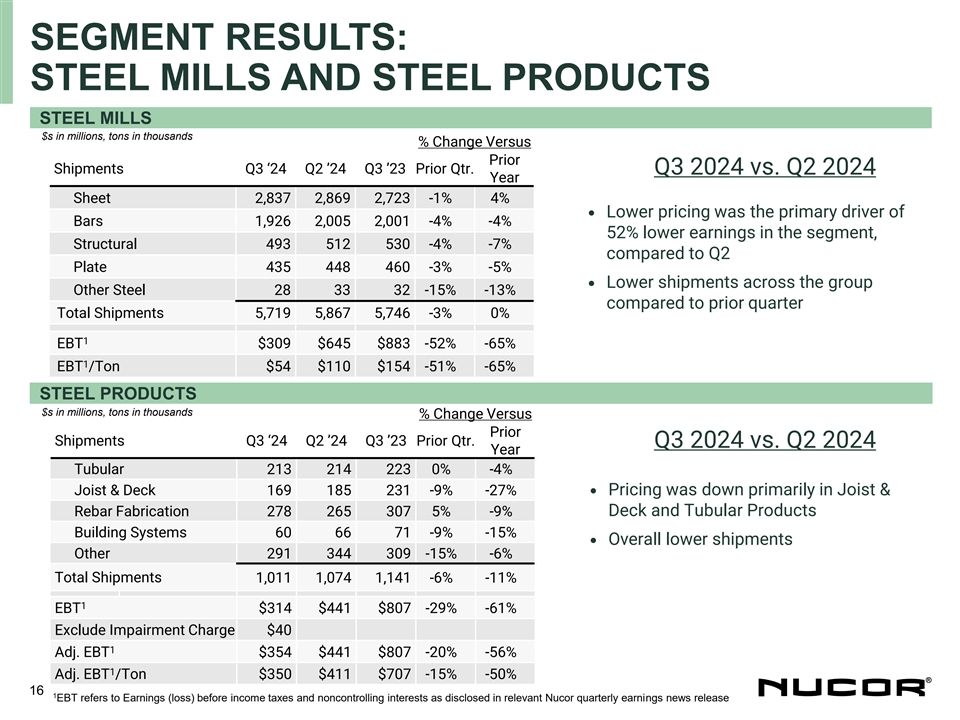
SEGMENT RESULTS: STEEL MILLS AND STEEL PRODUCTS STEEL MILLS $s in millions, tons in thousands % Change Versus Prior Shipments Q3 ‘24 Q2 ’24 Q3 ’23 Prior Qtr. Q3 2024 vs. Q2 2024 Year Sheet 2,837 2,869 2,723 -1% 4% • Lower pricing was the primary driver of Bars 1,926 2,005 2,001 -4% -4% 52% lower earnings in the segment, Structural 493 512 530 -4% -7% compared to Q2 Plate 435 448 460 -3% -5% • Lower shipments across the group Other Steel 28 33 32 -15% -13% compared to prior quarter Total Shipments 5,719 5,867 5,746 -3% 0% 1 EBT $309 $645 $883 -52% -65% 1 EBT /Ton $54 $110 $154 -51% -65% STEEL PRODUCTS $s in millions, tons in thousands % Change Versus Prior Shipments Q3 ‘24 Q2 ’24 Q3 ’23 Prior Qtr. Q3 2024 vs. Q2 2024 Year Tubular 213 214 223 0% -4% • Joist & Deck 169 185 231 -9% -27% Pricing was down primarily in Joist & Rebar Fabrication 278 265 307 5% -9% Deck and Tubular Products Building Systems 60 66 71 -9% -15% • Overall lower shipments Other 291 344 309 -15% -6% Total Shipments 1,011 1,074 1,141 -6% -11% 1 EBT $314 $441 $807 -29% -61% Exclude Impairment Charge $40 1 Adj. EBT $354 $441 $807 -20% -56% 1 Adj. EBT /Ton $350 $411 $707 -15% -50% 16 1 EBT refers to Earnings (loss) before income taxes and noncontrolling interests as disclosed in relevant Nucor quarterly earnings news release
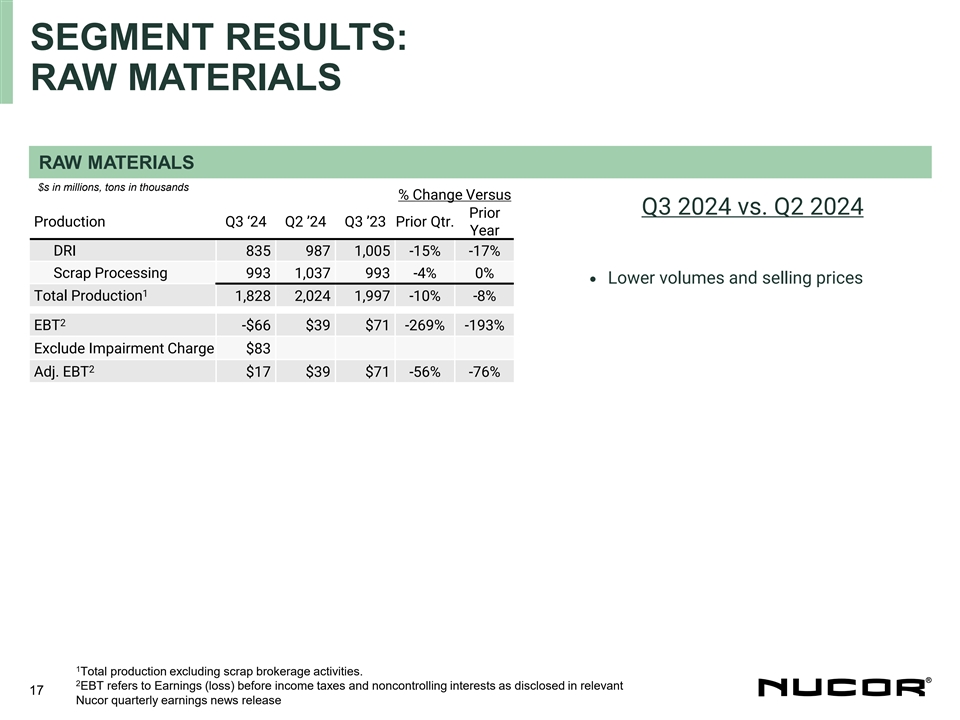
SEGMENT RESULTS: RAW MATERIALS RAW MATERIALS $s in millions, tons in thousands % Change Versus Q3 2024 vs. Q2 2024 Prior Production Q3 ‘24 Q2 ’24 Q3 ’23 Prior Qtr. Year DRI 835 987 1,005 -15% -17% Scrap Processing 993 1,037 993 -4% 0% • Lower volumes and selling prices 1 Total Production 1,828 2,024 1,997 -10% -8% 2 EBT -$66 $39 $71 -269% -193% Exclude Impairment Charge $83 2 Adj. EBT $17 $39 $71 -56% -76% 1 Total production excluding scrap brokerage activities. 2 EBT refers to Earnings (loss) before income taxes and noncontrolling interests as disclosed in relevant 17 Nucor quarterly earnings news release
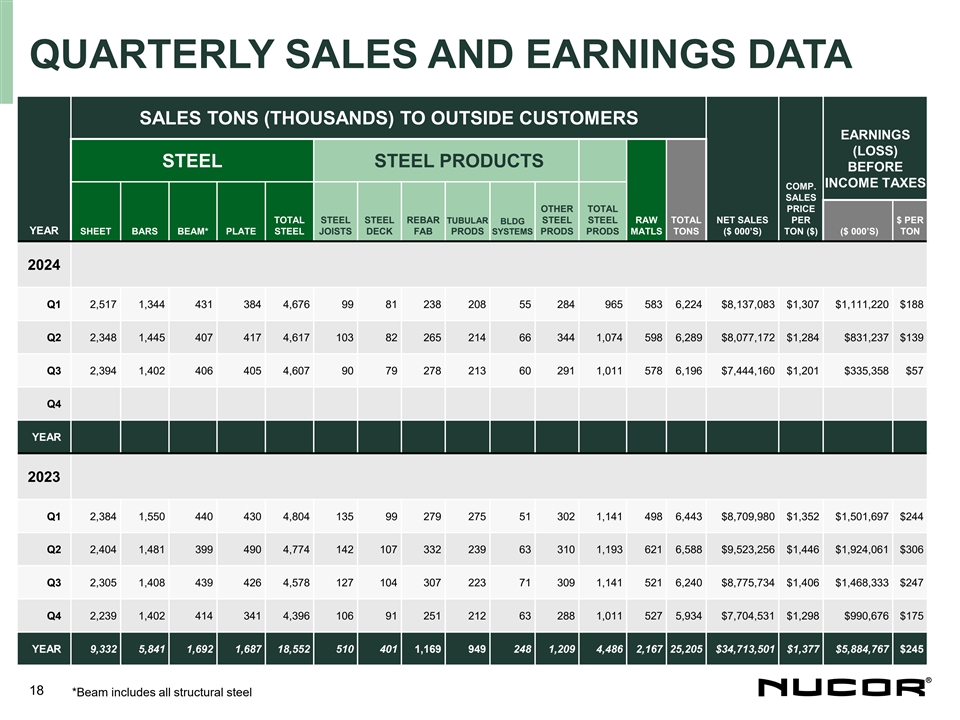
QUARTERLY SALES AND EARNINGS DATA SALES TONS (THOUSANDS) TO OUTSIDE CUSTOMERS EARNINGS (LOSS) STEEL STEEL PRODUCTS BEFORE INCOME TAXES COMP. SALES OTHER TOTAL PRICE TOTAL STEEL STEEL REBAR TUBULAR BLDG STEEL STEEL RAW TOTAL NET SALES PER $ PER YEAR SHEET BARS BEAM* PLATE STEEL JOISTS DECK FAB PRODS SYSTEMS PRODS PRODS MATLS TONS ($ 000’S) TON ($) ($ 000’S) TON 2024 Q1 2,517 1,344 431 384 4,676 99 81 238 208 55 284 965 583 6,224 $8,137,083 $1,307 $1,111,220 $188 Q2 2,348 1,445 407 417 4,617 103 82 265 214 66 344 1,074 598 6,289 $8,077,172 $1,284 $831,237 $139 Q3 2,394 1,402 406 405 4,607 90 79 278 213 60 291 1,011 578 6,196 $7,444,160 $1,201 $335,358 $57 Q4 YEAR 2023 Q1 2,384 1,550 440 430 4,804 135 99 279 275 51 302 1,141 498 6,443 $8,709,980 $1,352 $1,501,697 $244 Q2 2,404 1,481 399 490 4,774 142 107 332 239 63 310 1,193 621 6,588 $9,523,256 $1,446 $1,924,061 $306 Q3 2,305 1,408 439 426 4,578 127 104 307 223 71 309 1,141 521 6,240 $8,775,734 $1,406 $1,468,333 $247 Q4 2,239 1,402 414 341 4,396 106 91 251 212 63 288 1,011 527 5,934 $7,704,531 $1,298 $990,676 $175 YEAR 9,332 5,841 1,692 1,687 18,552 510 401 1,169 949 248 1,209 4,486 2,167 25,205 $34,713,501 $1,377 $5,884,767 $245 18 *Beam includes all structural steel
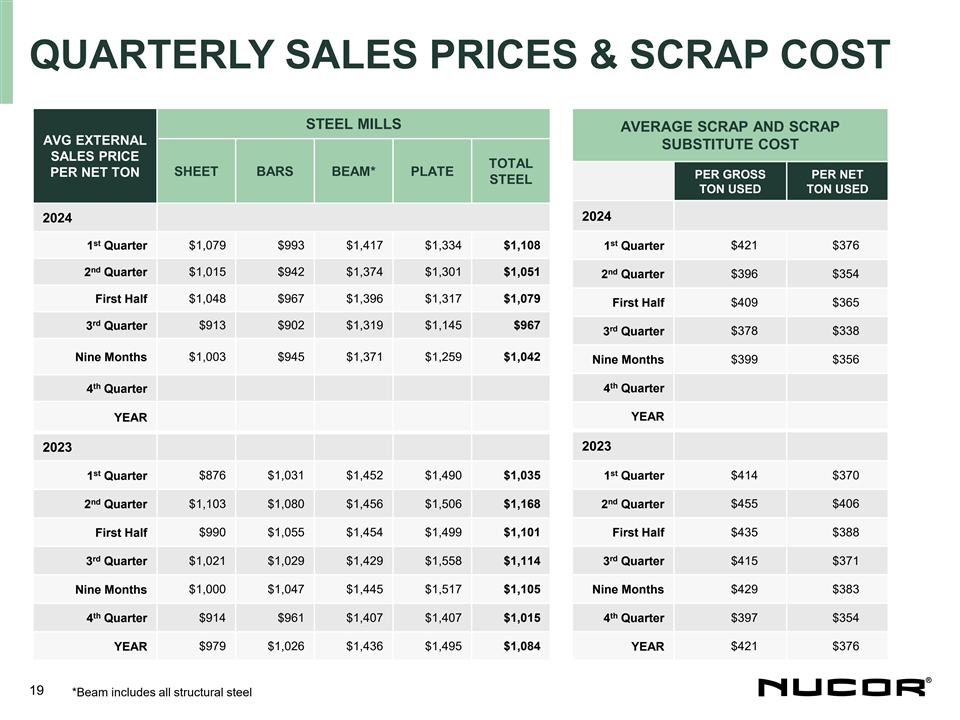
QUARTERLY SALES PRICES & SCRAP COST STEEL MILLS AVERAGE SCRAP AND SCRAP AVG EXTERNAL SUBSTITUTE COST SALES PRICE TOTAL SHEET BARS BEAM* PLATE PER NET TON PER GROSS PER NET STEEL TON USED TON USED 2024 2024 st st 1 Quarter $1,079 $993 $1,417 $1,334 $1,108 $421 $376 1 Quarter nd nd 2 Quarter $1,015 $942 $1,374 $1,301 $1,051 2 Quarter $396 $354 First Half $1,048 $967 $1,396 $1,317 $1,079 First Half $409 $365 rd 3 Quarter $913 $902 $1,319 $1,145 $967 rd $378 $338 3 Quarter Nine Months $1,003 $945 $1,371 $1,259 $1,042 Nine Months $399 $356 th th 4 Quarter 4 Quarter YEAR YEAR 2023 2023 st st 1 Quarter $876 $1,031 $1,452 $1,490 $1,035 1 Quarter $414 $370 nd nd 2 Quarter $1,103 $1,080 $1,456 $1,506 $1,168 2 Quarter $455 $406 $990 $1,055 $1,454 $1,499 $1,101 $435 $388 First Half First Half rd rd 3 Quarter $1,021 $1,029 $1,429 $1,558 $1,114 3 Quarter $415 $371 Nine Months $1,000 $1,047 $1,445 $1,517 $1,105 Nine Months $429 $383 th th 4 Quarter $914 $961 $1,407 $1,407 $1,015 4 Quarter $397 $354 YEAR $979 $1,026 $1,436 $1,495 $1,084 YEAR $421 $376 19 *Beam includes all structural steel
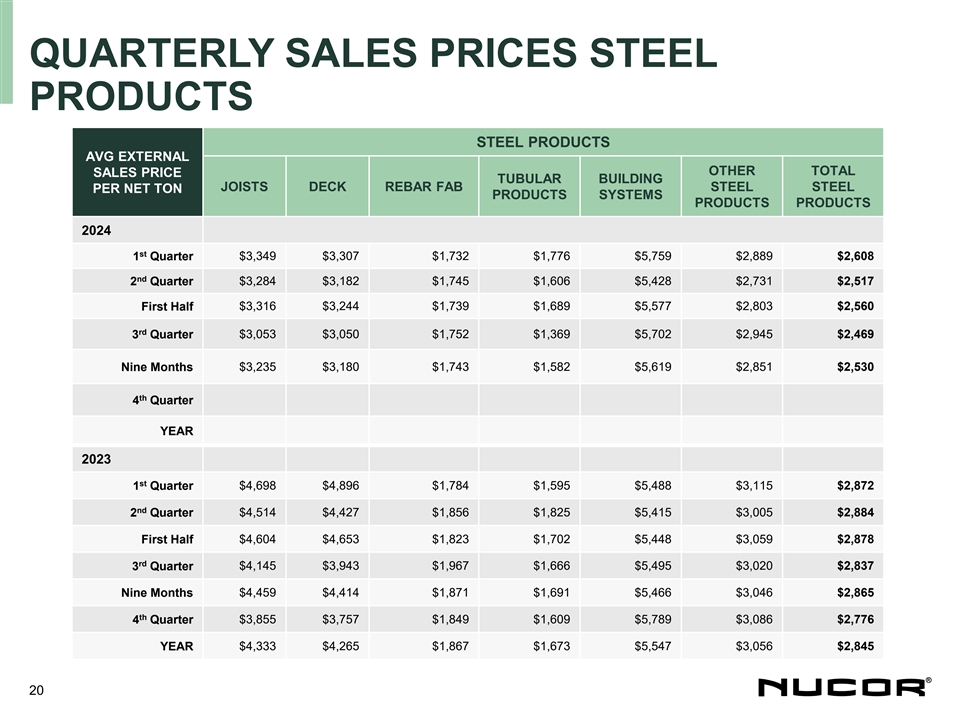
QUARTERLY SALES PRICES STEEL PRODUCTS STEEL PRODUCTS AVG EXTERNAL OTHER TOTAL SALES PRICE TUBULAR BUILDING JOISTS DECK REBAR FAB STEEL STEEL PER NET TON PRODUCTS SYSTEMS PRODUCTS PRODUCTS 2024 st 1 Quarter $3,349 $3,307 $1,732 $1,776 $5,759 $2,889 $2,608 nd 2 Quarter $3,284 $3,182 $1,745 $1,606 $5,428 $2,731 $2,517 First Half $3,316 $3,244 $1,739 $1,689 $5,577 $2,803 $2,560 rd 3 Quarter $3,053 $3,050 $1,752 $1,369 $5,702 $2,945 $2,469 $3,235 $3,180 $1,743 $1,582 $5,619 $2,851 $2,530 Nine Months th 4 Quarter YEAR 2023 st $4,698 $4,896 $1,784 $1,595 $5,488 $3,115 $2,872 1 Quarter nd $4,514 $4,427 $1,856 $1,825 $5,415 $3,005 $2,884 2 Quarter First Half $4,604 $4,653 $1,823 $1,702 $5,448 $3,059 $2,878 rd 3 Quarter $4,145 $3,943 $1,967 $1,666 $5,495 $3,020 $2,837 Nine Months $4,459 $4,414 $1,871 $1,691 $5,466 $3,046 $2,865 th 4 Quarter $3,855 $3,757 $1,849 $1,609 $5,789 $3,086 $2,776 YEAR $4,333 $4,265 $1,867 $1,673 $5,547 $3,056 $2,845 20
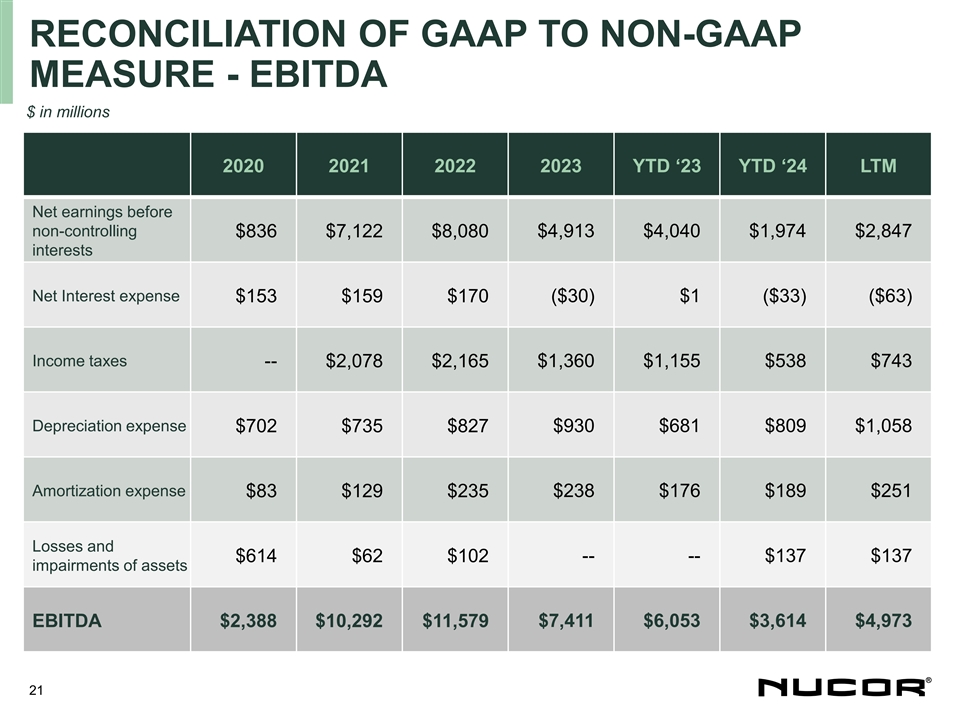
RECONCILIATION OF GAAP TO NON-GAAP MEASURE - EBITDA $ in millions 2020 2021 2022 2023 YTD ‘23 YTD ‘24 LTM Net earnings before non-controlling $836 $7,122 $8,080 $4,913 $4,040 $1,974 $2,847 interests Net Interest expense $153 $159 $170 ($30) $1 ($33) ($63) Income taxes -- $2,078 $2,165 $1,360 $1,155 $538 $743 Depreciation expense $702 $735 $827 $930 $681 $809 $1,058 Amortization expense $83 $129 $235 $238 $176 $189 $251 Losses and $614 $62 $102 -- -- $137 $137 impairments of assets $7,411 $6,053 $3,614 $4,973 EBITDA $2,388 $10,292 $11,579 21

RECONCILIATION OF GAAP TO NON-GAAP MEASURE – FREE CASH FLOW (FCF) $ in millions YTD YTD 2020 2021 2022 2023 LTM 2023 2024 CASH PROVIDED BY $2,697 $6,231 $10,072 $7,112 $5,592 $3,246 $4,766 OPERATING ACTIVITIES CAPITAL EXPENDITURES ($1,543) ($1,622) ($1,948) ($2,214) ($1,496) ($2,294) ($3,012) FREE CASH FLOW $1,154 $4,609 $8,124 $4,898 $4,096 $952 $1,754 22