Management’s Discussion and Analysis
This Management’s Discussion and Analysis (MD&A) contains important information about our business and our performance for the year ended December 31, 2022. This MD&A should be read in conjunction with our 2022 Audited Consolidated Financial Statements, which have been prepared in accordance with International Financial Reporting Standards (IFRS) as issued by the International Accounting Standards Board (IASB).
All dollar amounts are in Canadian dollars unless otherwise stated. All percentage changes are calculated using the rounded numbers as they appear in the tables. This MD&A is current as at March 9, 2023 and was approved by RCI’s Board of Directors (the Board). This MD&A includes forward-looking statements and assumptions. See “About Forward-Looking Information” for more information.
We, us, our, Rogers, Rogers Communications, and the Company refer to Rogers Communications Inc. and its subsidiaries. RCI refers to the legal entity Rogers Communications Inc., not including its subsidiaries. Rogers also holds interests in various investments and ventures.
We are publicly traded on the Toronto Stock Exchange (TSX: RCI.A and RCI.B) and on the New York Stock Exchange (NYSE: RCI).
Effective January 1, 2022, we changed the way in which we report certain subscriber metrics in both our Wireless and Cable segments such that we began presenting postpaid mobile phone subscribers, prepaid mobile phone subscribers, and mobile phone ARPU in our Wireless segment. We also no longer report blended average billings per unit (ABPU). In Cable, we began presenting retail Internet, Video (formerly Television), Smart Home Monitoring, and Home Phone subscribers. These changes are a result of shifts in the ways in which we manage our business, including the significant adoption of our wireless device financing program, and to better align with industry practices. See “Key Performance Indicators” for more information. We have retrospectively amended our 2021 comparative segment results to account for this redefinition.
In this MD&A, first quarter refers to the three months ended March 31, 2022, second quarter refers to the three months ended June 30, 2022, third quarter refers to the three months ended September 30, 2022, fourth quarter refers to the three months ended December 31, 2022, this year refers to the twelve months ended December 31, 2022, and last year refers to the twelve months ended December 31, 2021. All results commentary is compared to the equivalent periods in 2021 or as at December 31, 2021, as applicable, unless otherwise indicated.
Trademarks in this MD&A are owned by Rogers Communications Inc. or an affiliate. This MD&A also includes trademarks of other parties. The trademarks referred to in this MD&A may be listed without the ™ symbols. ©2023 Rogers Communications
ABOUT FORWARD-LOOKING INFORMATION
This MD&A includes “forward-looking information” and “forward-looking statements” within the meaning of applicable securities laws (collectively, “forward-looking information”), and
assumptions about, among other things, our business, operations, and financial performance and condition approved by our management on the date of this MD&A. This forward-looking information and these assumptions include, but are not limited to, statements about our objectives and strategies to achieve those objectives, and about our beliefs, plans, expectations, anticipations, estimates, or intentions.
Forward-looking information:
| • | typically includes words like could, expect, may, anticipate, assume, believe, likely, intend, estimate, plan, project, predict, potential, guidance, outlook, target, and similar expressions, although not all forward-looking information includes them; |
| • | includes conclusions, forecasts, and projections that are based on our current objectives and strategies and on estimates, expectations, assumptions, and other factors, that we believe to have been reasonable at the time they were applied but may prove to be incorrect; and |
| • | was approved by our management on the date of this MD&A. |
Our forward-looking information includes conclusions, forecasts, and projections related to the following items, among others:
| • | revenue; |
| • | total service revenue; |
| • | adjusted EBITDA; |
| • | capital expenditures and capital expenditures excluding Shaw; |
| • | cash income tax payments; |
| • | free cash flow and free cash flow excluding Shaw; |
| • | dividend payments; |
| • | the growth of new products and services; |
| • | expected growth in subscribers and the services to which they subscribe; |
| • | the cost of acquiring and retaining subscribers and deployment of new services; |
| • | continued cost reductions and efficiency improvements; |
| • | our debt leverage ratio; |
| • | statements relating to plans we have implemented in response to COVID-19 and its impact on us; |
| • | the expected timing and completion of the Shaw Transaction and the Freedom Transaction (as defined below), including the associated processes and timelines to obtain the receipt of applicable approvals under the Competition Act (Canada) and the Radiocommunication Act (Canada) (collectively, Key Regulatory Approvals); |
| • | the benefits expected to result from the Shaw Transaction, including corporate, operational, scale, and other synergies, and their anticipated timing; |
| • | the terms and the conditions of Freedom Transaction; and |
| • | all other statements that are not historical facts. |
Specific forward-looking information included in this MD&A includes, but is not limited to, information and statements under “Financial and Operating Guidance” relating to our 2023 consolidated guidance on total service revenue, adjusted EBITDA, capital expenditures excluding Shaw, and free cash flow excluding Shaw. All other statements that are not historical facts are forward-looking information.
2022 ANNUAL REPORT ROGERS COMMUNICATIONS INC. | 11
MANAGEMENT’S DISCUSSION AND ANALYSIS
We base our conclusions, forecasts, and projections (including the aforementioned guidance) on a number of estimates, expectations, assumptions, and other factors, including, among others:
| • | general economic and industry conditions; |
| • | currency exchange rates and interest rates; |
| • | product pricing levels and competitive intensity; |
| • | subscriber growth; |
| • | pricing, usage, and churn rates; |
| • | changes in government regulation; |
| • | technology and network deployment; |
| • | availability of devices; |
| • | timing of new product launches; |
| • | content and equipment costs; |
| • | the integration of acquisitions; |
| • | industry structure and stability; and |
| • | the impact of COVID-19 on our operations, liquidity, financial condition, or results. |
Except as otherwise indicated, this MD&A and our forward-looking information do not reflect the potential impact of any non-recurring or other special items or of any dispositions, monetization events, mergers, acquisitions, other business combinations, or other transactions that may be considered or announced or may occur after the date on which the statement containing the forward-looking information is made.
RISKS AND UNCERTAINTIES
Actual events and results can be substantially different from what is expressed or implied by forward-looking information as a result of risks, uncertainties, and other factors, many of which are beyond our control, including, but not limited to:
| • | regulatory changes; |
| • | technological changes; |
| • | economic, geopolitical, and other conditions affecting commercial activity; |
| • | unanticipated changes in content or equipment costs; |
| • | changing conditions in the entertainment, information, and/or communications industries; |
| • | sports-related work stoppages or cancellations and labour disputes; |
| • | the integration of acquisitions; |
| • | litigation and tax matters; |
| • | the level of competitive intensity; |
| • | the emergence of new opportunities; |
| • | external threats, such as epidemics, pandemics, and other public health crises, natural disasters, the effects of climate change, or cyberattacks, among others; |
| • | risks related to the Shaw Transaction and the Freedom Transaction, including the timing, receipt, and conditions related to the Key Regulatory Approvals; satisfaction of the various conditions to close the Shaw Transaction and the Freedom Transaction; |
financing the Shaw Transaction; the anticipated benefits and successful integration of the businesses and operations of Rogers and Shaw; and the other risks outlined in “Risks and Uncertainties Affecting our Business – Shaw Transaction” in this MD&A; |
| • | new interpretations and new accounting standards from accounting standards bodies; and |
| • | the other risks outlined in “Risks and Uncertainties Affecting our Business”. |
These risks, uncertainties, and other factors can also affect our objectives, strategies, and intentions. Many of these risks, uncertainties, and other factors are beyond our control or our current expectations or knowledge. Should one or more of these risks, uncertainties, or other factors materialize, our objectives, strategies, or intentions change, or any other factors or assumptions underlying the forward-looking information prove incorrect, our actual results and our plans could vary significantly from what we currently foresee.
Accordingly, we warn investors to exercise caution when considering statements containing forward-looking information and caution them that it would be unreasonable to rely on such statements as creating legal rights regarding our future results or plans. We are under no obligation (and we expressly disclaim any such obligation) to update or alter any statements containing forward-looking information or the factors or assumptions underlying them, whether as a result of new information, future events, or otherwise, except as required by law. All of the forward-looking information in this MD&A is qualified by the cautionary statements herein.
BEFORE MAKING AN INVESTMENT DECISION
Before making any investment decisions and for a detailed discussion of the risks, uncertainties, and environment associated with our business, its operations, and its financial performance and condition, fully review the sections in this MD&A entitled “Regulation in our Industry”, “Risk Management”, and “Environmental, Social, and Governance (ESG)”, as well as our various other filings with Canadian and US securities regulators, which can be found at sedar.com and sec.gov, respectively.
FOR MORE INFORMATION
You can find more information about us, including our Annual Information Form, on our website (investors.rogers.com), on SEDAR (sedar.com), and on EDGAR (sec.gov), or you can e-mail us at investor.relations@rci.rogers.com. Information on or connected to these and any other websites referenced in this document does not constitute part of this MD&A.
You can also find information about our governance practices, corporate social responsibility reporting, a glossary of communications and media industry terms, and additional information about our business at investors.rogers.com.
12 | ROGERS COMMUNICATIONS INC. 2022 ANNUAL REPORT
Rogers is a leading Canadian technology and media company that provides communications services and entertainment to consumers and businesses. Our shares are publicly traded on the Toronto Stock Exchange (TSX: RCI.A and RCI.B) and on the New York Stock Exchange (NYSE: RCI).
Almost all of our operations and sales are in Canada. We have a highly skilled and diversified workforce of approximately 22,000 employees. Our head office is in Toronto, Ontario and we have numerous offices across Canada. We report our results of operations in three reportable segments. See “Understanding Our Business” for more information.
KEY FINANCIAL INFORMATION
Years ended December 31 | ||||||||||||
(In millions of dollars, except margins and per share amounts) | 2022 | 2021 | % Chg | |||||||||
Consolidated | ||||||||||||
Total revenue |
| 15,396 |
|
| 14,655 |
|
| 5 |
| |||
Total service revenue 1 |
| 13,305 |
|
| 12,533 |
|
| 6 |
| |||
Adjusted EBITDA 2 |
| 6,393 |
|
| 5,887 |
|
| 9 |
| |||
Adjusted EBITDA margin 2 |
| 41.5% |
|
| 40.2% |
|
| 1.3 pts |
| |||
Net income |
| 1,680 |
|
| 1,558 |
|
| 8 |
| |||
Adjusted net income 2 |
| 1,915 |
|
| 1,803 |
|
| 6 |
| |||
Basic earnings per share | $ | 3.33 |
| $ | 3.09 |
|
| 8 |
| |||
Adjusted basic earnings per share 2 | $ | 3.79 |
| $ | 3.57 |
|
| 6 |
| |||
Capital expenditures 3 |
| 3,075 |
|
| 2,788 |
|
| 10 |
| |||
Cash provided by operating activities |
| 4,493 |
|
| 4,161 |
|
| 8 |
| |||
Free cash flow 2 |
| 1,773 |
|
| 1,671 |
|
| 6 |
| |||
Free cash flow excluding Shaw financing 2 | 1,985 | 1,671 | 19 | |||||||||
Wireless | ||||||||||||
Service revenue | 7,131 | 6,666 | 7 | |||||||||
Revenue |
| 9,197 |
|
| 8,768 |
|
| 5 |
| |||
Adjusted EBITDA |
| 4,469 |
|
| 4,214 |
|
| 6 |
| |||
Adjusted EBITDA service margin 4 |
| 62.7% |
|
| 63.2% |
|
| (0.5 pts | ) | |||
Adjusted EBITDA margin 5 | 48.6% | 48.1% | 0.5 pts | |||||||||
Cable | ||||||||||||
Revenue |
| 4,071 |
|
| 4,072 |
|
| – |
| |||
Adjusted EBITDA |
| 2,058 |
|
| 2,013 |
|
| 2 |
| |||
Adjusted EBITDA margin | 50.6% | 49.4% | 1.2 pts | |||||||||
Media | ||||||||||||
Revenue |
| 2,277 |
|
| 1,975 |
|
| 15 |
| |||
Adjusted EBITDA |
| 69 |
|
| (127 | ) |
| n/m |
| |||
Adjusted EBITDA margin |
| 3.0% |
|
| (6.4)% |
|
| 9.4 pts |
| |||
n/m – not meaningful
| 1 | As defined. See “Key Performance Indicators”. |
| 2 | Adjusted EBITDA is a total of segments measure. Adjusted EBITDA margin is a supplementary financial measure. Adjusted basic earnings per share is a non-GAAP ratio. Adjusted net income and free cash flow excluding Shaw financing are non-GAAP financial measures; adjusted net income is a component of adjusted basic earnings per share. Free cash flow is a capital management measure. These are not standardized financial measures under IFRS and might not be comparable to similar financial measures disclosed by other companies. See “Non-GAAP and Other Financial Measures” for more information about these measures. |
| 3 | Includes additions to property, plant and equipment net of proceeds on disposition, but does not include expenditures for spectrum licences, additions to right-of-use assets, or assets acquired through business combinations. |
| 4 | Calculated using Wireless service revenue. |
| 5 | Calculated using Wireless total revenue. |
2022 ANNUAL REPORT ROGERS COMMUNICATIONS INC. | 13
MANAGEMENT’S DISCUSSION AND ANALYSIS
KEY PERFORMANCE INDICATORS
|
| As at or years ended December 31 | |||||||||||
|
| 2022 | 2021 | Chg | |||||||||
| Subscriber results (in thousands) 1 | ||||||||||||
Wireless postpaid mobile phone net additions |
| 545 |
|
| 403 |
|
| 142 |
| |||
Wireless prepaid mobile phone net additions (losses) |
| 89 |
|
| (94 | ) |
| 183 |
| |||
Wireless mobile phone subscribers |
| 10,647 |
|
| 10,013 |
|
| 634 |
| |||
Retail Internet net additions |
| 52 |
|
| 71 |
|
| (19 | ) | |||
Retail Internet subscribers 2 |
| 2,284 |
|
| 2,229 |
|
| 55 |
| |||
Video net additions (losses) |
| 32 |
|
| (9 | ) |
| 41 |
| |||
Video subscribers 2 |
| 1,525 |
|
| 1,491 |
|
| 34 |
| |||
Smart Home Monitoring net losses |
| (12 | ) |
| (18 | ) |
| 6 |
| |||
Smart Home Monitoring subscribers 2 |
| 101 |
|
| 113 |
|
| (12 | ) | |||
Home Phone net losses |
| (76 | ) |
| (90 | ) |
| 14 |
| |||
Home Phone subscribers 2 |
| 836 |
|
| 911 |
|
| (75 | ) | |||
Customer relationships net additions |
| 6 |
|
| 31 |
|
| (25 | ) | |||
Total customer relationships 2 | 2,590 | 2,581 | 9 | |||||||||
| Additional Wireless metrics 1 | ||||||||||||
Postpaid mobile phone churn (monthly) |
| 0.90% |
|
| 0.88% |
|
| 0.02 pts |
| |||
Mobile phone ARPU (monthly) 1,3 | $ | 57.89 | $ | 56.83 | $ | 1.06 | ||||||
| Additional Cable metrics 1 | ||||||||||||
ARPA (monthly) 1,3 | $ | 130.12 |
| $ | 132.58 |
| ($ | 2.46 | ) | |||
Penetration |
| 53.9% |
|
| 54.9% |
|
| (1.0 pts | ) | |||
| Ratios | ||||||||||||
Capital intensity 1,3 |
| 20.0% |
|
| 19.0% |
|
| 1.0 pts |
| |||
Dividend payout ratio of net income 1,3 |
| 60.1% |
|
| 64.8% |
|
| (4.7 pts | ) | |||
Dividend payout ratio of free cash flow 1,3 |
| 57.0% |
|
| 60.4% |
|
| (3.4 pts | ) | |||
Return on assets 1,3 |
| 3.0% |
|
| 3.7% |
|
| (0.7 pts | ) | |||
Debt leverage ratio 4 |
| 3.5 |
|
| 3.4 |
|
| 0.1 |
| |||
Debt leverage ratio excluding Shaw financing 4 |
| 3.1 |
|
| 3.4 |
|
| (0.3 | ) | |||
| Employee-related information | ||||||||||||
Total active employees | 22,000 | 23,000 | (1,000 | ) | ||||||||
| 1 | As defined. See “Key Performance Indicators”. |
| 2 | On March 16, 2022, we acquired approximately 3,000 retail Internet subscribers, 2,000 Video subscribers, 1,000 Home Phone subscribers, and 3,000 customer relationships as a result of our acquisition of a small regional cable company in Nova Scotia, which are not included in net additions, but do appear in the ending total balances for December 31, 2022. |
| 3 | Mobile phone ARPU, ARPA, capital intensity, dividend payout ratio of net income, dividend payout ratio of free cash flow, and return on assets are supplementary financial measures. See “Non-GAAP and Other Financial Measures” for an explanation as to the composition of these measures. |
| 4 | Debt leverage ratio is a capital management measure. Debt leverage ratio excluding Shaw financing is a non-GAAP ratio. Adjusted net debt excluding Shaw financing is a non-GAAP financial measure and is a component of debt leverage ratio excluding Shaw financing. These are not standardized financial measures under IFRS and might not be comparable to similar financial measures disclosed by other companies. See “Non-GAAP and Other Financial Measures” and “Financial Condition” for more information about these measures. |
14 | ROGERS COMMUNICATIONS INC. 2022 ANNUAL REPORT
REVENUE
Total revenue and total service revenue increased by 5% and 6%, respectively, this year, driven primarily by revenue growth in our Wireless and Media businesses.
Wireless service revenue increased by 7% this year, primarily as a result of higher roaming revenue associated with significantly increased travel, as COVID-19-related global travel restrictions were removed, and a larger postpaid mobile phone subscriber base, partially offset by credits granted to subscribers relating to the July network outage. Wireless equipment revenue decreased by 2% as a result of fewer of our new subscribers purchasing devices and fewer device upgrades by existing subscribers.
Cable revenue was in line with 2021, primarily as a result of increased competitive promotional activity and credits granted to subscribers relating to the July network outage, offset by service pricing changes made in the first quarter and an increase in total customer relationships.
Media revenue increased by 15% this year, primarily as a result of higher Toronto Blue Jays revenue, driven by the increase to full audience capacity for the full year at the Rogers Centre, and higher advertising revenue, partially offset by lower Today’s Shopping Choice revenue.
ADJUSTED EBITDA
Consolidated adjusted EBITDA increased 9% this year and our adjusted EBITDA margin increased by 130 basis points with increases in each of our segments.
Wireless adjusted EBITDA increased 6% this year, primarily due to the flow-through impact of higher revenue as discussed above. This gave rise to an adjusted EBITDA service margin of 62.7%.
Cable adjusted EBITDA increased 2% this year, primarily as a result of lower operating expenses due to recognized cost efficiencies. This gave rise to an adjusted EBITDA margin of 50.6%.
Media adjusted EBITDA increased by $196 million this year, primarily due to higher revenue as discussed above, partially offset by higher Toronto Blue Jays player payroll costs and higher production and other operating costs as a result of increased activities as COVID-19 restrictions were removed.
NET INCOME AND ADJUSTED NET INCOME
Net income and adjusted net income increased by 8% and 6%, respectively, this year, primarily as a result of higher adjusted EBITDA, partially offset by higher finance costs attributable to the Shaw senior note financing (as defined below). See “Review of Consolidated Performance” for more information.
CASH FLOW AND AVAILABLE LIQUIDITY
We returned substantial cash to shareholders this year through the payment of $1.01 billion in dividends. In addition, we declared a $0.50 per share dividend on February 1, 2023.
Our cash provided by operating activities increased by 8% this year, primarily a result of higher adjusted EBITDA, as well as the impact of lower income taxes paid, partially offset by higher investment in net operating assets and higher interest paid, related to the Shaw senior note financing. Free cash flow increased 6% this year, primarily as a result of higher adjusted EBITDA.
Our debt leverage ratio was 3.5 as at December 31, 2022, up from 3.4 as at December 31, 2021, driven by higher adjusted net debt, primarily due to an increase in our long-term debt from the issuance of US$7.05 billion and $4.25 billion of senior notes and US$750 million of subordinated notes, and an increase in our short-term borrowings. Our debt leverage ratio excluding Shaw financing was 3.1 as at December 31, 2022, down from 3.4 as at December 31, 2021, primarily due to higher adjusted EBITDA.
Our overall weighted average cost of all borrowings was 4.50% as at December 31, 2022 (2021 – 3.95%) and our overall weighted average term to maturity on our debt was 11.8 years as at December 31, 2022 (2021 – 11.6 years).
We ended the year with approximately $4.9 billion of available liquidity1 (2021 – $4.2 billion), including $4.4 billion (2021 – $3.1 billion) available under our bank and letter of credit facilities and $0.5 billion (2021 – $0.7 billion) in cash and cash equivalents. We also held $12.8 billion in restricted cash and cash equivalents that will be used to partially fund the cash consideration of the Shaw Transaction (see “Managing our Liquidity and Financial Resources”).
| 1 | Available liquidity is a capital management measure. See “Non-GAAP and Other Financial Measures” for more information about this measure. |
2022 ANNUAL REPORT ROGERS COMMUNICATIONS INC. | 15
MANAGEMENT’S DISCUSSION AND ANALYSIS
On March 15, 2021, we announced an agreement with Shaw Communications Inc. (Shaw) to acquire all of Shaw’s issued and outstanding Class A Participating Shares and Class B Non-Voting Participating Shares for a price of $40.50 per share in cash, with the exception of the shares held by the Shaw Family Living Trust, the controlling shareholder of Shaw, and related persons (Shaw Family Shareholders). The Shaw Family Shareholders will receive 60% of the consideration for their shares in the form of RCI Class B Non-Voting common shares on the basis of the volume-weighted average trading price for such shares for the ten trading days ended March 12, 2021, and the balance in cash. The acquisition (Shaw Transaction) is valued at approximately $26 billion, including the assumption of approximately $6 billion of Shaw debt.
The Shaw Transaction will be implemented through a court-approved plan of arrangement under the Business Corporations Act (Alberta). The Shaw Transaction is subject to other customary closing conditions, including receipt of the Key Regulatory Approvals. Rogers, Shaw, and the Shaw Family Living Trust have agreed to extend the outside date for the Shaw Transaction to March 31, 2023.
FINANCING
In connection with the Shaw Transaction, we entered into a binding commitment letter for a committed credit facility with a syndicate of banks in an original amount up to $19 billion. In 2021, we entered into a $6 billion non-revolving credit facility (term loan facility) related to the Shaw Transaction, which reduced the amount available under the committed credit facility to $13 billion. During the first quarter of 2022, we issued US$7.05 billion and $4.25 billion of senior notes (Shaw senior note financing), which reduced the amount available under the committed credit facility to nil and the facility was terminated. The arrangement agreement between Rogers and Shaw requires us to maintain sufficient liquidity to ensure we are able to fund the Shaw Transaction upon closing and, as a result of the termination of the committed credit facility, we have restricted the use of approximately $12.8 billion in funds, which are recognized as “restricted cash and cash equivalents” on our 2022 Consolidated Statements of Financial Position. The substantial majority of these funds were held as cash deposits with major financial institutions as at December 31, 2022. The remaining restricted cash equivalents have been invested in short-term, highly liquid investments and are readily convertible to cash with no associated penalties.
The senior notes (except the $1.25 billion senior notes due 2025) also contain a “special mandatory redemption” provision (SMR notes), which initially required them to be redeemed at 101% of principal amount (plus accrued interest) if the Shaw Transaction was not consummated prior to December 31, 2022 (SMR outside date). In August 2022, we received consent from the note holders of the SMR notes, and paid an initial consent fee of $557 million (including directly attributable transaction costs), to extend the SMR outside date to December 31, 2023, to ensure this financing remains in place should the Shaw Transaction close after December 31, 2022. As at December 31, 2022, because the Shaw Transaction had not yet been consummated and we had not become obligated to complete a special mandatory redemption, we were required to pay $262 million of additional consent fees to
the holders of SMR notes in January 2023. Additionally, in September 2022, we extended the drawdown period on the $6 billion term loan facility from December 31, 2022 to December 31, 2023. See “Managing our Liquidity and Financial Resources” for more information on the committed facility and our restricted cash and cash equivalents balance.
We also expect that RCI will either assume Shaw’s senior notes or provide a guarantee of Shaw’s payment obligations under those senior notes upon closing the Shaw Transaction and, in either case, Rogers Communications Canada Inc. (RCCI) will guarantee Shaw’s payment obligations under those senior notes.
REGULATORY APPROVAL STATUS
On March 24, 2022, the Canadian Radio-television and Telecommunications Commission (CRTC) approved our acquisition of Shaw’s broadcasting services, subject to a number of conditions and modifications, including:
| • | the contribution of $27.2 million in benefits to the broadcasting system through various initiatives and funds, including those that support the production of content by Indigenous producers and members of equity-seeking groups; |
| • | annual reporting on our commitments to increase our support for local news, including by employing more journalists at our Citytv stations across the country and by producing an additional 48 news specials each year that reflect local communities; |
| • | the distribution of at least 45 independent English- and French-language services on each of our cable and satellite services; and |
| • | safeguards to ensure that cable providers relying on signals delivered by us will continue to be able to serve their communities, including those in rural and remote areas. |
The CRTC approval only relates to the broadcasting elements of the Shaw Transaction.
On May 9, 2022, the Competition Bureau (Bureau) announced it had filed applications to the Competition Tribunal (Tribunal) opposing the Shaw Transaction and requesting an injunction to prevent closing of the Shaw Transaction until the Bureau’s application to challenge the Shaw Transaction could be decided.
On June 17, 2022, we announced a divestiture agreement with Shaw and Quebecor Inc. (Quebecor) for the sale of Freedom Mobile Inc. (Freedom) (Freedom Transaction). The agreement provides for the sale of all Freedom-branded wireless and Internet customers and all of Freedom’s infrastructure, spectrum licences, and retail locations. The Freedom Transaction also includes long-term agreements to provide transport (including backhaul and backbone), roaming, and other services to Quebecor. Subsequent to closing, Rogers and Quebecor will provide each other with customary transition services as necessary to operate Freedom’s business for a reasonable period of time and to facilitate the separation of Freedom’s business from the other businesses and operations of Shaw and its affiliates. The agreement does not contemplate the sale of Shaw Mobile-branded wireless subscribers. Under the terms of the agreement, Quebecor has agreed to pay Shaw $2.85 billion on a cash-free, debt-free basis.
The Freedom Transaction is conditional, among other things, on the completion of the Shaw Transaction, compliance with the Competition Act (Canada), and the approval of the Minister of
16 | ROGERS COMMUNICATIONS INC. 2022 ANNUAL REPORT
Innovation, Science and Industry and would close substantially concurrently with closing of the Shaw Transaction. On August 12, 2022, we announced Rogers and Shaw had entered into definitive agreements with Quebecor.
On October 25, 2022, the Minister for Innovation, Science and Industry as an administrative matter denied our initial March 2021 request to transfer Freedom’s spectrum licences to Rogers. In contemplation of the proposed Freedom Transaction, the Minister set out certain conditions (which Quebecor announced its intention to accept) before the Minister would consider approving a transfer of Freedom’s spectrum licences to Videotron Inc. (Videotron). On December 31, 2022, the Minister indicated he would not render his decision on the transfer of Freedom’s spectrum licences to Videotron until there was clarity on the ongoing legal process arising from the Tribunal’s decision. The proposed Freedom Transaction continues to be reviewed by Innovation, Science and Economic Development Canada (ISED Canada).
The Tribunal proceedings commenced on November 7, 2022 and final oral arguments were completed on December 14, 2022. On December 29, 2022, the Tribunal released its summary decision, dismissing the Bureau’s application to block the Shaw Transaction. Subsequently, on December 30, 2022, the Bureau announced it would appeal the Tribunal’s decision to the Federal Court of Appeal. The Federal Court of Appeal held a hearing on January 24,
2023, during which it issued a ruling from the bench dismissing the Bureau’s appeal and upholding the Tribunal’s decision. On January 24, 2023, following the Federal Court of Appeal’s decision, the Bureau announced it would not be pursuing a further appeal in the case. As a result, there are no further impediments under the Competition Act to closing the Shaw Transaction or the Freedom Transaction. On January 25, 2023, the House of Commons Standing Committee on Industry and Technology held a second public hearing regarding the Shaw Transaction, including the proposed Freedom Transaction, at which members of management for Rogers, Shaw, and Quebecor, among others, appeared.
Given the ongoing regulatory process and the parties’ continued commitment to the Shaw Transaction, Rogers, Shaw, and the Shaw Family Living Trust have agreed to extend the outside date for closing the Shaw Transaction to March 31, 2023 (with the consent of Quebecor). The outside date for the proposed Freedom Transaction coincides with the outside date of the Shaw Transaction. Nonetheless, the time required for ISED Canada to issue its approval is uncertain and could result in further delays in, or prevent the closing of, the Shaw Transaction and the Freedom Transaction.
The Transaction is subject to a number of additional risks. For more information, see “Risks and Uncertainties Affecting our Business – Shaw Transaction”.
2022 ANNUAL REPORT ROGERS COMMUNICATIONS INC. | 17
MANAGEMENT’S DISCUSSION AND ANALYSIS
Rogers is a leading Canadian technology and media company.
THREE REPORTABLE SEGMENTS
We report our results of operations in three reportable segments. Each segment and the nature of its business are as follows:
| Segment | Principal activities | |
Wireless | Wireless telecommunications operations for Canadian consumers and businesses. | |
Cable | Cable telecommunications operations, including Internet, television and other video (Video), telephony (Home Phone), and smart home monitoring services for Canadian consumers and businesses, and network connectivity through our fibre network and data centre assets to support a range of voice, data, networking, hosting, and cloud-based services for the business, public sector, and carrier wholesale markets. | |
Media | A diversified portfolio of media properties, including sports media and entertainment, television and radio broadcasting, specialty channels, multi-platform shopping, and digital media. | |
See “Capability to Deliver Results” for more information about our extensive wireless and cable networks and significant wireless spectrum position.
Wireless and Cable are operated by our wholly owned subsidiary, RCCI, and certain of our other wholly owned subsidiaries. Media is operated by our wholly owned subsidiary, Rogers Media Inc., and its subsidiaries.
WIRELESS
Rogers is a Canadian leader in delivering a range of innovative wireless network technologies and services. We were the first Canadian carrier to launch a 5G network and we have the largest 5G network in Canada, serving over 1,900 communities as at December 31, 2022. Our postpaid and prepaid wireless services are offered under the Rogers, Fido, and chatr brands, and provide consumers and businesses with the latest wireless devices, services, and applications including:
| • | mobile high-speed Internet access, including our Rogers Infinite unlimited data plans; |
| • | wireless voice and enhanced voice features; |
| • | Express Pickup, a convenient service for purchasing devices online or through a customer care agent, with the ability to pick up in-store as soon as the same day; |
| • | direct device shipping to the customer’s location of choice; |
| • | device financing; |
| • | device protection; |
| • | global voice and data roaming, including Roam Like Home and Fido Roam; |
| • | wireless home phone; |
| • | advanced wireless solutions for businesses, including wireless private network services; |
| • | bridging landline phones with wireless phones; and |
| • | machine-to-machine solutions and Internet of Things (IoT) solutions. |
CABLE
We are one of the largest cable providers in Canada. Our cable network provides an innovative and leading selection of high-speed broadband Internet access, Internet protocol-based (IP) television, applications, online viewing, phone, smart home monitoring, and advanced home WiFi services to consumers in Ontario, New Brunswick, Nova Scotia, and on the island of Newfoundland. We also provide services to businesses across Canada that aim to meet the increasing needs of today’s critical business applications.
In 2021, we launched Ignite Internet Gigabit 1.5 in select areas, giving customers access to even faster Internet service. We also expanded the Ignite WiFi Hub app with enhanced Active Time Details and Advanced Security to give customers greater control over their home WiFi.
In 2022, we launched a new WiFi modem with WiFi 6E, currently the world’s most powerful WiFi technology, and introduced new fibre-powered Ignite Internet packages and bundles with up to 8 gigabit per second (Gbps) symmetrical speeds in select areas.
Internet services include:
| • | Internet access through broadband and fixed wireless access (including basic and unlimited usage packages), security solutions, and e-mail; |
| • | access speeds of up to: |
| • | 1 Gbps, covering our entire Cable footprint; and |
| • | 1.5 Gbps, covering our entire Ontario Cable footprint, with some areas able to receive access speeds of up to 8 Gbps symmetrical speeds; |
| • | Rogers Ignite and Fido Internet unlimited packages, combining fast and reliable speeds with the freedom of unlimited usage and options for self-installation; |
| • | Rogers Ignite WiFi Hub, offering a personalized WiFi experience with a simple digital dashboard for customers to manage their home WiFi network, providing visibility and control over family usage, and Ignite WiFi Pods, an advanced WiFi system you can plug into different electrical outlets in your home to extend your WiFi coverage; and |
| • | Rogers Smart Home Monitoring, offering services such as monitoring, security, automation, energy efficiency, and smart control through a smartphone app. |
Television services include:
| • | local and network TV, made available through traditional digital or IP-based Ignite TV, including starter and premium channel packages along with à la carte channels; |
| • | on-demand television with Ignite TV services; |
| • | cloud-based digital video recorders (DVRs) available with Ignite TV services; |
| • | voice-activated remote controls, restart features, and integrated apps such as YouTube, Netflix, Sportsnet NOW, Amazon Prime Video, Disney+, and Apple TV+ on Ignite TV and Ignite Streaming; |
18 | ROGERS COMMUNICATIONS INC. 2022 ANNUAL REPORT
| • | personal video recorders (PVRs), including Whole Home PVR and 4K PVR capabilities; |
| • | an Ignite TV app, giving customers the ability to experience Ignite TV (including setting recordings) on their smartphone, tablet, laptop, or computer; |
| • | Ignite Streaming, an entertainment add-on for Ignite Internet customers, giving them access to their favourite streaming services in one place; |
| • | Download and Go, the ability to download recorded programs onto your smartphone or tablet to watch at a later time using the Ignite TV app; |
| • | linear and time-shifted programming; |
| • | digital specialty channels; and |
| • | 4K television programming, including regular season Toronto Blue Jays home games and select marquee National Hockey League (NHL) and National Basketball Association (NBA) games. |
Phone services include:
| • | residential and small business local telephony service; and |
| • | calling features such as voicemail, call waiting, and long distance. |
Enterprise services include:
| • | voice, data networking, IP, and Ethernet services over multi-service customer access devices that allow customers to scale and add services, such as private networking, Internet, IP voice, and cloud solutions, which blend seamlessly to grow with their business requirements; |
| • | optical wave, Internet, Ethernet, and multi-protocol label switching services, providing scalable and secure metro and wide area private networking that enables and interconnects critical business applications for businesses that have one or many offices, data centres, or points of presence (as well as cloud applications) across Canada; |
| • | simplified information technology (IT) and network technology offerings with security-embedded, cloud-based, professionally managed solutions; |
| • | extensive cable access network services for primary, bridging, and back-up (including through our wireless network, if applicable) connectivity; and |
| • | specialized telecommunications technical consulting for Internet service providers (ISPs). |
MEDIA
Our portfolio of Media assets, with a focus on sports and regional TV and radio programming, reaches Canadians from coast to coast.
In Sports Media and Entertainment, we own the Toronto Blue Jays, Canada’s only Major League Baseball (MLB) team, and the Rogers Centre event venue, which hosts the Toronto Blue Jays’ home games, concerts, trade shows, and special events.
Our agreement with the NHL (NHL Agreement), which runs through the 2025-2026 NHL season, allows us to deliver more than 1,300 regular season games during a typical season across television, smartphones, tablets, personal computers, and other streaming devices. It also grants Rogers national rights on those platforms to the Stanley Cup Playoffs and Stanley Cup Final, all NHL-related special events and non-game events (such as the NHL All-Star Game and the NHL Draft), and rights to sublicense broadcasting rights.
In Television, we operate several conventional and specialty television networks, including:
| • | Sportsnet’s four regional stations along with Sportsnet ONE, Sportsnet 360, and Sportsnet World; |
| • | Citytv network, which, together with affiliated stations, has broadcast distribution to approximately 78% of Canadian individuals; |
| • | OMNI multicultural broadcast television stations, including OMNI Regional, which provide multilingual newscasts nationally to all digital basic television subscribers; |
| • | specialty channels that include FX (Canada), FXX (Canada), and OLN (formerly Outdoor Life Network); and |
| • | Today’s Shopping Choice, Canada’s only nationally televised shopping channel, which generates a significant and growing portion of its revenue from online sales. |
In Radio, we operate 54 AM and FM radio stations in markets across Canada, including popular radio brands such as 98.1 CHFI, CityNews 680, Sportsnet 590 The FAN, KiSS, JACK, and SONiC.
We also offer a range of digital services and products, including:
| • | our digital sports-related assets, including sportsnet.ca and SN NOW; |
| • | other digital assets, including Citytv NOW; and |
| • | a range of other websites, apps, podcasts, and digital products associated with our various brands and businesses. |
OTHER
We offer several credit cards, including the Rogers World Elite Mastercard, Rogers Connections Mastercard, and Fido Mastercard, which allow customers to earn cashback rewards points on credit card spending.
OTHER INVESTMENTS
We hold interests in a number of associates and joint arrangements, some of which include:
| • | our 37.5% ownership interest in Maple Leaf Sports & Entertainment Ltd. (MLSE), which owns the Toronto Maple Leafs, the Toronto Raptors, Toronto FC, the Toronto Argonauts, and the Toronto Marlies, as well as various associated real estate holdings; and |
| • | our 50% ownership interest in Glentel Inc. (Glentel), a large provider of multicarrier wireless and wireline products and services with several hundred Canadian retail distribution outlets. |
We also hold a number of interests in marketable securities of publicly traded companies, including Cogeco Inc. and Cogeco Communications Inc.
The telecommunications industry is a highly competitive industry served by many national, regional, and reseller players giving consumers a broad choice in service providers and plan offerings. The industry is very capital intensive and requires meaningful, continual investments to implement next-generation technology and to support existing infrastructure. Given the highly regulated nature of the industry, the already competitive dynamic could be further influenced by regulatory change (see “Regulation in our Industry” for more information).
2022 ANNUAL REPORT ROGERS COMMUNICATIONS INC. | 19
MANAGEMENT’S DISCUSSION AND ANALYSIS
Traditional wireline telephony and television services are now offered over the Internet. Consumers continue to change how they choose to communicate or watch video, including with a growing selection of over-the-top (OTT) services, and this is changing the mix of packages and pricing service providers offer and could affect churn levels.
In the media industry, consumer viewing habits continue to shift towards digital and online media consumption and advertisers are directing more advertising dollars to those media channels. In addition, we now compete with a range of digital and online media companies, including large global companies.
WIRELESS
We compete on customer experience, price, quality of service, scope of services, network coverage, sophistication of wireless technology, breadth of distribution, selection of devices, branding, and positioning.
| • | Wireless technology – Our 5G network caters to customers seeking the increased capacity and speed it provides relative to long-term evolution (LTE) networks. We compete with BCE Inc. (Bell) and TELUS Corporation (Telus) at a national level, and with Vidéotron ltée (Videotron), Saskatchewan Telecommunications (SaskTel), and Eastlink Inc. (Eastlink) at a regional level, all of whom operate 5G networks. We also compete with Shaw at a national level, who operates an LTE network. We also compete with these providers on high-speed packet access (HSPA) and global system for mobile communications (GSM) networks and with providers that use alternative wireless technologies, such as WiFi “hotspots” and mobile virtual network operators (MVNO). |
| • | Product, branding, and pricing – we compete nationally with Bell, Telus, Videotron, and Shaw, including their flanker brands Virgin Plus (Bell), Lucky Mobile (Bell), Koodo (Telus), Public Mobile (Telus), Fizz (Videotron), Freedom Mobile (Shaw), and Shaw Mobile (Shaw). We also compete with various regional players and resellers. |
| • | Distribution of services and devices – we have one of the largest distribution networks in the country, and compete with other service providers for dealers, prime locations for our own stores, and third-party retail distribution shelf space. We also compete with other service providers on the quality and ease of use of our self-serve options and other digital capabilities. |
| • | Wireless networks – consolidation amongst regional players, or with incumbent carriers (including through the Freedom Transaction), could alter the regional or national competitive landscapes for Wireless. Additionally, certain service providers that currently do not offer wireless products or services have purchased spectrum licences and could enter the market in the future. |
| • | Spectrum – we currently have the largest spectrum position in the country, including the spectrum licences we obtained through the 3500 MHz auction held in 2021. On May 21, 2021, ISED Canada announced the decision to repurpose the 3800 MHz spectrum band to support 5G services. The 3800 MHz spectrum licence auction is scheduled to commence in October 2023. The 3800 MHz spectrum licences, along with other frequency bands, are essential to the deployment of 5G networks. The outcome of this auction may increase competition. See “Regulation in our Industry” for more information. |
CABLE
Internet
We compete with other ISPs that offer fixed-connection residential high-speed Internet access services. Rogers and Fido high-speed Internet services compete directly with, among others:
| • | Bell’s Internet services in Ontario, New Brunswick, Nova Scotia, and on the island of Newfoundland, including Virgin Plus; |
| • | various resellers, such as TekSavvy and others, using wholesale telecommunication company digital subscriber line (DSL) and cable third-party Internet access (TPIA) services in local markets; |
| • | smaller Internet service providers, such as Beanfield Metroconnect, in metropolitan areas; and |
| • | newer providers offering low Earth orbiting satellite Internet service in underserved regions. |
A number of different players in the Canadian market also compete for enterprise network and communications services. There are relatively few national providers, but each market has its own competitors that usually focus on the geographic areas in which they have the most extensive networks. In the enterprise market, we compete with facilities- and non-facilities-based telecommunications service providers. In markets where we own network infrastructure, we compete with incumbent fibre-based providers. Our main competitors are as follows:
| • | Ontario – Bell, Cogeco Data Services, Xplore, and Digital Colony; |
| • | Quebec – Bell, Telus, and Videotron; |
| • | Atlantic Canada – Bell, Xplore, and Eastlink; and |
| • | Western Canada – Shaw, Telus, and Digital Colony. |
Television
We compete with:
| • | other Canadian multi-channel broadcast distribution undertakings (BDUs), including Bell, Shaw, and other satellite and IPTV providers; |
| • | OTT video offerings through providers like Netflix, YouTube, Apple, Amazon Prime Video, Crave, Google, Disney+, DAZN, Paramount+, and other channels streaming their own content; and |
| • | over-the-air local and regional broadcast television signals received directly through antennas, the illegal distribution of Canadian and international channels via video streaming boxes, and the illegal reception of US direct broadcast satellite services. |
Phone
While Phone represents a small portion of our business, we compete with other telephony service providers, including:
| • | Bell’s wireline phone service in Ontario, New Brunswick, Nova Scotia, and on the island of Newfoundland; |
| • | incumbent local exchange carrier (ILEC) local loop resellers and voice over IP (VoIP) service providers (such as Comwave Networks Inc.), other VoIP-only service providers (such as Vonage and Skype), and other voice applications that use the Internet access services of ISPs (such as Facebook and WhatsApp); and |
| • | substitution of wireline for wireless products, including mobile phones and wireless home phone products. |
MEDIA
Competition in Sports Media and Entertainment includes other:
| • | televised and online sports broadcasters; |
| • | Toronto professional teams, for attendance at Toronto Blue Jays games; |
20 | ROGERS COMMUNICATIONS INC. 2022 ANNUAL REPORT
| • | MLB teams, for Toronto Blue Jays players and fans; |
| • | local sporting and special event venues; |
| • | professional sports teams, for merchandise sales revenue; and |
| • | new digital sports media companies. |
Television and Radio, both of which are focused on local and regional content, compete for audiences and advertisers with:
| • | other Canadian television and radio stations, including those owned and operated by the CBC, Bell Media, and Corus Entertainment; |
| • | OTT video offerings through providers like Netflix, YouTube, Apple, Amazon Prime Video, Crave, Google, Disney+, DAZN, Paramount+, and other channels streaming their own content; |
| • | OTT radio offerings, such as iHeartRadio, Apple Music, Spotify, Sirius satellite radio, and Radioplayer Canada; |
| • | other media, including newspapers, magazines, and outdoor advertising; and |
| • | other technologies available on the Internet or through the cloud, such as social media platforms, online web information services, digital assistants, music downloading, and portable media players. |
Today’s Shopping Choice’s model of live, hosted-video sales content and its robust online shopping experience competes with:
| • | pure play e-commerce retailers servicing Canada; |
| • | select branded retailers in Canada and their related e-commerce websites; |
| • | other available television-shopping channels and infomercials that sell products on television; and |
| • | direct-to-consumer livestream video shopping events, social commerce, and shoppable video technologies that are rapidly emerging online. |
Our digital media products compete for audiences and advertisers with:
| • | online information and entertainment websites and apps, including digital news services, streaming services, and content available via social networking services; |
| • | magazines, both digital and printed; and |
| • | other traditional media, such as TV and radio. |
The telecommunications industry in Canada is very capital intensive and highly regulated. Our reportable segments are affected by various overarching trends relating to changing technologies, consumer demands, economic conditions, and regulatory developments, all of which could limit essential future investments in the Canadian marketplace. See “Risks and Uncertainties Affecting our Business” and “Regulation in our Industry” for more information. Below is a summary of the industry trends affecting our specific reportable segments.
WIRELESS TRENDS
The ongoing extensive investment made by Canadian wireless providers has created far-reaching and sophisticated wireless networks that have enabled consumers and businesses to utilize fast multimedia capabilities through wireless data services.
Consumer demand for mobile devices, digital media, and on-demand content is pushing providers to build networks that can support the expanded use of applications, mobile video, messaging, and other wireless data. Mobile commerce continues to increase as more devices and platforms adopt secure technology to facilitate wireless transactions.
Wireless providers continue to invest in the next generation of technologies, like 5G, to meet increasing data demands. New products and applications on the wireless network, such as wireless private networks, will continue to rely on ultra-reliable, low latency transport networks, capable of supporting both wireless and wireline traffic.
We were the first Canadian carrier to launch a 5G network and the first Canadian carrier to begin rolling out a 5G standalone core network. Our 5G network is the largest 5G network in Canada, reaching more than 1,900 communities and 82% of the Canadian population as at December 31, 2022.
To help make the cost of new wireless devices more affordable for consumers, Rogers and other Canadian wireless carriers offer wireless device financing programs, whereby consumers can finance up to the full cost of the device over a 24-month term at 0% interest. We believe being able to finance devices over 24 months helps reduce subscriber churn.
In addition to the wireless device financing plans now available, subscribers are increasingly bringing their own devices or keeping their existing devices longer and therefore may not enter into term contracts for wireless services. This may negatively impact subscriber churn, but may also create gross addition subscriber opportunities as a result of increased churn from other carriers. This trend may also negatively impact the monthly service fees charged to subscribers as they shop for plans that best meet their needs.
Wireless market penetration in Canada is approximately 108% of the population (compared to penetration of 139% in the US) and is expected to continue growing, per the Bank of America Merrill Lynch October 2022 Global Wireless Matrix and as a result of rising immigration levels.
CABLE TRENDS
Economic conditions, technology advancements, non-traditional competitors, consumer behaviours, and regulatory developments are key areas influencing Cable. This market is very capital intensive, and a strong Internet offering is the backbone to effectively serving this market. Applications on the Internet are increasingly being used as a substitute for wireline telephone services, and televised content is increasingly available online. Downward television tier migration (cord shaving) and television cancellation with the intent of substitution (cord cutting) has continued with increased adoption of OTT services.
Canada’s economic condition continues to be impacted by recessionary fears, rising interest rates and higher inflation. Housing affordability remains a concern and rising immigration levels may push housing demand and supply further apart, thus impacting the demand for residential cable services.
2022 ANNUAL REPORT ROGERS COMMUNICATIONS INC. | 21
MANAGEMENT’S DISCUSSION AND ANALYSIS
Cable and wireline companies are expanding their service offerings to include faster broadband Internet, including consistently offering download speeds of 1.5 Gbps, with certain plans offering symmetrical speeds of up to 8 Gbps in select areas, and Internet offerings with unlimited bandwidth. Consumers are demanding faster-than-ever speeds for streaming online media, uploading personal content, playing online video games, and for their ever-growing number of connected devices. In order to help facilitate these speeds, cable and wireline companies are shifting their networks towards higher speed and capacity Data Over Cable Service Interface Specifications (DOCSIS) 3.1 and fibre-to-the-home (FTTH) technologies and they are starting to evolve their networks to be DOCSIS 4.0-capable. These technologies provide faster potential data communication speeds than earlier technologies, allowing both television and Internet signals to reach consumers more quickly in order to sustain reliable speeds to address the increasing number of Internet-capable devices.
Over the past several years many people are working or studying from home simultaneously, further establishing the need for strong and reliable cable networks that can handle increased capacity than previously existed. Cable and wireline companies have needed to continue adding capacity and managing traffic to continue reliably supporting the needs of Canadians.
Our business customers use fibre-based access and cloud computing to capture and share information in more secure and accessible environments. This, combined with the rise of multimedia and Internet-based business applications, is driving exponential growth in data demand.
Businesses and all levels of government are transforming data centre infrastructure by moving toward virtual data storage and hosting. This is driving demand for more advanced network functionality, robust, scalable services, and supportive dynamic network infrastructure.
Canadian wireline companies are dismantling legacy networks and investing in next-generation platforms that combine voice, data, and video solutions onto a single distribution and access platform. As next-generation platforms become more popular, our
competition will begin to include systems integrators and manufacturers.
Devices and machines are becoming more interconnected and there is more reliance on the Internet and other networks to facilitate updates and track usage.
MEDIA TRENDS
Consumer viewing behaviours are continually evolving and the industry continues to adjust to these changes. Access to live sports and other premium content has become even more important for acquiring and retaining audiences that in turn attract advertisers and subscribers. Therefore, ownership of content and/or long-term agreements with content owners has also become increasingly important to media companies. Leagues, teams, networks, and new digital entrants are also experimenting with the delivery of live sports content through online, social, and virtual platforms, while non-traditional sports are also growing in mindshare.
Consumer demand for digital media, content on mobile devices, and on-demand content is increasing and media products have experienced significant digital uptake, requiring industry players to increase their efforts in digital content and capabilities in order to compete. In response to this trend, advertisers are shifting their spending to premium video and audio products on global digital platforms and social media that enable marketers to narrowly target specific audiences instead of the previous mass marketing approach. This results in lower use of traditional advertising methods and may require a shift in focus.
Competition has changed and traditional media assets in Canada are increasingly being controlled by a small number of competitors with significant scale and financial resources. Technology has allowed new entrants and even individuals to become media players in their own right.
Some of our competitors have become more vertically integrated across both traditional and emerging platforms. Relationships between providers and purchasers of content have become more complex. Global aggregators have also emerged and are competing for both content and viewers.
22 | ROGERS COMMUNICATIONS INC. 2022 ANNUAL REPORT
Our Strategy, Key Performance Drivers, and Strategic Highlights
As part of our long-term vision to become number one, we set objectives to measure progress and to address short-term opportunities and risks.
| 1. | Successfully complete the Shaw acquisition |
| 2. | Invest in our networks to deliver world-class connectivity to Canadian consumers and business |
| 3. | Invest in our customer experience to deliver timely, high-quality customer service consistently to our customers |
| 4. | Improve execution and deliver strong financial performance across all lines of business |
KEY PERFORMANCE DRIVERS AND 2022 STRATEGIC HIGHLIGHTS
As COVID-19 restrictions have largely been removed, our businesses emerged stronger from the significant impacts and the Canadian economy recovered from the lockdowns of 2020 and 2021. Throughout the year, we remained focused on creating meaningful long-term growth in shareholder value, with continuing investments to ensure network leadership, combined with leading customer service.
Our four focus areas guided our work and decision-making as we further improved our operational execution and made well-timed investments to grow our core businesses and deliver increased shareholder value. Below are some highlights for the year.
SUCCESSFULLY COMPLETE THE SHAW ACQUISITION
| • | Received approval from the CRTC for the transfer of Shaw’s broadcasting services. |
| • | Entered into a definitive agreement with Shaw and Quebecor for the sale of Freedom to Quebecor. |
| • | Successfully obtained financing of $13 billion to fund the Shaw Transaction, including the largest cross-border financing in Canadian history. |
| • | Successfully argued for the dismissal by the Tribunal of the Bureau’s application to block the Shaw Transaction, with the panel concluding unanimously that the transactions are pro-competitive; the decision of the Tribunal was upheld by the Federal Court of Appeal on January 24, 2023. |
INVEST IN OUR NETWORKS TO DELIVER WORLD-CLASS CONNECTIVITY TO CANADIAN CONSUMERS AND BUSINESSES
| • | Invested a record $3.1 billion in capital investments in Canada, the majority of which was invested in our networks. |
| • | Continued to expand Canada’s largest 5G network as at December 31, 2022, reaching over 1,900 communities across the country. |
| • | Became the first service provider in Canada to deploy 3500 MHz spectrum to increase 5G network capacity, boost speeds, and deliver ultra-low latency services, starting in Nanaimo, British Columbia and continuing its deployment across Canada, including in Calgary, Edmonton, Montreal, Ottawa, Toronto, Vancouver, and multiple rural areas. |
| • | Committed to investing $20 billion in network reliability over the next five years and announced plans to separate our wireless and wireline IP core networks. |
| • | Signed a memorandum of understanding with Canada’s other major telecommunications carriers regarding reciprocal support |
for emergency roaming, mutual assistance, and communications protocols in the event of a future major network outage. |
INVEST IN OUR CUSTOMER EXPERIENCE TO DELIVER TIMELY, HIGH-QUALITY CUSTOMER SERVICE CONSISTENTLY TO OUR CUSTOMERS
| • | Introduced new fibre-powered Ignite Internet packages and bundles, with symmetrical download and upload speeds of up to 2.5 Gbps, with existing Ignite Internet Gigabit 1.5 customers upgraded at no extra cost. |
| • | First major provider in Canada to launch a new Wi-Fi modem with Wi-Fi 6E, currently the world’s most powerful Wi-Fi technology, and introduced premium Ignite Internet with 8 Gbps symmetrical speeds in certain areas. |
| • | Continued to accelerate our digital-first plan to make it easier for customers, with digital adoption at 88% of eligible transactions; includes 24/7 virtual assistant support tools and the ability for Fido and Rogers customers to complete price plan changes, hardware upgrades, and other account updates online. |
| • | Donated $1 million to Jays Care Foundation in support of their ambitious goal to bring programming to 45,000 kids across Canada through Indigenous Rookie League, Challenger Baseball, and Girls at Bat. |
IMPROVE EXECUTION AND DELIVER STRONG FINANCIAL PERFORMANCE ACROSS ALL LINES OF BUSINESS
| • | Attracted 545,000 net postpaid mobile phone subscribers to lead the Canadian industry, up 35% and our strongest results since 2007. |
| • | Delivered on robust 2022 full-year guidance after increasing guidance ranges in April for total service revenue, adjusted EBITDA, and free cash flow excluding Shaw financing guidance. |
| • | Generated total service revenue of $13,305 million, up 6%; adjusted EBITDA of $6,393 million, up 9%; and net income of $1,680 million, up 8%. |
| • | Generated free cash flow excluding Shaw financing of $1,985 million, up 19%, and cash provided by operating activities of $4,493 million, up 8%. |
| • | Paid dividends of $1,010 million to our shareholders. |
In 2022, we improved our execution, strengthened our fundamentals, and invested more than we ever have in our customer experience. Building on this momentum, and as part of
2022 ANNUAL REPORT ROGERS COMMUNICATIONS INC. | 23
MANAGEMENT’S DISCUSSION AND ANALYSIS
our vision to become number one, our five objectives are as follows:
BUILD THE BIGGEST AND BEST NETWORKS IN THE COUNTRY
Our networks are the backbone of the digital economy and our business is built on providing our customers with always-on coverage everywhere. We are focused on expanding coverage to enable Canadians to connect wherever they are and to deliver quality connectivity on networks that are reliable and consistently perform for Canadians and businesses.
DELIVER EASY TO USE, RELIABLE PRODUCTS AND SERVICES
We believe delivering easy to use, reliable products and services is key to our growth strategy. This includes designing products that are simple, creating plans that are easy to understand, and delivering reliable services our customers can count on.
BE THE FIRST CHOICE FOR CANADIANS
Everything starts and ends with our customers, so improving the customer experience is a key area of focus. We are investing in our frontline and continuing to build our digital and self-serve capabilities. With the evolution of consumer behaviours, we are expanding service channel options to serve our customers how and where they want in order to grow our customer base.
BE A STRONG NATIONAL COMPANY INVESTING IN CANADA
Every year, we reinvest the vast majority of our profits back into our country to connect as many Canadians as possible. We also partner with local community groups to help create a better future for young Canadians, the future leaders of our country.
BE THE GROWTH LEADER IN OUR INDUSTRY
To be number one, we are focused on operating efficiently and executing with excellence to accelerate revenue growth and translate it into strong margins, profit, free cash flow, return on assets, and returns to shareholders.
FINANCIAL AND OPERATING GUIDANCE
We provide consolidated annual guidance ranges for selected financial metrics on a basis consistent with the annual plans approved by the Board.
2022 ACHIEVEMENTS AGAINST GUIDANCE
The following table outlines the updated guidance ranges that we provided in April 2022 and our actual results and achievements for the selected full-year 2022 financial metrics.
| (In millions of dollars, except percentages) | 2021 Actual | 2022 Guidance Ranges | 2022 Actual | Achievement | ||||||||||||||||||||||||
Consolidated Guidance 1 | ||||||||||||||||||||||||||||
Total service revenue | 12,533 | Increase of 6% | to | increase of 8% | 13,305 | 6.2% | ✓ | |||||||||||||||||||||
Adjusted EBITDA | 5,887 | Increase of 8% | to | increase of 10% | 6,393 | 8.6% | ✓ | |||||||||||||||||||||
Capital expenditures 2 | 2,788 | 2,800 | to | 3,000 | 3,075 | n/m | ✓✓ | |||||||||||||||||||||
Free cash flow excluding Shaw financing | 1,671 | 1,900 | to | 2,100 | 1,985 | n/m | ✓ | |||||||||||||||||||||
Achieved ✓ | Exceeded ✓✓ | |
| 1 | The table outlines guidance ranges for selected full-year 2022 consolidated financial metrics provided in our January 27, 2022 earnings release and subsequently updated on April 20, 2022. Guidance ranges presented as percentages reflect percentage increases over full-year 2021 results. |
| 2 | Includes additions to property, plant and equipment net of proceeds on disposition, but does not include expenditures for spectrum licences, additions to right-of-use assets, or assets acquired through business combinations. |
We exceeded our guidance range for capital expenditures for the year due to greater investments in our networks. Despite these increased investments, we still achieved our guidance for total service revenue, adjusted EBITDA, and free cash flow excluding Shaw financing.
24 | ROGERS COMMUNICATIONS INC. 2022 ANNUAL REPORT
2023 FULL-YEAR CONSOLIDATED GUIDANCE
For the full-year 2023, we expect growth in total service revenue and adjusted EBITDA will drive higher free cash flow. In 2023, we expect to have the financial flexibility to maintain our network advantages and to continue to return cash to shareholders. To assess our results on an organic basis not including capital expenditures on integration-related activities in preparation for the Shaw Transaction (see “Shaw Transaction”), we are providing 2023 guidance ranges on “capital expenditures excluding Shaw” and “free cash flow excluding Shaw”.
(In millions of dollars, except percentages) | 2022 Actual | 2023 Guidance Ranges 1 | ||||||||||
Total service revenue | 13,305 | Increase of 4% | to | 7% | ||||||||
Adjusted EBITDA | 6,393 | Increase of 5% | to | 8% | ||||||||
Capital expenditures excluding Shaw 2,3 | 3,033 | 3,100 | to | 3,300 | ||||||||
Free cash flow excluding Shaw 3,4 | 2,027 | 2,000 | to | 2,200 | ||||||||
| 1 | Guidance ranges presented as percentages reflect percentage increases over full-year 2022 results. |
| 2 | Includes additions to property, plant and equipment net of proceeds on disposition, but does not include expenditures for spectrum licences, additions to right-of-use assets, assets acquired through business combinations, or expenditures on integration-related activities in preparation for the Shaw Transaction. |
| 3 | Capital expenditures excluding Shaw and free cash flow excluding Shaw are non-GAAP financial measures. These are not standardized financial measures under IFRS and might not be comparable to similar financial measures disclosed by other companies. See “Non-GAAP and Other Financial Measures” for more information about each of these measures. |
| 4 | Reflects free cash flow excluding the effect of Shaw senior note financing (as defined below) and capital expenditures on integration-related activities in preparation for the Shaw Transaction. |
The above table outlines guidance ranges for selected full-year 2023 consolidated financial metrics without giving effect to the Shaw Transaction (see “Shaw Transaction”), the associated financing, or any other associated transactions or expenses. These ranges take into consideration our current outlook and our 2022 results. The purpose of the financial outlook is to assist investors, shareholders, and others in understanding certain financial metrics relating to expected 2023 financial results for evaluating the performance of our business. This information may not be appropriate for other purposes. Information about our guidance, including the various assumptions underlying it, is forward-looking and should be read in conjunction with “About Forward-Looking Information”, “Risks and Uncertainties Affecting our Business”, the material assumptions listed below under “Key underlying assumptions”, and the related disclosure and information about various economic, competitive, and regulatory assumptions, factors, and risks that may cause our actual future financial and operating results to differ from what we currently expect.
We provide annual guidance ranges on a consolidated full-year basis that are consistent with annual full-year Board-approved plans. Any updates to our full-year financial guidance over the course of the year would only be made to the consolidated guidance ranges that appear above. Guidance ranges will be reassessed once the Shaw Transaction has closed.
Key underlying assumptions
Our 2023 guidance ranges presented in “2023 Full-Year Consolidated Guidance” are based on many assumptions including, but not limited to, the following material assumptions for the full-year 2023:
| • | continued competitive intensity in all segments in which we operate consistent with levels experienced in 2022; |
| • | no significant additional legal or regulatory developments, other shifts in economic conditions, or macro changes in the competitive environment affecting our business activities; |
| • | Wireless customers continue to adopt, and upgrade to, higher-value smartphones at similar rates in 2023 compared to 2022; |
| • | overall wireless market penetration in Canada grows in 2023 at a similar rate as in 2022; |
| • | continued subscriber growth in Internet; |
| • | declining Television subscribers, including the impact of customers migrating to Ignite TV from our legacy product, as subscription streaming services and other over-the-top providers continue to grow in popularity; |
| • | in Media, continued growth in sports and relative stability in other traditional media businesses; |
| • | no significant sports-related work stoppages or cancellations will occur; |
| • | with respect to capital expenditures: |
| • | we continue to invest to ensure we have competitive wireless and cable networks through (i) expanding our 5G wireless network and (ii) upgrading our hybrid fibre-coaxial network to lower the number of homes passed per node, utilize the latest technologies, and deliver an even more reliable customer experience; and |
| • | we continue to make expenditures related to our Home roadmap in 2023 and we make progress on our service footprint expansion projects; |
| • | a substantial portion of our 2023 US dollar-denominated expenditures is hedged at an average exchange rate of $1.25/US$; |
| • | key interest rates remain relatively stable throughout 2023; and |
| • | we retain our investment-grade credit ratings. |
2022 ANNUAL REPORT ROGERS COMMUNICATIONS INC. | 25
MANAGEMENT’S DISCUSSION AND ANALYSIS
WIRELESS
Rogers has one of the most extensive and advanced mobile broadband wireless networks in Canada, which:
| • | is the only national network in Canada fully owned by a single operator; |
| • | was the first 5G network in Canada, reaching over 82% of the Canadian population as at December 31, 2022 on our 5G network alone; |
| • | was the first LTE high-speed network in Canada, reaching 96% of the Canadian population as at December 31, 2022 on our LTE network alone; |
| • | is supported by voice and data roaming agreements with domestic and international carriers in more than 200 destinations, including LTE and a growing number of 5G roaming operators; and |
| • | includes network sharing arrangements with two wireless operators that operate in urban and rural parts of Canada. |
We are continuously enhancing our IP service infrastructure for all our wireless services. Advances in technology have transformed the ways in which our customers interact and use the variety of tools available to them in their personal and professional lives. Technology has also changed the way businesses operate.
In early 2020, we launched our 5G network commercially in downtown Vancouver, Toronto, Ottawa, and Montreal and reached over 1,900 communities across Canada as at December 31, 2022. We also became a founding member of the global 5G Future Forum, a first-of-its-kind 5G and Mobile Edge Computing forum that currently includes Verizon, Vodafone, Telstra, KT, América Móvil, and NOS.
Our 5G network currently uses a combination of the 600 MHz, 1900 MHz, 2500 MHz, 3500 MHz, and AWS spectrum bands, and is also aggregated with our LTE spectrum bands. 600 MHz spectrum is best suited to carry wireless data across long distances and through buildings, creating more consistent and higher-quality coverage in both remote and urban areas and in smart cities. We have deployed dynamic spectrum sharing, which allows our existing spectrum supporting 4G to also be used for 5G/5G+ networks.
A number of future investments will be required to successfully operate and maintain our 5G network, including, but not limited to:
| • | refarming spectrum currently used for 2G and 3G to LTE and 5G/5G+; |
| • | acquiring additional radio spectrum through government auctions and private sector transactions; |
| • | densifying our wireless network with additional macro cells, small cells, and in-building systems in key markets; and |
| • | purchasing incremental 5G-ready radio network equipment with lower unit and operational costs, and the ability to aggregate more radio carriers and achieve greater spectral efficiency. |
Significant spectrum position
Our wireless services are supported by our significant wireless spectrum licence holdings in low-band, mid-band, and high-band frequency ranges. As part of our network strategy, we expect to continue making significant capital investments in spectrum to:
| • | support the continual rapid growth in usage of broadband wireless data services; |
| • | support the expansion and maintenance of our 5G and 5G+ networks; and |
| • | introduce new innovative network-enabled features and functionality. |
26 | ROGERS COMMUNICATIONS INC. 2022 ANNUAL REPORT
Our spectrum holdings as at December 31, 2022 include:
Type of spectrum | Rogers licences | Who the licences support | ||
600 MHz | 20 to 40 MHz across Canada, covering 100% of the Canadian population. | 4G / 4.5G LTE, and 5G / 5G+ subscribers. | ||
700 MHz | 24 MHz in Canada’s major geographic markets, covering 99.7% of the Canadian population. | 4G / 4.5G LTE subscribers; future 5G / 5G+ subscribers. | ||
850 MHz | 25 MHz across Canada. | 2G GSM, 3G HSPA, 4G / 4.5G LTE subscribers; future 5G / 5G+ subscribers. | ||
1900 MHz | 60 MHz in all areas of Canada except 40 MHz in northern Quebec, 50 MHz in southern Ontario, and 40 MHz in the Yukon, Northwest Territories, and Nunavut. | 4G / 4.5G LTE, and 5G / 5G+ subscribers. | ||
AWS 1700/2100 MHz | 40 MHz in British Columbia and Alberta, 30 MHz in southern Ontario, an additional 10 MHz in the Greater Toronto Area, and 20 MHz in the rest of Canada. | 4G / 4.5G LTE, and 5G / 5G+ subscribers. | ||
2500 MHz | 40 MHz FDD across the majority of Canada except 20 MHz in parts of Quebec and no holdings in Nunavut and the Northwest Territories. Rogers also holds an additional 20 MHz TDD in key population areas in Quebec, Ontario, and British Columbia, and an additional 10 MHz in parts of rural British Columbia. | 4G / 4.5G LTE, and 5G / 5G+ subscribers. | ||
3500 MHz | Between 60 MHz and 80 MHz in large population centres, except in Edmonton where Rogers holds 30 MHz. Rogers holds 20 MHz to 90 MHz in rural areas. | Mobile 5G / 5G+ subscribers; fixed wireless subscribers | ||
We also have access to additional spectrum through the following network sharing agreements:
| Type of spectrum | Type of network venture | Who it supports | ||
2300 MHz | Orion Wireless Partnership (Orion) is a joint operation with Bell in which Rogers holds a 50% interest. Orion holds licences for 30 MHz of FDD 2300 MHz spectrum (of which 20 MHz is usable), primarily in eastern Canada, including certain population centres in southern and eastern Ontario, southern Quebec, and smaller holdings in New Brunswick, Manitoba, Alberta, and British Columbia. The Orion fixed wireless LTE national network utilizes the jointly held 2300 MHz bands. | 4G subscribers. | ||
| Various | Two network-sharing arrangements to enhance coverage and network capabilities:
• with Bell MTS, which covers 98% of the population across Manitoba; and
• with Videotron to provide HSPA and LTE services across the province of Quebec and Ottawa. |
2G GSM, 3.5G / 4G HSPA+, 4G LTE, 5G subscribers.
4G LTE subscribers. | ||
CABLE
Our expansive fibre and hybrid fibre-coaxial (HFC) cable network delivers services to homes and businesses in Ontario, New Brunswick, Nova Scotia, and on the island of Newfoundland. This transcontinental, facilities-based fibre-optic network with 85,000 kilometres of fibre optic cable is also used to service business customers, including government and other telecommunications service providers outside of our home markets. We also use our extensive fibre network for backhaul for wireless cell site traffic. In Canada, the network extends coast-to-coast and includes fibre, both local and regional, and transmission systems and IP routers in hubs and points of presence. The network also extends to the US from Vancouver south to Seattle; from the Manitoba-Minnesota
border through Minneapolis, Milwaukee, and Chicago; from Toronto through Buffalo; and from Montreal through Albany to New York City and Ashburn, allowing us to connect Canada’s largest markets, while also reaching key US markets for the exchange of data, video, and voice traffic.
Our network is engineered for performance and redundancy and to allow for the simultaneous delivery of video, voice, and Internet. Diverse fibre paths that interconnect hubs provide redundancy to minimize disruptions that can result from fibre cuts and other events.
2022 ANNUAL REPORT ROGERS COMMUNICATIONS INC. | 27
MANAGEMENT’S DISCUSSION AND ANALYSIS
Homes and commercial buildings are connected to the core network through our HFC and DOCSIS or ten gigabit symmetrical passive optical network (XGS-PON) access networks. We connect the HFC and PON nodes to the core network using fibre optic cable and from the home to the node using coaxial cable or fibre. Using 1.2GHz, 860 MHz, and 750 MHz of cable spectrum for our HFC networks in Ontario and Atlantic Canada, respectively, we deliver video, voice, and broadband services to our customers. HFC node segmentation reduces the number of homes passed per HFC node, thereby increasing the bandwidth and capacity per subscriber.
We continually invest in our network to augment capacity, enhance performance and resilience, reduce operating costs, and introduce new features and functionality. Our investments are focused on:
| • | modernizing our HFC network to 1.2 GHz and subsequently 1.8 GHz in preparation for DOCSIS 4.0 (as the technology becomes generally available), which will: |
| • | expand cable spectrum capacity; |
| • | enhance network performance, quality, and resilience with digital fibre optics and new higher radio frequency amplifiers; and |
| • | reduce homes passed per node with segmentation; |
| • | increasing capacity per subscriber by enabling additional DOCSIS 3.1 downstream and upstream channels and preparing for the deployment of DOCSIS 4.0 that will support symmetrical Gbps speeds and lower latency; |
| • | expanding our fibre network connecting more homes, multiple dwelling unit buildings, and business premises directly to fibre and XGS-PON technology; and |
| • | enhancing resilience by separating the wireless and wireline IP core networks, adding equipment redundancy, and adding additional fibre paths to protect against simultaneous outages. |
Fixed wireless access services and expanding our cable footprint is a key priority for connecting all areas of Canada, including rural and underserved areas. We are actively investing in the expansion of our network in both Wireless and Cable to leverage what’s needed to offer fixed wireless Internet access. We are investing in the next generation of broadband wireless data networks, such as 5G/5G+ technologies, to support the growing data demand and new products and applications. This requires a strong network, capable of supporting both wireline and wireless data at low latencies to ensure new products and applications operate as intended.
We continue to invest in and improve our cable network services; for example, with technology to support multi-gigabit Internet speeds, Ignite TV, Rogers 4K TV, and a significant commitment to live broadcasting in 4K, including regular season Toronto Blue Jays home games and numerous NHL and NBA games.
Voice-over-cable telephony services are also served using the DOCSIS network. Our offerings ensure a high quality of service by including geographic redundancy and network backup powering. Our phone service includes a rich set of features, such as three-way calling, and advanced voicemail features that allow customers to be notified of, and listen to, their home voicemail on their wireless phone or over the Internet.
We own and operate some of the most advanced networks and data centres in Canada. Our data centres provide guaranteed uptime and expertise in collocation, cloud, and managed services
solutions. We own and operate nine state-of-the-art, highly reliable, certified data centres across Canada, including:
| • | Canada’s first Tier III Design and Construction certified multi-tenant facility in Toronto; |
| • | Alberta’s first Tier III certified data centre; and |
| • | a third Tier III certified data centre in Ottawa. |
We leverage our national fibre, cable, and wireless networks and data centre infrastructure to enable businesses to deliver greater value to their customers through proactive network monitoring and problem resolution with enterprise-level reliability, security, and performance. Our primary and secondary network operation centres proactively monitor Rogers’ networks to mitigate the risk of service interruptions and to allow for rapid responses to any outages.
We are committed to providing our customers with the best experience possible. To do this, we have invested in several areas to make it easier and more convenient for customers to interact with us, such as:
| • | live customer support handled by customer solution specialists located entirely within Canada; |
| • | 24/7 customer support handled by virtual assistant tools that provide customers the option for live chat or scheduled callbacks; |
| • | an innovative Integrated Voice Response (IVR) system that can take calls in English, French, Mandarin, and Cantonese; |
| • | voice authentication technology across all of our contact centres that automatically identifies our registered customers by their voice, increasing security and protecting customers from potential fraud; |
| • | self-serve options, including: |
| • | the ability for Fido and Rogers customers to complete price plan changes, hardware upgrades, and other account updates online; |
| • | a simplified login, allowing Fido customers to log in to their accounts online or through the Fido MyAccount app using their Facebook login credentials, eliminating the need to remember multiple login credentials and making self-service easier to access; |
| • | the ability for customers to install their Internet, TV, home phone, smart home monitoring, and Ignite Streaming products at their convenience, without the need for a technician visiting their residence; |
| • | Rogers EnRoute, a tool that gives customers the ability to track on their phone when a technician will arrive for an installation or service call; and |
| • | the ability for chatr customers to use SMS to easily review account information, balance details, and top up their account; |
| • | customer care available over Facebook Messenger, Twitter, and online chat through our websites; |
| • | Rogers Infinite unlimited data plans with no overage charges; |
| • | 24-month, $0 down, interest-free wireless device financing on Rogers Infinite plans and through our Fido Payment Program; |
| • | Ignite WiFi Hub for all Ignite TV customers, giving them ultimate control over their WiFi experience; |
28 | ROGERS COMMUNICATIONS INC. 2022 ANNUAL REPORT
| • | Family Data Manager, a data manager tool, and Data Top Ups, both of which allow Wireless customers to manage and customize their data usage in real-time through MyRogers; |
| • | Fido 5 Extra Hours, which grant Fido customers an additional five hours of data, per billing cycle, at no extra charge; |
| • | Fido XTRA, a program that gives Fido postpaid Wireless and Internet customers free access to new perks every Thursday, such as deals and giveaways from leading brands on food, drinks, apparel, entertainment, and more; |
| • | a simple online bill, making it easier for customers to read and understand their monthly charges; |
| • | Roam Like Home and Fido Roam, worry-free wireless roaming allowing Canadians to use their wireless plan like they do at home when traveling to included destinations; |
| • | DAY PASS, a flexible daily payment option for chatr customers; |
| • | Top Up as a Guest, which allows chatr customers to top up an account without signing in; |
| • | Advantage Mobility and Advantage Security, business-grade solutions offered by Rogers for Business to support small- and medium-sized Canadian enterprises with reliable connectivity and network security; |
| • | a Premium Device Protection program, including AppleCare services for Rogers and Fido customers, offering customers more protection and choice; |
| • | Express Pickup, a free service that allows customers to purchase a new device online or through a customer care agent and pick up it up the same day in-store; |
| • | an online appointment booking tool, allowing customers to conveniently schedule an appointment to speak to a Rogers expert at a specific store and time; and |
| • | Certified Walk-in Repairs, a fast and reliable phone repair service offering customers more convenience, flexibility, and reliability. |
The Rogers brand has strong national recognition through our:
| • | established networks; |
| • | extensive distribution; |
| • | recognizable media content and programming; |
| • | advertising; |
| • | event and venue sponsorships; |
| • | community investment, including the Ted Rogers Scholarship Fund and Ted Rogers Community Grants; and |
| • | naming rights to some of Canada’s landmark buildings. |
We also own or utilize some of Canada’s most recognized brands, including:
| • | the wireless brands of Rogers, Fido, and chatr; |
| • | the residential brands of Rogers and Fido; |
| • | 23 TV stations and specialty channels, including Sportsnet, OMNI, Citytv, FX (Canada), and FXX (Canada); |
| • | 54 radio stations, including 98.1 CHFI, CityNews 680, Sportsnet 590 The FAN, KiSS, JACK, and SONiC; |
| • | major league sports teams, including the Toronto Blue Jays, and teams owned by MLSE, such as the Toronto Maple Leafs, the Toronto Raptors, Toronto FC, and the Toronto Argonauts; |
| • | an exclusive national 12-year agreement with the NHL, which runs through the 2025-2026 season, as well as regional agreements, that allows us to deliver coverage of professional hockey in Canada; and |
| • | Today’s Shopping Choice, a premium online and TV shopping retailer. |
WIDESPREAD PRODUCT DISTRIBUTION
WIRELESS
We have an extensive national distribution network and offer our wireless products nationally through multiple channels, including:
| • | company-owned Rogers, Fido, and chatr retail stores; |
| • | customer self-serve using rogers.com, fido.ca, chatrwireless.com, and e-commerce sites; |
| • | an extensive independent dealer network; |
| • | major retail chains and convenience stores; |
| • | other distribution channels, such as WOW! mobile boutique, as well as Wireless Wave and TBooth Wireless through our ownership interest in Glentel; |
| • | our contact centres; and |
| • | outbound telemarketing. |
CABLE
We distribute our residential cable products using various channels, including:
| • | company-owned Rogers and Fido retail stores; |
| • | customer self-serve using rogers.com and fido.ca; |
| • | our Canada-based contact centres, outbound telemarketing, and door-to-door agents; and |
| • | major retail chains. |
Our sales team and third-party retailers sell services to the business, public sector, and carrier wholesale markets. An extensive network of third-party channel distributors deals with IT integrators, consultants, local service providers, and other indirect sales relationships. This diverse approach gives greater breadth of coverage and allows for strong sales growth for next-generation services.
We deliver highly sought-after sports content enhanced by the following initiatives:
| • | an exclusive national 12-year agreement with the NHL, which runs through the 2025-2026 season, as well as regional agreements, that allows us to deliver coverage of professional hockey in Canada across television, smartphones, tablets, and other streaming devices; |
| • | broadcasting and distribution rights of the Toronto Blue Jays in Canada through our ownership of the team; |
| • | SN NOW, an OTT sports service, offering 24/7 access to Sportsnet’s TV content; |
| • | the MLB Network, a 24-hour network dedicated to baseball, brought to Canada on Rogers television services; |
| • | an 11-year broadcasting agreement with the NBA, which runs through the 2025-2026 season, that allows us to deliver coverage of professional basketball in Canada across television, smartphones, tablets, and other streaming devices; and |
| • | a 10-year, multi-platform agreement that runs through August 2024, which makes Rogers the exclusive wholesaler and Canadian distributor of World Wrestling Entertainment’s (WWE) flagship programming. |
2022 ANNUAL REPORT ROGERS COMMUNICATIONS INC. | 29
MANAGEMENT’S DISCUSSION AND ANALYSIS
For our team of approximately 22,000 employees, we strive to create a great workplace, focusing on all aspects of the employee experience, which include:
| • | engaging employees and building high-performing teams through various initiatives; |
| • | aiming to attract and retain top talent through effective training and development, performance-driven employee recognition programs, and career progression programs for front-line employees; |
| • | maintaining our commitment to diversity and inclusion; and |
| • | providing a safe, collaborative, and agile workplace that provides employees the tools and training to be successful. |
FINANCIAL STRENGTH AND FLEXIBILITY
We have an investment-grade balance sheet and substantial available liquidity of $4.9 billion as at December 31, 2022. Our capital resources consist primarily of cash balances, cash provided by operating activities, available lines of credit, funds available under our receivables securitization program, issuances of US dollar-denominated commercial paper (US CP) under our US CP program, and long-term debt. We also owned approximately $1,200 million of marketable equity securities in publicly traded companies as at December 31, 2022.
The following information is forward-looking and should be read in conjunction with “About Forward-Looking Information”, “Financial and Operating Guidance”, “Risks and Uncertainties Affecting our Business”, and our other disclosures about various economic, competitive, and regulatory assumptions, factors, and risks that could cause our actual future financial and operating results to differ from those currently expected.
The Shaw Transaction has had, and will continue to have, a significant impact on our capital structure as we issued US$7.05 billion and $4.25 billion of debt in March 2022 (see “Managing our Liquidity and Financial Resources”) to partially fund
the cash consideration of the Shaw Transaction; however, we expect we will have sufficient capital resources to satisfy our anticipated cash funding requirements in 2023, including the Shaw Transaction, funding of dividends on our common shares, repayment of maturing short-term borrowings and long-term debt, and other financing and investing activities. This takes into account our opening cash balance, cash provided by operating activities, and funds available to us under credit facilities, our receivables securitization program, our US CP program, and other bank facilities or debt issued, including, for the purposes of the Shaw Transaction as necessary, the $12.8 billion restricted cash and cash equivalents and the $6 billion term loan facility. As at December 31, 2022, there were no significant restrictions on the flow of funds between RCI and its subsidiary companies.
We believe we can satisfy foreseeable additional funding requirements through cash provided by operating activities and additional financing, which, depending on market conditions, could include restructuring our existing bank credit and letter of credit facilities, entering into new bank credit facilities, issuing long-term or short-term debt, amending the terms of our receivables securitization or US CP programs, or issuing equity. We may also opportunistically refinance a portion of existing debt depending on market conditions and other factors. There is no assurance, however, that these financing initiatives will or can be done as they become necessary.
WIDESPREAD SHAREHOLDER BASE AND DIVIDENDS
RCI’s Class B Non-Voting common shares (Class B Non-Voting Shares) are widely held and actively trade on the TSX and the NYSE with a combined average daily trading volume of approximately 2.0 million shares in 2022. In addition, RCI’s Class A Voting common shares (Class A Shares) trade on the TSX. At the discretion of the Board, we pay an equal dividend on both classes of shares. In 2022, each share paid an annualized dividend of $2.00.
30 | ROGERS COMMUNICATIONS INC. 2022 ANNUAL REPORT
See “Accounting Policies” in this MD&A and the notes to our 2022 Audited Consolidated Financial Statements for important accounting policies and estimates as they relate to the following discussion.
We use several key performance indicators to measure our performance against our strategy and the results of our peers and
competitors. Many of these are not defined terms under IFRS and should not be considered alternative measures to net income or any other financial measure of performance under IFRS. See “Key Performance Indicators” and “Non-GAAP and Other Financial Measures” for more information.
SUMMARY OF CONSOLIDATED RESULTS
Years ended December 31
| ||||||||||||
(In millions of dollars, except margins and per share amounts)
|
2022
|
2021
|
% Chg
| |||||||||
Revenue | ||||||||||||
Wireless | 9,197 | 8,768 | 5 | |||||||||
Cable | 4,071 | 4,072 | – | |||||||||
Media | 2,277 | 1,975 | 15 | |||||||||
Corporate items and intercompany eliminations | (149 | ) | (160 | ) | (7 | ) | ||||||
Revenue | 15,396 | 14,655 | 5 | |||||||||
Total service revenue 1 | 13,305 | 12,533 | 6 | |||||||||
Adjusted EBITDA | ||||||||||||
Wireless | 4,469 | 4,214 | 6 | |||||||||
Cable | 2,058 | 2,013 | 2 | |||||||||
Media | 69 | (127 | ) | n/m | ||||||||
Corporate items and intercompany eliminations | (203 | ) | (213 | ) | (5 | ) | ||||||
Adjusted EBITDA | 6,393 | 5,887 | 9 | |||||||||
Adjusted EBITDA margin | 41.5% | 40.2% | 1.3 pts | |||||||||
Net income | 1,680 | 1,558 | 8 | |||||||||
Basic earnings per share | $ | 3.33 | $ | 3.09 | 8 | |||||||
Diluted earnings per share | $ | 3.32 | $ | 3.07 | 8 | |||||||
Adjusted net income | 1,915 | 1,803 | 6 | |||||||||
Adjusted basic earnings per share | $ | 3.79 | $ | 3.57 | 6 | |||||||
Adjusted diluted earnings per share 2 | $ | 3.78 | $ | 3.56 | 6 | |||||||
Capital expenditures | 3,075 | 2,788 | 10 | |||||||||
Cash provided by operating activities | 4,493 | 4,161 | 8 | |||||||||
Free cash flow | 1,773 | 1,671 | 6 | |||||||||
Free cash flow excluding Shaw financing | 1,985 | 1,671 | 19 | |||||||||
| 1 | As defined. See “Key Performance Indicators”. |
| 2 | Adjusted diluted earnings per share is a non-GAAP ratio. Adjusted net income is a non-GAAP financial measure and is a component of adjusted diluted earnings per share. This is not a standardized financial measure under IFRS and might not be comparable to similar financial measures disclosed by other companies. See “Non-GAAP and Other Financial Measures” for more information about this measure. |
2022 ANNUAL REPORT ROGERS COMMUNICATIONS INC. | 31
MANAGEMENT’S DISCUSSION AND ANALYSIS
KEY CHANGES IN FINANCIAL RESULTS YEAR OVER YEAR
REVENUE
Wireless service revenue increased this year, primarily as a result of higher roaming revenue associated with significantly increased travel, as COVID-19-related global travel restrictions were removed, and a larger postpaid mobile phone subscriber base, partially offset by credits granted to subscribers relating to the July network outage. Wireless equipment revenue decreased this year as a result of fewer of our new subscribers purchasing devices and fewer device upgrades by existing subscribers.
Cable revenue was in line with 2021, primarily as a result of increased competitive promotional activity and credits granted to subscribers relating to the July network outage, offset by service pricing changes made in the first quarter and an increase in total customer relationships.
Media revenue increased this year, primarily as a result of higher Toronto Blue Jays revenue, driven by the increase to full audience capacity for the full year at the Rogers Centre, and higher advertising revenue, partially offset by lower Today’s Shopping Choice revenue.
ADJUSTED EBITDA
Consolidated adjusted EBITDA increased this year, primarily due to increases in Wireless and Cable adjusted EBITDA, which led to an adjusted EBITDA margin of 41.5%.
Wireless adjusted EBITDA increased this year, primarily due to the flow-through impact of higher revenue as discussed above. This gave rise to a Wireless adjusted EBITDA service margin of 62.7%.
Cable adjusted EBITDA increased this year, primarily as a result of lower operating expenses due to recognized cost efficiencies, which led to a Cable adjusted EBITDA margin of 50.6%.
Media adjusted EBITDA increased this year, primarily as a result of higher revenue as discussed above, partially offset by higher Toronto Blue Jays player payroll costs and higher production and other operating costs as a result of increased activities as COVID-19 restrictions were removed.
NET INCOME AND ADJUSTED NET INCOME
Net income and adjusted net income increased this year, primarily as a result of higher adjusted EBITDA, partially offset by higher finance costs attributable to the Shaw senior note financing.
32 | ROGERS COMMUNICATIONS INC. 2022 ANNUAL REPORT
ROGERS IS CANADA’S LARGEST PROVIDER OF WIRELESS COMMUNICATIONS SERVICES
As at December 31, 2022, we had:
| • | approximately 10.6 million wireless mobile phone subscribers; and |
| • | approximately 30% subscriber and revenue share of the Canadian wireless market. |
WIRELESS FINANCIAL RESULTS
Years ended December 31 | ||||||||||||
(In millions of dollars, except margins) | 2022 | 2021 | % Chg | |||||||||
Revenue | ||||||||||||
Service revenue |
| 7,131 |
|
| 6,666 |
|
| 7 |
| |||
Equipment revenue |
| 2,066 |
|
| 2,102 |
|
| (2 | ) | |||
Revenue |
| 9,197 |
|
| 8,768 |
|
| 5 |
| |||
Operating expenses | ||||||||||||
Cost of equipment |
| 2,115 |
|
| 2,142 |
|
| (1 | ) | |||
Other operating expenses |
| 2,613 |
|
| 2,412 |
|
| 8 |
| |||
Operating expenses |
| 4,728 |
|
| 4,554 |
|
| 4 |
| |||
Adjusted EBITDA |
| 4,469 |
|
| 4,214 |
|
| 6 |
| |||
Adjusted EBITDA service margin 1 |
| 62.7% |
|
| 63.2% |
|
| (0.5 pts | ) | |||
Adjusted EBITDA margin 2 |
| 48.6% |
|
| 48.1% |
|
| 0.5 pts |
| |||
Capital expenditures |
| 1,758 |
|
| 1,515 |
|
| 16 |
| |||
| 1 | Calculated using service revenue. |
| 2 | Calculated using total revenue. |
WIRELESS SUBSCRIBER RESULTS 1
(In thousands, except churn and mobile phone ARPU) | Years ended December 31 | |||||||||||
| 2022 | 2021 | Chg | ||||||||||
Postpaid mobile phone | ||||||||||||
Gross additions |
| 1,523 |
|
| 1,304 |
|
| 219 |
| |||
Net additions |
| 545 |
|
| 403 |
|
| 142 |
| |||
Total postpaid mobile phone subscribers 2 |
| 9,392 |
|
| 8,847 |
|
| 545 |
| |||
Churn (monthly) |
| 0.90% |
|
| 0.88% |
|
| 0.02 pts |
| |||
Prepaid mobile phone | ||||||||||||
Gross additions |
| 796 |
|
| 512 |
|
| 284 |
| |||
Net additions |
| 89 |
|
| (94 | ) |
| 183 |
| |||
Total prepaid mobile phone subscribers 2 |
| 1,255 |
|
| 1,166 |
|
| 89 |
| |||
Churn (monthly) |
| 4.90% |
|
| 4.20% |
|
| 0.70 pts |
| |||
Mobile phone ARPU (monthly) | $ | 57.89 |
| $ | 56.83 |
| $ | 1.06 |
| |||
| 1 | Subscriber counts and subscriber churn are key performance indicators. See “Key Performance Indicators”. |
| 2 | As at end of period. |
REVENUE
Our revenue depends on the size of our subscriber base, the revenue per user, the revenue from the sale of wireless devices, and other equipment revenue.
Service revenue
Service revenue includes revenue derived from voice and data services from:
| • | postpaid and prepaid monthly fees; |
| • | data usage; |
| • | airtime; |
| • | long distance charges; |
| • | essential services charges; |
| • | inbound and outbound roaming charges; and |
| • | certain other fees and charges. |
The 7% increase in service revenue this year was a result of:
| • | higher roaming revenue associated with significantly increased travel as COVID-19-related global travel restrictions were less strict than last year; and |
| • | a larger mobile phone subscriber base; partially offset by |
| • | credits granted to subscribers relating to the July network outage. |
The 2% increase in mobile phone ARPU was primarily a result of the increased roaming revenue.
The increases in gross and net additions to our postpaid subscriber base were a result of strong operating performance, an increase in market activity by Canadians, and increasing immigration levels with the continuing improvement of the economy as the COVID-19 environment improved.
Equipment revenue
Equipment revenue includes revenue from sales of mobile devices to subscribers through fulfillment by Wireless’ customer service groups, websites, telesales, corporate stores, and independent dealers, agents, and retailers.
The 2% decrease in equipment revenue this year was a result of:
| • | fewer of our new subscribers purchasing devices; and |
| • | fewer device upgrades by existing customers; partially offset by |
| • | lower promotional activity. |
OPERATING EXPENSES
We record operating expenses in two categories:
| • | the cost of wireless devices and equipment; and |
| • | all other expenses involved in day-to-day operations, to service existing subscriber relationships, and to attract new subscribers. |
The 1% decrease in the cost of equipment this year was a result of:
| • | fewer of our new subscribers purchasing devices; and |
| • | fewer device upgrades by existing customers; partially offset by |
| • | a continued shift in the product mix towards higher-value devices. |
The 8% increase in other operating expenses this year was primarily a result of higher costs associated with the increased revenue, which included increased roaming, commissions, and advertising.
ADJUSTED EBITDA
The 6% increase in adjusted EBITDA this year was a result of the revenue and expense changes discussed above.
2022 ANNUAL REPORT ROGERS COMMUNICATIONS INC. | 33
MANAGEMENT’S DISCUSSION AND ANALYSIS
ONE OF CANADA’S LEADING PROVIDERS OF HIGH-SPEED INTERNET, CABLE TELEVISION, AND PHONE SERVICES
As at December 31, 2022, we had:
| • | approximately 2.3 million retail Internet subscribers; |
| • | approximately 1.5 million Video subscribers; and |
| • | a network passing approximately 4.8 million homes in Ontario, New Brunswick, Nova Scotia, and on the island of Newfoundland. |
CABLE FINANCIAL RESULTS
Years ended December 31 | ||||||||||||
| (In millions of dollars, except margins) | 2022 | 2021 | % Chg | |||||||||
Revenue | ||||||||||||
Service revenue | 4,046 | 4,052 | – | |||||||||
Equipment revenue | 25 | 20 | 25 | |||||||||
Revenue |
| 4,071 |
|
| 4,072 |
|
| – |
| |||
Operating expenses | 2,013 | 2,059 | (2 | ) | ||||||||
Adjusted EBITDA | 2,058 | 2,013 | 2 | |||||||||
Adjusted EBITDA margin | 50.6% | 49.4% | 1.2 pts | |||||||||
Capital expenditures | 1,019 | 913 | 12 | |||||||||
CABLE SUBSCRIBER RESULTS 1
| (In thousands, except ARPA and penetration) | Years ended December 31 | |||||||||||
| 2022 | 2021 | Chg | ||||||||||
Homes passed 2 | 4,804 | 4,700 | 104 | |||||||||
Customer relationships | ||||||||||||
Net additions | 6 | 31 | (25 | ) | ||||||||
Total customer relationships 2,3 | 2,590 | 2,581 | 9 | |||||||||
ARPA (monthly) | $ | 130.12 | $ | 132.58 | ($ | 2.46 | ) | |||||
Penetration 2 | 53.9% | 54.9% | (1.0 pts | ) | ||||||||
Retail Internet | ||||||||||||
Net additions | 52 | 71 | (19 | ) | ||||||||
Total retail Internet subscribers 2,3 | 2,284 | 2,229 | 55 | |||||||||
Video | ||||||||||||
Net additions (losses) | 32 | (9 | ) | 41 | ||||||||
Total Video subscribers 2,3 | 1,525 | 1,491 | 34 | |||||||||
| Smart Home Monitoring | ||||||||||||
Net losses | (12 | ) | (18 | ) | 6 | |||||||
Total Smart Home Monitoring subscribers 2 | 101 | 113 | (12 | ) | ||||||||
| Home Phone | ||||||||||||
Net losses | (76 | ) | (90 | ) | 14 | |||||||
Total Home Phone subscribers 2,3 | 836 | 911 | (75 | ) | ||||||||
| 1 | Subscriber results are key performance indicators. See “Key Performance Indicators”. |
| 2 | As at end of period. |
| 3 | On March 16, 2022, we acquired approximately 3,000 retail Internet subscribers, 2,000 Video subscribers, 1,000 Home Phone subscribers, and 3,000 customer relationships as a result of our acquisition of a small regional cable company in Nova Scotia, which are not included in net additions, but do appear in the ending total balances for December 31, 2022. |
REVENUE
Service revenue
Service revenue includes revenue derived from:
| • | monthly subscription and additional use service revenue from residential, small business, enterprise, public sector, and wholesale Internet access subscribers; |
| • | monthly service revenue from our smart home monitoring products; |
| • | modem, television set-top box, and other equipment rental fees; |
| • | IPTV and digital cable services, such as: |
| • | basic service fees; |
| • | tier service fees; |
| • | access fees for use of channel capacity by third parties; and |
| • | premium and specialty service subscription fees, including pay-per-view service fees and video-on-demand service fees; |
| • | monthly service fees; |
| • | calling features, such as voicemail, call waiting, and caller ID; and |
| • | long distance calling. |
Cable service revenue was in line with 2021 as a result of:
| • | increased competitive promotional activity; |
| • | credits granted to subscribers relating to the July network outage; and |
| • | declines in our Home Phone and Smart Home Monitoring subscriber bases; offset by |
| • | service pricing changes made in the first quarter; and |
| • | the increase in total customer relationships over the past year, due to growth in our retail Internet and Video subscriber bases. |
The lower customer relationship net additions, the lower retail Internet net additions, and the lower ARPA this year were a result of increased competitive promotional activity throughout the latter half of the year.
Equipment revenue
Equipment revenue includes revenue generated from the sale of television set-top boxes, Internet modems and other equipment, and smart home monitoring equipment. The increase in equipment revenue this year was a result of higher Ignite equipment sales.
OPERATING EXPENSES
We record Cable operating expenses in three categories:
| • | the cost of programming; |
| • | the cost of equipment revenue (including smart home monitoring equipment); and |
| • | all other expenses involved in day-to-day operations, to service and retain existing subscriber relationships, and to attract new subscribers. |
The 2% decrease in operating expenses this year was a result of cost efficiencies, including lower content-related costs, partially due to negotiation of certain content rates with suppliers.
ADJUSTED EBITDA
The 2% increase in adjusted EBITDA this year was a result of the revenue and expense changes described above.
34 | ROGERS COMMUNICATIONS INC. 2022 ANNUAL REPORT
DIVERSIFIED CANADIAN MEDIA COMPANY
We have a broad portfolio of media properties, which most significantly includes:
| • | sports media and entertainment, such as Sportsnet and the Toronto Blue Jays; |
| • | our exclusive national 12-year NHL Agreement, which runs through the 2025-2026 season; |
| • | category-leading television and radio broadcasting properties; |
| • | multi-platform televised and online shopping; and |
| • | digital media. |
MEDIA FINANCIAL RESULTS
Years ended December 31 | ||||||||||||
| (In millions of dollars, except margins) | 2022 | 2021 | % Chg | |||||||||
| Revenue |
|
2,277 |
|
|
1,975 |
|
|
15 |
| |||
Operating expenses |
| 2,208 |
|
| 2,102 |
|
| 5 |
| |||
| Adjusted EBITDA | 69 | (127 | ) | (154 | ) | |||||||
| Adjusted EBITDA margin | 3.0% | (6.4)% | 9.4 pts | |||||||||
Capital expenditures |
| 142 |
|
| 115 |
|
| 23 |
| |||
REVENUE
Media revenue is earned from:
| • | advertising sales across its television, radio, and digital media properties; |
| • | subscriptions to televised and OTT products; |
| • | ticket sales, fund redistribution and other distributions from MLB, and concession sales; and |
| • | retail product sales. |
The 15% increase in revenue this year was a result of:
| • | higher sports-related revenue, including: |
| • | higher Toronto Blue Jays revenue, primarily as a result of increased attendance from strong team performance and the availability for fan attendance to reach full capacity at the Rogers Centre as COVID-19 restrictions were removed and a distribution from MLB; and |
| • | negotiation of certain content rates; and |
| • | higher advertising revenue due to the continuing improvement of the economy as the COVID-19 environment improved and increased sports betting; partially offset by |
| • | lower Today’s Shopping Choice revenue. |
OPERATING EXPENSES
We record Media operating expenses in four primary categories:
| • | the cost of broadcast content, including sports programming and production; |
| • | Toronto Blue Jays player compensation; |
| • | the cost of retail products sold; and |
| • | all other expenses involved in day-to-day operations. |
The 5% increase in operating expenses this year was a result of:
| • | higher Toronto Blue Jays expenses, including player payroll, and game day costs due to increased attendance from strong team performance and the availability for fan attendance to reach full capacity at the Rogers Centre; and |
| • | higher production and other general operating costs as a result of increased activities as COVID-19 restrictions were removed; partially offset by |
| • | lower Today’s Shopping Choice costs in line with the lower revenue. |
ADJUSTED EBITDA
The increase in adjusted EBITDA this year was a result of the revenue and expense changes described above.
2022 ANNUAL REPORT ROGERS COMMUNICATIONS INC. | 35
MANAGEMENT’S DISCUSSION AND ANALYSIS
Capital expenditures include costs associated with acquiring property, plant and equipment and placing it into service. The telecommunications business requires extensive and continual investments, including investment in new technologies and the expansion of capacity and geographical reach. Expenditures related to the acquisition of spectrum licences and additions to right-of-use assets are not included in capital expenditures and do not factor into the calculation of free cash flow or capital intensity. See “Managing our Liquidity and Financial Resources”, “Key Performance Indicators”, and “Non-GAAP and Other Financial Measures” for more information.
Capital expenditures are significant and have a material impact on our cash flows; therefore, our management teams focus on planning, funding, and managing them. We believe this measure best reflects our cost of property, plant and equipment in a given period and is a simpler measure for comparing between periods.
(In millions of dollars, except capital | Years ended December 31 | |||||||||||
2022 | 2021 | % Chg | ||||||||||
Wireless |
| 1,758 |
|
| 1,515 |
|
| 16 |
| |||
Cable |
| 1,019 |
|
| 913 |
|
| 12 |
| |||
Media |
| 142 |
|
| 115 |
|
| 23 |
| |||
Corporate |
| 156 |
|
| 245 |
|
| (36 | ) | |||
Capital expenditures 1 |
| 3,075 |
|
| 2,788 |
|
| 10 |
| |||
Capital intensity 2 |
| 20.0% |
|
| 19.0% |
|
| 1.0 pts |
| |||
| 1 | Includes additions to property, plant and equipment net of proceeds on disposition, but does not include expenditures for spectrum licences, additions to right-of-use assets, or assets acquired through business combinations. |
| 2 | Capital intensity is a supplementary financial measure. See “Non-GAAP and Other Financial Measures” for an explanation as to the composition of this measure. |
One of our objectives is to deliver world-class connectivity to Canadian consumers and businesses. As we continually work towards this, we spent more on our wireless and wireline networks this year than we have in the past several years. This year, we continued to roll out our 5G network, the largest 5G network in Canada, across the country. We also continued to invest in fibre deployments, including FTTH, in our cable network and we expanded our network footprint to reach more homes and businesses.
On July 8, 2022, a network outage occurred across both wireless and wireline services following a maintenance update in our core network that caused some of our routers to malfunction. We disconnected the specific equipment and redirected traffic, which allowed our network and services to come back online over time as
we managed traffic volumes returning to normal levels. We will continue to direct capital expenditures to strengthen the resilience of our networks and make significant investments to strengthen our technology systems, increase network stability for our customers, and enhance our testing.
WIRELESS
The increase in capital expenditures in Wireless this year was a result of investments made to upgrade and expand our wireless network. We deployed 3500 MHz spectrum licences in several cities across Canada, including Toronto, Montreal, Vancouver, Calgary, Edmonton, and Halifax, among others. The ongoing deployment of 3500 MHz spectrum substantially augments the capacity and resilience of our earlier 5G deployments in the 600 MHz spectrum band.
CABLE
The increase in capital expenditures in Cable this year reflect continued investments in our network infrastructure, including additional fibre deployments to increase our FTTH distribution. These upgrades will lower the number of homes passed per node and incorporate the latest technologies to help deliver more bandwidth and an even more engaging customer experience as we progress in our connected home roadmap, including service footprint expansion and upgrades to our DOCSIS 3.1 platform to evolve to DOCSIS 4.0, which will offer increased network resilience and stability along with faster download speeds over time.
MEDIA
The increase in capital expenditures this year was primarily a result of higher Toronto Blue Jays stadium infrastructure expenditures, partially offset by lower broadcast infrastructure expenditures, relating to investments in new production studios in the prior year.
CORPORATE
The decrease in corporate capital expenditures this year was a result of lower investments in our corporate information technology infrastructure.
CAPITAL INTENSITY
Capital intensity increased this year as a result of higher capital expenditures, partially offset by higher revenue, as discussed above.
36 | ROGERS COMMUNICATIONS INC. 2022 ANNUAL REPORT
REVIEW OF CONSOLIDATED PERFORMANCE
This section discusses our net income and other expenses that do not form part of the segment discussions above.
Years ended December 31 | ||||||||||||
(In millions of dollars) | 2022 | 2021 | % Chg | |||||||||
Adjusted EBITDA |
| 6,393 |
|
| 5,887 |
|
| 9 |
| |||
Deduct (add): | ||||||||||||
Depreciation and amortization |
| 2,576 |
|
| 2,585 |
|
| – |
| |||
Restructuring, acquisition and other |
| 310 |
|
| 324 |
|
| (4 | ) | |||
Finance costs |
| 1,233 |
|
| 849 |
|
| 45 |
| |||
Other (income) expense |
| (15 | ) |
| 2 |
|
| n/m |
| |||
Income tax expense |
| 609 |
|
| 569 |
|
| 7 |
| |||
Net income |
| 1,680 |
|
| 1,558 |
|
| 8 |
| |||
ADJUSTED EBITDA
See “Key Changes in Financial Results Year Over Year” for a discussion of the increase in adjusted EBITDA this year.
DEPRECIATION AND AMORTIZATION
Years ended December 31 | ||||||||||||
(In millions of dollars) | 2022 | 2021 | % Chg | |||||||||
Depreciation of property, plant and equipment |
| 2,281 |
|
| 2,322 |
|
| (2 | ) | |||
Depreciation of right-of-use assets |
| 274 |
|
| 246 |
|
| 11 |
| |||
Amortization |
| 21 |
|
| 17 |
|
| 24 |
| |||
Total depreciation and amortization |
| 2,576 |
|
| 2,585 |
|
| – |
| |||
RESTRUCTURING, ACQUISITION AND OTHER
During the year ended December 31, 2022, we incurred $310 million (2021 – $324 million) in restructuring, acquisition and other expenses, which included $192 million (2021 – $137 million) of incremental costs supporting acquisition and integration activities related to the Shaw Transaction, including certain costs related to the committed credit facility (which was terminated during the first quarter).
The remaining costs in 2022 were primarily severance costs associated with the targeted restructuring of our employee base. The remaining costs in 2021 were primarily severance costs associated with the targeted restructuring of our employee base, certain contract termination costs, incremental, temporary costs incurred in response to COVID-19, and other costs.
FINANCE COSTS
Years ended December 31 | ||||||||||||
(In millions of dollars) | 2022 | 2021 | % Chg | |||||||||
Interest on borrowings |
| 907 |
|
| 745 |
|
| 22 |
| |||
Interest on Shaw senior note financing |
| 447 |
|
| – |
|
| – |
| |||
Total interest on borrowings 1 |
| 1,354 |
|
| 745 |
|
| 82 |
| |||
Interest earned on restricted cash and cash equivalents |
| (235 | ) |
| – |
|
| – |
| |||
Interest on borrowings, net |
| 1,119 |
|
| 745 |
|
| (1 | ) | |||
Interest on lease liabilities |
| 80 |
|
| 74 |
|
| (1 | ) | |||
Interest on post-employment benefits liability |
| (1 | ) |
| 14 |
|
| n/m |
| |||
Loss on foreign exchange |
| 127 |
|
| 10 |
|
| n/m |
| |||
Change in fair value of derivative instruments |
| (126 | ) |
| (6 | ) |
| n/m |
| |||
Capitalized interest |
| (29 | ) |
| (17 | ) |
| 71 |
| |||
Deferred transaction costs and other |
| 63 |
|
| 29 |
|
| 117 |
| |||
Total finance costs |
| 1,233 |
|
| 849 |
|
| 45 |
| |||
| 1 | Interest on borrowings includes interest on short-term borrowings and on long-term debt. |
The 45% increase in finance costs this year was primarily due to an increase in net interest borrowings this year as a result of new debt issued, primarily associated with the completion of our long-term financing for the Shaw Transaction, to support our acquisition of 3500 MHz spectrum licences in late 2021, and to fund certain debt maturities, including:
| • | the issuance of $2 billion subordinated notes in December 2021; |
| • | the issuance of US$750 million subordinated notes in February 2022; and |
| • | the issuance of $4.25 billion and US$7.05 billion senior notes in March 2022. |
Foreign exchange and change in fair value of derivative instruments
We recognized $127 million in net foreign exchange losses in 2022 (2021 – $10 million in net losses). These losses were primarily attributed to our US$1 billion senior notes due 2025 and our US CP program borrowings. In 2021, the losses were primarily attributed to our US CP program borrowings.
These foreign exchange losses were offset by the $126 million gain related to the change in fair value of derivatives (2021 – $6 million gain) that was primarily attributed to the debt derivatives, which were not designated as hedges for accounting purposes, we used to substantially offset the foreign exchange risk related to these US dollar-denominated borrowings.
See “Managing our Liquidity and Financial Resources” for more information about our debt and related finance costs.
2022 ANNUAL REPORT ROGERS COMMUNICATIONS INC. | 37
MANAGEMENT’S DISCUSSION AND ANALYSIS
INCOME TAX EXPENSE
Below is a summary of the difference between income tax expense computed by applying the statutory income tax rate to income before income tax expense and the actual income tax expense for the year.
Years ended December 31 | ||||||||
(In millions of dollars, except tax rates) | 2022 | 2021 | ||||||
Statutory income tax rate |
| 26.5% |
|
| 26.5% |
| ||
Income before income tax expense |
| 2,289 |
|
| 2,127 |
| ||
Computed income tax expense |
| 607 |
|
| 564 |
| ||
Increase (decrease) in income tax expense resulting from: | ||||||||
Non-deductible stock-based compensation |
| 10 |
|
| 1 |
| ||
Non-deductible portion of equity losses |
| 9 |
|
| 12 |
| ||
Non-taxable portion of capital gains |
| (5 | ) |
| – |
| ||
Non-taxable income from security investments |
| (12 | ) |
| (11 | ) | ||
Other items |
| – |
|
| 3 |
| ||
Total income tax expense |
| 609 |
|
| 569 |
| ||
Effective income tax rate |
| 26.6% |
|
| 26.8% |
| ||
Cash income taxes paid |
| 455 |
|
| 700 |
| ||
Our effective income tax rate this year was 26.6% compared to 26.8% for 2021. The effective income tax rate for 2022 and 2021 approximated the statutory income tax rate.
Cash income taxes paid decreased this year as 2021 tax installments included a final 2020 amount arising from our transition to a device financing business model, which results in earlier recognition of equipment revenue for income tax purposes.
NET INCOME
Net income was 8% higher than last year. See “Key Changes in Financial Results Year Over Year” for more information.
(In millions of dollars, except per | Years ended December 31 | |||||||||||
| 2022 | 2021 | % Chg | ||||||||||
Net income |
| 1,680 |
|
| 1,558 |
|
| 8 |
| |||
Basic earnings per share | $ | 3.33 |
| $ | 3.09 |
|
| 8 |
| |||
Diluted earnings per share | $ | 3.32 |
| $ | 3.07 |
|
| 8 |
| |||
ADJUSTED NET INCOME
Adjusted net income was 6% higher compared to 2021, primarily as a result of higher adjusted EBITDA, partially offset by higher finance costs.
(In millions of dollars, except per | Years ended December 31 | |||||||||||
| 2022 | 2021 | % Chg | ||||||||||
Adjusted EBITDA |
| 6,393 |
|
| 5,887 |
|
| 9 |
| |||
Deduct (add): | ||||||||||||
Depreciation and amortization |
| 2,576 |
|
| 2,585 |
|
| – |
| |||
Finance costs |
| 1,233 |
|
| 849 |
|
| 45 |
| |||
Other (income) expense |
| (15 | ) |
| 2 |
|
| n/m |
| |||
Income tax expense 1 |
| 684 |
|
| 648 |
|
| 6 |
| |||
Adjusted net income |
| 1,915 |
|
| 1,803 |
|
| 6 |
| |||
Adjusted basic earnings per share | $ | 3.79 |
| $ | 3.57 |
|
| 6 |
| |||
Adjusted diluted earnings per share | $ | 3.78 |
| $ | 3.56 |
|
| 6 |
| |||
| 1 | Income tax expense above excludes a $75 million recovery (2021 – $79 million recovery) for the year ended December 31, 2022 related to the income tax impact for adjusted items. |
EMPLOYEES
Employee salaries and benefits represent a material portion of our expenses. As at December 31, 2022, we had approximately 22,000 employees (2021 – 23,000) across all of our operating groups, including shared services and the corporate office. Total salaries and benefits for full-time and part-time employees in 2022 were $2,226 million (2021 – $2,181 million).
38 | ROGERS COMMUNICATIONS INC. 2022 ANNUAL REPORT
2021 FULL-YEAR RESULTS COMPARED TO 2020
Years ended December 31 | ||||||||||||
(In millions of dollars, except margins) | 2021 | 2020 | % Chg | |||||||||
Revenue | ||||||||||||
Wireless | 8,768 | 8,530 | 3 | |||||||||
Cable | 4,072 | 3,946 | 3 | |||||||||
Media | 1,975 | 1,606 | 23 | |||||||||
Corporate items and intercompany eliminations |
| (160 | ) |
| (166 | ) |
| (4 | ) | |||
Revenue |
| 14,655 |
|
| 13,916 |
|
| 5 |
| |||
Total service revenue |
| 12,533 |
|
| 11,955 |
|
| 5 |
| |||
Adjusted EBITDA | ||||||||||||
Wireless |
| 4,214 |
|
| 4,067 |
|
| 4 |
| |||
Cable |
| 2,013 |
|
| 1,935 |
|
| 4 |
| |||
Media |
| (127 | ) |
| 51 |
|
| n/m |
| |||
Corporate items and intercompany eliminations |
| (213 | ) |
| (196 | ) |
| 9 |
| |||
Adjusted EBITDA |
| 5,887 |
|
| 5,857 |
|
| 1 |
| |||
Adjusted EBITDA margin |
| 40.2% |
|
| 42.1% |
|
| (1.9 pts | ) | |||
Net income |
| 1,558 |
|
| 1,592 |
|
| (2 | ) | |||
Adjusted net income |
| 1,803 |
|
| 1,725 |
|
| 5 |
| |||
Revenue
Consolidated revenue increased by 5% in 2021, driven by a revenue increase of 3% in Wireless, a 3% increase in Cable, and a 23% increase in Media.
Wireless service revenue increased as a result of a larger postpaid subscriber base and higher roaming revenue, as COVID-19-related global travel restrictions in 2021 were generally less strict than in 2020, partially offset by lower overage revenue. Wireless equipment revenue increased as a result of higher device upgrades by existing customers and a shift in the product mix towards higher-value devices, partially offset by fewer of our new subscribers purchasing devices.
Cable revenue increased by 3% as a result of the movement of Internet customers to higher speed and usage tiers, the increases in our Internet and Ignite TV subscriber bases, and disciplined
promotional activity and Internet service pricing changes in late 2020, partially offset by declines in our legacy television and home phone subscriber bases.
Media revenue increased by 23% as a result of the postponement of the start of the 2020-2021 NHL and NBA seasons, shifting revenue to 2021, and higher Toronto Blue Jays attendance-related revenue as COVID-19 restrictions eased and fan attendance was permitted.
Adjusted EBITDA
Consolidated adjusted EBITDA increased in 2021 to $5,887 million, primarily due to 4% increases in Wireless and Cable adjusted EBITDA, partially offset by the decrease in Media adjusted EBITDA, with a consolidated adjusted EBITDA margin of 40%.
Wireless adjusted EBITDA Increased 4% as a result of the flow-through impact of the aforementioned increases in revenue and lower bad debt expense. Although a decrease from 2020, the ongoing long-term shift to customers financing their device purchases is reflected in the general improvement in our equipment margin.
Cable adjusted EBITDA increased by 4% in 2021 as a result of higher revenue, as discussed above.
Media adjusted EBITDA decreased by $178 million, primarily as a result of higher programming and production costs as a result of the postponement of the start of the 2020-2021 NHL and NBA seasons, higher general operating costs as a result of the resumption of sports and increased activities as COVID-19 restrictions eased, and higher Toronto Blue Jays player payroll and game day costs, partially offset by higher revenue as discussed above.
Net income and adjusted net income
Adjusted net income increased 5% in 2021 primarily as a result of the increase in adjusted EBITDA and lower finance costs. Net income decreased 2% in 2021 primarily as a result of higher restructuring, acquisition and other costs attributable to the Shaw Transaction.
2022 ANNUAL REPORT ROGERS COMMUNICATIONS INC. | 39
MANAGEMENT’S DISCUSSION AND ANALYSIS
Below is a summary of our quarterly consolidated financial results and key performance indicators for 2022 and 2021.
QUARTERLY CONSOLIDATED FINANCIAL SUMMARY
2022 | 2021 | |||||||||||||||||||||||||||||||||||||||||||
(In millions of dollars, except per share amounts) | Full Year | Q4 | Q3 | Q2 | Q1 | Full Year | Q4 | Q3 | Q2 | Q1 | ||||||||||||||||||||||||||||||||||
Revenue | ||||||||||||||||||||||||||||||||||||||||||||
Wireless |
| 9,197 |
|
| 2,578 |
|
| 2,267 |
|
| 2,212 |
|
| 2,140 |
|
| 8,768 |
|
| 2,415 |
|
| 2,215 |
|
| 2,064 |
|
| 2,074 |
| ||||||||||||||
Cable |
| 4,071 |
|
| 1,019 |
|
| 975 |
|
| 1,041 |
|
| 1,036 |
|
| 4,072 |
|
| 1,023 |
|
| 1,016 |
|
| 1,013 |
|
| 1,020 |
| ||||||||||||||
Media |
| 2,277 |
|
| 606 |
|
| 530 |
|
| 659 |
|
| 482 |
|
| 1,975 |
|
| 516 |
|
| 473 |
|
| 546 |
|
| 440 |
| ||||||||||||||
Corporate items and intercompany eliminations |
| (149 | ) |
| (37 | ) |
| (29 | ) |
| (44 | ) |
| (39 | ) |
| (160 | ) |
| (35 | ) |
| (38 | ) |
| (41 | ) |
| (46 | ) | ||||||||||||||
Total revenue |
| 15,396 |
|
| 4,166 |
|
| 3,743 |
|
| 3,868 |
|
| 3,619 |
|
| 14,655 |
|
| 3,919 |
|
| 3,666 |
|
| 3,582 |
|
| 3,488 |
| ||||||||||||||
Total service revenue |
| 13,305 |
|
| 3,436 |
|
| 3,230 |
|
| 3,443 |
|
| 3,196 |
|
| 12,533 |
|
| 3,232 |
|
| 3,149 |
|
| 3,131 |
|
| 3,021 |
| ||||||||||||||
Adjusted EBITDA | ||||||||||||||||||||||||||||||||||||||||||||
Wireless |
| 4,469 |
|
| 1,173 |
|
| 1,093 |
|
| 1,118 |
|
| 1,085 |
|
| 4,214 |
|
| 1,086 |
|
| 1,107 |
|
| 1,008 |
|
| 1,013 |
| ||||||||||||||
Cable |
| 2,058 |
|
| 522 |
|
| 465 |
|
| 520 |
|
| 551 |
|
| 2,013 |
|
| 518 |
|
| 516 |
|
| 492 |
|
| 487 |
| ||||||||||||||
Media |
| 69 |
|
| 57 |
|
| 76 |
|
| 2 |
|
| (66 | ) |
| (127 | ) |
| (26 | ) |
| 33 |
|
| (75 | ) |
| (59 | ) | ||||||||||||||
Corporate items and intercompany eliminations |
| (203 | ) |
| (73 | ) |
| (51 | ) |
| (48 | ) |
| (31 | ) |
| (213 | ) |
| (56 | ) |
| (56 | ) |
| (51 | ) |
| (50 | ) | ||||||||||||||
Adjusted EBITDA |
| 6,393 |
|
| 1,679 |
|
| 1,583 |
|
| 1,592 |
|
| 1,539 |
|
| 5,887 |
|
| 1,522 |
|
| 1,600 |
|
| 1,374 |
|
| 1,391 |
| ||||||||||||||
Deduct (add): | ||||||||||||||||||||||||||||||||||||||||||||
Depreciation and amortization |
| 2,576 |
|
| 648 |
|
| 644 |
|
| 638 |
|
| 646 |
|
| 2,585 |
|
| 658 |
|
| 642 |
|
| 647 |
|
| 638 |
| ||||||||||||||
Restructuring, acquisition and other |
| 310 |
|
| 58 |
|
| 85 |
|
| 71 |
|
| 96 |
|
| 324 |
|
| 101 |
|
| 63 |
|
| 115 |
|
| 45 |
| ||||||||||||||
Finance costs |
| 1,233 |
|
| 287 |
|
| 331 |
|
| 357 |
|
| 258 |
|
| 849 |
|
| 218 |
|
| 207 |
|
| 206 |
|
| 218 |
| ||||||||||||||
Other (income) expense |
| (15 | ) |
| (10 | ) |
| 19 |
|
| (18 | ) |
| (6 | ) |
| 2 |
|
| (12 | ) |
| 20 |
|
| (7 | ) |
| 1 |
| ||||||||||||||
Net income before income tax expense |
| 2,289 |
|
| 696 |
|
| 504 |
|
| 544 |
|
| 545 |
|
| 2,127 |
|
| 557 |
|
| 668 |
|
| 413 |
|
| 489 |
| ||||||||||||||
Income tax expense |
| 609 |
|
| 188 |
|
| 133 |
|
| 135 |
|
| 153 |
|
| 569 |
|
| 152 |
|
| 178 |
|
| 111 |
|
| 128 |
| ||||||||||||||
Net income |
| 1,680 |
|
| 508 |
|
| 371 |
|
| 409 |
|
| 392 |
|
| 1,558 |
|
| 405 |
|
| 490 |
|
| 302 |
|
| 361 |
| ||||||||||||||
Earnings per share: | ||||||||||||||||||||||||||||||||||||||||||||
Basic | $ | 3.33 |
| $ | 1.01 |
| $ | 0.73 |
| $ | 0.81 |
| $ | 0.78 |
| $ | 3.09 |
| $ | 0.80 |
| $ | 0.97 |
| $ | 0.60 |
| $ | 0.71 |
| ||||||||||||||
Diluted | $ | 3.32 |
| $ | 1.00 |
| $ | 0.71 |
| $ | 0.76 |
| $ | 0.77 |
| $ | 3.07 |
| $ | 0.80 |
| $ | 0.94 |
| $ | 0.60 |
| $ | 0.70 |
| ||||||||||||||
Net income |
| 1,680 |
|
| 508 |
|
| 371 |
|
| 409 |
|
| 392 |
|
| 1,558 |
|
| 405 |
|
| 490 |
|
| 302 |
|
| 361 |
| ||||||||||||||
Add (deduct): | ||||||||||||||||||||||||||||||||||||||||||||
Restructuring, acquisition and other |
| 310 |
|
| 58 |
|
| 85 |
|
| 71 |
|
| 96 |
|
| 324 |
|
| 101 |
|
| 63 |
|
| 115 |
|
| 45 |
| ||||||||||||||
Income tax impact of above items |
| (75 | ) |
| (12 | ) |
| (20 | ) |
| (17 | ) |
| (26 | ) |
| (79 | ) |
| (20 | ) |
| (17 | ) |
| (30 | ) |
| (12 | ) | ||||||||||||||
Adjusted net income |
| 1,915 |
|
| 554 |
|
| 436 |
|
| 463 |
|
| 462 |
|
| 1,803 |
|
| 486 |
|
| 536 |
|
| 387 |
|
| 394 |
| ||||||||||||||
Adjusted earnings per share: | ||||||||||||||||||||||||||||||||||||||||||||
Basic | $ | 3.79 |
| $ | 1.10 |
| $ | 0.86 |
| $ | 0.92 |
| $ | 0.91 |
| $ | 3.57 |
| $ | 0.96 |
| $ | 1.06 |
| $ | 0.77 |
| $ | 0.78 |
| ||||||||||||||
Diluted | $ | 3.78 |
| $ | 1.09 |
| $ | 0.84 |
| $ | 0.86 |
| $ | 0.91 |
| $ | 3.56 |
| $ | 0.96 |
| $ | 1.03 |
| $ | 0.76 |
| $ | 0.77 |
| ||||||||||||||
Capital expenditures |
| 3,075 |
|
| 776 |
|
| 872 |
|
| 778 |
|
| 649 |
|
| 2,788 |
|
| 846 |
|
| 739 |
|
| 719 |
|
| 484 |
| ||||||||||||||
Cash provided by operating activities |
| 4,493 |
|
| 1,145 |
|
| 1,216 |
|
| 1,319 |
|
| 813 |
|
| 4,161 |
|
| 1,147 |
|
| 1,319 |
|
| 1,016 |
|
| 679 |
| ||||||||||||||
Free cash flow |
| 1,773 |
|
| 635 |
|
| 279 |
|
| 344 |
|
| 515 |
|
| 1,671 |
|
| 468 |
|
| 507 |
|
| 302 |
|
| 394 |
| ||||||||||||||
Free cash flow excluding Shaw financing |
| 1,985 |
|
| 644 |
|
| 347 |
|
| 451 |
|
| 543 |
|
| 1,671 |
|
| 468 |
|
| 507 |
|
| 302 |
|
| 394 |
| ||||||||||||||
40 | ROGERS COMMUNICATIONS INC. 2022 ANNUAL REPORT
FOURTH QUARTER 2022 RESULTS
Results commentary in “Fourth Quarter 2022 Results” compares the fourth quarter of 2022 with the fourth quarter of 2021.
Revenue
Total revenue and total service revenue each increased by 6% in the fourth quarter, driven primarily by revenue growth in our Wireless and Media businesses.
Wireless service revenue increased by 7% in the fourth quarter, primarily as a result of higher roaming revenue associated with increased travel, as COVID-19-related global travel restrictions were removed, and a larger postpaid mobile phone subscriber base. Wireless equipment revenue increased by 6%, as a result of higher device upgrades by existing customers, and a continued shift in the product mix towards higher-value devices.
Cable service revenue was stable in the fourth quarter, primarily as a result of increased competitive promotional activity, offset by service pricing changes made in the first quarter and an increase in total customer relationships.
Media revenue increased by 17% in the fourth quarter, primarily as a result of higher sports-related revenue, including higher Toronto Blue Jays revenue, and higher advertising revenue, partially offset by lower Today’s Shopping Choice revenue.
Adjusted EBITDA and margins
Consolidated adjusted EBITDA increased 10% in the fourth quarter and our adjusted EBITDA margin increased by 150 basis primarily due to increases in Wireless and Media adjusted EBITDA.
Wireless adjusted EBITDA increased by 8%, primarily due to the flow-through impact of higher revenue as discussed above. This gave rise to a Wireless adjusted EBITDA service margin of 63.2%.
Cable adjusted EBITDA increased by 1%, primarily as a result lower operating expenses due to recognized cost efficiencies. This gave rise to a Cable adjusted EBITDA margin of 51.2%.
Media adjusted EBITDA increased by $83 million in the fourth quarter, primarily due to higher revenue as discussed above.
Net income and adjusted net income
Net income and adjusted net income increased in the fourth quarter by 25% and 14%, respectively, primarily as a result of higher adjusted EBITDA, partially offset by higher income taxes and higher finance costs attributable to the Shaw senior note financing.
QUARTERLY TRENDS AND SEASONALITY
Our operating results generally vary from quarter to quarter as a result of changes in general economic conditions and seasonal fluctuations, among other things, in each of our reportable segments. This means our results in one quarter are not necessarily indicative of how we will perform in a future quarter. Wireless, Cable, and Media each have unique seasonal aspects to, and certain other historical trends in, their businesses.
COVID-19 affected our operating results in 2021 in addition to the typical seasonal fluctuations in our business that are described below. In Wireless, the reduced customer travel due to global travel restrictions resulted in lower-than-pre-pandemic roaming revenue. In Media, due to postponed and condensed NBA and NHL
seasons, sports-related revenue and expenses, such as programming rights amortization, were recognized at different points in time than is typical. Furthermore, the Toronto Blue Jays being able to allow limited game-day attendance impacted revenue and operating expenses. In 2022, COVID-19 did not have a material impact on our operating results.
We do not expect COVID-19 to continue to significantly affect our operating results in 2023 and there is less uncertainty surrounding the duration and potential outcomes of COVID-19.
Fluctuations in net income from quarter to quarter can also be attributed to losses on the repayment of debt, foreign exchange gains or losses, changes in the fair value of derivative instruments, other income and expenses, restructuring, acquisition and other costs, impairment of assets, and changes in income tax expense.
Wireless
Trends affecting both Wireless revenue and adjusted EBITDA reflect:
| • | the growing number of wireless subscribers; |
| • | greater usage of wireless data; |
| • | a shift to consumers financing higher-value devices, along with ongoing disciplined promotional activity; partially offset by |
| • | fewer new subscribers purchasing devices and fewer device upgrades by existing customers; and |
| • | decreasing postpaid churn, which we believe is beginning to reflect the realization of our enhanced customer service efforts; partially offset by |
| • | lower overage revenue as customers continue to adopt our unlimited data plans. |
Additional trends affecting Wireless adjusted EBITDA reflect higher costs related to the increasing number of subscribers.
We continue to target organic growth in higher-value postpaid subscribers, reflected in the increasing proportion of postpaid subscribers relative to prepaid subscribers. Prepaid plans have also evolved to have properties similar to those of traditional postpaid plans. We believe this evolution provides consumers with greater choice of subscribing to a postpaid or prepaid service plan. Growth in our customer base over time has resulted in higher costs for customer service, retention, credit, and collection; however, most of the cost increases have been offset by gains in operating efficiencies.
Wireless operating results are influenced by the timing of our marketing and promotional expenditures and higher levels of subscriber additions, resulting in higher subscriber acquisition- and activation-related expenses, typically in the third and fourth quarters. Conversely, periods with higher activity may adversely impact subscriber churn metrics as a result of heightened competitive activity. The third and fourth quarters typically experience higher volumes of activity as a result of “back to school” and holiday season-related consumer behaviour. Aggressive promotional offers are often advertised during these periods and also contribute to the impact on subscriber metrics. In contrast, we typically see lower subscriber additions in the first quarter of the year.
The launch of popular new wireless device models can also affect the level of subscriber activity. Highly anticipated device launches typically occur in the spring and fall seasons of each year. Wireless
2022 ANNUAL REPORT ROGERS COMMUNICATIONS INC. | 41
MANAGEMENT’S DISCUSSION AND ANALYSIS
roaming revenue is dependent on customer travel volumes and timing, which in turn are affected by the foreign exchange rate of the Canadian dollar and general economic conditions.
Cable
Trends affecting Cable service revenue primarily reflect:
| • | higher Internet subscription fees as customers increasingly upgrade to higher-tier speed plans; |
| • | customers adopting Ignite TV; |
| • | general service pricing increases; and |
| • | the shift of business customers from lower-margin, off-net legacy long distance and data services to higher-margin, next-generation services and data centre businesses; partially offset by |
| • | competitive losses of legacy Television and Phone subscribers; |
| • | Television subscribers downgrading their service plans; and |
| • | lower additional usage of our products and services as service plans are increasingly bundling more features, such as a greater number of TV channels. |
Trends affecting Cable adjusted EBITDA primarily reflect:
| • | higher Internet operating margins, as a result of the shift from conventional Television to Internet services; and |
| • | the shift to a self-install model for most of our Cable products; partially offset by |
| • | higher premium supplier fees in Television as a result of bundling more value-added offerings into our Cable products. |
Cable’s operating results are affected by modest seasonal fluctuations in subscriber additions and disconnections, typically caused by:
| • | university and college students who live in residence moving out early in the second quarter and cancelling their service as well as students moving in late in the third quarter and signing up for cable service; |
| • | individuals temporarily suspending service for extended vacations or seasonal relocations; |
| • | the timing of service pricing changes; and |
| • | the focused marketing we generally conduct in our fourth quarter. |
Cable operating results are also influenced by trends in cord shaving and cord cutting, which has resulted in fewer subscribers watching traditional cable television, as well as a lower number of Television subscribers. In addition, trends in the use of wireless products and Internet or social media as substitutes for traditional home phone products have resulted in fewer Phone subscribers. Cable results from our business customers do not generally have any unique seasonal aspects.
Media
Trends affecting Media revenue and adjusted EBITDA are generally the result of:
| • | fluctuations in advertising and consumer market conditions; |
| • | subscriber rate increases; |
| • | higher sports and rights costs, including increases as we move further along in our NHL Agreement; |
| • | general cord shaving and cord cutting by television subscribers regardless of service provider; and |
| • | continual investment in primetime and specialty programming relating to both our broadcast networks (such as Citytv) and our specialty channels (such as FX (Canada)). |
Seasonal fluctuations relate to:
| • | periods of increased consumer activity and their impact on advertising and related retail cycles, which tend to be most active in the fourth quarter due to holiday spending and slower in the first quarter; |
| • | the MLB season, where: |
| • | games played are concentrated in the spring, summer, and fall months (generally the second and third quarters of the year); |
| • | revenue related to game day ticket sales, merchandise sales, and advertising are concentrated in the spring, summer, and fall months (generally the second and third quarters of the year), with postseason games commanding a premium in advertising revenue and additional revenue from game day ticket sales and merchandise sales, if and when the Toronto Blue Jays play in the postseason (in the fourth quarter of the year); and |
| • | programming and production costs and player payroll are expensed based on the number of games aired or played, as applicable; and |
| • | the NHL season, where: |
| • | regular season games are concentrated in the fall and winter months (generally the first and fourth quarters of the year) and playoff games are concentrated in the spring months (generally the second quarter of the year). We expect a correlation between the quality of revenue and earnings and the extent of Canadian teams’ presence during the playoffs; |
| • | programming and production costs are expensed based on the timing of when the rights are aired or are expected to be consumed; and |
| • | advertising revenue and programming expenses are concentrated in the fall, winter, and spring months, with playoff games commanding a premium in advertising revenue. |
Other expenses
Depreciation and amortization trails capital expenditures and is expected to trend upward as a result of an increase in our capital expenditures and general depreciable asset base, related significantly to the ongoing expansions of our wireless and cable networks. The increasing trend is a direct result of increasing capital expenditures as we upgraded our wireless network for 5G services and our service footprint expansion and upgrades to our DOCSIS 3.1 platform to evolve to DOCSIS 4.0 for our Cable footprint. We expect future depreciation and amortization to align with ongoing capital expenditures and additions to right-of-use assets.
42 | ROGERS COMMUNICATIONS INC. 2022 ANNUAL REPORT
OVERVIEW OF FINANCIAL POSITION
CONSOLIDATED STATEMENTS OF FINANCIAL POSITION
As at December 31 (In millions of dollars) | ||||||||||||||||||
| 2022 | 2021 | $ Chg | % Chg | Explanation of significant changes | ||||||||||||||
Assets | ||||||||||||||||||
Current assets: | ||||||||||||||||||
Cash and cash equivalents |
| 463 |
|
| 715 |
|
| (252 | ) |
| (35 | ) | See “Managing our Liquidity and Financial Resources”. | |||||
Restricted cash and cash equivalents |
| 12,837 |
|
| – |
|
| 12,837 |
|
| – |
| Reflects the restrictions on use of, and liquidity maintenance on, the proceeds received from our issuance of the Shaw senior note financing. | |||||
Accounts receivable |
| 4,184 |
|
| 3,847 |
|
| 337 |
|
| 9 |
| Primarily reflects an increase in financing receivables and in trade accounts receivable associated with higher revenue. | |||||
Inventories |
| 438 |
|
| 535 |
|
| (97 | ) |
| (18 | ) | Reflects a decrease in Wireless handset inventories. | |||||
Current portion of contract assets |
| 111 |
|
| 115 |
|
| (4 | ) |
| (3 | ) | n/m | |||||
Other current assets |
| 561 |
|
| 497 |
|
| 64 |
|
| 13 |
| n/m | |||||
Current portion of derivative instruments |
| 689 |
|
| 120 |
|
| 569 |
|
| n/m |
| Primarily reflects the reclassification to current of our debt derivatives related to our US$500 million senior notes due March 2023 and our US$850 million senior notes due October 2023, partially offset by the change in market values of debt derivatives as a result of the depreciation of the Cdn$ relative to the US$. | |||||
Total current assets |
| 19,283 |
|
| 5,829 |
|
| 13,454 |
|
| n/m |
| ||||||
Property, plant and equipment |
| 15,574 |
|
| 14,666 |
|
| 908 |
|
| 6 |
| Primarily reflects capital expenditures and additions to right-of-use assets partially offset by depreciation expense. | |||||
Intangible assets |
| 12,251 |
|
| 12,281 |
|
| (30 | ) |
| – |
| n/m | |||||
Investments |
| 2,088 |
|
| 2,493 |
|
| (405 | ) |
| (16 | ) | Primarily reflects fair value decreases for certain publicly traded investments. | |||||
Derivative instruments |
| 861 |
|
| 1,431 |
|
| (570 | ) |
| (40 | ) | Primarily reflects the reclassification to current of our debt derivatives related to our US$500 million senior notes due March 2023 and our US$850 million senior notes due October 2023, partially offset by the change in market values of debt derivatives as a result of the depreciation of the Cdn$ relative to the US$. | |||||
Financing receivables |
| 886 |
|
| 854 |
|
| 32 |
|
| 4 |
| n/m | |||||
Other long-term assets |
| 681 |
|
| 385 |
|
| 296 |
|
| 77 |
| Primarily reflects an increase in pension assets. | |||||
Goodwill |
| 4,031 |
|
| 4,024 |
|
| 7 |
|
| – |
| n/m | |||||
| Total assets | 55,655 | 41,963 | 13,692 | 33 |
| |||||||||||||
Liabilities and shareholders’ equity | ||||||||||||||||||
Current liabilities: | ||||||||||||||||||
Short-term borrowings |
| 2,985 |
|
| 2,200 |
|
| 785 |
|
| 36 |
| Reflects increases in borrowings under our receivables securitization program and our non-revolving credit facilities. | |||||
Accounts payable and accrued liabilities |
| 3,722 |
|
| 3,416 |
|
| 306 |
|
| 9 |
| Reflects an increase due to the additional consent fee on the SMR notes. | |||||
Income tax payable |
| – |
|
| 115 |
|
| (115 | ) |
| (100 | ) | Reflects a decrease in taxes owed as a result of tax installments paid. | |||||
Other current liabilities |
| 252 |
|
| 607 |
|
| (355 | ) |
| (58 | ) | Primarily reflects the termination of our interest rate derivatives upon issuance of our senior and subordinated notes and the change in market values of debt derivatives as a result of the depreciation of the Cdn$ relative to the US$. | |||||
Contract liabilities |
| 400 |
|
| 394 |
|
| 6 |
|
| 2 |
| n/m | |||||
Current portion of long-term debt |
| 1,828 |
|
| 1,551 |
|
| 277 |
|
| 18 |
| Reflects the repayment of US$750 million senior notes in March 2022 and $600 million senior notes in June 2022, partially offset by the reclassification to current of our US$500 million senior notes due March 2023 and our US$850 million senior notes due October 2023. | |||||
Current portion of lease liabilities |
| 362 |
|
| 336 |
|
| 26 |
|
| 8 |
| n/m | |||||
Total current liabilities |
| 9,549 |
|
| 8,619 |
|
| 930 |
|
| 11 |
| ||||||
Provisions |
| 53 |
|
| 50 |
|
| 3 |
|
| 6 |
| n/m | |||||
Long-term debt |
| 29,905 |
|
| 17,137 |
|
| 12,768 |
|
| 75 |
| Primarily reflects the issuances of our US$750 million subordinated notes and $4.25 billion and US$7.05 billion in senior notes, partially offset by a reclassification to current of our US$500 million senior notes due March 2023 and our US$850 million senior notes due October 2023. | |||||
Lease liabilities |
| 1,666 |
|
| 1,621 |
|
| 45 |
|
| 3 |
| Reflects liabilities related to new leases. | |||||
Other long-term liabilities |
| 738 |
|
| 565 |
|
| 173 |
|
| 31 |
| Primarily reflects changes in market values of certain debt derivatives as a result of changes in the Canadian and US interest rate environment. | |||||
Deferred tax liabilities |
| 3,652 |
|
| 3,439 |
|
| 213 |
|
| 6 |
| n/m | |||||
Total liabilities |
| 45,563 |
|
| 31,431 |
|
| 14,132 |
|
| 45 |
| ||||||
Shareholders’ equity |
| 10,092 |
|
| 10,532 |
|
| (440 | ) |
| (4 | ) | Reflects changes in retained earnings and equity reserves. | |||||
Total liabilities and shareholders’ equity |
| 55,655 |
|
| 41,963 |
|
| 13,692 |
|
| 33 |
|
| |||||
2022 ANNUAL REPORT ROGERS COMMUNICATIONS INC. | 43
MANAGEMENT’S DISCUSSION AND ANALYSIS
Managing our Liquidity and Financial Resources
OPERATING, INVESTING, AND FINANCING ACTIVITIES
Years ended December 31
| ||||||||
(In millions of dollars)
| 2022
| 2021
| ||||||
Cash provided by operating activities before changes in net operating assets and liabilities, income taxes paid, and interest paid | 6,154 | 5,626 | ||||||
Change in net operating assets and liabilities | (152 | ) | 37 | |||||
Income taxes paid | (455 | ) | (700 | ) | ||||
Interest paid, net | (1,054 | ) | (802 | ) | ||||
Cash provided by operating activities | 4,493 | 4,161 | ||||||
Investing activities: | ||||||||
Capital expenditures | (3,075 | ) | (2,788 | ) | ||||
Additions to program rights | (47 | ) | (54 | ) | ||||
Changes in non-cash working capital related to capital expenditures and intangible assets | (200 | ) | 67 | |||||
Acquisitions and other strategic transactions, net of cash acquired | (9 | ) | (3,404 | ) | ||||
Other | 68 | 46 | ||||||
Cash used in investing activities | (3,263 | ) | (6,133 | ) | ||||
Financing activities: | ||||||||
Net proceeds received from short-term borrowings | 707 | 971 | ||||||
Net issuance of long-term debt | 12,711 | 550 | ||||||
Net payments on settlement of debt derivatives and forward contracts | (11 | ) | (8 | ) | ||||
Transaction costs incurred | (726 | ) | (31 | ) | ||||
Principal payments of lease liabilities | (316 | ) | (269 | ) | ||||
Dividends paid | (1,010 | ) | (1,010 | ) | ||||
Cash provided by financing activities | 11,355 | 203 | ||||||
Change in cash and cash equivalents and restricted cash and cash equivalents | 12,585 | (1,769 | ) | |||||
Cash and cash equivalents and restricted cash and cash equivalents, beginning of year | 715 | 2,484 | ||||||
Cash and cash equivalents and restricted cash and cash equivalents, end of year | 13,300 | 715 | ||||||
Cash and cash equivalents | 463 | 715 | ||||||
Restricted cash and cash equivalents | 12,837 | – | ||||||
Cash and cash equivalents and restricted cash and cash equivalents, end of year | 13,300 | 715 | ||||||
OPERATING ACTIVITIES
The 8% increase in cash provided by operating activities this year was primarily a result of higher adjusted EBITDA as well as the impact of lower income taxes paid, partially offset by higher investment in net operating assets, mainly higher accounts receivable associated with the increase in revenue, and higher interest paid, related to the Shaw senior note financing.
INVESTING ACTIVITIES
Capital expenditures
We spent $3,075 million this year on property, plant and equipment before related changes in non-cash working capital items, which was 10% higher than 2021. See “Capital Expenditures” for more information.
Acquisitions and other strategic transactions
In 2021, we paid $3.3 billion for the acquisition of 3500 MHz spectrum licences and also made four individually immaterial acquisitions complementary to our existing lines of business in Cable and Media.
FINANCING ACTIVITIES
This year, we received net amounts of $12,681 million (2021 – received net amounts of $1,482 million) on our short-term borrowings, long-term debt, and related derivatives, net of transaction costs. The receipts reflect new debt issued primarily associated with the completion of our long-term financing for the Shaw Transaction. See “Financial Risk Management” for more information on the cash flows relating to our derivative instruments.
44 | ROGERS COMMUNICATIONS INC. 2022 ANNUAL REPORT
Short-term borrowings
Our short-term borrowings consist of amounts outstanding under our receivables securitization program, our short-term non-revolving credit facilities, and our US CP program. Below is a summary of our short-term borrowings as at December 31, 2022 and 2021.
Years ended December 31
| ||||||||
(In millions of dollars)
| 2022
| 2021
| ||||||
Receivables securitization program | 2,400 | 800 | ||||||
US commercial paper program (net of the discount on issuance) | 214 | 893 | ||||||
Non-revolving credit facility borrowings
|
| 371
|
|
| 507
|
| ||
Total short-term borrowings
|
| 2,985
|
|
| 2,200
|
| ||
The table below summarizes the activity relating to our short-term borrowings for the years ended December 31, 2022 and 2021.
| Year ended December 31, 2022 | Year ended December 31, 2021 | |||||||||||||||||||||||
| (In millions of dollars, except exchange rates) | Notional (US$) | Exchange rate | Notional (Cdn$) | Notional (US$) | Exchange rate | Notional (Cdn$) | ||||||||||||||||||
Proceeds received from receivables securitization |
|
|
|
|
|
| 1,600 |
|
|
|
|
|
| 150 | ||||||||||
Net proceeds received from receivables securitization |
|
|
|
|
|
| 1,600 |
|
|
|
|
|
| 150 | ||||||||||
Proceeds received from US commercial paper | 6,745 | 1.302 | 8,781 | 2,568 | 1.260 | 3,235 | ||||||||||||||||||
Repayment of US commercial paper | (7,303 | ) | 1.306 | (9,537 | ) | (2,314 | ) | 1.259 | (2,914 | ) | ||||||||||||||
Net (repayment of) proceeds received from US commercial paper |
|
|
|
|
|
| (756 | ) |
|
|
|
|
|
| 321 | |||||||||
Proceeds received from non-revolving credit facilities (Cdn$) | 865 | – | ||||||||||||||||||||||
Proceeds received from non-revolving credit facilities (US$) | – | – | – | 1,200 | 1.253 | 1,503 | ||||||||||||||||||
Total proceeds received from non-revolving credit facilities |
|
|
|
|
|
| 865 |
|
|
|
|
|
| 1,503 | ||||||||||
Repayment of non-revolving credit facilities (Cdn$) | (495 | ) | – | |||||||||||||||||||||
Repayment of non-revolving credit facilities (US$) | (400 | ) | 1.268 | (507 | ) | (800 | ) | 1.254 | (1,003 | ) | ||||||||||||||
Total repayment of non-revolving credit facilities |
|
|
|
|
|
| (1,002 | ) |
|
|
|
|
|
| (1,003 | ) | ||||||||
Net (repayment of) proceeds received from non-revolving credit facilities |
|
|
|
|
|
| (137 | ) |
|
|
|
|
|
| 500 | |||||||||
Net proceeds received from short-term borrowings |
|
|
|
|
|
| 707 |
|
|
|
|
|
| 971 | ||||||||||
In March 2022, we amended the terms of our receivables securitization program and increased the maximum potential proceeds under the program from $1.2 billion to $1.8 billion. In May 2022, we further amended the terms of the program and increased the maximum potential proceeds to $2 billion. In October 2022, we further amended the terms of the program and increased the maximum potential proceeds to $2.4 billion. We will continue to service the receivables and they will continue to be recorded as “accounts receivable” or “financing receivables”, as applicable, on our 2022 Consolidated Statements of Financial Position.
The terms of our receivables securitization program are committed until its expiry, which we extended this year to an expiration date of April 25, 2024. The buyer’s interest in these receivables ranks ahead of our interest. The buyer of our receivables has no further claim on any of our other assets.
We have a US CP program that allows us to issue up to a maximum aggregate principal amount of US$1.5 billion. Funds can be borrowed under this program with terms to maturity ranging from
1 to 397 days, subject to ongoing market conditions. Any issuances made under the US CP program will be issued at a discount. The obligations of RCI under the US CP program are unsecured and guaranteed by RCCI, and rank equally in right of payment with all our senior notes and debentures. See “Financial Condition” for more information.
Concurrent with our US CP issuances and non-revolving credit facility borrowings, we entered into debt derivatives to hedge the foreign currency risk associated with the principal and interest components of the borrowings. See “Financial Risk Management” for more information.
In December 2022, we entered into non-revolving credit facilities with an aggregate limit of $1 billion, including $375 million maturing in December 2023, $375 million maturing in January 2024, and $250 million maturing one year from when it is drawn. Any borrowings under these facilities will be recorded as “short-term borrowings” as they will be due within 12 months. Borrowings under the facilities are unsecured, guaranteed by RCCI, and rank
2022 ANNUAL REPORT ROGERS COMMUNICATIONS INC. | 45
MANAGEMENT’S DISCUSSION AND ANALYSIS
equally in right of payment with all of our senior notes and debentures. As at December 31, 2022, we had borrowed $375 million, and received $370 million net of the discount on issuance, under the facility maturing in December 2023. In January 2023, we borrowed US$273 million under the facility maturing in January 2024. In February 2023, we borrowed US$186 million under the remaining facility, maturing in February 2024. As a result, we have fully drawn on the facilities.
In June 2021, we entered into non-revolving credit facilities with an aggregate limit of US$1.6 billion that matured in June 2022. Borrowings under these facilities were recorded as “short-term borrowings”. Borrowings under the facilities were unsecured, guaranteed by RCCI, and ranked equally in right of payment with
all of our senior notes and debentures. In December 2021, we terminated the undrawn non-revolving credit facilities with an aggregate limit of US$1.2 billion. In February 2022, we repaid the outstanding US$400 million and terminated the facility.
In March 2021, in connection with the Shaw Transaction, we entered into a binding commitment letter for a committed credit facility with a syndicate of banks in an amount up to $19 billion. As a result of entering into the term loan facility (see “Long-term debt” below), this committed facility decreased to $13 billion. Subsequently, as a result of issuing US$7.05 billion ($9.05 billion) and $4.25 billion senior notes (see “Long-term debt” below) during the first quarter of 2022, the maximum amount we could have drawn decreased to nil and the facility was terminated.
Long-term debt
Our long-term debt consists of amounts outstanding under our bank and letter of credit facilities and the senior notes, debentures, and subordinated notes we have issued. The tables below summarize the activity relating to our long-term debt for the years ended December 31, 2022 and 2021.
| Year ended December 31, 2022 | Year ended December 31, 2021 | |||||||||||||||||||||||
| (In millions of dollars, except exchange rates) | Notional (US$) | Exchange rate | Notional (Cdn$) | Notional (US$) | Exchange rate | Notional (Cdn$) | ||||||||||||||||||
Senior note issuances (Cdn$) | 4,250 | – | ||||||||||||||||||||||
Senior note issuances (US$) | 7,050 | 1.284 | 9,054 | – | – | – | ||||||||||||||||||
Total senior note issuances |
|
|
|
|
|
| 13,304 |
|
|
|
|
|
| – | ||||||||||
Senior note repayments (Cdn$) | (600 | ) | (1,450 | ) | ||||||||||||||||||||
Senior note repayments (US$) | (750 | ) | 1.259 | (944 | ) | – | – | – | ||||||||||||||||
Total senior note repayments |
|
|
|
|
|
| (1,544 | ) |
|
|
|
|
|
| (1,450 | ) | ||||||||
Net issuance (repayment) of senior notes |
|
|
|
|
|
| 11,760 |
|
|
|
|
|
| (1,450 | ) | |||||||||
Subordinated note issuances (Cdn$) | – | 2,000 | ||||||||||||||||||||||
Subordinated note issuances (US$) | 750 | 1.268 | 951 | – | – | – | ||||||||||||||||||
Total subordinated note issuances |
|
|
|
|
|
| 951 |
|
|
|
|
|
| 2,000 | ||||||||||
Net issuance of long-term debt |
|
|
|
|
|
| 12,711 |
|
|
|
|
|
| 550 | ||||||||||
| Years ended December 31 | ||||||||
| (In millions of dollars) | 2022 | 2021 | ||||||
Long-term debt net of transaction costs, beginning of year | 18,688 | 18,201 | ||||||
Net issuance of long-term debt | 12,711 | 550 | ||||||
Loss (gain) on foreign exchange | 1,271 | (50 | ) | |||||
Deferred transaction costs incurred | (988 | ) | (31 | ) | ||||
Amortization of deferred transaction costs | 51 | 18 | ||||||
Long-term debt net of transaction costs, end of year | 31,733 | 18,688 | ||||||
In the first quarter, we entered into a $665 million senior unsecured non-revolving credit facility with a fixed 1% interest rate with Canada Infrastructure Bank. The credit facility can only be drawn upon to finance broadband service expansion projects to underserved communities under the Universal Broadband Fund. As at December 31, 2022, we had not drawn on the credit facility.
In April 2021, we entered into a $6 billion term loan facility consisting of three tranches of $2 billion each. The facility cannot be drawn upon until the closing date of the Shaw Transaction. The first tranche matures three years after the Shaw Transaction closing date and subsequent tranches mature in years four and five thereafter, respectively. At tranche maturity, any outstanding borrowings under that tranche must be repaid. The interest rate
charged on borrowings from the term loan facility ranges from nil to 1.25% per annum over the bank prime rate or base rate, or 0.65% to 2.25% over the bankers’ acceptance rate or London Inter-Bank Offered Rate. In May 2022, we extended the drawdown period of the term loan facility to December 31, 2022. In September 2022, we further extended the drawdown period to December 31, 2023.
In April 2021, we amended our revolving credit facility to, among other things, increase the total credit limit and extend the maturity dates. We increased the total credit limit from $3.2 billion to $4 billion by increasing the limits of the two tranches to $3 billion and $1 billion (from $2.5 billion and $700 million), respectively. We also extended the maturity date of the $3 billion tranche from
46 | ROGERS COMMUNICATIONS INC. 2022 ANNUAL REPORT
September 2023 to April 2026 and the $1 billion tranche from September 2022 to April 2024. In January 2023, we amended our revolving credit facility to further extend the maturity date of the
$3 billion tranche to January 2028, from April 2026 and the $1 billion tranche to January 2026, from April 2024.
Issuance of senior and subordinated notes and related debt derivatives
Below is a summary of the senior and subordinated notes that we issued in 2022 and 2021. In 2022, substantially all of the proceeds were recognized in our “restricted cash and cash equivalents”. In 2021, the proceeds were used to partially fund the purchase of 3500 MHz spectrum licences.
| (In millions of dollars, except interest rates and discounts) | Transaction costs and discounts 2 (Cdn$) | |||||||||||||||||||||||||||
| Date issued | Principal amount | Due date | Interest rate | Discount/ premium at issuance | Total gross proceeds 1 (Cdn$) | Upon issuance | Upon modification 3 | |||||||||||||||||||||
2022 issuances | ||||||||||||||||||||||||||||
February 11, 2022 (subordinated) 4 | US 750 | 2082 | 5.250% | At par | 951 | 13 | – | |||||||||||||||||||||
March 11, 2022 (senior) 5 | US 1,000 | 2025 | 2.950% | 99.934% | 1,283 | 9 | 50 | |||||||||||||||||||||
March 11, 2022 (senior) | 1,250 | 2025 | 3.100% | 99.924% | 1,250 | 7 | – | |||||||||||||||||||||
March 11, 2022 (senior) | US 1,300 | 2027 | 3.200% | 99.991% | 1,674 | 13 | 82 | |||||||||||||||||||||
March 11, 2022 (senior) | 1,000 | 2029 | 3.750% | 99.891% | 1,000 | 7 | 57 | |||||||||||||||||||||
March 11, 2022 (senior) | US 2,000 | 2032 | 3.800% | 99.777% | 2,567 | 27 | 165 | |||||||||||||||||||||
March 11, 2022 (senior) | 1,000 | 2032 | 4.250% | 99.987% | 1,000 | 6 | 58 | |||||||||||||||||||||
March 11, 2022 (senior) | US 750 | 2042 | 4.500% | 98.997% | 966 | 20 | 95 | |||||||||||||||||||||
March 11, 2022 (senior) | US 2,000 | 2052 | 4.550% | 98.917% | 2,564 | 55 | 250 | |||||||||||||||||||||
March 11, 2022 (senior) | 1,000 | 2052 | 5.250% | 99.483% | 1,000 | 12 | 62 | |||||||||||||||||||||
2021 issuance | ||||||||||||||||||||||||||||
December 17, 2021 (subordinated) 4 | 2,000 | 2081 | 5.000% | At par | 2,000 | 20 | – | |||||||||||||||||||||
| 1 | Gross proceeds before transaction costs, discounts, and premiums. |
| 2 | Transaction costs, discounts, and premiums are included as deferred transaction costs and discounts in the carrying value of the long-term debt, and recognized in net income using the effective interest method. |
| 3 | Accounted for as a modification of the respective financial liabilities. Reflects initial consent fee of $557 million incurred in September 2022 and additional consent fee of $262 million incurred in December 2022. |
| 4 | Deferred transaction costs and discounts in the carrying value of the subordinated notes are recognized in net income using the effective interest method over a five-year period. |
| 5 | The US$1 billion senior notes due 2025 can be redeemed at par on or after March 15, 2023. |
Concurrent with the US dollar-denominated issuances, we entered into debt derivatives to convert all interest and principal payment obligations on the senior notes to Canadian dollars at a fixed interest rate. See “Financial Risk Management” for more information.
The issued senior and subordinated notes are unsecured and guaranteed by RCCI, ranking equally with all of our other unsecured senior notes and debentures, subordinated notes, bank credit facilities, and letter of credit facilities.
In December 2021, we issued $2 billion subordinated notes due 2081 with an initial coupon of 5% for the first five years. Concurrently, we terminated the $750 million bond forwards entered into in July 2021 to hedge the interest rate risk associated with future debt issuances. We used the proceeds to partially fund the remaining payment required to obtain the 3500 MHz spectrum licences.
In February 2022, we issued US$750 million subordinated notes due 2082 with an initial coupon of 5.25% for the first five years. Concurrently, we terminated $950 million of interest rate derivatives entered into in 2021 to hedge the interest rate risk associated with future debt issuances. We received net proceeds of US$740 million ($938 million) from the issuance.
Each of the subordinated notes can be redeemed at par on their respective five-year anniversary or on any subsequent interest payment date. The subordinated notes are unsecured and subordinated obligations of RCI. Payment on these notes will, under certain circumstances, be subordinated to the prior payment in full of all of our senior indebtedness, including our senior notes, debentures, and bank credit facilities. In addition, upon the occurrence of certain events involving a bankruptcy or insolvency of
RCI, the outstanding principal and interest of such subordinated notes would automatically convert into preferred shares. We understand that S&P Global Ratings Services (S&P), Moody’s Investors Service (Moody’s), and Fitch Ratings (Fitch) will only include 50% of the outstanding principal amount of these subordinated notes in their leverage ratio calculation for at least the first five years after their issuance.
In connection with the subordinated notes issuances, the Board approved the creation of new Series I and Series II preferred shares, respectively. Series I and Series II have been authorized for up to 3.3 million and 1.4 million preferred shares, respectively, have no voting rights, have par values of $1,000 per share, and will be issued automatically upon the occurrence of certain events involving a bankruptcy or insolvency of RCI to holders of the respective subordinated notes.
In March 2022, we issued the Shaw senior note financing to partially finance the cash consideration for the Shaw Transaction. Each of the SMR notes contains a “special mandatory redemption” provision, which required them to be redeemed at 101% of their principal amount (plus accrued interest) if the Shaw Transaction was not consummated prior to December 31, 2022. At the same time, we terminated the committed credit facility we had arranged in March 2021. The arrangement agreement between Rogers and Shaw requires us to maintain sufficient liquidity to ensure we are able to fund the cash consideration portion of the Shaw Transaction upon closing and as such, we have recognized approximately $12.8 billion of the net proceeds as “restricted cash and cash equivalents” on our 2022 Consolidated Statements of Financial Position.
2022 ANNUAL REPORT ROGERS COMMUNICATIONS INC. | 47
MANAGEMENT’S DISCUSSION AND ANALYSIS
In August 2022, we received consent from the SMR note holders to extend the SMR outside date to December 31, 2023, to ensure this financing remains in place should the Shaw Transaction close after December 31, 2022. As a result, we paid an initial consent fee to the note holders, including other directly attributable transaction costs, in September 2022 of $557 million ($121 million and US$331 million). Since the Shaw Transaction did not close prior to December 31, 2022, we were required to pay to the holders of SMR notes an additional consent fee of $262 million ($55 million and US$152 million) on January 9, 2023. The transaction costs are included as deferred transaction costs and discounts in the carrying value of the long-term debt, and recognized in net income using the effective interest method. The liability associated with the additional consent fee has been recognized within “accounts payable and accrued liabilities” on our Consolidated Statements of Financial Position as at December 31, 2022.
Concurrent with the Shaw senior note financing, we terminated US$2 billion of interest rate swap derivatives, $500 million of bond forwards, and $2.3 billion of interest rate swap derivatives entered into in 2021 to hedge the interest rate risk associated with future debt issuances. Concurrent with the US dollar-denominated issuances, we also entered into debt derivatives to convert all interest and principal payment obligations to Canadian dollars. As a result, we received net proceeds of US$6.95 billion ($8.93 billion) from the US dollar-denominated issuances.
Repayment of senior notes and related derivative settlements
During the year ended December 31, 2022, we repaid the entire outstanding principal amount of our $600 million 4.00% senior notes at maturity. There were no derivatives associated with these senior notes. We also repaid the entire outstanding principal amount of our US$750 million floating rate senior notes and the associated debt derivatives at maturity. As a result, we repaid $1,019 million, including $75 million on settlement of the associated debt derivatives.
During the year ended December 31, 2021, we repaid the entire outstanding principal amount of our $1.45 billion 5.34% senior notes at maturity. There were no derivatives associated with these senior notes.
Dividends
In 2022, we declared and paid dividends on each of RCI’s outstanding Class A Shares and Class B Non-Voting Shares. We paid $1,010 million in cash dividends. See “Dividends and Share Information” for more information.
Shelf prospectuses
We had two shelf prospectuses that qualified the offering of debt securities from time to time. One shelf prospectus qualified the public offering of up to $4 billion of our debt securities in each of the provinces of Canada (Canadian Shelf) and the other shelf prospectus (together with a corresponding registration statement filed with the US Securities and Exchange Commission) qualified the public offering of up to US$4 billion of our debt securities in the United States and Ontario (US Shelf). Both the Canadian Shelf and the US Shelf expired in May 2022.
FREE CASH FLOW
Years ended December 31 | ||||||||||||
| (In millions of dollars) | 2022 | 2021 | % Chg | |||||||||
Adjusted EBITDA |
| 6,393 |
|
| 5,887 |
|
| 9 |
| |||
Deduct (add): | ||||||||||||
Capital expenditures 1 |
| 3,075 |
|
| 2,788 |
|
| 10 |
| |||
Interest on borrowings, net of capitalized interest |
| 1,090 |
|
| 728 |
|
| 50 |
| |||
Cash income taxes 2 |
| 455 |
|
| 700 |
|
| (35 | ) | |||
Free cash flow |
| 1,773 |
|
| 1,671 |
|
| 6 |
| |||
Add (deduct): | ||||||||||||
Interest on Shaw senior note financing |
| 447 |
|
| – |
|
| – |
| |||
Interest earned on restricted cash and cash equivalents |
| (235 | ) |
| – |
|
| – |
| |||
Free cash flow excluding Shaw financing |
| 1,985 |
|
| 1,671 |
|
| 19 |
| |||
| 1 | Includes additions to property, plant and equipment net of proceeds on disposition, but does not include expenditures for spectrum licences, additions to right-of-use assets, or assets acquired through business combinations. |
| 2 | Cash income taxes are net of refunds received. |
The 6% increase in free cash flow and 19% increase in free cash flow excluding Shaw financing this year was primarily a result of higher adjusted EBITDA and lower cash income taxes, partially offset by higher capital expenditures. Free cash flow was also impacted by higher interest on borrowings associated with the Shaw Transaction.
AVAILABLE LIQUIDITY
Below is a summary of our total available liquidity from our cash and cash equivalents, bank credit facilities, letters of credit facilities, and short-term borrowings.
As at December 31, 2022 (In millions of dollars) | Total sources | Drawn | Letters of credit | US CP program 1 | Net available | |||||||||||||||
Cash and cash equivalents |
| 463 |
|
| – |
|
| – |
|
| – |
|
| 463 |
| |||||
Bank credit facilities 2: | ||||||||||||||||||||
Revolving | 4,000 | – | 8 | 215 | 3,777 | |||||||||||||||
Non-revolving | 1,000 | 375 | – | – | 625 | |||||||||||||||
Outstanding letters of credit | 75 | – | 75 | – | – | |||||||||||||||
Receivables securitization 2 |
| 2,400 |
|
| 2,400 |
|
| – |
|
| – |
|
| – |
| |||||
Total |
| 7,938 |
|
| 2,775 |
|
| 83 |
|
| 215 |
|
| 4,865 |
| |||||
| 1 | The US CP program amounts are gross of the discount on issuance. |
| 2 | The total liquidity sources under our bank credit facilities and receivables securitization represents the total credit limits per the relevant agreements. The amount drawn and letters of credit are currently outstanding under those agreements. The US CP program amount represents our currently outstanding US CP borrowings that are backstopped by our revolving credit facility. |
48 | ROGERS COMMUNICATIONS INC. 2022 ANNUAL REPORT
As at December 31, 2021 (In millions of dollars) | Total sources | Drawn | Letters of credit | US CP program 1 | Net available | |||||||||||||||
Cash and cash equivalents |
| 715 |
|
| – |
|
| – |
|
| – |
| 715 | |||||||
Bank credit facilities 2: | ||||||||||||||||||||
Revolving | 4,000 | – | 8 | 894 | 3,098 | |||||||||||||||
Non-revolving | 507 | 507 | – | – | – | |||||||||||||||
Outstanding letters of credit | 72 | – | 72 | – | – | |||||||||||||||
Receivables securitization 2 |
| 1,200 |
|
| 800 |
|
| – |
|
| – |
| 400 | |||||||
Total |
| 6,494 |
|
| 1,307 |
|
| 80 |
|
| 894 |
| 4,213 | |||||||
| 1 | The US CP program amounts are gross of the discount on issuance. |
| 2 | The total liquidity sources under our bank credit facilities and receivables securitization represents the total credit limits per the relevant agreements. The amount drawn and letters of credit are currently outstanding under those agreements. The US CP program amount represents our currently outstanding US CP borrowings that are backstopped by our revolving credit facility. |
In addition to the sources of available liquidity noted above, we held $1,200 million of marketable securities in publicly traded companies as at December 31, 2022 (2021 – $1,581 million).
Our restricted cash and cash equivalents are not included in available liquidity as the funds were raised solely to fund a portion of the cash consideration of the Shaw Transaction. Our $6 billion term loan facility related to the Shaw Transaction is also not included in available liquidity as we can only draw on that facility to partially fund the Shaw Transaction. Our Canada Infrastructure Bank credit agreement (see “Sources and Uses of Cash”) is not included in available liquidity as it can only be drawn upon for use in broadband projects under the Universal Broadband Fund, and therefore is not available for other general purposes.
Weighted average cost of borrowings
Our borrowings had a weighted average cost of 4.50% as at
December 31, 2022 (2021 – 3.95%) and a weighted average term to maturity of 11.8 years (2021 – 11.6 years). These figures reflect the repayment of our subordinated notes on the five-year anniversary.
COVENANTS
The provisions of our $4.0 billion revolving bank credit facility described in “Sources and Uses of Cash” impose certain restrictions on our operations and activities, the most significant of which are leverage-related maintenance tests. As at December 31, 2022 and 2021, we were in compliance with all financial covenants, financial ratios, and all of the terms and conditions of our debt agreements. Throughout 2022, these covenants did not impose restrictions of any material consequence on our operations.
CREDIT RATINGS
Credit ratings provide an independent measure of credit quality of an issue of securities and can affect our ability to obtain short-term and long-term financing and the terms of the financing. If rating agencies lower the credit ratings on our debt, particularly a downgrade below investment-grade, it could adversely affect our cost of financing and access to liquidity and capital.
We have engaged each of S&P, Moody’s, Fitch, and DBRS Morningstar to rate certain of our public debt issues. Below is a summary of the credit ratings on RCI’s outstanding senior and subordinated notes and debentures (long-term) and US CP (short-term) as at December 31, 2022.
Issuance | S&P Global Ratings | Moody’s | Fitch | DBRS Morningstar | ||||
Corporate credit issuer default rating | BBB+ CreditWatch Negative | Baa1 under review | BBB+ Rating Watch Negative | BBB (high), Under Review with Negative Implications | ||||
Senior unsecured debt | BBB+ CreditWatch Negative | Baa1 under review | BBB+ Rating Watch Negative | BBB (high), Under Review with Negative Implications | ||||
Subordinated debt | BBB- CreditWatch Negative | Baa3 under review | BBB- Rating Watch Negative | N/A 1 | ||||
US commercial paper | A-2 CreditWatch Negative | P-2 under review | N/A 1 | N/A 1 | ||||
| 1 | We have not sought a rating from Fitch or DBRS Morningstar for our short-term obligations or from DBRS Morningstar for our subordinated debt |
As a result of our agreement to acquire Shaw and the related commitments in connection with the Shaw Transaction, each of these rating agencies has put our credit rating under review. We expect S&P, Moody’s, Fitch, and DBRS Morningstar to complete their reviews upon closing of the Shaw Transaction. See “Shaw Transaction” and “Risks and Uncertainties Affecting our Business – Shaw Transaction” for more information on our agreement with Shaw and the Shaw Transaction.
Ratings for long-term debt instruments across the universe of composite rates range from AAA (S&P, Fitch, and DBRS Morningstar) or Aaa (Moody’s), representing the highest quality of securities rated, to D (S&P and DBRS Morningstar), Substantial Risk (Fitch), and C (Moody’s) for the lowest quality of securities rated. Investment-grade credit ratings are generally considered to range from BBB- (S&P and Fitch), BBB (DBRS Morningstar), or Baa3 (Moody’s) to AAA (S&P, Fitch, and DBRS Morningstar) or Aaa (Moody’s).
2022 ANNUAL REPORT ROGERS COMMUNICATIONS INC. | 49
MANAGEMENT’S DISCUSSION AND ANALYSIS
Ratings for short-term debt instruments across the universe of composite rates ranges from A-1+ (S&P) or P-1 (Moody’s), representing the highest quality of securities rated, to C (S&P), and not prime (Moody’s) for the lowest quality of securities rated. Investment-grade credit ratings are generally considered to be ratings of at least A-3 (S&P), or P-3 (Moody’s) quality or higher.
Credit ratings are not recommendations to purchase, hold, or sell securities, nor are they a comment on market price or investor suitability. There is no assurance that a rating will remain in effect for a given period, or that a rating will not be revised or withdrawn entirely by a rating agency if it believes circumstances warrant it. The ratings on our senior debt provided by S&P, Fitch, Moody’s, and DBRS Morningstar are investment-grade ratings.
ADJUSTED NET DEBT AND DEBT LEVERAGE RATIOS
We use adjusted net debt and debt leverage ratio to conduct valuation-related analysis and make capital structure-related decisions. Adjusted net debt includes long-term debt, net debt derivative assets or liabilities, short-term borrowings, lease liabilities, net of cash and cash equivalents or bank advances, and restricted cash and cash equivalents.
As at December 31 | As at December 31 | |||||||
| (In millions of dollars, except ratios) | 2022 | 2021 | ||||||
Long-term debt 1 |
| 32,855 |
|
| 18,873 |
| ||
Subordinated notes adjustment 2 |
| (1,508 | ) |
| (1,000 | ) | ||
Net debt derivative assets valued without any adjustment for credit risk 3 |
| (998 | ) |
| (1,278 | ) | ||
Short-term borrowings |
| 2,985 |
|
| 2,200 |
| ||
Lease liabilities |
| 2,028 |
|
| 1,957 |
| ||
Cash and cash equivalents |
| (463 | ) |
| (715 | ) | ||
Restricted cash and cash equivalents 4 |
| (12,837 | ) |
| – |
| ||
Adjusted net debt 2,5 |
| 22,062 |
|
| 20,037 |
| ||
Divided by: trailing 12-month adjusted EBITDA |
| 6,393 |
|
| 5,887 |
| ||
Debt leverage ratio |
| 3.5 |
|
| 3.4 |
| ||
Adjusted net debt |
| 22,062 |
|
| 20,037 |
| ||
Add (deduct): | ||||||||
Shaw senior note financing |
| (13,799 | ) |
| – |
| ||
Restricted cash and cash equivalents |
| 12,837 |
|
| – |
| ||
Net debt derivative liabilities related to Shaw senior note financing |
| (267 | ) |
| – |
| ||
Transaction costs related to Shaw senior note financing |
| (707 | ) |
| – |
| ||
Interest income on restricted cash and cash equivalents |
| 235 |
|
| – |
| ||
Interest paid on Shaw senior note financing |
| (301 | ) |
| – |
| ||
Adjusted net debt excluding Shaw financing 5 |
| 20,060 |
|
| 20,037 |
| ||
Divided by: trailing 12-month adjusted EBITDA |
| 6,393 |
|
| 5,887 |
| ||
Debt leverage ratio excluding Shaw financing |
| 3.1 |
|
| 3.4 |
| ||
| 1 | Includes current and long-term portion of long-term debt before deferred transaction costs and discounts. |
| 2 | For the purposes of calculating adjusted net debt and debt leverage ratio, we believe adjusting 50% of the value of our subordinated notes is appropriate as this methodology factors in certain circumstances with respect to priority for payment and this approach is commonly used to evaluate debt leverage by rating agencies. |
| 3 | For the purposes of calculating adjusted net debt and debt leverage ratio, we believe including debt derivatives valued without adjustment for credit risk is commonly used to evaluate debt leverage and for market valuation and transactional purposes. |
| 4 | For the purposes of calculating adjusted net debt, we have deducted our restricted cash and cash equivalents as these funds were raised solely to fund a portion of the cash consideration of the Shaw Transaction or, if unable to be consummated, be used to redeem the applicable senior notes excluding any premium. We therefore believe including only the underlying senior notes would not represent our view of adjusted net debt prior to the consummation of the Shaw Transaction or the redemption of the senior notes. |
| 5 | Adjusted net debt is a capital management measure. Adjusted net debt excluding Shaw financing is a non-GAAP financial measure and is a component of debt leverage ratio excluding Shaw financing. These are not standardized financial measures under IFRS and might not be comparable to similar financial measures disclosed by other companies. See “Non-GAAP and Other Financial Measures” for more information about these measures. |
We use adjusted net debt excluding Shaw financing and debt leverage ratio excluding Shaw financing to analyze our debt and cash balances when excluding the effect of the Shaw senior note financing, as those senior notes were issued for the specific purpose of funding the Shaw Transaction, which has not yet closed. To calculate adjusted net debt excluding Shaw financing, we further adjust adjusted net debt to exclude the balances of the Shaw senior note financing, our restricted cash and cash equivalents balance, and the net debt derivative liabilities relating to the US dollar-denominated Shaw senior note financing, as well as the cumulative transaction costs we have paid to date on the Shaw senior note financing, the cumulative interest income we
have earned on the restricted cash and cash equivalents balance, and the cumulative interest we have paid on the Shaw senior note financing.
Our adjusted net debt increased by $2,025 million from December 31, 2021 as a result of:
| • | an increase in long-term debt from senior and subordinated note issuances; and |
| • | an increase in short-term borrowings from our receivables securitization program; partially offset by |
| • | an increase in our restricted cash position. |
See “Overview of Financial Position” for more information.
50 | ROGERS COMMUNICATIONS INC. 2022 ANNUAL REPORT
PENSION OBLIGATIONS
Our defined benefit pension plans were in a net asset position of approximately $298 million as at December 31, 2022 (2021 – net asset position of $18 million). During 2022, our net deferred pension asset increased by $280 million primarily as a result of a net decrease in the plan obligations resulting from higher discount rates.
We made a total of $134 million (2021 – $177 million) of contributions to our funded defined benefit pension plans this year. We expect our total estimated funding requirements for our
funded defined benefit pension plans to be $73 million in 2023 and to be adjusted annually thereafter based on various market factors, such as interest rates, expected returns, and staffing assumptions.
Changes in factors such as the discount rate, participation rates, increases in compensation, and the expected return on plan assets can affect the accrued benefit obligation, pension expense, and the deficiency of plan assets over accrued obligations in the future. See “Accounting Policies” for more information.
We use derivative instruments from time to time to manage risks related to our business activities, summarized as follows:
Derivative | The risk they manage | Types of derivative instruments | ||
Debt derivatives | Impact of fluctuations in foreign exchange rates on principal and interest payments for US dollar-denominated senior and subordinated notes and debentures, credit facility borrowings, commercial paper borrowings, and certain lease liabilities | Cross-currency interest rate exchange agreements
Forward cross-currency interest rate exchange agreements
Forward foreign exchange agreements | ||
Interest rate derivatives | Impact of fluctuations in market interest rates on forecast interest payments for expected long-term debt | Forward interest rate agreements
Interest rate swap agreements
Bond forwards | ||
Expenditure derivatives | Impact of fluctuations in foreign exchange rates on forecast US dollar-denominated expenditures | Forward foreign exchange agreements and foreign exchange option agreements | ||
Equity derivatives | Impact of fluctuations in share price of our Class B Non-Voting Shares on stock-based compensation expense | Total return swap agreements | ||
We also manage our exposure to fixed and fluctuating interest rates and we have fixed the interest rate on 91.2% (2021 – 89.3%) of our debt, including short-term borrowings, as at December 31, 2022.
DEBT DERIVATIVES
We use cross-currency interest rate agreements, forward cross-currency interest rate agreements, and forward foreign exchange agreements (collectively, debt derivatives) to manage risks from fluctuations in foreign exchange rates and interest rates associated with our US dollar-denominated senior notes and debentures, lease liabilities, credit facility borrowings, and US CP borrowings. We typically designate the debt derivatives related to our senior notes, debentures, subordinated notes, and lease liabilities as hedges for accounting purposes against the foreign exchange risk or interest rate risk associated with specific issued and forecast debt instruments. Debt derivatives related to our US dollar-denominated notes due 2025 and our credit facility and US CP borrowings have not been designated as hedges for accounting purposes.
Issuance of debt derivatives related to senior notes
Below is a summary of the debt derivatives we entered into related to senior and subordinated notes in 2022. We did not enter into any debt derivatives related to senior or subordinated notes issued in 2021.
| (In millions of dollars, except for coupon and interest rates) | US$ | Hedging effect | ||||||||||||||||||
| Effective date | Principal/Notional amount (US$) | Maturity date | Coupon rate | Fixed hedged (Cdn$) interest rate 1 | Equivalent (Cdn$) | |||||||||||||||
2022 issuances | ||||||||||||||||||||
February 11, 2022 |
| 750 |
|
| 2082 |
|
| 5.250% |
|
| 5.635% |
|
| 951 |
| |||||
March 11, 2022 2 |
| 1,000 |
|
| 2025 |
|
| 2.950% |
|
| 2.991% |
|
| 1,283 |
| |||||
March 11, 2022 |
| 1,300 |
|
| 2027 |
|
| 3.200% |
|
| 3.413% |
|
| 1,674 |
| |||||
March 11, 2022 |
| 2,000 |
|
| 2032 |
|
| 3.800% |
|
| 4.232% |
|
| 2,567 |
| |||||
March 11, 2022 |
| 750 |
|
| 2042 |
|
| 4.500% |
|
| 5.178% |
|
| 966 |
| |||||
March 11, 2022 |
| 2,000 |
|
| 2052 |
|
| 4.550% |
|
| 5.305% |
|
| 2,564 |
| |||||
| 1 | Converting from a fixed US$ coupon rate to a weighted average Cdn$ fixed rate. |
| 2 | The derivatives associated with our US$1 billion senior notes due 2025 have not been designated as hedges for accounting purposes. |
2022 ANNUAL REPORT ROGERS COMMUNICATIONS INC. | 51
MANAGEMENT’S DISCUSSION AND ANALYSIS
Settlement of debt derivatives related to senior notes
In March 2022, we repaid the entire outstanding principal amount of our US$750 million floating rate senior notes and the associated debt derivatives at maturity, resulting in a repayment of $1,019 million, including $75 million on settlement of the associated debt derivatives.
During the twelve months ended December 31, 2022, in connection with the issuance of the US$2 billion senior notes due 2052, we terminated US$2 billion notional amount of forward starting cross-currency swaps and received $43 million upon settlement. As at December 31, 2022, we had no forward starting cross-currency swaps outstanding (December 31, 2021 – US$2 billion).
We did not settle any debt derivatives related to senior notes during 2021.
As at December 31, 2022, we had US$16,100 million of US dollar-denominated senior notes, debentures, and subordinated notes, all of which were hedged economically using debt derivatives.
As at December 31 | ||||||||
(In millions of dollars, except exchange rates, percentages, and years) | 2022 | 2021 | ||||||
US dollar-denominated long-term debt 1 | US$ | 16,100 |
| US$ | 9,050 |
| ||
Hedged with debt derivatives | US$ | 16,100 |
| US$ | 9,050 |
| ||
Hedged exchange rate |
| 1.2365 |
|
| 1.2069 |
| ||
Percent hedged |
| 100.0% |
|
| 100.0% |
| ||
Amount of borrowings at fixed rates 2 | ||||||||
Total borrowings | $ | 33,948 |
| $ | 20,514 |
| ||
Total borrowings at fixed rates | $ | 30,958 |
| $ | 18,323 |
| ||
Percent of borrowings at fixed rates |
| 91.2% |
|
| 89.3% |
| ||
Weighted average interest rate on borrowings |
| 4.50% |
|
| 3.95% |
| ||
Weighted average term to maturity |
| 11.8 years |
|
| 11.6 years |
| ||
| 1 | US dollar-denominated long-term debt reflects the hedged exchange rate and the hedged interest rate. |
| 2 | Borrowings include long-term debt, including the impact of debt derivatives, and short-term borrowings associated with our US CP program, receivables securitization program, and non-revolving credit facilities. |
Debt derivatives related to credit facilities and US CP
During the year, we entered into debt derivatives related to our credit facility and US CP borrowings as a result of a favourable interest rate spread obtained from borrowing funds in US dollars. We used these derivatives to offset the foreign exchange and interest rate risk on our US dollar-denominated credit facility and commercial paper borrowings.
Below is a summary of the debt derivatives we entered and settled related to our credit facility borrowings and US CP program during 2022 and 2021.
Year ended December 31, 2022 | Year ended December 31, 2021 | |||||||||||||||||||||||
| (In millions of dollars, except exchange rates) | Notional (US$) | Exchange rate | Notional (Cdn$) | Notional (US$) | Exchange rate | Notional (Cdn$) | ||||||||||||||||||
Credit facilities | ||||||||||||||||||||||||
Debt derivatives entered |
| – |
|
| – |
|
| – |
|
| 1,200 |
|
| 1.253 |
|
| 1,503 |
| ||||||
Debt derivatives settled |
| 400 |
|
| 1.268 |
|
| 507 |
|
| 800 |
|
| 1.254 |
|
| 1,003 |
| ||||||
Net cash received (paid) on settlement |
| 9 |
|
| (2 | ) | ||||||||||||||||||
US commercial paper program | ||||||||||||||||||||||||
Debt derivatives entered |
| 6,745 |
|
| 1.302 |
|
| 8,781 |
|
| 2,568 |
|
| 1.260 |
|
| 3,235 |
| ||||||
Debt derivatives settled |
| 7,292 |
|
| 1.306 |
|
| 9,522 |
|
| 2,312 |
|
| 1.259 |
|
| 2,911 |
| ||||||
Net cash received (paid) on settlement |
| 64 |
|
| (15 | ) | ||||||||||||||||||
Lease liabilities
Below is a summary of the debt derivatives we entered and settled related to our outstanding lease liabilities during 2022 and 2021.
Year ended December 31, 2022 | Year ended December 31, 2021 | |||||||||||||||||||||||
| (In millions of dollars, except exchange rates) | Notional (US$) | Exchange rate | Notional (Cdn$) | Notional (US$) | Exchange rate | Notional (Cdn$) | ||||||||||||||||||
| Debt derivatives entered | 156 | 1.321 | 206 | 132 | 1.273 | 168 | ||||||||||||||||||
Debt derivatives settled | 124 | 1.306 | 162 | 81 | 1.333 | 108 | ||||||||||||||||||
52 | ROGERS COMMUNICATIONS INC. 2022 ANNUAL REPORT
As at December 31, 2022, we had US$225 million notional amount of debt derivatives outstanding related to our outstanding lease liabilities (2021 – US$193 million) with terms to maturity ranging from January 2023 to December 2025 (2021 – January 2022 to December 2024), at an average rate of $1.306/US$ (2021 – $1.301/US$).
See “Mark-to-market value” for more information about our debt derivatives.
INTEREST RATE DERIVATIVES
From time to time, we use bond forward derivatives or interest rate swap derivatives (collectively, interest rate derivatives) to hedge interest rate risk on current and future debt instruments. Our interest rate derivatives are designated as hedges for accounting purposes.
Concurrent with our issuance of US$750 million subordinated notes in February 2022, we terminated $950 million of interest rate swap derivatives and received $33 million upon settlement.
Concurrent with our issuance of US$7.05 billion ($9.05 billion) and $4.25 billion senior notes in March 2022, we terminated:
| • | US$2 billion of interest rate swap derivatives and paid US$129 million ($165 million) upon settlement; and |
| • | $500 million of bond forwards and $2.3 billion of interest rate swap derivatives and received $80 million upon settlement. |
As at December 31, 2022, we had no interest rate derivatives outstanding.
EXPENDITURE DERIVATIVES
We use foreign currency derivative contracts (expenditure derivatives) to hedge the foreign exchange risk on the notional amount of certain forecast US dollar-denominated expenditures. Below is a summary of the expenditure derivatives we entered and settled to manage foreign exchange risk related to certain forecast expenditures.
|
| Year ended December 31, 2022 | Year ended December 31, 2021 | ||||||||||||||||||||||
| (In millions of dollars, except exchange rates) | Notional (US$) | Exchange rate | Notional (Cdn$) | Notional (US$) | Exchange rate | Notional (Cdn$) | ||||||||||||||||||
| Expenditure derivatives entered | 852 | 1.251 | 1,066 | 438 | 1.244 | 545 | ||||||||||||||||||
Expenditure derivatives settled | 960 | 1.291 | 1,239 | 960 | 1.360 | 1,306 | ||||||||||||||||||
The expenditure derivatives noted above have been designated as hedges for accounting purposes.
As at December 31, 2022, we had US$960 million of expenditure derivatives outstanding (2021 – US$1,068 million), at an average rate of $1.250/US$ (2021 – $1.287/US$), with terms to maturity ranging from January 2023 to December 2023 (2021 – January 2022 to December 2023).
EQUITY DERIVATIVES
We use total return swap agreements (equity derivatives) to hedge the market price appreciation risk of the Class B Non-Voting Shares granted under our stock-based compensation programs. As at December 31, 2022, we had equity derivatives for 5.5 million (2021 – 5.0 million) Class B Non-Voting Shares with a weighted average price of $53.65 (2021 – $53.10). These derivatives have not been designated as hedges for accounting purposes. We record changes in their fair value as a stock-based compensation expense, or offset thereto, which serves to offset a substantial portion of the impact of changes in the market price of Class B Non-Voting Shares on the accrued value of the stock-based compensation liability for our stock-based compensation programs.
In 2022, we entered into 0.5 million equity derivatives (2021 – 0.4 million) with a weighted average price of $59.18 (2021 – $60.98).
In 2021, we reset the weighted average price to $59.64 on 0.5 million equity derivatives and received net proceeds of $3 million. At the same time in 2021, we reset the expiry dates to April 2023 (from April 2021).
Additionally, we executed extension agreements for the remainder of our equity derivative contracts under substantially the same commitment terms and conditions with revised expiry dates to April 2023 (from April 2022).
CASH SETTLEMENTS ON DEBT DERIVATIVES AND FORWARD CONTRACTS
Below is a summary of the net proceeds (payments) on settlement of debt derivatives and forward contracts during the years ended December 31, 2022 and 2021.
|
| Year ended December 31, 2022 | Year ended December 31, 2021 | ||||||||||||||||||||||
| (In millions of dollars, except exchange rates) | US$ settlements | Exchange rate | Cdn$ settlements | US$ settlements | Exchange rate | Cdn$ settlements | ||||||||||||||||||
| Credit facilities | 9 | (2 | ) | |||||||||||||||||||||
| US commercial paper program | 64 | (15 | ) | |||||||||||||||||||||
| Senior and subordinated notes | (75 | ) | – | |||||||||||||||||||||
| Forward starting cross-currency swaps | 43 | – | ||||||||||||||||||||||
| Interest rate derivatives (Cdn$) | 113 | 9 | ||||||||||||||||||||||
Interest rate derivatives (US$) |
|
(129 |
) |
|
1.279 |
|
|
(165 |
) |
|
– |
|
|
– |
|
|
– |
| ||||||
Net payments on settlement of debt derivatives and forward contracts | (11 | ) | (8 | ) | ||||||||||||||||||||
2022 ANNUAL REPORT ROGERS COMMUNICATIONS INC. | 53
MANAGEMENT’S DISCUSSION AND ANALYSIS
MARK-TO-MARKET VALUE
We record our derivatives using an estimated credit-adjusted, mark-to-market valuation, calculated in accordance with IFRS.
| As at December 31, 2022 | ||||||||||||||||
| (In millions of dollars, except exchange rates) | Notional amount (US$) | Exchange rate | Notional amount (Cdn$) | Fair (Cdn$) | ||||||||||||
Debt derivatives accounted for as cash flow hedges: |
|
|
|
|
|
|
|
|
|
|
|
| ||||
As assets | 7,834 | 1.1718 | 9,180 | 1,330 | ||||||||||||
As liabilities | 7,491 | 1.3000 | 9,738 | (414 | ) | |||||||||||
Short-term debt derivatives not accounted for as hedges: |
|
|
|
|
|
|
|
|
|
|
|
| ||||
As assets | 1,173 | 1.2930 | 1,517 | 72 | ||||||||||||
Net mark-to-market debt derivative asset |
|
|
|
|
|
|
|
|
| 988 | ||||||
Expenditure derivatives accounted for as cash flow hedges: |
|
|
|
|
|
|
|
|
|
|
|
| ||||
As assets | 960 | 1.2500 | 1,200 | 94 | ||||||||||||
Net mark-to-market expenditure derivative asset |
|
|
|
|
|
|
|
|
| 94 | ||||||
Equity derivatives not accounted for as hedges: |
|
|
|
|
|
|
|
|
|
|
|
| ||||
As assets | – | – | 295 | 54 | ||||||||||||
Net mark-to-market equity derivative asset |
|
|
|
|
|
|
|
|
| 54 | ||||||
Net mark-to-market asset |
|
|
|
|
|
|
|
|
| 1,136 | ||||||
| As at December 31, 2021 | ||||||||||||||||
| (In millions of dollars, except exchange rates) | Notional amount (US$) | Exchange rate | Notional amount (Cdn$) | Fair (Cdn$) | ||||||||||||
Debt derivatives accounted for as cash flow hedges: |
|
|
|
|
|
|
|
|
|
|
|
| ||||
As assets | 5,859 | 1.1369 | 6,661 | 1,453 | ||||||||||||
As liabilities | 5,383 | 1.3025 | 7,011 | (343 | ) | |||||||||||
Short-term debt derivatives not accounted for as hedges: |
|
|
|
|
|
|
|
|
|
|
|
| ||||
As assets | 1,104 | 1.2578 | 1,389 | 11 | ||||||||||||
Net mark-to-market debt derivative asset |
|
|
|
|
|
|
|
|
| 1,121 | ||||||
Interest rate derivatives accounted for as cash flow hedges: |
|
|
|
|
|
|
|
|
|
|
|
| ||||
As assets (Cdn$) | – | – | 3,250 | 40 | ||||||||||||
As liabilities (Cdn$) | – | – | 500 | (6 | ) | |||||||||||
As liabilities (US$) | 2,000 | – | – | (277 | ) | |||||||||||
Net mark-to-market interest rate derivative liability |
|
|
|
|
|
|
|
|
| (243 | ) | |||||
Expenditure derivatives accounted for as cash flow hedges: |
|
|
|
|
|
|
|
|
|
|
|
| ||||
As assets | 438 | 1.2453 | 545 | 11 | ||||||||||||
As liabilities | 630 | 1.3151 | 829 | (30 | ) | |||||||||||
Net mark-to-market expenditure derivative liability |
|
|
|
|
|
|
|
|
| (19 | ) | |||||
Equity derivatives not accounted for as hedges: |
|
|
|
|
|
|
|
|
|
|
|
| ||||
As assets | – | – | 265 | 36 | ||||||||||||
Net mark-to-market asset |
|
|
|
|
|
|
|
|
| 895 | ||||||
DIVIDENDS AND SHARE INFORMATION
DIVIDENDS
Below is a summary of the dividends that have been declared and paid on RCI’s outstanding Class A Shares and Class B Non-Voting Shares.
| Declaration date | Record date | Payment date | Dividend per share (dollars) | Dividends paid (in millions of dollars) | ||||||||
January 26, 2022 | March 10, 2022 | April 1, 2022 | 0.50 | 252 | ||||||||
April 19, 2022 | June 10, 2022 | July 4, 2022 | 0.50 | 253 | ||||||||
July 26, 2022 | September 9, 2022 | October 3, 2022 | 0.50 | 253 | ||||||||
November 8, 2022 | December 9, 2022 | January 3, 2023 | 0.50 | 252 | ||||||||
January 27, 2021 | March 10, 2021 | April 1, 2021 | 0.50 | 252 | ||||||||
April 20, 2021 | June 10, 2021 | July 2, 2021 | 0.50 | 253 | ||||||||
July 20, 2021 | September 9, 2021 | October 1, 2021 | 0.50 | 253 | ||||||||
October 20, 2021 | December 10, 2021 | January 4, 2022 | 0.50 | 252 | ||||||||
54 | ROGERS COMMUNICATIONS INC. 2022 ANNUAL REPORT
On February 1, 2023, the Board declared a quarterly dividend of $0.50 per Class A Voting Share and Class B Non-Voting Share, to be paid on April 3, 2023, to shareholders of record on March 10, 2023.
We currently expect that the remaining record and payment dates for the 2023 declaration of dividends will be as follows, subject to the declaration by the Board each quarter at its sole discretion:
| Declaration date | Record date | Payment date | ||
April 25, 2023 | June 9, 2023 | July 5, 2023 | ||
June 6, 2023 | September 8, 2023 | October 2, 2023 | ||
November 8, 2023 | December 8, 2023 | January 2, 2024 | ||
OUTSTANDING COMMON SHARES
As at December 31 | ||||||||
| 2022 | 2021 | |||||||
Common shares outstanding 1 | ||||||||
Class A Voting |
| 111,152,011 |
|
| 111,153,411 |
| ||
Class B Non-Voting |
| 393,773,306 |
|
| 393,771,907 |
| ||
Total common shares |
| 504,925,317 |
|
| 504,925,318 |
| ||
Options to purchase Class B Non-Voting Shares | ||||||||
Outstanding options |
| 9,860,208 |
|
| 6,494,001 |
| ||
Outstanding options exercisable |
| 3,440,894 |
|
| 2,373,717 |
| ||
| 1 | Holders of our Class B Non-Voting Shares are entitled to receive notice of and to attend shareholder meetings; however, they are not entitled to vote at these meetings except as required by law or stipulated by stock exchanges. If an offer is made to purchase outstanding Class A Shares, there is no requirement under applicable law or our constating documents that an offer be made for the outstanding Class B Non-Voting Shares, and there is no other protection available to shareholders under our constating documents. If an offer is made to purchase both classes of shares, the offer for the Class A Shares may be made on different terms than the offer to the holders of Class B Non-Voting Shares. |
As at February 28, 2023, 111,152,011 Class A Shares, 393,773,306 Class B Non-Voting Shares, and 9,800,208 options to purchase Class B Non-Voting Shares were outstanding.
We use the weighted average number of shares outstanding to calculate earnings per share and adjusted earnings per share.
Years ended December 31 | ||||||||
(Number of shares in millions) | 2022 | 2021 | ||||||
Basic weighted average number of shares outstanding |
| 505 |
|
| 505 |
| ||
Diluted weighted average number of shares outstanding |
| 506 |
|
| 506 |
| ||
PREFERRED SHARES
In relation to our issuances of subordinated notes in December 2021 and February 2022, the Board approved the creation of new Series I and Series II preferred shares, respectively. Series I has been authorized for up to 3.3 million preferred shares and Series II has been authorized for up to 1.4 million preferred shares. Both series have no voting rights, par values of $1,000 per share, and will be issued automatically upon the occurrence of certain events involving a bankruptcy or insolvency of RCI to holders of the respective subordinated notes.
2022 ANNUAL REPORT ROGERS COMMUNICATIONS INC. | 55
MANAGEMENT’S DISCUSSION AND ANALYSIS
COMMITMENTS AND CONTRACTUAL OBLIGATIONS
CONTRACTUAL OBLIGATIONS
Below is a summary of our obligations under firm contractual arrangements as at December 31, 2022. See notes 3, 17, and 28 to our 2022 Audited Consolidated Financial Statements for more information. In addition to the below, our share of commitments relating to associates and joint ventures is $320 million.
| (In millions of dollars) | Less than 1 Year | 1-3 Years | 4-5 Years | After 5 Years | Total | |||||||||||||||
Short-term borrowings |
| 2,985 |
|
| – |
|
| – |
|
| – |
|
| 2,985 |
| |||||
Long-term debt 1,2 |
| 1,828 |
|
| 4,152 |
|
| 6,954 |
|
| 19,921 |
|
| 32,855 |
| |||||
Net interest payments |
| 1,503 |
|
| 2,639 |
|
| 2,163 |
|
| 13,345 |
|
| 19,650 |
| |||||
Lease liabilities |
| 362 |
|
| 716 |
|
| 320 |
|
| 1,218 |
|
| 2,616 |
| |||||
Debt derivative instruments 3 |
| (443 | ) |
| (88 | ) |
| (159 | ) |
| (1,220 | ) |
| (1,910 | ) | |||||
Expenditure derivative instruments 3 |
| (100 | ) |
| – |
|
| – |
|
| – |
|
| (100 | ) | |||||
Player contracts 4 |
| 170 |
|
| 183 |
|
| 119 |
|
| 33 |
|
| 505 |
| |||||
Purchase obligations 5 |
| 333 |
|
| 299 |
|
| 130 |
|
| 156 |
|
| 918 |
| |||||
Property, plant and equipment |
| 69 |
|
| 99 |
|
| 24 |
|
| – |
|
| 192 |
| |||||
Intangible assets |
| 1 |
|
| 1 |
|
| – |
|
| – |
|
| 2 |
| |||||
Program rights 6 |
| 694 |
|
| 1,199 |
|
| 421 |
|
| 346 |
|
| 2,660 |
| |||||
Other long-term liabilities |
| – |
|
| 3 |
|
| 2 |
|
| 5 |
|
| 10 |
| |||||
Total |
| 7,402 |
|
| 9,203 |
|
| 9,974 |
|
| 33,804 |
|
| 60,383 |
| |||||
| 1 | Principal obligations of long-term debt (including current portion) due at maturity. |
| 2 | Reflects repayment of the subordinated notes issued in December 2021 and February 2022 on the five-year anniversary. |
| 3 | Net (receipts) disbursements due at maturity. US dollar amounts have been translated into Canadian dollars at the Bank of Canada year-end rate. |
| 4 | Toronto Blue Jays players’ salary contracts into which we have entered and are contractually obligated to pay. |
| 5 | Contractual obligations under service, product, and wireless device contracts to which we have committed. |
| 6 | Agreements into which we have entered to acquire broadcasting rights for sports broadcasting programs and films for periods in excess of one year at contract inception. |
OFF-BALANCE SHEET ARRANGEMENTS
GUARANTEES
As a regular part of our business, we enter into agreements that provide for indemnification and guarantees to counterparties in transactions involving business sale and business combination agreements, sales of services, and purchases and development of assets. Due to the nature of these indemnifications, we are unable to make a reasonable estimate of the maximum potential amount we could be required to pay counterparties. Historically, we have not made any significant payment under these indemnifications or guarantees. See note 27 to our 2022 Audited Consolidated Financial Statements.
56 | ROGERS COMMUNICATIONS INC. 2022 ANNUAL REPORT
Environmental, Social, and Governance (ESG)
We are a national company with a strong legacy of investing in the future of Canada. We are committed to making a meaningful impact through investments to improve digital access for all Canadians, to help the next generation achieve their highest potential, to take action on climate change, to deliver for our customers, and to empower our team to give back to communities.
We are focused on growing in a socially and environmentally responsible manner through a focus on ESG. The material aspects of our environmental and social activities cover three focus areas (Environmental Leadership, People and Communications, and Responsible Management), each of which is described below.
ENVIRONMENTAL LEADERSHIP
Our strategy remains focused on reducing our environmental footprint, managing our environmental risks, and promoting environmental awareness and engagement with all our stakeholders. Through these efforts, we strive to ensure stakeholder satisfaction and maintain investor confidence.
Energy management and climate change
| • | We are focused on minimizing our impact on the climate by managing our energy and associated carbon emissions. Annually, we measure and disclose details on our energy use and greenhouse gas (GHG) emissions across our buildings and retail stores, cell transmission sites, power supply stations, data centres, fleet, employee travel and commuting, and the operations of the Toronto Blue Jays and Rogers Centre. |
| • | In December 2022, we became the first national Canadian telecommunications company to commit to a science-based net-zero GHG emissions target for 2050 as well as a near-term target to reduce emissions by 50% by 2030 with the Science Based Targets initiative, the governing body that approves private sector GHG targets to align with the Paris Agreement. We plan to meet these new commitments through a four-point plan: increase energy efficiencies across our operations, network, and data centres; transition our fleet to electric and hybrid vehicles; expand our renewable energy strategy; and engage suppliers to set their own science-based targets. |
| • | We continue to invest in energy efficiency programs to reduce energy and associated GHG emissions, including LED lighting retrofits, cooling optimization strategies across our head-ends and data centres, and modernization of our network through software features to help reduce power consumption in our radio access network sites. In 2022, we continued to identify and implement end-of-life and optimization opportunities across our head-ends and data centres, achieving greater operational savings, deferred capital upgrades, and improved space utilization. |
| • | As we transition towards a low-carbon economy, we recognize the importance of renewable energy sources. In 2022, we implemented localized renewable solar and wind power generation to supply power to several off-grid 5G cell sites. These modular renewable systems limit the runtime of diesel-fuelled generators and further reduce operational and maintenance costs. |
| • | We are committed to conducting business in an environmentally responsible manner, as reinforced through our Rogers Environmental Policy. In support of our policy, we maintain an Environmental Management System, including 25 separate procedures to set the foundation for how we manage our environmental risk, improve business efficiency, and drive environmental progress and performance. Environmental responsibilities for employees and suppliers are outlined in our Rogers Business Conduct Policy and our Supplier Code of Conduct, which is reviewed annually. |
| • | We have formal, dedicated oversight on environmental matters at the Board and management levels. We maintain a corporate governance framework to oversee energy management and climate-related risks and opportunities through our Energy Executive Council, Climate Change Steering Committee, Climate Change Core Team, Energy Operations Committee, and a management-level Energy and Sustainability Group. Having responsibility at all levels of leadership ensures accountability and effective management for climate-related issues. |
| • | Our Energy Executive Council is responsible for assessing and managing our energy transition strategy, including overseeing target setting and monitoring reduction efforts across our operations. |
| • | Our Energy Operations Committee is responsible for the implementation of our energy strategy, including execution of energy reduction efforts contributing to improved efficiencies and cost savings. |
| • | Our Climate Change Steering Committee is responsible for approving and overseeing our climate approach and supporting our executive engagement activities while our Climate Change Core Team develops our climate change strategy and implements it across our business units. In 2022, members of both were engaged to further develop our work plan for establishing recommendations towards a new GHG emissions reduction target. |
Material sourcing, efficiency, and waste management
As we transform our business for the future, we believe we have a responsibility to do more with less, while minimizing waste generation. Responsible material stewardship enables us to increase efficiency, lower our environmental impacts, and engage stakeholders in digital solutions to transition towards a more sustainable circular economy. Our waste management strategy is focused on using sustainable products, optimizing material use, and diverting waste from landfills.
Product end-of-life management
We recognize the important responsibility we have towards product stewardship in a way that contributes to a sustainable circular economy. In addition to providing sustainably sourced devices to our customers and services to elongate their lifespan, we have set an ambitious goal to recycle 100% of our electronic waste, completely diverting it from landfills. Across our office buildings, we encourage our employees to separate materials, with the goal of recycling 70% or more.
2022 ANNUAL REPORT ROGERS COMMUNICATIONS INC. | 57
MANAGEMENT’S DISCUSSION AND ANALYSIS
PEOPLE AND COMMUNITIES
The health and safety of our employees is paramount. Throughout 2022, we continued to support inclusion and diversity, working in partnership with employee-led diversity communities who are instrumental in helping foster change, including the release of our Truth and Reconciliation Commitment Statement in September 2022.
We are proud to continue investing in Canada’s youth through Ted Rogers Scholarships, Ted Rogers Community Grants, and Jays Care Foundation, which collectively reduced financial barriers to post-secondary education, helped organizations deliver critical skills programs, and made sports more accessible to thousands of young people across the country.
Safety and well-being
| • | To prevent injuries, we have a comprehensive, risk-based safety management system that includes policies, programs, training, engagement, and continuous improvement. Our Safety Executive Council, composed of senior leaders from across the company, oversees our safety strategy and performance and drives priorities across the business. Our local Workplace Health and Safety Committees are also actively engaged in supporting our safety programs. |
| • | We are focused on our employees’ well-being and we strive to support employees so they can thrive at work. Guided by our five pillars of well-being (mental, physical, social, work, and financial), we have developed a strategy that has allowed us to create programming to improve skills for people leaders, consult on employee-driven well-being initiatives, and support accessibility. We also continue promoting mental health training for people leaders to help them support themselves and employees in need. In addition, we continued holding Safe Talk sessions and business unit well-being sessions, and we launched an online platform as a central hub for well-being resources. |
| • | We aim to build a more inclusive environment that improves the employee and customer experience, including for individuals with accessibility needs. With the support of senior leadership, we have working groups to help champion accessibility across the organization, and we are focused on equipping our team members with the knowledge and tools to embed accessibility into their everyday work. We have an accessibility feedback process to gather information from our customers on how we can better interact with, support, and elevate their experience with Rogers. |
Employee engagement and talent development
| • | It is important we live our values, develop our teams, and continue to support our employees on their career journeys. Our Chief Human Resources Officer oversees talent management, while the Human Resources Committee assists the Board in monitoring, reviewing, and approving compensation and benefit policies and practices. |
| • | Our five-year inclusion and diversity (I&D) strategy, launched in 2020, focuses on embedding diversity, equity, and inclusion (DEI) into the fabric of our organization by applying a DEI lens to everything we do, from how we recruit, to how we engage with our customers. It is grounded in three pillars (people, customers, and community) to accelerate our progress and address inequalities. |
| • | For our people, we focus on embedding inclusion into the employee experience and building diversity. In 2022, we embedded I&D into objective setting and introduced a new I&D category as part of the Ted Rogers Awards program. To drive awareness and allyship, we commemorated days of significance and hosted Safe Talk sessions to support our people in response to external human rights issues. As part of building diversity, we continued to implement inclusive recruitment practices, including diverse candidate slates and partnering with organizations such as Black Professionals in Tech and Lime Connect to broaden our reach. |
Community and Indigenous collaboration
| • | Giving back and supporting the communities where we live and work continued to be a focus in 2022 and we provided $76 million in cash and in-kind donations to support various organizations and causes. |
| • | Our annual corporate matching campaign for employees in November saw $1.3 million in total donations, pledged to more than 850 charitable organizations across Canada. |
| • | We continued to invest in the next generation of young Canadians by awarding more than 350 Ted Rogers Scholarships to the Class of 2022 to support their post-secondary studies. Additionally, 70% of community scholarships were awarded to equity-deserving recipients across more than 140 Canadian communities. |
| • | Through our 2022 Ted Rogers Community Grants program, we provided funding to more than 70 organizations across Canada that deliver programs to youth in education, health and sport, digital literacy, and entrepreneurship. Recipient programs collectively support over 50,000 Canadian youth across more than 250 communities. |
| • | We made sports more accessible for Canadian youth through a $1 million donation to support Jays Care Foundation’s ambitious goal to bring youth baseball programs to over 45,000 youth across Canada, in partnership with over 100 organizations through programs like Challenger Baseball, Indigenous Rookie League, and Girls at Bat. Through a joint multi-year partnership with Tennis Canada, we also provided funding for four new covered courts (tennis bubbles) to enable year-round access to tennis for youth, communities, and future athletes in Calgary, Alberta; Markham, Ontario; Ancaster, Ontario; and Waterloo, Quebec. |
| • | We donated and launched text-to-donate campaigns to support multiple Canadian Red Cross disaster and humanitarian relief efforts in 2022, including Ukraine, Pakistan, Hurricane Fiona, and fires in Newfoundland. To support our customers, we waived long distance and SMS charges for our customers anxious to communicate with friends and family in related support efforts in a number of countries, including in Iran, and donated thousands of prepaid chatr SIM cards to provide immediate emergency connectivity for individuals arriving from Ukraine. |
| • | Through Rogers Group of Funds programs, we are proud to invest in Canadian content creation and to help amplify voices and storytelling from equity-deserving filmmakers. We joined Creative BC in launching the new Rogers Indigenous Film Fund Program, supporting Indigenous storytellers in British Columbia, and supported the second round of funding for Black and People of Colour creators through the Rogers-BSO Script Development Fund. In 2022, Rogers Group of Funds awarded |
58 | ROGERS COMMUNICATIONS INC. 2022 ANNUAL REPORT
$23 million in funding to support Canadian storytellers and content creators through the Rogers Cable Network and Documentary Funds, with a focus on supporting projects from equity-deserving creators. |
| • | We continued on our truth and reconciliation journey by releasing our Truth and Reconciliation Commitment Statement, a formal declaration of actions we will take to further the ongoing collective journey towards reconciliation and greater collaboration with Indigenous communities. Written in partnership with Indigenous leaders at Rogers, the statement commits to bridging the digital divide, creating safe spaces, recruiting Indigenous employees, and supporting the next generation of Indigenous youth through scholarships, grants, and access to sport. In honour of the National Day for Truth and Reconciliation, we renamed the Huntley Street Park at our Toronto office the “Ishkozi Park”, an Ojibwe word meaning “awake”. |
| • | We supported equity-deserving businesses through our Supplier Diversity Program and the Rogers Sports & Media All IN program, which offers free advertising and creative services to small businesses and charities. |
Human rights
| • | We share the values reflected in international proclamations about human rights, such as the Universal Declaration of Human Rights. We commit to respect and protect human rights, support the UN Guiding Principles for Business and Human Rights, and comply with Canadian human rights laws. As a member of the United Nations Global Compact, we contribute to the UN Sustainable Development Goals, which include actions we will take to address things like climate change, human rights, education, gender equality, and overall health and well-being. |
| • | Our human rights expectations for our employees and Board are defined in our Business Conduct Policy and Director Code of Conduct and Ethics. We are committed to ensuring we treat each other with respect and dignity and do not tolerate harassment or discriminatory practices. We have robust policies in place to support accessibility, diversity, inclusion, and equity. |
| • | Our Supplier Code of Conduct defines what we expect from our suppliers on ethical conduct, anti-bribery practices, and safety, environmental, and labour behaviours. This means they cannot use forced or child labour, workweeks cannot exceed the maximum set by local law, and compensation paid to workers must comply with applicable wage laws. We conduct annual Ethical Procurement Practices assessments of our supplier base to monitor performance. We also continue to support diverse suppliers to help reduce inequalities, including systemic racism and gender issues through our Supplier Diversity program, and through collaboration with non-profit organizations. |
| • | We deliver products and services to our customers without discrimination and harassment as defined in our Business Conduct Policy. We are committed to providing services that are affordable and accessible and we address customer complaints through our “Share your Concern” portal. |
| • | We provide scholarships, community grants, and access to technology to bridge the digital divide and to help ensure Canadian youth have access to quality education. We are helping to reduce inequality by focusing efforts and investments on equity-deserving communities. |
RESPONSIBLE MANAGEMENT
We aim to adhere to the highest standards of responsible management through strong policies, oversight, and systems to mitigate risk, ensure safety, and protect privacy. We put our customers first in everything we do by investing in our customer-facing teams and our networks to keep Canadians connected to what matters most. We have strict safety regulations and take steps across our entire company to be a good environmental steward. We also strive for supplier diversity across our supply chain to support equity-deserving businesses.
Data privacy and security
| • | We actively work to improve transparency and strive to be an industry leader in the privacy space. Our Privacy Policy outlines our responsibilities and practices regarding the protection of the personal information of our employees and customers. Our Chief Privacy Officer oversees our compliance with this policy and all applicable laws. |
| • | Requests received for the release of customer information from law enforcement agencies are carefully analyzed and we will only release customer information when we are satisfied it is appropriate to do so. |
Service reliability and network leadership
| • | We are focused on providing resilient networks and services. In 2022, we committed to investing $20 billion to improve network coverage and reliability over the next five years. We have begun to make progress on our action plan, including putting in place increased oversight and testing, and using predictive technologies to ensure we meet customer expectations. |
| • | In 2022, we also committed to physically separate our IP core to support our wireless and wireline traffic. |
| • | Innovation is part of our DNA whether it is bringing new products or the latest network technologies to market. In 2022, we invested $3.1 billion in capital expenditures, with much of that investment going to our wireless and wireline networks, including continuing to expand Canada’s largest 5G network as at December 31, 2022, which now reaches over 1,900 communities. |
Customer service
| • | We believe our customers expect and deserve the best service and we are committed to putting customers first in everything we do to deliver the best experience. We are proud to be the only national telecommunications provider with 100% Canada-based customer-facing teams. With a continued focus on self-serve options for our customers and investment in training and tools for our customer-facing teams, we are dedicated to exceptional service, regardless of how customers choose to interact with us. |
| • | We have programs and policies in place to manage a range of product responsibility issues. For example, we have policies in place to comply with all relevant safety regulations and codes, we have programs and teams to manage and advise on our accessibility offerings, and we operate stewardship programs to manage the proper disposal and recycling of our used products, including Rogers Trade-Up and FidoTrade. |
2022 ANNUAL REPORT ROGERS COMMUNICATIONS INC. | 59
MANAGEMENT’S DISCUSSION AND ANALYSIS
| • | In our retail stores, we commemorated days of significance including Black History Month, Pride, and National Day of Truth and Reconciliation, and reduced language barriers through our We Speak Your Language pilot. Through this pilot, employees across 40 participating stores can speak to our customers in over 100 languages. |
Digital inclusion
| • | Recognizing the power of connection for vulnerable Canadians, we extended our goodwill device and plan donation program to continue providing connectivity for those escaping violence and abuse, youth connecting to mentors, and 2SLGBTQ+ youth and allies. |
| • | We continued to bridge the digital divide through Connected for Success with 750,000 Canadians eligible for the service, including those on disability support, and through expansion into rural, remote, and Indigenous communities. |
Procurement and supplier management
| • | We strive to conduct business with socially and environmentally responsible companies that share our values. Through our competitive supplier selection process, contract management, and governance practices, we identify, mitigate, and monitor risks associated with third-party engagements. We require suppliers adhere to our Third-Party Risk Management program and we further monitor compliance through annual risk assessments. |
Net neutrality
| • | The CRTC, through the Telecommunications Act (Canada), sets the regulatory framework for Internet traffic management practices. This framework supports free and open access to information on our networks. We are a firm proponent of net neutrality and comply with the policy and requirements set by the CRTC in ensuring open Internet access for our customers. We also acknowledge that we have a role to play in addressing illegal, infringing, and harmful content online. We believe sanctioned measures to address this behaviour are an essential and consistent aspect of net neutrality principles. |
ESG governance and business ethics
| • | We strive to offer innovative solutions for customers, create diverse and well-paying jobs, support small businesses, pay taxes to all levels of government, and deliver dividends to shareholders. In 2022, we directly contributed $15 billion to the Canadian economy and, as at December 31, 2022, employed 22,000 team members across the country. Beyond these direct economic impacts, our performance produces indirect economic benefits, including locally procured goods and services and significant charitable donations. |
See our 2021 ESG report on our website (about.rogers.com/our-impact) for more information about our social, environmental, and governance performance. We expect to release our 2022 ESG report in the coming months.
Rogers is a family-founded, family-controlled company and we take pride in our proactive and disciplined approach to ensuring that our governance structure and practices instill confidence in our shareholders.
Voting control of Rogers Communications Inc. is held by the Rogers Control Trust (the Trust), the beneficiaries of which are members of the Rogers family. The Trust holds voting control of RCI for the benefit of successive generations of the Rogers family via the Trust’s ownership of 98% of the outstanding Class A Shares of RCI (2021 – 98%). The Rogers family are substantial stakeholders and owned approximately 29% of our equity as at December 31, 2022 (2021 – 29%) through its ownership of a combined total of 147 million (2021 – 147 million) Class A Shares and Class B Non-Voting Shares. As a result, the Trust is able to elect all members of the Board and to control the vote on most matters submitted to shareholders, whether through a shareholder meeting or a written consent resolution.
The Board is currently made up of thirteen directors who bring a rich mix of experience as business leaders in North America. Each of our directors is firmly committed to effective governance, strong oversight, and the ongoing creation of shareholder value. The Board as a whole is committed to sound corporate governance and continually reviews its governance practices and benchmarks them against acknowledged leaders and evolving legislation. The Board believes that Rogers’ governance system is effective and that there are appropriate structures and procedures in place.
GOVERNANCE BEST PRACTICES
We have adopted many best practices for effective governance, including:
| • | separation of the CEO and Chair roles; |
| • | an independent lead director; |
| • | formal corporate governance policies and charters; |
| • | a code of business conduct and whistleblower hotline; |
| • | director share ownership requirements; |
| • | Board and committee in camera discussions; |
| • | annual reviews of Board and Committee performance; |
| • | Audit and Risk Committee meetings with internal and external auditors; |
| • | an orientation program for new directors; |
| • | regular Board and committee education sessions; |
| • | committee authority to retain independent advisors; and |
| • | director material relationship standards. |
The Board now consists of 8 independent directors and 5 non-independent directors.
We comply with all relevant corporate governance guidelines and standards as a Canadian public company listed on the TSX and as a foreign private issuer listed on the NYSE in the US.
60 | ROGERS COMMUNICATIONS INC. 2022 ANNUAL REPORT
BOARD OVERSIGHT
The Board delegates certain responsibilities to its eight standing committees to ensure proper oversight and accountability:
| • | Audit and Risk Committee – reviews our accounting policies and practices, the integrity of our financial reporting processes and procedures, and the financial statements and other relevant disclosure for release to shareholders and the public. It assists the Board in its oversight of our compliance with legal and regulatory requirements for financial reporting, assesses our accounting and financial control systems, and evaluates the qualifications, independence, and work of our internal and external auditors. It also reviews risk management policies and associated processes used to manage major risk exposures. |
| • | Corporate Governance Committee – assists the Board to ensure it has appropriate systems and procedures for carrying out its responsibilities. This committee develops governance policies and practices, recommends them to the Board for approval, and leads the Board in its periodic review of Board and committee performance. |
| • | Nominating Committee – identifies prospective candidates to serve on the Board. Nominated directors can be elected by shareholders at a meeting, appointed by the Board, or appointed by written consent resolution. The committee also recommends nominees for each Board committee, including each committee chair. |
| • | Human Resources Committee – assists the Board in monitoring, reviewing, and approving compensation and benefit policies and practices. It is also responsible for recommending the |
compensation of senior management and monitoring senior executive succession planning. |
| • | ESG Committee – assists the Board in fulfilling its oversight responsibilities of relevant environmental sustainability, social responsibility, and governance policies, strategies, and programs and the actions we can take to be a responsible corporate citizen. |
| • | Executive Committee – assists the Board in discharging its responsibilities between meetings, including acting in such areas as are specifically designated and authorized at a preceding Board meeting to consider matters that may arise from time to time. |
| • | Finance Committee – reviews our investment strategies, general debt, and equity structure and reports on them to the Board. |
| • | Pension Committee – oversees the administration of our retiree pension plans and reviews the investment performance and provisions of the plans. |
You can find more details about governance at Rogers on our Investor Relations website (investors.rogers.com), including:
| • | a complete statement of our corporate governance practices; |
| • | our codes of conduct and ethics; |
| • | charters for each of the Board’s standing committees; |
| • | director biographies; and |
| • | a summary of the differences between the NYSE corporate governance rules that apply to US-based companies and our governance practices as a non-US-based issuer listed on the NYSE. |
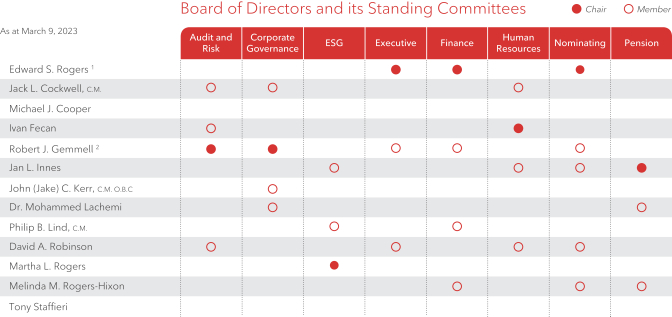
| 1 | Chair of the Board |
| 2 | Lead Director |
2022 ANNUAL REPORT ROGERS COMMUNICATIONS INC. | 61
MANAGEMENT’S DISCUSSION AND ANALYSIS
INCOME TAX AND OTHER GOVERNMENT PAYMENTS
We proactively manage our tax affairs to enhance our business decisions and optimize after-tax free cash flow available for investment in our business and shareholder returns. We have comprehensive policies and procedures to ensure we are compliant with all tax laws and reporting requirements, including filing and making all income and sales tax returns and payments on a timely basis. As a part of this process, we pursue open and cooperative relationships with revenue authorities to minimize audit effort and reduce tax uncertainty. We also engage with government policy makers on taxation matters that affect Rogers and its shareholders, employees, customers, and other stakeholders.
INCOME TAX PAYMENTS
Our total income tax expense of $609 million in 2022 is close to the expense computed on our accounting income at the statutory rate of 26.5%. Cash income tax payments totaled $455 million in 2022. The primary reasons our cash income tax is lower than our income tax expense are the timing of installment payments and the significant capital investment we continue to make in our wireless and cable networks throughout Canada. Similar to tax systems throughout the world, Canadian tax laws permit investments in such productivity-enhancing assets to be deducted for tax purposes more quickly than they are depreciated for financial statement purposes.
OTHER GOVERNMENT PAYMENTS
In addition to paying income tax on the profits we earn, we contribute significantly to Canadians by paying taxes and fees to federal, provincial, and municipal governments, including:
| • | various taxes on the salaries and wages we pay (payroll taxes) to approximately 22,000 employees; |
| • | property and business taxes; |
| • | unrecoverable sales taxes and custom duties; and |
| • | broadcast, spectrum, and other regulatory fees. |
As outlined in the table below, the total cost to Rogers of these payments in 2022 was $1,333 million.
Years ended December 31 | ||||||||
(In millions of dollars) | 2022 | 2021 | ||||||
Income taxes paid |
| 455 |
|
| 700 |
| ||
Add: | ||||||||
Unrecoverable sales taxes paid |
| 15 |
|
| 9 |
| ||
Payroll taxes paid |
| 145 |
|
| 135 |
| ||
Regulatory and spectrum fees paid 1 |
| 670 |
|
| 490 |
| ||
Property and business taxes paid |
| 48 |
|
| 50 |
| ||
Taxes paid and other government payments 2
|
| 1,333
|
|
| 1,384
|
| ||
| 1 | Includes an allocation of $418 million (2021 – $252 million) relating to the $3.3 billion, $24 million, $1.7 billion, and $3.3 billion we paid for the acquisition of spectrum licences in 2014, 2015, 2019, and 2021, respectively. |
| 2 | Taxes paid and other government payments is a non-GAAP financial measure. This is not a standardized financial measure under IFRS and might not be comparable to similar financial measures disclosed by other companies. See “Non-GAAP and Other Financial Measures” for more information about this measure. |
We also collected on behalf of the government $2,059 million in sales taxes on our products and services and $720 million in employee payroll taxes.
62 | ROGERS COMMUNICATIONS INC. 2022 ANNUAL REPORT
We strive to continually strengthen our risk management capabilities to protect and enhance shareholder value. The purpose of risk management is not to eliminate risk but to optimize trade-offs between risk and return to maximize value to the organization. As such, Rogers will knowingly take certain risks in order to generate earnings and encourage innovation that advance us as a customer-centric market leader. To maintain our reputation and trust, we will always work to ensure the impacts (financial, operational, strategic, regulatory, privacy, and cybersecurity) of our risk-taking activities are understood and are in line with our strategic objectives and company values.
RISK GOVERNANCE
The Board has overall responsibility for risk governance and oversees management in identifying the key risks we face in our business and implementing appropriate risk assessment processes to manage these risks. It delegates certain risk oversight and management duties to the Audit and Risk Committee.
The Audit and Risk Committee discusses risk policies with management and the Board and assists the Board in overseeing our compliance with legal and regulatory requirements.
The Audit and Risk Committee also reviews:
| • | the adequacy of the internal controls that have been adopted to safeguard assets from loss and unauthorized use, to prevent, deter, and detect fraud, and to ensure the accuracy of the financial records; |
| • | the processes for identifying, assessing, and managing risks; |
| • | our exposure to major risks and trends and management’s implementation of risk policies and actions to monitor and control these exposures, including cybersecurity, privacy, technology, and environmental; |
| • | the implementation of new major systems and changes to existing major systems; |
| • | our business continuity and disaster recovery plans; |
| • | any special audit steps adopted due to material weaknesses or significant deficiencies that may be identified; and |
| • | other risk management matters from time to time as determined by the Audit and Risk Committee or directed by the Board. |
ENTERPRISE RISK MANAGEMENT
Our Enterprise Risk Management (ERM) program uses the “3 Lines of Defence” framework to identify, assess, manage, monitor, and communicate risks. Our business units and departments, led by the Executive Leadership Team, are the first line of defence and are accountable for managing or accepting the risks. Together, they identify and assess key risks, define controls and action plans to minimize these risks, and enhance our ability to meet our business objectives.
ERM is the second line of defence. ERM helps management identify the key and emerging risks in meeting our corporate and business unit objectives in line with our risk appetite. At the business unit and department level, ERM works with management to provide governance and advice in managing the key risks and associated controls to mitigate these risks. Business Continuity is a function within ERM which also assists the business in mitigating key risks. Specifically, the Business Continuity function oversees
incident management and planning to maintain customer service, operation of our network and businesses in the event of threats and natural disasters. Such threats include cyberattacks or equipment failures that could cause various degrees of network outages; supply chain disruptions; natural disaster threats; epidemics; pandemics; and political instability. Our ERM program also includes insurance coverage allowing us to transfer certain risks. Lastly, ERM works with Internal Audit to monitor the adequacy and effectiveness of controls to reduce risks to an acceptable level.
Annually, ERM carries out a corporate risk assessment. The assessment includes reviewing risk and audit reports and industry benchmarks and, conducting an annual risk survey of all senior leaders. Based on the survey results, ERM, in consultation with senior management, identifies the key risks to achieving our corporate objectives. ERM reports the results of the annual corporate risk assessment to the Executive Leadership Team, the Audit and Risk Committee, and the Board and provides quarterly risk updates.
ERM also facilitates management’s completion of the financial statement fraud risk assessment which aims to ensure there is no potential fraud or misstatement in our financial statements and disclosures and to assess whether controls are adequately designed and operating effectively to mitigate financial statement fraud risk.
Internal Audit is the third line of defence. Internal Audit is an independent and objective assurance function that evaluates the design and operational effectiveness of internal controls and risk management processes supporting the mitigation of risks that may affect the achievement of our objectives.
The Executive Leadership Team and the Audit and Risk Committee are responsible for approving our enterprise risk policies. Our ERM methodology and policies rely on the expertise of our management and employees to identify risks and opportunities and implement risk mitigation strategies as required.
RISKS AND UNCERTAINTIES AFFECTING OUR BUSINESS
This section describes the principal risks and uncertainties that could have a material adverse effect on our business and financial results. Any discussion about risks should be read in conjunction with “About Forward-Looking Information”.
SHAW TRANSACTION
The Shaw Transaction with Shaw, and the proposed Freedom Transaction, is subject to a number of risks, many of which are outside the control of Rogers, Shaw, and Quebecor, as applicable. These are described below.
Key Regulatory Approvals and other conditions
To complete the Shaw Transaction and the Freedom Transaction, each of Rogers and Shaw have made certain filings with, and either have obtained or must obtain certain consents and approvals from, various governmental and regulatory authorities, including the Competition Bureau and ISED Canada. Rogers and Shaw have not
2022 ANNUAL REPORT ROGERS COMMUNICATIONS INC. | 63
MANAGEMENT’S DISCUSSION AND ANALYSIS
yet obtained the Key Regulatory Approvals, each of which is required to complete the Shaw Transaction. Specifically, the remaining approval relates to the transfer or deemed transfer of specific assets, including spectrum licences, from Freedom to Quebecor, the approval for which could impose material conditions relating to the Shaw Transaction, the Freedom Transaction, or any such transfer. If the Key Regulatory Approvals are not obtained, or any applicable law or order is in effect which makes the consummation of the Shaw Transaction illegal, the Shaw Transaction will not be completed.
In addition, further delays in obtaining the Key Regulatory Approvals could result in the Shaw Transaction not being completed. In particular, if the Shaw Transaction is not completed by March 31, 2023, either Rogers or Shaw may terminate the arrangement agreement, in which case the Shaw Transaction will not be completed. Rogers, Shaw, and the Shaw Family Living Trust have extended the outside date for closing the Shaw Transaction to March 31, 2023 (with the consent of Quebecor) in accordance with the terms of the arrangement agreement.
Under certain circumstances, if the Key Regulatory Approvals are not obtained, or any law or order relating to the Key Regulatory Approvals or the Competition Act is in effect that would make the consummation of the Shaw Transaction illegal, and the failure to obtain the Key Regulatory Approvals is not caused by, and is not a result of, the failure by Shaw to perform in all material respects any of its covenants or agreements under the arrangement agreement, we would be obligated to pay a $1.2 billion reverse termination fee to Shaw (see “Termination of the arrangement agreement, costs, and termination fee” below). We would also be responsible to reimburse Shaw for certain costs relating to the May 2021 exercise of our right to require Shaw to redeem its issued and outstanding preferred shares.
The completion of the Shaw Transaction is subject to a number of other conditions precedent, some of which are outside of the control of Rogers and Shaw, including there not having occurred a Material Adverse Effect or Purchaser Material Adverse Effect (as such terms are defined in the arrangement agreement) and the satisfaction of certain other customary closing conditions.
There can be no certainty, nor can Rogers or Shaw provide any assurance, that all conditions precedent to the Shaw Transaction will be satisfied or waived, nor can there be any certainty of the timing of their satisfaction or waiver.
Termination of the arrangement agreement, costs, and termination fee
The arrangement agreement may be terminated by Rogers or Shaw in certain circumstances, in which case the Shaw Transaction will not be completed. Accordingly, there is no certainty, nor can we provide any assurance, that the arrangement agreement will not be terminated by us or Shaw prior to completion of the Shaw Transaction.
We must pay certain costs relating to the Shaw Transaction, such as legal, accounting, tax, and financing-related fees, even if the Shaw Transaction is not completed, which may be significant. In addition, if the Shaw Transaction is not completed for certain reasons, we may be required to pay a reverse termination fee of $1.2 billion to Shaw and certain costs relating to the May 2021 exercise of our right to require Shaw to redeem its issued and outstanding
preferred shares, the result of which could have a material adverse effect on our business, results of operations, financial position, and our ability to fund growth prospects and current operations.
If the Shaw Transaction is not completed or is delayed, our share price and future business and financial results could be negatively affected. Any non-completion or delay of the Shaw Transaction may also negatively impact the relationships we have with our employees (including a potential lack of focus on our business), suppliers, vendors, distributors, retailers, dealers, or customers, including that such groups could cease doing business with us or curtail their activities with us.
Potential credit rating consequences
In addition to the Shaw senior note financing issued in March 2022 and assuming approximately $6 billion of existing Shaw debt, we expect to issue up to an additional $6 billion in new debt to finance the Shaw Transaction. As a result, we anticipate the combined company will have over $40 billion of consolidated debt upon closing. The increased level of debt could decrease our flexibility in responding to changing business and economic conditions, increase our interest expense, and potentially make it more difficult to obtain additional financing or refinance existing financing. The increase in our debt service obligations could adversely affect our results, financial condition, and our ability to fund growth prospects and could reduce our funds available for other business purposes.
Additionally, as a result of the significant increase in outstanding debt, there is a risk our credit ratings could be adversely affected, including the potential for a downgrade below investment-grade. A downgrade in our credit ratings could result in difficulty issuing debt in the future or higher borrowing costs and may otherwise affect our share price. If Shaw’s existing senior notes are subject to a downgrade below investment-grade constituting a “change of control trigger event” (as defined in Shaw’s senior note indenture), Shaw would be required to offer to purchase its senior notes at 101% of their principal amount plus accrued interest following closing of the Shaw Transaction, potentially having an adverse impact on the combined company’s financial condition.
Expected synergies and integration
Achieving the anticipated benefits of the Shaw Transaction depends on our ability to consolidate and integrate Shaw’s businesses, operations, and workforce in a manner that facilitates growth opportunities and achieves the projected cost savings and revenue growth without adversely affecting the combined company’s current operations. Even if we successfully integrate Shaw’s businesses, the anticipated benefits of the Shaw Transaction may not be fully realized or they could take longer to realize than expected.
In addition to the day-to-day operations of Rogers, management will need to focus on the Shaw Transaction and all related activities, including integration. If completion of the Shaw Transaction is delayed, there could be adverse effects on our business, results of operations, or financial condition.
Shaw actions prior to closing
The arrangement agreement restricts Shaw from taking certain actions outside of the ordinary course of business while the Shaw Transaction is pending, including, among other things, certain acquisitions or dispositions of businesses and assets, entering into
64 | ROGERS COMMUNICATIONS INC. 2022 ANNUAL REPORT
or amending certain contracts, repurchasing or issuing securities, making significant capital expenditures, and incurring indebtedness, in each case subject to certain exceptions. As a result of these restrictions, Shaw may not have the flexibility to appropriately respond to certain events, which may result in us recognizing lower-than-expected synergies once the Shaw Transaction closes.
CYBERSECURITY
Our industry is vulnerable to cybersecurity risks that are growing in both frequency and complexity. Rogers, along with our suppliers, employs systems and network infrastructure that are subject to cyberattacks, which may include theft of assets, unauthorized access to proprietary or sensitive information, destruction or corruption of data, ransomware attacks, or operational disruption. A significant cyberattack against our, or our suppliers’, critical network infrastructure and supporting information systems could result in service disruptions, litigation, loss of customers, incurring significant costs, and/or reputational damage.
Management has committed to an information and cybersecurity program designed to reinforce the importance of remaining a secure, vigilant, and resilient organization. Our ongoing success depends on protecting our sensitive data, including personal information about our customers and employees. We rely on security awareness training, policies, procedures, and IT systems to protect this information. Success also depends on Rogers continuing to monitor these risks, leveraging external threat intelligence, internal monitoring, reviewing best practices, and implementing controls as required to mitigate them. We have insurance coverage against certain damages related to cybersecurity breaches, intrusions, and attacks, amongst other things.
External threats to the network and our business generally are constantly changing and there is no assurance we will be able to protect the network from all future threats. The impact of such attacks may affect our customer service or our financial results.
PRIVACY
In the evolving digital world, privacy and the ways in which organizations handle personal information are becoming increasing priorities for consumers. Ensuring appropriate governance over this data has become even more critical. As the move to digital transactions accelerated over the past several years, companies continued to gain greater amounts of data on customers and employees. The nature of the products and services we offer our customers means we are entrusted with a significant amount of personal information. This means that ensuring there are appropriate safeguards and privacy protections in place is a priority for us. We are the stewards of this data and this responsibility is of the utmost importance to us. If a privacy breach were to occur and personal information was made public, there could be a material adverse effect on our reputation and our business.
TECHNOLOGY
New technologies
Our network plans assume the availability of new technology for both wireless and wireline networks, including 5G technology in the wireless industry and future DOCSIS enhancements and
evolutions in the wireline industry. While we work with industry standards bodies and our vendors to ensure timely delivery of new technology, there are no assurances these technologies will be available as and when required.
As new technologies become available, we expect a substantial portion of our future revenue growth may come from new and advanced services, and companies such as Rogers will need to continue to invest significant capital resources to develop our networks and implement in an agile framework to meet customers and business timelines. It is possible, however, that there may not be sufficient consumer demand, or that we may not anticipate or satisfy demand for certain products and services or be able to offer or market these new products and services successfully to subscribers. If we do not attract subscribers to new products and services profitably or keep pace with changing consumer preferences, we could experience slower revenue growth and increased churn. This could have a material adverse effect on our business, results of operations, and financial condition.
Several technologies have affected the way our services are delivered, including:
| • | broadband; |
| • | IP-based voice, data, and video delivery services; |
| • | increased use of optical fibre technologies to businesses and residences; |
| • | broadband wireless access and wireless services using a radio frequency spectrum to which we may have limited or no access; and |
| • | applications and services using cloud-based technology, independent of carrier or physical connectivity. |
These technologies may also lead to significantly different cost structures for users and therefore affect the long-term viability of some of our current technologies. Some of these technologies have allowed competitors to enter our markets with similar products or services at lower costs. These competitors may also be larger and/or have greater access to financial resources. Additional competitors with advances in technology, such as high-speed Internet service from low Earth orbit satellite operators like Starlink, have entered the Canadian market and could potentially have a material adverse impact on our operations and results.
The continued emergence and growth of subscriber-based satellite and digital radio products could affect AM and FM radio audience listening habits and have a negative effect on the results of our radio stations. Certain audiences are also migrating away from traditional broadcast platforms to the Internet as more video and audio content streaming becomes available.
Reliance on technology
Our technologies, processes, and systems are operationally complex and increasingly interconnected. Further, our businesses depend on IT systems for day-to-day operations and critical elements of our network infrastructure and IT systems are concentrated in various physical facilities. If we are unable to operate our systems, make enhancements to accommodate customer growth and new products and services, or if our systems experience disruptions or failures, it could have an adverse effect on our ability to acquire new subscribers, service customers, manage subscriber churn, produce accurate and timely subscriber invoices, generate revenue growth, and manage operating expenses. This could have an adverse impact on our results and financial position.
2022 ANNUAL REPORT ROGERS COMMUNICATIONS INC. | 65
MANAGEMENT’S DISCUSSION AND ANALYSIS
Impact of failures on customer service
Customers have high expectations of reliable and consistent performance of our networks. Failure to maintain high service levels and to effectively manage network traffic could have an impact on the customer experience, potentially resulting in an increase in customer churn. Due to the increased demand and traffic on our networks, there could be capacity and congestion pressures. If our networks or key network components fail, it could, in some circumstances, result in a loss of service for our customers for certain periods and have an adverse effect on our results and our financial position.
We work to protect our networks and our service from the impact of natural disasters and major weather events such as ice storms, wind storms, forest fires, flooding, earthquakes, or landslides where it is necessary and feasible to do so. There are no assurances that a future event will not cause service outages and that such outages would not affect our results. Service disruptions or outages could also affect our operations if not quickly resolved, potentially causing a risk of billing delays or errors. If we fail to have appropriate response strategies and protocols in place to handle service outages in the face of these types of events, they could have an impact on our revenue and our customer experience. Recovering from these disasters could require significant resources and remediation costs, which are difficult to estimate.
COMPETITIVE INTENSITY
Competitive behaviour and market dynamics are continuously changing in our fast-paced industry. There is no assurance that our current or future competitors will not provide services that are superior to ours or at lower prices, adapt more quickly to evolving industry trends or changing market requirements, enter markets in which we operate, or introduce competing services. The federal government also continues to promote competition and affordability, and is committed to universal high-speed Internet for every Canadian by 2030. Any of these factors could increase churn or reduce our business market share or revenue.
The strategic offering of unlimited wireless plans continues to offer greater value to our customers and has helped us take a significant step towards simplifying our products and services. However, depending on economic conditions and the response from our competitors and/or current and potential customers, we may need to extend lower wireless pricing offers to attract new customers and retain existing subscribers. As wireless penetration of the population deepens, new wireless customers may generate lower average monthly revenue, which could slow revenue growth.
Global technology giants continue to ramp up content spending into new markets such as sports media, resulting in increased competition for our Media and Cable segments. This may result in an increase in subscriber churn as customers now have additional choices of supplementary sources of media content.
Competition is increasing for content programming rights from both traditional linear television broadcasters and online competitors. Online providers have moved towards self-made, self-hosted exclusive content, and are aggressively competing for rights such that traditional broadcasters may not gain access to desirable
programming. Overall increased competition for content could increase costs of programming rights. As broadcasters and distributors sign longer-term agreements to secure programming rights, this could affect the availability of desirable programming rights and result in lower revenue due to a lack of access to these rights. Lower revenue in turn could adversely affect the operating results of our business if we are unable to recover programming investments through advertising revenue and subscription fee increases that reflect the market.
In addition, the CRTC Broadcasting Distribution Regulations do not allow cable operators to obtain exclusive contracts in buildings where it is technically feasible to install two or more transmission systems.
Continued deployments of fibre networks by competitors may lead to an increase in the reach, speed, and stability of their wireline-related services. This could result in an increase in churn pertaining to our wireline business segment services.
Improvements in the quality of streaming video over the Internet, coupled with increasing availability of television shows and movies online through OTT content providers, has resulted in competition for viewership and increased competition for Canadian cable television service providers. As a result, we have noticed an increase in cord cutting and cord shaving as consumers continue to withdraw from traditional cable services. If advances in technology are made to any alternative Canadian multi-channel broadcasting distribution system, our cable services may face increased competition. In addition, as the technology for wireless Internet continues to develop, it is, in some instances, replacing traditional wireline Internet.
REGULATORY RISKS
Changes in government regulations
Substantially all of our business activities are regulated by ISED Canada and/or the CRTC. Any regulatory changes or decisions could adversely affect our consolidated results of operations. The most significant outstanding regulatory proceedings to our business are various appeals related to the wholesale Internet costing and pricing regime (see “Regulation in our Industry” and “Litigation Risks”).
Regulatory changes or decisions made by these regulators could adversely impact our results on a consolidated basis. This regulation relates to, among other things, licensing and related fees, competition, the cable television programming services we must distribute, wireless and wireline interconnection agreements, the rates we may charge to provide access to our networks by third parties, the resale of our networks and roaming on our networks, our operation and ownership of communications systems, and our ability to acquire an interest in other communications systems. In addition, the costs of providing services may be increased from time to time as a result of compliance with industry or legislative initiatives to address consumer protection concerns or such Internet-related issues as copyright infringement, unsolicited commercial e-mail, cybercrime, and lawful access.
Generally, our licences are granted for a specified term and are subject to conditions on the maintenance of these licences. These licensing conditions and related fees may be modified at any time by the regulators. The regulators may decide not to renew a licence when it expires, and any failure by us to comply with the conditions
66 | ROGERS COMMUNICATIONS INC. 2022 ANNUAL REPORT
on the maintenance of a licence could result in a revocation or forfeiture of any of our licences or the imposition of fines. Our cable, wireless, and broadcasting licences generally may not be transferred without regulatory approval.
The licences include conditions requiring us to comply with Canadian ownership restrictions of the applicable legislation. We are currently in compliance with all of these Canadian ownership and control requirements. If these requirements were violated, we would be subject to various penalties, possibly including, in the extreme case, the loss of a licence.
Spectrum
Radio spectrum is one of the fundamental assets required to carry on our Wireless business. Our ability to continue to offer and improve current services and to offer new services depends on, among other factors, continued access to, and deployment of, adequate spectrum, including the ability to both renew current spectrum licences and acquire new spectrum licences.
If we cannot acquire and retain needed spectrum, whether due to the government providing favourable spectrum auctions for regional carriers through set asides and lower rates, through increased costs for us to purchase spectrum licences at auction, or otherwise, we may not be able to continue to offer and improve our current services and deploy new services on a timely basis, including providing competitive data speeds our customers want. As a result, our ability to attract and retain customers could be adversely affected. In addition, an inability to acquire and retain needed spectrum could affect network quality and result in higher capital expenditures.
Changes to government spectrum fees could significantly increase our payments and therefore materially reduce our net income.
Radio frequency emissions
From time to time, media and other reports have highlighted alleged links between radio frequency emissions from wireless devices (including new 5G technology) and various health concerns, including cancer, and interference with various medical devices, including hearing aids and pacemakers. This may discourage the use of wireless devices or expose us to potential litigation even though there are no definitive reports or studies stating that these health issues are directly attributable to radio frequency emissions. Future regulatory actions may result in more restrictive standards on radio frequency emissions from low-powered devices like wireless devices. We cannot predict the nature or extent of any restrictions.
Obtaining access to support structures and municipal rights of way
To build and support the rollout of 5G, and to continue upgrading our cable network, we must continue to have access to support structures and municipal rights of way to install equipment on municipal poles and buildings, and on First Nations land. We can apply to the CRTC to obtain a right of access under the Telecommunications Act in areas where we cannot secure access to municipal rights of way. Failure to obtain access could increase our costs and adversely affect our business.
The Supreme Court of Canada ruled in 2003, however, that the CRTC does not have the jurisdiction to establish the terms and conditions of accessing the poles of provincial power utility companies. As a result, we normally obtain access under terms established by the provincial utility boards.
On October 30, 2020, the CRTC launched Telecom Notice of Consultation 2020-366 regarding potential regulatory measures to make access to poles owned by Canadian carriers more efficient. The CRTC expressed concerns that untimely and costly access to poles owned by Canadian carriers has negative impacts on the deployment of efficient broadband-capable networks, particularly in areas of Canada with limited or no access to such networks. Therefore, the CRTC initiated a proceeding to identify and implement regulatory measures that will make access to such poles more efficient. We actively participated in the process and are awaiting a decision from the CRTC.
On December 10, 2021, a regulation was filed under Part VI.1 of the Ontario Energy Board Act, O. Reg. 842/21 requiring the Ontario Energy Board (OEB) to establish a generic, province-wide pole attachment charge for 2022. The Regulation further requires the OEB to set the charge for 2023 and subsequent years by adjusting the prior year’s charge for inflation, resulting in the calculation of the charge becoming a mechanistic exercise. On December 16, 2021, the OEB published Decision and Order EB-2021-0302, Wireline Pole Attachment Charge. The OEB calculated the charge for 2022 at $34.76 per attacher per year per pole, in accordance with the directions set out in O. Reg. 842/21. The 2021 charge was $44.50. This charge applies to every distributor that is required as a condition of licence to provide access to telecom attachments and to charge the amount approved by the OEB.
CUSTOMER EXPERIENCE
Our customers’ loyalty and their likelihood to recommend Rogers are both dependent upon our ability to provide a service experience that meets or exceeds their expectations. We handle many customer interactions annually, ranging from potential new customers making in-store and online purchases to existing customers calling for technical support and everything in between. We understand that every time a customer uses one of our services, such as making a call or browsing the Internet on their wireless device, watching their favourite show using their Internet or television services, or listening to one of our radio stations, their experience affects all future interactions with any Rogers brand. If our products do not deliver the usage experience our customers expect from us, and if we do not have clear, simple, and fair interactions with our customers, it could cause confusion and frustrate our customers. This could result in lost sales opportunities and increased churn, both of which could have negative effects on our reputation, results of operations, and financial condition.
RESULTS PERFORMANCE
We strive to drive profitable growth in all markets we serve. This means we will focus on core growth drivers in each of our businesses, including increasing subscribers and reducing churn, expanding products in our enterprise business, and returning Media to growth. At the same time, our goal is to continue to develop strong capabilities in cost management to support investments that will fuel our future. If we are not successful in
2022 ANNUAL REPORT ROGERS COMMUNICATIONS INC. | 67
MANAGEMENT’S DISCUSSION AND ANALYSIS
achieving these goals, as a result of economic conditions or the competitive landscape, this could negatively impact confidence with investors and external stakeholders, and ultimately our stock price.
TALENT ACQUISITION AND RETENTION
A significant transformation is underway in our industry, and as competition for talent increases, our success is highly dependent on our ability to attract and retain a high-performing, diverse, and engaged workforce, including in key growth areas, such as the network, IT, and digital fields. Our focus must be on providing career and development opportunities, competitive compensation and benefits, fostering an inclusive and diverse workplace, and a great employee experience. Failure to maintain and achieve this focus, and changes to our workforce as a result of factors such as turnover and restructuring, failing to develop internal succession, cost reduction initiatives, ongoing union negotiations, or other events, could have an adverse effect on the customer experience, and as a result our revenue and profitability.
RELIANCE ON SUPPLY CHAIN AND THIRD PARTIES
We have outsourcing, managed service, and supplier arrangements with third parties to provide certain essential components of our business operations to our employees and customers. These include, but are not limited to, certain critical infrastructure components and devices; facilities or property management functions; contact centre support; installation and service technicians; network sharing arrangements; network and IT functions; and invoice printing. Some of these essential suppliers are relatively small in number and we have limited operational or financial control over them. If interruptions in these services or at these suppliers occur, including due to the ongoing global supply chain issues, it could adversely affect our ability to service our customers. Additionally, in the course of fulfilling service arrangements, third-party service providers must ensure our information is appropriately protected and safeguarded. Failure to do so may affect Rogers through increased regulatory risk, reputational damage, and damage to the customer experience.
FINANCIAL RISKS
Capital commitments, liquidity, debt, and interest payments
Our capital commitments and financing obligations could have important consequences, including:
| • | requiring us to dedicate a substantial portion of cash provided by operating activities to pay interest, principal amounts, and dividends, which reduces funds available for other business purposes, including other financial operations; |
| • | making us more vulnerable to adverse economic and industry conditions; |
| • | limiting our flexibility in planning for, and reacting to, changes in our business and industry; |
| • | putting us at a competitive disadvantage compared to competitors who may have more financial resources and/or less financial leverage; or |
| • | restricting our ability to obtain additional financing to fund working capital and capital expenditures and for other general corporate purposes. |
Our ability to satisfy our financial obligations depends on our future operating performance and on economic, financial, competitive,
and other factors, many of which are beyond our control. Our business may not generate sufficient cash flow in the future and financings may not be available to provide sufficient net proceeds to meet our obligations or to successfully execute our business strategy.
Credit ratings
Credit ratings provide an independent measure of credit quality of a securities issuer and can affect our ability to obtain short- and long-term financing and the terms of the financing. If rating agencies lower the credit ratings on our debt, particularly a downgrade below investment-grade, it could adversely affect our cost of financing and access to liquidity and capital.
Capital markets
External capital market conditions could affect our ability to make strategic investments and meet ongoing capital funding requirements. Risk factors include a reduction in lending activity, disruptions in capital markets, and regulatory requirements for an increase in bank capitalization, which could either reduce the availability, or increase the cost of capital.
Income taxes and other taxes
We collect, pay, and accrue significant amounts of income and other taxes, such as federal and provincial sales, employment, and property taxes.
We have recorded significant amounts of deferred and current income tax liabilities and expense, and calculated these amounts based on substantively enacted income tax rates in effect at the relevant time. A legislative change in these rates could have a material effect on the amounts recorded and payable in the future.
We provide for income and other taxes based on all currently available information and believe that we have adequately provided for these items. The calculation of applicable taxes in many cases, however, requires significant judgment in interpreting tax rules and regulations. Our tax filings are subject to audits, which could materially change the amount of current and deferred income tax assets, liabilities, and expense, and could, in certain circumstances, result in the assessment of interest and penalties.
While we believe we have paid and provided for adequate amounts of tax, our business is complex and significant judgment is required in interpreting how tax legislation and regulations apply to us.
OTHER RISKS
Economic conditions
Our businesses are affected by general economic conditions and consumer confidence and spending. Recessions, declines in economic activity, and economic uncertainty can erode consumer and business confidence and reduce discretionary spending. Any of these factors can negatively affect us through reduced advertising, lower demand for our products and services, decreased revenue and profitability, and higher churn and bad debt expense. A significant portion of our broadcasting and digital revenue comes from the sale of advertising and is affected by the strength of the economy.
Strategy and business plans
Our strategy is vital to our long-term success. Changing strategic priorities or adding new strategic priorities could compromise
68 | ROGERS COMMUNICATIONS INC. 2022 ANNUAL REPORT
existing initiatives and could have a material adverse effect on our business, results of operations, and financial condition.
We develop business plans, execute projects, and launch new ventures to grow our business. If the expected benefits from these do not materialize, this could have a material adverse effect on our business, results of operations, and financial condition.
Our products, services, and networks rely, in part, on certain vendors. Should our vendors not deliver solutions that operate as intended, our business and financial results could be adversely affected. This may result in subscriber losses, lower revenue, and unfavourable customer satisfaction.
Monitoring and controlling fraudulent activities
As a large company with tens of thousands of employees and a range of desirable and valuable products and services, fraud prevention requires a disciplined program covering governance, exposure identification and assessment, prevention, detection, and reporting. This program must consider corruption and misappropriation of assets by employees and/or external parties. Fraud events can result in financial loss and brand degradation. In addition to unauthorized access to digital boxes and Internet modems, a sample of potential examples of fraud relevant to us include (i) inappropriate use of our cable or wireless networks, (ii) subscription fraud and fraudulent account takeovers for purpose of hardware theft or SIM swapping, (iii) intentional manipulation of financial statements by employees and/or external parties, and (iv) copyright theft and other forms of unauthorized use that undermine the exclusivity of our content offerings.
Unauthorized access to digital boxes or Internet modems
With a significant number of Canadians purchasing illegal pre-loaded set-top boxes and illegally streaming our television products, cord-shaving, cord-cutting and customer churn rates could increase. To address this, we use encryption technology developed and supported by our vendors to protect our cable signals from unauthorized access and to control access to programming based on subscription packages. We also use encryption and security technologies to prevent unauthorized access to our Internet service.
There is no assurance that we will be able to effectively prevent unauthorized decoding of television signals or Internet access in the future. If we are unable to control cable access with our encryption technology, and subscriptions to digital programming, including premium video-on-demand and subscription video-on-demand, this could result in a decline in our Cable revenue.
Legal and ethical compliance
We rely on our employees, officers, Board, suppliers, and other business partners to behave consistently with applicable legal and ethical standards in all jurisdictions in which we operate, including, but not limited to, anti-bribery laws and regulations. Situations where individuals or others, whether inadvertently or intentionally, do not adhere to our policies, applicable laws and regulations, or contractual obligations may expose us to litigation and the possibility of damages, sanctions, and fines, or of being disqualified from bidding on contracts. This may have an adverse effect on our results, financial position, reputation, and brand.
Acquisitions, divestitures, or investments
Acquiring complementary businesses and technologies, developing strategic alliances, and divesting portions of our business are often required to optimally execute our business strategy. Some areas of our operations (and adjacent businesses) are subject to rapidly evolving technologies and consumer usage and demand trends. It is possible that we may not effectively forecast the value of consumer demand or risk of competing technologies resulting in higher valuations for acquisitions or missed opportunities.
Services, technologies, key personnel, or businesses of companies we acquire may not be effectively integrated into our business or service offerings, or our alliances may not be successful. We also may not be able to successfully complete certain divestitures on satisfactory terms, if at all.
Decline of television subscribers in Canada (cord-cutting and cord-shaving)
The number of households that subscribe to television service in Canada continues to decline. Other video offerings available to consumers (for example, direct-to-consumer subscription and free services), as well as piracy, have contributed to this trend. If this decline continues, it could have a material adverse effect on our results of operations.
Migrating from conventional to digital media
Our Media business operates in many industries that can be affected by customers migrating from conventional to digital media, which is driving shifts in the quality and accessibility of data and mobile alternatives to conventional media. We have been shifting our focus towards the digital market. Increasing competition for advertising revenue from digital platforms, such as search engines, social networks, and digital content alternatives, has resulted in advertising dollars migrating from conventional television broadcasters to digital platforms. The impact is greater on conventional over-the-air broadcast networks, such as Citytv and OMNI, which do not have a second revenue stream from subscription revenue. Our Media results could be adversely affected if we are unsuccessful in shifting advertising dollars from conventional to digital platforms.
Our market position in radio and television
Advertising dollars typically migrate to media properties that are leaders in their respective markets and categories, particularly when advertising budgets are tight. Our radio and television properties may not continue performing how they currently perform. Advertisers base a substantial part of their purchasing decisions on ratings data generated by industry associations and agencies. If our radio and television ratings decrease substantially, our advertising sales volumes and the rates that we charge advertisers could be adversely affected.
Climate change
Climate change is an increasingly important consideration in all businesses, including the telecommunications business. Failure of climate change mitigation and adaptation efforts could affect our business through potential disruption of our operations or supply chains, damage to our infrastructure, and the effects on the communities we serve. The physical risk to our infrastructure caused
2022 ANNUAL REPORT ROGERS COMMUNICATIONS INC. | 69
MANAGEMENT’S DISCUSSION AND ANALYSIS
by extreme weather disturbances related to climate change can significantly affect our ability to maintain secure communication services to all our customers, including governments and health and emergency services.
Climate change and the environment are drawing more attention through evolving stakeholder interest and management expectations. Many aspects of our operations are subject to evolving and increasingly stringent federal, provincial, and local environmental, health, and safety laws and regulations. Such laws and regulations impose requirements with respect to matters such as the release of substances into the environment, corrective and remedial action concerning such releases, and the proper handling and management of substances. These evolving considerations and more stringent laws and regulations could lead to increased costs for compliance and rising costs of utilities. Failure to recognize and adequately respond could result in fines, regulatory scrutiny, loss of stakeholder confidence, or damage to our reputation or brand.
Controlling shareholder ownership risk
Rogers is a family-founded, family-controlled company. Voting control of Rogers Communications Inc. is held by the Trust for the benefit of successive generations of the Rogers family and, as a result, the Trust is able to elect all members of the Board and to control the vote on most matters submitted to shareholders, whether through a shareholder meeting or a written consent resolution. The beneficiaries of the Trust are a small group of individuals who are members of the Rogers family, several of whom are also directors of the Board. The trustee is the trust company subsidiary of a Canadian chartered bank.
As at December 31, 2022, private Rogers family holding companies controlled by the Trust owned approximately 98% of our outstanding Class A Shares (2021 – 98%) and approximately 10% of our Class B Non-Voting Shares (2021 – 10%), or in total approximately 29% of the total shares outstanding (2021 – 29%). Only Class A Shares carry the right to vote in most circumstances.
LITIGATION RISKS
July 2022 network outage
As a result of the network outage that occurred on July 8, 2022, a total of four applications were filed in the Quebec Superior Court seeking authorization to commence a class action against Rogers in relation to this network outage. One of the applications was subsequently withdrawn. A second application has since been suspended. Each of the remaining two applications seeks to institute a class action on behalf of all persons in Quebec who, among other things, experienced a wireless or wireline service interruption as a result of, or were otherwise impacted by, the outage. Each remaining application also claims various damages, including, among others, contractual damages, damages for lost profits, and punitive damages.
At this time, we are unable to assess the likelihood of success of these applications, or predict the magnitude of any liability we might incur by virtue of the claims underlying those applications or any corresponding or similar claims that may be brought against us in the future. As such, we have not recognized a liability for this contingency. If successful, one of those claims could have a material adverse effect on our business, financial results, or financial
condition. It is also possible that similar or corresponding claims could be filed in other jurisdictions.
Wholesale Internet costing and pricing
On August 15, 2019, in Telecom Order CRTC 2019-288, Follow-up to Telecom Orders 2016-396 and 2016-448 – Final rates for aggregated wholesale high-speed access services (Order), the CRTC set final rates for facilities-based carriers’ wholesale high-speed access services, including Rogers’ TPIA service. The Order set final rates for Rogers that are significantly lower than the interim rates that were previously billed and it further determined that these final rates will apply retroactively to March 31, 2016.
We did not believe the final rates set by the CRTC were just and reasonable as required by the Telecommunications Act as we believed they were below cost. On May 27, 2021, the CRTC released Telecom Decision CRTC 2021-181 Requests to review and vary Telecom Order 2019-288 regarding final rates for aggregated wholesale high-speed access services. The CRTC decided to adopt the interim rates in effect prior to the Order as the final rates, with certain modifications, including the removal of the supplementary markup of 10% for incumbent local exchange carriers.
The final rates are lower than the rates we previously billed to the resellers for the period of March 31, 2016 to October 6, 2016. We recognized a refund in 2021 of amounts previously billed to the resellers of approximately $25 million, representing the impact on a retroactive basis for that period.
On May 28, 2021 a wholesale ISP petitioned the Governor in Council to, among other things, restore the 2019 Order and make the rates established in that order final. In addition, on June 28, 2021, the same wholesale ISP filed a motion seeking leave to appeal the 2021 Decision to the Federal Court of Appeal, which was granted on September 15, 2021. We, along with several other cable companies, have intervened in these matters.
System access fee – Saskatchewan
In 2004, a class action was commenced against providers of wireless communications in Canada under the Class Actions Act (Saskatchewan). The class action relates to the system access fee wireless carriers charge to some of their customers. The plaintiffs are seeking unspecified damages and punitive damages, which would effectively be a reimbursement of all system access fees collected.
In 2007, the Saskatchewan Court granted the plaintiffs’ application to have the proceeding certified as a national, “opt-in” class action where affected customers outside Saskatchewan must take specific steps to participate in the proceeding. In 2008, our motion to stay the proceeding based on the arbitration clause in our wireless service agreements was granted. The Saskatchewan Court directed that its order, in respect of the certification of the action, would exclude customers who are bound by an arbitration clause from the class of plaintiffs.
In 2009, counsel for the plaintiffs began a second proceeding under the Class Actions Act (Saskatchewan) asserting the same claims as the original proceeding. If successful, this second class action would be an “opt-out” class proceeding. This second proceeding was ordered conditionally stayed on the basis that it was an abuse of process.
70 | ROGERS COMMUNICATIONS INC. 2022 ANNUAL REPORT
At the time the Saskatchewan class action was commenced, corresponding claims were filed in multiple jurisdictions across Canada. The claims in all provinces other than Saskatchewan have now been dismissed or discontinued. We have not recognized a liability for this contingency.
911 fee
In June 2008, a class action was launched in Saskatchewan against providers of wireless communications services in Canada. It involves allegations of breach of contract, misrepresentation, and false advertising, among other things, in relation to the 911 fee that had been charged by us and the other wireless telecommunication providers in Canada. The plaintiffs are seeking unspecified damages and restitution. The plaintiffs intend to seek an order certifying the proceeding as a national class action in Saskatchewan. We have not recognized a liability for this contingency.
Videotron Ltd.
On October 29, 2021, Videotron Ltd. launched a lawsuit against Rogers in the Quebec Superior Court, in connection with the agreement entered into by the parties in 2013 for the development and operation of a joint LTE network in the province of Quebec. The lawsuit involves allegations by Videotron Ltd. that Rogers has breached its contractual obligations by developing its own network in the territory. Videotron is seeking compensatory damages in the amount of $850 million. We intend to vigorously defend this lawsuit. We have not recognized a liability for this contingency.
Other claims
There are certain other claims and potential claims against us. We do not expect any of these, individually or in the aggregate, to have a material adverse effect on our financial results.
Outcome of proceedings
The outcome of all the proceedings and claims against us, including the matters described above, is subject to future resolution that includes the uncertainties of litigation. It is not possible for us to predict the result or magnitude of the claims due to the various factors and uncertainties involved in the legal process. Based on information currently known to us, we believe it is not probable that the ultimate resolution of any of these proceedings and claims, individually or in total, will have a material adverse effect on our business, financial results, or financial condition. If circumstances change and it becomes probable that we will be held liable for claims against us and such claim is estimable, we will recognize a provision during the period in which the change in probability occurs, which could be material to our Consolidated Statements of Income or Consolidated Statements of Financial Position.
DISCLOSURE CONTROLS AND PROCEDURES
We conducted an evaluation of the effectiveness of the design and operation of our disclosure controls and procedures as at December 31, 2022, under the supervision and with the participation of our management, including the Chief Executive Officer and Chief Financial Officer, pursuant to Rule 13a-15 promulgated under the US Securities Exchange Act of 1934, as amended. Based on this evaluation, our Chief Executive Officer and Chief Financial Officer concluded that our disclosure controls and procedures were effective at that date.
MANAGEMENT’S REPORT ON INTERNAL CONTROL OVER FINANCIAL REPORTING
Management is responsible for establishing and maintaining adequate internal control over financial reporting.
Our internal control system is designed to give management and the Board reasonable assurance that our financial statements are prepared and fairly presented in accordance with IFRS as issued by the IASB. The system is intended to provide reasonable assurance that transactions are authorized, assets are safeguarded, and financial records are reliable. Management also takes steps to assure the flow of information and communication is effective, and monitors performance and our internal control procedures.
Management assessed the effectiveness of our internal control over financial reporting as at December 31, 2022, based on the criteria set out in the Internal Control – Integrated Framework (2013) issued by the Committee of Sponsoring Organizations of the Treadway Commission (COSO), and concluded that it was effective at that date. Our independent auditors, KPMG LLP, have issued an unqualified opinion on the effectiveness of the Company’s internal control over financial reporting as of December 31, 2022. This report is included in our 2022 Audited Consolidated Financial Statements filed on SEDAR (sedar.com).
All internal control systems, however, no matter how well designed, have inherent limitations, and even systems that have been determined to be effective can only provide reasonable assurance about the preparation and presentation of financial statements.
CHANGES IN INTERNAL CONTROL OVER FINANCIAL REPORTING AND DISCLOSURE CONTROLS AND PROCEDURES
There have been no changes in 2022 that materially affected, or are reasonably likely to materially affect, our internal control over financial reporting.
2022 ANNUAL REPORT ROGERS COMMUNICATIONS INC. | 71
MANAGEMENT’S DISCUSSION AND ANALYSIS
Our business, except for the non-broadcasting operations of Media, is regulated by two groups:
| • | ISED Canada on behalf of the Minister of Innovation, Science and Industry; and |
| • | the CRTC, under the Telecommunications Act and the Broadcasting Act. |
Regulation relates to the following, among other things:
| • | wireless spectrum and broadcasting licensing; |
| • | competition; |
| • | the cable television programming services we must, and can, distribute; |
| • | wireless and wireline interconnection agreements; |
| • | rates we can charge third parties for access to our network; |
| • | the resale of services on our networks; |
| • | roaming on our networks and the networks of others; |
| • | ownership and operation of our communications systems; and |
| • | our ability to acquire an interest in other communications systems. |
Regulatory changes or decisions can adversely affect our results of operations.
Our costs of providing services may increase from time to time as we comply with industry or legislative initiatives to address consumer protection concerns or Internet-related issues like copyright infringement, unsolicited commercial e-mail, cybercrime, and lawful access.
Generally, our spectrum and broadcast licences are granted for a specified term and are subject to conditions for maintaining these licences. Regulators can modify these licensing conditions at any time, and they can decide not to renew a licence when it expires. If we do not comply with the conditions, a licence may be forfeited or revoked, or we may be fined.
The licences have conditions that require us, amongst other things, to comply with Canadian ownership restrictions of the applicable legislation. We are currently in compliance with these conditions. If we violate the requirements, we would be subject to various penalties, including the loss of a licence in extreme cases.
Cable, wireless, and broadcasting licences generally cannot be transferred without regulatory approval.
CANADIAN BROADCASTING AND TELECOMMUNICATIONS OPERATIONS
The CRTC is responsible for regulating and supervising all aspects of the Canadian broadcasting and telecommunications system. Our Canadian broadcasting operations – including our cable television systems, radio and television stations, and specialty services – are licensed (or operated under an exemption order) and regulated by the CRTC under the Broadcasting Act.
The CRTC is also responsible under the Telecommunications Act for the regulation of telecommunications carriers, including:
| • | Wireless’ mobile voice and data operations; and |
| • | Cable’s Internet and telephone services. |
Our cable and telecommunications retail services are not currently subject to retail price regulation, other than our affordable entry-
level basic cable television service ordered by the CRTC and introduced in 2016, as the CRTC believes there is enough competition for these services provided by other carriers to protect the interests of users and has forborne from regulating them. Regulations can and do, however, affect the terms and conditions under which we offer these services.
SPECTRUM LICENCES
ISED Canada sets technical standards for telecommunications under the Radiocommunication Act (Canada) (Radiocommunication Act) and the Telecommunications Act. It licences and oversees:
| • | the technical aspects of the operation of radio and television stations; |
| • | the frequency-related operations of cable television networks; and |
| • | spectrum for wireless communications systems in Canada. |
On June 30, 2022, ISED Canada released its Policy and Licensing Framework for Spectrum in the 3800 MHz Band, laying out the rules for the upcoming auction. The 3800 MHz band, along with the 3500 MHz band that was auctioned in 2021, is key to supporting strong 5G networks. The auction is expected to begin in October 2023. The rules include measures such as (i) imposing a 100 MHz cap on large national providers (i.e. RCCI, Bell Mobility Inc., and Telus Communications Inc.) as to how much combined 3500 MHz and 3800 MHz spectrum they can acquire; (ii) reserving a total of 150 MHz across the 3500 MHz and 3800 MHz spectrum bands for smaller competitors; and (iii) implementing strong deployment requirements requiring spectrum won at auction to be deployed within a certain timeframe or risk losing the licences.
ROYALTIES
The Copyright Board of Canada (Copyright Board) oversees the administration of copyright royalties in Canada and establishes the royalties to be paid for the use of certain copyrighted works. It sets the copyright tariff royalties that Canadian broadcasting undertakings, including cable, radio, television, and specialty services, pay to copyright collectives.
BILLING AND CONTRACTS
Manitoba, Newfoundland and Labrador, Ontario, and Quebec have enacted consumer protection legislation for wireless, wireline, and Internet service contracts. This legislation addresses the content of such contracts, the determination of the early cancellation fees that can be charged to customers, the use of security deposits, the cancellation and renewal rights of customers, the sale of prepaid cards, and the disclosure of related costs. Rogers is also currently subject to the CRTC Wireless Code, the CRTC Television Service Provider Code of Conduct that became effective on September 1, 2017, and the CRTC Internet Code that became effective on January 31, 2020. See “CRTC Wireless Code of Conduct” and “CRTC Internet Code” for more information.
FOREIGN OWNERSHIP AND CONTROL
Non-Canadians can own and control, directly or indirectly:
| • | up to 33.3% of the voting shares and the related votes of a holding company that has a subsidiary operating company licenced under the Broadcasting Act, and |
72 | ROGERS COMMUNICATIONS INC. 2022 ANNUAL REPORT
| • | up to 20% of the voting shares and the related votes of the operating licensee company may be owned and controlled directly or indirectly by non-Canadians. |
Combined, these limits can enable effective foreign control of up to 46.7%.
The chief executive officer and 80% of the members of the board of directors of the operating licensee must be resident Canadians. There are no restrictions on the number of non-voting shares that may be held by non-Canadians at either the holding company or the licensee company level. Neither the Canadian carrier nor its parent may be otherwise controlled in fact by non-Canadians. Subject to appeal to the federal Cabinet, the CRTC has the jurisdiction to determine as a question of fact whether a given licensee is controlled by non-Canadians.
Pursuant to the Telecommunications Act and associated regulations, the same rules also apply to Canadian telecommunications carriers such as Wireless, except that there is no requirement that the chief executive officer be a resident Canadian. We believe we are in compliance with the foregoing foreign ownership and control requirements.
On June 29, 2012, Bill C-38 amending the Telecommunications Act passed into law. The amendments exempt telecommunications companies with less than 10% of total Canadian telecommunications market measured by revenue from foreign investment restrictions. Companies that are successful in growing their market shares in excess of 10% of total Canadian telecommunications market revenue other than by way of merger or acquisitions will continue to be exempt from the restrictions.
CRTC REVIEW OF BASIC TELECOMMUNICATIONS SERVICES
After an extensive proceeding examining which telecommunications services Canadians require to participate meaningfully in the digital economy and the CRTC’s role in ensuring the availability of affordable basic telecommunications services to all Canadians, the CRTC released Telecom Regulatory Policy CRTC 2016-496, Modern telecommunications services – The path forward for Canada’s digital economy, on December 21, 2016.
The CRTC set as its universal service objective that Canadians, in urban areas as well as in rural and remote areas, have access to voice services and broadband Internet access services, on both fixed and mobile wireless networks. To measure the successful achievement of this objective, the CRTC has established several criteria, including:
| • | 90% of Canadian residential and business fixed broadband Internet access service subscribers should be able to access speeds of at least 50 Mbps download and 10 Mbps upload, and to subscribe to a service offering with an unlimited data allowance by 2021, with the remaining 10% of the population receiving such service by 2031; and |
| • | the latest generally deployed mobile wireless technology should be available not only in Canadian homes and businesses, but on as many major transportation roads as possible in Canada. |
To help attain the universal service objective, the CRTC will begin to shift the focus of its regulatory frameworks from wireline voice services to broadband Internet access services. As such, the following services that form part of the universal service objective
are considered basic telecommunications services within the meaning of subsection 46.5(1) of the Telecommunications Act:
| • | fixed and mobile wireless broadband Internet access services; and |
| • | fixed and mobile wireless voice services. |
To assist in extending broadband into under-served rural and remote locations, the CRTC stated that it would establish a new broadband fund to which all entities providing Internet services in Canada must contribute. The specifics of the fund, including guiding principles, fund design, and assessment criteria, were established in Telecom Regulatory Policy CRTC 2018-377, Development of the CRTC’s Broadband Fund, released on September 27, 2018. Two calls for applications occurred in 2019. 2020 marks the first year of payments into the fund, with a maximum funding level of $100 million in the first year of implementation. This level will increase by $25 million annually over the following four years to reach an annual cap of $200 million, with the incremental increases in years four and five contingent on a review of the fund in the third year to ensure it is being managed efficiently and is achieving its intended purpose.
A percent of revenue levy has been applied on wireline and wireless voice revenues since 2000 to support providing voice service to designated high-cost local voice serving area and to provide a national video relay service (VRS). In 2019, a 0.52% levy on wireline and wireless voice revenues generated $94.2 million in subsidies. The voice service subsidy component is declining year-over-year because in Telecom Regulatory Policy CRTC 2018-213, Phase-out of the local voice service subsidy regime, the CRTC determined that the current $115 million local service subsidy for incumbent local telephone company high-cost serving areas would be phased out in six equal increments between 2019 and 2021 such that the voice subsidy will be eliminated by the end of 2021.
For 2020, the $100 million funding requirements of the Broadband Fund was added to the voice and VRS requirements, resulting in an increased projected subsidy requirement of $170.7 million per Telecom Decision CRTC 2019-395, Final 2019 revenue-percent charge and related matters, released on December 4, 2019. The percent of revenue levy currently applied to wireline and wireless voice revenues will be extended to also apply to Internet and texting revenue and is set for 2020 on an interim basis at 0.45% on this expanded revenue base, subject to finalization based on actual revenues in late 2020.
CANADA’S ANTI-SPAM LEGISLATION
Canada’s anti-spam legislation was passed into law on December 15, 2010 and came into force on July 1, 2014. Sections of such legislation related to the unsolicited installation of computer programs or software came into force on January 15, 2015. We are in compliance with this legislation.
MANDATORY NOTIFICATION OF PRIVACY BREACHES
Since 2018, organizations that are regulated by the Personal Information Protection and Electronic Documents Act (PIPEDA), have had an obligation to notify impacted individuals and the federal Privacy Commissioner of a privacy breach where it is reasonable to believe the breach of security safeguard creates a real risk of significant harm to the individual. Notification must be completed as soon as feasible after it is determined a breach
2022 ANNUAL REPORT ROGERS COMMUNICATIONS INC. | 73
MANAGEMENT’S DISCUSSION AND ANALYSIS
occurred. Businesses must also keep records of breaches and provide these records to the Privacy Commissioner upon request. Failure to provide notification or maintain records could result in fines up to $100,000 per violation. We fully comply with these obligations under PIPEDA.
REVIEW OF PIPEDA
On June 16, 2022, the Federal Government tabled Bill C-27, the Digital Charter Implementation Act, 2022, to overhaul Canada’s private sector privacy legislation. It includes provisions for increased consumer control over personal information, new powers for the federal Privacy Commissioner, significant financial penalties, a Private Right of Action, new rules for protecting children’s privacy, and regulates the development and deployment of artificial intelligence systems. If passed, Bill C-27 will include a transition window that allows organizations sufficient time to make the necessary updates and changes to internal policies and processes for compliance.
GOVERNMENT OF CANADA REVIEW OF THE BROADCASTING ACT
On February 2, 2022, the Federal Government introduced Bill C-11, the Online Streaming Act. Bill C-11 will amend the Broadcasting Act and make related and consequential amendments to other acts. The goal of Bill C-11 is to support Canada’s cultural policy objectives of producing Canadian stories in the midst of a changing broadcasting landscape. The main amendments would subject online streaming services to CRTC regulation and require specific investment in Canadian cultural enterprises and include diverse programming, including Indigenous content. The CRTC will decide how the new regulatory regime is to be implemented subject to the guidance that would be provided by the Government in a policy direction to be issued when (and if) the Bill is passed.
THE ONLINE NEWS ACT
On April 5, 2022, the Federal Government introduced Bill C-18, the Online News Act. The purpose of Bill C-18 is to regulate online communications platforms, called “digital news intermediaries”, as a means to enhance fairness in the Canadian digital news marketplace and contribute to sustainability. Bill C-18 has not yet been passed into law.
MATTERS ASSOCIATED WITH NETWORK OUTAGE
On July 11, 2022, in response to the network outage that occurred on July 8, 2022, the Minister for Innovation, Science and Industry announced he had directed the major telecommunications companies in Canada to improve the resilience and reliability of their networks by ensuring formal arrangements are in place within 60 days that will address (i) emergency roaming, (ii) mutual assistance during outages, and (iii) a communication protocol to better inform the public and authorities during telecommunications emergencies. On September 7, 2022, we announced that a formal memorandum of understanding had been signed among Canada’s major telecommunications carriers regarding reciprocal support for emergency roaming, mutual assistance, and communications protocols in the event of a future network outage.
On July 12, 2022, the CRTC issued a request for information asking us to respond to detailed questions and provide a comprehensive explanation regarding the network outage. The CRTC has requested a detailed account as to why and how this network outage happened, as well as what measures we will put in place to prevent future outages. On July 22, 2022, we provided responses to the CRTC’s questions. On August 5, 2022, the CRTC issued a subsequent request for information, responses to which were filed by Rogers on August 22, 2022.
On July 15, 2022, the House of Commons Standing Committee on Industry and Technology announced it would study the network outage, including the underlying causes and its impact on families, consumers, and businesses. The committee held meetings during July 2022 during which representatives from Rogers, amongst others, appeared.
3800 MHZ SPECTRUM LICENCE BANDS
On June 6, 2019, ISED Canada released its Decision (2019 Decision) on its Consultation on Revisions to the 3500 MHz Band to Accommodate Flexible Use and Preliminary Consultation on Changes to the 3800 MHz Band. On August 27, 2020, ISED Canada launched its Consultation on the Technical and Policy Framework for the 3650-4200 MHz Band and Changes to the Frequency Allocation of the 3500-3650 MHz Band to address potential changes to the spectrum utilization policy, band plans, and the technical and policy considerations to optimize the use of the 3700-4200 MHz bands to support 5G wireless technologies deployment. On May 21, 2021, ISED Canada released its Decision on the Technical and Policy Framework for the 3650-4200 MHz Band and Changes to the Frequency Allocation of the 3500-3650 MHz Band, announcing the decision to repurpose the 3800 MHz spectrum band to support 5G services. On December 17, 2021, ISED Canada launched a follow-up proceeding, Consultation on a Policy and Licensing Framework for Spectrum in the 3800 MHz band, to determine the auction format and rules. Initial comments were due on February 15, 2022.
On June 30, 2022, ISED Canada released its Policy and Licensing Framework for Spectrum in the 3800 MHz Band, laying out the rules for the upcoming auction. The rules include measures such as (i) imposing a 100 MHz cap on large national providers (i.e. RCCI, Bell Mobility Inc., and Telus Communications Inc.) as to how much combined 3500 MHz and 3800 MHz spectrum they can acquire; (ii) reserving a total of 150 MHz across the 3500 MHz and 3800 MHz spectrum bands for smaller competitors; and (iii) implementing strong deployment requirements requiring spectrum won at auction to be deployed within a certain timeframe or risk losing the licences. The 3800 MHz auction is expected to begin on October 24, 2023.
TRANSFERS, DIVISIONS, AND SUBORDINATE LICENSING OF SPECTRUM LICENCES
In June 2013, ISED Canada released Framework Relating to Transfers, Divisions and Subordinate Licensing of Spectrum Licences for Commercial Mobile Spectrum. The Framework lays out the criteria ISED Canada will consider and the processes it will use when it reviews spectrum licence transfers, including
74 | ROGERS COMMUNICATIONS INC. 2022 ANNUAL REPORT
prospective transfers that could arise from purchase or sale options and other agreements. Key items to note are that:
| • | ISED Canada will review all spectrum transfer requests and will not allow any that result in “undue spectrum concentration” and reduced competition. Decisions will be made on a case-by-case basis and will be issued publicly to increase transparency; and |
| • | licensees must ask for a review within 15 days of entering into any agreement that could lead to a prospective transfer. ISED Canada will review the agreement as though the licence transfer that could arise from it has been made. |
CRTC WIRELESS CODE OF CONDUCT
In June 2013, the CRTC issued its Wireless Code of Conduct (Wireless Code) that came into effect in December 2013. The Wireless Code imposes several obligations on wireless carriers, including maximum contract term length, roaming bill caps, device unlocking requirements, and contract summaries. It also lays out the rules for device subsidies and early cancellation fees. Under the Wireless Code, if a customer cancels a contract early, carriers can only charge the outstanding balance of the device subsidy they received, which decreases by an equal amount every month over no more than 24 months.
On June 15, 2017, the CRTC released its decision on the three-year review of the Wireless Code (Telecom Regulatory Policy CRTC 2017-200, Review of the Wireless Code). The CRTC determined that as of December 1, 2017, all individual and small business wireless service customers will have the right to have their cellular phones and other mobile devices unlocked, free of charge, upon request. In addition, all newly purchased devices must be provided unlocked from that day forward. The CRTC also determined that for family or shared plans (multi-line plans), the account holder must, by default, be the one who consents to data overage and data roaming charges beyond the established caps ($50 and $100 per month, respectively). Wireless service providers may, however, allow account holders to authorize other users on a family or shared plan to consent to additional charges. The CRTC also made clear that in all instances, the caps apply on a per account basis, regardless of the number of devices, for multi-line plans and individual lines on the account.
In July 2019, Rogers introduced wireless device financing agreements with both 24- and 36-month terms. On August 30, 2019, the CRTC initiated Telecom Notice of Consultation CRTC 2019-309, Show cause proceeding and call for comments – The Wireless Code – Device financing plans, to consider whether device financing plans, including those with terms longer than 24 months, are compliant with the Wireless Code. We voluntarily ceased offering device financing arrangements with terms greater than 24 months at that time. Final reply submissions were filed on October 29, 2019. On March 4, 2021, the CRTC released Telecom Decision CRTC 2021-98, Wireless Code – Application to device financing plans, confirming that the Wireless Code does apply to device financing plans sold with a wireless service plan and that device financing plans must comply with all relevant protections of the Wireless Code. The CRTC also established that device financing plans are similar to device subsidies when determining early cancellation fees under the Wireless Code.
On October 28, 2022, the CRTC issued Telecom Regulatory Policy 2022-294, The Wireless Code – Clarification of the term “manufacturer’s suggested retail price”, in which it clarified the
definition of the term “manufacturer’s suggested retail price (MSRP)” provided in Telecom Regulatory Policy 2019-271. The CRTC stated the regular price for a wireless mobile device as published by the original equipment manufacturer (OEM) on the OEM’s Canadian website, at the time a contract is entered into is to be deemed the MSRP for the purpose of Section G of the Wireless Code if no MSRP is provided by the OEM to the wireless service provider (WSP). Furthermore, the CRTC directed WSPs to collect and update MSRP data on a monthly basis and to retain historical MSRP data to make it available to the CRTC. The CRTC further expects each WSP to collect this information in a consistent manner.
TOWER SHARING POLICY
In March 2013, ISED Canada released Revised Frameworks for Mandatory Roaming and Antenna Tower and Site Sharing, concluding a consultation initiated in 2012. It sets out the current rules for tower and site sharing, among other things. The key terms of the tower and site sharing rules are:
| • | all holders of spectrum licences, radio licences, and broadcasting certificates must share towers and antenna sites, where technically feasible, at commercial rates; and |
| • | the timeframe for negotiating agreements is 60 days, after which arbitration according to ISED Canada arbitration rules will begin. |
In Telecom Regulatory Policy 2015-177, Regulatory framework for wholesale mobile wireless services, released in May 2015, the CRTC determined that it would not mandate or require general wholesale tariffs for tower and site sharing. At the same time, it determined that its existing powers and processes are sufficient to address tower and site sharing disputes related to rates, terms, and conditions. As a result, carriers may use the arbitration process established by ISED Canada, or they may request the CRTC to intervene in the event that tower and site sharing negotiations fail.
POLICY DIRECTION TO THE CRTC ON TELECOMMUNICATIONS
On February 26, 2019, the Minister of Innovation, Science and Economic Development tabled a Proposed Order Issuing a Direction to the CRTC on Implementing the Canadian Telecommunications Policy Objectives to Promote Competition, Affordability, Consumer Interests and Innovation. The Direction signals the government’s intention to require the CRTC to consider competition, affordability, consumer interests, and innovation in its telecommunications decisions and to demonstrate to Canadians in those decisions that it has done so.
On June 17, 2019, the Order Issuing a Direction to the CRTC on Implementing the Canadian Telecommunications Policy Objectives to Promote Competition, Affordability, Consumer Interests and Innovation came into effect after review and revision. It requires the CRTC to consider competition, affordability, consumer interests, and innovation in its telecommunications decisions and to demonstrate to Canadians in those decisions that it has done so.
On February 13, 2023, the Order Issuing a Direction to the CRTC on a Renewed Approach to Telecommunications Policy came into effect. Building on the direction and objectives set out in the previous Order, it adds the required principles of effective regulation that the CRTC must follow. The principles most notably include transparency, predictability, coherence, and efficiency, and
2022 ANNUAL REPORT ROGERS COMMUNICATIONS INC. | 75
MANAGEMENT’S DISCUSSION AND ANALYSIS
also state the CRTC should ensure proceedings are held, and decisions released, in a timely manner. It also requires the CRTC to consider fixed Internet competition and mobile wireless competition, including maintaining regulatory frameworks regarding wholesale services for both fixed Internet and wholesale roaming services for mobile wireless. Lastly, it requires the CRTC to enhance and protect the rights of consumers in telecommunication markets, and to continue taking measures to support universal access to high-quality, reliable, and resilient fixed Internet and mobile wireless services.
CRTC REVIEW OF MOBILE WIRELESS SERVICES
On February 28, 2019, through Telecom Notice of Consultation CRTC 2019-57, Review of mobile wireless services, the CRTC initiated its five-year review to examine the state of the mobile wireless market and to determine whether further action is required to improve choice and affordability for Canadians. After extensive written submissions were filed in 2019, a two-week oral hearing began on February 18, 2020. Final written submissions were filed on July 15, 2020.
On April 15, 2021 the CRTC issued Telecom Regulatory Policy 2021-130, Review of mobile wireless services. The CRTC mandated wholesale mobile virtual network operator (MVNO) access, seamless handoff for mandated wholesale roaming, and new mandatory low-cost and occasional-use retail rate plans; however, mandated MVNO access will only be provided if certain conditions are met as described briefly below.
The CRTC decided that mandated wholesale MVNO access must be offered by the national carriers, and SaskTel in Saskatchewan, but only made available to eligible regional wireless carriers that hold mobile spectrum licences, and only in the areas that are covered by their licences. The terms and conditions associated with mandated MVNO access must be approved by the CRTC, while rates will be subject to commercial negotiation, backstopped by final offer arbitration, with the CRTC acting as arbitrator. Mandated MVNO access will be limited to a seven-year period commencing on the date the CRTC finalizes the terms and conditions. This time limit is intended to provide the regional carriers sufficient time to expand their networks while maintaining investment incentives.
The national wireless carriers must also provide seamless handoff as part of the mandatory roaming they must offer to the regional wireless carriers. Seamless handoff will ensure that calls in progress are not dropped when customers travel outside their home network coverage and into the coverage of their roaming provider. The CRTC also directed the national wireless carriers to offer 5G roaming where the roaming network offers 5G service on its own network and to file proposed revised terms and conditions within 90 days for CRTC approval. The CRTC also mandated retail rate plans for low-cost and occasional use. These plans were implemented on July 14, 2021.
On April 6, 2022, the CRTC issued Telecom Decision CRTC 2022-102, Updates to national wireless carriers’ GSM-based wholesale mobile wireless roaming tariffs to incorporate seamless hand-off and 5G roaming, which requires the implementation of seamless roaming, including using one-way seamless hand-off. The CRTC directs the national wireless carriers to begin accepting written requests for seamless roaming from regional wireless carriers effective immediately. The CRTC considers that its
determinations in this decision will assist with the implementation of seamless roaming to the benefit of regional wireless carriers and reduce barriers to entry into the market and to competition for telecommunications service providers that are new, regional, or smaller than the incumbent national service providers.
On October 19, 2022, the CRTC issued Telecom Decision CRTC 2022-288, Facilities-based wholesale mobile virtual network operator (MVNO) access tariffs – Commission determinations on proposed terms and conditions, which determined that wholesale MVNO access service is available for use by regional wireless carriers that have deployed their own home Public Mobile Network (PMN) somewhere in Canada and are also offering retail wireless services. To be eligible for the MVNO access, a regional wireless carrier must be registered with the CRTC as a wireless carrier, must have home PMN somewhere in Canada, and must be actively offering mobile wireless services commercially to retail customers. The CRTC has directed the incumbents to modify their tariffs in accordance with its determination, and noted that entities that are not currently eligible for the service may become eligible over the course of the mandate if they acquire rights to spectrum, and invest in a home PMN and start offering retail service.
COPYRIGHT RETRANSMISSION OF DISTANT SIGNALS
Pursuant to section 31(2) of the Copyright Act, television service providers are permitted to retransmit programming within distant over-the-air television signals as part of a compulsory licensing regime. Rates for the distribution of the programming are established through negotiation or set by the Copyright Board. Distributors and content providers (the Collectives) were unable to agree on a new rate for the distribution of distant signals after the expiration of the then-current agreement in 2013. A proceeding was initiated by the Copyright Board in 2015 and a decision was rendered on December 18, 2018. The decision increased the rate paid by broadcast distribution undertakings (BDUs) by approximately 8% for 2014, a further 7.5% for 2015, and a further 2.5% for 2016, with 2017 and 2018 held constant at the 2016 rate. For the period of 2019 to 2023, an interim rate was set at the 2016 rate of $1.17.
The Collectives appealed the Copyright Board’s decision on the 2014 to 2018 rates, seeking to have the rates increased to an average of approximately $2.20 for the five-year period. On July 22, 2021, the Federal Court of Appeal released a decision in which it determined the 2014 and 2015 rates would be final but agreed with the Collectives that errors were made with respect to the 2016 to 2018 rates. The BDUs, including Rogers, filed a motion for Leave to Appeal the Federal Court of Appeal’s decision with the Supreme Court of Canada which was dismissed in early 2022. Meanwhile, the Copyright Board commenced a new proceeding in July 2022 to determine the rates from 2016 onward. The fees we currently pay the Collectives are not material.
DIFFERENTIAL PRICING RELATED TO INTERNET DATA PLANS
On April 20, 2017, the CRTC released Telecom Regulatory Policy CRTC 2017-104, Framework for assessing the differential pricing practices of Internet service providers, setting out the evaluation
76 | ROGERS COMMUNICATIONS INC. 2022 ANNUAL REPORT
criteria it will apply to determine whether a specific differential pricing practice complies with subsection 27(2) of the Telecommunications Act on a case-by-case basis, as follows:
| • | the degree to which the treatment of data is agnostic (i.e., data is treated equally regardless of its source or nature); |
| • | whether the offering is exclusive to certain customers or certain content providers; |
| • | the impact on Internet openness and innovation; and |
| • | whether there is financial compensation involved. |
Of these criteria, the degree to which data is treated agnostically will generally carry the most weight. The overriding expectation is that all content and applications will be treated in a neutral manner. Zero-rating of account management functions (e.g., monitoring of Internet data usage or the payment of bills online) will generally be permitted.
WHOLESALE INTERNET COSTING AND PRICING
On August 15, 2019, in Telecom Order CRTC 2019-288, Follow-up to Telecom Orders 2016-396 and 2016-448 – Final rates for aggregated wholesale high-speed access services (2019 Order), the CRTC set final rates for facilities-based carriers’ wholesale HAS, including Rogers’ TPIA service. The 2019 Order set final rates for Rogers that are significantly lower than the interim rates that were previously billed and it further determined that these final rates will apply retroactively to March 31, 2016. We do not believe the final rates set by the CRTC are just and reasonable as required by the Telecommunications Act as we believe they are below cost.
On September 13, 2019, Rogers, in conjunction with the other large Canadian cable companies (Cable Carriers), filed a motion for Leave to Appeal pursuant to Section 64(1) of the Telecommunications Act with the Federal Court of Appeal (Court) and an associated motion for an interlocutory Stay of the 2019 Order. On November 22, 2019, the Court granted Leave to Appeal and an interlocutory Stay of the 2019 Order. On September 10, 2020, the Court dismissed the Cable Carriers’ appeal and simultaneously vacated the interlocutory Stay previously granted.
On November 13, 2019, Rogers, again in conjunction with the other Cable Carriers, filed an appeal of the 2019 Order with the Federal Cabinet, pursuant to Section 12(1) of the Telecommunications Act, asking the Cabinet to order the CRTC to reconsider its August 15, 2019 decision in conjunction with the CRTC’s previously announced review of the entire wholesale regulatory framework. On August 15, 2020, the Federal Cabinet recognized that the final rates did not always appropriately balance the policy objectives of the wholesale network and were concerned that they would undermine investment in high-quality networks. They however decided not to refer the matter back to the CRTC, given that the matter was already before them as a result of the review and vary application filed by Rogers and the other Cable Carriers.
On December 13, 2019, Rogers, again in conjunction with the other Cable Carriers, filed an Application with the CRTC seeking review and variance and stay of the 2019 Order pursuant to sections 27(1), 61(2), and 62 of the Telecommunications Act, Part 1 of the Canadian Radio-television and Telecommunications Commission Rules of Practice and Procedure, and Telecommunications
Information Bulletin CRTC 2011-214, Revised Guidelines for review and vary applications. Specifically, we seek:
| a) | review and variance of the methodology and the resulting rates approved for the Cable Carriers’ aggregated wholesale HAS in the 2019 Order in conjunction with the CRTC’s planned review of its approach to setting the rates for wholesale telecommunications services generally; |
| b) | review and variance of the determination in the 2019 Order regarding retroactivity such that any new wholesale rates for Cable Carrier HAS services apply only on a prospective basis; and |
| c) | in the event that the interlocutory stay of the 2019 Order granted by the Federal Court of Appeal is terminated or varied, an interim stay of the 2019 Order pending completion of the CRTC’s determinations in respect of both (a) and (b) above. |
On September 28, 2020, the CRTC issued a Stay of Order 2019-288 pending review of the appropriateness of the rates established in the 2019 Order. On November 12, 2020, Rogers, again in conjunction with the other Cable Carriers, filed a motion for Leave to Appeal the Court’s decision with the Supreme Court of Canada. The Supreme Court of Canada dismissed the request for Leave on February 25, 2021 without reasons.
On May 27, 2021, the CRTC released Telecom Decision CRTC 2021-181 Requests to review and vary Telecom Order 2019-288 regarding final rates for aggregated wholesale high-speed access services (2021 Decision) in which it adopted the interim rates in effect prior to the 2019 Order as the final rates, with certain modifications, including the removal of the supplementary markup of 10% for incumbent local exchange carriers.
On May 28, 2021, a wholesale ISP petitioned the Governor in Council to, among other things, restore the 2019 Order and make the rates established in that order final. In addition, on June 28, 2021, the same wholesale ISP filed a motion seeking leave to appeal the 2021 Decision to the Federal Court of Appeal, which was granted on September 15, 2021. We, along with several other cable companies, have intervened in these matters.
CRTC INTERNET CODE
On July 31, 2019, the CRTC released Telecom Regulatory Policy CRTC 2019-269, The Internet Code, establishing a mandatory code of conduct (Code) for large facilities-based ISPs that applies to the companies’ provision of fixed wireline Internet access services to individual customers. As is the case for the Wireless, Deposit and Disconnection, and Television Service Provider Codes already in place, the CRTC for Complaints for Telecom-television Services Inc. (CCTS) will administer the Code. The Code came into effect on January 31, 2020.
CRTC REVIEW OF WHOLESALE WIRELINE TELECOMMUNICATIONS SERVICES
On July 22, 2015, the CRTC released its decision on the regulatory framework for wholesale wireline services (Telecom Regulatory Policy 2015-326, Review of wholesale wireline services and associated policies), determining which wireline services, and under what terms and conditions, facilities-based telecommunications carriers must make available to other telecommunications service
2022 ANNUAL REPORT ROGERS COMMUNICATIONS INC. | 77
MANAGEMENT’S DISCUSSION AND ANALYSIS
providers, such as resellers. The CRTC determined that wholesale high-speed access services, which are used to support retail competition for services, such as local phone, television, and Internet access, would continue to be mandated. The provision of provincially aggregated services, however, would no longer be mandated and would be phased out in conjunction with the implementation of a disaggregated service with connections at telephone company central offices and cable company head-ends. The requirement to implement disaggregated wholesale high-speed access services will include making them available over fibre-to-the-premises (FTTP) access facilities. Regulated rates will continue to be based on long-run increment cost studies.
On September 20, 2016, the CRTC released Telecom Decision CRTC 2016-379, Follow-up to Telecom Regulatory Policy 2015-326 – Implementation of a disaggregated wholesale high-speed access service, including over fibre-to-the premises access facilities, addressing the technical implementation of new, disaggregated, high-speed access TPIA, a service that will provide access to FTTP facilities as ordered in the CRTC’s July 22, 2015 ruling. The decision is consistent with the positions submitted by Rogers in our filings. Proposed tariffs and supporting cost studies for the new service were filed on January 9, 2017, with further information filed later in 2017 and 2018. A decision on final rates was anticipated in 2020 but was temporarily suspended on June 11, 2020 by CRTC Telecom Notice of Consultation 2020-187, Call for comments – Appropriate network configuration for disaggregated wholesale high-speed access services. Initial comments for this proceeding were filed on October 5, 2020 and reply comments were filed on December 7, 2020.
CRTC REVIEW OF LOCAL AND COMMUNITY PROGRAMMING
On June 15, 2016, the CRTC released Broadcasting Regulatory Policy CRTC 2016-224, Policy framework for local and community television. The CRTC created a new model for BDU contributions to Canadian programming that took effect on September 1, 2017. Annual contributions will remain at 5% of annual gross broadcasting revenues; however, of that amount, in all licensed cable systems, up to 1.5% (rather than the previous 2%) can be used to fund community channel programming. Of this revenue, 0.3% must now go to a newly created Independent Local News Fund for independently owned local TV stations, and the remaining funding will continue to go to the Canada Media Fund and independent production funds. This decision provides the flexibility for BDUs that operate community channels in large markets (Montreal, Toronto, Edmonton, Calgary, and Vancouver) to now direct their community channel revenues from those markets to fund either community channel programming in smaller markets, or to fund local news on TV stations (such as Citytv, in the case of Rogers). Rogers has closed its Greater Toronto Area community channels and redirected these revenues.
TELEVISION SERVICES DISTRIBUTION
Distributors are required to offer customers an option for a small basic service consisting only of Canadian local channels (local radio is optional), national mandatory services, community and provincial legislature channels, and, should they wish, US 4+1 networks. The retail rate for this entry-level service is capped at $25 per month (excluding equipment). Further, all channels above the basic tier
must be offered on an à la carte basis and in smaller, reasonably priced packages. As a BDU, we are permitted to continue to offer our existing basic service and programming packages. Consumers have to be offered, but will not have to receive, a majority of Canadian services.
All licensed programmers and BDUs must also comply with the Wholesale Code. Distributors of foreign services are required to make their channels available on an à la carte basis and in “pick-packs” or smaller pre-assembled packages and abide by the Wholesale Code.
Finally, the CRTC established a Television Service Provider (TVSP) Code of Conduct to govern certain aspects of the relationship between TVSPs and their customers as well as to allow consumers to complain to the Commissioner for Complaints for Telecommunications Services about their providers, which came into effect on September 1, 2017.
ROGERS CABLE TV LICENCE RENEWALS
On August 2, 2018, in Broadcasting Decision CRTC 2018-265, Rogers – Licence renewal for various terrestrial broadcasting distribution undertakings, the CRTC renewed Rogers’ Broadcasting Distribution Undertaking licences in Ontario and Atlantic Canada for a full seven-year licence term with conditions substantially consistent with Rogers’ application.
CRTC PROCEEDING ON FUTURE PROGRAMMING DISTRIBUTION MODELS
On October 12, 2017, prompted by Order in Council P.C. 2017-1195, the CRTC initiated a proceeding (Broadcasting Notice of Consultation CRTC 2017-359, Call for comments on the Governor in Council’s request for a report on future programming distribution models) to report on the distribution model or models of programming that are likely to exist in the future; how and through whom Canadians will access that programming; and the extent to which these models will ensure a vibrant domestic market that is capable of supporting the continued creation, production, and distribution of Canadian programming, in both official languages, including original entertainment and information programming.
On May 30, 2018, the CRTC issued its report on future programming distribution models requested by the government in September 2017 through Order in Council P.C. 2017-1195. The report proposes new tools and regulatory approaches to support the production and promotion of audio and video content made by and for Canadians.
MEDIA
REVIEW OF COMMERCIAL RADIO POLICY
On December 7, 2022, the CRTC released its decision on the review of the Commercial Radio Policy, which had not been updated since 2006. The primary policy consideration put forward by the industry was a relaxation of the Common Ownership Policy, which restricts the number of stations an owner can operate in any individual market as well as the bands (AM/FM) in which they broadcast. The CRTC did not relax its common ownership policy, which remains at 4 in markets served by more than 8 commercial radio stations, and made minor modifications to AM/FM band restrictions to now allow ownership of 3 FM stations in a market.
78 | ROGERS COMMUNICATIONS INC. 2022 ANNUAL REPORT
CRITICAL ACCOUNTING ESTIMATES AND JUDGMENTS
Management makes judgments, estimates, and assumptions that affect how accounting policies are applied, the amounts we report in assets, liabilities, revenue, and expenses, and our related disclosure about contingent assets and liabilities. Significant changes in our assumptions, including those related to our future business plans and cash flows, could materially change the amounts we record. Actual results could be different from these estimates.
These estimates are critical to our business operations and understanding our results of operations. We may need to use additional judgment because of the sensitivity of the methods and assumptions used in determining the asset, liability, revenue, and expense amounts.
ESTIMATES
REVENUE FROM CONTRACTS WITH CUSTOMERS
Determining the transaction price
The transaction price is the amount of consideration that is enforceable and to which we expect to be entitled in exchange for the goods and services we have promised to our customer. We determine the transaction price by considering the terms of the contract and business practices that are customary within that particular line of business. Discounts, rebates, refunds, credits, price concessions, incentives, penalties, and other similar items are reflected in the transaction price at contract inception.
Determining the stand-alone selling price and the allocation of the transaction price
The transaction price is allocated to performance obligations based on the relative stand-alone selling prices of the distinct goods or services in the contract. The best evidence of a stand-alone selling price is the observable price of a good or service when the entity sells that good or service separately in similar circumstances and to similar customers. If a stand-alone selling price is not directly observable, we estimate the stand-alone selling price taking into account reasonably available information relating to the market conditions, entity-specific factors, and the class of customer.
In determining the stand-alone selling price, we allocate revenue between performance obligations based on expected minimum enforceable amounts to which we are entitled. Any amounts above the minimum enforceable amounts are recognized as revenue as they are earned.
FAIR VALUE
We use estimates to determine the fair value of assets acquired and liabilities assumed in an acquisition, using the best available information, including information from financial markets. These estimates include key assumptions such as discount rates, attrition rates, and terminal growth rates for performing discounted cash flow analyses.
LEASES
We estimate the lease term by considering the facts and circumstances that can create an economic incentive to exercise an extension option, or not exercise a termination option. We make certain qualitative and quantitative assumptions when deriving the value of the economic incentive.
USEFUL LIVES
We depreciate the cost of property, plant and equipment over their estimated useful lives by considering industry trends and company-specific factors, including changing technologies and expectations for the in-service period of certain assets at the time. We reassess our estimates of useful lives annually, or when circumstances change, to ensure they match the anticipated life of the technology from a revenue-producing perspective. If technological change happens more quickly, or in a different way, than anticipated, we might have to reduce the estimated life of property, plant and equipment, which could result in a higher depreciation expense in future periods or an impairment charge to write down the value. We monitor and review our depreciation rates and asset useful lives at least once a year and change them if they are different from our previous estimates. We recognize the effect of changes in estimates in net income prospectively.
CAPITALIZING DIRECT LABOUR, OVERHEAD, AND INTEREST
Certain direct labour, overhead, and interest costs associated with the acquisition, construction, development, or improvement of our networks are capitalized to “property, plant and equipment”. The capitalized amounts are calculated based on estimated costs of projects that are capital in nature, and are generally based on a per-hour rate. In addition, interest costs are capitalized during development and construction of certain property, plant and equipment. Capitalized amounts increase the cost of the asset and result in a higher depreciation expense in future periods.
IMPAIRMENT OF ASSETS
Indefinite-life intangible assets (including goodwill and spectrum and/or broadcast licences) are assessed for impairment on an annual basis, or more often if events or circumstances warrant, and finite-life assets (including property, plant and equipment and other intangible assets) are assessed for impairment if events or circumstances warrant. The recoverable amount of a cash-generating unit (CGU) involves significant estimates such as future cash flows, terminal growth rates, and discount rates. If key estimates differ unfavourably in the future, we could experience impairment charges that could decrease net income.
FINANCIAL INSTRUMENTS
The fair values of our derivatives are recorded using an estimated credit-adjusted mark-to-market valuation. If the derivatives are in an asset position (i.e. the counterparty owes Rogers), the credit spread for the bank counterparty is added to the risk-free discount rate to determine the estimated credit-adjusted value. If the derivatives are in a liability position (i.e. Rogers owes the counterparty), our credit
2022 ANNUAL REPORT ROGERS COMMUNICATIONS INC. | 79
MANAGEMENT’S DISCUSSION AND ANALYSIS
spread is added to the risk-free discount rate. The estimated credit-adjusted value of derivatives requires assessment of the credit risk of the parties to the instruments and the instruments’ discount rates.
For all derivative instruments where hedge accounting is applied, we are required to ensure that the hedging relationships meet hedge effectiveness criteria. Hedge effectiveness testing requires the use of both judgments and estimates.
PENSION BENEFITS
When we account for defined benefit pension plans, assumptions are made in determining the valuation of benefit obligations. Assumptions and estimates include the discount rate, the rate of future compensation increase, and the mortality rate. Changes to these primary assumptions and estimates would affect the pension expense, pension asset and liability, and other comprehensive income. Changes in economic conditions, including financial markets and interest rates, may also have an impact on our pension plans, as there is no assurance that the plans will be able to earn the assumed rate of return. Market-driven changes may also result in changes in the discount rates and other variables that could require us to make contributions in the future that differ significantly from the current contributions and assumptions incorporated into the actuarial valuation process.
Below is a summary of the effect an increase or decrease in the primary assumptions and estimates would have had on our accrued benefit obligation as at December 31, 2022.
(In millions of dollars)
| Increase (decrease) in
| |||
Discount rate | ||||
Impact of 0.5% increase |
| (163 | ) | |
Impact of 0.5% decrease |
| 183 |
| |
Rate of future compensation increase | ||||
Impact of 0.25% increase |
| 10 |
| |
Impact of 0.25% decrease |
| (10 | ) | |
Mortality rate | ||||
Impact of 1 year increase |
| 42 |
| |
Impact of 1 year decrease |
| (45 | ) | |
STOCK-BASED COMPENSATION
Stock option plans
Our employee stock option plans attach cash-settled share appreciation rights (SARs) to all new and previously granted options. The SAR feature allows the option holder to elect to receive a cash payment equal to the intrinsic value of the option, instead of exercising the option and acquiring Class B Non-Voting Shares. We measure stock-based compensation to employees at fair value. We determine the fair value of options using our Class B Non-Voting Share price and option pricing models, and record all outstanding stock options as liabilities. The liability is marked to market each period and is amortized to expense using a graded vesting approach over the period during which employee services are rendered, or over the period to the date an employee is eligible to retire, whichever is shorter. The expense in each period is affected by the change in the price of our Class B Non-Voting Shares during the period.
Restricted share unit (RSU) and deferred share unit (DSU) plans
We recognize outstanding RSUs and DSUs as liabilities, measuring the liabilities and compensation costs based on the awards’ fair values, which are based on the market price of the Class B Non-Voting Shares, and recognizing them as charges to “operating costs” over the vesting period of the awards. If an award’s fair value changes after it has been granted and before the exercise date, we recognize the resulting changes in the liability within “operating costs” or “restructuring, acquisition and other”, as applicable, in the year the change occurs. For RSUs, the payment amount is established as of the vesting date. For DSUs, the payment amount is established as of the exercise date.
JUDGMENTS
REVENUE FROM CONTRACTS WITH CUSTOMERS
Distinct goods and services
We make judgments in determining whether a promise to deliver goods or services is considered distinct. We account for individual products and services separately if they are distinct (i.e. if a product or service is separately identifiable from other items in the bundled package and if the customer can benefit from it). The consideration is allocated between separate products and services in a bundle based on their stand-alone selling prices. For distinct items we do not sell separately, we estimate stand-alone selling prices using the adjusted market assessment approach.
Residual value arrangements
Under certain customer offers, we allow customers to defer a component of the device cost until contract termination. We use judgment in determining whether these arrangements constitute revenue-generating arrangements or leases. In making this determination, we use judgment to assess the extent of control over the devices that passes to our customer, including whether the customer has a significant economic incentive at contract inception to return the device at contract termination.
LEASES
We make judgments in determining whether a contract contains an identified asset. The identified asset should be physically distinct or represent substantially all of the capacity of the asset, and should provide us with the right to substantially all of the economic benefits from the use of the asset.
We also make judgments in determining whether or not we have the right to control the use of the identified asset. We have that right when we have the decision-making rights that are most relevant to changing how and for what purpose the asset is used. In rare cases where the decisions about how and for what purpose the asset is used are predetermined, we have the right to direct the use of the asset if we have the right to operate the asset or if we designed the asset in a way that predetermines how and for what purpose the asset will be used.
80 | ROGERS COMMUNICATIONS INC. 2022 ANNUAL REPORT
We make judgments in determining the incremental borrowing rate used to measure our lease liability for each lease contract, including an estimate of the asset-specific security impact. The incremental borrowing rate should reflect the interest that we would have to pay to borrow at a similar term and with a similar security.
Certain of our leases contain extension or renewal options that are exercisable only by us and not by the lessor. At lease commencement, we assess whether we are reasonably certain to exercise any of the extension options based on our expected economic return from the lease. We typically exercise extension options on our network leases, primarily due to the significant cost that would be required to relocate our network towers and related equipment. We periodically reassess whether we are reasonably certain to exercise the options and account for any changes at the date of the reassessment.
USEFUL LIVES AND DEPRECIATION AND AMORTIZATION METHODS
We make significant judgments in choosing methods for depreciating our property, plant and equipment that we believe most accurately represent the consumption of benefits derived from those assets and are most representative of the economic substance of the intended use of the underlying assets.
We amortize the cost of intangible assets with finite lives over their estimated useful lives. We review their useful lives, residual values, and the amortization methods at least once a year.
We do not amortize intangible assets with indefinite lives (spectrum licences, broadcast licences, and certain brand names) as there is no foreseeable limit to the period over which these assets are expected to generate net cash inflows for us. We make judgments to determine that these assets have indefinite lives, analyzing all relevant factors, including the expected usage of the asset, the typical life cycle of the asset, and anticipated changes in the market demand for the products and services the asset helps generate. After review of the competitive, legal, regulatory, and other factors, it is our view that these factors do not limit the useful lives of our spectrum licences, broadcast licences, and certain brand names.
Judgment is also applied in choosing methods for amortizing our intangible assets and program rights that we believe most accurately represent the consumption of those assets and are most representative of the economic substance of the intended use of the underlying assets.
IMPAIRMENT OF ASSETS
We make judgments in determining CGUs and the allocation of goodwill to CGUs or groups of CGUs for the purpose of impairment testing. The allocation of goodwill involves considerable management judgment in determining the CGUs (or groups of CGUs) that are expected to benefit from the synergies of a business combination. A CGU is the smallest identifiable group of assets that generates cash inflows that are largely independent of the cash inflows from other assets or groups of assets. Goodwill and indefinite-life intangible assets are allocated to CGUs (or groups of CGUs) based on the level at which management monitors goodwill, which is not higher than an operating segment. In particular for Media, we have determined that goodwill is
monitored and should be tested for impairment at the Media segment level as a whole, rather than at the underlying business by business level, based on the interdependencies across Media and how it sells and goes to market.
RESTRUCTURING, ACQUISITION AND OTHER COSTS
We make significant judgments in determining the appropriate classification of costs to be included in restructuring, acquisition and other.
HEDGE ACCOUNTING
We make significant judgments in determining whether our financial instruments qualify for hedge accounting, including our determination of hedge effectiveness. These judgments include assessing whether the forecast transactions designated as hedged items in hedging relationships will materialize as forecast, whether the hedging relationships designated as effective hedges for accounting purposes continue to qualitatively be effective, and determining the methodology to determine the fair values used in testing the effectiveness of hedging relationships.
SEGMENTS
We make significant judgments in determining our operating segments. These are components that engage in business activities from which they may earn revenue and incur expenses, for which operating results are regularly reviewed by our chief operating decision makers to make decisions about resources to be allocated and to assess component performance, and for which discrete financial information is available.
INCOME TAXES AND OTHER TAXES
We accrue income and other tax provisions based on information currently available in each of the jurisdictions in which we operate. While we believe we have paid and provided for adequate amounts of tax, our business is complex and significant judgment is required in interpreting how tax legislation and regulations apply to us. Our tax filings are subject to audit by the relevant government revenue authorities and the results of the government audit could materially change the amount of our actual income tax expense, income tax payable or receivable, other taxes payable or receivable, and deferred income tax assets and liabilities and could, in certain circumstances, result in the assessment of interest and penalties.
CONTINGENCIES
Considerable judgment is involved in the determination of contingent liabilities. Our judgment is based on information currently known to us, and the probability of the ultimate resolution of the contingencies. If it becomes probable that a contingent liability will result in an outflow of economic resources, we will record a provision in the period the change in probability occurs. The amount of the loss involves judgment based on information available at that time. Any provision recognized for a contingent liability could be material to our consolidated financial position and results of operations.
ONEROUS CONTRACTS
Judgment is required to determine when we are subject to unavoidable costs arising from onerous contracts. These judgments may include, for example, whether a certain promise is legally binding or whether we may be successful in negotiations with the counterparty.
2022 ANNUAL REPORT ROGERS COMMUNICATIONS INC. | 81
MANAGEMENT’S DISCUSSION AND ANALYSIS
TRANSACTIONS WITH RELATED PARTIES
We have entered into certain transactions in the normal course of business with related parties in which we have an equity interest, being primarily MLSE (primarily broadcasting rights) and Glentel (Wireless distribution support). The amounts received from or paid to these parties were as follows:
Years ended December 31 | ||||||||||||
(In millions of dollars) | 2022 | 2021 | % Chg | |||||||||
Revenue |
| 74 |
|
| 31 |
|
| 139 |
| |||
Purchases |
| 194 |
|
| 180 |
|
| 8 |
| |||
We entered into business transactions with Transcontinental Inc., a company that provides us with printing and prepress services. Isabelle Marcoux, C.M., is chair of the board of Transcontinental Inc. and was a Director of RCI until June 2021, total amounts paid to this related party during the year ended December 31, 2021 was $3 million.
We have also entered into business transactions with companies controlled by our Directors Michael J. Cooper and John C. Kerr, which became related parties in October 2021. These companies include Dream Unlimited Corp. and Vancouver Professional Baseball LLP, respectively. Dream Unlimited Corp. is a real estate company that rents spaces in office and residential buildings. Vancouver Professional Baseball LLP controls the Vancouver Canadians, the Toronto Blue Jays’ High-A affiliate minor league team. Total amounts paid to these related parties were nominal during the period from October 2021 to December 2021 and for the year ended December 31, 2022.
We have also entered into certain transactions with the Trust and companies it controls. These transactions are subject to formal agreements approved by the Audit and Risk Committee. Total amounts paid to these related parties generally reflect the charges to Rogers for occasional business use of aircraft, net of other administrative services, and were less than $1 million for each of 2022 and 2021.
These transactions are measured at the amount agreed to by the related parties, which are also reviewed by the Audit and Risk Committee. The amounts owing are unsecured, interest-free, and due for payment in cash within one month from the date of the transaction.
NEW ACCOUNTING PRONOUNCEMENTS ADOPTED IN 2022
We adopted the following IFRS amendments in 2022. They did not have a material effect on our financial statements.
| • | Amendments to IFRS 3, Business Combinations – Updating a Reference to the Conceptual Framework, updating a reference in IFRS 3 to now refer to the Conceptual Framework. |
| • | Amendments to IAS 16, Property, Plant and Equipment: Proceeds before intended use, prohibiting reducing the cost of property, plant and equipment by proceeds while bringing an asset to capable operations. |
| • | Amendments to IAS 37, Provisions, Contingent Liabilities and Contingent Assets – Onerous Contracts, specifying costs an entity should include in determining the “cost of fulfilling” a potential onerous contract. |
RECENT ACCOUNTING PRONOUNCEMENTS NOT YET ADOPTED
The IASB has issued the following new standard and amendments that will become effective in future years:
| • | IFRS 17, Insurance Contracts, a replacement of IFRS 4, Insurance Contracts, that aims to provide consistency in the application of accounting for insurance contracts (January 1, 2023). |
| • | Amendments to IAS 1, Presentation of Financial Statements – Classification of Liabilities as Current or Non-current, clarifying the classification requirements in the standard for liabilities as current or non-current (January 1, 2023). |
| • | Amendments to IAS 1, Presentation of Financial Statements – Disclosure of Accounting Policies, requiring entities to disclose material, instead of significant, accounting policy information (January 1, 2023). |
| • | Amendments to IAS 8, Accounting Policies – Changes in Accounting Estimates and Errors, clarifying the definition of “accounting policies” and “accounting estimates” (January 1, 2023). |
| • | Amendments to IAS 12, Income Taxes – Deferred Tax related to Assets and Liabilities arising from a Single Transaction, narrowing the scope for exemption when recognizing deferred taxes (January 1, 2023). |
| • | Amendments to IFRS 16, Leases – Lease Liability in a Sale and Leaseback, clarifying subsequent measurement requirements for sale and leaseback transactions for sellers-lessees. (January 1, 2024). |
| • | Amendments to IAS 1, Presentation of Financial Statements – Non-current Liabilities with Covenants, modifying the 2020 amendments to IAS 1 to further clarify the classification, presentation, and disclosure requirements in the standard for non-current liabilities with covenants. (January 1, 2024). |
We do not expect IFRS 17, Insurance Contracts, or the amendments effective January 1, 2023, will have an effect on our consolidated financial statements. We are assessing the impacts, if any, the remaining amendments will have on our consolidated financial statements; however we currently do not expect any material impacts.
82 | ROGERS COMMUNICATIONS INC. 2022 ANNUAL REPORT
We measure the success of our strategy using a number of key performance indicators, which are outlined below. We believe these key performance indicators allow us to appropriately measure our performance against our operating strategy and against the results of our peers and competitors. The following key performance indicators, some of which are supplementary financial measures (see “Non-GAAP and Other Financial Measures”), are not measurements in accordance with IFRS. They include:
| • | subscriber counts; |
| • | Wireless; |
| • | Cable; and |
| • | homes passed (Cable); |
| • | Wireless subscriber churn (churn); |
| • | Wireless mobile phone average revenue per user (ARPU); |
| • | Cable average revenue per account (ARPA); |
| • | Cable customer relationships; |
| • | Cable market penetration (penetration); |
| • | capital intensity; |
| • | total service revenue; |
| • | dividend payout ratios; and |
| • | return on assets. |
Effective January 1, 2022, we are disclosing mobile phone subscribers in Wireless, which represent devices with voice-only or voice-and-data plans. Our previous definition included devices on data-only plans and customers who subscribe to our wireless home phone service. As a result, our definition of ARPU has also shifted to mobile phone ARPU. We also no longer report blended ABPU given the significant adoption of our wireless device financing program resulting in this metric being less meaningful.
In Cable, we have adjusted our definition of an Internet subscriber such that it only includes retail Internet subscribers, representing customers who have Internet service installed and operating, and are being billed directly by us. Our previous definition included third-party Internet access subscribers and Smart Home Monitoring subscribers. We also began reporting Video (consisting of Ignite TV and legacy Television subscribers), Smart Home Monitoring, and Home Phone subscribers in separate categories.
We have updated our 2021 comparative subscriber results for the impact of these changes. Our updated definitions are as follows:
SUBSCRIBER COUNTS
We determine the number of subscribers to our services based on active subscribers. When subscribers are deactivated, either voluntarily or involuntarily for non-payment, they are considered deactivations in the period the services are discontinued. We use subscriber counts to measure our core business performance and ability to benefit from recurring revenue streams. We use homes passed (Cable) as a measure for our potential market penetration within a defined geographical area.
Subscriber count (Wireless)
| • | A wireless subscriber is represented by each identifiable telephone number. |
| • | We report wireless subscribers in two categories: postpaid mobile phone and prepaid mobile phone. Postpaid and prepaid include voice-only subscribers and subscribers with service plans including both voice and data. |
| • | Usage and overage charges for postpaid subscribers are billed a month in arrears. Prepaid subscribers cannot incur usage and/or overage charges in excess of their plan limits or account balance. |
| • | Wireless prepaid subscribers are considered active for a period of 90 days from the date of their last revenue-generating usage. |
Subscriber count (Cable)
| • | Cable retail Internet, Video, and Smart Home Monitoring subscribers are represented by a dwelling unit; Cable Home Phone subscribers are represented by line counts. |
| • | When there is more than one unit in a single dwelling, such as an apartment building, each tenant with cable service is counted as an individual subscriber, whether the service is invoiced separately or included in the tenant’s rent. Institutional units, such as hospitals or hotels, are each considered one subscriber. |
| • | Cable retail Internet, Video, Smart Home Monitoring, and Home Phone subscribers include only those subscribers who have service installed and operating, and who are being billed accordingly. |
| • | Subscriber counts exclude certain business services delivered over our fibre network and data centre infrastructure, and circuit-switched local and long distance voice services and legacy data services where access is delivered using leased third-party network elements and tariffed ILEC services. |
SUBSCRIBER CHURN
Subscriber churn (churn) is a measure of the number of subscribers that deactivated during a period as a percentage of the total subscriber base, usually calculated on a monthly basis. Subscriber churn measures our success in retaining our subscribers. We calculate it by dividing the number of Wireless subscribers that deactivated (usually in a month) by the aggregate numbers of subscribers at the beginning of the period. When used or reported for a period greater than one month, subscriber churn represents the sum of the number of subscribers deactivating for each period divided by the sum of the aggregate number of subscribers at the beginning of each period.
MOBILE PHONE AVERAGE REVENUE PER USER (WIRELESS)
Mobile phone ARPU helps us identify trends and measure our success in attracting and retaining higher-value subscribers. Mobile phone ARPU is a supplementary financial measure. See “Non-GAAP and Other Financial Measures” for an explanation as to the composition of this measure.
AVERAGE REVENUE PER ACCOUNT (CABLE)
Average revenue per account (ARPA) measures total average spending by a single customer account on Cable products. We use it to identify trends and measure our success in attracting and retaining multiple-service accounts. ARPA is also a supplementary financial measure. See “Non-GAAP and Other Financial Measures” for an explanation as to the composition of this measure.
2022 ANNUAL REPORT ROGERS COMMUNICATIONS INC. | 83
MANAGEMENT’S DISCUSSION AND ANALYSIS
CUSTOMER RELATIONSHIPS
Customer relationships are represented by dwelling units where at least one of our Cable services (i.e. retail Internet, legacy television or Ignite TV, and/or home phone) are installed and operating, and the service or services are billed accordingly. When there is more than one unit in one dwelling, such as an apartment building, each tenant with at least one of our Cable services is counted as an individual customer relationship, whether the service is invoiced separately or included in the tenant’s rent. Institutional units, like hospitals or hotels, are each considered one customer relationship.
MARKET PENETRATION
Market penetration (penetration) measures our success at attracting new households to our brands and products within our network footprint. Market penetration is calculated by dividing customer relationships by homes passed. An increasing market penetration rate reflects more new customer relationships than new homes passed.
CAPITAL INTENSITY
Capital intensity allows us to compare the level of our capital expenditures to that of other companies within the same industry. Our capital expenditures do not include expenditures on spectrum licences or additions to right-of-use assets. We use it to evaluate the performance of our assets and when making decisions about capital expenditures. We believe that certain investors and analysts use capital intensity to measure the performance of asset purchases and construction in relation to revenue. Capital intensity is also a supplementary financial measure. See “Non-GAAP and Other Financial Measures” for an explanation as to the composition of this measure.
TOTAL SERVICE REVENUE
We use total service revenue to measure our core business performance from the provision of services to our customers separate from revenue generated from the sale of equipment we have acquired from device manufacturers and resold. Included in this metric is our retail revenue from Today’s Shopping Choice and the Toronto Blue Jays, which are also core to our business. We calculate total service revenue by subtracting equipment revenue from total revenue.
DIVIDEND PAYOUT RATIOS
We calculate the dividend payout ratio by dividing dividends declared for the year by net income or free cash flow for the year. We use dividends as a percentage of net income and free cash flow to conduct analysis and assist with determining the dividends we should pay. Dividend payout ratio of net income and dividend payout ratio of free cash flow are also supplementary financial measures. See “Non-GAAP and Other Financial Measures” for an explanation as to the composition of these measures.
RETURN ON ASSETS
We use return on assets to measure our efficiency in using our assets to generate net income. Return on assets is also a supplementary financial measure. See “Non-GAAP and Other Financial Measures” for an explanation as to the composition of this measure.
84 | ROGERS COMMUNICATIONS INC. 2022 ANNUAL REPORT
NON-GAAP AND OTHER FINANCIAL MEASURES
We use the following “non-GAAP financial measures” and other “specified financial measures” (each within the meaning of applicable Canadian securities laws). These are reviewed regularly by management and the Board in assessing our performance and making decisions regarding the ongoing operations of our business and its ability to generate cash flows. Some or all of these measures may also be used by investors, lending institutions, and credit rating agencies as indicators of our operating performance, of our ability to incur and service debt, and as measurements to value companies in the telecommunications sector. These are not standardized measures under IFRS, so may not be reliable ways to compare us to other companies.
Non-GAAP financial measures | ||||||
| Specified financial measure | How it is useful | How we calculate it | Most directly comparable IFRS financial measure | |||
Adjusted net income | • To assess the performance of our businesses before the effects of the noted items, because they affect the comparability of our financial results and could potentially distort the analysis of trends in business performance. Excluding these items does not imply that they are non-recurring. | Net income add (deduct) restructuring, acquisition and other; loss (recovery) on sale or wind down of investments; loss (gain) on disposition of property, plant and equipment; (gain) on acquisitions; loss on non-controlling interest purchase obligations; loss on repayment of long-term debt; loss on bond forward derivatives; and income tax adjustments on these items, including adjustments as a result of legislative changes. | Net income | |||
Taxes paid and other government payments | • To assess how much cash we pay in taxes and fees to federal, provincial, and municipal governments. | Income taxes paid add unrecoverable sales taxes paid; payroll taxes paid, regulatory and spectrum fees paid; and property and business taxes paid. | Income taxes paid | |||
Free cash flow excluding Shaw financing | • To show how much cash we generate from our operations that is available to repay debt and reinvest in our company excluding the effect of the Shaw senior note financing, as it was issued for a specific purpose and does not contribute to our core business operations. | Cash provided by operating activities add (deduct) (capital expenditures); (interest on borrowings, net and capitalized interest); interest paid; restructuring, acquisition, and other; (program rights amortization); change in net operating assets and liabilities; interest on Shaw senior note financing; and (interest earned on restricted cash and cash equivalents). | Cash provided by operating activities | |||
Adjusted net debt excluding Shaw financing | • We believe this helps investors and analysts analyze the components of our debt and cash balances while taking into account the impact of debt derivatives on our US dollar-denominated debt, excluding the cumulative effect of the Shaw senior note financing as it was issued for the specific purpose of funding the Shaw Transaction, which has not yet closed. | Total long-term debt add (deduct) current portion of long-term debt; deferred transaction costs and discounts; net debt derivative (assets) liabilities associated with issued debt; credit risk adjustment related to net debt derivatives; current portion of lease liabilities; lease liabilities; bank advances (cash and cash equivalents); short-term borrowings; and (restricted cash and cash equivalents); add (deduct) (Shaw senior note financing); restricted cash and cash equivalents; net debt derivative assets (liabilities) related to Shaw senior note financing; (deferred transaction costs paid related to Shaw senior note financing); interest income on restricted cash and cash equivalents; and (interest paid on Shaw senior note financing). | Long-term debt | |||
2022 ANNUAL REPORT ROGERS COMMUNICATIONS INC. | 85
MANAGEMENT’S DISCUSSION AND ANALYSIS
Non-GAAP financial measures | ||||||
| Specified financial measure | How it is useful | How we calculate it | Most directly comparable IFRS financial measure | |||
Capital expenditures excluding Shaw | • To show how much capital investment we make to enhance our core business assets, excluding the effect of integration-related capital expenditures in preparation for the Shaw Transaction, as they are for a specific purpose and do not yet contribute to our core business operations. | Capital expenditures deduct capital expenditures related to Shaw integration activities. | Capital expenditures | |||
Free cash flow excluding Shaw | • To show how much cash we generate from our operations that is available to repay debt and reinvest in our company excluding the effect of the Shaw senior note financing and integration-related capital expenditures in preparation for the Shaw Transaction, as they are for a specific purpose and do not yet contribute to our core business operations. | Cash provided by operating activities add (deduct) (capital expenditures); (interest on borrowings, net and capitalized interest); interest paid; restructuring, acquisition, and other; (program rights amortization); change in net operating assets and liabilities; interest on Shaw senior note financing; (interest earned on restricted cash and cash equivalents); and capital expenditures related to Shaw integration activities. | Cash provided by operating activities | |||
Non-GAAP ratios | ||||
| Specified financial measure | How it is useful | How we calculate it | ||
Adjusted basic earnings per share
Adjusted diluted earnings per share | • To assess the performance of our businesses before the effects of the noted items, because they affect the comparability of our financial results and could potentially distort the analysis of trends in business performance. Excluding these items does not imply that they are non-recurring. | Adjusted net income divided by basic weighted average shares outstanding.
Adjusted net income including the dilutive effect of stock-based compensation divided by diluted weighted average shares outstanding. | ||
Debt leverage ratio excluding Shaw financing | • We believe this helps investors and analysts analyze our ability to service our debt obligations, excluding the effect of specific Shaw senior note financing as it was issued for a specific purpose and does not reflect our ability to service our core business debt obligations. | Adjusted net debt excluding Shaw financing (defined above) divided by 12-month trailing adjusted EBITDA. | ||
| Total of segments measures | ||
| Specified financial measure | Most directly comparable IFRS financial measure | |
| Adjusted EBITDA | Net income | |
| Capital management measures | ||
| Specified financial measure | How it is useful | |
Free cash flow | • To show how much cash we generate that is available to repay debt and reinvest in our company, which is an important indicator of our financial strength and performance. • We believe that some investors and analysts use free cash flow to value a business and its underlying assets. | |
Adjusted net debt | • We believe this helps investors and analysts analyze our debt and cash balances while taking into account the impact of debt derivatives on our US dollar-denominated debt. | |
Debt leverage ratio | • We believe this helps investors and analysts analyze our ability to service our debt obligations. | |
Available liquidity | • To help determine if we are able to meet all of our commitments, to execute our business plan, and to mitigate the risk of economic downturns. | |
86 | ROGERS COMMUNICATIONS INC. 2022 ANNUAL REPORT
| Supplementary financial measures | ||
| Specified financial measure | How we calculate it | |
Adjusted EBITDA margin | Adjusted EBITDA divided by revenue. | |
Wireless mobile phone average revenue per user (ARPU) | Wireless service revenue divided by average total number of Wireless mobile phone subscribers for the relevant period. | |
Cable average revenue per account (ARPA) | Cable service revenue divided by average total number of customer relationships for the relevant period. | |
Capital intensity | Capital expenditures divided by revenue. | |
Return on assets | Net income divided by total assets. | |
Dividend payout ratio of net income | Dividends declared divided by net income. | |
Dividend payout ratio of free cash flow | Dividends declared for the year divided by free cash flow (defined above). | |
RECONCILIATION OF CAPITAL EXPENDITURES EXCLUDING SHAW
Years ended December 31 | ||||||||
| (In millions of dollars) |
2022
|
2021
| ||||||
Capital expenditures |
| 3,075 |
|
| 2,788 |
| ||
Deduct: | ||||||||
Capital expenditures related to Shaw integration activities
|
| (42
| )
|
| –
|
| ||
Capital expenditures excluding Shaw |
| 3,033 |
|
| 2,788 |
| ||
RECONCILIATION OF ADJUSTED EBITDA
Years ended December 31 | ||||||||
| (In millions of dollars) | 2022 | 2021 | ||||||
Net income |
| 1,680 |
|
| 1,558 |
| ||
Add (deduct): | ||||||||
Income tax expense |
| 609 |
|
| 569 |
| ||
Other (income) expense |
| (15 | ) |
| 2 |
| ||
Finance costs |
| 1,233 |
|
| 849 |
| ||
Restructuring, acquisition and other |
| 310 |
|
| 324 |
| ||
Depreciation and amortization |
| 2,576 |
|
| 2,585 |
| ||
Adjusted EBITDA |
| 6,393 |
|
| 5,887 |
| ||
RECONCILIATION OF ADJUSTED NET INCOME
Years ended December 31 | ||||||||
| (In millions of dollars) | 2022 | 2021 | ||||||
Net income |
| 1,680 |
|
| 1,558 |
| ||
Add (deduct): | ||||||||
Restructuring, acquisition and other |
| 310 |
|
| 324 |
| ||
Income tax impact of above items |
| (75 | ) |
| (79 | ) | ||
Adjusted net income |
| 1,915 |
|
| 1,803 |
| ||
RECONCILIATION OF FREE CASH FLOW, FREE CASH FLOW EXCLUDING SHAW FINANCING, AND FREE CASH FLOW EXCLUDING SHAW
Years ended December 31 | ||||||||
| (In millions of dollars) |
2022
|
2021
| ||||||
Cash provided by operating activities |
| 4,493 |
|
| 4,161 |
| ||
Add (deduct): | ||||||||
Capital expenditures |
| (3,075 | ) |
| (2,788 | ) | ||
Interest on borrowings, net and capitalized interest |
| (1,090 | ) |
| (728 | ) | ||
Interest paid |
| 1,054 |
|
| 802 |
| ||
Restructuring, acquisition and other |
| 310 |
|
| 324 |
| ||
Program rights amortization |
| (61 | ) |
| (68 | ) | ||
Change in net operating assets and liabilities |
| 152 |
|
| (37 | ) | ||
Other adjustments 1
|
| (10
| )
|
| 5
|
| ||
Free cash flow |
| 1,773 |
|
| 1,671 |
| ||
Add (deduct): | ||||||||
Interest on Shaw senior note financing |
| 447 |
|
| – |
| ||
Interest earned on restricted cash and cash equivalents
|
| (235
| )
|
| –
|
| ||
Free cash flow excluding Shaw financing |
| 1,985 |
|
| 1,671 |
| ||
Add: | ||||||||
Capital expenditures related to Shaw integration activities
|
| 42
|
|
| –
|
| ||
Free cash flow excluding Shaw
|
| 2,027
|
|
| 1,671
|
| ||
| 1 | Other adjustments consists of post-employment benefit contributions, net of expense, cash flows relating to other operating activities, and other (income) expense from our financial statements. |
2022 ANNUAL REPORT ROGERS COMMUNICATIONS INC. | 87
MANAGEMENT’S DISCUSSION AND ANALYSIS
SUMMARY OF FINANCIAL RESULTS OF LONG-TERM DEBT GUARANTOR
Our outstanding public debt, amounts drawn on our $5.1 billion bank credit and letter of credit facilities, and derivatives are unsecured obligations of RCI, as obligor, and RCCI, as either co-obligor or guarantor, as applicable.
The selected unaudited consolidating summary financial information for RCI for the periods identified below, presented with a separate column for: (i) RCI, (ii) RCCI, (iii) our non-guarantor subsidiaries on a combined basis, (iv) consolidating adjustments, and (v) the total consolidated amounts, is set forth as follows:
Years ended December 31 (unaudited) | RCI 1 | RCCI 1 | Non-guarantor | Consolidating | Total | |||||||||||||||||||||||||||||||||||
(In millions of dollars) | 2022 | 2021 | 2022 | 2021 | 2022 | 2021 | 2022 | 2021 | 2022 | 2021 | ||||||||||||||||||||||||||||||
Selected Statements of Income data measure: | ||||||||||||||||||||||||||||||||||||||||
Revenue |
| – |
|
| – |
|
| 13,200 |
|
| 12,769 |
|
| 2,386 |
|
| 2,073 |
|
| (190 | ) |
| (187 | ) |
| 15,396 |
|
| 14,655 |
| ||||||||||
Net income (loss) |
| 1,680 |
|
| 1,558 |
|
| 1,529 |
|
| 1,528 |
|
| 360 |
|
| 105 |
|
| (1,889 | ) |
| (1,633 | ) |
| 1,680 |
|
| 1,558 |
| ||||||||||
As at December 31 (unaudited) | RCI 1 | RCCI 1,2 | Non-guarantor | Consolidating | Total | |||||||||||||||||||||||||||||||||||
(In millions of dollars) | 2022 | 2021 | 2022 | 2021 | 2022 | 2021 | 2022 | 2021 | 2022 | 2021 | ||||||||||||||||||||||||||||||
Selected Statements of Financial Position data measure: | ||||||||||||||||||||||||||||||||||||||||
Current assets |
| 47,197 |
|
| 29,982 |
|
| 33,845 |
|
| 28,825 |
|
| 9,991 |
|
| 10,089 |
|
| (71,750 | ) |
| (63,067 | ) |
| 19,283 |
|
| 5,829 |
| ||||||||||
Non-current assets |
| 34,499 |
|
| 33,290 |
|
| 30,135 |
|
| 28,959 |
|
| 3,853 |
|
| 3,717 |
|
| (32,115 | ) |
| (29,832 | ) |
| 36,372 |
|
| 36,134 |
| ||||||||||
Current liabilities |
| 36,902 |
|
| 30,993 |
|
| 37,051 |
|
| 32,942 |
|
| 8,972 |
|
| 9,378 |
|
| (73,376 | ) |
| (64,694 | ) |
| 9,549 |
|
| 8,619 |
| ||||||||||
Non-current liabilities |
| 31,890 |
|
| 18,943 |
|
| 5,302 |
|
| 4,960 |
|
| 188 |
|
| 181 |
|
| (1,366 | ) |
| (1,272 | ) |
| 36,014 |
|
| 22,812 |
| ||||||||||
| 1 | For the purposes of this table, investments in subsidiary companies are accounted for by the equity method. |
| 2 | Amounts recorded in current liabilities and non-current liabilities for RCCI do not include any obligations arising as a result of being a guarantor or co-obligor, as the case may be, under any of RCI’s long-term debt. |
88 | ROGERS COMMUNICATIONS INC. 2022 ANNUAL REPORT
FIVE-YEAR SUMMARY OF CONSOLIDATED FINANCIAL RESULTS
| (In millions of dollars, except per share amounts, subscriber count results, churn, ARPU, ARPA, percentages, and ratios) | As at or years ended December 31 | |||||||||||||||||||
| 2022 | 2021 | 2020 | 2019 | 2018 1 | ||||||||||||||||
Revenue | ||||||||||||||||||||
Wireless | 9,197 | 8,768 | 8,530 | 9,250 | 9,200 | |||||||||||||||
Cable | 4,071 | 4,072 | 3,946 | 3,954 | 3,932 | |||||||||||||||
Media | 2,277 | 1,975 | 1,606 | 2,072 | 2,168 | |||||||||||||||
Corporate items and intercompany eliminations | (149 | ) | (160 | ) | (166 | ) | (203 | ) | (204 | ) | ||||||||||
Total revenue | 15,396 | 14,655 | 13,916 | 15,073 | 15,096 | |||||||||||||||
Total service revenue | 13,305 | 12,533 | 11,955 | 12,965 | 12,974 | |||||||||||||||
Adjusted EBITDA | ||||||||||||||||||||
Wireless | 4,469 | 4,214 | 4,067 | 4,345 | 4,090 | |||||||||||||||
Cable | 2,058 | 2,013 | 1,935 | 1,919 | 1,874 | |||||||||||||||
Media | 69 | (127 | ) | 51 | 140 | 196 | ||||||||||||||
Corporate items and intercompany eliminations | (203 | ) | (213 | ) | (196 | ) | (192 | ) | (177 | ) | ||||||||||
Total adjusted EBITDA |
| 6,393 |
|
| 5,887 |
|
| 5,857 |
|
| 6,212 |
|
| 5,983 |
| |||||
Net income | 1,680 | 1,558 | 1,592 | 2,043 | 2,059 | |||||||||||||||
Adjusted net income | 1,915 | 1,803 | 1,725 | 2,135 | 2,241 | |||||||||||||||
Cash provided by operating activities | 4,493 | 4,161 | 4,321 | 4,526 | 4,288 | |||||||||||||||
Free cash flow | 1,773 | 1,671 | 2,366 | 2,278 | 2,134 | |||||||||||||||
Free cash flow excluding Shaw financing | 1,985 | 1,671 | 2,366 | 2,278 | 2,134 | |||||||||||||||
Capital expenditures | 3,075 | 2,788 | 2,312 | 2,807 | 2,790 | |||||||||||||||
Earnings per share | ||||||||||||||||||||
Basic | $ | 3.33 | $ | 3.09 | $ | 3.15 | $ | 3.99 | $ | 4.00 | ||||||||||
Diluted | $ | 3.32 | $ | 3.07 | $ | 3.13 | $ | 3.97 | $ | 3.99 | ||||||||||
Adjusted earnings per share | ||||||||||||||||||||
Basic | $ | 3.79 | $ | 3.57 | $ | 3.42 | $ | 4.17 | $ | 4.35 | ||||||||||
Diluted | $ | 3.78 | $ | 3.56 | $ | 3.40 | $ | 4.15 | $ | 4.34 | ||||||||||
Statements of Financial Position: | ||||||||||||||||||||
Assets | ||||||||||||||||||||
Property, plant and equipment | 15,574 | 14,666 | 14,018 | 13,934 | 11,780 | |||||||||||||||
Goodwill | 4,031 | 4,024 | 3,973 | 3,923 | 3,905 | |||||||||||||||
Intangible assets | 12,251 | 12,281 | 8,926 | 8,905 | 7,205 | |||||||||||||||
Investments | 2,088 | 2,493 | 2,536 | 2,830 | 2,134 | |||||||||||||||
Other assets | 21,711 | 8,499 | 9,401 | 7,427 | 6,894 | |||||||||||||||
Total assets |
| 55,655 |
|
| 41,963 |
|
| 38,854 |
|
| 37,019 |
|
| 31,918 |
| |||||
Liabilities and Shareholders’ Equity | ||||||||||||||||||||
Long-term liabilities | 36,014 | 22,812 | 22,695 | 21,639 | 16,903 | |||||||||||||||
Current liabilities | 9,549 | 8,619 | 6,586 | 5,964 | 6,836 | |||||||||||||||
Total liabilities | 45,563 | 31,431 | 29,281 | 27,603 | 23,739 | |||||||||||||||
Shareholders’ equity | 10,092 | 10,532 | 9,573 | 9,416 | 8,179 | |||||||||||||||
Total liabilities and shareholders’ equity |
| 55,655 |
|
| 41,963 |
|
| 38,854 |
|
| 37,019 |
|
| 31,918 |
| |||||
Subscriber count results (in thousands) 2 | ||||||||||||||||||||
Wireless mobile phone subscribers 3 | 10,647 | 10.013 | n/a | n/a | n/a | |||||||||||||||
Retail Internet subscribers 3,4 | 2,284 | 2,229 | n/a | n/a | n/a | |||||||||||||||
Video subscribers 3,4 | 1,525 | 1,491 | n/a | n/a | n/a | |||||||||||||||
Smart Home Monitoring subscribers 3,4 | 101 | 113 | n/a | n/a | n/a | |||||||||||||||
Home Phone subscribers 3,4 | 836 | 911 | n/a | n/a | n/a | |||||||||||||||
Customer relationships 3,4 | 2,590 | 2,581 | 2,530 | 2,510 | n/a | |||||||||||||||
Additional Wireless metrics 2 | ||||||||||||||||||||
Postpaid mobile phone churn (monthly) 3 | 0.90% | 0.88% | n/a | n/a | n/a | |||||||||||||||
Mobile phone ARPU (monthly) 3 | $ | 57.89 | $ | 56.83 | n/a | n/a | n/a | |||||||||||||
Additional Cable metrics | ||||||||||||||||||||
ARPA (monthly) 3 | $ | 130.12 | $ | 132.58 | $ | 130.70 | $ | 131.71 | n/a | |||||||||||
Penetration 3 | 53.9% | 54.9% | 55.3% | 56.1% | n/a | |||||||||||||||
Additional consolidated metrics | ||||||||||||||||||||
Revenue growth | 5% | 5% | (8)% | —% | —% | |||||||||||||||
Adjusted EBITDA growth | 9% | 1% | (6)% | 4% | 9% | |||||||||||||||
Dividends declared per share | $ | 2.00 | $ | 2.00 | $ | 2.00 | $ | 2.00 | $ | 1.92 | ||||||||||
Dividend payout ratio of net income 2 | 60.1% | 64.8% | 63.4% | 50.0% | 48.0% | |||||||||||||||
Dividend payout ratio of free cash flow 2 | 57.0% | 60.4% | 42.7% | 44.9% | 55.8% | |||||||||||||||
Return on assets 2 | 3.0% | 3.7% | 4.1% | 5.5% | 6.5% | |||||||||||||||
Debt leverage ratio | 3.5 | 3.4 | 3.0 | 2.9 | 2.5 | |||||||||||||||
Debt leverage ratio excluding Shaw financing | 3.1 | 3.4 | 3.0 | 2.9 | 2.5 | |||||||||||||||
| 1 | 2018 reported figures have not been restated applying IFRS 16. |
| 2 | As defined. See “Key Performance Indicators”. |
| 3 | Customer relationships, ARPA, and penetration have not been presented for periods prior to 2019. We commenced using the aforementioned measures as key performance indicators in the first quarter of 2020. Wireless mobile phone subscribers, retail Internet subscribers, Video subscribers, Smart Home Monitoring subscribers, Home Phone subscribers, postpaid mobile phone churn, and mobile phone ARPU have not been presented for periods prior to 2021. We commenced using the aforementioned measures as key performance indicators in the first quarter of 2022, and updated our 2021 comparative subscriber results. See “Key Performance Indicators”. |
| 4 | On September 30, 2020, we acquired approximately 2,000 retail Internet subscribers and customer relationships as a result of our acquisition of Ruralwave Inc. On October 1, 2020, we acquired approximately 5,000 retail Internet subscribers and 6,000 customer relationships as a result of our acquisition of Cable Cable Inc. On September 1, 2021, we acquired approximately 18,000 retail Internet subscribers and 20,000 customer relationships as a result of our acquisition of Seaside Communications. On March 16, 2022, we acquired approximately 3,000 retail Internet subscribers, 2,000 Video subscribers, 1,000 Home Phone subscribers, and 3,000 customer relationships as a result of our acquisition of a small regional cable company in Nova Scotia. None of these subscribers are included in net additions, but they do appear in the ending total balance for the respective years and thereafter. |
2022 ANNUAL REPORT ROGERS COMMUNICATIONS INC. | 89