EXHIBIT 99.1
Slide Presentation dated June 7, 2004
The following slides were presented June 7, 2004 to investors and analysts at the RBC Capital Markets 2004 North American Energy and Power Conference held at the Westin Copley Place Hotel in Boston, Massachusetts.
(Slide 1)
Southwestern Energy Company
Presentation to RBC Capital Markets 2004 North American Energy and Power Conference
June 2004
NYSE: SWN
This slide contains a picture of a snow-capped volcano. The caption above reads "The Power Within." The Company's formula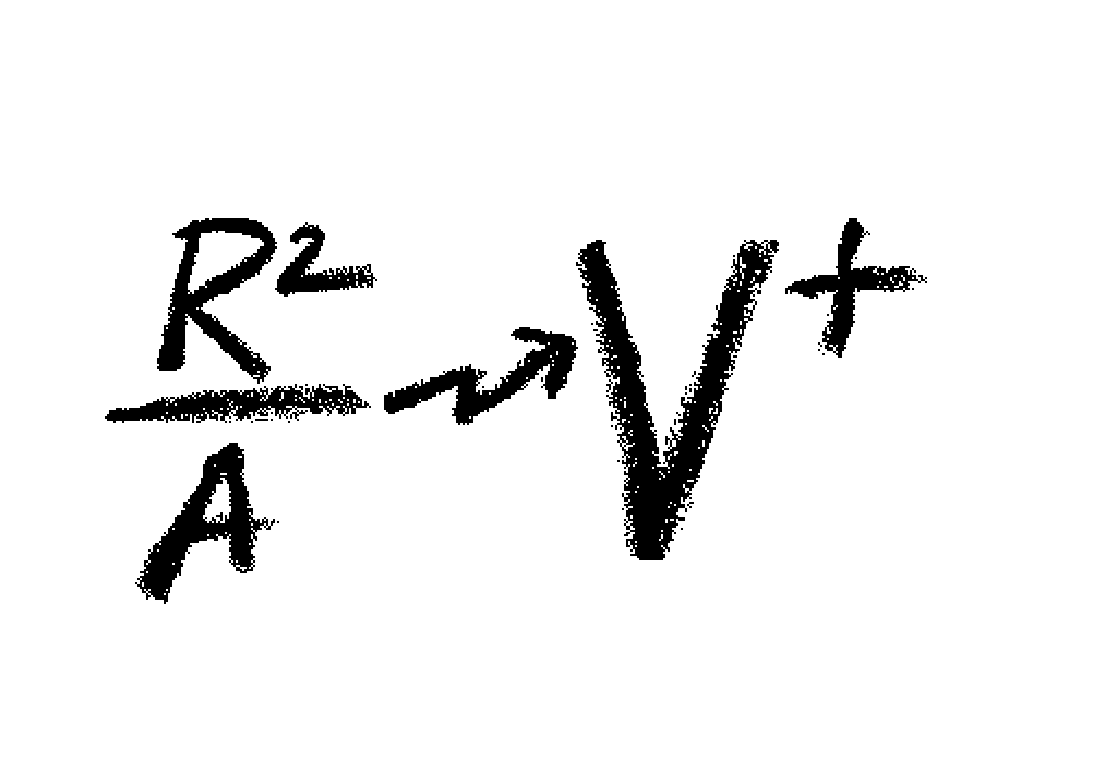 is located in the bottom right corner.
(Slide 2)
Southwestern Energy Company (NYSE: SWN)
General Information
Southwestern Energy Company is an independent energy company primarily focused on the exploration for and production of natural gas. Our strategy is to add at least $1.30 in discounted value for every dollar invested in a focused exploration and production program in the Arkoma and Permian Basins, East Texas and the onshore Gulf Coast.
Market Data as of June 1, 2004
Shares of Common Stock Outstanding | 36,077,888 |
Market Capitalization | $922,000,000 |
Institutional Ownership | 91.6% |
Management Ownership | 7.0% |
52-Week Price Range | $14.41 (07/24/2003) |
| | $26.60 (04/27/2004) |
Investor Contacts
Greg D. Kerley
Executive Vice President and Chief Financial Officer
Phone: | (281) 618-4803 |
Fax: | (281) 618-4820 |
Brad D. Sylvester, CFA
Manager, Investor Relations
Phone: | (281) 618-4897 |
Fax: | (281) 618-4820 |
(Slide 3)
Forward-Looking Statements
This presentation includes certain statements that may be deemed to be "forward-looking statements" within the meaning of Section 27A of the Securities Act of 1933, as amended, and Section 21E of the Securities Exchange Act of 1934, as amended. All statements, other than historical financial information, may be deemed to be forward-looking statements. Although the Company believes the expectations expressed in such forward-looking statements are based on reasonable assumptions, investors are cautioned that any such statements are not guarantees of future performance and that actual results or developments may differ materially from those projected in the forward-looking statements. Important factors that could cause actual results to differ materially from those in the forward-looking statements herein include, but are not limited to, the timing and extent of changes in commodity prices for gas and oil, the timing and extent of the Company's success in discovering, developing, producing, a nd estimating reserves, property acquisition or divestiture activities that may occur, the effects of weather and regulation on the Company's gas distribution segment, increased competition, legal and economic factors, governmental regulation, the financial impact of accounting regulations and critical accounting policies, changing market conditions, the comparative cost of alternative fuels, conditions in capital markets and changes in interest rates, availability of oil field services, drilling rigs, and other equipment, as well as other factors beyond the Company's control. For additional information with respect to certain of these and other factors, see the reports filed by the Company with the Securities and Exchange Commission. The Company disclaims any intention or obligation to update or revise any forward-looking statements, whether as a result of new information, future events, or otherwise. Without limiting the foregoing, all financial information and strategies contained herein have been prepa red by the Company and are based on a number of assumptions that are subject to significant uncertainties and contingencies, many of which are beyond the Company's control. There can be no assurance that the assumptions will prove to be accurate or that the amounts included in the projections will be realized or transactions currently contemplated in strategies will be completed, and actual future results may be materially higher or lower than those shown.
(Slide 4)
About Southwestern
| * Focused on domestic production of natural gas. |
| | * 503 Bcfe of reserves; 91% natural gas; 12.2 R/P at year-end 2003. |
| |
| * Track record of adding significant reserves at low costs. |
| | * Since 1999, we've averaged production growth of 6% per year, 230% reserve replacement, F&D cost of $1.10 per Mcfe. |
| | |
| * E&P strategy built on organic growth through the drillbit. |
| | * Approximately 80% of 2004 planned E&P capital allocated to drilling. |
| | |
| * Proven management team has increased Southwestern's market capitalization from $187 million at year-end 1998 to approximately $900 million today. |
| |
| * Strategy built on the Formula: |
| | The Right People doing the Right Things, wisely investing the cash flow from the underlying Assets will create Value+. |
(Slide 5)
2003 Highlights
| * Follow-on equity offering completed in March 2003. Raised $103 million to accelerate development drilling at Overton Field and reduce debt. |
| * Improved our debt-to-capital ratio to 45% at 12/31/03 from 66% at 12/31/02. |
| | |
| * Record operating and financial results. |
| | * Record reserve additions of 144.5 Bcfe, replacing 351% of production. |
| | * Reserve growth of 21% to 503 Bcfe. |
| | * Record production of 41.2 Bcfe. |
| | * Received $4.1 million annual rate increase for utility. |
| | * Record net income of $48.9 million. |
| | * Record EBITDA(1) of $152.3 million. |
| | |
| * New $300 million revolving credit facility put in place January 2004. |
(1) EBITDA is a non-GAAP financial measure. See explanation and reconciliation of non-GAAP financial measures on pages 30 and 31.
(Slide 6)
Proven Track Record
This slide contains bar charts for the periods ended December 31.
| 1999 | 2000 | 2001 | 2002 | 2003 |
Production (Bcfe) | 32.9 | 35.7 | 39.8 | 40.1 | 41.2 |
Reserve Replacement | 150% | 196% | 224% | 209% | 351% |
EBITDA ($MM)(1) | $76.1 | $103.2 | $134.6 | $99.8 | $152.3 |
F&D Cost ($/Mcfe) | $1.20 | $0.99 | $1.11 | $1.02 | $1.18 |
Note: Reserve data excludes reserve revisions.
(1) EBITDA is a non-GAAP financial measure. See explanation and reconciliation of non-GAAP financial measures on pages 30 and 31.
(Slide 7)
E&P Focused
This slide contains a map of Arkansas, Louisiana, Oklahoma, Texas and New Mexico with shadings to denote the Arkoma and Permian Basins, the Gulf Coast region and the East Texas region. Lines trace gas distribution pipelines and the Ozark Pipeline.
E&P Segment
| * 2003 Reserves: 503 Bcfe |
| * 91% Natural Gas |
| * 82% Proved Developed |
| * Reserve Life: 12.2 years |
| * 2003 Production: 41.2 Bcfe |
Arkoma
| * Reserves - 211.7 Bcf (42%) |
| * Production - 18.9 Bcf (46%) |
| * Maintain our strong position through low-risk development drilling and workovers. |
East Texas (Overton)
| * Reserves - 196.3 Bcfe (39%) |
| * Production - 13.6 Bcfe (33%) |
| * Grow through low-risk infill drilling. |
Gulf Coast
| * Reserves - 39.5 Bcfe (8%) |
| * Production - 4.5 Bcfe (11%) |
| * Reduce our high-risk exploration. |
Permian
* Reserves - 55.6 Bcfe (11%) |
* Production - 4.2 Bcfe (10%) |
* Focus on medium-risk exploration. |
Utility Segment
| * 142,000 customers in N. Arkansas |
| * 6th fastest growing region in U.S. |
| * Received $4.1 MM annual rate increase Oct. 2003 |
(Slide 8)
Capital Investments
This slide contains a bar chart of Company capital investments, summarized as follows:
| | | | | 2004 |
| 2001 | | 2002 | 2003 | Plan |
| | ($ in millions) |
Utility & Corporate | $7.1 | | $6.9 | $9.3 | $9.5 |
Property Acquisitions | $0.7 | | $0.1 | - | - |
Cap. Exp. & Other | $9.9 | | $10.9 | $12.4 | $19.3 |
Leasehold & Seismic | $9.8 | | $9.2 | $19.0 | $18.0 |
Development Drilling | $44.2 | | $46.3 | $119.7 | $162.3 |
Exploration Drilling | $20.8 | | $18.7 | $19.8 | $29.9 |
Total | $92.5 | (1) | $92.1 | $180.2 | $239.0 |
This slide also contains a pie chart of Company capital investments by area of operation, summarized as follows:
| % of Total |
| Capital Investments |
East Texas | 54% |
Arkoma | 21% |
Gulf Coast | 6% |
Permian | 5% |
Other E&P | 10% |
Utility | 4% |
| * E&P capital program heavily weighted to low-risk drilling in 2004: |
| | * Low-risk East Texas ($124.4 MM, 54%) and Arkoma ($51.2 MM, 21%) |
| | * Medium-risk Permian Basin ($11.8 MM, 5%) and |
| | * Higher-risk, but larger potential Gulf Coast ($13.5 MM, 6%). |
| | |
| * Invested $11.0 MM in 2003 to acquire 345,300 acres in "New Venture" areas. |
| | * Acquired additional 95,000 acre CBM project in Montana in early 2004. |
| | * Plan to invest additional $23.7 MM in 2004. |
| | |
| * 84% of E&P capital allocated to drilling in 2004. |
(1) Net of $13.5 million reimbursement from Overton Field partnership.
Note that the information contained on this slide constitutes a "forward-looking statement".
(Slide 9)
East Texas - Overton Field
This slide contains a map of Smith County, Texas where the Overton Field is located. Existing wells at year-end 2002, 2003 development wells, and future development locations are denoted. It is stated that the Overton Field contains 17,900 acres and the South Overton Farm-in Acreage contains 6,500 acres.
| * Purchased original 10,800 acres and 16 producing wells for $6.1 million in 2000 (developed at 640-acre spacing). |
| |
| * Drilled 90 wells in 2001-2003 with 100% success. |
| |
| * Plan to drill 74 wells in 2004, a portion of which will be at 40-acre spacing. |
| |
| * A large portion of the field will likely require 40-acre spaced wells to adequately develop the field. |
Overton Field reserve potential:
| | Approx. | Reserve |
| Well | Spacing | Potential |
| Count | (Acres) | (Net Bcfe) |
Original Wells | 16 | 640 | 22 |
2001 - 2002 Development | 33 | 365 | 89 |
2003 Development | 57 | 170 | 102 |
Planned 2004 Development | 74 | 100 | 105 |
| | | |
Potential Future Development | 76 | <80 | 97 |
| 256 | <80 | 415 |
Overton Field Three-Year Average Results:
Reserve Replacement: | | 902% |
LOE Cost (incl. Taxes) ($/Mcfe): | | $0.46 |
F&D Cost ($/Mcfe): | | $0.82 |
Note that the information contained on this slide constitutes a "forward-looking statement".
(Slide 10)
Overton Field Gross Production
The graph contained in this slide displays the Overton Field gross production rate (MMcfe/d) from the year 2000 to the current period in 2004 and the potential gross production rate for 2004 under both an accelerated drilling program and under an eighteen well per year program.
Overton Field Net Production:
| Bcfe |
2000 | 0.3 |
2001 | 2.3 |
2002 | 5.9 |
2003 | 13.6 |
2004 Forecast | 19 - 21 |
Note that the information contained on this slide constitutes a "forward-looking statement".
(Slide 11)
Overton Field - Improved Drilling Results
This slide portrays the improved drilling rate in the Overton Field since its purchase from Fina in 2001. Fina's average drilling rate was 55 days. Upon the Field's purchase in 2001 we decreased that rate to 35 days. It was further decreased to 27 days in 2002 and 23 days in 2003.
| * Reduced drilling time by >50%. |
| |
| * Increased initial production by 200%. |
| |
| * Increased gross reserves by 60% (avg. EUR of 2.2 Bcfe per well in 2003). |
Note that the information contained on this slide constitutes a "forward-looking statement".
(Slide 12)
Arkoma Basin
This slide contains a map of Arkansas and Oklahoma with shading to denote the Arkoma Basin. The Ranger Anticline, Haileyville and the area known as the Fairway are further noted.
| * "Legacy asset" that provides SWN with a stable production/reserve base and low-risk drilling opportunities with some upside exploration potential. |
| | |
| * Competitive advantages: |
| | * 60+ years of experience in the basin. |
| | * Large acreage position of 367,000 gross acres and 256,000 net acres. |
| | |
| * 2004 capital program includes drilling over 80 wells and 95 workovers. |
Arkoma Basin Three-Year Average Results:
Reserve replacement: | 116% |
LOE cost (incl. Taxes) ($/Mcf): | $0.38 |
F&D cost ($/Mcf): | $1.14 |
Ranger Anticline:
Success: | 28/34 wells |
Net EUR: | 33.1 Bcf |
F&D/Mcf: | $.85 |
Haileyville:
Success: | 23/31 wells |
Net EUR: | 11.4 Bcf |
F&D/Mcf: | $.75 |
Note that the information contained on this slide constitutes a "forward-looking statement".
(Slide 13)
Ranger Anticline
This slide contains a map of the Ranger Anticline prospect with the Company's exploratory acreage and acreage held by production designated with shading. Also shown are SWN's successful wells at 12/31/03, 2004 proposed wells, the Smith #1-10, the Dulyea #1-10 and the Doggle #2-15 wells waiting on pipeline, the Albright #1-7 producing well and the Moua #1-10 plugged and abandoned.
Ranger Anticline:
Success: | 28/34 wells |
Net EUR: | 33.1 Bcf |
F&D/Mcf: | $.85 |
| * In early 2003 received approval to downspace field to 80 acres per well. |
| |
| * Large acreage position of 4,400 gross developed acres and 37,100 gross exploratory acres. |
| |
| * Average working interest 50% - 100%. |
| |
| * SWN plans to drill up to 20 wells in area in 2004. |
| |
| * Area has significant upside potential. |
Ranger Anticline Potential on Held by Production Acreage:
| | | Approx. | Reserve |
| | Well | Spacing | Potential |
| | Count | (Acres) | (Net Bcfe) |
Producing Wells at 12/31/02 | 13 | 320 | 17 |
Successful Wells in 2003 | 9 | 180 | 12 |
2004 Development Wells | 7 | 150 | 6 |
| | | | |
Potential Future Locations | | | |
Prob/Poss Locations | 24 | 80 | 19 |
TOTAL | 53 | 80 | 54 |
Note that the information contained on this slide constitutes a "forward-looking statement".
(Slide 14)
Focused on Adding Value
Typical First Year Economics:(1) | | Overton Well | | Ranger Well |
| | | (per Mcfe) | | (per Mcf) |
| | | | | |
Revenues | | $4.00 | | $4.00 |
Production costs | | $0.30 | | $0.20 |
Cash netback | | $3.70 | | $3.80 |
F&D costs | | $0.85 | | $0.80 |
| | | | | |
Total Life Economics: | | | | |
| | | | | |
Completed Well Cost(2) | | $1.5 million | | $1.0 million |
Pretax ROR(3) | | 30% | | 35% |
Pretax PVI(3) | | 1.8 | | 2.2 |
Note: Our ability to achieve our target PVI results are dependent upon the current and future market prices for natural gas and crude oil, costs associated with producing natural gas and crude oil and our ability to add reserves at an acceptable cost.
(1) Data based upon results of 2003 drilling program.
(2) Current completed well cost estimate.
(3) Assumes $4.00 per Mcf flat pricing and gross EUR of 2.2 Bcfe per Overton well and gross EUR of 1.8 Bcf per Ranger well.
Note that the information contained on this slide constitutes a "forward-looking statement".
(Slide 15)
2004 Exploration
This slide contains a map of Arkansas, Louisiana, Oklahoma, Texas and New Mexico with shading to denote areas of Company involvement. South Louisiana and New Mexico are further designated as areas of exploration. An exploded map of a portion of New Mexico details the River Ridge discovery. The Rio Blanco 33 #1 producing well, the Rio Blanco 33 #2 drilling well and the Rio Blanco #4-1 producing well are also shown.
| * South Louisiana: |
| | * 9/21 successful wildcats drilled since 1999. |
| | * Plan to drill 2 wildcats in 2004. |
| | |
| * Gulf Coast exploration: |
| | * Reducing our exposure to high-risk exploration in South Louisiana. |
| | * 2004 program includes drilling 2 exploration wells. |
| |
* River Ridge prospect, Lea County, New Mexico: |
| | * Gross reserve potential of 50+ Bcfe. |
Note that the information contained on this slide constitutes a "forward-looking statement".
(Slide 16)
How Have We Been Doing?
The graph contained on this slide shows F&D cost ($/Mcfe), reserve replacement (%) and PVI ($/$) after new management, a new E&P team and a new strategy were implemented in 1997.
| 1997 | 1998 | 1999 | 2000(1) | 2001 | 2002 | 2003 |
F&D cost ($/Mcfe) | $2.53 | $1.10 | $1.20 | $.99 | $1.11 | $1.02 | $1.18 |
Reserve replacement (%) | 77% | 129% | 150% | 196% | 224% | 209% | 351% |
PVI ($/$) | $ .56 | $1.17 | $1.07 | $1.30 | $1.40 | $1.33 | $1.42 |
Note: All metrics calculated exclude reserve revisions.
(1) PVI metrics calculated using pricing in effect at year-end (except for 2000 which was calculated at $3.00 per Mcf natural gas price).
(Slide 17)
Outlook for 2004
| * Production target of 47.5 - 50.0 Bcfe in 2004 (estimated growth of 15 - 20%). |
| 2003 Actual | 2004 Guidance NYMEX Price Assumptions |
| $5.39 Gas(1) | $5.00 Gas | $6.00 Gas |
| $30.83 Oil(1) | $26.00 Oil | $26.00 Oil |
Net Income | $48.9 MM | $69 - $72 MM | $87 - $90 MM |
EPS | $1.43 | $1.90 - $2.00 | $2.40 - $2.50 |
Operating Income | $97.3 MM | $132 - $135 MM | $162 - $165 MM |
Cash Flow(2) | $132.3 MM | $184 - $187 MM | $213 - $216 MM |
EBITDA(2) | $152.3 MM | $200 - $203 MM | $230 - $233 MM |
Note: Per share estimates for 2004 assume 36.2 million weighted average diluted shares outstanding.
(1) The average realized prices for our gas and oil production, after the effect of commodity hedge losses and basis differentials, were $4.20 per Mcf and $26.72 per Bbl, respectively, in 2003.
(2) Cash Flow and EBITDA are non-GAAP financial measures. See explanation and reconciliation of non-GAAP financial measures on pages 30 and 31.
Note that the information contained on this slide constitutes a "forward-looking statement".
(Slide 18)
Gas Hedges in Place Through 2005
This slide contains a bar chart detailing gas hedges in place by quarter for the years 2004 and 2005. A summary of these outstanding gas hedges is as follows:
| | | Average Price per Mcf | Percent of Total |
| Type | Hedged Volumes | (or Floor/Ceiling) | Production Hedged |
2004 | Swaps | 7.2 Bcf | $4.00 | 15 - 20% |
| Collars | 26.0 Bcf | $3.92 / $6.62 | 50 - 55% |
2005 | Swaps | 11.0 Bcf | $4.87 | - |
| Collars | 19.0 Bcf | $4.51/ $7.01 | - |
Note: Southwestern has approximately 426,000 barrels of oil hedged at a fixed WTI price of $28.39 per barrel in 2004 and 240,000 barrels of oil hedged at a fixed WTI price of $30.05 per barrel in 2005.
Note that the information contained on this slide constitutes a "forward-looking statement".
(Slide 19)
The Road to V+
| * Invest in the Highest PVI Projects. |
| | * Accelerate Overton Development. |
| | * Accelerate Ranger Anticline Development. |
| | |
| * Maximize Cash Flow. |
| | |
| * Stay the Course with Our Focused Strategy. |
| | |
| * Deliver the Numbers. |
| | * Production and Reserve Growth. |
| | * Add Value for Every Dollar Invested. |
| | |
| * Continue to Tell Our Story. |
(Slide 20)
Appendix
(Slide 21)
Financial & Operational Summary
This slide contains a table that summarizes the Company's financial and operational indicators.
| | Quarter Ended March 31, | | Year Ended December 31, |
| 2004 | 2003 | | 2003 | 2002 | 2001 | 2000(1) |
| ($ in millions, except per share amounts) |
| | | | | | | |
Revenues | $119.8 | $98.7 | | $327.4 | $261.5 | $344.9 | $363.9 |
EBITDA(2) | 59.3 | 39.8 | | 152.3 | 99.8 | 134.6 | 103.2 |
Net Income | 24.5 | 13.6 | | 48.9 | 14.3 | 35.3 | 20.5 |
Cash Flow(2) | 56.5 | 36.7 | | 132.3 | 79.8 | 112.7 | 82.4 |
Diluted EPS | $0.67 | $0.47 | | $1.43 | $0.55 | $1.38 | $0.82 |
| | | | | | | | |
Production (Bcfe) | 11.4 | 8.9 | | 41.2 | 40.1 | 39.8 | 35.7 |
Avg. Gas Price ($/Mcf) | $4.92 | $4.15 | | $4.20 | $3.00 | $3.85 | $2.88 |
Avg. Oil Price ($/Bbl) | $28.43 | $27.69 | | $26.72 | $21.02 | $23.55 | $22.99 |
| | | | | | | | |
Finding Cost ($/Mcfe)(3) | | | | $1.18 | $1.02 | $1.11 | $0.99 |
Reserve Replacement (%)(3) | | | | 351% | 209% | 224% | 196% |
(1) Before the effects of unusual and extraordinary items.
(2) Cash Flow and EBITDA are non-GAAP financial measures; see explanation and reconciliation of non-GAAP financial measures on pages 30 and 31.
(3) Excluding reserve revisions.
(Slide 22)
SWN is One of the Lowest Cost Operators
This slide contains a bar graph that compares SWN to its competitors in terms of lifting cost per Mcfe of production (3 year average).
| | | Lifting Cost per Mcfe |
| | | of Production |
| | | (3 year average) |
| | | |
Burlington Resources | | $0.57 |
Southwestern Energy Company | | $0.62 |
| Equitable Resources | | $0.63 |
EOG Resources | | $0.65 |
Kerr-McGee | | $0.69 |
ONEOK | | $0.72 |
Apache | | $0.79 |
Noble Energy | | $0.81 |
| Amerada Hess | | $0.83 |
National Fuel Gas | | $0.84 |
Anadarko Petroleum | | $0.85 |
Murphy Oil | | $0.87 |
XTO Energy | | $0.89 |
| Devon Energy | | $0.90 |
MDU Resources | | $0.95 |
Occidental Petroleum | | $0.99 |
| Marathon Oil | | $1.01 |
| Energen | | $1.15 |
This slide also contains a bar graph comparing SWN to its competitors in terms of drillbit F&D cost per Mcfe (3 year average).
| | | Drillbit F&D Cost |
| | | per Mcfe |
| | | (3 year average) |
| | | |
XTO Energy | | $0.81 |
Occidental Petroleum | | $0.86 |
| MDU Resources | | $1.03 |
| Energen | | $1.05 |
Southwestern Energy Company | | $1.11 |
EOG Resources | | $1.19 |
Apache | | $1.32 |
Burlington Resources | | $1.37 |
| ONEOK | | $1.47 |
Anadarko Petroleum | | $1.51 |
Kerr-McGee | | $1.63 |
| Equitable Resources | | $1.67 |
Noble Energy | | $1.71 |
Marathon Oil | | $2.30 |
| National Fuel Gas | | $2.32 |
| Murphy Oil | | $2.76 |
Devon Energy | | $3.18 |
Amerada Hess | | $3.54 |
Source: John S. Herold Database
Note: All data as of December 31, 2001, 2002, and 2003.
(Slide 23)
Ranger Anticline
This slide contains a vertical cross-section of the Ranger Anticline area with shading to denote upper and lower borum.
| * Thrust faulted/anticlinal Atokan sand play. |
| |
| * Repeat sections of tight gas sands. |
| |
| * Natural fractures that enhance productivity. |
Note that the information contained on this slide constitutes a "forward-looking statement".
(Slide 24)
U.S. Gas Consumption and Sources
This slide displays U.S. gas production versus U.S. gas consumption from 1975 to the present. Net gas imports for the same period are also given. U.S. gas production has been basically flat since 1994.
Source: EIA
(Slide 25)
U.S. Gas Production Decline Rate
This graph portrays U.S. natural gas production history. The graph indicates a 29% 2004 decline rate.
| | Production Decline Rate of Base |
1990 | | 17% | |
1991 | | 17% | |
1992 | | 16% | |
1993 | | 18% | |
1994 | | 19% | |
1995 | | 19% | |
1996 | | 20% | |
1997 | | 21% | |
1998 | | 23% | |
1999 | | 23% | |
2000 | | 25% | |
2001E | | 24% | |
2002E | | 27% | |
2003E | | 28% | |
| 2004E | | 29% | |
Utilized data supplied by IHS Energy; Copyright 1990 - 2004 IHS Energy
Chart prepared by and property of EOG Resources, Inc.; Copyright 2002 - 2004
(Slide 26)
U.S. Electricity Consumption on the Rise
This line graph shows an increase in U.S. electricity consumption in billion kilowatt-hours per month from 1990 to 2004.
Source: Edison Electric Institute
(Slide 27)
NYMEX Gas Prices
This line graph represents NYMEX gas prices in $/Mcf from 2000 to 2004.
Source: Bloomberg
(Slide 28)
U.S. Gas Drilling
This line graph denotes the number of rigs drilling for gas through the period 1988 to 2004.
Source: Baker Hughes
(Slide 29)
West Texas Intermediate Oil Prices
This line graph shows the price of West Texas Intermediate oil in $/Bbl for the years 2000 to 2004.
Source: Bloomberg
(Slide 30)
Oil and Gas Price Comparison
This line graph compares the prices of Henry Hub natural gas and WTI crude oil in $/MMBtu and $/Bbl respectively for the period 1994 to 2004.
Source: Bloomberg
(Slide 31)
Explanation and Reconciliation of Non-GAAP Financial Measures: Cash Flow
Net cash provided by operating activities before changes in operating assets and liabilities is presented because of its acceptance as an indicator of an oil and gas exploration and production company's ability to internally fund exploration and development activities and to service or incur additional debt. The company has also included this information because changes in operating assets and liabilities relate to the timing of cash receipts and disbursements which the company may not control and may not relate to the period in which the operating activities occurred. Net cash provided by operating activities before changes in operating assets and liabilities should not be considered in isolation or as a substitute for net cash provided by operating activities prepared in accordance with generally accepted accounting principles. The company does not forecast changes in operating assets and liabilities and, therefore, a reconciliation of the company's 2004 forecasted net cash provided by o perating activities before changes in operating assets and liabilities to net cash provided by operating activities is not provided. However, the table below reconciles net cash provided by operating activities before changes in operating assets and liabilities with net cash provided by operating activities as derived from the company's historical financial information.
| 12 Months Ended December 31, |
| 2003 | 2002 | 2001 | 2000 | |
Net Cash provided by operating activities | $109,099 | $77,574 | $144,583 | $(28,917) | |
Add back: | | | | | |
Change in operating assets and liabilities | | | | | |
Net cash provided by operating activities before | | | | | |
Changes in operating activities and liabilities | | | | | (1) |
(1) Net cash provided by operating activities before changes in operating assets and liabilities for 2000 would have been $58.1 million excluding the effects of unusual items for the Hales judgment and other litigation.
(Slide 32)
Explanation and Reconciliation of Non-GAAP Financial Measures: EBITDA
EBITDA is defined as net income plus interest, income tax expense, depreciation, depletion and amortization. Southwestern has included information concerning EBITDA because it is used by certain investors as a measure of the ability of a company to service or incur indebtedness and because it is a financial measure commonly used in the energy industry. EBITDA should not be considered in isolation or as a substitute for net income, net cash provided by operating activities or other income or cash flow data prepared in accordance with generally accepted accounting principles or as a measure of the company's profitability or liquidity. EBITDA as defined above may not be comparable to similarly titled measures of other companies. Net income is a financial measure calculated and presented in accordance with generally accepted accounting principles. The table below reconciles EBITDA as defined with net income as derived from the company's historical financial information.
| | 12 Months Ended December 31, |
| | 2003 | | 2002 | 2001 | 2000 | |
| | | | | | | |
Net income | $48,897 | | $14,311 | $35,324 | $20,461 | (1) |
Depreciation, depletion and amortization(2) | 57,762 | | 55,352 | 53,641 | 46,622 | |
Net interest expense | 17,311 | | 21,466 | 23,699 | 24,689 | |
Provision for income taxes | | (3) | | | | |
EBITDA | | | | | | (1) |
(1)Amounts exclude unusual and extraordinary items.
(2) Depreciation, depletion and amortization includes the amortization of restricted stock issued under the company's incentive compensation plan.
(3)Provision for income taxes for 2003 includes the tax benefit associated with the cumulative effect of adoption of accounting principle.
The table below reconciles EBITDA with net income assuming different NYMEX price scenarios and their corresponding estimated impact on the company's results for 2004, including current hedges in place, as of February 19, 2004:
| | 2004 Guidance |
| | NYMEX Commodity Price Assumptions |
| | $5.00 Gas | $6.00 Gas |
| | $26.00 Oil | $26.00 Oil |
| ($ in millions) |
Net Income | $69 - $72 | $87 - $90 |
Add back: | | |
Provision for income taxes - deferred | 43 - 44 | 54 - 55 |
Interest expense | 17 - 19 | 17 - 19 |
Depreciation, depletion, amortization | | |
EBITDA | | |