EXHIBIT 99.1
Slide Presentation dated May 14, 2007
The following slides will be presented to investors.
(Cover)
Southwestern Energy Company
Presentation to
Bank of America 2007 Smid Cap Conference
May 2007
NYSE: SWN
The left side of this slide contains a close-up picture of a leaf. The caption above reads "Stimulating Growth." The Company's formula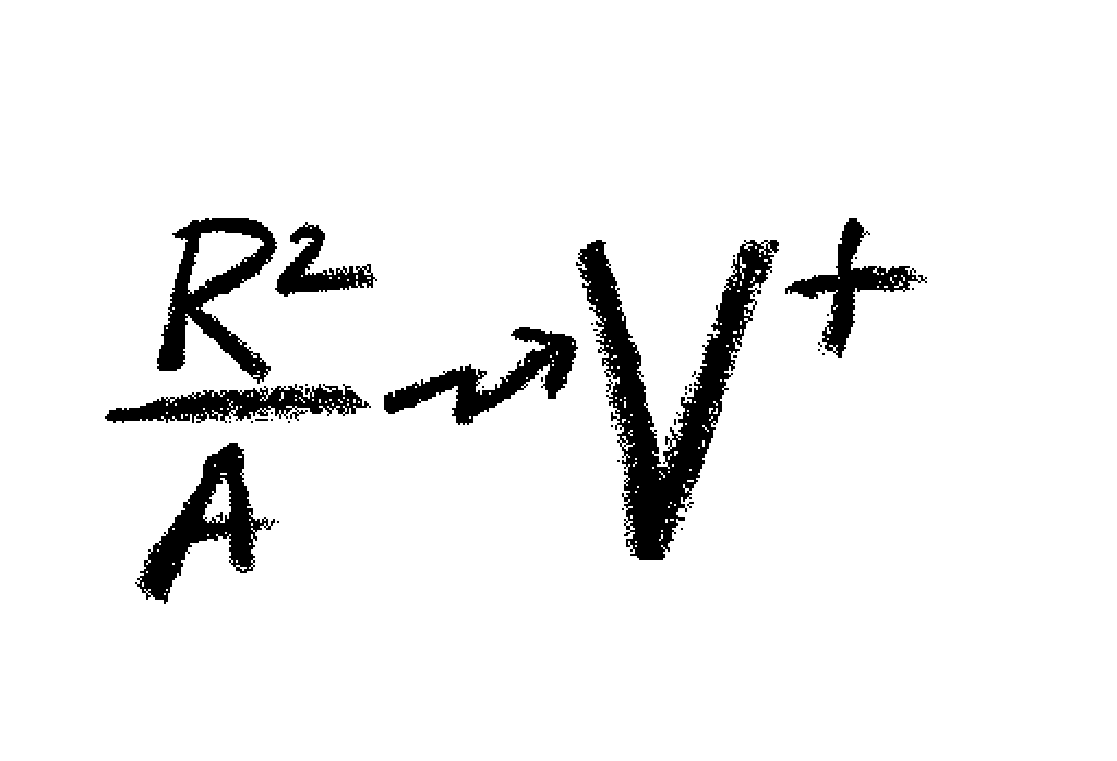 is located in the bottom-left corner. The top-right corner of this slide contains the company logo.
(Slide 1)
Southwestern Energy Company (NYSE: SWN)
General Information
Southwestern Energy Company is an integrated natural gas company whose wholly-owned subsidiaries are engaged in oil and gas exploration and production, natural gas gathering, transmission and marketing, and natural gas distribution.
Market Data as of May 9, 2007
Shares of Common Stock Outstanding | 169,844,979 |
Market Capitalization | $7,315,000,000 |
Institutional Ownership | 88.0% |
Management Ownership | 5.1% |
52-Week Price Range | $24.80 (6/13/06) - $44.99 (4/13/07) |
Investor Contacts
Greg D. Kerley
Executive Vice President and Chief Financial Officer
Phone: | (281) 618-4803 |
Fax: | (281) 618-4820 |
Brad D. Sylvester, CFA
Manager, Investor Relations
Phone: | (281) 618-4897 |
Fax: | (281) 618-4820 |
(Slide 2)
Forward-Looking Statements
All statements, other than historical financial information, may be deemed to be forward-looking statements within the meaning of Section 27A of the Securities Act of 1933, as amended, and Section 21E of the Securities Exchange Act of 1934, as amended. All statements that address activities, outcomes and other matters that should or may occur in the future, including, without limitation, statements regarding the financial position, business strategy, production and reserve growth and other plans and objectives for the company’s future operations, are forward-looking statements. Although the company believes the expectations expressed in such forward-looking statements are based on reasonable assumptions, such statements are not guarantees of future performance and actual results or developments may differ materially from those in the forward-looking statements. The company has no obligation and makes no undertaking to publicly update or revise any forward-looking statements. You should not place undue reliance on forward-looking statements. They are subject to known and unknown risks, uncertainties and other factors that may affect the company’s operations, markets, products, services and prices and cause its actual results, performance or achievements to be materially different from any future results, performance or achievements expressed or implied by the forward-looking statements. In addition to any assumptions and other factors referred to specifically in connection with forward-looking statements, risks, uncertainties and factors that could cause the company’s actual results to differ materially from those indicated in any forward-looking statement include, but are not limited to: the availability of oil field personnel, services, drilling rigs and other equipment, including pressure pumping equipment and crews in the Arkoma Basin; the timing and extent of changes in commodity prices for natural gas and oil; the company’s abi lity to determine the most effective and economic fracture stimulation for the Fayetteville Shale formation; the timing and extent of the company’s success in discovering, developing, producing and estimating reserves; the extent to which the Fayetteville Shale play can replicate the results of other productive shale gas plays; the potential for significant variability in reservoir characteristics of the Fayetteville Shale over such a large acreage position; the extent of the company’s success in drilling and completing horizontal wells; the company’s relative lack of experience owning and operating drilling rigs; the company’s ability to fund its planned capital expenditures; future property acquisition or divestiture activities; the effects of weather and regulation on the company’s gas distribution segment; increased competition; the impact of federal, state and local government regulation; the financial impact of accounting regulations and critical accounting policies; changing m arket conditions and prices (including regional basis differentials); the comparative cost of alternative fuels; conditions in capital markets and changes in interest rates; and any other factors listed in the reports we have filed and may file with the Securities and Exchange Commission (SEC). For additional information with respect to certain of these and other factors, see reports filed by the company with the SEC. The company disclaims any intention or obligation to update or revise any forward-looking statements, whether as a result of new information, future events or otherwise.
The Securities and Exchange Commission has generally permitted oil and gas companies, in their filings with the SEC, to disclose only proved reserves that a company has demonstrated by actual production or conclusive formation tests to be economically and legally producible under existing economic and operating conditions. We use the terms “estimated ultimate recovery,” “EUR,” “probable,” “possible,” and “non-proven” reserves, reserve “potential” or “upside” or other descriptions of volumes of reserves potentially recoverable through additional drilling or recovery techniques that the SEC’s guidelines may prohibit us from including in filings with the SEC. These estimates are by their nature more speculative than estimates of proved reserves and accordingly are subject to substantially greater risk of being actually realized by the company.
(Slide 3)
About Southwestern
| * Focused on domestic exploration and production of natural gas. |
| | * 1,026 Bcfe of reserves; 95% natural gas; 14.2 R/P at year-end 2006. |
| |
| * E&P strategy built on organic growth through the drillbit. |
| | * Over 80% of planned E&P capital allocated to drilling in 2007. |
| |
| * Track record of adding significant reserves at low costs. |
| | * From 1999 through 2006, we've averaged annual production growth of 12%, reserve growth of 16%, 297% reserve replacement, and F&D cost of $1.73 per Mcfe. |
| | |
* Proven management team has increased Southwestern's market capitalization from $187 million at year-end 1998 to over $7 billion today. |
| |
| * Strategy built on the Formula: |
| | The Right People doing the Right Things, wisely investing the cash flow from the underlying Assets will create Value+. |
Note that the information contained on this slide constitutes a "forward-looking statement".
(Slide 4)
Recent Developments
* First Quarter 2007 Highlights |
| * Production of 22.9 Bcfe (up 44%); 2007 production projected at 107-110 Bcfe (up 48-52%). |
| * Discretionary cash flow of $142.4 million, up 14%. |
| * Capital investments of $327.3 million, approximately double the prior year period. |
* Operations Update |
| * East Texas and Ranger Anticline development programs delivering high-return growth. |
| * Fayetteville Shale - progress in horizontal drilling and confirmation of play. |
| | * Through April 30, 2007, 263 wells were completed, including 181 SW/XL horizontal wells. |
| | * Production from Fayetteville Shale project increased to approximately 155 MMcf per day at April 30, 2007, compared to approximately 20 MMcf the same time a year ago. |
Notes: Discretionary cash flow is net cash flow before changes in operating assets and liabilities. Discretionary cash flow is a non-GAAP financial measure (see explanation and reconciliation on page 39).
Note that the information contained on this slide constitutes a "forward-looking statement".
(Slide 5)
Proven Track Record
This slide contains bar charts for the periods ended December 31.
| 1999 | 2000 | 2001 | 2002 | 2003 | 2004 | 2005 | 2006 | 2007E |
Production (Bcfe) | 33 | 36 | 40 | 40 | 41 | 54 | 61 | 72 | 107-110E |
Reserve Replacement | 150% | 196% | 224% | 209% | 351% | 388% | 450% | 505% | |
EBITDA ($MM)(1) | $75 | $104 | $134 | $99 | $151 | $255 | $346 | $415 | |
F&D Cost ($/Mcfe) | $1.20 | $0.99 | $1.11 | $1.02 | $1.18 | $1.34 | $1.51 | $2.10 | |
Note: Reserve data excludes reserve revisions and capital investments in drilling rigs.
(1) EBITDA is a non-GAAP financial measure. See explanation and reconciliation of EBITDA on page 40.
Note that the information contained on this slide constitutes a "forward-looking statement".
(Slide 6)
About the Company
This slide contains a map of Arkansas, Louisiana, Oklahoma, Texas and New Mexico with shadings to denote the Arkoma and Permian Basins, the Gulf Coast and the East Texas regions. Lines trace gas distribution pipelines.
Exploration and Production Segment
* 2006: 1,026 Bcfe of Reserves |
| 95% Natural Gas |
| | Production: 72.3 Bcfe |
| * 2007 Est. Production: 107-110 Bcfe |
Arkoma
* Reserves - 577 Bcf (56%) |
| * Production - 31.9 Bcf (44%) |
East Texas
* Reserves - 383 Bcfe (37%) |
* Production - 32.0 Bcfe (44%) |
Gulf Coast
* Reserves - 15 Bcfe (2%) |
* Production - 2.6 Bcfe (4%) |
Permian
* Reserves - 51 Bcfe (5%) |
* Production - 5.8 Bcfe (8%) |
Gas Distribution Segment
* 151,000 customers in North Arkansas |
* Service area includes 6th fastest growing region in U.S. and the Milken Institute's 8th "Best Performing City" |
* Southwestern operates in Arkansas, Texas, New Mexico, Oklahoma and Louisiana and has three segments: E&P, Midstream Services and Gas Distribution. |
* E&P generates approximately 95% of operating income and EBITDA. |
* Midstream Services and Gas Distribution segments provide operating synergies for the E&P business in addition to contributing to the stability of our cash flow. |
Note that the information contained on this slide constitutes a "forward-looking statement".
(Slide 7)
Capital Expenditures
This slide contains a bar chart of Company capital investments, summarized as follows:
| | | | | | 2007 |
| 2003 | 2004 | 2005 | 2006 | Plan |
| | (in millions) |
Utility & Other | $9.3 | $13.0 | $15.9 | $32.7 | $19.6 |
Property Acquisitions | $ - | $14.2 | $ - | $18.0 | $ - |
Cap. Exp. & Other | $12.4 | $17.9 | $32.4 | $62.0 | $86.0 |
Leasehold & Seismic | $19.0 | $21.1 | $60.6 | $70.0 | $139.0 |
Development Drilling | $119.7 | $208.7 | $287.6 | $421.4 | $937.2 |
Exploration Drilling | $19.8 | $20.1 | $35.6 | $196.0 | $75.3 |
| Midstream Services | $0.0 | $0.0 | $15.8 | $48.7 | $83.9 |
| Rig Commitment | $0.0 | $0.0 | $35.2 | $93.6 | $ - |
Total | $180.2 | $295.0 | $483.1 | $942.4 | $1,341.0 |
This slide also contains a pie chart of Company's preliminary planned 2007 capital expenditures by area of operation, summarized as follows:
| % of Total |
| Capital Investments |
Arkoma Fayetteville Shale | 65% |
East Texas | 12% |
Arkoma | 9% |
| Midstream | 6% |
| Other E&P | 4% |
Permian/Gulf Coast | 2% |
Utility | 2% |
* E&P capital program heavily weighted to the Fayetteville Shale play in 2007. |
| |
* Over 80% of E&P capital is allocated to drilling in 2007. |
| |
* Plan to invest over $950 million in the Fayetteville Shale play in 2007. |
Note that the information contained on this slide constitutes a "forward-looking statement".
(Slide 8)
East Texas
This slide contains a map of several counties in East Texas. The Company's Overton and Angelina River Trend acreage positions are highlighted. The East Texas Salt Basin is also denoted on the map. The cities of Tyler and Lufkin, Texas are displayed as reference points.
East Texas Activity: | | Annual | Year-End |
| Well | Production | Reserves |
| Count | (Bcfe) | (Bcfe) |
Original Wells (acquired) | 16 | 0.3 | 22 |
2001 - 2002 Development | 33 | 8.2 | 111 |
2003 Development | 57 | 13.6 | 196 |
2004 Development | 84 | 22.2 | 299 |
| 2005 Development | 88 | 28.2 | 369 |
2006 Development | 78 | 32.0 | 383 |
Planned 2007 Development | 68 | 27 - 29 | |
* Entered area in 2000 with purchase of 10,800 acres at Overton for $6.1 million. |
|
* Current acreage position of 24,400 gross acres at Overton and 77,200 gross acres at Angelina. |
|
* Drilled 334 wells at Overton from 2001 to March 31, 2007, with 100% success. |
|
* Plan to drill 39 wells at Overton and 29 wells at Angelina in 2007. |
|
* Potential for future development program at Angelina. |
Note that the information contained on this slide constitutes a "forward-looking statement".
(Slide 9)
Arkoma Basin - Conventional
This slide contains a map of Arkansas and Oklahoma with shading to denote the Arkoma Basin. The Ranger Anticline, the Midway Exploration and the area known as the Fairway are further noted.
* 60+ years of experience in the basin, large acreage position of 460,000 net acres. |
* 2007 capital program includes drilling 100 - 110 wells, including 50 - 60 wells in the company's growing Ranger Anticline area. |
Arkoma Basin 2004-2006 Avg Results:(1)
Reserve replacement: | 205% |
LOE Cost (incl. Taxes) ($/Mcf): | $0.60 |
F&D Cost ($/Mcf): | $1.74 |
Ranger Anticline (inception thru 12/31/06):(1)
Success: | 104/118 |
Net EUR: | 95.7 Bcf |
F&D/Mcf: | $1.52 |
(1) Including reserve revisions.
Note that the information contained on this slide constitutes a "forward-looking statement".
(Slide 10)
Ranger Anticline
This slide contains a map of the Ranger Anticline prospect with the Company's exploratory and held by production acreage designated with shading. Also shown are SWN's producing wells at 12/31/06 and 2007 proposed wells. A box denotes the successful extension wells.
Ranger Anticline (inception thru 12/31/06):(1)
Success: | 104/118 |
Net EUR: | 95.7 Bcf |
F&D/Mcf: | $1.52 |
* Current acreage position of 16,000 gross dev. acres and 58,000 gross undev. acres. |
|
* Average working interest 50% - 100%. |
|
* Plan to drill up to 60 wells in 2007. |
| |
* Area has significant potential growth/inventory. |
| |
* 2006 exploration success at Midway prospect, approx. 10 miles north of Ranger, also holds significant potential. |
Ranger Anticline Potential: | | Reserve |
| Well | Adds |
| Count | (Net Bcfe) |
Successful Wells at 12/31/02 | 13 | 12 |
Successful Wells in 2003 | 10 | 8 |
Successful Wells in 2004 | 20 | 25 |
Successful Wells in 2005 | 34 | 17 |
| Successful Wells in 2006 | 27 | 34 |
| Planned 2007 Drilling Program | 60 | |
| Future Potential Locations | ~150 | |
(1) Including reserve revisions.
Note that the information contained on this slide constitutes a "forward-looking statement".
(Slide 11)
Fayetteville Shale Play
This slide contains a map of Oklahoma, Arkansas, and portions of Louisiana and Texas. A box denotes SWN's Fayetteville Shale position in the Arkoma Basin. The Barnett Shale in the Fort Worth Basin, the Wedington Incongruity as well as the Llano Uplift and Sabine Uplift are also denoted. The Arbuckle and Ouachita mountains are shown as reference points.
* Mississippian-age shale, geological equivalent of the Barnett Shale in north Texas.
* Within the SWN play area, the shale appears to be laterally extensive across several counties in Arkansas, ranging in thickness from 50 to 550 feet and depths from 1,500 to 6,500 feet.
* SWN currently holds approximately 896,000 net acres in the Fayetteville Shale play area (equivalent to approximately 1,400 square miles).
Note that the information contained on this slide constitutes a "forward-looking statement".
(Slide 12)
Fayetteville Shale Focus Area
This slide contains a map of the Fayetteville Shale Focus Area in Arkansas. Existing pilot areas and portions of the conventional fairway are indicated. 771,000 net acres and 125,000 net acres HBP are outlined on the map. A box denotes Conventional Production (9 MMcf/d). The Scotland Field, Gravel Hill Field, Griffin Mountain Field, Cove Creek Field, New Quitman Field, Chattanooga Test and Ranger Anticline are also designated. The Moorefield Prospective Area is outlined. Additionally, the East Cutthroat, Carter #2-35H well (Moorefield) with an IP of 1.2 MMcf/d is indicated on the slide.
* As of April 30, 2007, SWN has drilled and completed 263 wells, of which 181 are horizontal SW/XL wells, in 33 separate pilot areas in 8 counties. We are also producing gas from the deeper Moorefield and Chattanooga Shales and from conventional production in four pilot areas. |
|
* We anticipate participating in 400 horizontal wells in 2007, approximately 75% of which we would operate. |
| |
* Assuming development of 50% of the acreage within the shaded areas at 80-acre spacing and average ultimate production of 1.4 Bcf gross per well, the potential exists for 8,000 horizontal wells and approximately 11 Tcf gross ultimate recovery. |
Notes: Data as of April 30, 2007
Note that the information contained on this slide constitutes a "forward-looking statement".
(Slide 13)
Fayetteville Shale Performance - SW/XL Wells
This slide contains a map of the Fayetteville Shale Play where pilot areas are highlighted with circles and categorized as First 30 Day average rate (Pilots with 2 or more wells), Initial test rate only, Completing wells and Conventional Production. The Moorefield Prospective Area is outlined.
* Gravel Hill
Average: 1,857 Mcfpd
Range: 644 - 3,868 Mcfpd
30 wells
* East Cutthroat
Average: 401 Mcfpd
Range: 247 - 566 Mcfpd
4 wells
* Conventional Production
(9 MMcf/d from 4 wells)
Notes: Data as of April 22, 2007. Each circle has been scaled to size to reflect the relative position of the rate compared to the others shown.
Note that the information contained on this slide constitutes a "forward-looking statement".
(Slide 14)
Fayetteville Shale Performance - SW/XL Wells
This slide contains a map of the Fayetteville Shale Play where pilot areas are highlighted with circles and categorized as First 30 Day average rate (Pilots with 2 or more wells), Initial test rate only, Completing wells and Conventional Production. The Moorefield Prospective Area is outlined.
* Gravel Hill
Average: 1,857 Mcfpd
Range: 644 - 3,868 Mcfpd
30 wells
* East Cutthroat
Average: 401 Mcfpd
Range: 247 - 566 Mcfpd
4 wells
* Scotland
Average: 1,103 Mcfpd
Range: 387 - 2,531 Mcfpd
16 wells
* Steelhead
Average: 1,365 Mcfpd
Range: 1,082 - 1,666 Mcfpd
5 wells
* Southeast Rainbow
Average: 1,069 Mcfpd
Range: 313 - 2,168 Mcfpd
9 wells
* Midge
Average: 680 Mcfpd
Range: 604 - 858 Mcfpd
5 wells
* Sharkey
Average: 1,064 Mcfpd
Range: 813 - 1,266 Mcfpd
3 wells
* Griffin Mountain
Average: 804 Mcfpd
Range: 348 - 1,330 Mcfpd
18 wells
* South Brownie
Average: 673 Mcfpd
Range: 560 - 786 Mcfpd
2 wells
* South Rainbow
Average: 1,792 Mcfpd
Range: 325 - 3,041 Mcfpd
13 wells
* Cove Creek
Average: 1,206 Mcfpd
Range: 527 - 2,016 Mcfpd
26 wells
* New Quitman
Average: 867 Mcfpd
Range: 385 - 1,780 Mcfpd
15 wells
* Matthis Hollow
Avg. Test: 897 Mcfpd
* Nemo
Avg. Test: 731 Mcfpd
* SW Greers Lake
Test: 1,810 Mcfpd
* Caddis:
Test: 675 Mcfpd
* Yellowstone
Avg. Test: 952 Mcfpd
* West Cutthroat
Test: 2,016 Mcfpd
* North Charley
Avg. Test: 469 Mcfpd
* Charley
Test: 258 Mcfpd
* Mako
Test: 940 Mcfpd
* Hammerhead
Test: 869 Mcfpd
* Stonefly
Avg. Test: 394 Mcfpd
* Bull
Test: 3,348 Mcfpd
Notes: Data as of April 22, 2007. Each circle has been scaled to size to reflect the relative position of the rate compared to the others shown.
Note that the information contained on this slide constitutes a "forward-looking statement".
(Slide 15)
Fayetteville Project - Gross Production
This line graph shows gross production in MMcf/d for the Fayetteville Shale from January 2006 to April 30, 2007. Gross production of approximately 155 MMcf/d as of April 30, 2007.
Note that the information contained on this slide constitutes a "forward-looking statement".
(Slide 16)
Fayetteville Shale - Horizontal Well Performance
The graph contained in this slide provides average daily production data through April 22, 2007, for the company's horizontal wells drilled on acreage outside of that held by conventional production. The production data is compared to 1.3 Bcf and 1.5 Bcf typecurves from the company's reservoir simulation shale gas model. This graph also displays two composite curves, one showing the SW/XL normalized production from the Company's horizontal wells and another showing the SW/XL production excluding mechanical issues. Composite curves are also shown for Gravel Hill Excl. mechanical issues and East Cutthroat.
Well counts and respective days of production are also displayed, as follows:
| Days of Production | Total Well Count | Gravel Hill Well Count | East Cutthroat Well Count |
| | (as of April 22, 2007) |
| | | | |
| 15 | 151 | 28 | 4 |
| 30 | 138 | 26 | 3 |
| 60 | 112 | 23 | 2 |
| 90 | 97 | 22 | 1 |
| 120 | 83 | 22 | 0 |
| 150 | 63 | 18 | 0 |
| 180 | 51 | 17 | 0 |
| 210 | 43 | 15 | 0 |
| 240 | 35 | 15 | 0 |
| 270 | 27 | 15 | 0 |
| 300 | 19 | 10 | 0 |
| 330 | 11 | 5 | 0 |
| 360 | 6 | 2 | 0 |
| 390 | 3 | 2 | 0 |
| 420 | 1 | 1 | 0 |
| 450 | 1 | 1 | 0 |
| 480 | 1 | 1 | 0 |
| 510 | 1 | 1 | 0 |
| 540 | 1 | 1 | 0 |
| 557 | 1 | 1 | 0 |
Notes: Data as of April 22, 2007. Average lateral length of approximately 2,200 feet.
Note that the information contained on this slide constitutes a "forward-looking statement".
(Slide 17)
Outlook for 2007
| * Production target of 107.0 - 110.0 Bcfe in 2007 (estimated growth of 48 - 52%). |
| 2006 | 2007 Guidance |
| | Actual | NYMEX Price Assumptions |
| $7.23 Gas | $6.00 Gas | | $7.00 Gas | $8.00 Gas |
| $64.74 Oil | $50.00 Oil | | $60.00 Oil | $65.00 Oil |
Net Income | $162.6 MM | $170 - $175 MM | | $200 - $205 MM | $245 - $250 MM |
EPS | $0.95 | $0.99 - $1.02 | | $1.16 - $1.19 | $1.42 - $1.45 |
Operating Income | $246.3 MM | $305 - $310 MM | | $355 - $360 MM | $425 - $430 MM |
Net Cash Flow(1) | $413.5 MM | $545 - $555 MM | | $590 - $600 MM | $660 - $670 MM |
EBITDA(1) | $414.5 MM | $575 - $585 MM | | $615 - $625 MM | $685 - $695 MM |
| CapEx | $942.4 MM | $1,341 MM | | $1,341 MM | $1,341 MM |
Note: Guidance updated as of April 30, 2007. 2006 oil and gas prices include actual last-day NYMEX closing prices.
(1) Net cash flow is net cash flow before changes in operating assets and liabilities. Net cash flow and EBITDA are non-GAAP financial measures. See explanation and reconciliation of non-GAAP financial measures on pages 39 and 40.
Note that the information contained on this slide constitutes a "forward-looking statement".
(Slide 18)
The Road to V+
| * Invest in the Highest PVI Projects. |
| | * Continue Development of East Texas and the Ranger Anticline. |
| | |
| * Accelerate Development of the Fayetteville Shale Play. |
| |
| * Deliver the Numbers. |
| | * Production and Reserve Growth. |
| | * Maximize Cash Flow. |
| | |
| * Continue to Tell Our Story. |
Note that the information contained on this slide constitutes a "forward-looking statement".
(Slide 19)
Appendix
(Slide 20)
Financial & Operational Summary
This slide contains a table that summarizes the Company's financial and operational indicators.
| | Quarter Ended March 31, | | Year ended December 31, |
| | 2007 | 2006 | | 2006 | 2005 | 2004 |
| | ($ in millions, except per share amounts) |
| | | | | | | |
| Revenues | $284.7 | $226.7 | | $763.1 | $676.3 | $477.1 |
| EBITDA (1) | 139.6 | 120.9 | | 414.5 | 345.9 | 255.3 |
| Net Income | 51.0 | 58.4 | | 162.6 | 147.8 | 103.6 |
| Net Cash Flow (1) | 142.4 | 125.4 | | 413.5 | 321.8 | 237.7 |
| Diluted EPS (2) | $0.30 | $0.34 | | $0.95 | $0.95 | $0.70 |
| Diluted CFPS (2) | $0.83 | $0.73 | | $2.41 | $2.06 | $1.61 |
| | | | | | | |
| Production (Bcfe) | 22.9 | 15.9 | | 72.3 | 61.0 | 54.1 |
| Avg. Gas Price ($/Mcf) | $6.71 | $7.86 | | $6.55 | $6.51 | $5.21 |
| Avg. Oil Price ($/Bbl) | $55.17 | $56.80 | | $58.36 | $42.62 | $31.47 |
| | | | | | | |
| Finding Cost ($/Mcfe) (3) | | | | $2.10 | $1.51 | $1.34 |
| Reserve Replacement (%) (3) | | | | 505% | 450% | 388% |
(1) Net cash flow is net cash flow before changes in operating assets and liabilities. Net cash flow and EBITDA are non-GAAP financial measures. See explanation and reconciliation of non-GAAP financial measures on pages 39 and 40.
(2) Diluted earnings per share and diluted cash flow per share have been adjusted to give effect to the two 2-for-1 stock splits during 2005.
(3) Excluding reserve revisions and capital investments in drilling rigs.
(Slide 21)
Gas Hedges in Place Through 2009
This slide contains a bar chart detailing gas hedges in place by quarter for year 2007, year 2008 and year 2009. A summary of these outstanding gas hedges is as follows:
| | | Average Price per Mcf | Percent |
| Type | Hedged Volumes | (or Floor/Ceiling) | Hedged |
2007 | Swaps | 43.5 Bcf | $7.81 | 42% |
| Collars | 36.0 Bcf | $6.99 / $12.21 | 35% |
2008 | Swaps | 31.0 Bcf | $8.27 | - |
| Collars | 44.0 Bcf | $7.86 / $11.65 | - |
2009 | Swaps | 16.0 Bcf | $7.94 | - |
| Collars | 12.0 Bcf | $7.83 / $10.51 | - |
Note that the information contained on this slide constitutes a "forward-looking statement".
(Slide 22)
SWN is One of the Lowest Cost Operators
This slide contains a bar graph that compares SWN to its competitors in terms of lifting cost per Mcfe of production (3 year average).
| | | Lifting Cost per Mcfe |
| | | of Production |
| | | (3 year average) |
| | | |
Southwestern Energy Company | | $0.83 |
EOG Resources, Inc. | | $1.04 |
Noble Energy | | $1.04 |
Chesapeake Energy | | $1.06 |
EnCana | | $1.07 |
| Pioneer Natural Resources | | $1.09 |
Newfield Exploration | | $1.10 |
Range Resources | | $1.13 |
Ultra Petroleum | | $1.16 |
Cabot Oil & Gas | | $1.18 |
Devon Energy | | $1.28 |
| Anadarko Petroleum | | $1.33 |
XTO Energy | | $1.41 |
Apache | | $1.49 |
Pogo Producing | | $1.50 |
| Cimarex Energy | | $1.52 |
| Swift Energy | | $1.54 |
| Forest Oil | | $1.56 |
| St. Mary Land & Exploration | | $1.62 |
| Quicksilver Resources | | $1.67 |
| Denbury Resources | | $2.04 |
This slide also contains a bar graph comparing SWN to its competitors in terms of drillbit F&D cost per Mcfe (3 year average).
| | | Drillbit F&D Cost |
| | | per Mcfe |
| | | (3 year average) |
| | | |
| Ultra Petroleum | | $0.52 |
| Quicksilver Resources | | $1.00 |
XTO Energy | | $1.35 |
| Southwestern Energy Company | | $1.69 |
Range Resources | | $1.77 |
| Cabot Oil & Gas | | $1.82 |
| EOG Resources, Inc. | | $1.90 |
EnCana | | $1.93 |
Apache | | $2.02 |
| Devon Energy | | $2.05 |
Denbury Resources | | $2.31 |
Noble Energy | | $2.89 |
St. Mary Land & Exploration | | $3.22 |
Newfield Exploration | | $3.29 |
Anadarko Petroleum | | $4.29 |
| Pioneer Natural Resources | | $4.47 |
Cimarex Energy | | $4.48 |
| Forest Oil | | $4.58 |
Chesapeake Energy | | $4.58 |
Swift Energy | | $7.18 |
| Pogo Producing Co. | | $7.34 |
Source: John S. Herold Database
Note: All data as of December 31, 2004, 2005 and 2006.
(Slide 23)
Fayetteville Shale Activity Compared to the Barnett
This slide contains a bar chart displaying the number of wells drilled in the Barnett Shale Play and the Fayetteville Shale Play, summarized as follows:
Barnett Shale Play
*1981 – 1st Well Drilled
*1992 – 1st Horizontal Well Drilled
*1997 – 1st Slickwater Frac
| | |
1981-1989 | Avg. 7 Wells/Year | |
| | |
| | |
1990-1994 | Avg. 40 Wells/Year | |
| | |
| | |
1995-1999 | Avg. 73 Wells/Year | |
| | |
| | |
2000 | Vertical Wells Drilled Horizontal Wells Drilled | 186 2 | |
| | |
| | |
2001 | Vertical Wells Drilled Horizontal Wells Drilled | 501 3 | |
| | |
| | |
2002 | Vertical Wells Drilled Horizontal Wells Drilled | 785 5 | |
| | |
| | |
2003 | Vertical Wells Drilled Horizontal Wells Drilled | 872 75 | |
| | |
| | |
2004 | Vertical Wells Drilled Horizontal Wells Drilled | 566 278 | |
| | |
| | |
2005 | Vertical Wells Drilled Horizontal Wells Drilled | 322 613 | |
| | |
| | |
2006E | Vertical Wells Drilled Horizontal Wells Drilled | 200 1100 | |
| | |
| | |
2007E | Vertical Wells Drilled Horizontal Wells Drilled | 250 1500 | |
| | |
Fayetteville Shale Play
*Q2 2004 – 1st Well Drilled
*Q1 2005 – 1st Horizontal Well Drilled
*Q3 2005 – 1st Slickwater Frac
| | |
2004 | Vertical Wells Drilled Horizontal Wells Drilled | 21 0 | |
| | |
| | |
2005 | Vertical Wells Drilled Horizontal Wells Drilled | 30 37 | |
| | |
| | |
2006 | Vertical Wells Drilled Horizontal Wells Drilled | 7 189 | |
| | |
| | |
2007E | Vertical Wells Drilled Horizontal Wells Drilled | 0 ~400 | |
| | |
Source: Republic Energy Co., Pickering Energy Partners
Note that the information contained on this slide constitutes a "forward-looking statement".
(Slide 24)
Fayetteville Shale Production Compared to the Barnett
The graph contained in this slide displays production volumes in MMcf/d for the Fayetteville Shale over a 2-year period and the Barnett Shale over an 18-year period, which are the respective time periods in which each shale play reached 120 MMcf/d in production.
A box accompanying the graph states:
We collapsed the “learning curve” dramatically; Paradigm shift in gas prices
Source: Pickering Energy Partners
Note that the information contained on this slide constitutes a "forward-looking statement".
(Slide 25)
East Texas - Overton Field
This slide contains a map of Smith County, Texas, where the Overton Field is located. Existing wells at year-end 2005 and development well locations for 2006 and 2007 are denoted. It is stated that the Overton Field contains 17,600 acres and the South Overton Farm-in Acreage contains 6,800 acres.
* Purchased original 10,800 acres and 16 producing wells for $6.1 million in 2000 (developed at 640-acre spacing). |
|
* Drilled 334 wells from 2001 to March 31, 2007, with 100% success. |
|
* Plan to drill 39 wells in 2007, a portion of which will be at 40-acre spacing. |
| Overton Field Reserve Potential: | | Approx. | Reserve |
| Well | Spacing | Adds(1) |
| Count | (Acres) | (Net Bcfe) |
Original Wells | 16 | 640 | 21 |
2001 - 2002 Development | 33 | 365 | 66 |
2003 Development | 57 | 170 | 70 |
2004 Development | 83 | 100 | 123 |
| 2005 Development | 80 | 70 | 106 |
2006 Development | 66 | 60 | 87 |
Planned 2007 Development | 39 | 60 | |
Overton Field 2004-2006 Avg Results:(1)
Reserve Replacement: | | 297% |
LOE Cost (incl. Taxes) ($/Mcfe): | | $0.57 |
F&D Cost ($/Mcfe): | | $1.98 |
(1)Excluding reserve revisions.
Note that the information contained on this slide constitutes a "forward-looking statement".
(Slide 26)
Overton Field Gross Production
The graph contained on this slide displays the Overton Field gross production rate (MMcfe/d) from June 2000 to December 2006. Additionally, in early 2003, the graph indicates the projected production profile from an accelerated drilling program as a result of our 2003 equity offering. In 2004, the graph indicates addition of a fifth rig and curtailment issues.
Overton Net Production:
| Bcfe |
2000 | 0.3 |
2001 | 2.3 |
2002 | 5.9 |
2003 | 13.6 |
2004 | 21.8 |
| 2005 | 26.7 |
| 2006 | 29.8 |
Note that the information contained on this slide constitutes a "forward-looking statement".
(Slide 27)
Overton Field - Improved Drilling Results
This slide of drilling days versus depth portrays the improved drilling rate in the Overton Field since its purchase from Fina in 2001. Fina's average drilling rate was 55 days. Upon the Field's purchase in 2001 SWN decreased that rate to 35 days. It was further decreased to 27 days in 2002, 23 days in 2003, 19 days in 2004, 18 days in 2005 and 17 days in 2006.
* Reduced drilling time by >50%. |
|
* Increased initial production by 200%. |
|
* Increased gross reserves by 60% (avg. gross EUR of 1.6 Bcfe per well in 2006) |
Note that the information contained on this slide constitutes a "forward-looking statement".
(Slide 28)
The Energy Balance Today
* Oil and gas prices have risen substantially since 2002. |
|
* World demand for hydrocarbons has increased dramatically (China, India, etc.) and supply/demand relationship is tight. |
|
* Resource nationalism is a reality. |
| |
| * A serious challenge exists to meet demand growth for hydrocarbons (oil and gas). |
| |
| * There are no "silver bullet" technologies today to replace hydrocarbons. |
Note that the information contained on this slide constitutes a "forward-looking statement".
(Slide 29)
U.S. Oil Consumption and Sources
This slide displays U.S. oil production versus U.S. oil consumption from 1981 to present. Net imports for the same period are also given. Imports represent 66% or total US consumption.
Source: EIA
(Slide 30)
West Texas Intermediate Oil Prices
This line graph shows the price of West Texas Intermediate oil in $/Bbl for the years 2000 to present noting a compound average growth rate of 19%. It is also noted, however, finding costs for US E&P companies from 2002-2006 grew at a 38%CAGR.
Source: Bloomberg, John S. Herold, Inc.
(Slide 31)
Rising Resource Nationalism
This slide contains a bar graph displaying the volume of oil and gas resources in BBoe controlled by the following entities:
Government-owned Oil Companies (GOCs) –95%:
Saudi Aramco, NIOC (Iran), Qatar Petroleum, ADNOC (UAE), Iraq NOC,
Gazprom (Russia), tKPC (Kuwai), PDVSA (Venezuela), NNPC (Nigeria), NOC (Libya)
Sonatrach (Algeria), Rosneft (Russia), Petronas (Malaysia), Lukoil (Russia),
Pemex (Mexico), Petrochina (China), Petrobras (Brazil), ONGC (India), Sinopec (China)
International Oil Companies (IOCs) –5%:
ExxonMobil, BP, Chevron, Royal Dutch Shell, Total, ConocoPhillips, ENI
* GOCs control an overwhelming majority of oil and gas resources.
Source: Merrill Lynch
(Slide 32)
The Challenges
* Aging of the workforce |
|
* Access to land |
|
* Political situations in large resource countries |
| |
| * Balancing environmental vs. energy needs |
| |
| * Lack of new talent (engineering and technical) |
| |
| * Challenge of meeting the demand growth with new supplies |
Note that the information contained on this slide constitutes a "forward-looking statement".
(Slide 33)
U.S. Gas Consumption and Sources
This slide displays U.S. gas production versus U.S. gas consumption from 1975 to 2006. Net imports for the same period are also given. US gas production basically flat since 1994.
Source: EIA
(Slide 34)
U.S. Gas Production Decline Rate
This graph portrays U.S. natural gas production history. The graph indicates a 32% 2006E decline rate.
| | Production Decline Rate of Base | |
| 1990 | 17% | | |
| 1991 | 17% | | |
| 1992 | 16% | | |
| 1993 | 18% | | |
| 1994 | 19% | * | |
| 1995 | 19% | * | |
| 1996 | 20% | * | |
| 1997 | 21% | * | |
| 1998 | 23% | * | |
| 1999 | 23% | * | |
| 2000 | 25% | | |
| 2001E | 24% | | |
| 2002E | 27% | | |
| 2003E | 28% | | |
| 2004E | 29% | | |
| 2005E | 30% | | |
| 2006E | 32% | * | |
*Supply impact of 32% vs. 19-23% is under estimated
Utilizes data supplied by IHS Energy; Copyright IHS Energy
Chart prepared by and Property of EOG Resources, Inc.; Copyright 2006
(Slide 35)
U.S. Electricity Consumption on the Rise
This line graph shows an increase in U.S. electricity consumption in billion kilowatt-hours per month from 1990 to present.
Source: Edison Electric Institute
(Slide 36)
NYMEX Gas Prices
This line graph represents NYMEX gas prices in $/Mcf from 2000 to present.
Source: Bloomberg
(Slide 37)
U.S. Gas Drilling
This line graph denotes the number of rigs drilling for gas through the period 1988 to present.
Source: Baker Hughes
(Slide 38)
Oil and Gas Price Comparison
This line graph compares the prices of Henry Hub natural gas and WTI crude oil in $/MMBtu and $/Bbl, respectively, for the period 1994 to present.
Source: Bloomberg
(Slide 39)
Explanation and Reconciliation of Non-GAAP Financial Measures: Net Cash Flow
Net cash provided by operating activities before changes in operating assets and liabilities is presented because of its acceptance as an indicator of an oil and gas exploration and production company’s ability to internally fund exploration and development activities and to service or incur additional debt. The company has also included this information because changes in operating assets and liabilities relate to the timing of cash receipts and disbursements which the company may not control and may not relate to the period in which the operating activities occurred. Net cash provided by operating activities before changes in operating assets and liabilities should not be considered in isolation or as a substitute for net cash provided by operating activities prepared in accordance with generally accepted accounting principles. Forecasting changes in operating assets and liabilities would require unreasonable effort, would not be reliable and could be misl eading. Therefore, the reconciliation of the company’s forecasted net cash provided by operating activities before changes in operating assets and liabilities has assumed no changes in assets and liabilities. The first table below reconciles actual net cash provided by operating activities before changes in operating assets and liabilities with net cash provided by operating activities as derived from the company's financial information.
| | Quarter Ended March 31, | | Year Ended December 31, |
| | 2007 | | 2006 | | 2006 | | 2005 | | 2004 |
| | ($ in thousands) |
Net cash provided by operating activities before changes in operating assets and liabilities | $142,403 | | $125,369 | | $413,508 | | $321,758 | | $237,706 |
Add back (deduct): | | | | | | | | | |
Change in operating assets and liabilities | (13,992) | | 18,000 | | 16,429 | | (17,276) | | 191 |
Net cash provided by operating activities | $128,411 | | $436,369 | | $429,937 | | $304,482 | | $237,897 |
| |
| 2007 Guidance |
| NYMEX Commodity Price Assumptions |
| $6.00 Gas | $7.00 Gas | $8.00 Gas |
| $50.00 Oil | $60.00 Oil | $65.00 Oil |
| | ($ in millions) |
Net cash provided by operating activities | $545-$555 | $590-$600 | $660-$670 |
Add back (deduct): | | | |
Assumed change in operating assets and liabilities | -- | -- | -- |
Net cash provided by operating activities before changes in operating assets and liabilities | $545-$555 | $590-$600 | $660-$670 |
Note that the information contained on this slide constitutes a "forward-looking statement".
(Slide 40)
Explanation and Reconciliation of Non-GAAP Financial Measures: EBITDA
EBITDA is defined as net income plus interest, income tax expense, depreciation, depletion and amortization. Southwestern has included information concerning EBITDA because it is used by certain investors as a measure of the ability of a company to service or incur indebtedness and because it is a financial measure commonly used in the energy industry. EBITDA should not be considered in isolation or as a substitute for net income, net cash provided by operating activities or other income or cash flow data prepared in accordance with generally accepted accounting principles or as a measure of the company's profitability or liquidity. EBITDA as defined above may not be comparable to similarly titled measures of other companies. Net income is a financial measure calculated and presented in accordance with generally accepted accounting principles. The table below reconciles historical EBITDA with historical net income.
| | 3 Months Ended March 31, | | 12 Months Ended December 31, |
| 2007 | | 2006 | | 2006 | | 2005 | | 2004 | | 2003 | | 2002 | | 2001 | | 2000 | | 1999 |
| | ($ in thousands) |
Net income | $50,.988 | | $58,395 | | $162,636 | | $147,760 | | $103,576 | | $48,897 | | $14,311 | | $35,324 | | $20,461 | (1) | $9,927 |
Depreciation, depletion and amortization | 55,920 | | 28,221 | | 151,795 | | 96,641 | | 74,919 | | 56,833 | | 54,095 | | 53,003 | | 47,505 | | 41,707 |
Net interest expense | 1,458 | | 145 | | 679 | | 15,040 | | 16,992 | | 17,311 | | 21,466 | | 23,699 | | 24,689 | | 17,351 |
Provision for income taxes | 31,251 | | 34,149 | | 99,399 | | 86,431 | | 59,778 | | 28,372 | (2) | 8,708 | | 21,917 | | 11,457 | | 6,449 |
EBITDA | $139,617 | | $120,910 | | $414,509 | | $345,872 | | $255,265 | | $151,413 | | $98,580 | | $133,943 | | $104,112 | (1) | $75,434 |
(1) 2000 amounts exclude unusual items of $109.3 million for the Hales judgment and $2.0 million for other litigation.
(2) Provision for income taxes for 2003 includes the tax benefit associated with the cumulative effect of adoption of accounting principle.
The table below reconciles forecasted EBITDA with forecasted net income for 2007, assuming different NYMEX price scenarios and their corresponding estimated impact on the company's results for 2007, including current hedges in place, as of March 5, 2007:
| 2007 Guidance |
| NYMEX Commodity Price Assumptions |
| $6.00 Gas | $7.00 Gas | $8.00 Gas |
| $50.00 Oil | $60.00 Oil | $65.00 Oil |
| | ($ in millions) |
Net income | $170 - $175 | $200 - $205 | $245 - $250 |
Add back: | | | |
Provision for income taxes - deferred | 100 - 103 | 123 - 126 | 150 - 153 |
Interest expense | 25 - 30 | 25 - 30 | 25 - 30 |
Depreciation, depletion and amortization | 270 - 280 | 270 - 280 | 270 - 280 |
EBITDA | $575 - $585 | $615 - $625 | $685 - $695 |
Note that the information contained on this slide constitutes a "forward-looking statement".