Gross Operated Production from the Fayetteville Shale Reaches 500 MMcf/D
Company Raises Production Guidance for Remainder of 2008
Houston, Texas – July 30, 2008...Southwestern Energy Company (NYSE: SWN) today announced financial and operating results for the second quarter of 2008. Highlights include:
·
Record production of 45.1 Bcfe, up 74% over the same period in 2007
·
Record earnings of $136.6 million, up 187% from the same period in 2007
·
Record net cash provided by operating activities before changes in operating assets and liabilities (a non-GAAP measure reconciled below) of $288.2 million, up 96% from the same period in 2007
For the second quarter of 2008, Southwestern reported net income of $136.6 million, or $0.39 per diluted share, up from $47.6 million, or $0.14* per diluted share, for the same period in 2007. Net cash provided by operating activities before changes in operating assets and liabilities (a non-GAAP measure reconciled below) was $288.2 million in the second quarter of 2008, up from $146.8 million for the same period in 2007.
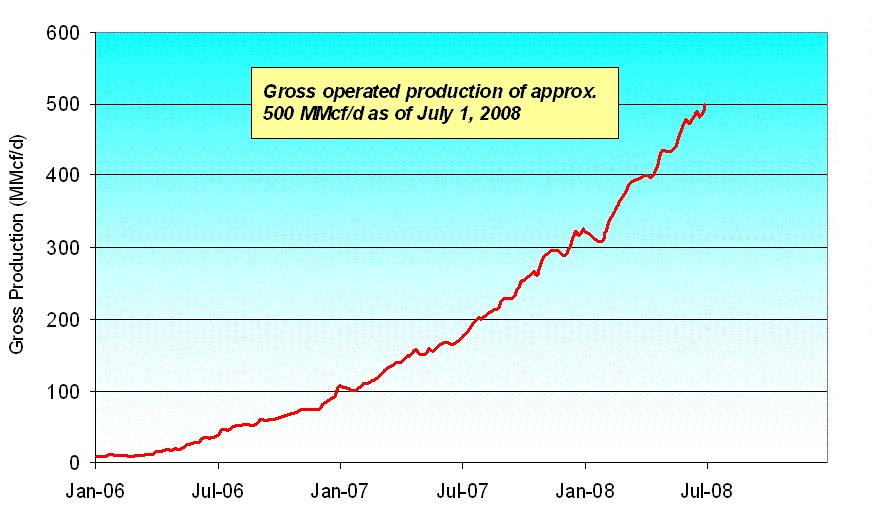
“We achieved record results in the second quarter, driven primarily by our production growth in the Fayetteville Shale and higher gas prices,” stated Harold M. Korell, Chairman and Chief Executive Officer of Southwestern Energy. “Our knowledge of how to drill and complete wells in the shale is consistently improving. These improvements are clearly visible in our production rates which, as of July 1, reflected gross daily operated production volumes from the Fayetteville of approximately 500 MMcf, up from about 200 MMcf per day a year ago. We are also seeing good results from our activities in the James Lime play in East Texas and our conventional Arkoma Basin properties.”
Net income for the six months ended June 30, 2008, was $245.6 million, or $0.71 per diluted share, up from $98.6 million, or $0.29* per diluted share, for the same period in 2007. Net cash provided by operating activities before changes in operating assets and liabilities (a non-GAAP measure reconciled below) was $571.9 million for the first six months of 2008, up 98% from $289.2 million for the same period in 2007.
* Adjusted to reflect the company’s two-for-one stock split effected in March 2008.
- MORE -
As of July 1, 2008, the company has completed the sale of, or has agreements to sell, assets resulting in total gross proceeds of approximately $1 billion. In the second quarter, the company sold certain oil and gas leases, wells and gathering equipment in its Fayetteville Shale play for $518.3 million. Additionally, the company has sold or has agreements to sell all of its oil and gas properties in the Gulf Coast and the Permian Basin for approximately $250 million in the aggregate. Approximately $179 million of these proceeds will be received in the third quarter of 2008. Finally, the company announced that it had closed the previously announced sale of its utility, Arkansas Western Gas Company, to SourceGas, LLC for approximately $230 million, subject to post-closing adjustments.
These sales impacted the company’s second quarter results in several ways. First, the proceeds from the sales of the company’s oil and gas assets were credited to the full cost pool, thus reducing its full cost pool amortization rate. Also, as a result of the tax gains related to the sales of its oil and gas properties that closed during the second quarter, the company recorded a current tax liability of approximately $47 million (all of which is related to alternative minimum tax). Southwestern also expects to record a gain on the sale of its utility assets of approximately $55 million during the third quarter of 2008.
Second Quarter 2008 Financial Results
E&P Segment - Operating income from the company’s E&P segment was $215.1 million for the second quarter of 2008, up from $81.4 million for the same period in 2007. The increase was primarily due to a 74% increase in production volumes and higher realized natural gas prices.
Southwestern’s natural gas and crude oil production totaled 45.1 Bcfe for the second quarter of 2008, up from 25.8 Bcfe for the second quarter of 2007. The increase was primarily due to growth from the company’s Fayetteville Shale play, which produced 29.6 Bcf in the second quarter of 2008, up from 23.6 Bcf in the first quarter of 2008 and 10.7 Bcf in the second quarter of 2007.
Southwestern has increased its production guidance for the remainder of 2008 as follows:
1st Quarter
2nd Quarter
3rd Quarter
4th Quarter
Full-Year 2008
Actual
Actual
Estimate
Estimate
Estimate
Previous Guidance (Bcfe)
35.0 – 36.0
41.5 – 42.5
43.0 – 44.5
44.5 – 46.0
168.0 – 172.0
Revised Guidance (Bcfe)
39.1
45.1
47.0 – 49.0
50.0 – 52.0
181.0 – 185.0
Southwestern revised its total oil and gas production guidance for 2008 to 181.0 to 185.0 Bcfe, an increase of approximately 60% over its 2007 oil and gas production. Of the 181.0 to 185.0 Bcfe of expected production in 2008, approximately 119.0 to 124.0 Bcf is expected to come from the Fayetteville Shale.
Southwestern’s average realized gas price was $8.17 per Mcf for the second quarter of 2008, including the effect of hedges, compared to $6.90 per Mcf for the second quarter of 2007. The company’s commodity hedging activities decreased its average gas price by $1.83 per Mcf during the second quarter of 2008, compared to an increase of $0.07 per
- MORE -
Mcf during the second quarter of 2007. Disregarding the impact of commodity price hedges, the company’s average price received for its gas production during the second quarter of 2008 was approximately $0.92 per Mcf lower than average NYMEX spot prices.
Southwestern’s average realized oil price was $122.26 per barrel for the second quarter of 2008, up from $61.72 per barrel for the second quarter of 2007. For calendar year 2008, the company has not hedged any of its expected crude oil production.
Lease operating expenses for the company’s E&P segment were $0.95 per Mcfe in the second quarter of 2008, compared to $0.73 per Mcfe in the second quarter of 2007. The increase was driven by higher per unit costs associated with the company’s Fayetteville Shale operations, including the impact of higher natural gas prices on the cost of compression fuel. Due to the rise in natural gas prices and the resulting higher expected compressor fuel costs, Southwestern now expects its per unit operating cost for this segment to range between $0.92 and $0.97 per Mcfe for 2008.
General and administrative expenses were $0.41 per Mcfe in the second quarter of 2008, compared to $0.48 per Mcfe in the second quarter of 2007. The decrease was primarily due to the effects of increased production volumes which more than offset increased incentive compensation, payroll and related costs associated with the expansion of the company’s E&P operations due to the Fayetteville Shale play. Southwestern added 69 new employees during the second quarter of 2008, most of which were hired in its E&P segment. Southwestern expects its cost per unit for general and administrative expenses in 2008 to range between $0.42 and $0.47 per Mcfe.
Taxes other than income taxes were $0.16 per Mcfe in the second quarter of 2008, compared to $0.21 per Mcfe in the second quarter of 2007, primarily due to the change in the mix of the company’s production volumes and the accrual of severance tax refunds related to the company’s East Texas production. Southwestern now expects taxes other than income taxes to range between $0.15 and $0.20 per Mcfe in 2008.
The company’s full cost pool amortization rate decreased to $2.01 per Mcfe in the second quarter of 2008, compared to $2.41 per Mcfe in the second quarter of 2007. The declines in the average amortization rates were the result of sales of oil and gas properties in the second quarter of 2008, the proceeds of which were credited to the full cost pool. The amortization rate is impacted by timing and amount of reserve additions and the costs associated with those additions, revisions of previous reserve estimates due to both price and well performance, write-downs that result from full cost ceiling tests, proceeds from the sale of properties that reduce the full cost pool and the levels of costs subject to amortization. The future full cost pool amortization rate cannot be predicted with accuracy due to the variability of each of the factors discussed above, as well as other factors.
Midstream Services - Operating income for the company’s midstream services segment, which is comprised of natural gas marketing and gathering activities, was $15.0 million in the second quarter of 2008, up from $2.3 million in the second quarter of 2007. The increase in operating income was primarily due to higher gathering revenues and an increase in the margin from gas marketing activities, partially offset by increased operating costs and expenses. Midstream Services is currently gathering approximately 600 MMcf
- MORE -
per day through 736 miles of gathering lines in the Fayetteville Shale play area, up from approximately 224 MMcf per day a year ago. Gathering volumes, revenues and expenses for this segment are expected to continue to grow as reserves related to the company’s Fayetteville Shale play are developed and production increases.
Natural Gas Distribution Segment - The company’s utility segment recorded a seasonal operating loss of $0.9 million in the second quarter of 2008, compared to an operating loss of $1.7 million in the second quarter of 2007.The decrease in operating loss was due to colder weather and the implementation of a rate increase which became effective in August 2007. Effective July 1, 2008, the company sold its utility, Arkansas Western Gas Company, to SourceGas, LLC for approximately $230 million, which amount is subject to post-closing adjustments. As a result of the sale of the utility, the company is no longer engaged in any natural gas distribution operations.
First Six Months of 2008 Financial Results
E&P Segment - Operating income for the E&P segment was $380.8 million in the first six months of 2008, compared to $155.7 million in the first six months of 2007. The increase was primarily due to a 73% increase in production volumes and higher realized natural gas prices.
Gas and oil production was 84.1 Bcfe in the first six months of 2008, compared to 48.7 Bcfe in the first six months of 2007. The increase resulted primarily from increased production from the company’s Fayetteville Shale play. Net production from the Fayetteville Shale was 53.2 Bcf in the first six months of 2008, compared to 18.9 Bcfe in the first six months of 2007.
Southwestern’s average realized gas price was $7.95 per Mcf, including the effect of hedges, in the first six months of 2008 compared to $6.81 per Mcf in the first six months of 2007. The company’s hedging activities decreased the average gas price realized during the first six months of 2008 by $0.87 per Mcf, compared to an increase of $0.28 per Mcf during the first six months of 2007. Disregarding the impact of hedges, the average price received for the company’s gas production during the first six months of 2008 was approximately $0.66 per Mcf lower than average NYMEX spot prices, compared to approximately $0.63 per Mcf lower than NYMEX spot prices during the first six months of 2007. Southwestern’s average realized oil price was $108.69 per barrel during the first six months of 2008, compared to $58.42 per barrel during the first six months of 2007.
Lease operating expenses for the company’s E&P segment were $0.87 per Mcfe in the first six months of 2008, compared to $0.73 per Mcfe in the first six months of 2007. The increase was due to increased gathering and compression costs, the majority of which relate to the company’s Fayetteville Shale play.
General and administrative expenses were $0.42 per Mcfe in the first six months of 2008, compared to $0.47 per Mcfe in the first six months of 2007. The decrease was primarily due to growth in the company’s production volumes. Southwestern added 115 new employees in the first six months of 2008.
- MORE -
Taxes other than income taxes were $0.16 per Mcfe during the first six months of 2008, compared to $0.23 per Mcfe during the first six months of 2007, primarily due to the effects of a changing mix of production and the accrual of severance tax refunds related to the company’s East Texas production.
The company’s full cost pool amortization rate decreased to $2.15 per Mcfe in the first six months of 2008, compared to $2.33 per Mcfe in the first six months of 2007, primarily due to the net proceeds from the sale of properties during the second quarter of 2008 that reduced the full cost pool.
Midstream Services - Operating income for the company’s midstream activities was $25.2 million in the first six months of 2008, compared to $2.3 million in the first six months of 2007. The increase in operating income was primarily due to increased gathering revenues and an increase in the margin from gas marketing activities related to the Fayetteville Shale play, partially offset by increased operating costs and expenses.
Natural Gas Distribution Segment - Operating income for Southwestern’s utility was $10.7 million in the first six months of 2008, compared to $7.7 million in the first six months of 2007. The increase in operating income resulted primarily from increases in volumes delivered due to colder weather and the implementation of a rate increase which became effective August 1, 2007. Weather during the first six months of 2008 was 4% colder than normal and 12% colder than the same period in 2007.
E&P Operations Review
Southwestern invested a total of $739.3 million in its E&P program during the first six months of 2008, compared to $670.3 million in the first half of 2007. During the first six months of 2008, the company participated in drilling 343 wells, of which 198 were producers, 3 were dry and 142 were in progress at June 30, 2008. Of the 142 wells in progress, 125 were in the company’s Fayetteville Shale play.
Fayetteville Shale- As of June 30, 2008, Southwestern had drilled and completed a total of 619 operated wells in the Fayetteville Shale play, of which 554 were horizontal. Of the 554 horizontal wells, 507 wells have been fracture stimulated using slickwater or crosslinked gel fluids. The wells are located in 33 separate pilot areas in eight counties in Arkansas.
At July 1, 2008, the company’s gross operated production rate from the Fayetteville Shale play area was approximately 500 MMcf per day, including approximately 12 MMcf per day from 14 wells producing from conventional reservoirs. The company currently has 22 drilling rigs running in its Fayetteville Shale play area, 15 that are capable of drilling horizontal wells and 7 smaller rigs that are used to drill the vertical section of the wells. The graph below provides gross production data from the company’s operated wells in the Fayetteville Shale play area.
- MORE -
For the remainder of 2008, the company plans to focus the majority of its Fayetteville Shale drilling activity where possible in areas with 3-D seismic coverage. Results from the company’s drilling activities in the second quarter of 2008, plus the previous five quarters, are as follows:
Time Frame
Wells Placed on Production
Average IP Rate (Mcf/d)
30th-Day Avg Rate (# of wells)
60th-Day Avg Rate (# of wells)
Average Lateral Length
Completion Method SW/XL/Hy-RHy
1st Qtr 2007
58
1,261
1,066 (58)
958 (58)
2,104
11/37/10
2nd Qtr 2007
46
1,497
1,254 (46)
1,034 (46)
2,512
24/12/10
3rd Qtr 2007
74
1,788
1,512 (72)
1,350 (71)
2,622
69/4/1
4th Qtr 2007
77
2,028
1,690 (77)
1,499 (76)
3,193
68/1/8
1st Qtr 2008
75
2,343
2,147 (75)
1,930 (72)
3,301
71/1/3
2nd Qtr 2008
83
2,541
2,143 (58)
1,798 (26)
3,562
83/0/0
SW – Slickwater fluids
XL – Crosslinked gel fluids
Hy-RHy – Hybrid or Reverse Hybrid method (combination slickwater/crosslinked gel fluid system)
Note: Data excludes wells which were sold in May 2008.
During the second quarter, the company’s horizontal wells had an average completed well cost of $2.8 million per well, average horizontal lateral length of 3,562 feet and average time to drill to total depth of 14 days from re-entry to re-entry. This compares to an average completed well cost of $2.9 million per well, average horizontal lateral length of 3,301 feet and average time to drill to total depth of 15 days from re-entry to re-entry during the first quarter of 2008. As the company continues to drill wells with longer laterals in some of its pilot areas, the number of drilling days and well costs may increase.
During the first half of 2008, the company began to test closer perforation cluster spacing in its horizontal wells with positive results. Southwestern has tested this technique on 38 of its wells and has seen a 15% to 20% improvement in early production over average initial
- MORE -
production of wells on which the company did not utilize this technique. Southwestern estimates that ultimate recovery on these wells could be improved by 15% to 20% and is currently planning to utilize this technique on all of its wells it plans to drill for the remainder of the year. Associated with this new completion technique and longer laterals, the company expects completed well costs to average approximately $3.0 million per well for the rest of 2008. Additionally in the second half of 2008, Southwestern plans to test the downspacing of wells at and below 80-acre spacing.
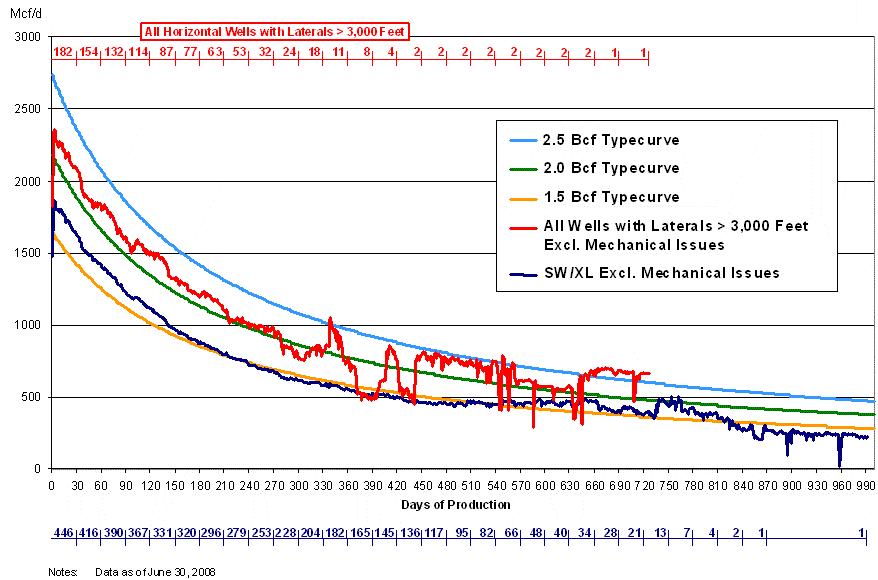
The graph below provides normalized average daily production data through June 30, 2008, for the company’s horizontal wells using slickwater and crosslinked gel fluids. The “dark blue” curve is for horizontal wells fracture stimulated with either slickwater or crosslinked gel fluid systems and excludes 28 wells which had significant mechanical issues that are negatively impacting the wells’ production performance. The “red curve” indicates results for the company’s wells with lateral lengths greater than 3,000 feet. The normalized production curves are intended to provide a qualitative indication of the company’s Fayetteville Shale wells’ performance and should not be used to estimate an individual well’s estimated ultimate recovery. The 1.5, 2.0 and 2.5 Bcf typecurves are shown solely for reference purposes and are not intended to be projections of the performance of the company’s wells.
At June 30, 2008, Southwestern held approximately 857,000 net acres in the play area, including approximately 125,400 net acres held by conventional production in the traditional Fairway portion of the Arkoma Basin.
Conventional Arkoma- Southwestern participated in drilling 46 wells in its conventional Arkoma Basin drilling program during the first six months of 2008, including 21 wells at its
- MORE -
Ranger Anticline area, resulting in production of 11.9 Bcf during the first six months of 2008, compared to 11.5 Bcf for the first six months of 2007.
East Texas- During the first half of 2008, Southwestern participated in drilling 23 wells in East Texas, 12 of which were James Lime horizontal wells. Production from the company’s East Texas properties was 16.0 Bcfe for the first six months of 2008, compared to 15.1 Bcfe for the same period last year.
At June 30, 2008, Southwestern held approximately 102,000 gross acres in its Angelina River Trend area, which consists of several separate development areas located primarily in four different counties in East Texas where the company is targeting the Pettet, Travis Peak and James Lime formations. The company drilled 18 wells in the Angelina River Trend area during the first six months of 2008, all of which were either productive or in progress at June 30, 2008. Southwestern is currently focusing its drilling activity in this area on the James Lime formation where it has 9 operated wells on production which had average gross initial production rates of 8.0 MMcf per day. Southwestern’s current net production from the James Lime is approximately 23 MMcf per day, including production from 5 outside-operated wells.
The company alsoannounced the signing of a 50/50 joint venture agreement with a private company to drill two wells targeting the Haynesville/Bossier Shale intervals in Shelby and San Augustine Counties, Texas. A portion of the company’s acreage in its Angelina River Trend area (approximately 41,500 gross acres) in Shelby, San Augustine and Nacogdoches Counties is included in the joint venture.
New Ventures - Southwestern currently has approximately 105,000 net undeveloped acres in Pennsylvania under which it believes the Marcellus Shale is prospective. The company has drilled its first two vertical wells on its acreage located in Bradford and Susquehanna Counties. The company expects to complete the wells during the third quarter. Southwestern plans to drill at least two additional test wells, one of which will be a horizontal well, on its acreage during the remainder of the year.
Explanation and Reconciliation of Non-GAAP Financial Measures
Net cash provided by operating activities before changes in operating assets and liabilities is presented because of its acceptance as an indicator of an oil and gas exploration and production company’s ability to internally fund exploration and development activities and to service or incur additional debt. The company has also included this information because changes in operating assets and liabilities relate to the timing of cash receipts and disbursements which the company may not control and may not relate to the period in which the operating activities occurred. Net cash provided by operating activities before changes in operating assets and liabilities should not be considered in isolation or as a substitute for net cash provided by operating activities prepared in accordance with generally accepted accounting principles. The table below reconciles net cash provided by operating activities before changes in operating assets and liabilities with net cash provided by operating activities as derived from the company's financial information.
- MORE -
3 Months Ended June 30,
6 Months Ended June 30,
2008
2007
2008
2007
(in thousands)
Net cash provided by operating activities before changes in operating assets and liabilities
$
288,230
$
146,783
$
571,947
$
289,186
Add back (deduct):
Change in operating assets and liabilities
2,935
(16,976)
16,305
(30,968)
Net cash provided by operating activities
$
291,165
$
129,807
$
588,252
$
258,218
Southwestern will host a teleconference call on Thursday, July 31, 2008, at 10:00 a.m. Eastern to discuss the company’s second quarter 2008 financial and operating results. The toll-free number to call is 888-239-5257 and the reservation number is 4335208. The teleconference can also be heard “live” on the Internet athttp://www.swn.com.
Southwestern Energy Company is an integrated natural gas company whose wholly-owned subsidiaries are engaged in oil and gas exploration and production and natural gas gathering and marketing. Additional information on the company can be found on the Internet athttp://www.swn.com.
Contacts:
Greg D. Kerley
Brad D. Sylvester, CFA
Executive Vice President
Manager, Investor Relations
and Chief Financial Officer
(281) 618-4897
(281) 618-4803
All statements, other than historical financial information, may be deemed to be forward-looking statements within the meaning of Section 27A of the Securities Act of 1933, as amended, and Section 21E of the Securities Exchange Act of 1934, as amended. All statements that address activities, outcomes and other matters that should or may occur in the future, including, without limitation, statements regarding the financial position, business strategy, production and reserve growth and other plans and objectives for the company’s future operations, are forward-looking statements. Although the company believes the expectations expressed in such forward-looking statements are based on reasonable assumptions, such statements are not guarantees of future performance and actual results or developments may differ materially from those in the forward-looking statements. The company has no obligation and makes no undertaking to publicly update or revise any forward-looking statements. You should not place undue reliance on forward-looking statements. They are subject to known and unknown risks, uncertainties and other factors that may affect the company’s operations, markets, products, services and prices and cause its actual results, performance or achievements to be materially different from any future results, performance or achievements expressed or implied by the forward-looking statements. In addition to any assumptions and other factors referred to specifically in connection with forward-looking statements, risks, uncertainties and factors that could cause the company’s actual results to differ materially from those indicated in any forward-looking statement include, but are not limited to: the timing and extent of changes in market conditions and prices for natural gas and oil (including regional basis differentials); the timing and extent of the company’s success in discovering, developing, producing and estimating reserves; the economic viability of, and the company’s success in drilling, the company’s large acreage position in the Fayetteville Shale play, overall as well as relative to other productive shale gas plays; the company’s ability to fund the company’s planned
- MORE -
capital investments; the company’s ability to determine the most effective and economic fracture stimulation for the Fayetteville Shale formation; the impact of federal, state and local government regulation, including any increase in severance taxes; the costs and availability of oil field personnel services and drilling supplies, raw materials, and equipment and services; the company’s future property acquisition or divestiture activities; increased competition; the financial impact of accounting regulations and critical accounting policies; the comparative cost of alternative fuels; conditions in capital markets and changes in interest rates, and any other factors listed in the reports the company has filed and may file with the Securities and Exchange Commission (SEC). For additional information with respect to certain of these and other factors, see the reports filed by the company with the SEC. The company disclaims any intention or obligation to update or revise any forward-looking statements, whether as a result of new information, future events or otherwise.
Financial Summary Follows
OPERATING STATISTICS (Unaudited)
Page 1 of 5
Southwestern Energy Company and Subsidiaries
Three Months
Six Months
Periods Ended June 30
2008
2007
2008
2007
Exploration & Production
Production
Gas production (MMcf)
44,312
24,848
82,517
46,734
Oil production (MBbls)
127
166
269
333
Total equivalent production (MMcfe)
45,075
25,841
84,132
48,732
Commodity Prices
Average gas price per Mcf, including hedges
$8.17
$6.90
$7.95
$6.81
Average gas price per Mcf, excluding hedges
$10.00
$6.83
$8.82
$6.53
Average oil price per Bbl
$122.26
$61.72
$108.69
$58.42
Operating Expenses per Mcfe
Lease operating expenses
$0.95
$0.73
$0.87
$0.73
General & administrative expenses
$0.41
$0.48
$0.42
$0.47
Taxes, other than income taxes
$0.16
$0.21
$0.16
$0.23
Full cost pool amortization
$2.01
$2.41
$2.15
$2.33
Midstream
Gas volumes gathered (MMcf)
49,911
15,523
88,410
26,236
Gas volumes marketed (MMcf)
59,512
32,270
109,604
59,357
Gas Distribution
Sales and end-use transportation deliveries (Bcf)
4.3
4.2
14.5
13.7
Sales customers at period end
150,181
149,272
150,181
149,272
Average sales rate per Mcf
$13.69
$11.34
$11.61
$10.85
Heating weather - degree days
391
359
2,588
2,300
- - percent of normal
128%
111%
104%
92%
STATEMENTS OF OPERATIONS (Unaudited)
Page 2 of 5
Southwestern Energy Company and Subsidiaries
Three Months
Six Months
Periods Ended June 30
2008
2007
2008
2007
(in thousands, except share/per share amounts)
Operating Revenues
Gas sales
$ 368,879
$ 184,059
$ 729,550
$ 395,703
Gas marketing
208,071
72,238
345,298
127,555
Oil sales
15,538
10,216
29,251
19,453
Gas gathering, transportation and other
11,882
3,569
24,377
12,023
604,370
270,082
1,128,476
554,734
Operating Costs and Expenses
Gas purchases – midstream services
202,889
69,488
335,341
122,705
Gas purchases – gas distribution
9,544
7,427
61,439
55,408
Operating expenses
30,030
20,485
54,026
40,522
General and administrative expenses
25,741
17,935
49,481
34,683
Depreciation, depletion and amortization
98,151
66,435
195,248
122,220
Taxes, other than income taxes
8,729
6,306
16,145
13,431
375,084
188,076
711,680
388,969
Operating Income
229,286
82,006
416,796
165,765
Interest Expense
Interest on long-term debt
15,659
7,384
32,745
11,509
Other interest charges
619
545
1,267
926
Interest capitalized
(7,281)
(2,923)
(13,486)
(5,971)
8,997
5,006
20,526
6,464
Other Income (Loss)
169
(125)
176
(104)
Income Before Income Taxes and Minority Interest
220,458
76,875
396,446
159,197
Minority Interest in Partnership
(215)
(111)
(350)
(194)
Income Before Income Taxes
220,243
76,764
396,096
159,003
Provision for Income Taxes
Current
46,500
―
46,500
―
Deferred
37,193
29,170
104,017
60,421
83,693
29,170
150,517
60,421
Net Income
$ 136,550
$ 47,594
$ 245,579
$ 98,582
Earnings Per Share(1)
Basic
$ 0.40
$ 0.14
$ 0.72
$ 0.29
Diluted
$ 0.39
$ 0.14
$ 0.71
$ 0.29
Weighted Average Common Shares Outstanding(1)
Basic
341,402,888
338,933,824
341,233,574
338,073,050
Diluted
346,551,198
345,001,082
346,287,843
344,537,804
(1) 2007 restated to reflect the two-for-one stock split effected on March 25, 2008.
BALANCE SHEETS (Unaudited)
Page 3 of 5
Southwestern Energy Company and Subsidiaries
June 30
2008
2007
(in thousands)
ASSETS
Current Assets(1)
$ 805,993
$ 270,303
Property, Plant and Equipment, at cost
4,510,372
3,507,492
Less: Accumulated depreciation, depletion and amortization
1,392,380
1,032,294
3,117,992
2,475,198
Other Assets(1)
213,475
183,493
$4,137,460
$2,928,994
LIABILITIES AND STOCKHOLDERS’ EQUITY
Current Liabilities(1)
$ 1,169,449
$ 409,586
Long-Term Debt
674,800
496,100
Deferred Income Taxes
450,089
402,542
Long-Term Hedging Liability
301,668
15,965
Other Liabilities(1)
67,734
54,972
Commitments and Contingencies
Minority Interest in Partnership
10,718
11,093
Stockholders’ Equity
Common stock, $.01 par value, authorized 540,000,000 shares, issued 342,786,381 shares in 2008 and 340,403,984 in 2007(2)
3,428
3,404
Additional paid-in capital(2)
798,750
764,352
Retained earnings
1,127,610
759,439
Accumulated other comprehensive income (loss)
(462,061)
11,541
Common stock in treasury, 224,594 shares in 2008
(4,725)
—
1,463,002
1,538,736
$ 4,137,460
$ 2,928,994
(1) Amounts include assets and liabilities for the Natural Gas Distribution segment that are classified as “held for sale.”
(2) 2007 restated to reflect the two-for-one stock split effected on March 25, 2008.
STATEMENTS OF CASH FLOWS (Unaudited)
Page 4 of 5
Southwestern Energy Company and Subsidiaries
Six Months
Periods Ended June 30
2008
2007
(in thousands)
Cash Flows From Operating Activities
Net income
$ 245,579
$ 98,582
Adjustments to reconcile net income to net cash provided by operating activities:
Depreciation, depletion and amortization
196,411
122,887
Deferred income taxes
104,017
60,421
Unrealized loss on derivatives
20,345
4,589
Stock-based compensation expense
5,839
2,648
Gain on sale of property, plant and equipment
(392)
―
Minority interest in partnership
148
59
Change in assets and liabilities
16,305
(30,968)
Net cash provided by operating activities
588,252
258,218
Cash Flows From Investing Activities
Capital investments
(812,421)
(704,583)
Proceeds from sale of property, plant and equipment
590,513
2,712
Other items
(296)
158
Net cash used in investing activities
(222,204)
(701,713)
Cash Flows From Financing Activities
Debt retirement
(600)
(600)
Payments on revolving long-term debt
(1,843,600)
(355,200)
Borrowings under revolving long-term debt
1,001,400
715,300
Proceeds from issuance of long-term debt
600,000
―
Debt issuance costs and revolving credit facility costs
(8,895)
(1,275)
Excess tax benefit for stock-based compensation
39,332
17,764
Change in bank drafts outstanding
19,643
21,056
Proceeds from exercise of common stock options
2,067
3,834
Net cash provided by (used in) financing activities
(190,653)
400,879
Increase (decrease) in cash and cash equivalents
175,395
(42,616)
Cash and cash equivalents at beginning of year(1)
1,832
42,927
Cash and cash equivalents at end of period(1)
$ 177,227
$ 311
(1) Cash and cash equivalents includes amounts classified as “held for sale.”
SEGMENT INFORMATION (Unaudited)
Page 5 of 5
Southwestern Energy Company and Subsidiaries
Exploration
Natural Gas
&
Midstream
Distribution
Production
Services
& Other
Eliminations
Total
(in thousands)
Quarter Ending June 30, 2008
Revenues
$ 377,725
$ 639,758
$ 33,631
$ (446,744)
$ 604,370
Gas purchases
—
609,366
20,463
(417,396)
212,433
Operating expenses
42,964
8,967
7,299
(29,200)
30,030
General & administrative expenses
18,378
3,333
4,178
(148)
25,741
Depreciation, depletion & amortization
94,031
2,370
1,750
—
98,151
Taxes, other than income taxes
7,266
720
743
—
8,729
Operating Income (Loss)
$ 215,086
$ 15,002
$ (802)
$ —
$ 229,286
Capital Investments(1)
$ 362,821
$ 47,878
$ 4,843
$ —
$ 415,542
Quarter Ending June 30, 2007
Revenues
$ 181,798
$ 233,667
$ 27,717
$ (173,100)
$ 270,082
Gas purchases
—
224,221
16,186
(163,492)
76,915
Operating expenses
18,816
4,362
6,772
(9,465)
20,485
General & administrative expenses
12,287
1,858
3,933
(143)
17,935
Depreciation, depletion & amortization
64,039
744
1,652
—
66,435
Taxes, other than income taxes
5,304
172
830
—
6,306
Operating Income (Loss)
$ 81,352
$ 2,310
$ (1,656)
$ —
$ 82,006
Capital Investments(1)
$ 369,125
$ 23,660
$ 4,056
$ —
$ 396,841
Six Months Ending June 30, 2008
Revenues
$ 689,742
$ 1,045,083
$ 117,934
$ (724,283)
$ 1,128,476
Gas purchases
—
992,426
79,120
(674,766)
396,780
Operating expenses
73,213
15,902
14,139
(49,228)
54,026
General & administrative expenses
34,931
6,126
8,713
(289)
49,481
Depreciation, depletion & amortization
187,337
4,407
3,504
—
195,248
Taxes, other than income taxes
13,465
1,059
1,621
—
16,145
Operating Income
$ 380,796
$ 25,163
$ 10,837
$ —
$ 416,796
Capital Investments(1)
$ 739,335
$ 79,323
$ 6,742
$ —
$ 825,400
Six Months Ending June 30, 2007
Revenues
$ 343,059
$ 412,256
$ 104,823
$ (305,404)
$ 554,734
Gas purchases
—
395,900
70,403
(288,190)
178,113
Operating expenses
35,796
8,358
13,294
(16,926)
40,522
General & administrative expenses
23,068
3,528
8,375
(288)
34,683
Depreciation, depletion & amortization
117,113
1,786
3,321
—
122,200
Taxes, other than income taxes
11,420
363
1,648
—
13,431
Operating Income
$ 155,662
$ 2,321
$ 7,782
$ —
$ 165,765
Capital Investments(1)
$ 670,323
$ 45,280
$ 8,491
$ —
$ 724,094
(1) Capital investments include a reduction of $6.8 million and an increase of $10.0 million for the three- and six-month periods ended June 30, 2008, respectively, and increases of $64.0 million and $17.7 million for the three- and six-months periods ended June 30, 2007, respectively, relating to the change in accrued expenditures between periods.
We use cookies on this site to provide a more responsive and personalized service. Continuing to browse, clicking I Agree, or closing this banner indicates agreement. See our Cookie Policy for more information.