Company Updates Well Spacing Results in the Fayetteville Shale
Houston, Texas – October 28, 2010...Southwestern Energy Company (NYSE: SWN) today announced financial and operating results for the third quarter of 2010. Highlights include:
·
Net income of $160.7 million, up 36% from the same period in 2009
·
Net cash provided by operating activities before changes in operating assets and liabilities of $421.1 million (a non-GAAP measure reconciled below), up 27% from the same period in 2009
·
Natural gas and crude oil production of 105.0 Bcfe, up 44% over the same period in 2009
For the third quarter of 2010, Southwestern reported net income of $160.7 million, or $0.46 per diluted share, compared to $118.3 million, or $0.34 per diluted share, for the prior year period. Net cash provided by operating activities before changes in operating assets and liabilities (a non-GAAP measure; see reconciliation below) was $421.1 million for the third quarter of 2010, up 27% from $331.8 million in the third quarter of 2009.
“We had an excellent quarter,” stated Steve Mueller, President and Chief Executive Officer. “Our earnings and cash flow were up significantly compared to last year, despite lower gas prices, primarily driven by our production growth of 44% compared to last year and 7% sequentially.”
“We also are beginning to better understand the well spacing for the Fayetteville Shale play. Previously, we have stated that based on the wells drilled to date, we expected a minimum of 10 to 12 wells per section to effectively drain the reserves, which would represent approximately 65-acre spacing. Early production performance from recent well spacing tests indicates that there are areas of the field that may be economically developed at tighter spacing. At this time, we have confirmed that approximately 20% of the roughly 600,000 net acres drilled to date can be developed at 30- to 40-acre spacing, approximately 40% of that acreage can be developed at 65-acre spacing, and the remaining 40% of the acreage needs more test data to determine if development on tighter spacing than 65-acres would be economic. We will continue with our well spacing program to better define the areas of the field that are suitable for tighter spacing and expect to know more about well spacing on the remainder of our acreage in 2011. We also continue to drive down our costs and have begun to see meaningful reductions in our drilling time. In response to the low gas prices we see today, we have
- MORE -
dropped our horizontal rig count to 13 rigs in the Fayetteville Shale. With our low cost structure and large inventory of wells in the Fayetteville Shale, we are well-positioned to weather the current low gas price environment with profitable growth in production and reserves.”
Third Quarter 2010 Financial Results
E&P Segment- Operating income from the company’s E&P segment was $216.7 million for the third quarter of 2010, up 26% compared to $172.0 million for the same period in 2009. The increase was primarily due to higher production volumes, which were partially offset by lower realized gas prices and increased operating costs and expenses.
Gas and oil production totaled 105.0 Bcfe in the third quarter of 2010, up 44% from 73.2 Bcfe in the third quarter of 2009, and included 92.3 Bcf from the company’s Fayetteville Shale play, up from 58.8 Bcf in the third quarter of 2009.
Including the effect of hedges, Southwestern’s average realized gas price in the third quarter of 2010 was $4.67 per Mcf, compared to $5.06 per Mcf in the third quarter of 2009. The company’s commodity hedging activities increased its average gas price by $0.76 per Mcf during the third quarter of 2010, compared to an increase of $2.21 per Mcf during the same period in 2009. At October 25, 2010, Southwestern had approximately 44 Bcf of its remaining 2010 projected natural gas production hedged through fixed price swaps and collars at a weighted average floor price of $6.26 per Mcf. The company also had approximately 92 Bcf of its 2011 forecasted gas production hedged at an average floor price of $5.61 per Mcf and approximately 80 Bcf of its 2012 forecasted gas production hedged at an average floor price of $5.50 per Mcf.
Disregarding the impact of commodity price hedges, the company’s average price received for its gas production during the third quarter of 2010 was approximately $0.47 per Mcf lower than average monthly NYMEX settlement prices, compared to approximately $0.54 per Mcf lower during the third quarter of 2009. As of September 30, 2010, the company had basis protected on approximately 51 Bcf of its fourth quarter 2010 expected gas production through financial hedging activities and physical sales arrangements at a differential to NYMEX gas prices of approximately $0.10 per Mcf. The company sells its gas at a discount to NYMEX due to transportation and fuel costs, in addition to basis differentials. For the fourth quarter of 2010, the company expects its total gas sales discount to NYMEX to range from $0.45 to $0.50 per Mcf.
Lease operating expenses per unit of production for the company’s E&P segment were $0.85 per Mcfe in the third quarter of 2010, compared to $0.76 per Mcfe in the third quarter of 2009. The increase was primarily due to increased gathering and compression costs related to its Fayetteville Shale operations.
General and administrative expenses per unit of production were $0.28 per Mcfe in the third quarter of 2010, compared to $0.38 per Mcfe in the third quarter of 2009. The decrease was primarily due to the effects of the company’s increased production volumes which more than offset increased payroll, incentive compensation and other
- MORE -
employee-related costs primarily associated with the expansion of the company’s operations in the Fayetteville Shale play.
Taxes other than income taxes per unit of production were $0.12 per Mcfe in the third quarter of 2010, compared to $0.10 per Mcfe in the third quarter of 2009. Taxes other than income taxes vary due to changes in severance and ad valorem taxes that result from the mix of the company’s volumes and fluctuations in commodity prices.
The company’s full cost pool amortization rate was $1.31 per Mcfe in the third quarter of 2010, down from $1.43 per Mcfe in the third quarter of 2009. The decrease in the average amortization ratewas primarily due to lower finding and development costs as well as the sale of certain East Texas oil and gas leases and wells in the second quarter of 2010 as the proceeds from the sale were credited to the full cost pool. The amortization rate is impacted by the timing and amount of reserve additions and the costs associated with those additions, revisions of previous reserve estimates due to both price and well performance, impairments that result from full cost ceiling tests, proceeds from the sale of properties that reduce the full cost pool and the levels of costs subject to amortization. The future full cost pool amortization rate cannot be predicted with accuracy due to the variability of each of the factors discussed above, as well as other factors.
Midstream Services- Operating income for the company’s Midstream Services segment, which is comprised of natural gas gathering and marketing activities, was $53.4 million for the third quarter of 2010, up more than double from $25.1 million for the third quarter of 2009. The increase in operating income was primarily due to the increase in gathering revenues and an increase in the margin from gas marketing activities related to the company’s Fayetteville Shale play, partially offset by increased operating costs and expenses. At October 25, 2010, the company’s Midstream Services segment was gathering approximately 1,717 MMcf per day through 1,524 miles of gathering lines in the Fayetteville Shale play area, up from approximately 1,304 MMcf per day through 1,091 miles of gathering lines a year ago. Gathering volumes, revenues and expenses for this segment are expected to continue to grow as reserves related to the company’s Fayetteville Shale play are developed and production increases.
First Nine Months of 2010 Financial Results
For the first nine months of 2010, Southwestern reported net income of $454.6 million, or $1.30 per diluted share, compared to a net loss of $193.5 million, or $0.56 per diluted share, in the same period in 2009 which included a first quarter $907.8 million non-cash ceiling test impairment ($558.3 million net of taxes) of the company’s natural gas and oil properties resulting from lower natural gas prices. Excluding the non-cash impairment, Southwestern’s net income for the first nine months of 2009 was $364.8 million, or $1.06 per diluted share (both are non-GAAP measures; see reconciliation below).
Net cash provided by operating activities before changes in operating assets and liabilities (a non-GAAP measure; see reconciliation below) was $1.18 billion for the first nine months of 2010, up 15% compared to $1.03 billion for the same period in 2009.
E&P Segment - Operating income from the company’s E&P segment was $629.6
- MORE -
million for the nine months ended September 30, 2010, up 20% compared to $526.4 million for the same period in 2009, excluding the non-cash impairment (a non-GAAP measure; see reconciliation below). The increase was primarily due to higher production volumes, partially offset by lower realized gas prices and increased operating costs and expenses.
Gas and oil production was 293.3 Bcfe in the first nine months of 2010, up 39% compared to 211.4 Bcfe in the first nine months of 2009, and included 251.4 Bcf from the company’s Fayetteville Shale play, up from 169.6 Bcfe in the first nine months of 2009.
Southwestern’s average realized gas price was $4.76 per Mcf, including the effect of hedges, in the first nine months of 2010 compared to $5.31 per Mcf in the first nine months of 2009. The company’s hedging activities increased the average gas price realized during the first nine months of 2010 by $0.64 per Mcf, compared to an increase of $2.15 per Mcf during the first nine months of 2009. Disregarding the impact of hedges, the average price received for the company’s gas production during the first nine months of 2010 was approximately $0.47 per Mcf lower than average monthly NYMEX settlement prices, compared to approximately $0.77 per Mcf lower than NYMEX gas prices during the first nine months of 2009.
Lease operating expenses for the company’s E&P segment were $0.83 per Mcfe in the first nine months of 2010, compared to $0.76 per Mcfe in the first nine months of 2009. The increase was primarily due to increased gathering and compression costs and increased costs associated with higher water disposal volumes in the company’s Fayetteville Shale operations.
General and administrative expenses were $0.29 per Mcfe in the first nine months of 2010, compared to $0.34 per Mcfe in the first nine months of 2009. The decrease was primarily due to the effects of the company’s increased production volumes which more than offset increased compensation and employee-related costs primarily associated with the expansion of the company’s E&P operations in the Fayetteville Shale play.
Taxes other than income taxes were $0.12 per Mcfe during the first nine months of 2010, compared to $0.10 per Mcfe during the first nine months of 2009.
The company’s full cost pool amortization rate decreased to $1.35 per Mcfe in the first nine months of 2010, compared to $1.56 per Mcfe in the first nine months of 2009, primarily due to the $907.8 million non-cash ceiling test impairment recorded in the first quarter of 2009 and the result of lower finding and development costs.
Midstream Services - Operating income for the company’s midstream activities was $134.8 million in the first nine months of 2010, compared to $80.3 million in the first nine months of 2009. The increase in operating income was primarily due to increased gathering revenues and an increase in the margin from gas marketing activities related to the Fayetteville Shale play, partially offset by increased operating costs and expenses.
- MORE -
Capital Investments- For the first nine months of 2010, Southwestern invested a total of approximately $1.5 billion, compared to $1.4 billion during the first nine months of 2009, which included $1.3 billion invested in its E&P business and $216.0 million invested in its Midstream Services segment. Of the approximately $1.3 billion invested in its E&P business, $968.7 million was invested in its Fayetteville Shale play, $117.9 million in East Texas, $55.4 million in Appalachia, $110.7 million in New Ventures and $10.2 million in its conventional Arkoma Basin program.
E&P Operations Review
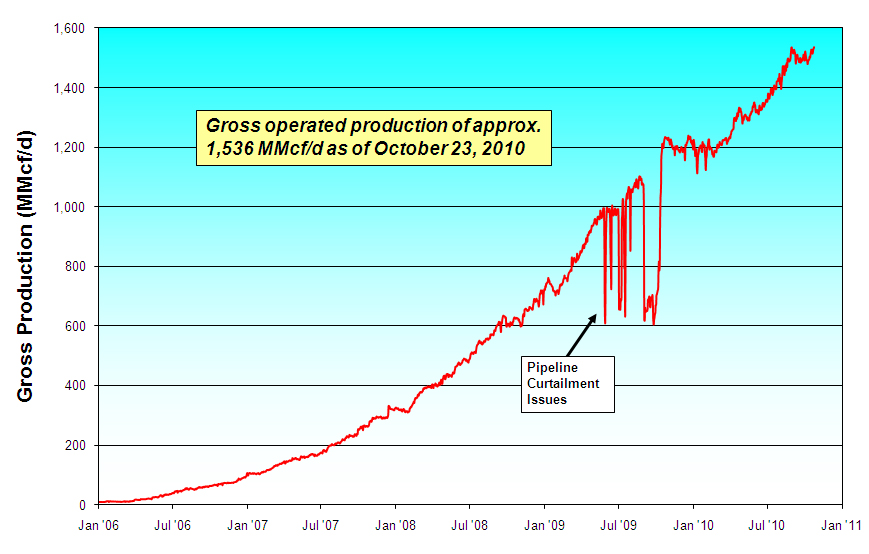
Fayetteville Shale Play– During the third quarter of 2010, Southwestern placed a total of 145 operated wells on production in the Fayetteville Shale play, all of which were horizontal wells fracture stimulated using slickwater. At October 23, 2010, the company’s gross production rate from the Fayetteville Shale play was 1,536 MMcf per day, up from approximately 1,230 MMcf per day a year ago. The company is currently utilizing 22 drilling rigs in its Fayetteville Shale play, including 13 that are capable of drilling horizontal wells and 9 smaller rigs that are used to drill the vertical portion of the wells. The graph below provides gross production data from the company’s operated wells in the Fayetteville Shale play area through October 23, 2010.
During the third quarter of 2010, the company’s horizontal wells had an average completed well cost of $2.8 million per well, average horizontal lateral length of 4,503 feet and average time to drill to total depth of 11 days from re-entry to re-entry. This compares to an average completed well cost of $3.1 million per well, average horizontal lateral length of 4,532 feet and average time to drill to total depth of 13 days from re-entry to re-entry in the second quarter of 2010. In the third quarter, the company had 8
- MORE -
wells placed on production which had average times to drill to total depth of 5 days or less from re-entry to re-entry.
The company’s wells placed on production during the third quarter of 2010 averaged initial production rates of 3,281 Mcf per day, down 5% from average initial production rates of 3,449 Mcf per day in the second quarter of 2010. Results for the third quarter of 2010 include 58 wells (40%) placed on production which were the first well in a new section. The company also placed 5 wells on production in the third quarter of 2010 which were completed before 2008 using older completion techniques and shorter laterals, but were not on production until recently due to pipeline infrastructure. Excluding these 5 wells, the company’s average initial production rate would have been 3,335 Mcf per day. The company also set a new record during the third quarter by placing the play’s highest rate well, the Harlan 09-10 #1-12H located in Cleburne County, on production with an initial production rate of approximately 8.7 MMcf per day with a 3,900-foot completed lateral. Results from the company’s drilling activities from 2007 by quarter are shown below.
Time Frame
Wells Placed on Production
Average IP Rate (Mcf/d)
30th-Day Avg Rate (# of wells)
60th-Day Avg Rate (# of wells)
Average Lateral Length
1st Qtr 2007
58
1,261
1,066 (58)
958 (58)
2,104
2nd Qtr 2007
46
1,497
1,254 (46)
1,034 (46)
2,512
3rd Qtr 2007
74
1,769
1,510 (72)
1,334 (72)
2,622
4th Qtr 2007
77
2,027
1,690 (77)
1,481 (77)
3,193
1st Qtr 2008
75
2,343
2,147 (75)
1,943 (74)
3,301
2nd Qtr 2008
83
2,541
2,155 (83)
1,886 (83)
3,562
3rd Qtr 2008
97
2,882
2,560 (97)
2,349 (97)
3,736
4th Qtr 2008(1)
74
3,350(1)
2,722 (74)
2,386 (74)
3,850
1st Qtr 2009(1)
120
2,992(1)
2,537 (120)
2,293 (120)
3,874
2nd Qtr 2009
111
3,611
2,833 (111)
2,556 (111)
4,123
3rd Qtr 2009
93
3,604
2,640 (92)
2,275 (92)
4,100
4th Qtr 2009
122
3,727
2,674 (122)
2,360 (120)
4,303
1st Qtr 2010(2)
106
3,197(2)
2,388 (106)
2,123 (106)
4,348
2nd Qtr 2010
143
3,449
2,575 (141)
2,329 (141)
4,532
3rd Qtr 2010
145
3,281
2,439 (118)
2,309 (73)
4,503
Note: Results as of September 30, 2010.
(1)
The significant increase in the average initial production rate for the fourth quarter of 2008 and the subsequent decrease for the first quarter of 2009 primarily reflected the impact of the delay in the Boardwalk Pipeline.
(2)
In the first quarter of 2010, the company’s results were impacted by the shift of all wells to “green completions” and the mix of wells, as a large percentage of wells were placed on production in the shallower northern and far eastern borders of the company’s acreage.
The company continues to test tighter well spacing and, at September 30, 2010, had placed 523 wells on production that have well spacing of 700 feet or less, representing approximately 65-acre spacing or less. Previously, the company has stated that based on the wells drilled to date, it expected a minimum of 10 to 12 wells per section to effectively drain the reserves, which would represent approximately 65-acre spacing. Early production performance from recent well spacing tests indicates that there are areas of the field that may be economically developed at tighter spacing. At this time, the company believes that approximately 20% of the approximately 600,000 net acres drilled to date can be developed at 30- to 40-acre spacing, approximately 40% can be developed at 65-acre spacing and the remaining 40% of that acreage needs more results from testing to determine if development on tighter spacing than 65-acres would
- MORE -
be economic. The company will continue its well spacing program to better define the areas of the field that are suitable for tighter spacing and expects to know more about well spacing on the remainder of its acreage in 2011.
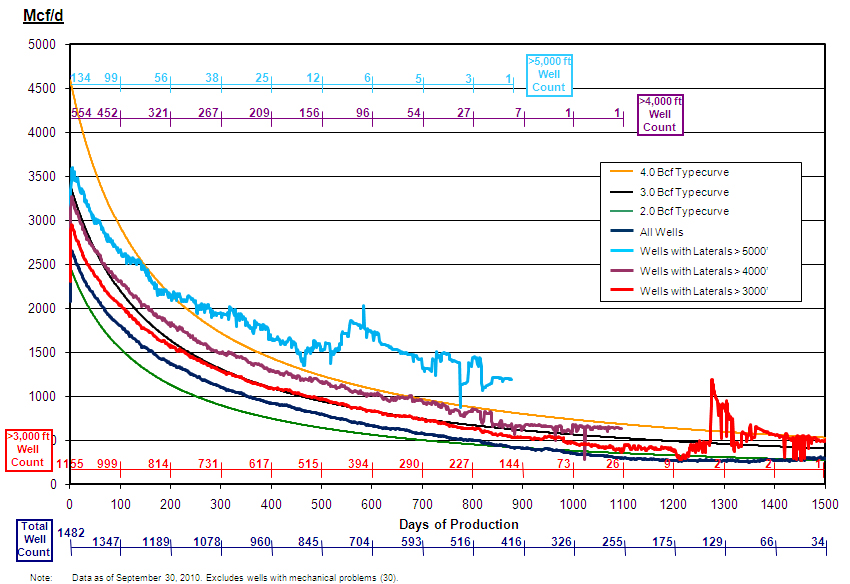
The graph below provides normalized average daily production data through September 30, 2010, for the company’s horizontal wells using slickwater and crosslinked gel fluids. The “dark blue curve” is for horizontal wells fracture stimulated with either slickwater or crosslinked gel fluid. The “red curve” indicates results for the company’s wells with lateral lengths greater than 3,000 feet, while the “purple curve” indicates results for the company’s wells with lateral lengths greater than 4,000 feet and the “light blue curve” indicates results for the company’s wells with lateral lengths greater than 5,000 feet. The normalized production curves are intended to provide a qualitative indication of the company’s Fayetteville Shale wells’ performance and should not be used to estimate an individual well’s estimated ultimate recovery. The 2.0, 3.0 and 4.0 Bcf typecurves are shown solely for reference purposes and are not intended to be projections of the performance of the company’s wells.
At September 30, 2010, Southwestern held approximately 889,000 net acres in the play area (including approximately 125,000 net acres in the traditional Fairway portion of the Arkoma Basin).
East Texas– Production from the company’s East Texas properties was 26.9 Bcfe during the first nine months of 2010, compared to 24.6 Bcfe during the same period last year. Southwestern has participated in drilling 21 wells in East Texas during the first
- MORE -
nine months of 2010, 11 of which were James Lime horizontal wells, 6 of which were Haynesville horizontal wells and 4 of which were Pettet horizontal oil wells. Initial production rates from James Lime wells that were placed on production during the third quarter averaged 8.0 MMcfe per day.
On June 30, 2010, Southwestern closed the previously announced sale of certain oil and gas leases, wells and gathering equipment held by the company in East Texas. Total net proceeds from the sale were $355.8 million. The sale included only theproducing rights to the Haynesville and Middle Bossier Shale intervals in approximately 20,063 net acres. The company has retained the drilling and producing rights covering all other depths in the acreage, including the company’s current James Lime and Pettet drilling programs. Approximately 2.1 Bcfe of company’s 2010 production was related to its Haynesville and Middle Bossier properties which were sold in June.
Southwestern still has approximately 10,500 net acres with Haynesville and Middle Bossier Shale potential. The company has drilled three wells on this acreage (Hawthorne prospect), the Timberstar Blackstone A-1H well targeting the Haynesville Shale formation and the Harris B-1H and Crest C-1H wells targeting the Middle Bossier Shale formation.The Blackstone well was placed on production in August at an initial production rate of 13.2 MMcf per day. The Harris and Crest wells will be completed in the first quarter of 2011.
Conventional Arkoma Program – (Outside the Fayetteville Shale play area) Production from the company’s conventional Arkoma Basin properties was 14.8 Bcf for the first nine months of 2010, compared to 16.9 Bcf for the first nine months of 2009. Southwestern has participated in drilling 8 wells in its conventional Arkoma Basin properties during the first nine months of 2010.
Appalachia– At September 30, 2010, Southwestern held approximately 151,000 net undeveloped acres in Pennsylvania under which it believes the Marcellus Shale is prospective. In 2010, the company has drilled 9 horizontal wells, 3 of which are currently being completed. Approximately 15 wells are expected to be drilled by Southwestern in 2010, 7 of which are expected to be completed by year-end.
In July 2010, the company placed the Greenzweig #1-H well, its first horizontal well which was drilled in 2008, on production and at the company’s second quarter earnings release date it was producing approximately 3.3 MMcf per day without compression into the pipeline with just over 3,000 psi of flowing tubing pressure. The Greenzweig #1-H well was drilled in late-2008 and had a 2,945-foot horizontal lateral and was fractured stimulated with slickwater in 7 stages. Production from the company’s Appalachia properties was approximately 0.2 Bcf in the third quarter of 2010.
Explanation and Reconciliation of Non-GAAP Financial Measures
We report our financial results in accordance with accounting principles generally accepted in the United States of America (“GAAP”). However, management believes certain non-GAAP performance measures may provide users of this financial information with additional meaningful comparisons between current results and the results of our peers and of prior periods.
- MORE -
One such non-GAAP financial measure is net cash provided by operating activities before changes in operating assets and liabilities. Management presents this measure because (i) it is accepted as an indicator of an oil and gas exploration and production company’s ability to internally fund exploration and development activities and to service or incur additional debt, (ii) changes in operating assets and liabilities relate to the timing of cash receipts and disbursements which the company may not control and (iii) changes in operating assets and liabilities may not relate to the period in which the operating activities occurred.
Additional non-GAAP financial measures we may present from time to time are net income attributable to Southwestern Energy, diluted earnings per share attributable to Southwestern Energy stockholders and our E&P segment operating income, all which exclude certain charges or amounts. Management presents these measures because (i) they are consistent with the manner in which the Company’s performance is measured relative to the performance of its peers, (ii) these measures are more comparable to earnings estimates provided by securities analysts, and (iii) charges or amounts excluded cannot be reasonably estimated and guidance provided by the Company excludes information regarding these types of items. These adjusted amounts are not a measure of financial performance under GAAP.
See the reconciliations below of GAAP financial measures to non-GAAP financial measures for the three and nine months ended September 30, 2010 and September 30, 2009. Non-GAAP financial measures should not be considered in isolation or as a substitute for the Company's reported results prepared in accordance with GAAP.
3 Months Ended Sept. 30,
2010
2009
(in thousands)
Cash flow from operating activities:
Net cash provided by operating activities
$ 406,009
$ 315,795
Add back (deduct):
Change in operating assets and liabilities
15,051
15,978
Net cash provided by operating activities before changes
in operating assets and liabilities
$ 421,060
$ 331,773
9 Months Ended Sept. 30,
2010
2009
(in thousands)
Cash flow from operating activities:
Net cash provided by operating activities
$ 1,215,062
$ 989,526
Add back (deduct):
Change in operating assets and liabilities
(30,507)
40,098
Net cash provided by operating activities before changes
in operating assets and liabilities
$ 1,184,555
$ 1,029,624
- MORE -
9 Months Ended Sept. 30,
2010
2009
(in thousands)
Net income (loss) attributable to Southwestern Energy:
Net income (loss) attributable to Southwestern Energy
$ 454,607
$ (193,476)
Add back:
Impairment of natural gas and oil properties (net of taxes)
--
558,305
Net income attributable to Southwestern Energy,
excluding impairment of natural gas and oil properties
$ 454,607
$ 364,829
9 Months Ended Sept. 30,
2010
2009
Diluted earnings per share:
Net income (loss) per share attributable to
Southwestern Energy stockholders
$ 1.30
$ (0.56)
Add back:
Impairment of natural gas and oil properties (net of taxes)
--
1.62
Net income per share attributable to Southwestern Energy stockholders,
excluding impairment of natural gas and oil properties
Southwestern will host a teleconference call on Friday, October 29, 2010, at 10:00 a.m. Eastern to discuss the company’s third quarter 2010 results. The toll-free number to call is 877-407-8035 and the international dial-in number is 201-689-8035. The teleconference can also be heard “live” on the Internet athttp://www.swn.com.
Southwestern Energy Company is an integrated company whose wholly-owned subsidiaries are engaged in oil and gas exploration and production, natural gas gathering and marketing. Additional information on the company can be found on the Internet athttp://www.swn.com.
Contacts:
Greg D. Kerley
Brad D. Sylvester, CFA
Executive Vice President
Vice President, Investor Relations
and Chief Financial Officer
(281) 618-4897
(281) 618-4803
All statements, other than historical financial information, may be deemed to be forward-looking statements within the meaning of Section 27A of the Securities Act of 1933, as amended, and Section 21E of the Securities Exchange Act of 1934, as amended. All
- MORE -
statements that address activities, outcomes and other matters that should or may occur in the future, including, without limitation, statements regarding the financial position, business strategy, production and reserve growth and other plans and objectives for the company’s future operations, are forward-looking statements. Although the company believes the expectations expressed in such forward-looking statements are based on reasonable assumptions, such statements are not guarantees of future performance and actual results or developments may differ materially from those in the forward-looking statements. The company has no obligation and makes no undertaking to publicly update or revise any forward-looking statements. You should not place undue reliance on forward-looking statements. They are subject to known and unknown risks, uncertainties and other factors that may affect the company’s operations, markets, products, services and prices and cause its actual results, performance or achievements to be materially different from any future results, performance or achievements expressed or implied by the forward-looking statements. In addition to any assumptions and other factors referred to specifically in connection with forward-looking statements, risks, uncertainties and factors that could cause the company’s actual results to differ materially from those indicated in any forward-looking statement include, but are not limited to: the timing and extent of changes in market conditions and prices for natural gas and oil (including regional basis differentials); the company’s ability to fund the company’s planned capital investments; the company’s ability to transport its production to the most favorable markets or at all; the timing and extent of the company’s success in discovering, developing, producing and estimating reserves; the economic viability of, and the company’s success in drilling, the company’s large acreage position in the Fayetteville Shale play, overall as well as relative to other productive shale gas plays; the impact of federal, state and local government regulation, including any legislation relating to hydraulic fracturing, the climate or over the counter derivatives; the company’s ability to determine the most effective and economic fracture stimulation for the Fayetteville Shale formation; the company’s future property acquisition or divestiture activities; the impact of the adverse outcome of any material litigation; the costs and availability of oil field personnel, services, drilling supplies, raw materials, and equipment; increased competition; the financial impact of accounting regulations and critical accounting policies; the comparative cost of alternative fuels; conditions in capital markets, changes in interest rates and the ability of the company’s lenders to provide it with funds as agreed; credit risk relating to the risk of loss as a result of non-performance by the company’s counterparties and any other factors listed in the reports the company has filed and may file with the Securities and Exchange Commission (SEC). For additional information with respect to certain of these and other factors, see the reports filed by the company with the SEC. The company disclaims any intention or obligation to update or revise any forward-looking statements, whether as a result of new information, future events or otherwise.
Financial Summary Follows
# # #
OPERATING STATISTICS (Unaudited)
Page 1 of 5
Southwestern Energy Company and Subsidiaries
Three Months
Nine Months
Periods Ended September 30
2010
2009
2010
2009
Exploration & Production
Production
Gas production (Bcf)
104.7
73.0
292.4
210.8
Oil production (MBbls)
44
29
137
95
Total equivalent production (Bcfe)
105.0
73.2
293.3
211.4
Commodity Prices
Average gas price per Mcf, including hedges
$ 4.67
$ 5.06
$ 4.76
$ 5.31
Average gas price per Mcf, excluding hedges
$ 3.91
$ 2.85
$ 4.12
$ 3.16
Average oil price per Bbl
$ 74.37
$ 64.20
$ 75.39
$ 49.47
Operating Expenses per Mcfe
Lease operating expenses
$ 0.85
$ 0.76
$ 0.83
$ 0.76
General & administrative expenses
$ 0.28
$ 0.38
$ 0.29
$ 0.34
Taxes, other than income taxes
$ 0.12
$ 0.10
$ 0.12
$ 0.10
Full cost pool amortization
$ 1.31
$ 1.43
$ 1.35
$ 1.56
Midstream
Gas volumes marketed (Bcf)
130.2
98.3
357.0
273.9
Gas volumes gathered (Bcf)
155.7
93.0
421.6
267.4
STATEMENTS OF OPERATIONS (Unaudited)
Page 2 of 5
Southwestern Energy Company and Subsidiaries
Three Months
Nine Months
Periods Ended September 30
2010
2009
2010
2009
(in thousands, except share/per share amounts)
Operating Revenues
Gas sales
$ 483,886
$ 369,963
$ 1,378,873
$ 1,110,051
Gas marketing
161,324
113,642
461,576
356,652
Oil sales
3,238
1,805
10,320
4,680
Gas gathering
33,715
17,443
87,303
50,871
Other
9
96
2,160
(968)
682,172
502,949
1,940,232
1,521,286
Operating Costs and Expenses
Gas purchases – midstream services
158,095
112,956
457,555
353,323
Operating expenses
52,929
38,898
140,438
96,576
General and administrative expenses
35,158
31,942
104,735
84,851
Depreciation, depletion and amortization
151,284
113,833
434,307
355,988
Impairment of natural gas and oil properties
—
—
—
907,812
Taxes, other than income taxes
14,570
8,282
38,654
23,963
412,036
305,911
1,175,689
1,822,513
Operating Income (Loss)
270,136
197,038
764,543
(301,227)
Interest Expense
Interest on debt
14,574
13,761
42,702
41,671
Other interest charges
503
740
1,447
2,269
Interest capitalized
(8,488)
(9,224)
(24,872)
(31,913)
6,589
5,277
19,277
12,027
Other Income, Net
326
554
265
1,088
Income (Loss) Before Income Taxes
263,873
192,315
745,531
(312,166)
Provision (Benefit) for Income Taxes
Current
(5,274)
(20,704)
(2,574)
(56,204)
Deferred
108,509
94,809
293,690
(62,378)
103,235
74,105
291,116
(118,582)
Net income (loss)
160,638
118,210
454,415
(193,584)
Less: Net loss attributable to noncontrolling interest
(103)
(44)
(192)
(108)
Net Income (Loss) Attributable to Southwestern Energy
$ 160,741
$ 118,254
$ 454,607
$ (193,476)
Earnings Per Share
Net income (loss) attributable to Southwestern Energy stockholders - Basic
$ 0.47
$ 0.34
$ 1.32
$ (0.56)
Net income (loss) attributable to Southwestern Energy stockholders - Diluted
$ 0.46
$ 0.34
$ 1.30
$ (0.56)
Weighted Average Common Shares Outstanding
Basic
345,587,569
343,717,232
345,326,985
343,087,065
Diluted
349,228,576
349,000,241
349,308,957
343,087,065
BALANCE SHEETS (Unaudited)
Page 3 of 5
Southwestern Energy Company and Subsidiaries
September 30
2010
2009
(in thousands)
ASSETS
Current Assets(1)
$ 961,196
$ 533,836
Property and Equipment
8,382,654
6,734,040
Less: Accumulated depreciation, depletion and amortization
3,515,411
2,906,798
4,867,243
3,827,242
Other Assets
164,285
97,065
$ 5,992,724
$ 4,458,143
LIABILITIES AND EQUITY
Current Liabilities
$ 646,142
$ 561,600
Long-Term Debt
1,289,400
958,300
Deferred Income Taxes
1,061,579
632,890
Long-Term Hedging Liability
25,751
10,265
Other Liabilities
89,351
65,523
Commitments and Contingencies
Equity
Common stock, $0.01 par value; authorized 1,250,000,000 shares in 2010 and 540,000,000 in 2009, issued 346,978,646 shares in 2010 and 345,256,980 in 2009
3,470
3,453
Additional paid-in capital
848,206
827,040
Retained earnings
1,868,934
1,256,501
Accumulated other comprehensive income
155,006
136,999
Common stock in treasury, 207,994 shares in 2010 and 203,472 in 2009
(4,510)
(4,316)
Total Southwestern Energy stockholders’ equity
2,871,106
2,219,677
Noncontrolling interest
9,395
9,888
Total Equity
2,880,501
2,229,565
$ 5,992,724
$ 4,458,143
(1) Current Assets include restricted cash of $354.2 million in 2010.
STATEMENTS OF CASH FLOWS (Unaudited)
Page 4 of 5
Southwestern Energy Company and Subsidiaries
Nine Months
Periods Ended September 30
2010
2009
(in thousands)
Cash Flows From Operating Activities
Net income (loss)
$ 454,415
$ (193,584)
Adjustments to reconcile net income (loss) to net cash provided by operating activities:
Depreciation, depletion and amortization
435,515
357,218
Impairment of natural gas and oil properties
—
907,812
Deferred income taxes
293,690
(62,378)
Unrealized (gain) loss on derivatives
(3,504)
6,535
Stock-based compensation expense
6,612
6,859
Other
(2,173)
7,162
Change in assets and liabilities
30,507
(40,098)
Net cash provided by operating activities
1,215,062
989,526
Cash Flows From Investing Activities
Capital investments
(1,506,079)
(1,374,047)
Proceeds from sale of property and equipment
348,379
—
Transfers to restricted cash
(355,865)
—
Transfers from restricted cash
1,689
—
Other
(2,632)
(4,585)
Net cash used in investing activities
(1,514,508)
(1,378,632)
Cash Flows From Financing Activities
Payments on current portion of long-term debt
(600)
(60,600)
Payments on revolving long-term debt
(2,043,600)
(879,400)
Borrowings under revolving long-term debt
2,336,100
1,164,100
Change in bank drafts outstanding
5,546
(25,783)
Proceeds from exercise of common stock options
3,013
4,171
Net cash provided by financing activities
300,459
202,488
Increase (decrease) in cash and cash equivalents
1,013
(186,618)
Cash and cash equivalents at beginning of year
13,184
196,277
Cash and cash equivalents at end of period
$ 14,197
$ 9,659
SEGMENT INFORMATION (Unaudited)
Page 5 of 5
Southwestern Energy Company and Subsidiaries
Exploration
&
Midstream
Production
Services
Other
Eliminations
Total
(in thousands)
Quarter Ended September 30, 2010
Revenues
$ 491,900
$ 646,909
$ 247
$ (456,884)
$ 682,172
Gas purchases
—
552,539
—
(394,444)
158,095
Operating expenses
89,176
25,947
—
(62,194)
52,929
General & administrative expenses
29,600
5,768
36
(246)
35,158
Depreciation, depletion & amortization
143,457
7,684
143
—
151,284
Taxes, other than income taxes
12,971
1,581
18
—
14,570
Operating Income
$ 216,696
$ 53,390
$ 50
$ —
$ 270,136
Capital Investments(1)
$ 420,294
$ 77,006
$ 19,330
$ —
$ 516,630
Quarter Ended September 30, 2009
Revenues
$ 371,034
$ 360,211
$ 112
$ (228,408)
$ 502,949
Gas purchases
—
306,745
—
(193,789)
112,956
Operating expenses
55,584
17,828
—
(34,514)
38,898
General & administrative expenses
27,638
4,402
7
(105)
31,942
Depreciation, depletion & amortization
108,432
5,205
196
—
113,833
Taxes, other than income taxes
7,342
931
9
—
8,282
Operating Income (Loss)
$ 172,038
$ 25,100
$ (100)
$ —
$ 197,038
Capital Investments(1)
$ 333,927
$ 64,986
$ 9,860
$ —
$ 408,773
Nine Months Ended September 30, 2010
Revenues
$ 1,405,824
$ 1,837,410
$ 739
$ (1,303,741)
$ 1,940,232
Gas purchases
—
1,591,138
—
(1,133,583)
457,555
Operating expenses
242,576
67,281
—
(169,419)
140,438
General & administrative expenses
86,303
19,051
120
(739)
104,735
Depreciation, depletion & amortization
413,069
20,831
407
—
434,307
Taxes, other than income taxes
34,276
4,328
50
—
38,654
Operating Income
$ 629,600
$ 134,781
$ 162
$ —
$ 764,543
Capital Investments(1)
$ 1,272,953
$ 216,025
$ 44,802
$ —
$ 1,533,780
Nine Months Ended September 30, 2009
Revenues
$ 1,121,800
$ 1,090,849
$ 575
$ (691,938)
$ 1,521,286
Gas purchases
—
936,356
—
(583,033)
353,323
Operating expenses
159,937
45,209
—
(108,570)
96,576
General & administrative expenses
72,334
12,811
41
(335)
84,851
Depreciation, depletion & amortization
341,920
13,506
562
—
355,988
Impairment of natural gas and oil properties
907,812
—
—
—
907,812
Taxes, other than income taxes
21,219
2,713
31
—
23,963
Operating Income (Loss)
$ (381,422)
$ 80,254
$ (59)
$ —
$ (301,227)
Capital Investments(1)
$ 1,186,409
$ 167,442
$ 14,350
$ —
$ 1,368,201
(1)
Capital investments include reductions of $29.8 million and $4.2 million for the three-month periods ended September 30, 2010 and 2009, respectively, and reductions of $4.8 million and $12.4 million for the nine-month periods ended September 30, 2010 and 2009, respectively, relating to the change in accrued expenditures between periods.
We use cookies on this site to provide a more responsive and personalized service. Continuing to browse, clicking I Agree, or closing this banner indicates agreement. See our Cookie Policy for more information.