Houston, Texas – October 27, 2011...Southwestern Energy Company (NYSE: SWN) today announced financial and operating results for the third quarter of 2011. Highlights include:
·
Natural gas and crude oil production of 128.9 Bcfe, up from 105.0 Bcfe in the same period in 2010
·
Record net cash provided by operating activities before changes in operating assets and liabilities of $472.6 million (a non-GAAP measure reconciled below), up 12% from the same period in 2010
·
Net income of $175.2 million, up 9% from the same period in 2010
For the third quarter of 2011, Southwestern reported net income of $175.2 million, or $0.50 per diluted share, compared to $160.7 million, or $0.46 per diluted share, for the prior year period. Net cash provided by operating activities before changes in operating assets and liabilities (a non-GAAP measure; see reconciliation below) was $472.6 million for the third quarter of 2011, up 12% from $421.1 million in the third quarter of 2010.
“We had another excellent quarter,” stated Steve Mueller, President and Chief Executive Officer. “The increases in our earnings and cash flow were primarily driven by our production growth and our vertical integration and focus on costs continue to be key advantages for us. As a result of our Fayetteville and Marcellus projects, our production guidance has again been increased to approximately 496-500 Bcfe for the full year of 2011, which represents approximately a 23% increase over 2010 levels. With one of the lowest cost structures in our industry, a large inventory of wells to drill in the Fayetteville and Marcellus Shales and a growing New Ventures acreage position, we are well-positioned to provide profitable growth in production and reserves over the next several years.”
Third Quarter 2011 Financial Results
E&P Segment- Operating income from the company’s E&P segment was $228.5 million for the third quarter of 2011, up from $216.7 million for the same period in 2010. The increase was primarily due to higher production volumes, which were partially offset by lower realized gas prices and increased operating costs and expenses.
Gas and oil production totaled 128.9 Bcfe in the third quarter of 2011, up 23% from 105.0 Bcfe in the third quarter of 2010, and included 111.9 Bcf from the company’s
- MORE -
Fayetteville Shale play, up from 92.3 Bcf in the third quarter of 2010. The company has updated its production guidance for the remainder of 2011 due to the strong performance from its Fayetteville Shale and Marcellus Shale operating areas. The revised total gas and oil production guidance for 2011 of 496 to 500 Bcfe is an increase of approximately 23% over the company’s 2010 gas and oil production (using midpoints). Of the company’s total expected production in 2011, approximately 430 to 434 Bcf is expected to come from the Fayetteville Shale. The company’s production guidance for the remainder of 2011 as follows:
1st Quarter
2nd Quarter
3rd Quarter
4th Quarter
Full-Year 2011
Actual
Actual
Actual
Estimate
Estimate
Previous Guidance (Bcfe)
115.0
119-121
123-125
126-130
483-491
Revised Guidance (Bcfe)
115.0
122.8
128.9
129-133
496-500
Including the effect of hedges, Southwestern’s average realized gas price in the third quarter of 2011 was $4.30 per Mcf, compared to $4.67 per Mcf in the third quarter of 2010. The company’s commodity hedging activities increased its average gas price by $0.59 per Mcf during the third quarter of 2011, compared to an increase of $0.76 per Mcf during the same period in 2010. At October 25, 2011, Southwestern had approximately 80 Bcf of its remaining 2011 projected natural gas production hedged through fixed price swaps and collars at a weighted average floor price of $5.21 per Mcf. The company also had approximately 266 Bcf of its 2012 forecasted gas production hedged at an average floor price of $5.16 per Mcf and approximately 185 Bcf of its 2013 forecasted gas production hedged at an average floor price of $5.06 per Mcf.
The company typically sells its natural gas at a discount to NYMEX settlement prices. This discount includes a basis differential, third-party transportation charges and fuel charges. Disregarding the impact of commodity price hedges, the company’s average price received for its gas production during the third quarter of 2011 was approximately $0.49 per Mcf lower than average monthly NYMEX settlement prices, compared to approximately $0.47 per Mcf lower during the third quarter of 2010. For the remainder of 2011, the company expects its total gas sales discount to NYMEX settlement prices to be $0.45 to $0.50 per Mcf. As of September 30, 2011, the company had protected approximately 55 Bcf of its fourth quarter 2011 expected gas production from the potential of widening basis differentials through hedging activities and sales arrangements at an average basis differential to NYMEX gas prices of approximately $0.01 per Mcf, excluding transportation and fuel charges.
Lease operating expenses per unit of production for the company’s E&P segment were $0.86 per Mcfe in the third quarter of 2011, up from $0.85 per Mcfe in the third quarter of 2010. The increase was primarily due to increased gathering and salt water disposal costs.
General and administrative expenses per unit of production were $0.25 per Mcfe in the third quarter of 2011, compared to $0.28 per Mcfe in the third quarter of 2010. The decrease was primarily due to the effects of the company’s increased production volumes which more than offset increased payroll, incentive compensation and other employee-related costs primarily associated with the expansion of the company’s
- MORE -
operations in the company’s Fayetteville Shale properties and its Marcellus Shale properties.
Taxes other than income taxes per unit of production were $0.11 per Mcfe in the third quarter of 2011, compared to $0.12 per Mcfe in the third quarter of 2010. Taxes other than income taxes per Mcfe vary from period to period due to changes in severance and ad valorem taxes that result from the mix of the company’s production volumes and fluctuations in commodity prices.
The company’s full cost pool amortization rate was $1.28 per Mcfe in the third quarter of 2011, down from $1.31 per Mcfe in the third quarter of 2010. The decline in the average amortization rate was primarily the result of lower finding and development costs, combined with the sale of certain East Texas oil and natural gas leases and wells in the second quarter of 2011, as the proceeds from the sale were appropriately credited to the full cost pool. The amortization rate is impacted by the timing and amount of reserve additions and the costs associated with those additions, revisions of previous reserve estimates due to both price and well performance, write-downs that result from full cost ceiling tests, proceeds from the sale of properties that reduce the full cost pool and the levels of costs subject to amortization.
Midstream Services- Operating income for the company’s Midstream Services segment, which is comprised of natural gas gathering and marketing activities, was $66.8 million for the third quarter of 2011, up 25% from $53.4 million for the third quarter of 2010. The increase in operating income was primarily due to the increase in gathering revenues from the company’s Fayetteville and Marcellus Shale properties, partially offset by increased operating costs and expenses.
At October 27, 2011, the company’s midstream segment was gathering approximately 2.0 Bcf per day through 1,745 miles of gathering lines in the Fayetteville Shale play area, up from approximately 1.7 Bcf per day through 1,524 miles of gathering lines a year ago. Gathering volumes, revenues and expenses for this segment are expected to continue to grow as reserves related to the company’s Fayetteville Shale play are developed and production increases and as it develops its Marcellus Shale properties.
First Nine Months of 2011 Financial Results
For the first nine months of 2011, Southwestern reported net income of $479.2 million, or $1.37 per diluted share, up from $454.6 million, or $1.30 per diluted share, for the first nine months of 2010. Net cash provided by operating activities before changes in operating assets and liabilities (a non-GAAP measure; see reconciliation below) was $1.31 billion for the first nine months of 2011, up from $1.18 billion for the same period in 2010.
E&P Segment - Operating income from the company’s E&P segment was $629.3 million for the nine months ended September 30, 2011, compared to $629.6 million for the same period in 2010. The slight decrease in operating income was primarily due to lower realized natural gas prices and increased operating costs and expenses, offset by higher natural gas production volumes.
- MORE -
Gas and oil production was 366.7 Bcfe in the first nine months of 2011, up 25% compared to 293.3 Bcfe in the first nine months of 2010, and included 320.4 Bcf from the company’s Fayetteville Shale play, up from 251.4 Bcfe in the first nine months of 2010.
Southwestern’s average realized gas price for the first nine months of 2011 was $4.24 per Mcf, including the effect of hedges, down 11% from $4.76 per Mcf in the first nine months of 2010. The company’s hedging activities increased the average gas price realized during the first nine months of 2011 by $0.49 per Mcf, compared to an increase of $0.64 per Mcf during the first nine months of 2010. Disregarding the impact of hedges, the average price received for the company’s gas production during the first nine months of 2011 was approximately $0.46 per Mcf lower than average monthly NYMEX settlement prices, compared to approximately $0.47 per Mcf lower than NYMEX gas prices during the first nine months of 2010.
Lease operating expenses for the company’s E&P segment were $0.84 per Mcfe in the first nine months of 2011, up from $0.83 per Mcfe in the first nine months of 2010. The increase was primarily due to increased gathering and salt water disposal costs.
General and administrative expenses were $0.26 per Mcfe in the first nine months of 2011, down from $0.29 per Mcfe in the first nine months of 2010. The decrease was primarily due to the effects of the company’s increased production volumes which more than offset increased compensation and employee-related costs primarily associated with the expansion of the company’s E&P operations in the company’s Fayetteville Shale properties and its Marcellus Shale properties. Southwestern added 147 new employees during the first nine months of 2011, most of which were hired in its E&P segment.
Taxes other than income taxes were $0.11 per Mcfe during the first nine months of 2011, compared to $0.12 per Mcfe during the first nine months of 2010. Taxes other than income taxes per Mcfe vary from period to period due to changes in severance and ad valorem taxes that result from the mix of the company’s production volumes and fluctuations in commodity prices.
The company’s full cost pool amortization rate decreased to $1.29 per Mcfe in the first nine months of 2011, compared to $1.35 per Mcfe in the first nine months of 2010, primarily due to the sale of certain East Texas oil and natural gas leases and wells in 2010 and 2011, as the proceeds from the sale were appropriately credited to the full cost pool, combined with lower finding and development costs.
Midstream Services - Operating income for the company’s midstream activities was $180.4 million in the first nine months of 2011, compared to $134.8 million in the first nine months of 2010. The increase in operating income was primarily due to increased gathering revenues related to the company’s Fayetteville and Marcellus Shale properties, partially offset by increased operating costs and expenses.
Capital Structure and Investments- At September 30, 2011, the company had approximately $1.3 billion in long-term debt and its long-term debt-to-total capitalization was 26%.
- MORE -
For the first nine months of 2011, Southwestern invested a total of approximately $1.6 billion, compared to $1.5 billion during the first nine months of 2010, which included $1.4 billion invested in its E&P business and $138 million invested in its Midstream Services segment. Of the approximately $1.4 billion invested in its E&P business, $1.0 billion was invested in its Fayetteville Shale play, $170 million in Appalachia, $138 million in New Ventures and $67 million in East Texas and its conventional Arkoma Basin program.
E&P Operations Review
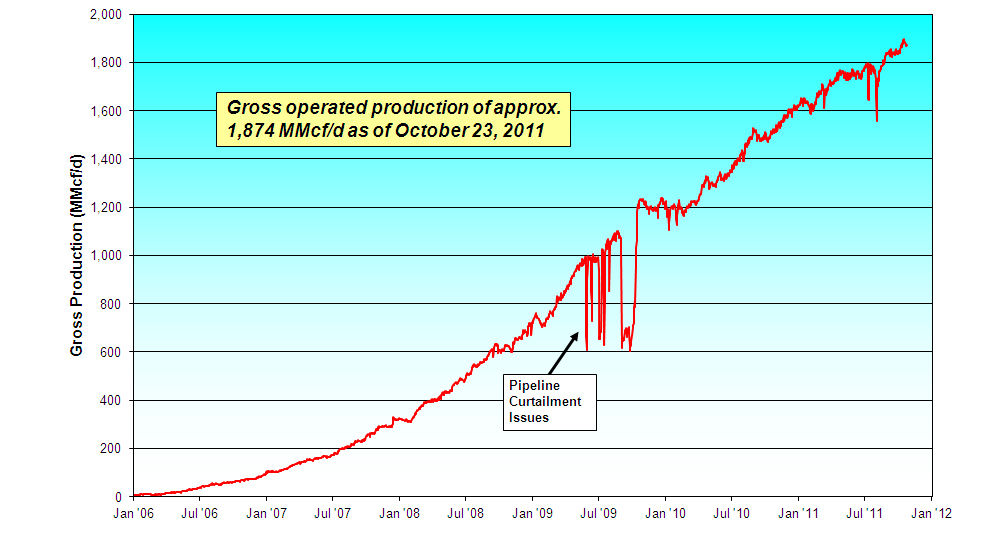
Fayetteville Shale Division– During the third quarter of 2011, Southwestern placed a total of 132 operated wells on production in the Fayetteville Shale play, all of which were horizontal wells fracture stimulated using slickwater. At October 23, 2011, the company’s gross production rate from the Fayetteville Shale play was approximately 1.9 Bcf per day, up from approximately 1.5 Bcf per day a year ago. The company is currently utilizing 19 drilling rigs in its Fayetteville Shale play, including 12 that are capable of drilling horizontal wells and 7 smaller rigs that are used to drill the vertical portion of the wells. The graph below provides gross production data from the company’s operated wells in the Fayetteville Shale play area through October 23, 2011.
During the third quarter of 2011, the company’s horizontal wells had an average completed well cost of $2.8 million per well, average horizontal lateral length of 4,847 feet and average time to drill to total depth of 7.8 days from re-entry to re-entry. This compares to an average completed well cost of $2.8 million per well, average horizontal lateral length of 4,839 feet and average time to drill to total depth of 8.2 days from re-entry to re-entry in the second quarter of 2011. In the third quarter of 2011, the company had 25 operated wells placed on production which had average times to drill to total depth of 5 days or less from re-entry to re-entry. In total, the company has had a total of
- MORE -
80 wells drilled to total depth of 5 days or less from re-entry to re-entry.
The company’s wells placed on production during the third quarter of 2011 averaged initial production rates of 3,443 Mcf per day. Results from the company’s drilling activities from 2007 by quarter are shown below.
Time Frame
Wells Placed on Production
Average IP Rate (Mcf/d)
30th-Day Avg Rate (# of wells)
60th-Day Avg Rate (# of wells)
Average Lateral Length
1st Qtr 2007
58
1,261
1,066 (58)
958 (58)
2,104
2nd Qtr 2007
46
1,497
1,254 (46)
1,034 (46)
2,512
3rd Qtr 2007
74
1,769
1,510 (72)
1,334 (72)
2,622
4th Qtr 2007
77
2,027
1,690 (77)
1,481 (77)
3,193
1st Qtr 2008
75
2,343
2,147 (75)
1,943 (74)
3,301
2nd Qtr 2008
83
2,541
2,155 (83)
1,886 (83)
3,562
3rd Qtr 2008
97
2,882
2,560 (97)
2,349 (97)
3,736
4th Qtr 2008(1)
74
3,350(1)
2,722 (74)
2,386 (74)
3,850
1st Qtr 2009(1)
120
2,992(1)
2,537 (120)
2,293 (120)
3,874
2nd Qtr 2009
111
3,611
2,833 (111)
2,556 (111)
4,123
3rd Qtr 2009
93
3,604
2,624 (93)
2,255 (93)
4,100
4th Qtr 2009
122
3,727
2,674 (122)
2,360 (120)
4,303
1st Qtr 2010(2)
106
3,197(2)
2,388 (106)
2,123 (106)
4,348
2nd Qtr 2010
143
3,449
2,554 (143)
2,321 (142)
4,532
3rd Qtr 2010
145
3,281
2,448 (145)
2,202 (144)
4,503
4th Qtr 2010
159
3,472
2,678 (159)
2,294 (159)
4,667
1st Qtr 2011
137
3,231
2,604 (137)
2,238(137)
4,985
2nd Qtr 2011
149
3,014
2,328 (149)
1,991 (149)
4,839
3rd Qtr 2011
132
3,443
2,678 (108)
2,199 (60)
4,847
Note: Results as of September 30, 2011.
(1)
The significant increase in the average initial production rate for the fourth quarter of 2008 and the subsequent decrease for the first quarter of 2009 primarily reflected the impact of the delay in the Boardwalk Pipeline.
(2)
In the first quarter of 2010, the company’s results were impacted by the shift of all wells to “green completions” and the mix of wells, as a large percentage of wells were placed on production in the shallower northern and far eastern borders of the company’s acreage.
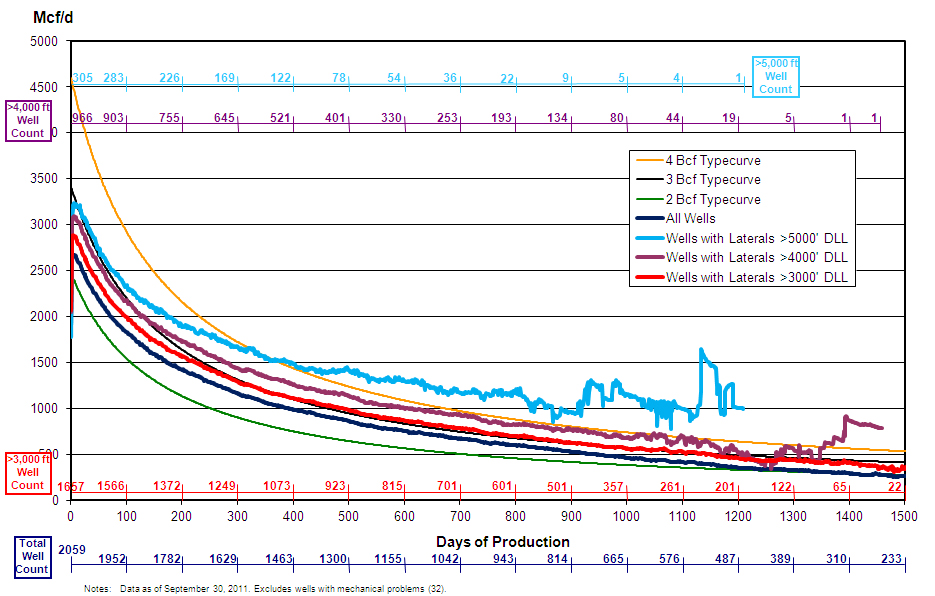
The graph below provides normalized average daily production data through September 30, 2011, for the company’s horizontal wells using slickwater and crosslinked gel fluids. The “dark blue curve” is for horizontal wells fracture stimulated with either slickwater or crosslinked gel fluid. The “red curve” indicates results for the company’s wells with lateral lengths greater than 3,000 feet, while the “purple curve” indicates results for the company’s wells with lateral lengths greater than 4,000 feet and the “light blue curve” indicates results for the company’s wells with lateral lengths greater than 5,000 feet. The normalized production curves are intended to provide a qualitative indication of the company’s Fayetteville Shale wells’ performance and should not be used to estimate an individual well’s estimated ultimate recovery. The 2, 3 and 4 Bcf typecurves are shown solely for reference purposes and are not intended to be projections of the performance of the company’s wells.
- MORE -
Appalachia Division –Southwestern has participated in a total of 40 wells in northeast Pennsylvania, of which 18 were producing and 22 were in progress at September 30, 2011. The producing wells are all operated Marcellus Shale wells located in its Greenzweig area in Bradford County. Net production from the area was 7.4 Bcf and 15.2 Bcf for three months and nine months ending September 30, 2011, respectively, compared to 0.2 Bcf and 0.2 Bcf for the same periods in 2010, respectively. The company is currently running 2 drilling rigs in Susquehanna County.
The company is currently completing a five-well pad in its Greenzweig area in Bradford County which is expected to be placed on production in November. The company also noted that the Ball Myer 1H well which was placed on production on June 23, 2011 is currently producing at a tubing constrained rate of approximately 8.2 MMcf per day at a flowing tubing pressure of 1,300 psi after 120 days of production This well had a completed lateral of 4,502 feet and was fracture stimulated in 19 stages. In total, the company’s 17 horizontal wells have average completed lateral lengths of approximately 3,849 feet and have averaged 10.8 stages of completion. Gross operated production from the area is currently approximately 110 MMcf per day and constrained by a temporary pipeline curtailment.
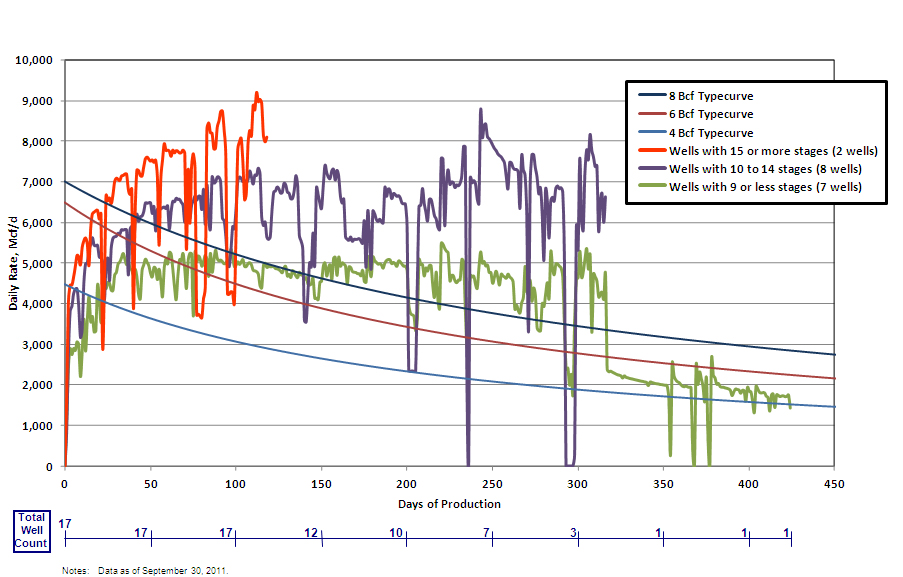
The graph below provides normalized average daily production data through September 30, 2011, for the company’s horizontal wells in the Marcellus Shale. The “red curve” indicates results for two wells with 15 or more fracture stimulation stages, the “purple curve” indicates results for eight wells with 10 to 14 fracture stimulation stages and the “green curve” indicates results for seven wells with 9 or less fracture stimulation stages. The normalized production curves are intended to provide a qualitative indication of the company’s Marcellus Shale wells’ performance and should not be used to estimate an
- MORE -
individual well’s estimated ultimate recovery. The 4, 6 and 8 Bcf typecurves are shown solely for reference purposes and are not intended to be projections of the performance of the company’s wells.
Ark-La-Tex Division –Total net production from the company’s East Texas and conventional Arkoma Basin properties was 9.6 Bcfe and 31.1 Bcfe for three months and nine months ending September 30, 2011, respectively. This compares to 12.5 Bcfe and 41.7 Bcfe for the same periods in 2010, respectively. The company participated in drilling 10 wells in these areas during the first nine months of 2011, 5 of which were operated.
In the second quarter of 2011, Southwestern sold certain oil and natural gas leases, wells and gathering equipment in Shelby, San Augustine and Sabine Counties in East Texas for approximately $108.1 million, before customary purchase price adjustments. This divestiture included only the producing rights to the Haynesville and Middle Bossier Shale intervals in this acreage with net production of approximately 7.0 MMcf per day as of May 25, 2011 and proved net reserves of approximately 25.1 Bcf at December 31, 2010. At closing, the company deposited $85 million of proceeds from this sale with a qualified intermediary to facilitate potential like-kind exchange transactions pursuant to Section 1031 of the Internal Revenue Code.
New Ventures– At September 30, 2011, Southwestern held 2,518,518 net undeveloped acres which were located in New Brunswick, Canada and approximately 948,000 net undeveloped acres in connection with other New Ventures prospects. In New Brunswick, the company has completed the second phase of surface geochemical sampling and the acquisition phase of approximately 250 miles of 2-D data. Interpretation of both sets of data is underway.
- MORE -
Included in the approximately 948,000 net acres are 487,000 net acres located in the Lower Smackover Brown Dense formation, an unconventional oil reservoir found in southern Arkansas and northern Louisiana. The company spud its first well in September, the Roberson 18-19 #1-15H located in Columbia County, Arkansas, and is currently drilling the lateral portion of the well. This well has a vertical depth of approximately 9,200 feet and a planned horizontal lateral length of 4,000 feet. The well is expected to be completed in November. The company will spud its second well, the Garrett 7-23-5H #1 located in Claiborne Parish, Louisiana in November. This well has a planned total vertical depth of approximately 10,700 feet and a planned 7,900-foot horizontal lateral. The company plans to drill up to 8 additional wells as we continue to test the concept in 2012. If the company’s drilling program yields positive results, it expects that activity in the play could increase significantly over the next several years.
Explanation and Reconciliation of Non-GAAP Financial Measures
We report our financial results in accordance with accounting principles generally accepted in the United States of America (“GAAP”). However, management believes certain non-GAAP performance measures may provide users of this financial information with additional meaningful comparisons between current results and the results of our peers and of prior periods.
One such non-GAAP financial measure is net cash provided by operating activities before changes in operating assets and liabilities. Management presents this measure because (i) it is accepted as an indicator of an oil and gas exploration and production company’s ability to internally fund exploration and development activities and to service or incur additional debt, (ii) changes in operating assets and liabilities relate to the timing of cash receipts and disbursements which the company may not control and (iii) changes in operating assets and liabilities may not relate to the period in which the operating activities occurred.
Additional non-GAAP financial measures we may present from time to time are net income attributable to Southwestern Energy, diluted earnings per share attributable to Southwestern Energy stockholders and our E&P segment operating income, all which exclude certain charges or amounts. Management presents these measures because (i) they are consistent with the manner in which the Company’s performance is measured relative to the performance of its peers, (ii) these measures are more comparable to earnings estimates provided by securities analysts, and (iii) charges or amounts excluded cannot be reasonably estimated and guidance provided by the Company excludes information regarding these types of items. These adjusted amounts are not a measure of financial performance under GAAP.
See the reconciliations below of GAAP financial measures to non-GAAP financial measures for the three and nine months ended September 30, 2011 and September 30, 2010. Non-GAAP financial measures should not be considered in isolation or as a substitute for the Company's reported results prepared in accordance with GAAP.
- MORE -
3 Months Ended Sept. 30,
2011
2010
(in thousands)
Cash flow from operating activities:
Net cash provided by operating activities
$ 443,281
$ 406,009
Add back (deduct):
Change in operating assets and liabilities
29,313
15,051
Net cash provided by operating activities before changes
in operating assets and liabilities
$ 472,594
$ 421,060
9 Months Ended Sept. 30,
2011
2010
(in thousands)
Cash flow from operating activities:
Net cash provided by operating activities
$ 1,300,211
$ 1,215,062
Add back (deduct):
Change in operating assets and liabilities
12,129
(30,507)
Net cash provided by operating activities before changes
in operating assets and liabilities
$ 1,312,340
$ 1,184,555
Southwestern will host a teleconference call on Friday, October 28, 2011, at 10:00 a.m. Eastern to discuss the company’s third quarter 2011 results. The toll-free number to call is 877-407-8035 and the international dial-in number is 201-689-8035. The teleconference can also be heard “live” on the Internet athttp://www.swn.com.
Southwestern Energy Company is an integrated company whose wholly-owned subsidiaries are engaged in oil and gas exploration and production, natural gas gathering and marketing. Additional information on the company can be found on the Internet athttp://www.swn.com.
Contacts:
Greg D. Kerley
Brad D. Sylvester, CFA
Executive Vice President
Vice President, Investor Relations
and Chief Financial Officer
(281) 618-4897
(281) 618-4803
All statements, other than historical financial information, may be deemed to be forward-looking statements within the meaning of Section 27A of the Securities Act of 1933, as amended, and Section 21E of the Securities Exchange Act of 1934, as amended. All statements that address activities, outcomes and other matters that should or may occur in the future, including, without limitation, statements regarding the financial position, business strategy, production and reserve growth and other plans and objectives for the company’s future operations, are forward-looking statements. Although the company believes the expectations expressed in such forward-looking statements are based on reasonable assumptions, such statements are not guarantees of future performance and actual results or developments may differ materially from those in the forward-looking statements. The company has no obligation and makes no undertaking to publicly update or revise any forward-looking statements. You should not place undue reliance on forward-looking statements. They are subject to known and unknown risks, uncertainties and other factors that may affect the company’s
- MORE -
operations, markets, products, services and prices and cause its actual results, performance or achievements to be materially different from any future results, performance or achievements expressed or implied by the forward-looking statements. In addition to any assumptions and other factors referred to specifically in connection with forward-looking statements, risks, uncertainties and factors that could cause the company’s actual results to differ materially from those indicated in any forward-looking statement include, but are not limited to: the timing and extent of changes in market conditions and prices for natural gas and oil (including regional basis differentials); the company’s ability to transport its production to the most favorable markets or at all; the timing and extent of the company’s success in discovering, developing, producing and estimating reserves; the economic viability of, and the company’s success in drilling, the company’s large acreage position in the Fayetteville Shale play, overall as well as relative to other productive shale gas plays; the company’s ability to fund the company’s planned capital investments; the impact of federal, state and local government regulation, including any legislation relating to hydraulic fracturing, the climate or over the counter derivatives; the company’s ability to determine the most effective and economic fracture stimulation for the Fayetteville Shale formation; the costs and availability of oil field personnel services and drilling supplies, raw materials, and equipment and services; the company’s future property acquisition or divestiture activities; increased competition; the financial impact of accounting regulations and critical accounting policies; the comparative cost of alternative fuels; conditions in capital markets, changes in interest rates and the ability of the company’s lenders to provide it with funds as agreed; credit risk relating to the risk of loss as a result of non-performance by the company’s counterparties and any other factors listed in the reports the company has filed and may file with the Securities and Exchange Commission (SEC). For additional information with respect to certain of these and other factors, see the reports filed by the company with the SEC. The company disclaims any intention or obligation to update or revise any forward-looking statements, whether as a result of new information, future events or otherwise.
Financial Summary Follows
# # #
OPERATING STATISTICS (Unaudited)
Page 1 of 5
Southwestern Energy Company and Subsidiaries
Three Months
Nine Months
Periods Ended September 30,
2011
2010
2011
2010
Exploration & Production
Production
Gas production (Bcf)
128.7
104.7
366.2
292.4
Oil production (MBbls)
24
44
79
137
Total equivalent production (Bcfe)
128.9
105.0
366.7
293.3
Commodity Prices
Average gas price per Mcf, including hedges
$ 4.30
$ 4.67
$ 4.24
$ 4.76
Average gas price per Mcf, excluding hedges
$ 3.71
$ 3.91
$ 3.75
$ 4.12
Average oil price per Bbl
$ 88.35
$ 74.37
$ 93.54
$ 75.39
Operating Expenses per Mcfe
Lease operating expenses
$ 0.86
$ 0.85
$ 0.84
$ 0.83
General & administrative expenses
$ 0.25
$ 0.28
$ 0.26
$ 0.29
Taxes, other than income taxes
$ 0.11
$ 0.12
$ 0.11
$ 0.12
Full cost pool amortization
$ 1.28
$ 1.31
$ 1.29
$ 1.35
Midstream
Gas volumes marketed (Bcf)
153.3
130.2
450.4
357.0
Gas volumes gathered (Bcf)
190.9
155.7
545.7
421.6
STATEMENTS OF OPERATIONS (Unaudited)
Page 2 of 5
Southwestern Energy Company and Subsidiaries
Three Months
Nine Months
Periods Ended September 30,
2011
2010
2011
2010
(in thousands, except share/per share amounts)
Operating Revenues
Gas sales
$ 551,757
$ 483,886
$ 1,543,667
$ 1,378,873
Gas marketing
176,787
161,324
549,243
461,576
Oil sales
2,157
3,238
7,387
10,320
Gas gathering
36,541
33,715
107,961
87,303
Other
13
9
498
2,160
767,255
682,172
2,208,756
1,940,232
Operating Costs and Expenses
Gas purchases – midstream services
175,236
158,095
545,518
457,555
Operating expenses
63,911
52,929
175,763
140,438
General and administrative expenses
35,600
35,158
112,955
104,735
Depreciation, depletion and amortization
179,113
151,284
514,180
434,307
Taxes, other than income taxes
17,677
14,570
49,429
38,654
471,537
412,036
1,397,845
1,175,689
Operating Income
295,718
270,136
810,911
764,543
Interest Expense
Interest on debt
16,696
14,574
48,380
42,702
Other interest charges
902
503
3,414
1,447
Interest capitalized
(11,941)
(8,488)
(32,531)
(24,872)
5,657
6,589
19,263
19,277
Other Income (Loss), Net
(122)
326
321
265
Income Before Income Taxes
289,939
263,873
791,969
745,531
Provision for Income Taxes
Current
3,491
(5,274)
3,691
(2,574)
Deferred
111,275
108,509
309,042
293,690
114,766
103,235
312,733
291,116
Net income
175,173
160,638
479,236
454,415
Less: Net loss attributable to noncontrolling interest
—
(103)
—
(192)
Net Income Attributable to Southwestern Energy
$ 175,173
$ 160,741
$ 479,236
$ 454,607
Earnings Per Share
Net income attributable to Southwestern Energy stockholders – Basic
$ 0.50
$ 0.47
$ 1.38
$ 1.32
Net income attributable to Southwestern Energy stockholders – Diluted
$ 0.50
$ 0.46
$ 1.37
$ 1.30
Weighted Average Common Shares Outstanding
Basic
347,239,793
345,587,569
347,070,330
345,326,985
Diluted
349,998,789
349,228,576
349,891,885
349,308,957
BALANCE SHEETS (Unaudited)
Page 3 of 5
Southwestern Energy Company and Subsidiaries
September 30,
2011
2010
(in thousands)
ASSETS
Current Assets
$ 836,120
$ 961,196
Property and Equipment
10,444,393
8,382,654
Less: Accumulated depreciation, depletion and amortization
4,230,121
3,515,411
6,214,272
4,867,243
Other Assets
163,715
164,285
$ 7,214,107
$ 5,992,724
LIABILITIES AND EQUITY
Current Liabilities
$ 766,250
$ 646,142
Long-Term Debt
1,271,000
1,289,400
Deferred Income Taxes
1,461,205
1,061,579
Long-Term Hedging Liability
4,582
25,751
Other Long-Term Liabilities
102,517
89,351
Commitments and Contingencies
Equity
Common stock, $0.01 par value; authorized 1,250,000,000 shares in 2011 and 2010; issued 348,264,799 shares in 2011 and 346,978,646 in 2010
3,483
3,470
Additional paid-in capital
880,425
848,206
Retained earnings
2,497,681
1,868,934
Accumulated other comprehensive income
229,750
155,006
Common stock in treasury, 125,984 shares in 2011 and 207,994 in 2010
(2,786)
(4,510)
Total Southwestern Energy Stockholders’ Equity
3,608,553
2,871,106
Noncontrolling Interest
—
9,395
Total Equity
3,608,553
2,880,501
$ 7,214,107
$ 5,992,724
STATEMENTS OF CASH FLOWS (Unaudited)
Page 4 of 5
Southwestern Energy Company and Subsidiaries
Nine Months
Periods Ended September 30,
2011
2010
(in thousands)
Cash Flows From Operating Activities
Net income
$ 479,236
$ 454,415
Adjustments to reconcile net income to net cash provided by operating activities:
Depreciation, depletion and amortization
516,891
435,515
Deferred income taxes
309,042
293,690
Unrealized gain (loss) on derivatives
905
(3,504)
Stock-based compensation
6,619
6,612
Other
(353)
(2,173)
Change in assets and liabilities
(12,129)
30,507
Net cash provided by operating activities
1,300,211
1,215,062
Cash Flows From Investing Activities
Capital investments
(1,543,549)
(1,506,079)
Proceeds from sale of property and equipment
121,546
348,379
Transfers to restricted cash
(85,040)
(355,865)
Transfers from restricted cash
15,779
1,689
Other
4,940
(2,632)
Net cash used in investing activities
(1,486,324)
(1,514,508)
Cash Flows From Financing Activities
Payments on current portion of long-term debt
(600)
(600)
Payments on revolving long-term debt
(2,575,000)
(2,043,600)
Borrowings under revolving long-term debt
2,753,600
2,336,100
Change in bank drafts outstanding
10,621
5,546
Proceeds from exercise of common stock options
4,844
3,013
Revolving credit facility costs
(10,211)
—
Net cash provided by financing activities
183,254
300,459
Effect of exchange rate changes on cash
97
—
Increase (decrease) in cash and cash equivalents
(2,762)
1,013
Cash and cash equivalents at beginning of year
16,055
13,184
Cash and cash equivalents at end of period
$ 13,293
$ 14,197
SEGMENT INFORMATION (Unaudited)
Page 5 of 5
Southwestern Energy Company and Subsidiaries
Exploration
&
Midstream
Production
Services
Other
Eliminations
Total
(in thousands)
Quarter Ending September 30, 2011
Revenues
$ 555,620
$ 743,831
$ 832
$ (533,028)
$ 767,255
Gas purchases
—
629,899
—
(454,663)
175,236
Operating expenses
111,444
30,001
34
(77,568)
63,911
General & administrative expenses
32,615
3,718
64
(797)
35,600
Depreciation, depletion & amortization
169,391
9,414
308
—
179,113
Taxes, other than income taxes
13,694
3,962
21
—
17,677
Operating Income
$ 228,476
$ 66,837
$ 405
$ —
$ 295,718
Capital Investments(1)
$ 421,182
$ 32,158
$ 17,095
$ —
$ 470,435
Quarter Ending September 30, 2010
Revenues
$ 491,900
$ 646,909
$ 247
$ (456,884)
$ 682,172
Gas purchases
—
552,539
—
(394,444)
158,095
Operating expenses
89,176
25,947
—
(62,194)
52,929
General & administrative expenses
29,600
5,768
36
(246)
35,158
Depreciation, depletion & amortization
143,457
7,684
143
—
151,284
Taxes, other than income taxes
12,971
1,581
18
—
14,570
Operating Income
$ 216,696
$ 53,390
$ 50
$ —
$ 270,136
Capital Investments(1)
$ 420,294
$ 77,006
$ 19,330
$ —
$ 516,630
Nine Months Ending September 30, 2011
Revenues
$ 1,561,658
$ 2,183,708
$ 2,401
$(1,539,011)
$ 2,208,756
Gas purchases
—
1,862,736
—
(1,317,218)
545,518
Operating expenses
308,665
86,478
53
(219,433)
175,763
General & administrative expenses
96,667
18,449
199
(2,360)
112,955
Depreciation, depletion & amortization
486,130
27,170
880
—
514,180
Taxes, other than income taxes
40,898
8,477
54
—
49,429
Operating Income
$ 629,298
$ 180,398
$ 1,215
$ —
$ 810,911
Capital Investments(1)
$ 1,365,434
$ 137,998
$ 53,506
$ —
$ 1,556,938
Nine Months Ending September 30, 2010
Revenues
$ 1,405,824
$ 1,837,410
$ 739
$ (1,303,741)
$ 1,940,232
Gas purchases
—
1,591,138
—
(1,133,583)
457,555
Operating expenses
242,576
67,281
—
(169,419)
140,438
General & administrative expenses
86,303
19,051
120
(739)
104,735
Depreciation, depletion & amortization
413,069
20,831
407
—
434,307
Taxes, other than income taxes
34,276
4,328
50
—
38,654
Operating Income
$ 629,600
$ 134,781
$ 162
$ —
$ 764,543
Capital Investments(1)
$ 1,272,953
$ 216,025
$ 44,802
$ —
$ 1,533.780
(1)
Capital investments include reductions of $60.9 million and $29.8 million for the three-month periods ended September 30, 2011 and 2010, respectively, and reductions of $3.0 million and $4.8 million for the nine-month periods ended September 30, 2011 and 2010, respectively, relating to the change in accrued expenditures between periods.
We use cookies on this site to provide a more responsive and personalized service. Continuing to browse, clicking I Agree, or closing this banner indicates agreement. See our Cookie Policy for more information.