NEWS RELEASE
SOUTHWESTERN ENERGY ANNOUNCESSECOND QUARTER 2012
FINANCIAL AND OPERATING RESULTS
Houston, Texas –August 2, 2012...Southwestern Energy Company (NYSE: SWN) today announced its financial and operating results for thesecond quarter of 2012. Highlights include:
| · | Gas and oil production of137.4 Bcfe, up12% compared toprior year |
| · | Adjustednetincome of $90.8 million, which excludes a non-cash ceiling test impairment of natural gas and oil properties (a non-GAAP measure reconciled below) |
| · | Net cash provided by operating activities before changes in operating assets and liabilitiesof $354.5 million(reconciled below) |
| · | Encouraging Brown Dense results, drilling in Colorado and Montana, over 385,000 of undisclosed New Ventures net acres |
For thesecond quarter of 2012, Southwestern reporteda netloss of $488.1 million, or $1.40 perdilutedshare. The netloss for the three months endedJune 30, 2012 included a $935.9 million non-cash ceiling test impairment($578.9 million net of taxes)ofthe company’s natural gas and oil properties resulting from lower natural gas prices. Excluding the non-cash impairment, Southwestern reported net income for thesecond quarter of 2012 of $90.8 million(reconciled below), or $0.26 per diluted share, compared to net income of$167.5 million, or $0.48 perdilutedshare, for the prior year period.
Net cash provided by operating activities before changes in operating assets and liabilities (reconciled below) was $354.5 millionfor thesecond quarter of 2012, downcompared to $448.2 millionfor the same period in 2011 primarily due to lower realized gas prices.
“The second quarter was challenging for any company drilling for natural gas. Southwestern Energy has embraced those challenges and our results show we had a very strong quarter,” remarked Steve Mueller, President and Chief Executive Officer of Southwestern Energy. “Our costs continue to be low, with all-in cash operating costs of $1.20 per Mcfe for the second quarter of 2012 and our Fayetteville and Marcellus drilling programs continue to provide a meaningful drilling inventory at the prices we see going forward. Finally, our New Ventures activities in the Brown Dense play are providing encouraging results and we are excited about the other ideas we are pursuing. We see many challenges as we look toward the second half of 2012, but those challenges also bring opportunities that have the potential to make 2012 one of the most exciting years in our history.”
Second Quarter 2012 Financial Results
E&P Segment – Excludingthe non-cash impairment, operating income fromthe company’s E&P segment(reconciled below)was $76.0 million for the three months endedJune 30, 2012, compared to $222.5 million for the same period in 2011. The decrease was primarily due to
lower realized natural gas prices and increased operating costs and expenses from higher activity levels, partially offset by higher production.
Southwesternaccounts forits natural gas and oil properties using the full-cost method of accounting, which requires thecompany to perform a ceiling test that limits the amount ofits capitalized gas and oil properties less accumulated amortization and related deferred income taxesto the aggregate of the present value of future net revenues attributable to proved natural gas and oil reserves, net of taxes, discounted at 10 percent plus the lower of cost or market value of unproved properties. The company’s non-cash ceiling test impairment used the average quoted price from the first day of each month from the previous 12 months for Henry Hub natural gas of $3.15 per MMBtu and $92.17 per barrel for West Texas Intermediate oil, adjusted for market differentials, compared to$4.12 per MMBtu and $92.71 per barrel for West Texas Intermediate oil, adjusted for market differentials, at December 31, 2011.
Gas and oil production totaled137.4 Bcfe in thesecond quarter of2012, up12% from 122.8 Bcfe in thesecond quarter of 2011, and included121.0 Bcffromthe company’s Fayetteville Shale play, up from107.4 Bcf in thesecond quarter of 2011. Production from the Marcellus Shale was9.9 Bcf in thesecond quarter of 2012, compared to5.1 Bcf in thesecond quarter of 2011.
Including the effect of hedges, Southwestern’s average realized gas price in thesecondquarter of 2012 was $3.12 per Mcf, down27% from $4.30 per Mcf in thesecondquarter of 2011. The company’s commodity hedging activities increased its average gas price by $1.36 per Mcf during thesecond quarter of 2012, compared to an increase of $0.46 per Mcf during the same period in 2011. As ofJune 30, 2012, Southwestern hadNYMEX price hedges in place on notional volumes ofapproximately134 Bcf of itsremaining2012 forecasted gas production hedged at an average floor price of $5.16 per Mcf and approximately 185 Bcf of its 2013 forecasted gas production hedged at an average floor price of $5.06 per Mcf. As of June 30, 2012, the company had protected approximately 131 Bcf of its remaining 2012 expected gas production from the potential of widening basis differentials through hedging activities and sales arrangements at an average basis differential to NYMEX gas prices of approximately ($0.03) per Mcf.
The company typically sells its natural gas at a discount to NYMEX settlement prices. This discount includes a basis differential, third-party transportation charges and fuel charges. Disregarding the impact of commodity price hedges, the company’s average price received for its gas production during thesecond quarter of 2012 was approximately$0.46 per Mcf lower than average NYMEX settlement prices, compared to approximately $0.47 per Mcf lower during thesecondquarter of 2011.
In 2012, the company expects its total gas sales discount to NYMEX to be $0.45 to $0.55 per Mcf.
Lease operating expenses per unit of production forthe company’s E&P segment were$0.79 per Mcfein thesecond quarter of 2012, compared to $0.80 per Mcfe in thesecond quarter of 2011. Thedecrease was primarily due todecreased compression costs, offset slightly by an increase in salt water disposal costs.
General and administrative expenses per unit of production were$0.27 per Mcfe in thesecondquarter of 2012, flatcompared to thesecond quarter of 2011.
Taxes other than income taxes per unit of production were$0.08 per Mcfe in thesecond quarter of 2012, compared to $0.11 per Mcfe in thesecond quarter of 2011. Taxes other than income taxes vary due to changes in severance and ad valorem taxes that result from the mix of the company’s volumes and fluctuations in commodity prices.
The company’s full cost pool amortization ratewas $1.38 per Mcfe in thesecond quarter of 2012, compared to $1.28 per Mcfein thesecond quarter of 2011. The amortization rate is impacted by the timing and amount of reserve additions and the costs associated with those additions, revisions of previous reserve estimates due to both price and well performance, write-downs that result from full cost ceiling tests, proceeds from the sale of properties that reduce the full cost pool and the levels of costs subject to amortization. The company cannot predictits future full cost pool amortization rate with accuracy due to the variability of each of the factors discussed above, as well as other factors.
Midstream Services – Operating income for the company’sMidstreamServicessegment, which is comprised of natural gas gathering and marketing activities, was$71.8 million for the three months endedJune 30, 2012, up20%from $59.6 million in the same period in 2011. The increase in operating income was primarily due to increased gathering revenues related to thecompany’sFayettevilleand MarcellusShaleproperties, partially offset by increased operating costs and expenses. AtJune 30, 2012, the company’s midstream segment was gatheringapproximately 2.1 Bcf per day through1,829 miles of gathering lines in the Fayetteville Shale play, compared to gathering approximately2.0 Bcf per day a year ago. Gathering volumes, revenues and expenses for this segmentare expected to grow over the next few years largely as a result of increased development ofthe company’s acreage in the Fayetteville Shale and Marcellus Shale and the increased development activity undertaken by other operators in those areas.
First Six Months of 2012 Financial Results
For the first six months of 2012, Southwestern reporteda netloss of $380.4 million, or $1.09 perdilutedshare. Excluding the non-cashceiling testimpairment,the company reportedadjusted net income for the first six months of 2012 of $198.5 million (reconciled below), or $0.57 per diluted share, compared to$304.1 million, or $0.87 per diluted share,for the first six months of 2011.Net cash provided by operating activities before changes in operating assets and liabilities (reconciled below) was $725.3 million for the first six months of 2012, compared to $839.7 million for the same period in 2011.
E&P Segment – Excludingthe non-cash impairment, operating income fromthe company’s E&P segment(reconciled below)was $192.3 million for the six months ended June 30, 2012, compared to$400.8 millionfor the same period in 2011.Thedecrease was primarily due tolower average realized gas prices andincreased operating costs and expenses from higher activity levelswhich were partially offset by higher production volumes.
Gas and oil production was270.8 Bcfe in the first six months of 2012, up14% compared to237.8 Bcfe in the first six months of 2011, and included236.8 Bcf from the company’s Fayetteville Shale play, up from208.5 Bcf in the first six months of 2011. Production from the Marcellus Shale was19.2 Bcf in thefirst six months of 2012, compared to7.9 Bcf in thefirst six months of2011. The company expects that its full-year production for 2012 should range
between approximately 560 and 570 Bcfe, an increase of approximately 13% compared to 2011.
Southwestern’s average realized gas price was $3.30 per Mcf, including the effect of hedges, in the first six months of 2012 compared to $4.21 per Mcf in the first six months of 2011. The company’s hedging activities increased the average gas price realized during the first six months of 2012 by $1.30 per Mcf, compared to an increase of $0.45 per Mcf during the first six months of 2011. Disregarding the impact of hedges, the average price received for thecompany’s gas production during the first six months of 2012 was approximately $0.48 per Mcf lower than averagemonthlyNYMEXsettlement prices, compared toapproximately $0.45per Mcf during the first six months of 2011.
Lease operating expenses for the company’s E&P segment were $0.81 per Mcfe in the first six months of 2012, compared to $0.83 per Mcfe in the first six months of 2011. The decrease was primarily due to decreased compression costs in the Fayetteville Shale.
General and administrative expenses were $0.29 per Mcfe in the first six months of 2012, compared to $0.27 per Mcfe in the first six months of 2011. The increase in general and administrative expenses wasprimarily a result ofpersonnel and information system costs associated with the expansion ofthe company’s E&P operations due to the continued development of the Fayetteville Shale play and Marcellus Shale play.
Taxes other than income taxes were $0.11 per Mcfe during the first six months of 2012, flatcompared to the first six months of 2011. In February 2012, the Commonwealth of Pennsylvania passed the Unconventional Gas Well Impact Fee Actwhich imposes an annual impact fee for a period of up to fifteen years on each natural gas well drilled. The impact fee adjusts annually based on the age of the well, the average NYMEX natural gas price for the year and an inflation index.As a result ofthis legislation, Southwestern recorded a one-time expense in the first quarter of 2012 of $3.2 million, or approximately $0.024 per Mcfe, based on the required retroactive application of this legislation to all wells drilled in 2011 and previous years.
The company’s full cost pool amortization rateincreased to $1.36 per Mcfe in the first six months of 2012, compared to $1.30 per Mcfe in the first six months of 2011.
Midstream Services -Operating income for the company’s midstream activities was $141.1 million in the first six months of 2012, up24% compared to $113.6 million in the first six months of 2011. The increase in operating income was primarily due to increased gathering revenues related to thecompany’sFayettevilleand MarcellusShaleproperties, partially offset by increased operating costs and expenses.
CapitalStructure andInvestments– AtJune 30, 2012, the company had approximately$1.7 billion in long-term debt and itstotal debt-to-total capitalization was32.2%, compared to 25.3% at December 31, 2011. Excluding the non-cash impairment,the company’stotal debt-to-total capitalization was29.0%. The company also had cash and cash equivalents of approximately $41 million and restricted cash of approximately $144 million at June 30, 2012.
For the first six months of 2012, Southwestern invested a total ofapproximately$1.2 billion, compared to $1.1 billion during the first six months of 2011, which included$1,065 million invested in its E&P business and$74 million invested in its Midstream Services activities.
Southwestern’s total capital investments program for 2012 is expected to be approximately $2.1 billion.
E&P OperationsReview
Southwestern investedapproximately $1,065 million in its E&P business during the firstsix monthsof 2012,of which approximately$635 million was invested in its Fayetteville Shale play,$272 million in the Marcellus Shale,$145 million in New Ventures,$7 million inArk-La-Tex and $6 million in E&P Services.
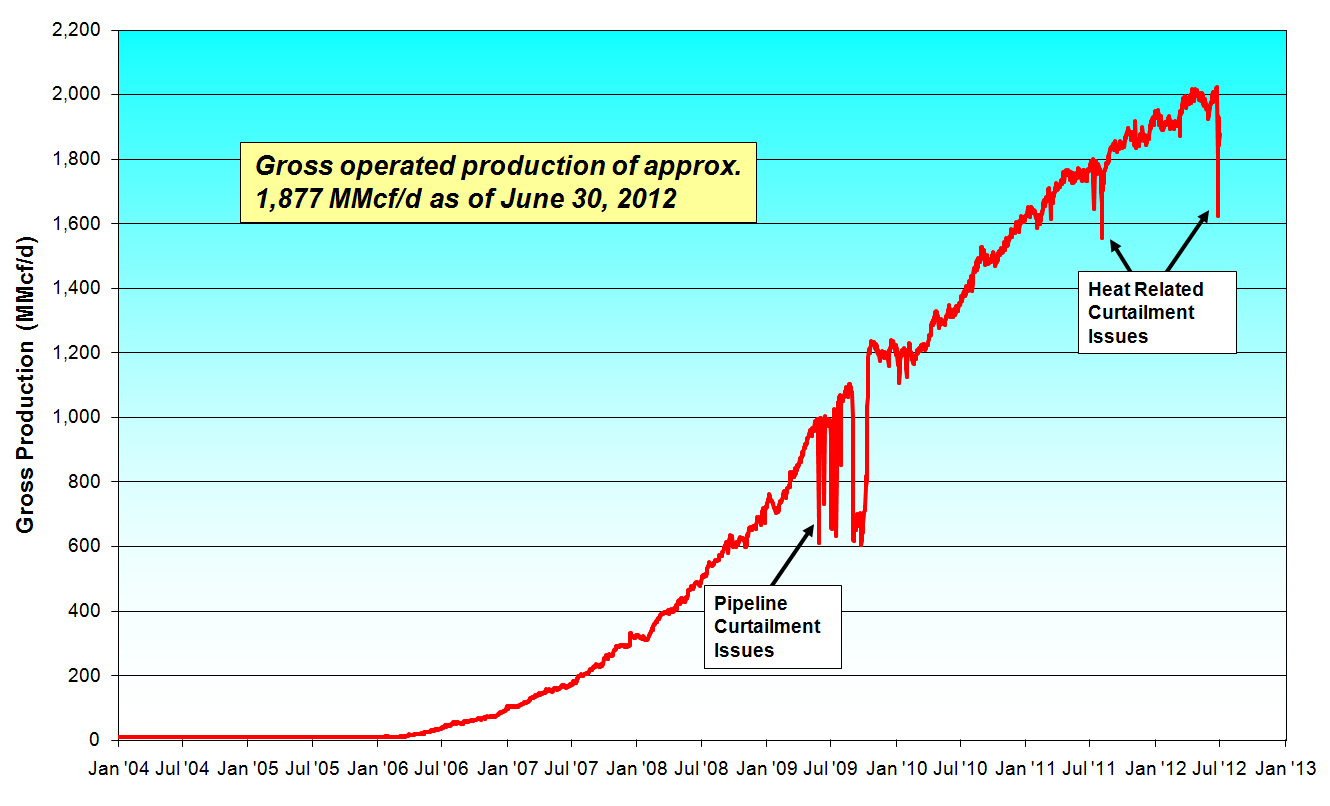
Fayetteville Shale Play – For thesecond quarter of 2012, Southwestern placed a total of131 operated wells on production in the Fayetteville Shale play, all of which were horizontal wells fracture stimulated using slickwater. AtJune 30, 2012, the company’s gross production rate from the Fayetteville Shale play was approximately1,877 MMcf per day, up from approximately1,775 MMcf per day a year ago.The company’s production from the Fayetteville Shale has been affected by the recent extremely high temperatures in central Arkansas and, year-to-date, the company estimates that its production from the field has been reduced by approximately 0.5 to 1.0 Bcf due to the extreme heat. Since June 30, the company’s gross producing rate has returned to approximately 2 Bcf per day.The company is currently utilizing11 drilling rigs in its Fayetteville Shale play, including7 that are capable of drilling horizontal wells. The graph below provides gross production data from the company’s operated wells in the Fayetteville Shale play area throughJune 30, 2012.
During thesecond quarter of 2012, the company’s horizontal wells had an average completed well costof $2.8 million per well, average horizontal lateral length of 4,840 feet and average time to drill to total depth of6.9 days from re-entry to re-entry. This compares to an average completed well cost of $2.8 million per well, average horizontal lateral length of4,743 feet and average time to drill to total depth of7.3 days from re-entry to re-entry in thefirst quarter of
2012. In thesecond quarter of 2012, the companyhad30 operated wells placed on production which had average times to drill to total depth of 5 days or less from re-entry to re-entry. In total, the company has had a total of160 wells drilled to total depth of 5 days or less from re-entry to re-entry.
The company’s wells placed on production duringthesecond quarter of2012 averaged initial productionrates of 3,500 Mcf per day. Results from the company’s drilling activities from 2007 by quarter are shown below.
| | | | | |
Time Frame | Wells Placed on Production | Average IP Rate (Mcf/d) | 30th-Day Avg Rate (# of wells) | 60th-Day Avg Rate (# of wells) | Average Lateral Length |
1st Qtr 2007 | 58 | 1,261 | 1,066 (58) | 958 (58) | 2,104 |
2nd Qtr 2007 | 46 | 1,497 | 1,254 (46) | 1,034 (46) | 2,512 |
3rd Qtr 2007 | 74 | 1,769 | 1,510 (72) | 1,334 (72) | 2,622 |
4th Qtr 2007 | 77 | 2,027 | 1,690 (77) | 1,481 (77) | 3,193 |
1st Qtr 2008 | 75 | 2,343 | 2,147 (75) | 1,943 (74) | 3,301 |
2nd Qtr 2008 | 83 | 2,541 | 2,155 (83) | 1,886 (83) | 3,562 |
3rd Qtr 2008 | 97 | 2,882 | 2,560 (97) | 2,349 (97) | 3,736 |
4th Qtr 2008(1) | 74 | 3,350(1) | 2,722 (74) | 2,386 (74) | 3,850 |
1st Qtr 2009(1) | 120 | 2,992(1) | 2,537 (120) | 2,293 (120) | 3,874 |
2nd Qtr 2009 | 111 | 3,611 | 2,833 (111) | 2,556 (111) | 4,123 |
3rd Qtr 2009 | 93 | 3,604 | 2,624 (93) | 2,255 (93) | 4,100 |
4th Qtr 2009 | 122 | 3,727 | 2,674 (122) | 2,360 (120) | 4,303 |
1st Qtr 2010(2) | 106 | 3,197(2) | 2,388 (106) | 2,123 (106) | 4,348 |
2nd Qtr 2010 | 143 | 3,449 | 2,554 (143) | 2,321 (142) | 4,532 |
3rd Qtr 2010 | 145 | 3,281 | 2,448 (145) | 2,202 (144) | 4,503 |
4th Qtr 2010 | 159 | 3,472 | 2,678 (159) | 2,294 (159) | 4,667 |
1st Qtr 2011 | 137 | 3,231 | 2,604 (137) | 2,238 (137) | 4,985 |
2nd Qtr 2011 | 149 | 3,014 | 2,328 (149) | 1,991 (149) | 4,839 |
3rd Qtr 2011 | 132 | 3,443 | 2,666 (132) | 2,372 (132) | 4,847 |
4th Qtr 2011 | 142 | 3,646 | 2,606 (142) | 2,243 (142) | 4,703 |
1st Qtr 2012 | 146 | 3,319 | 2,421 (146) | 2,131 (146) | 4,743 |
2nd Qtr 2012 | 131 | 3,500 | 2,454(121) | 2,003 (77) | 4,840 |
Note: Results as ofJune 30, 2012.
| (1) | The significant increase in the average initial production rate for the fourth quarter of 2008 and the subsequent decrease for the first quarter of 2009 primarily reflected the impact of the delay in the Boardwalk Pipeline. |
| (2) | In the first quarter of 2010, the company’s results were impacted by the shift of all wells to “green completions” and the mix of wells, as a large percentage of wells were placed on production in the shallower northern and far eastern borders of the company’s acreage. |
Marcellus Shale – As of June 30, 2012, Southwestern hasparticipated ina total of120 operated horizontal wells in northeast Pennsylvania, of which41 were producing. Net production from the area was9.9 Bcf in thesecondquarter of 2012, compared to5.1 Bcf in thesecond quarter of 2011.AtJune 30, 2012, the company’s gross operated production from the areawas approximately166 MMcf per day and was limited by high line pressures andgatheringconstraints. Recent gross production from the area hasexceeded 200 MMcf per day.
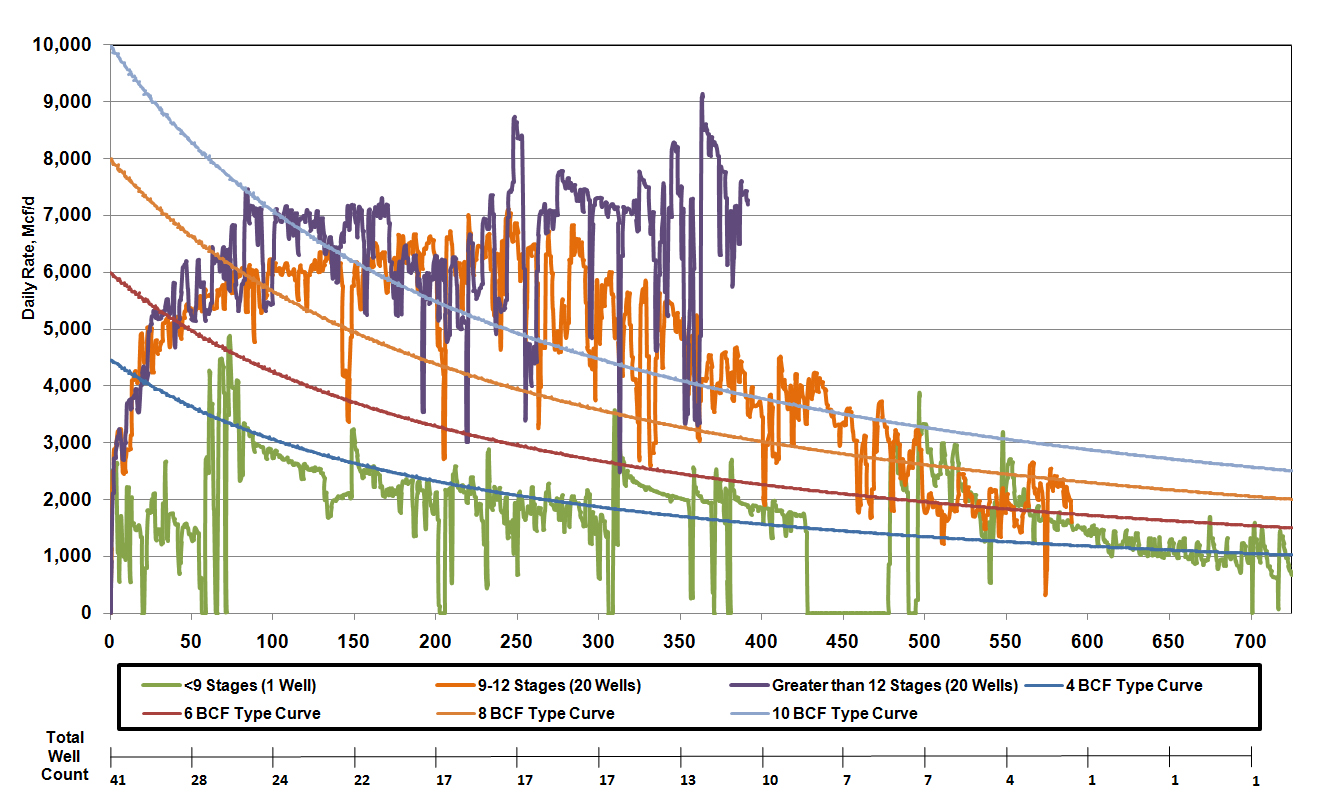
The graph below provides normalized average daily production data throughJune 30, 2012, for the company’s horizontal wellsin the Marcellus Shale. The “purple curve” indicates results for20wells withmore than 12 fracture stimulation stages, the “orange curve”indicates results for20wells with9 to 12 fracture stimulation stages and the “green curve”indicates results for1 well withless than 9 fracture stimulation stages. The normalized production curves are intended to provide a qualitative indication of the company’sMarcellus Shale wells’ performance and should
not be used to estimate an individual well’s estimated ultimate recovery. The4, 6, 8 and 10Bcf typecurves are shown solely for reference purposes and are not intended to be projections of the performance of the company’s wells.
Ark-La-Tex – Total net production fromthe company’sEast Texasand conventional Arkoma Basin propertieswas6.4 Bcfe inthesecond quarter of2012, comparedto10.3 Bcfe inthesecond quarter of2011.
On May 1,2012, Southwestern sold its oil andnaturalgas leases, wells andgatheringequipment inits Overton Field inEast Texas for approximately $168 million, excluding typicalpurchase price adjustments. The saleincludesapproximately19,800 net acres in Smith County, Texas. Net production from thefieldwas approximately24 MMcfe per dayas of the closing dateand proved net reserves were approximately143Bcfe as of year-end 2011.
New Ventures – As ofJune 30, 2012, Southwestern held3,756,870 net undeveloped acres in connection withits New Ventures prospects, of which 2,518,518 net acres were located in New Brunswick, Canada.
Southwestern has approximately 563,000 net acrestargeting theLower Smackover Brown Dense formationinsouthernArkansas andnorthernLouisiana. The company has drilledfour wells in the play area to date and is currently drilling two wells. The company’s first two wells, which were completed earlier this year, are currently shut-in for testing.The company’s third well, theBML #31-22 #1-1H located in Union Parish, Louisiana, was drilled to a vertical depth of approximately10,400 feet with a4,300-foot horizontal lateral and was completed with19 successful fracture stimulation stages in June. After41days of flowing up casing, this well’s highest 24-hour producing rate to date was421 barrels of50o API oil per day,3,900 Mcfof high Btu gasper day and836 barrels of water per day (43% of load recovered to date) with a
calculatedflowingbottom hole pressure of5,700 psi on a24/64-inch choke. Thewell was shut-in on July27in order toperform a pressure build-up test. The company believes that it will begin sellingbothoil and gas from the BML well in the fourth quarter of 2012.The oil pricingthe company is receiving from this area is at a premiumto WTIdue to the geographic location of the play, and analysis of the gas showsa Btu content ofapproximately 1,220 per cubic foot, soit is expected to receive a premium toNYMEX gas prices due to the richer gas liquids.The company’s fourth well, the Johnson #21-22-1 #1 located in Union Parish, Louisiana, was drilled to a vertical depth of10,507 feet in July.Like in the BML well, this well also encountered unusuallyhighpressure within the target formation.The company plans tocomplete this well vertically in August, but the well will be able to bere-entered as a horizontal well in the future. The company has also commenced drilling on theDean31-22-1E #1, located inUnionParish, Louisiana, which is currently drilling at approximately8,325 feet. This well is planned tobe drilled to approximately10,450 feet andbe completed vertically.The company is also drilling the Doles30-22-1H #1, located in Union Parish, Louisiana, which is currently drilling at approximately6,375 feet. This well is planned to be drilled toa measured depth ofapproximately17,300 feet and is currently designed to be completed with a6,000-foot horizontal lateral.
The company has also leased approximately 290,000net acres in the Denver-Julesburg Basin in eastern Colorado wherethe company has begun testing a new unconventional oil play targetingmiddle andlate Pennsylvanian to Permian agecarbonates and shales. InJuly, the company completed itsfirst well, the Ewertz Farms 1-58 #1-26, located in Adams County, Colorado,which was drilled to a total vertical depth of8,550 feet with a2,000-foothorizontallateral targeting the Marmaton formation. This wellbegan flowbackin mid-Julyand only24% of flowback has been recovered to date, however oil production began 3 days after flowback commenced.The highest 24-hour producing rate to date for the Ewertz Farms well was 65 barrels of oil per day, 40 Mcf of gas per day and 740 barrels of water per day on pump.The company has also drilled the Staner 5-58 #1-8 well located in Arapahoe County to a total vertical depth of9,650 feet. This well is planned to be completed in August as a vertical completion. The company will evaluate the production from these two wells over the next 90 days.
In New Brunswick, Canada, the company has deferred itsplanned 2012 exploration program until 2013 to provide additional time for public engagement and completion of the permitting process in the Province. The New Brunswick Department of Natural Resources and other key government officials support this decision andthe company will continue to work together with the appropriate parties to deliver onits commitments to the Province in 2013.
Explanation and Reconciliation of Non-GAAP Financial Measures
The company reports its financial results in accordance with accounting principles generally accepted in the United States of America (“GAAP”). However, management believes certain non-GAAP performance measures may provide users of this financial information additional meaningful comparisons between current results and the results ofitspeers and of prior periods.
One such non-GAAP financial measure is net cash provided by operating activities before changes in operating assets and liabilities. Management presents this measure because (i) it is accepted as an indicator of an oil and gas exploration and production company’s ability to internally fund exploration and development activities and to service or incur additional debt, (ii)
changes in operating assets and liabilities relate to the timing of cash receipts and disbursements which the company may not control and (iii) changes in operating assets and liabilities may not relate to the period in which the operating activities occurred.
Additional non-GAAP financial measuresthe company may present from time to time are net income, diluted earnings per share andits E&P segment operating income, all which exclude certain charges or amounts. Management presents these measures because (i) they are consistent with the manner in which thecompany’s performance is measured relative to the performance of its peers, (ii) these measures are more comparable to earnings estimates provided by securities analysts, and (iii) charges or amounts excluded cannot be reasonably estimated and guidance provided by thecompany excludes information regarding these types of items. These adjusted amounts are not a measure of financial performance under GAAP.
See the reconciliations below of GAAP financial measures to non-GAAP financial measures for the threeand sixmonths endedJune 30, 2012 andJune 30, 2011. Non-GAAP financial measures should not be considered in isolation or as a substitute for the company's reported results prepared in accordance with GAAP.
| | | |
| 3 Months EndedJune 30, |
| 2012 | | 2011 |
| (in thousands) |
Net income (loss): | | | |
Net income (loss) | $ (488,100) | | $ 167,454 |
Add back: | | | |
Impairment of natural gas and oil properties (net of taxes) | 578,879 | | -- |
Net income, excluding impairment of natural gas and oil properties | $ 90,779 | | $ 167,454 |
| | | |
| 6 Months EndedJune 30, |
| 2012 | | 2011 |
| (in thousands) |
Net income (loss): | | | |
Net income (loss) | $ (380,396) | | $ 304,063 |
Add back: | | | |
Impairment of natural gas and oil properties (net of taxes) | 578,879 | | -- |
Net income, excluding impairment of natural gas and oil properties | $ 198,483 | | $ 304,063 |
| | | |
| 3 Months EndedJune 30, |
| 2012 | | 2011 |
| |
Diluted earnings per share: | | | |
Net income (loss) per share | $ (1.40) | | $ 0.48 |
Add back: | | | |
Impairment of natural gas and oil properties (net of taxes) | 1.66 | | -- |
Net income per share, excluding impairment of natural gas and oil properties | $ 0.26 | | $ 0.48 |
| | | |
| 6 Months EndedJune 30, |
| 2012 | | 2011 |
| |
Diluted earnings per share: | | | |
Net income (loss) per share | $ (1.09) | | $ 0.87 |
Add back: | | | |
Impairment of natural gas and oil properties (net of taxes) | 1.66 | | -- |
Net income per share, excluding impairment of natural gas and oil properties | $ 0.57 | | $ 0.87 |
| | | |
| 3 Months EndedJune 30, |
| 2012 | | 2011 |
| (in thousands) |
Cash flow from operating activities: | | | |
Net cash provided by operating activities | $ 392,727 | | $ 460,451 |
Add back (deduct): | | | |
Change in operating assets and liabilities | (38,200) | | (12,237) |
Net cash provided by operating activities before changes in operating assets and liabilities | $ 354,527 | | $ 448,214 |
| | | |
| 6 Months EndedJune 30, |
| 2012 | | 2011 |
| (in thousands) |
Cash flow from operating activities: | | | |
Net cash provided by operating activities | $ 837,390 | | $ 856,930 |
Add back (deduct): | | | |
Change in operating assets and liabilities | (112,043) | | (17,184) |
Net cash provided by operating activities before changes in operating assets and liabilities | $ 725,347 | | $ 839,746 |
| | | |
| 3 Months EndedJune 30, |
| 2012 | | 2011 |
| (in thousands) |
E&P segment operating income: | | | |
E&P segment operating income (loss) | $ (859,872) | | $ 222,539 |
Add back: | | | |
Impairment of natural gas and oil properties | 935,899 | | -- |
E&P segment operating income excluding impairment of natural gas and oil properties | $ 76,027 | | $ 222,539 |
| | | |
| 6 Months EndedJune 30, |
| 2012 | | 2011 |
| (in thousands) |
E&P segment operating income: | | | |
E&P segment operating income (loss) | $ (743,629) | | $ 400,822 |
Add back: | | | |
Impairment of natural gas and oil properties | 935,899 | | -- |
E&P segment operating income excluding impairment of natural gas and oil properties | $ 192,270 | | $ 400,822 |
Southwestern will host a teleconference call on Friday,August 3, 2012, at 10:00 a.m. Eastern to discuss the company’ssecond quarter 2012 results. The toll-free number to call is877-407-8035 and the international toll-free number is 201-689-8035. The teleconference can also be heard “live” on the Internet athttp://www.swn.com.
Southwestern Energy Company is anindependent energycompany whose wholly-owned subsidiaries are engaged in oil and gas exploration and production, natural gas gathering and marketing. Additional information on the company can be found on the Internet athttp://www.swn.com.
| | |
Contacts: | Greg D. Kerley | Brad D. Sylvester, CFA |
| Executive Vice President | Vice President, Investor Relations |
| And Chief Financial Officer | (281) 618-4897 |
| (281) 618-4803 | |
All statements, other than historicalfacts andfinancial information, may be deemed to be forward-looking statements within the meaning of Section 27A of the Securities Act of 1933, as amended, and Section 21E of the Securities Exchange Act of 1934, as amended.All statements that address activities, outcomes and other matters that should or may occur in the future, including, without limitation, statements regarding the financial position, business strategy, production and reserve growth and other plans and objectives forthe company’sfuture operations, are forward-looking statements. Although the company believes the expectations expressed in such forward-looking statements are based on reasonable assumptions, such statements are not guarantees of future performance and actual results or developments may differ materially from those in the forward-looking statements.The company has no obligation and makes no undertaking to publicly update or revise any forward-looking statements, other than to the extent set forth below.You should not place undue reliance on forward-looking statements. They are subject to known and unknown risks, uncertainties and other factors that may affectthe company’s operations, markets, products, services and prices and causeitsactual results, performance or achievements to be materially different from any future results, performance or achievements expressed or implied by the forward-looking statements. In addition to any assumptions and other factors referred to specifically in connection with forward-looking statements, risks, uncertainties and factors that could causethe company’sactual results to differ materially from those indicated in any forward-looking statement include, but are not limited to: the timing and extent of changes in market conditions and prices for natural gas and oil (including regional basis differentials);the company’s ability to transport its production to the most favorable markets or at all;the timing and extent ofthe company’s success in discovering, developing, producing and estimating reserves; the economic viability of, andthe company’s success in drilling,the company’s large acreage position in the Fayetteville Shaleplay, overall as well as relative to other productive shale gasareas; the company’s ability to fundthe company’s planned capital investments; the impact of federal, state and local government regulation, including any legislation relating to hydraulic fracturing, the climate or over the counter derivatives; the company’s ability to determine the most effective and economic fracture stimulation for the Fayetteville Shaleplay and the Marcellus Shale play; the costs and availability of oil field personnel services and drilling supplies, raw materials, and equipment and services; the company’s future property acquisition or divestiture activities; increased competition; the financial impact of accounting regulations and critical accounting policies; the comparative cost of alternative fuels; conditions in capital markets, changes in interest rates and the ability of the company’s lenders to provide it with funds as agreed; credit risk relating to the
risk of loss as a result of non-performance by the company’s counterparties and any other factors listed in the reportsthe company hasfiled and may file with the Securities and Exchange Commission (SEC). For additional information with respect to certain of these and other factors, seethereports filed by the company with theSEC. The company disclaims any intention or obligation to update or revise any forward-looking statements, whether as a result of new information, future events or otherwise.
Financial Summary Follows
# # #

| | | | | | | |
OPERATING STATISTICS (Unaudited) | | | | | Page 1 of 5 |
Southwestern Energy Company and Subsidiaries | | | | | | | |
| | | | | | | |
| Three Months | | Six Months |
Periods Ended June 30, | 2012 | | 2011 | | 2012 | | 2011 |
| | | | | | | |
Exploration & Production | | | | | | | |
Production | | | | | | | |
Gas production (Bcf) | 137.2 | | 122.6 | | 270.5 | | 237.5 |
Oil production (MBbls) | 16 | | 25 | | 40 | | 55 |
Total equivalent production (Bcfe) | 137.4 | | 122.8 | | 270.8 | | 237.8 |
Commodity Prices | | | | | | | |
Average gas price per Mcf, including hedges | $ 3.12 | | $ 4.30 | | $ 3.30 | | $ 4.21 |
Average gas price per Mcf, excluding hedges | $ 1.76 | | $ 3.84 | | $ 2.00 | | $ 3.76 |
Average oil price per Bbl | $ 104.44 | | $ 100.32 | | $ 104.41 | | $ 95.86 |
Operating Expenses per Mcfe | | | | | | | |
Lease operating expenses | $ 0.79 | | $ 0.80 | | $ 0.81 | | $ 0.83 |
General & administrative expenses | $ 0.27 | | $ 0.27 | | $ 0.29 | | $ 0.27 |
Taxes, other than income taxes | $ 0.08 | | $ 0.11 | | $ 0.11 | | $ 0.11 |
Full cost pool amortization | $ 1.38 | | $ 1.28 | | $ 1.36 | | $ 1.30 |
| | | | | | | |
| | | | | | | |
Midstream | | | | | | | |
Gas volumes marketed (Bcf) | 168.0 | | 154.1 | | 327.5 | | 297.1 |
Gas volumes gathered (Bcf) | 206.2 | | 183.3 | | 408.2 | | 354.8 |
| | | | | | | |
| | | | | | | |
STATEMENTS OF OPERATIONS (Unaudited) | | | | | | | Page 2 of 5 |
Southwestern Energy Company and Subsidiaries | | | | | | | |
| Three Months | | Six Months |
Periods Ended June 30, | 2012 | | 2011 | | 2012 | | 2011 |
| (in thousands, except share/per share amounts) |
Operating Revenues | | | | | | | |
Gas sales | $ 429,044 | | $ 524,466 | | $ 892,812 | | $ 992,395 |
Gas marketing | 126,688 | | 201,358 | | 274,739 | | 372,456 |
Oil sales | 1,680 | | 2,503 | | 4,208 | | 5,230 |
Gas gathering | 42,316 | | 36,839 | | 84,438 | | 71,420 |
| 599,728 | | 765,166 | | 1,256,197 | | 1,441,501 |
Operating Costs and Expenses | | | | | | | |
Gas purchases – midstream services | 127,614 | | 200,052 | | 274,290 | | 370,282 |
Operating expenses | 56,614 | | 55,054 | | 117,572 | | 111,852 |
General and administrative expenses | 44,932 | | 40,238 | | 93,758 | | 77,355 |
Depreciation, depletion and amortization | 207,830 | | 171,620 | | 401,457 | | 335,067 |
Impairment of natural gas and oil properties | 935,899 | | — | | 935,899 | | — |
Taxes, other than income taxes | 14,480 | | 15,660 | | 34,902 | | 31,752 |
| 1,387,369 | | 482,624 | | 1,857,878 | | 926,308 |
Operating Income (Loss) | (787,641) | | 282,542 | | (601,681) | | 515,193 |
Interest Expense | | | | | | | |
Interest on debt | 23,956 | | 16,640 | | 43,691 | | 31,684 |
Other interest charges | 1,047 | | 1,001 | | 2,038 | | 2,512 |
Interest capitalized | (16,642) | | (11,471) | | (30,030) | | (20,590) |
| 8,361 | | 6,170 | | 15,699 | | 13,606 |
Other Income, Net | 2,577 | | 69 | | 2,377 | | 443 |
Income (Loss) Before Income Taxes | (793,425) | | 276,441 | | (615,003) | | 502,030 |
Provision for Income Taxes | | | | | | | |
Current | 100 | | 100 | | 268 | | 200 |
Deferred | (305,425) | | 108,887 | | (234,875) | | 197,767 |
| (305,325) | | 108,987 | | (234,607) | | 197,967 |
Net income (loss) | $ (488,100) | | $ 167,454 | | $ (380,396) | | $ 304,063 |
Earnings Per Share | | | | | | | |
Basic | $ (1.40) | | $ 0.48 | | $ (1.09) | | $ 0.88 |
Diluted | $ (1.40) | | $ 0.48 | | $ (1.09) | | $ 0.87 |
Weighted Average Common Shares Outstanding | | | | | | | |
Basic | 348,162,723 | | 347,132,830 | | 348,081,399 | | 346,984,194 |
Diluted | 348,162,723 | | 349,970,819 | | 348,081,399 | | 349,840,044 |
| | | |
BALANCE SHEETS (Unaudited) | Page 3 of 5 |
Southwestern Energy Company and Subsidiaries | | | |
| | | |
June 30, | 2012 | | 2011 |
| (in thousands) |
ASSETS | | | |
| | | |
Current Assets | $ 1,003,513 | | $ 686,142 |
Property and Equipment | 12,053,382 | | 9,973,824 |
Less: Accumulated depreciation, depletion and amortization | (5,763,882) | | (4,042,758) |
| 6,289,500 | | 5,931,066 |
Other Assets | 210,950 | | 124,893 |
| $ 7,503,963 | | $ 6,742,101 |
| | | |
LIABILITIES AND EQUITY | | | |
| | | |
Current Liabilities | $ 885,949 | | $ 767,349 |
Long-Term Debt | 1,668,811 | | 1,215,400 |
Deferred Income Taxes | 1,321,980 | | 1,323,970 |
Other Long-Term Liabilities | 111,346 | | 128,951 |
Commitments and Contingencies | | | |
Equity | | | |
Common stock, $0.01 par value; authorized 1,250,000,000 shares; issued 349,214,796 shares in 2012 and 348,108,100 in 2011 | 3,492 | | 3,481 |
Additional paid-in capital | 916,951 | | 874,827 |
Retained earnings | 2,275,818 | | 2,322,508 |
Accumulated other comprehensive income | 321,931 | | 108,383 |
Common stock in treasury, 101,659 shares in 2012 and 125,550 in 2011 | (2,315) | | (2,768) |
Total Equity | 3,515,877 | | 3,306,431 |
| $ 7,503,963 | | $ 6,742,101 |
| | | |
STATEMENTS OF CASH FLOWS (Unaudited) | Page 4 of 5 |
Southwestern Energy Company and Subsidiaries | | | |
| Six Months |
Periods Ended June 30, | 2012 | | 2011 |
| (in thousands) |
Cash Flows From Operating Activities | | | |
Net income (loss) | $ (380,396) | | $ 304,063 |
Adjustments to reconcile net income to net cash provided by operating activities: | | | |
Depreciation, depletion and amortization | 403,250 | | 337,035 |
Impairment of natural gas and oil properties | 935,899 | | — |
Deferred income taxes | (234,875) | | 197,767 |
Unrealized gain on derivatives | (4,567) | | (3,975) |
Stock-based compensation | 5,549 | | 4,686 |
Other | 487 | | 170 |
Change in assets and liabilities | 112,043 | | 17,184 |
Net cash provided by operating activities | 837,390 | | 856,930 |
| | | |
Cash Flows From Investing Activities | | | |
Capital investments | (1,140,661) | | (1,024,658) |
Proceeds from sale of property and equipment | 174,337 | | 121,133 |
Transfers to restricted cash | (167,750) | | (85,002) |
Transfers from restricted cash | 23,366 | | — |
Other | 8,895 | | 3,879 |
Net cash used in investing activities | (1,101,813) | | (984,648) |
| | | |
Cash Flows From Financing Activities | | | |
Payments on current portion of long-term debt | (600) | | (600) |
Payments on revolving long-term debt | (1,273,700) | | (1,717,600) |
Borrowings under revolving long-term debt | 602,200 | | 1,840,600 |
Change in bank drafts outstanding | (30,730) | | 9,260 |
Proceeds from issuance of long-term debt | 998,780 | | — |
Debt issuance costs | (8,338) | | — |
Revolving credit facility costs | — | | (10,210) |
Proceeds from exercise of common stock options | 2,698 | | 3,365 |
Net cash provided by financing activities | 290,310 | | 124,815 |
| | | |
Effect of exchange rate changes on cash | (15) | | 127 |
Increase (decrease) in cash and cash equivalents | 25,872 | | (2,776) |
Cash and cash equivalents at beginning of year | 15,627 | | 16,055 |
Cash and cash equivalents at end of period | $ 41,499 | | $ 13,279 |
| | | | | | | | | | | | | | |
| | | | | | | | | |
SEGMENT INFORMATION (Unaudited) | | | | | | Page 5 of 5 |
Southwestern Energy Company and Subsidiaries |
| Exploration | | | | | | | | |
| & | | Midstream | | | | | | |
| Production | | Services | | Other | | Eliminations | | Total |
| (in thousands) |
Quarter Ending June 30, 2012 | | | | | | | | | | | | | | |
| | | | | | | | | | | | | | |
Revenues | $ | 429,239 | | $ | 488,395 | | $ | 853 | | $ | (318,759) | | $ | 599,728 |
Gas purchases | | — | | | 366,994 | | | — | | | (239,380) | | | 127,614 |
Operating expenses | | 107,995 | | | 27,111 | | | 92 | | | (78,584) | | | 56,614 |
General & administrative expenses | | 37,402 | | | 8,262 | | | 63 | | | (795) | | �� | 44,932 |
Depreciation, depletion & amortization | | 196,201 | | | 11,309 | | | 320 | | | — | | | 207,830 |
Impairment of natural gas and oil properties | | 935,899 | | | — | | | — | | | — | | | 935,899 |
Taxes, other than income taxes | | 11,614 | | | 2,898 | | | (32) | | | — | | | 14,480 |
Operating Income (Loss) | $ | (859,872) | | $ | 71,821 | | $ | 410 | | $ | — | | $ | (787,641) |
| | | | | | | | | | | | | | |
Capital Investments(1) | $ | 531,845 | | $ | 47,719 | | $ | 9,069 | | $ | — | | $ | 588,633 |
| | | | | | | | | | | | | | |
| | | | | | | | | | | | | | |
Quarter Ending June 30, 2011 | | | | | | | | | | | | | | |
| | | | | | | | | | | | | | |
Revenues | $ | 529,868 | | $ | 760,609 | | $ | 793 | | $ | (526,104) | | $ | 765,166 |
Gas purchases | | — | | | 653,517 | | | — | | | (453,465) | | | 200,052 |
Operating expenses | | 98,276 | | | 28,611 | | | 19 | | | (71,852) | | | 55,054 |
General & administrative expenses | | 33,590 | | | 7,363 | | | 72 | | | (787) | | | 40,238 |
Depreciation, depletion & amortization | | 161,929 | | | 9,365 | | | 326 | | | — | | | 171,620 |
Taxes, other than income taxes | | 13,534 | | | 2,109 | | | 17 | | | — | | | 15,660 |
Operating Income | $ | 222,539 | | $ | 59,644 | | $ | 359 | | $ | — | | $ | 282,542 |
| | | | | | | | | | | | | | |
Capital Investments(1) | $ | 476,040 | | $ | 59,862 | | $ | 20,072 | | $ | — | | $ | 555,974 |
| | | | | | | | | | | | | | |
| | | | | | | | | | | | | | |
Six Months Ending June 30, 2012 | | | | | | | | | | | | | | |
| | | | | | | | | | | | | | |
Revenues | $ | 896,217 | | $ | 1,034,849 | | $ | 1,703 | | $ | (676,572) | | $ | 1,256,197 |
Gas purchases | | — | | | 792,489 | | | — | | | (518,199) | | | 274,290 |
Operating expenses | | 219,171 | | | 55,077 | | | 107 | | | (156,783) | | | 117,572 |
General & administrative expenses | | 77,348 | | | 17,867 | | | 133 | | | (1,590) | | | 93,758 |
Depreciation, depletion & amortization | | 378,940 | | | 21,879 | | | 638 | | | — | | | 401,457 |
Impairment of natural gas and oil properties | | 935,899 | | | — | | | — | | | — | | | 935,899 |
Taxes, other than income taxes | | 28,488 | | | 6,427 | | | (13) | | | — | | | 34,902 |
Operating Income (Loss) | $ | (743,629) | | $ | 141,110 | | $ | 838 | | $ | — | | $ | (601,681) |
| | | | | | | | | | | | | | |
Capital Investments(1) | $ | 1,064,984 | | $ | 73,883 | | $ | 22,878 | | $ | — | | $ | 1,161,745 |
| | | | | | | | | | | | | | |
| | | | | | | | | | | | | | |
Six Months Ending June 30, 2011 | | | | | | | | | | | | | | |
| | | | | | | | | | | | | | |
Revenues | $ | 1,006,038 | | $ | 1,439,877 | | $ | 1,569 | | $ | (1,005,983) | | $ | 1,441,501 |
Gas purchases | | — | | | 1,232,837 | | | — | | | (862,555) | | | 370,282 |
Operating expenses | | 197,221 | | | 56,477 | | | 19 | | | (141,865) | | | 111,852 |
General & administrative expenses | | 64,052 | | | 14,731 | | | 135 | | | (1,563) | | | 77,355 |
Depreciation, depletion & amortization | | 316,739 | | | 17,756 | | | 572 | | | — | | | 335,067 |
Taxes, other than income taxes | | 27,204 | | | 4,515 | | | 33 | | | — | | | 31,752 |
Operating Income | $ | 400,822 | | $ | 113,561 | | $ | 810 | | $ | — | | $ | 515,193 |
| | | | | | | | | | | | | | |
Capital Investments(1) | $ | 944,252 | | $ | 105,840 | | $ | 36,411 | | $ | — | | $ | 1,086,503 |
| | | | | | | | | | | | | | |
| (1) | Capital investments include an increase of $0.2 million and a reduction of $56.4 million for the three-month periods ended June 30, 2012 and 2011, respectively, and increases of $15.5 million and $57.9 million for the six-month periods ended June 30, 2012 and 2011, respectively, relating to the change in accrued expenditures between periods. |