NEWS RELEASE
SOUTHWESTERN ENERGY ANNOUNCES FIRST QUARTER
2014 FINANCIAL AND OPERATING RESULTS
Houston, Texas – May 1, 2014...Southwestern Energy Company (NYSE: SWN) today announced its financial and operating results for the quarter ended March 31, 2014. First quarter highlights include:
| · | | Record gas and oil production of 182.0 Bcfe, up 23% compared to year-ago levels; |
| · | | Record adjusted net income of $231.4 million, or $0.66 per diluted share, up 58% compared to year-ago levels when excluding losses on derivative contracts, net of settlements (a non-GAAP measure reconciled below); |
| · | | Record net cash provided by operating activities before changes in operating assets and liabilities of approximately $616.7 million, up 45% compared to year-ago levels (a non-GAAP measure reconciled below); and |
| · | | Marcellus Shale gross operated production reaches 800 MMcf per day; net production up 147% compared to year-ago levels. |
“A strong start to 2014 allowed us to set many records during the first quarter,” remarked Steve Mueller, President and Chief Executive Officer of Southwestern Energy. “Our first quarter demonstrated the earnings and cash flow power of our combined Fayetteville and Marcellus assets. Although we attained record production and earnings this quarter, our focus remains the same – to add more value every day through our current drilling and midstream operations while keeping our costs low, all the while building for the future with new exploration ideas.”
For the first quarter of 2014, Southwestern reported adjusted net income of $231.4 million, or $0.66 per diluted share, when excluding a $61.9 million ($37.2 million net of taxes) loss on derivative contracts, net of settlements. Including this loss, net income for the first quarter of 2014 was $194.2 million, or $0.55 per diluted share (reconciled below). For the first quarter of 2013, Southwestern reported adjusted net income of $146.0 million, or $0.42 per diluted share, when excluding a $30.8 million ($18.5 million net of taxes) loss on derivative contracts, net of settlements. Including this loss, Southwestern reported net income of $127.5 million, or $0.36 per diluted share, in the first quarter of 2013 (reconciled below).
Net cash provided by operating activities before changes in operating assets and liabilities (reconciled below) was $616.7 million for the first quarter of 2014, up 45% compared to $426.3 million for the same period in 2013.
E&P Segment – Operating income from the company’s E&P segment was $352.1 million for the first quarter of 2014, compared to $175.8 million for the same period in 2013. The increase was primarily due to higher production volumes and higher realized natural gas prices, offset slightly by increased operating costs and expenses due to increased compression and gathering costs.
Gas and oil production totaled 182.0 Bcfe in the first quarter of 2014, up 23% from 147.8 Bcfe in the first quarter of 2013, and included 119.4 Bcf from the Fayetteville Shale, compared to 118.9 Bcf in the first quarter of 2013. Gas production from the Marcellus Shale was 58.0 Bcf in the first quarter of 2014, more than double its production of 23.5 Bcf in the first quarter of 2013.
Including the effect of hedges, Southwestern’s average realized gas price in the first quarter of 2014 was $4.19 per Mcf, up from $3.42 per Mcf in the first quarter of 2013. The company’s commodity hedging activities decreased its average realized gas price by $0.44 per Mcf during the first quarter of 2014, compared to an increase of $0.54 per Mcf during the same period in 2013. As of April 30, 2014, the company had approximately 349 Bcf of its remaining 2014 forecasted gas production hedged at an average price of $4.35 per Mcf and approximately 240 Bcf of its 2015 forecasted gas production hedged at an average price of $4.40 per Mcf.
Like most producers, the company typically sells its natural gas at a discount to NYMEX settlement prices. This discount includes a basis differential, third-party transportation charges and fuel charges. Disregarding the impact of hedges, the company’s average price received for its gas production during the first quarter of 2014 was approximately $0.31 per Mcf lower than average NYMEX settlement prices, compared to approximately $0.46 per Mcf lower during the first quarter of 2013. As of April 30, 2014, the company had protected approximately 240 Bcf of its 2014 expected gas production from the potential of widening basis differentials through hedging activities and sales arrangements at an average basis differential to NYMEX gas prices of approximately ($0.11) per Mcf.
Lease operating expenses per unit of production for the company’s E&P segment were $0.93 per Mcfe in the first quarter of 2014, compared to $0.81 per Mcfe in the first quarter of 2013. The increase was primarily due to increased third-party gathering costs in the Marcellus Shale due to higher activity levels and higher compressor fuel costs as a result of higher natural gas prices.
General and administrative expenses per unit of production were $0.25 per Mcfe in the first quarter of 2014, compared to $0.21 per Mcfe in the first quarter of 2013, up due to higher personnel costs related to improved company performance.
Taxes other than income taxes were $0.13 per Mcfe in the first quarter of 2014, compared to $0.12 per Mcfe in the first quarter of 2013. Taxes other than income taxes per Mcfe vary from period to period due to changes in severance and ad valorem taxes that result from the mix of the company’s production volumes and fluctuations in commodity prices.
The company’s full cost pool amortization rate increased to $1.10 per Mcfe in the first quarter of 2014, compared to $1.09 per Mcfe in the first quarter of 2013. The amortization rate is impacted by the timing and amount of reserve additions and the costs associated with those additions, revisions of previous reserve estimates due to both price and well performance, write-downs that result from full cost ceiling tests, proceeds from the sale of properties that reduce the full cost pool and the levels of costs subject to amortization. The company cannot predict its future full cost pool amortization rate with accuracy due to the variability of each of the factors discussed above, as well as other factors.
Midstream Services – Operating income for the company’s Midstream Services segment, which is comprised of natural gas gathering and marketing activities, was $82.6 million for the first quarter of 2014, up 8% from $76.3 million for the same period in 2013. The growth in operating income was primarily due to increases in gas volumes gathered and marketing margins. At March 31, 2014, the company’s midstream segment was gathering approximately 2.3 Bcf per day through 1,961 miles of gathering lines in the Fayetteville Shale and approximately 436 MMcf per day from 96 miles of gathering lines in the Marcellus Shale. Gathering volumes, revenues and expenses for this segment are expected to grow over the next few years largely as a result of continued development of the company’s acreage in the Fayetteville Shale and Marcellus Shale and development activity being undertaken by other operators in those areas.
Capital Structure and Investments – At March 31, 2014, the company had approximately $1.8 billion in long-term debt, including approximately $160.2 million borrowed on its revolving credit facility, and its long-term debt-to-total capitalization ratio was 32%.
During the first quarter of 2014, Southwestern invested a total of $542 million, up from $518 million in the first quarter of 2013, and included approximately $499 million invested in its E&P business, $39 million invested in its Midstream Services segment and $4 million invested for corporate and other purposes.
E&P Operations Review
During the first quarter of 2014, Southwestern invested a total of approximately $499 million in its E&P business, including $227 million in the Fayetteville Shale, $184 million in the Marcellus Shale, $1 million in its Ark-La-Tex division, $60 million in New Ventures, and $27 million in E&P Services.
Marcellus Shale – In the first quarter of 2014, Southwestern placed 21 new wells on production in the Marcellus Shale resulting in net gas production from the Marcellus Shale of 58.0 Bcf, up 147% from 23.5 Bcf in the first quarter of 2013. Gross operated production in the Marcellus Shale was approximately 823 MMcf per day at March 31, 2014.
As of March 31, 2014, Southwestern had 193 operated wells on production and 91 wells in progress. Of the operated wells on production, 192 were horizontal wells of which 93 were located in Bradford County, 16 were located in Lycoming County and 83 were located in Susquehanna County. Of the 91 wells in progress, 36 were either waiting on completion or waiting to be placed to sales, including 10 in Bradford County and 26 in Susquehanna County.
Results from the company’s drilling activities since the third quarter of 2010 are shown below.
| | | | |
Time Frame | 30th-Day Avg Rate (# of wells) | Average Completed Lateral Length | Average RE-RE (Rig Days) | Average Completed Well Cost ($MM) |
3rd Qtr 2010 | 1,405 (1) | 2,927 | 22.6 | $5.8 |
4th Qtr 2010 | 5,584 (6) | 3,805 | 19.8 | $7.1 |
1st Qtr 2011 | 5,052 (3) | 3,864 | 18.1 | $6.6 |
2nd Qtr 2011 | 6,114 (7) | 4,780 | 13.4 | $6.7 |
4th Qtr 2011 | 5,284 (5) | 4,129 | 18.8 | $6.0 |
1st Qtr 2012 | 7,327 (2) | 4,009 | 13.2 | $6.0 |
2nd Qtr 2012 | 3,859 (17) | 3,934 | 12.9 | $6.0 |
3rd Qtr 2012 | 4,493 (8) | 4,380 | 13.2 | $5.7 |
4th Qtr 2012 | 4,606 (22) | 3,830 | 15.9 | $7.0 |
1st Qtr 2013 | 5,356 (21) | 4,712 | 11.0 | $7.0 |
2nd Qtr 2013 | 5,530 (37) | 4,371 | 11.6 | $6.6 |
3rd Qtr 2013 | 4,470 (22) | 4,740 | 11.5 | $7.3 |
4th Qtr 2013 | 7,589 (20) | 6,116 | 10.2 | $7.1 |
1st Qtr 2014 | 7,842 (6) | 4,718 | 10.5 | $6.2 |
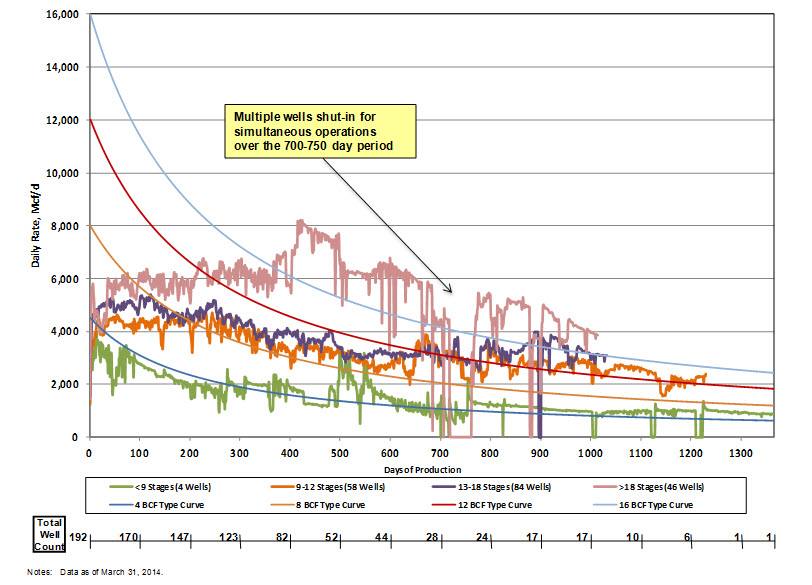
The graph below provides normalized average daily production data through March 31, 2014, for the company’s horizontal wells in the Marcellus Shale. The “pink curve” indicates results for 46 wells with more than 18 fracture stimulation stages, the “purple curve” indicates results for 84 wells with 13 to 18 fracture stimulation stages, the “orange curve” indicates results for 58 wells with 9 to 12 fracture stimulation stages and the “green curve” indicates results for 4 wells with less than 9 fracture stimulation stages. The normalized production curves are intended to provide a qualitative indication of the company’s Marcellus Shale wells’ performance and should not be used to estimate an individual well’s estimated ultimate recovery. The 4, 8, 12 and 16 Bcf typecurves are shown solely for reference purposes and are not intended to be projections of the performance of the company’s wells.
Fayetteville Shale – In the first quarter of 2014, Southwestern placed 105 new wells on production in the Fayetteville Shale resulting in net gas production from the Fayetteville Shale of 119.4 Bcf in the first quarter of 2014, compared to 118.9 Bcf in the first quarter of 2013. Gross operated gas production in the Fayetteville Shale was approximately 2,022 MMcf per day at March 31, 2014.
During the first quarter of 2014, the company’s horizontal wells in the Fayetteville Shale had an average completed well cost of $2.5 million per well, average horizontal lateral length of 5,680 feet and average time to drill to total depth of 6.9 days from re-entry to re-entry. This compares to an average horizontal lateral length of 5,976 feet and average time to drill to total depth of 6.9 days from re-entry to re-entry for an average completed well cost of $2.6 million per well in the fourth quarter of 2013. In the first quarter of 2014, the company had 21 operated wells placed on production which had average times to drill to total depth of 5 days or less from re-entry to re-entry. Since inception, the company has drilled 456 wells to total depth in 5 days or less from re-entry to re-entry in the Fayetteville Shale.
In the first quarter of 2014, the company placed 30 operated wells on production with initial production rates that exceeded 5,000 Mcf per day, and 18 wells that exceeded 6,000 Mcf per day. The company’s wells placed on production during the first quarter of 2014 averaged initial production rates of 4,272 Mcf per day. Results from the company’s drilling activities since the first quarter of 2007 are shown below
| | | | | |
Time Frame | Wells Placed on Production | Average IP Rate (Mcf/d) | 30th-Day Avg Rate (# of wells) | 60th-Day Avg Rate (# of wells) | Average Lateral Length |
1st Qtr 2007 | 58 | 1,261 | 1,066 (58) | 958 (58) | 2,104 |
2nd Qtr 2007 | 46 | 1,497 | 1,254 (46) | 1,034 (46) | 2,512 |
3rd Qtr 2007 | 74 | 1,769 | 1,510 (72) | 1,334 (72) | 2,622 |
4th Qtr 2007 | 77 | 2,027 | 1,690 (77) | 1,481 (77) | 3,193 |
1st Qtr 2008 | 75 | 2,343 | 2,147 (75) | 1,943 (74) | 3,301 |
2nd Qtr 2008 | 83 | 2,541 | 2,155 (83) | 1,886 (83) | 3,562 |
3rd Qtr 2008 | 97 | 2,882 | 2,560 (97) | 2,349 (97) | 3,736 |
4th Qtr 2008(1) | 74 | 3,350(1) | 2,722 (74) | 2,386 (74) | 3,850 |
1st Qtr 2009(1) | 120 | 2,992(1) | 2,537 (120) | 2,293 (120) | 3,874 |
2nd Qtr 2009 | 111 | 3,611 | 2,833 (111) | 2,556 (111) | 4,123 |
3rd Qtr 2009 | 93 | 3,604 | 2,624 (93) | 2,255 (93) | 4,100 |
4th Qtr 2009 | 122 | 3,727 | 2,674 (122) | 2,360 (120) | 4,303 |
1st Qtr 2010(2) | 106 | 3,197(2) | 2,388 (106) | 2,123 (106) | 4,348 |
2nd Qtr 2010 | 143 | 3,449 | 2,554 (143) | 2,321 (142) | 4,532 |
3rd Qtr 2010 | 145 | 3,281 | 2,448 (145) | 2,202 (144) | 4,503 |
4th Qtr 2010 | 159 | 3,472 | 2,678 (159) | 2,294 (159) | 4,667 |
1st Qtr 2011 | 137 | 3,231 | 2,604 (137) | 2,238 (137) | 4,985 |
2nd Qtr 2011 | 149 | 3,014 | 2,328 (149) | 1,991 (149) | 4,839 |
3rd Qtr 2011 | 132 | 3,443 | 2,666 (132) | 2,372 (132) | 4,847 |
4th Qtr 2011 | 142 | 3,646 | 2,606 (142) | 2,243 (142) | 4,703 |
1st Qtr 2012 | 146 | 3,319 | 2,421 (146) | 2,131 (146) | 4,743 |
2nd Qtr 2012 | 131 | 3,500 | 2,515 (131) | 2,225 (131) | 4,840 |
3rd Qtr 2012 | 105 | 3,857 | 2,816 (105) | 2,447 (105) | 4,974 |
4th Qtr 2012 | 111 | 3,962 | 2,815 (111) | 2,405 (111) | 4,784 |
1st Qtr 2013 | 102 | 3,301 | 2,366 (102) | 2,069 (102) | 4,942 |
2nd Qtr 2013 | 126 | 3,625 | 2,233 (126) | 1,975 (126) | 5,165 |
3rd Qtr 2013 | 89 | 4,597 | 2,696 (89) | 2,374 (87) | 5,490 |
4th Qtr 2013 | 97 | 4,901 | 2,850 (93) | 2,605 (89) | 5,976 |
1st Qtr 2014 | 105 | 4,272 | 2,724 (61) | 2,917 (23) | 5,680 |
Note: Results as of March 31, 2014.
| (1) | | The significant increase in the average initial production rate for the fourth quarter of 2008 and the subsequent decrease for the first quarter of 2009 is primarily due to an operational delay of the Boardwalk Pipeline. |
| (2) | | In the first quarter of 2010, the company’s results were impacted by the shift of all wells to “green completions” and the mix of wells, as a large percentage of wells were placed on production in the shallower northern and far eastern borders of the company’s acreage. |
Ark-La-Tex – Total net production from the company’s East Texas and conventional Arkoma Basin assets was 4.3 Bcfe in the first quarter of 2014, compared to 4.8 Bcfe in the first quarter of 2013.
New Ventures – In the company’s Lower Smackover Brown Dense project, the Sharp 22-22-1 #1 vertical well in Union Parish, Louisiana, was placed back on production in late March and is currently producing at approximately 431 barrels of oil per day and 852 Mcf of gas per day. The company’s Milstead 15-22-1 #1 vertical well in Union Parish, located one mile north of the company’s Sharp well, reached a peak 24-hour production rate of 28 barrels of oil per day and 161 Mcf of gas per day in April. The company’s Plum Creek 23-22-1 #1 vertical well in Union Parish was completed with 9 stages in April and has just begun to flow back. In April, the company started drilling the Benson 27-22-1 #1 vertical well.
On May 1, 2014, the company closed on its previously announced acquisition of approximately 312,000 net acres in northwest Colorado targeting the Niobrara formation for approximately $180 million.
Explanation and Reconciliation of Non-GAAP Financial Measures
The company reports its financial results in accordance with accounting principles generally accepted in the United States of America (“GAAP”). However, management believes certain non-GAAP performance measures may provide financial statement users with additional meaningful comparisons between current results and the results of its peers and of prior periods.
One such non-GAAP financial measure is net cash provided by operating activities before changes in operating assets and liabilities. Management presents this measure because (i) it is accepted as an indicator of an oil and gas exploration and production company’s ability to internally fund exploration and development activities and to service or incur additional debt, (ii) changes in operating assets and liabilities relate to the timing of cash receipts and disbursements which the company may not control and (iii) changes in operating assets and liabilities may not relate to the period in which the operating activities occurred.
Additional non-GAAP financial measures the company may present from time to time are adjusted net income, adjusted diluted earnings per share and its E&P segment operating income, all which exclude certain charges or amounts. Management presents these measures because (i) they are consistent with the manner in which the company’s performance is measured relative to the performance of its peers, (ii) these measures are more comparable to earnings estimates provided by securities analysts, and (iii) charges or amounts excluded cannot be reasonably estimated and guidance provided by the company excludes information regarding these types of items. These adjusted amounts are not a measure of financial performance under GAAP.
See the reconciliations below of GAAP financial measures to non-GAAP financial measures for the three months ended March 31, 2014 and March 31, 2013. Non-GAAP financial measures should not be considered in isolation or as a substitute for the company's reported results prepared in accordance with GAAP.
| | | |
| 3 Months Ended March 31, |
| 2014 | | 2013 |
| (in thousands) |
Net income: | | | |
Net income | $ 194,190 | | $ 127,515 |
Add back: | | | |
Loss on derivatives, net of settlement (net of taxes) | 37,183 | | 18,473 |
Adjusted net income | $ 231,373 | | $ 145,988 |
| | | |
| 3 Months Ended March 31, |
| 2014 | | 2013 |
| |
Diluted earnings per share: | | | |
Diluted earnings per share | $ 0.55 | | $ 0.36 |
Add back: | | | |
Loss on derivatives, net of settlement (net of taxes) | 0.11 | | 0.06 |
Adjusted diluted earnings per share | $ 0.66 | | $ 0.42 |
| | | |
| 3 Months Ended March 31, |
| 2014 | | 2013 |
| (in thousands) |
Cash flow from operating activities: | | | |
Net cash provided by operating activities | $ 608,866 | | $ 372,138 |
Add back (deduct): | | | |
Change in operating assets and liabilities | 7,817 | | 54,114 |
Net cash provided by operating activities before changes in operating assets and liabilities | $ 616,683 | | $ 426,252 |
Southwestern management will host a teleconference call on Friday, May 2, 2014 at 10:00 a.m. EST to discuss its first quarter 2014 results. The toll-free number to call is 877-407-8035 and the international dial-in number is 201-689-8035. The teleconference can also be heard “live” on the Internet at http://www.swn.com.
Southwestern Energy Company is an independent energy company whose wholly-owned subsidiaries are engaged in natural gas and oil exploration and production and natural gas gathering and marketing. Additional information about the company can be found on the internet at http://www.swn.com.
| | |
Contacts: | R. Craig Owen | Brad D. Sylvester, CFA |
| Senior Vice President | Vice President, Investor Relations |
| and Chief Financial Officer | (281) 618-4897 |
| (281) 618-2808 | |