UNITED STATES
SECURITIES AND EXCHANGE COMMISSION
Washington, D.C. 20549
FORM N-CSR
CERTIFIED SHAREHOLDER REPORT
OF
REGISTERED MANAGEMENT INVESTMENT COMPANIES
Investment Company Act file number: 811-3916
Name of Registrant: Vanguard Specialized Funds
Address of Registrant:
P.O. Box 2600
Valley Forge, PA 19482
Name and address of agent for service:
Heidi Stam, Esquire
P.O. Box 876
Valley Forge, PA 19482
Registrant’s telephone number, including area code: (610) 669-1000
Date of fiscal year end: January 31
Date of reporting period: February 1, 2011 – July 31, 2011
Item 1: Reports to Shareholders
| Vanguard Energy Fund |
| Semiannual Report |
| July 31, 2011 |
 |
> Vanguard Energy Fund returned about 4% for the six months ended July 31, 2011.
> The fund’s return beat that of its benchmark index and the average return of its peer funds.
> The top contributors to performance were companies that provide energy equipment and those engaged in oil and gas exploration and production.
| Contents | |
| Your Fund’s Total Returns. | 1 |
| Chairman’s Letter. | 2 |
| Advisors’ Report. | 6 |
| Fund Profile. | 10 |
| Performance Summary. | 12 |
| Financial Statements. | 13 |
| About Your Fund’s Expenses. | 27 |
| Trustees Approve Advisory Arrangements. | 29 |
| Glossary. | 31 |
Please note: The opinions expressed in this report are just that—informed opinions. They should not be considered promises or advice.
Also, please keep in mind that the information and opinions cover the period through the date on the front of this report. Of course, the risks of investing in your fund are spelled out in the prospectus.
See the Glossary for definitions of investment terms used in this report.
Cover photograph: Jean Maher.
Your Fund’s Total Returns
Six Months Ended July 31, 2011
| Total | |
| Returns | |
| Vanguard Energy Fund | |
| Investor Shares | 4.34% |
| Admiral™ Shares | 4.38 |
| MSCI ACWI Energy Index | 2.59 |
| Global Natural Resources Funds Average | 0.13 |
| Global Natural Resources Funds Average: Derived from data provided by Lipper Inc. | |
Admiral Shares carry lower expenses and are available to investors who meet certain account-balance requirements.
Your Fund’s Performance at a Glance
January 31, 2011 , Through July 31, 2011
| Distributions Per Share | ||||
| Starting | Ending | Income | Capital | |
| Share Price | Share Price | Dividends | Gains | |
| Vanguard Energy Fund | ||||
| Investor Shares | $69.20 | $71.69 | $0.018 | $0.503 |
| Admiral Shares | 129.93 | 134.64 | 0.043 | 0.944 |
1

Chairman’s Letter
Dear Shareholder,
Vanguard Energy Fund returned about 4% for the six months ended July 31, 2011. The fund outperformed both its benchmark index and the average return of global natural resources funds.
A surge in crude oil prices in the first half of the period helped energy stocks outpace the broad U.S. market. The Energy Fund also benefited from the advisors’ stock selection among oil and gas exploration companies and firms that provide energy equipment and services.
I want to note that on May 11, we lowered the minimum required investment for the Investor Shares of several Vanguard funds, including the Energy Fund, to $3,000. This was done as part of our ongoing effort to simplify the offering of Investor Shares and to increase the accessibility of our funds.
Stocks worldwide crept higher in a treacherous marketplace
Global stock markets struggled to find direction during the past six months, as every positive signal seemed to be paired with its negative. The good news included surprisingly strong corporate profits, which proved to be a source of investor optimism through much of the period.
The counterpoint was a series of increasingly glum economic reports. Expectations that the U.S. economic expansion would accelerate in the second half of the year gave way to anxiety about the possibility of recession.
2
The Dow Jones U.S. Total Stock Market Index finished the period with a return of 1.55%. Across the globe, stock returns were similarly modest.
Bonds rallied in the U.S. market as investors sought safety
Bond prices climbed amid the turbulence. Investors sought refuge from a collection of troubles: Europe’s debt dramas, economic shocks produced by the Japanese tsunami and its aftermath, and prolonged debate over raising the U.S. debt ceiling. For the full six months, the broad U.S. taxable bond market returned more than 4%. (Rising prices are a mixed blessing, of course; they imply lower yields on future investment.)
The yields on money market instruments such as Treasury bills remained near 0%, consistent with the Federal Reserve’s target for short-term interest rates.
The U.S. credit downgrade: a cause for concern, not panic
On August 5, after the close of our reporting period, Standard & Poor’s downgraded its credit rating of U.S. debt from AAA to AA+. S&P said its action was prompted, in large part, by concern about “the effectiveness, stability, and predictability of American policymaking and political institutions”— in other words, the political gridlock on vivid display during the debt-ceiling debate.
| Market Barometer | |||
| Total Returns | |||
| Periods Ended July 31, 2011 | |||
| Six | One | Five Years | |
| Months | Year | (Annualized) | |
| Stocks | |||
| Russell 1000 Index (Large-caps) | 1.62% | 20.68% | 2.80% |
| Russell 2000 Index (Small-caps) | 2.63 | 23.92 | 4.00 |
| Dow Jones U.S. Total Stock Market Index | 1.55 | 20.83 | 3.27 |
| MSCI All Country World Index ex USA (International) | 1.39 | 17.36 | 3.18 |
| Bonds | |||
| Barclays Capital U.S. Aggregate Bond Index (Broad | |||
| taxable market) | 4.23% | 4.44% | 6.57% |
| Barclays Capital Municipal Bond Index (Broad | |||
| tax-exempt market) | 6.27 | 3.24 | 4.90 |
| Citigroup Three-Month U.S. Treasury Bill Index | 0.05 | 0.13 | 1.78 |
| CPI | |||
| Consumer Price Index | 2.59% | 3.63% | 2.11% |
3
The downgrade was controversial, and the other major rating agencies reaffirmed their decision to continue giving the highest ratings to U.S. debt. At Vanguard, our credit analysts and economists regularly assess the financial strength of the United States and other sovereign borrowers. Our confidence in the “full faith and credit” of the U.S. government remains unshaken, and we have cautioned investors against overreacting to the S&P downgrade.
Oil and natural gas price volatility provided challenges, opportunities
Early in the semiannual period, investors grew fearful of supply disruptions resulting from conflicts in the Middle East and North Africa and the natural disasters in Japan. These concerns pushed up the price of West Texas Intermediate crude oil to more than $113 a barrel in April—its highest level since 2008.
Vanguard Energy Fund’s stocks climbed nearly 10% in the first three months of the period, but then retreated, losing half their gains by July. Steep gasoline prices led consumers to cut back their driving, and the faltering of the U.S. economic recovery further weakened demand, leading to a decline in crude oil prices.
The largest proportion of the Energy Fund’s assets—about 50%, on average—is invested in integrated oil and gas companies. Although many of these companies reported strong earnings for the second quarter of 2011, they
Expense Ratios
Your Fund Compared With Its Peer Group
| Investor | Admiral | Peer Group | |
| Shares | Shares | Average | |
| Energy Fund | 0.34% | 0.28% | 1.50% |
The fund expense ratios shown are from the prospectus dated May 26, 2011, and represent estimated costs for the current fiscal year. For the six months ended July 31, 2011, the fund’s annualized expense ratios were 0.34% for Investor Shares and 0.28% for Admiral Shares. The peer-group expense ratio is derived from data provided by Lipper Inc. and captures information through year-end 2010.
Peer group: Global Natural Resources Funds.
4
ended up contributing only about a fifth of the fund’s return for the fiscal six months. Several turned in negative returns, battered by the decline in oil prices and a slump in production caused by, among other factors, limited access to war-torn areas such as Libya and drilling restrictions in the Gulf of Mexico.
Exxon Mobil, the fund’s largest holding—representing about 8% of its assets, on average—had a flat return for the six months, in part because of costs associated with its aggressive push into the natural gas business, which has struggled with stagnant prices. Last year, Exxon acquired XTO Energy, making it the largest U.S. natural gas producer.
The Energy Fund’s top performers for the period were natural gas producers. Although natural gas prices declined slightly during the half-year, the fund held sizable shares of a few strong performers in that segment that helped boost its results above those of its benchmark index. One example was Cabot Oil & Gas, an independent natural gas producer, which represented about 2% of the fund’s assets on average but contributed more than a quarter of the overall return.
Providers of oil and gas equipment and services also were strong contributors. Several of these companies turned in double-digit returns for the period, as they have benefited from the drilling boom in natural gas shale formations throughout the United States.
Diversification and perspective are important in volatile markets
The volatility in the stock market in recent months has tested investors’ mettle. As an investor in the Energy Fund, you’re probably familiar with the market’s potential for sharp and unpredictable swings.
At Vanguard, our guidance is the same for all investment environments: We believe investors should pursue their long-term goals with a portfolio that includes stocks, bonds, and money market funds in proportions consistent with their personal risk tolerance and time horizon. This balanced approach has demonstrated its wisdom over decades.
Vanguard Energy Fund, with its wide exposure to global energy companies, can play a supporting role in such a well-balanced portfolio. And while its narrow focus can leave it vulnerable to notable share price fluctuations, in the context of a larger, well-diversified portfolio, the fund can help dampen overall volatility. That’s because one sector can behave very differently from other parts of the market.
As always, thank you for continuing to entrust your assets to Vanguard.
Sincerely,

F. William McNabb III
Chairman and Chief Executive Officer
August 10, 2011
5
Advisors’ Report
Vanguard Energy Fund returned 4.34% for Investor Shares and 4.38% for Admiral Shares in the six months ended July 31, 2011. Your fund is managed by two advisors, a strategy that enhances the fund’s diversification by providing exposure to distinct, yet complementary, investment approaches. It’s not uncommon for different advisors to have different views about individual securities or the broader investment environment.
The advisors, the amount and percentage of fund assets each manages, and brief descriptions of their investment strategies are presented in the table below. The advisors have also provided a discussion of the investment environment that existed during the year and of how their portfolio positioning reflects this assessment. These reports were prepared on August 17, 2011.
| Vanguard Energy Fund Investment Advisors | |||
| Fund Assets Managed | |||
| Investment Advisor | % | $ Million | Investment Strategy |
| Wellington Management | 95 | 13,549 | Emphasizes long-term total-return opportunities from |
| Company, LLP | the various energy subsectors: international oils, | ||
| foreign integrated oils and foreign producers, North | |||
| American producers, oil services and equipment, | |||
| transportation and distribution, and refining and | |||
| marketing. | |||
| Vanguard Quantitative Equity | 3 | 384 | Employs a quantitative fundamental management |
| Group | approach, using models that assess valuation, market | ||
| sentiment, earnings quality and growth, and | |||
| management decisions of companies relative to their | |||
| peers. | |||
| Cash Investments | 2 | 260 | These short-term reserves are invested by Vanguard in |
| equity index products to simulate investments in stock. | |||
| Each advisor may also maintain a modest cash | |||
| position. | |||
6
Wellington Management Company, LLP
Portfolio Manager:
Karl E. Bandtel, Senior Vice President
For the six months, U.S. equities returned a tepid 1.46% as measured by the S&P 500 Index. The broad equity market trailed energy stocks during a period marked by increasing risk aversion and heightened volatility. Ongoing sovereign-debt concerns and monetary-policy tightening in Europe, as well as the possibility of slower global economic growth, weighed on markets. The political uncertainty concerning the U.S. debt ceiling unnerved investors further as the half-year drew to a close.
Commodity prices fluctuated during the period. Unrest in the Middle East and North Africa contributed to increases in oil prices early on, but prices fell after Western governments decided to release strategic reserves. Crude oil finished the period higher than it started, closing at $96 a barrel (West Texas Intermediate).
The price of natural gas in the United States finished the period near $4.25 per million BTUs (Henry Hub), not far from where it started. Abundant U.S. shale formations continued to provide low-cost supplies. Abroad, rising demand from emerging markets and the aftermath of the natural and nuclear disasters in Japan kept prices higher in Europe and Asia.
Our position in shares of Cabot Oil & Gas, a producer that focuses on natural gas, contributed strongly to our portfolio’s performance. Wellhead results topped
the market’s expectations, increasing investors’ confidence in the quality of the firm’s resource base. We see a strong outlook for production growth as the completion of significant infrastructure projects unlocks constraints on natural gas production in the firm’s high-quality Marcellus shale acreage. We trimmed our position in Cabot as the stock rose.
Another notable contributor was Japan-based Inpex, an oil and gas exploration and production firm. The company’s stock advanced as the outlook for its Ichthys project improved. Inpex also benefited from the rising demand for liquefied natural gas.
On the other hand, our position in Total, a multinational integrated oil and gas company, detracted from six-month performance. The stock fell on declining production. Given the low valuation, we see attractive upside potential. The company also has a high dividend yield, an excellent balance sheet, and potential for good future production from new fields.
Shares of Petroleo Brasileiro, Brazil’s state-owned oil company, also declined during the period. Concerns about increased local-content requirements, high capital expenditures, and weak returns on downstream investments weighed on the stock. We continue to hold the company based on an attractive valuation and the firm’s high-quality project inventory, including its leverage in the offshore Brazil pre-salt layer, one of the most productive oil resources in the world.
7
Although our long-term outlook for the energy sector is favorable, we would urge caution regarding the near-term direction of commodity prices and the volatility that accompanies investing in energy stocks.
Looking ahead, we believe that crude oil prices will likely continue to vary in tandem with changes to the outlook for both supply and demand. While pricing for natural gas remains driven by regional factors, we think the wide price arbitrage with other fuels and changing views about nuclear power generation will drive global demand in the long term.
The portfolio remains focused on upstream companies—those engaged in exploration and production—and skewed in favor of low-cost producers with compelling valuations based on our assessment of their respective long-term resource bases. We believe many of these companies have the ability to create value absent generally rising commodity prices.
Our investment process remains steady in its emphasis on large-capitalization integrated oil firms as well as exploration and production companies. Maintaining a large-cap, low-turnover bias, this global portfolio remains diversified across the energy subsectors.
Vanguard Quantitative Equity Group
Portfolio Manager:
James D. Troyer, CFA, Principal
The energy stocks in our benchmark started the period strongly, extending the solid performance of the previous fiscal year. Along with equities in general, however, these stocks then reversed their trend and finished the half-year with a smaller gain.
Within the energy sector, emerging market stocks performed best, followed by stocks in the Pacific region. European energy companies continued to struggle, while U.S. companies slightly outperformed. These results underscore the point that strong corporate profit growth and earnings during the last two quarters alone have not been enough to convince investors that the economy is on a sustainable growth path, especially in view of the many unsettling political and economic events worldwide in recent months.
While portfolio performance is influenced by such macro factors, our strategy is not to maintain a view on the overall market for energy shares. We also avoid making calls on relative country performance. Rather, our investment process seeks to identify individual stocks that we believe
8
are undervalued or that have shown price improvement relative to peers on the basis of recent earnings pronouncements. Our risk-control process then neutralizes the portfolio’s exposure to market-capitalization, volatility, and industry risks in comparison with our energy benchmark. In our view, such risk exposures are not justified by the rewards available.
For the period, our most successful holdings represented regions across the globe: Halliburton (+22%) and Chesapeake Energy (+17%) in the United States; Petronas Dagangan (+52%) in Malaysia; and Tatneft (+44%) in Russia. Equally important to the portfolio’s performance was our ability to limit exposure to underperforming stocks such as Canada’s Cameco (–35%).
The portfolio’s results were dampened by our overweighting of Hess (–18%) and Arch Coal (–25%). Our underweighting of better-performing stocks such as China Shenhua Energy (+27%) also held back performance relative to the benchmark.
An analysis of the results from our stock selection model shows that, of the two core components described earlier, our valuation signal contributed most to the overall return, but our signal related to price and earnings improvements also had positive impact. This outcome strengthens our confidence in the diversified approach that we employ in constructing a portfolio, which we believe will prove its merit in the long term.
9
Energy Fund
Fund Profile
As of July 31, 2011
| Share-Class Characteristics | |||
| Investor | Admiral | ||
| Shares | Shares | ||
| Ticker Symbol | VGENX | VGELX | |
| Expense Ratio1 | 0.34% | 0.28% | |
| 30-Day SEC Yield | 1.35% | 1.41% | |
| Portfolio Characteristics | |||
| DJ | |||
| MSCI | U.S. Total | ||
| ACWI | Market | ||
| Fund | Energy | Index | |
| Number of Stocks | 135 | 168 | 3,753 |
| Median Market Cap | $47.4B | $80.3B | $31.4B |
| Price/Earnings Ratio | 15.5x | 13.0x | 16.3x |
| Price/Book Ratio | 1.9x | 1.8x | 2.2x |
| Return on Equity | 20.1% | 20.8% | 19.0% |
| Earnings Growth Rate | -5.4% | -2.2% | 6.3% |
| Dividend Yield | 1.8% | 2.4% | 1.8% |
| Foreign Holdings | 37.9% | 54.5% | 0.0% |
| Turnover Rate | |||
| (Annualized) | 19% | — | — |
| Short-Term Reserves | 1.0% | — | — |
| Volatility Measures | ||
| DJ | ||
| Spliced | U.S. Total | |
| Energy | Market | |
| Index | Index | |
| R-Squared | 0.90 | 0.77 |
| Beta | 1.13 | 1.09 |
| These measures show the degree and timing of the fund’s fluctuations compared with the indexes over 36 months. | ||
| Ten Largest Holdings (% of total net assets) | ||
| Exxon Mobil Corp. | Integrated Oil & | |
| Gas | 7.5% | |
| Chevron Corp. | Integrated Oil & | |
| Gas | 4.6 | |
| Royal Dutch Shell plc | Integrated Oil & | |
| Gas | 4.5 | |
| Occidental Petroleum | Integrated Oil & | |
| Corp. | Gas | 4.4 |
| BP plc | Integrated Oil & | |
| Gas | 3.6 | |
| Schlumberger Ltd. | Oil & Gas | |
| Equipment & | ||
| Services | 2.9 | |
| Baker Hughes Inc. | Oil & Gas | |
| Equipment & | ||
| Services | 2.7 | |
| Halliburton Co. | Oil & Gas | |
| Equipment & | ||
| Services | 2.7 | |
| Total SA | Integrated Oil & | |
| Gas | 2.6 | |
| Consol Energy Inc. | Coal & Consumable | |
| Fuels | 2.5 | |
| Top Ten | 38.0% | |
| The holdings listed exclude any temporary cash investments and equity index products. | ||
1 The expense ratios shown are from the prospectus dated May 26, 2011, and represent estimated costs for the current fiscal year. For the six months ended July 31, 2011, the annualized expense ratios were 0.34% for Investor Shares and 0.28% for Admiral Shares.
10
Energy Fund
| Subindustry Diversification (% of equity exposure) | ||
| MSCI | ||
| ACWI | ||
| Fund | Energy | |
| Coal & Consumable Fuels | 4.8% | 3.2% |
| Consumer Staples | 0.3 | 0.0 |
| Industrials | 0.9 | 0.0 |
| Integrated Oil & Gas | 47.1 | 56.7 |
| Oil & Gas Drilling | 1.6 | 1.9 |
| Oil & Gas Equipment & | ||
| Services | 11.2 | 10.3 |
| Oil & Gas Exploration & | ||
| Production | 29.3 | 20.4 |
| Oil & Gas Refining & | ||
| Marketing | 2.8 | 4.1 |
| Oil & Gas Storage & | ||
| Transportation | 1.2 | 3.4 |
| Other | 0.8 | 0.0 |
| Market Diversification (% of equity exposure) | ||
| Europe | ||
| United Kingdom | 11.1% | |
| France | 2.6 | |
| Norway | 1.4 | |
| Italy | 1.4 | |
| Other | 1.1 | |
| Subtotal | 17.6% | |
| Pacific | ||
| Japan | 1.9% | |
| Other | 0.2 | |
| Subtotal | 2.1% | |
| Emerging Markets | ||
| Russia | 2.8% | |
| China | 2.5 | |
| Brazil | 2.1 | |
| Other | 1.5 | |
| Subtotal | 8.9% | |
| North America | ||
| United States | 61.8% | |
| Canada | 9.6 | |
| Subtotal | 71.4% | |
11
Energy Fund
Performance Summary
All of the returns in this report represent past performance, which is not a guarantee of future results that may be achieved by the fund. (Current performance may be lower or higher than the performance data cited. For performance data current to the most recent month-end, visit our website at vanguard.com/performance.) Note, too, that both investment returns and principal value can fluctuate widely, so an investor’s shares, when sold, could be worth more or less than their original cost. The returns shown do not reflect taxes that a shareholder would pay on fund distributions or on the sale of fund shares.
Fiscal-Year Total Returns (%): January 31, 2001, Through July 31, 2011
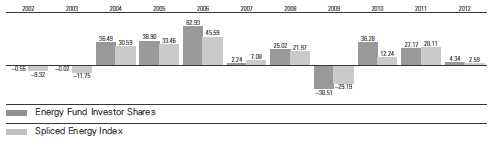
Note: For 2012, performance data reflect the six months ended July 31, 2011.
Average Annual Total Returns: Periods Ended June 30, 2011
This table presents returns through the latest calendar quarter—rather than through the end of the fiscal period.
Securities and Exchange Commission rules require that we provide this information.
| Inception | One | Five | Ten | |
| Date | Year | Years | Years | |
| Investor Shares | 5/23/1984 | 45.57% | 6.78% | 15.57% |
| Admiral Shares | 11/12/2001 | 45.66 | 6.85 | 16.601 |
| 1 Return since inception. | ||||
Vanguard fund returns do not reflect the 1% fee on redemptions of shares held for less than one year.
See Financial Highlights for dividend and capital gains information.
12
Energy Fund
Financial Statements (unaudited)
Statement of Net Assets
As of July 31, 2011
The fund reports a complete list of its holdings in regulatory filings four times in each fiscal year, at the quarter-ends. For the second and fourth fiscal quarters, the lists appear in the fund’s semiannual and annual reports to shareholders. For the first and third fiscal quarters, the fund files the lists with the Securities and Exchange Commission on Form N-Q. Shareholders can look up the fund’s Forms N-Q on the SEC’s website at sec.gov. Forms N-Q may also be reviewed and copied at the SEC’s Public Reference Room (see the back cover of this report for further information).
| Market | |||
| Value | |||
| Shares | ($000) | ||
| Common Stocks (97.6%)1 | |||
| United States (59.7%) | |||
| Energy Equipment & Services (11.1%) | |||
| Schlumberger Ltd. | 4,562,564 | 412,319 | |
| Baker Hughes Inc. | 4,970,650 | 384,629 | |
| Halliburton Co. | 7,006,162 | 383,447 | |
| * | Weatherford | ||
| International Ltd. | 5,535,900 | 121,347 | |
| National Oilwell | |||
| Varco Inc. | 1,431,876 | 115,366 | |
| SEACOR Holdings Inc. | 941,108 | 94,450 | |
| Noble Corp. | 1,728,325 | 63,723 | |
| Helmerich & Payne Inc. | 42,200 | 2,914 | |
| Transocean Ltd. | 6,210 | 382 | |
| 1,578,577 | |||
| Exchange-Traded Fund (0.5%) | |||
| ^,2 | Vanguard Energy ETF | 663,000 | 74,462 |
| Oil, Gas & Consumable Fuels (48.1%) | |||
| Coal & Consumable Fuels (3.7%) | |||
| Consol Energy Inc. | 6,611,200 | 354,360 | |
| Peabody Energy Corp. | 3,017,200 | 173,399 | |
| Arch Coal Inc. | 68,400 | 1,751 | |
| Integrated Oil & Gas (19.7%) | |||
| Exxon Mobil Corp. | 13,338,769 | 1,064,300 | |
| Chevron Corp. | 6,326,235 | 658,055 | |
| Occidental | |||
| Petroleum Corp. | 6,322,161 | 620,710 | |
| ConocoPhillips | 4,405,209 | 317,131 | |
| Hess Corp. | 1,835,839 | 125,865 | |
| Murphy Oil Corp. | 20,570 | 1,321 | |
| Oil & Gas Exploration & Production (22.3%) | |||
| EOG Resources Inc. | 3,371,986 | 343,943 | |
| Cabot Oil & Gas Corp. | 4,551,731 | 337,192 | |
| Anadarko | |||
| Petroleum Corp. | 3,204,930 | 264,599 | |
| Market | |||
| Value | |||
| Shares | ($000) | ||
| Noble Energy Inc. | 2,631,900 | 262,348 | |
| Devon Energy Corp. | 3,249,407 | 255,728 | |
| EQT Corp. | 3,475,900 | 220,650 | |
| Chesapeake Energy Corp. | 5,821,137 | 199,956 | |
| * | Denbury Resources Inc. | 9,771,344 | 188,782 |
| Apache Corp. | 1,515,300 | 187,473 | |
| Marathon Oil Corp. | 5,406,991 | 167,455 | |
| * | Ultra Petroleum Corp. | 3,113,236 | 145,762 |
| Range Resources Corp. | 2,029,100 | 132,216 | |
| Pioneer Natural | |||
| Resources Co. | 996,600 | 92,674 | |
| * | Newfield Exploration Co. | 1,320,203 | 89,008 |
| QEP Resources Inc. | 1,681,618 | 73,705 | |
| * | Southwestern Energy Co. | 1,642,000 | 73,168 |
| * | Whiting Petroleum Corp. | 821,300 | 48,128 |
| * | Gran Tierra Energy Inc. | 6,354,100 | 44,291 |
| * | Forest Oil Corp. | 1,221,500 | 31,759 |
| * | Plains Exploration & | ||
| Production Co. | 67,600 | 2,637 | |
| Oil & Gas Refining & Marketing (1.7%) | |||
| Valero Energy Corp. | 4,946,212 | 124,249 | |
| * | Marathon | ||
| Petroleum Corp. | 2,698,345 | 118,160 | |
| Oil & Gas Storage & Transportation (0.7%) | |||
| El Paso Corp. | 2,807,100 | 57,686 | |
| ^ | Nordic American | ||
| Tankers Ltd. | 1,894,515 | 38,800 | |
| Williams Cos. Inc. | 131,800 | 4,178 | |
| Spectra Energy Corp. | 2,100 | 57 | |
| 6,821,496 | |||
| Total United States | 8,474,535 | ||
| International (37.9%) | |||
| Argentina (0.5%) | |||
| YPF SA ADR | 1,800,200 | 76,634 | |
13
Energy Fund
| Market | |||
| Value | |||
| Shares | ($000) | ||
| Australia (0.2%) | |||
| Oil Search Ltd. | 3,897,262 | 29,242 | |
| Caltex Australia Ltd. | 136,558 | 1,597 | |
| Woodside Petroleum Ltd. | 26,520 | 1,118 | |
| 31,957 | |||
| Brazil (2.1%) | |||
| Petroleo Brasileiro | |||
| SA ADR | 7,729,505 | 262,571 | |
| Cosan Ltd. | 2,087,916 | 25,744 | |
| Petroleo Brasileiro | |||
| SA Prior Pfd. | 314,504 | 4,758 | |
| Petroleo Brasileiro SA | 222,022 | 3,722 | |
| Petroleo Brasileiro | |||
| SA ADR Type A | 44,920 | 1,380 | |
| 298,175 | |||
| Canada (9.5%) | |||
| Canadian Natural | |||
| Resources Ltd. | 7,430,318 | 299,368 | |
| Cenovus Energy Inc. | 6,204,800 | 237,954 | |
| Suncor Energy Inc. | 5,319,812 | 203,323 | |
| Encana Corp. | 3,543,100 | 103,777 | |
| Husky Energy Inc. | 2,980,200 | 83,437 | |
| Imperial Oil Ltd. | 1,736,477 | 76,457 | |
| Penn West | |||
| Petroleum Ltd. | 2,911,421 | 64,954 | |
| TransCanada Corp. | 1,472,896 | 61,879 | |
| Progress Energy | |||
| Resources Corp. | 3,943,800 | 57,210 | |
| Cameco Corp. | 1,814,500 | 48,193 | |
| Talisman Energy Inc. | 1,442,173 | 26,264 | |
| * | Legacy Oil & Gas Inc. | 1,633,200 | 19,333 |
| Niko Resources Ltd. | 237,550 | 16,337 | |
| * | MEG Energy Corp. | 277,517 | 14,947 |
| Suncor Energy Inc. | 220,134 | 8,437 | |
| Pacific Rubiales | |||
| Energy Corp. | 208,500 | 5,997 | |
| Petrominerales Ltd. | 183,000 | 5,838 | |
| Imperial Oil Ltd. | 71,500 | 3,143 | |
| Canadian Natural | |||
| Resources Ltd. | 75,378 | 3,044 | |
| ^ | PetroBakken Energy Ltd. | ||
| Class A | 140,400 | 2,066 | |
| Cenovus Energy Inc. | 27,139 | 1,043 | |
| ^ | Crescent Point Energy Corp. | 22,000 | 989 |
| Encana Corp. | 19,539 | 573 | |
| Enbridge Inc. | 17,100 | 561 | |
| * | Tourmaline Oil Corp. | 5,700 | 213 |
| 1,345,337 | |||
| China (2.5%) | |||
| PetroChina Co. Ltd. ADR | 1,308,000 | 186,037 | |
| China Shenhua | |||
| Energy Co. Ltd. | 16,317,000 | 81,815 | |
| Beijing Enterprises | |||
| Holdings Ltd. | 13,271,000 | 67,002 | |
| CNOOC Ltd. | 2,818,717 | 6,274 | |
| Market | |||
| Value | |||
| Shares | ($000) | ||
| PetroChina Co. Ltd. | 3,746,000 | 5,345 | |
| Yanzhou Coal | |||
| Mining Co. Ltd. | 742,000 | 2,843 | |
| China Oilfield | |||
| Services Ltd. | 1,164,000 | 2,036 | |
| 351,352 | |||
| France (2.6%) | |||
| Total SA ADR | 6,523,600 | 352,731 | |
| Total SA | 264,373 | 14,289 | |
| 367,020 | |||
| Hungary (0.0%) | |||
| * | MOL Hungarian | ||
| Oil and Gas plc | 21,197 | 2,275 | |
| India (0.8%) | |||
| Reliance Industries Ltd. | 5,975,772 | 111,758 | |
| Indonesia (0.0%) | |||
| Bumi Resources Tbk PT | 6,894,500 | 2,461 | |
| Italy (1.4%) | |||
| ENI SPA ADR | 3,860,350 | 167,076 | |
| ENI SPA | 1,223,968 | 26,598 | |
| Saipem SPA | 68,494 | 3,569 | |
| 197,243 | |||
| Japan (1.9%) | |||
| Inpex Corp. | 32,908 | 255,449 | |
| JX Holdings Inc. | 359,500 | 2,599 | |
| Idemitsu Kosan Co. Ltd. | 20,200 | 2,346 | |
| TonenGeneral Sekiyu KK | 176,000 | 2,211 | |
| Showa Shell Sekiyu KK | 227,500 | 2,190 | |
| Japan Petroleum | |||
| Exploration Co. | 15,200 | 774 | |
| Sumitomo Metal | |||
| Industries Ltd. | 69,000 | 165 | |
| 265,734 | |||
| Malaysia (0.0%) | |||
| Petronas Dagangan Bhd. | 399,000 | 2,395 | |
| Netherlands (0.3%) | |||
| Koninklijke Vopak NV | 719,642 | 35,916 | |
| SBM Offshore NV | 95,998 | 2,295 | |
| 38,211 | |||
| Norway (1.4%) | |||
| ^ | Statoil ASA ADR | 6,604,800 | 162,280 |
| * | Petroleum Geo- | ||
| Services ASA | 2,155,416 | 34,956 | |
| Statoil ASA | 47,651 | 1,175 | |
| 198,411 | |||
| Poland (0.0%) | |||
| * | Polski Koncern | ||
| Naftowy Orlen SA | 143,435 | 2,404 | |
| * | Grupa Lotos SA | 130,446 | 1,788 |
| 4,192 | |||
14
Energy Fund
| Market | ||
| Value | ||
| Shares | ($000) | |
| Russia (2.7%) | ||
| Gazprom OAO ADR | 19,718,615 | 282,167 |
| Rosneft Oil Co. GDR | 11,131,982 | 94,472 |
| Tatneft ADR | 78,772 | 3,289 |
| AK Transneft OAO | ||
| Prior Pfd. | 1,549 | 2,461 |
| Lukoil OAO ADR | 27,638 | 1,838 |
| NovaTek OAO GDR | 6,844 | 1,062 |
| Gazprom OAO | 124,674 | 883 |
| 386,172 | ||
| South Africa (0.0%) | ||
| Sasol Ltd. | 33,251 | 1,668 |
| South Korea (0.1%) | ||
| SK Innovation Co. Ltd. | 16,726 | 3,448 |
| S-Oil Corp. | 19,395 | 2,743 |
| GS Holdings | 31,530 | 2,702 |
| 8,893 | ||
| Spain (0.8%) | ||
| Repsol YPF SA | 3,504,087 | 110,513 |
| Thailand (0.1%) | ||
| PTT PCL (Foreign) | 267,500 | 3,100 |
| Banpu PCL | 95,150 | 2,323 |
| Thai Oil PCL (Foreign) | 872,600 | 2,234 |
| IRPC PCL (Foreign) | 10,783,200 | 2,071 |
| PTT Aromatics & | ||
| Refining PCL (Foreign) | 123,100 | 175 |
| 9,903 | ||
| Turkey (0.0%) | ||
| Tupras Turkiye | ||
| Petrol Rafinerileri AS | 89,761 | 2,179 |
| United Kingdom (11.0%) | ||
| BP plc ADR | 10,872,400 | 494,042 |
| Royal Dutch | ||
| Shell plc ADR | 6,426,600 | 472,741 |
| BG Group plc | 10,762,661 | 253,749 |
| Ensco plc ADR | 2,937,306 | 156,412 |
| Royal Dutch Shell plc | ||
| Class B | 4,226,315 | 154,751 |
| BP plc | 2,037,380 | 15,355 |
| Royal Dutch Shell plc | ||
| Class A | 330,410 | 12,103 |
| Royal Dutch Shell plc | ||
| Class A | ||
| (Amsterdam Shares) | 94,282 | 3,461 |
| Tullow Oil plc | 6,237 | 125 |
| 1,562,739 | ||
| Total International | 5,375,222 | |
| Total Common Stocks | ||
| (Cost $8,232,443) | 13,849,757 | |
| Market | |||
| Value | |||
| Shares | ($000) | ||
| Temporary Cash Investments (2.5%)1 | |||
| Money Market Fund (0.3%) | |||
| 3,4 | Vanguard Market | ||
| Liquidity Fund, 0.114% | 41,445,874 | 41,446 | |
| Face | |||
| Amount | |||
| ($000) | |||
| Repurchase Agreement (2.1%) | |||
| Deutsche Bank | |||
| Securities, Inc. | |||
| 0.200%, 8/1/11 | |||
| (Dated 7/29/11, | |||
| Repurchase Value | |||
| $296,705,000, | |||
| collateralized by | |||
| Government National | |||
| Mortgage Assn. | |||
| 4.000%–5.000%, | |||
| 7/15/39–7/15/41) | 296,700 | 296,700 | |
| U.S. Government and Agency Obligations (0.1%) | |||
| 5,6 | Fannie Mae Discount | ||
| Notes, 0.060%, 8/8/11 | 1,000 | 1,000 | |
| 5 | Federal Home Loan | ||
| Bank Discount Notes, | |||
| 0.250%, 9/7/11 | 5,000 | 4,999 | |
| 5,6 | Federal Home Loan | ||
| Bank Discount Notes, | |||
| 0.070%, 9/16/11 | 5,000 | 4,999 | |
| 5,6 | Federal Home Loan | ||
| Bank Discount Notes, | |||
| 0.100%, 10/11/11 | 1,000 | 1,000 | |
| 5,6 | Freddie Mac Discount | ||
| Notes, 0.050%, 10/3/11 | 2,000 | 1,999 | |
| 13,997 | |||
| Total Temporary Cash Investments | |||
| (Cost $352,144) | 352,143 | ||
| Total Investments (100.1%) | |||
| (Cost $8,584,587) | 14,201,900 | ||
| Other Assets and Liabilities (-0.1%) | |||
| Other Assets | 98,197 | ||
| Liabilities4 | (107,127) | ||
| (8,930) | |||
| Net Assets (100%) | 14,192,970 | ||
15
Energy Fund
| At July 31, 2011, net assets consisted of: | |
| Amount | |
| ($000) | |
| Paid-in Capital | 8,146,102 |
| Undistributed Net Investment Income | 92,815 |
| Accumulated Net Realized Gains | 337,165 |
| Unrealized Appreciation (Depreciation) | |
| Investment Securities | 5,617,313 |
| Futures Contracts | (1,078) |
| Forward Currency Contracts | 577 |
| Foreign Currencies | 76 |
| Net Assets | 14,192,970 |
| Investor Shares—Net Assets | |
| Applicable to 98,387,191 outstanding | |
| $.001 par value shares of beneficial | |
| interest (unlimited authorization) | 7,052,888 |
| Net Asset Value Per Share— | |
| Investor Shares | $71.69 |
| Admiral Shares—Net Assets | |
| Applicable to 53,032,725 outstanding | |
| $.001 par value shares of beneficial | |
| interest (unlimited authorization) | 7,140,082 |
| Net Asset Value Per Share— | |
| Admiral Shares | $134.64 |
See Note A in Notes to Financial Statements.
* Non-income-producing security.
^ Part of security position is on loan to broker-dealers. The total value of securities on loan is $33,777,000.
1 The fund invests a portion of its cash reserves in equity markets through the use of index futures contracts. After giving effect to futures investments, the fund’s effective common stock and temporary cash investment positions represent 98.8% and 1.3%, respectively, of net assets.
2 Considered an affiliated company of the fund as the issuer is another member of The Vanguard Group.
3 Affiliated money market fund available only to Vanguard funds and certain trusts and accounts managed by Vanguard. Rate shown is the 7-day yield.
4 Includes $35,165,000 of collateral received for securities on loan.
5 The issuer operates under a congressional charter; its securities are not backed by the full faith and credit of the U.S. government.
6 Securities with a value of $8,298,000 have been segregated as initial margin for open futures contracts.
ADR—American Depositary Receipt.
GDR—Global Depositary Receipt.
See accompanying Notes, which are an integral part of the Financial Statements.
16
Energy Fund
Statement of Operations
| Six Months Ended | |
| July 31, 2011 | |
| ($000) | |
| Investment Income | |
| Income | |
| Dividends1,2 | 130,016 |
| Interest2 | 436 |
| Security Lending | 5,022 |
| Total Income | 135,474 |
| Expenses | |
| Investment Advisory Fees—Note B | |
| Basic Fee | 10,010 |
| Performance Adjustment | 55 |
| The Vanguard Group—Note C | |
| Management and Administrative—Investor Shares | 6,012 |
| Management and Administrative—Admiral Shares | 4,083 |
| Marketing and Distribution—Investor Shares | 756 |
| Marketing and Distribution—Admiral Shares | 677 |
| Custodian Fees | 259 |
| Shareholders’ Reports—Investor Shares | 39 |
| Shareholders’ Reports—Admiral Shares | 10 |
| Trustees’ Fees and Expenses | 15 |
| Total Expenses | 21,916 |
| Expenses Paid Indirectly | (45) |
| Net Expenses | 21,871 |
| Net Investment Income | 113,603 |
| Realized Net Gain (Loss) | |
| Investment Securities Sold2 | 327,398 |
| Futures Contracts | 15,786 |
| Foreign Currencies and Forward Currency Contracts | (195) |
| Realized Net Gain (Loss) | 342,989 |
| Change in Unrealized Appreciation (Depreciation) | |
| Investment Securities | 136,330 |
| Futures Contracts | (6,195) |
| Foreign Currencies and Forward Currency Contracts | 624 |
| Change in Unrealized Appreciation (Depreciation) | 130,759 |
| Net Increase (Decrease) in Net Assets Resulting from Operations | 587,351 |
1 Dividends are net of foreign withholding taxes of $10,127,000.
2 Dividend income, interest income, and realized net gain (loss) from affiliated companies of the fund were $169,000, $204,000, and $25,901,000, respectively.
See accompanying Notes, which are an integral part of the Financial Statements.
17
Energy Fund
Statement of Changes in Net Assets
| Six Months Ended | Year Ended | |
| July 31, | January 31, | |
| 2011 | 2011 | |
| ($000) | ($000) | |
| Increase (Decrease) in Net Assets | ||
| Operations | ||
| Net Investment Income | 113,603 | 199,818 |
| Realized Net Gain (Loss) | 342,989 | 457,168 |
| Change in Unrealized Appreciation (Depreciation) | 130,759 | 2,204,352 |
| Net Increase (Decrease) in Net Assets Resulting from Operations | 587,351 | 2,861,338 |
| Distributions | ||
| Net Investment Income | ||
| Investor Shares | (1,784) | (90,181) |
| Admiral Shares | (2,298) | (94,977) |
| Realized Capital Gain1 | ||
| Investor Shares | (49,823) | (207,111) |
| Admiral Shares | (50,434) | (195,797) |
| Total Distributions | (104,339) | (588,066) |
| Capital Share Transactions | ||
| Investor Shares | 84,581 | (1,004,028) |
| Admiral Shares | 22,983 | 1,358,485 |
| Net Increase (Decrease) from Capital Share Transactions | 107,564 | 354,457 |
| Total Increase (Decrease) | 590,576 | 2,627,729 |
| Net Assets | ||
| Beginning of Period | 13,602,394 | 10,974,665 |
| End of Period2 | 14,192,970 | 13,602,394 |
1 Includes fiscal 2012 and 2011 short-term gain distributions totaling $22,102,000 and $62,911,000. Short-term gain distributions are treated as ordinary income dividends for tax purposes.
2 Net Assets—End of Period includes undistributed (overdistributed) net investment income of $92,815,000 and ($16,406,000).
See accompanying Notes, which are an integral part of the Financial Statements.
18
Energy Fund
Financial Highlights
Investor Shares
| Six Months | ||||||
| Ended | ||||||
| For a Share Outstanding | July 31, | Year Ended January 31, | ||||
| Throughout Each Period | 2011 | 2011 | 2010 | 2009 | 2008 | 2007 |
| Net Asset Value, Beginning of Period | $69.20 | $57.17 | $42.62 | $73.93 | $63.55 | $64.50 |
| Investment Operations | ||||||
| Net Investment Income | .502 | 1.053 | .910 | 1.2761 | 1.226 | 1.112 |
| Net Realized and Unrealized Gain (Loss) | ||||||
| on Investments | 2.509 | 14.103 | 14.591 | (28.853) | 14.639 | .405 |
| Total from Investment Operations | 3.011 | 15.156 | 15.501 | (27.577) | 15.865 | 1.517 |
| Distributions | ||||||
| Dividends from Net Investment Income | (.018) | (.977) | (.951) | (1.264) | (1.177) | (1.020) |
| Distributions from Realized Capital Gains | (.503) | (2.149) | — | (2.469) | (4.308) | (1.447) |
| Total Distributions | (.521) | (3.126) | (.951) | (3.733) | (5.485) | (2.467) |
| Net Asset Value, End of Period | $71.69 | $69.20 | $57.17 | $42.62 | $73.93 | $63.55 |
| Total Return2 | 4.34% | 27.17% | 36.28% | -38.51% | 25.02% | 2.24% |
| Ratios/Supplemental Data | ||||||
| Net Assets, End of Period (Millions) | $7,053 | $6,731 | $6,536 | $4,434 | $7,919 | $6,479 |
| Ratio of Total Expenses to | ||||||
| Average Net Assets | 0.34%3 | 0.34%3 | 0.38%3 | 0.28%3 | 0.25% | 0.25% |
| Ratio of Net Investment Income to | ||||||
| Average Net Assets | 1.57% | 1.74% | 1.73% | 1.84% | 1.67% | 1.71% |
| Portfolio Turnover Rate | 19% | 31% | 27% | 21% | 22% | 22% |
The expense ratio, net income ratio, and turnover rate for the current period have been annualized.
1 Calculated based on average shares outstanding.
2 Total returns do not include transaction or account service fees that may have applied in the periods shown. Fund prospectuses provide information about any applicable transaction and account service fees.
3 Includes performance-based investment advisory fee increases (decreases) of 0.00% for fiscal 2012, 0.00% for fiscal 2011, 0.03% for fiscal 2010, and 0.01% for fiscal 2009.
See accompanying Notes, which are an integral part of the Financial Statements.
19
Energy Fund
Financial Highlights
Admiral Shares
| Six Months | ||||||
| Ended | ||||||
| For a Share Outstanding | July 31, | Year Ended January 31, | ||||
| Throughout Each Period | 2011 | 2011 | 2010 | 2009 | 2008 | 2007 |
| Net Asset Value, Beginning of Period | $129.93 | $107.34 | $80.02 | $138.86 | $119.35 | $121.13 |
| Investment Operations | ||||||
| Net Investment Income | .981 | 2.045 | 1.780 | 2.4801 | 2.418 | 2.180 |
| Net Realized and Unrealized Gain (Loss) | ||||||
| on Investments | 4.716 | 26.479 | 27.395 | (54.203) | 27.505 | .757 |
| Total from Investment Operations | 5.697 | 28.524 | 29.175 | (51.723) | 29.923 | 2.937 |
| Distributions | ||||||
| Dividends from Net Investment Income | (.043) | (1.899) | (1.855) | (2.480) | (2.322) | (2.000) |
| Distributions from Realized Capital Gains | (.944) | (4.035) | — | (4.637) | (8.091) | (2.717) |
| Total Distributions | (.987) | (5.934) | (1.855) | (7.117) | (10.413) | (4.717) |
| Net Asset Value, End of Period | $134.64 | $129.93 | $107.34 | $80.02 | $138.86 | $119.35 |
| Total Return2 | 4.38% | 27.24% | 36.37% | -38.46% | 25.13% | 2.32% |
| Ratios/Supplemental Data | ||||||
| Net Assets, End of Period (Millions) | $7,140 | $6,871 | $4,439 | $2,889 | $5,214 | $3,612 |
| Ratio of Total Expenses to | ||||||
| Average Net Assets | 0.28%3 | 0.28%3 | 0.31%3 | 0.21%3 | 0.17% | 0.18% |
| Ratio of Net Investment Income to | ||||||
| Average Net Assets | 1.63% | 1.80% | 1.80% | 1.91% | 1.75% | 1.78% |
| Portfolio Turnover Rate | 19% | 31% | 27% | 21% | 22% | 22% |
The expense ratio, net income ratio, and turnover rate for the current period have been annualized.
1 Calculated based on average shares outstanding.
2 Total returns do not include transaction fees that may have applied in the periods shown. Fund prospectuses provide information about any applicable transaction fees.
3 Includes performance-based investment advisory fee increases (decreases) of 0.00% for fiscal 2012, 0.00% for fiscal 2011, 0.03% for fiscal 2010, and 0.01% for fiscal 2009.
See accompanying Notes, which are an integral part of the Financial Statements.
20
Energy Fund
Notes to Financial Statements
Vanguard Energy Fund is registered under the Investment Company Act of 1940 as an open-end investment company, or mutual fund. The fund invests in securities of foreign issuers, which may subject it to investment risks not normally associated with investing in securities of U.S. corporations. The fund offers two classes of shares: Investor Shares and Admiral Shares. Investor Shares are available to any investor who meets the fund’s minimum purchase requirements. Admiral Shares are designed for investors who meet certain administrative, service, and account-size criteria.
A. The following significant accounting policies conform to generally accepted accounting principles for U.S. mutual funds. The fund consistently follows such policies in preparing its financial statements.
1. Security Valuation: Securities are valued as of the close of trading on the New York Stock Exchange (generally 4 p.m., Eastern time) on the valuation date. Equity securities are valued at the latest quoted sales prices or official closing prices taken from the primary market in which each security trades; such securities not traded on the valuation date are valued at the mean of the latest quoted bid and asked prices. Securities for which market quotations are not readily available, or whose values have been affected by events occurring before the fund’s pricing time but after the close of the securities’ primary markets, are valued at their fair values calculated according to procedures adopted by the board of trustees. These procedures include obtaining quotations from an independent pricing service, monitoring news to identify significant market- or security-specific events, and evaluating changes in the values of foreign market proxies (for example, ADRs, futures contracts, or exchange-traded funds), between the time the foreign markets close and the fund’s pricing time. When fair-value pricing is employed, the prices of securities used by a fund to calculate its net asset value may differ from quoted or published prices for the same securities. Investments in Vanguard Market Liquidity Fund are valued at that fund’s net asset value. Temporary cash investments acquired over 60 days to maturity are valued using the latest bid prices or using valuations based on a matrix system (which considers such factors as security prices, yields, maturities, and ratings), both as furnished by independent pricing services. Other temporary cash investments are valued at amortized cost, which approximates market value.
2. Foreign Currency: Securities and other assets and liabilities denominated in foreign currencies are translated into U.S. dollars using exchange rates obtained from an independent third party as of the fund’s pricing time on the valuation date. Realized gains (losses) and unrealized appreciation (depreciation) on investment securities include the effects of changes in exchange rates since the securities were purchased, combined with the effects of changes in security prices. Fluctuations in the value of other assets and liabilities resulting from changes in exchange rates are recorded as unrealized foreign currency gains (losses) until the assets or liabilities are settled in cash, at which time they are recorded as realized foreign currency gains (losses).
3. Futures and Forward Currency Contracts: The fund uses index futures contracts to a limited extent, with the objective of maintaining full exposure to the stock market while maintaining liquidity. The fund may purchase or sell futures contracts to achieve a desired level of investment, whether to accommodate portfolio turnover or cash flows from capital share transactions. The primary risks associated with the use of futures contracts are imperfect correlation between changes in market values of stocks held by the fund and the prices of futures contracts, and the possibility of an illiquid market.
The fund also enters into forward currency contracts to provide the appropriate currency exposure related to any open futures contracts or to protect the value of securities and related receivables and payables against changes in foreign exchange rates. The primary risk associated with the fund’s use of these contracts is that a counterparty will fail to fulfill its obligation to pay gains due to the fund under the contracts. Counterparty risk is mitigated by entering into forward currency contracts only with highly rated counterparties, by a master netting arrangement between the fund and the counterparty,
21
Energy Fund
and by the posting of collateral by the counterparty. The forward currency contracts contain provisions whereby a counterparty may terminate open contracts if the fund’s net assets decline below a certain level, triggering a payment by the fund if the fund is in a net liability position at the time of the termination. The payment amount would be reduced by any collateral the fund has posted.
Any securities posted as collateral for open contracts are noted in the Statement of Net Assets.
Futures contracts are valued at their quoted daily settlement prices. Forward currency contracts are valued at their quoted daily prices obtained from an independent third party, adjusted for currency risk based on the expiration date of each contract. The aggregate principal amounts of the contracts are not recorded in the Statement of Net Assets. Fluctuations in the value of the contracts are recorded in the Statement of Net Assets as an asset (liability) and in the Statement of Operations as unrealized appreciation (depreciation) until the contracts are closed, when they are recorded as realized gains (losses) on futures or forward currency contracts.
4. Repurchase Agreements: The fund invests in repurchase agreements. Securities pledged as collateral for repurchase agreements are held by a custodian bank until the agreements mature. Each agreement requires that the market value of the collateral be sufficient to cover payments of interest and principal; however, in the event of default or bankruptcy by the other party to the agreement, retention of the collateral may be subject to legal proceedings.
5. Federal Income Taxes: The fund intends to continue to qualify as a regulated investment company and distribute all of its taxable income. Management has analyzed the fund’s tax positions taken for all open federal income tax years (January 31, 2008–2011), and for the period ended July 31, 2011, and has concluded that no provision for federal income tax is required in the fund’s financial statements.
6. Distributions: Distributions to shareholders are recorded on the ex-dividend date.
7. Security Lending: The fund may lend its securities to qualified institutional borrowers to earn additional income. Security loans are required to be secured at all times by collateral at least equal to the market value of securities loaned. The fund invests cash collateral received in Vanguard Market Liquidity Fund, and records a liability for the return of the collateral, during the period the securities are on loan. Security lending income represents fees charged to borrowers plus income earned on investing cash collateral, less expenses associated with the loan.
8. Other: Dividend income is recorded on the ex-dividend date. Interest income includes income distributions received from Vanguard Market Liquidity Fund and is accrued daily. Security transactions are accounted for on the date securities are bought or sold. Costs used to determine realized gains (losses) on the sale of investment securities are those of the specific securities sold. Fees assessed on redemptions of capital shares are credited to paid-in capital.
Each class of shares has equal rights as to assets and earnings, except that each class separately bears certain class-specific expenses related to maintenance of shareholder accounts (included in Management and Administrative expenses) and shareholder reporting. Marketing and distribution expenses are allocated to each class of shares based on a method approved by the board of trustees. Income, other non-class-specific expenses, and gains and losses on investments are allocated to each class of shares based on its relative net assets.
B. Wellington Management Company, LLP, provides investment advisory services to a portion of the fund for a fee calculated at an annual percentage rate of average net assets managed by the advisor.
The basic fee is subject to quarterly adjustments based on the fund’s performance for the preceding
22
Energy Fund
three years relative to a combined index composed of the S&P Citigroup BMI World Energy Index and the S&P 500 Energy Equal Weighted Blend Index through July 31, 2010, and the current benchmark, MSCI ACWI Energy Index, thereafter. The benchmark change will be fully phased in by July 2013.
The Vanguard Group provides investment advisory services to a portion of the fund on an at-cost basis; the fund paid Vanguard advisory fees of $164,000 for the six months ended July 31, 2011.
For the six months ended July 31, 2011, the aggregate investment advisory fee represented an effective annual basic rate of 0.14% of the fund’s average net assets, before an increase of $55,000 (0.00%) based on performance.
C. The Vanguard Group furnishes at cost corporate management, administrative, marketing, and distribution services. The costs of such services are allocated to the fund under methods approved by the board of trustees. The fund has committed to provide up to 0.40% of its net assets in capital contributions to Vanguard. At July 31, 2011, the fund had contributed capital of $2,235,000 to Vanguard (included in Other Assets), representing 0.02% of the fund’s net assets and 0.89% of Vanguard’s capitalization. The fund’s trustees and officers are also directors and officers of Vanguard.
D. The fund has asked its investment advisors to direct certain security trades, subject to obtaining the best price and execution, to brokers who have agreed to rebate to the fund part of the commissions generated. Such rebates are used solely to reduce the fund’s management and administrative expenses. For the six months ended July 31, 2011, these arrangements reduced the fund’s expenses by $45,000 (an annual rate of 0.00% of average net assets).
E. Various inputs may be used to determine the value of the fund’s investments. These inputs are summarized in three broad levels for financial statement purposes. The inputs or methodologies used to value securities are not necessarily an indication of the risk associated with investing in those securities.
Level 1—Quoted prices in active markets for identical securities.
Level 2—Other significant observable inputs (including quoted prices for similar securities, interest rates, prepayment speeds, credit risk, etc.).
Level 3—Significant unobservable inputs (including the fund’s own assumptions used to determine the fair value of investments).
The following table summarizes the fund’s investments as of July 31, 2011, based on the inputs used to value them:
| Level 1 | Level 2 | Level 3 | |
| Investments | ($000) | ($000) | ($000) |
| Common Stocks—United States | 8,474,535 | — | — |
| Common Stocks—International | 3,711,465 | 1,663,757 | — |
| Temporary Cash Investments | 41,446 | 310,697 | — |
| Futures Contracts—Liabilities1 | (1,108) | — | — |
| Forward Currency Contracts—Assets | — | 987 | — |
| Forward Currency Contracts—Liabilities | — | (410) | — |
| Total | 12,226,338 | 1,975,031 | — |
| 1 Represents variation margin on the last day of the reporting period. | |||
23
Energy Fund
F. At July 31, 2011, the fair values of derivatives were reflected in the Statement of Net Assets as follows:
| Foreign | |||
| Equity | Exchange | ||
| Contracts | Contracts | Total | |
| Statement of Net Assets Caption | ($000) | ($000) | ($000) |
| Other Assets | — | 987 | 987 |
| Liabilities1 | (1,108) | (410) | (1,518) |
| 1 Represents variation margin on the last day of the reporting period. | |||
Realized net gain (loss) and the change in unrealized appreciation (depreciation) on derivatives for the six months ended July 31, 2011, were:
| Foreign | |||
| Equity | Exchange | ||
| Contracts | Contracts | Total | |
| Realized Net Gain (Loss) on Derivatives | ($000) | ($000) | ($000) |
| Futures Contracts | 15,786 | — | 15,786 |
| Forward Currency Contracts | — | — | — |
| Realized Net Gain (Loss) on Derivatives | 15,786 | — | 15,786 |
| Change in Unrealized Appreciation (Depreciation) on Derivatives | |||
| Futures Contracts | (6,195) | — | (6,195) |
| Forward Currency Contracts | — | 577 | 577 |
| Change in Unrealized Appreciation (Depreciation) on Derivatives | (6,195) | 577 | (5,618) |
At July 31, 2011, the aggregate settlement value of open futures contracts and the related unrealized appreciation (depreciation) were:
| ($000) | ||||
| Aggregate | ||||
| Number of | Settlement | Unrealized | ||
| Long (Short) | Value | Appreciation | ||
| Futures Contracts | Expiration | Contracts | Long (Short) | (Depreciation) |
| E-mini S&P 500 Index | September 2011 | 2,059 | 132,640 | (1,264) |
| S&P 500 Index | September 2011 | 116 | 37,364 | 186 |
Unrealized appreciation (depreciation) on open futures contracts is required to be treated as realized gain (loss) for tax purposes.
24
Energy Fund
At July 31, 2011, the fund had open forward currency contracts to receive and deliver currencies as follows. Unrealized appreciation (depreciation) on open forward currency contracts is treated as realized gain (loss) for tax purposes.
| Unrealized | ||||||
| Contract | Appreciation | |||||
| Settlement | Contract Amount (000) | (Depreciation) | ||||
| Counterparty | Date | Receive | Deliver | ($000) | ||
| Bank of America NA | 9/16/11 | JPY | 1,308,379 | USD | 16,960 | 987 |
| Deutsche Bank AG | 9/16/11 | USD | 16,960 | JPY | 1,308,379 | (410) |
| JPY—Japanese yen. | ||||||
| USD—U.S. dollar. | ||||||
G. Distributions are determined on a tax basis and may differ from net investment income and realized capital gains for financial reporting purposes. Differences may be permanent or temporary. Permanent differences are reclassified among capital accounts in the financial statements to reflect their tax character. Temporary differences arise when certain items of income, expense, gain, or loss are recognized in different periods for financial statement and tax purposes; these differences will reverse at some time in the future. Differences in classification may also result from the treatment of short-term gains as ordinary income for tax purposes. The fund’s tax-basis capital gains and losses are determined only at the end of each fiscal year.
During the six months ended July 31, 2011, the fund realized net foreign currency losses of $195,000, which decreased distributable net income for tax purposes; accordingly, such losses have been reclassified from accumulated net realized gains to undistributed net investment income.
The fund realized gains on the sale of securities that were subject to capital gains tax in certain foreign countries. Capital gains taxes reduced realized gains for financial statement purposes but are treated as an expense for tax purposes. Accordingly, $105,000 of capital gains tax has been reclassified from accumulated net realized gains to undistributed net investment income.
At July 31, 2011, the cost of investment securities for tax purposes was $8,584,587,000. Net unrealized appreciation of investment securities for tax purposes was $5,617,313,000, consisting of unrealized gains of $5,699,422,000 on securities that had risen in value since their purchase and $82,109,000 in unrealized losses on securities that had fallen in value since their purchase.
H. During the six months ended July 31, 2011, the fund purchased $1,835,597,000 of investment securities and sold $1,340,344,000 of investment securities, other than temporary cash investments.
25
Energy Fund
I. Capital share transactions for each class of shares were:
| Six Months Ended | Year Ended | |||
| July 31, 2011 | January 31, 2011 | |||
| Amount | Shares | Amount | Shares | |
| ($000) | (000) | ($000) | (000) | |
| Investor Shares | ||||
| Issued | 752,324 | 10,514 | 993,363 | 16,506 |
| Issued in Lieu of Cash Distributions | 49,860 | 688 | 286,379 | 4,616 |
| Redeemed1 | (717,603) | (10,094) | (2,283,770) | (38,167) |
| Net Increase (Decrease)—Investor Shares | 84,581 | 1,108 | (1,004,028) | (17,045) |
| Admiral Shares | ||||
| Issued | 637,387 | 4,729 | 1,900,020 | 16,578 |
| Issued in Lieu of Cash Distributions | 48,506 | 356 | 261,084 | 2,235 |
| Redeemed1 | (662,910) | (4,934) | (802,619) | (7,281) |
| Net Increase (Decrease)—Admiral Shares | 22,983 | 151 | 1,358,485 | 11,532 |
| 1 Net of redemption fees for fiscal 2012 and 2011 of $1,035,000 and $2,317,000, respectively (fund totals). | ||||
J. The fund invested in a company that was considered to be an affiliated company of the fund because the fund owned more than 5% of the outstanding voting securities of the company. Transactions during the period in securities of this company were as follows:
| Current Period Transactions | |||||
| Jan. 31, 2011 | Proceeds from | July 31, 2011 | |||
| Market | Purchases | Securities | Dividend | Market | |
| Value | at Cost | Sold | Income | Value | |
| ($000) | ($000) | ($000) | ($000) | ($000) | |
| Cabot Oil & Gas Corp. | 266,816 | 4,965 | 100,718 | 169 | NA1 |
| 1 Not applicable—At July 31, 2011, the security was still held, but the issuer was no longer an affiliated company of the fund. | |||||
K. In preparing the financial statements as of July 31, 2011, management considered the impact of subsequent events for potential recognition or disclosure in these financial statements.
26
About Your Fund’s Expenses
As a shareholder of the fund, you incur ongoing costs, which include costs for portfolio management, administrative services, and shareholder reports (like this one), among others. Operating expenses, which are deducted from a fund’s gross income, directly reduce the investment return of the fund.
A fund’s expenses are expressed as a percentage of its average net assets. This figure is known as the expense ratio. The following examples are intended to help you understand the ongoing costs (in dollars) of investing in your fund and to compare these costs with those of other mutual funds. The examples are based on an investment of $1,000 made at the beginning of the period shown and held for the entire period.
The accompanying table illustrates your fund’s costs in two ways:
• Based on actual fund return. This section helps you to estimate the actual expenses that you paid over the period. The ”Ending Account Value“ shown is derived from the fund‘s actual return, and the third column shows the dollar amount that would have been paid by an investor who started with $1,000 in the fund. You may use the information here, together with the amount you invested, to estimate the expenses that you paid over the period.
To do so, simply divide your account value by $1,000 (for example, an $8,600 account value divided by $1,000 = 8.6), then multiply the result by the number given for your fund under the heading ”Expenses Paid During Period.“
• Based on hypothetical 5% yearly return. This section is intended to help you compare your fund‘s costs with those of other mutual funds. It assumes that the fund had a yearly return of 5% before expenses, but that the expense ratio is unchanged. In this case—because the return used is not the fund’s actual return—the results do not apply to your investment. The example is useful in making comparisons because the Securities and Exchange Commission requires all mutual funds to calculate expenses based on a 5% return. You can assess your fund’s costs by comparing this hypothetical example with the hypothetical examples that appear in shareholder reports of other funds.
Note that the expenses shown in the table are meant to highlight and help you compare ongoing costs only and do not reflect transaction costs incurred by the fund for buying and selling securities. Further, the expenses do not include any purchase, redemption, or account service fees described in the fund prospectus. If such fees were applied to your account, your costs would be higher. Your fund does not carry a “sales load.”
The calculations assume no shares were bought or sold during the period. Your actual costs may have been higher or lower, depending on the amount of your investment and the timing of any purchases or redemptions.
You can find more information about the fund’s expenses, including annual expense ratios, in the Financial Statements section of this report. For additional information on operating expenses and other shareholder costs, please refer to your fund’s current prospectus.
27
| Six Months Ended July 31, 2011 | |||
| Beginning | Ending | Expenses | |
| Account Value | Account Value | Paid During | |
| Energy Fund | 1/31/2011 | 7/31/2011 | Period |
| Based on Actual Fund Return | |||
| Investor Shares | $1,000.00 | $1,043.43 | $1.72 |
| Admiral Shares | 1,000.00 | 1,043.76 | 1.42 |
| Based on Hypothetical 5% Yearly Return | |||
| Investor Shares | $1,000.00 | $1,023.11 | $1.71 |
| Admiral Shares | 1,000.00 | 1,023.41 | 1.40 |
The calculations are based on expenses incurred in the most recent six-month period. The fund’s annualized six-month expense ratios for that period are 0.34% for Investor Shares and 0.28% for Admiral Shares. The dollar amounts shown as “Expenses Paid” are equal to the annualized expense ratio multiplied by the average account value over the period, multiplied by the number of days in the most recent six-month period, then divided by the number of days in the most recent 12-month period.
28
Trustees Approve Advisory Arrangements
The board of trustees of Vanguard Energy Fund has renewed the fund’s investment advisory arrangements with The Vanguard Group, Inc., through its Quantitative Equity Group, and Wellington Management Company, LLP. The board determined that the retention of the fund’s advisors was in the best interests of the fund and its shareholders.
The board based its decision upon an evaluation of each advisor’s investment staff, portfolio management process, and performance. The trustees considered the factors discussed below, among others. However, no single factor determined whether the board approved the arrangements. Rather, it was the totality of the circumstances that drove the board’s decision.
Nature, extent, and quality of services
The board considered the quality of the fund’s investment management over both the short and long term, and took into account the organizational depth and stability of each advisor. The board noted the following:
Wellington Management Company, LLP. Founded in 1928, Wellington Management is among the nation’s oldest and most respected institutional investment managers. The investment team uses a bottom-up approach in which stocks are selected based on the advisor’s estimates of fundamental investment value. The advisor’s investment process emphasizes company fundamentals, management track record, and security valuation. The firm has advised the fund since the fund’s inception in 1984.
The Vanguard Group, Inc. Vanguard has been managing investments for more than three decades. The Quantitative Equity Group adheres to a sound, disciplined investment management process; the team has considerable experience, stability, and depth. Vanguard has managed a portion of the fund since 2005.
The board concluded that each advisor’s experience, stability, depth, and performance, among other factors, warranted the continuation of the advisory arrangements.
Investment performance
The board considered the short- and long-term performance of the fund, including any periods of outperformance or underperformance of a relevant benchmark and peer group. The board concluded that each advisor has carried out its investment strategy in disciplined fashion, and that performance results have been in line with expectations. Information about the fund’s most recent performance can be found in the Performance Summary section of this report.
Cost
The board concluded that the fund’s expense ratio was well below the average expense ratio charged by funds in its peer group and that the fund’s advisory fee rate was also well below its peer-group average. Information about the fund’s expenses appears in the About Your Fund’s Expenses section of this report as well as in the Financial Statements section, which also includes information about the fund’s advisory fee rate.
The board did not consider profitability of Wellington Management in determining whether to approve the advisory fee, because Wellington Management is independent of Vanguard, and the advisory fee is the result of arm’s-length negotiations. The board does not conduct a profitability analysis of Vanguard, because of Vanguard’s unique “at-cost” structure. Unlike most other mutual fund management companies, Vanguard is owned by the funds it oversees, and produces “profits” only in the form of reduced expenses for fund shareholders.
29
The benefit of economies of scale
The board concluded that the fund’s shareholders benefit from economies of scale because of breakpoints in the fund’s advisory fee schedule for Wellington Management. The breakpoints reduce the effective rate of the fee as the fund’s assets managed by Wellington Management increase. The board also concluded that the fund’s low-cost arrangement with Vanguard ensures that the fund will realize economies of scale as it grows, with the cost to shareholders declining as the fund’s assets managed by Vanguard increase.
The board will consider whether to renew the advisory arrangement again after a one-year period.
30
Glossary
30-Day SEC Yield. A fund’s 30-day SEC yield is derived using a formula specified by the U.S. Securities and Exchange Commission. Under the formula, data related to the fund’s security holdings in the previous 30 days are used to calculate the fund’s hypothetical net income for that period, which is then annualized and divided by the fund’s estimated average net assets over the calculation period. For the purposes of this calculation, a security’s income is based on its current market yield to maturity (in the case of bonds), its actual income (for asset-backed securities), or its projected dividend yield (for stocks). Because the SEC yield represents hypothetical annualized income, it will differ—at times significantly—from the fund’s actual experience. As a result, the fund’s income distributions may be higher or lower than implied by the SEC yield.
Beta. A measure of the magnitude of a fund’s past share-price fluctuations in relation to the ups and downs of a given market index. The index is assigned a beta of 1.00. Compared with a given index, a fund with a beta of 1.20 typically would have seen its share price rise or fall by 12% when the index rose or fell by 10%. For this report, beta is based on returns over the past 36 months for both the fund and the index. Note that a fund’s beta should be reviewed in conjunction with its R-squared (see definition). The lower the R-squared, the less correlation there is between the fund and the index, and the less reliable beta is as an indicator of volatility.
Dividend Yield. Dividend income earned by stocks, expressed as a percentage of the aggregate market value (or of net asset value, for a fund). The yield is determined by dividing the amount of the annual dividends by the aggregate value (or net asset value) at the end of the period. For a fund, the dividend yield is based solely on stock holdings and does not include any income produced by other investments.
Earnings Growth Rate. The average annual rate of growth in earnings over the past five years for the stocks now in a fund.
Equity Exposure. A measure that reflects a fund’s investments in stocks and stock futures. Any holdings in short-term reserves are excluded.
Expense Ratio. The percentage of a fund’s average net assets used to pay its annual administrative and advisory expenses. These expenses directly reduce returns to investors.
Foreign Holdings. The percentage of a fund represented by securities or depositary receipts of companies based outside the United States.
Inception Date. The date on which the assets of a fund (or one of its share classes) are first invested in accordance with the fund’s investment objective. For funds with a subscription period, the inception date is the day after that period ends. Investment performance is measured from the inception date.
Median Market Cap. An indicator of the size of companies in which a fund invests; the midpoint of market capitalization (market price x shares outstanding) of a fund’s stocks, weighted by the proportion of the fund’s assets invested in each stock. Stocks representing half of the fund’s assets have market capitalizations above the median, and the rest are below it.
Price/Book Ratio. The share price of a stock divided by its net worth, or book value, per share. For a fund, the weighted average price/book ratio of the stocks it holds.
31
Price/Earnings Ratio. The ratio of a stock’s current price to its per-share earnings over the past year. For a fund, the weighted average P/E of the stocks it holds. P/E is an indicator of market expectations about corporate prospects; the higher the P/E, the greater the expectations for a company’s future growth.
R-Squared. A measure of how much of a fund’s past returns can be explained by the returns from the market in general, as measured by a given index. If a fund’s total returns were precisely synchronized with an index’s returns, its R-squared would be 1.00. If the fund’s returns bore no relationship to the index’s returns, its R-squared would be 0. For this report, R-squared is based on returns over the past 36 months for both the fund and the index.
Return on Equity. The annual average rate of return generated by a company during the past five years for each dollar of shareholder’s equity (net income divided by shareholder’s equity). For a fund, the weighted average return on equity for the companies whose stocks it holds.
Short-Term Reserves. The percentage of a fund invested in highly liquid, short-term securities that can be readily converted to cash.
Turnover Rate. An indication of the fund’s trading activity. Funds with high turnover rates incur higher transaction costs and may be more likely to distribute capital gains (which may be taxable to investors). The turnover rate excludes in-kind transactions, which have minimal impact on costs.
32
This page intentionally left blank.
This page intentionally left blank.
This page intentionally left blank.
The People Who Govern Your Fund
The trustees of your mutual fund are there to see that the fund is operated and managed in your best interests since, as a shareholder, you are a part owner of the fund. Your fund’s trustees also serve on the board of directors of The Vanguard Group, Inc., which is owned by the Vanguard funds and provides services to them on an at-cost basis.
A majority of Vanguard’s board members are independent, meaning that they have no affiliation with Vanguard or the funds they oversee, apart from the sizable personal investments they have made as private individuals. The independent board members have distinguished backgrounds in business, academia, and public service. Each of the trustees and executive officers oversees 178 Vanguard funds.
The following table provides information for each trustee and executive officer of the fund. More information about the trustees is in the Statement of Additional Information, which can be obtained, without charge, by contacting Vanguard at 800-662-7447, or online at vanguard.com.
| Interested Trustee1 | and President (2006–2008) of Rohm and Haas Co. |
| (chemicals); Director of Tyco International, Ltd. | |
| F. William McNabb III | (diversified manufacturing and services) and Hewlett- |
| Born 1957. Trustee Since July 2009. Chairman of the | Packard Co. (electronic computer manufacturing); |
| Board. Principal Occupation(s) During the Past Five | Senior Advisor at New Mountain Capital; Trustee |
| Years: Chairman of the Board of The Vanguard Group, | of The Conference Board; Member of the Board of |
| Inc., and of each of the investment companies served | Managers of Delphi Automotive LLP (automotive |
| by The Vanguard Group, since January 2010; Director | components). |
| of The Vanguard Group since 2008; Chief Executive | |
| Officer and President of The Vanguard Group and of | Amy Gutmann |
| each of the investment companies served by The | Born 1949. Trustee Since June 2006. Principal |
| Vanguard Group since 2008; Director of Vanguard | Occupation(s) During the Past Five Years: President |
| Marketing Corporation; Managing Director of The | of the University of Pennsylvania; Christopher H. |
| Vanguard Group (1995–2008). | Browne Distinguished Professor of Political Science |
| in the School of Arts and Sciences with secondary | |
| appointments at the Annenberg School for Commu- | |
| Independent Trustees | nication and the Graduate School of Education |
| of the University of Pennsylvania; Director of | |
| Emerson U. Fullwood | Carnegie Corporation of New York, Schuylkill River |
| Born 1948. Trustee Since January 2008. Principal | Development Corporation, and Greater Philadelphia |
| Occupation(s) During the Past Five Years: Executive | Chamber of Commerce; Trustee of the National |
| Chief Staff and Marketing Officer for North America | Constitution Center; Chair of the Presidential |
| and Corporate Vice President (retired 2008) of Xerox | Commission for the Study of Bioethical Issues. |
| Corporation (document management products and | |
| services); Executive in Residence and 2010 | JoAnn Heffernan Heisen |
| Distinguished Minett Professor at the Rochester | Born 1950. Trustee Since July 1998. Principal |
| Institute of Technology; Director of SPX Corporation | Occupation(s) During the Past Five Years: Corporate |
| (multi-industry manufacturing), the United Way of | Vice President and Chief Global Diversity Officer |
| Rochester, Amerigroup Corporation (managed health | (retired 2008) and Member of the Executive |
| care), the University of Rochester Medical Center, | Committee (1997–2008) of Johnson & Johnson |
| Monroe Community College Foundation, and North | (pharmaceuticals/consumer products); Director of |
| Carolina A&T University. | Skytop Lodge Corporation (hotels), the University |
| Medical Center at Princeton, the Robert Wood | |
| Rajiv L. Gupta | Johnson Foundation, and the Center for Work Life |
| Born 1945. Trustee Since December 2001.2 | Policy; Member of the Advisory Board of the |
| Principal Occupation(s) During the Past Five Years: | Maxwell School of Citizenship and Public Affairs |
| Chairman and Chief Executive Officer (retired 2009) | at Syracuse University. |
| F. Joseph Loughrey | Thomas J. Higgins | |
| Born 1949. Trustee Since October 2009. Principal | Born 1957. Chief Financial Officer Since September | |
| Occupation(s) During the Past Five Years: President | 2008. Principal Occupation(s) During the Past Five | |
| and Chief Operating Officer (retired 2009) and Vice | Years: Principal of The Vanguard Group, Inc.; Chief | |
| Chairman of the Board (2008–2009) of Cummins Inc. | Financial Officer of each of the investment companies | |
| (industrial machinery); Director of SKF AB (industrial | served by The Vanguard Group since 2008; Treasurer | |
| machinery), Hillenbrand, Inc. (specialized consumer | of each of the investment companies served by The | |
| services), the Lumina Foundation for Education, and | Vanguard Group (1998–2008). | |
| Oxfam America; Chairman of the Advisory Council | ||
| for the College of Arts and Letters and Member | Kathryn J. Hyatt | |
| of the Advisory Board to the Kellogg Institute for | Born 1955. Treasurer Since November 2008. Principal | |
| International Studies at the University of Notre Dame. | Occupation(s) During the Past Five Years: Principal | |
| of The Vanguard Group, Inc.; Treasurer of each of | ||
| André F. Perold | the investment companies served by The Vanguard | |
| Born 1952. Trustee Since December 2004. Principal | Group since 2008; Assistant Treasurer of each of the | |
| Occupation(s) During the Past Five Years: George | investment companies served by The Vanguard Group | |
| Gund Professor of Finance and Banking at the Harvard | (1988–2008). | |
| Business School (retired July 2011); Chief Investment | ||
| Officer and co-Managing Partner of HighVista | Heidi Stam | |
| Strategies LLC (private investment firm); Director of | Born 1956. Secretary Since July 2005. Principal | |
| Rand Merchant Bank; Overseer of the Museum of | Occupation(s) During the Past Five Years: Managing | |
| Fine Arts Boston. | Director of The Vanguard Group, Inc., since 2006; | |
| General Counsel of The Vanguard Group since 2005; | ||
| Alfred M. Rankin, Jr. | Secretary of The Vanguard Group and of each of the | |
| Born 1941. Trustee Since January 1993. Principal | investment companies served by The Vanguard Group | |
| Occupation(s) During the Past Five Years: Chairman, | since 2005; Director and Senior Vice President of | |
| President, and Chief Executive Officer of NACCO | Vanguard Marketing Corporation since 2005; | |
| Industries, Inc. (forklift trucks/housewares/lignite); | Principal of The Vanguard Group (1997–2006). | |
| Director of Goodrich Corporation (industrial products/ | ||
| aircraft systems and services) and the National | ||
| Association of Manufacturers; Chairman of the | Vanguard Senior Management Team | |
| Federal Reserve Bank of Cleveland; Vice Chairman | ||
| of University Hospitals of Cleveland; President of | R. Gregory Barton | Michael S. Miller |
| the Board of The Cleveland Museum of Art. | Mortimer J. Buckley | James M. Norris |
| Kathleen C. Gubanich | Glenn W. Reed | |
| Peter F. Volanakis | Paul A. Heller | George U. Sauter |
| Born 1955. Trustee Since July 2009. Principal | Martha G. King | |
| Occupation(s) During the Past Five Years: President | ||
| and Chief Operating Officer (retired 2010) of Corning | ||
| Incorporated (communications equipment); Director of | Chairman Emeritus and Senior Advisor | |
| Corning Incorporated (2000–2010) and Dow Corning | ||
| (2001–2010); Overseer of the Amos Tuck School of | John J. Brennan | |
| Business Administration at Dartmouth College. | Chairman, 1996–2009 | |
| Chief Executive Officer and President, 1996–2008 | ||
| Executive Officers | ||
| Founder | ||
| Glenn Booraem | ||
| Born 1967. Controller Since July 2010. Principal | John C. Bogle | |
| Occupation(s) During the Past Five Years: Principal | Chairman and Chief Executive Officer, 1974–1996 | |
| of The Vanguard Group, Inc.; Controller of each of | ||
| the investment companies served by The Vanguard | ||
| Group since 2010; Assistant Controller of each of | ||
| the investment companies served by The Vanguard | ||
| Group (2001–2010). | ||
1 Mr. McNabb is considered an “interested person,” as defined in the Investment Company Act of 1940, because he is an officer of the Vanguard funds.
2 December 2002 for Vanguard Equity Income Fund, Vanguard Growth Equity Fund, the Vanguard Municipal Bond Funds, and the Vanguard State Tax-Exempt Funds.
 | |
| P.O. Box 2600 | |
| Valley Forge, PA 19482-2600 |
Connect with Vanguard® > vanguard.com
| Fund Information > 800-662-7447 | CFA® is a trademark owned by CFA Institute. |
| Direct Investor Account Services > 800-662-2739 | |
| Institutional Investor Services > 800-523-1036 | |
| Text Telephone for People | |
| With Hearing Impairment > 800-749-7273 | |
| This material may be used in conjunction | |
| with the offering of shares of any Vanguard | |
| fund only if preceded or accompanied by | |
| the fund’s current prospectus. | |
| All comparative mutual fund data are from Lipper Inc. or | |
| Morningstar, Inc., unless otherwise noted. | |
| You can obtain a free copy of Vanguard’s proxy voting | |
| guidelines by visiting vanguard.com/proxyreporting or by | |
| calling Vanguard at 800-662-2739. The guidelines are | |
| also available from the SEC’s website, sec.gov. In | |
| addition, you may obtain a free report on how your fund | |
| voted the proxies for securities it owned during the 12 | |
| months ended June 30. To get the report, visit either | |
| vanguard.com/proxyreporting or sec.gov. | |
| You can review and copy information about your fund at | |
| the SEC’s Public Reference Room in Washington, D.C. To | |
| find out more about this public service, call the SEC at | |
| 202-551-8090. Information about your fund is also | |
| available on the SEC’s website, and you can receive | |
| copies of this information, for a fee, by sending a | |
| request in either of two ways: via e-mail addressed to | |
| publicinfo@sec.gov or via regular mail addressed to the | |
| Public Reference Section, Securities and Exchange | |
| Commission, Washington, DC 20549-1520. | |
| © 2011 The Vanguard Group, Inc. | |
| All rights reserved. | |
| Vanguard Marketing Corporation, Distributor. | |
| Q512 092011 | |
| Vanguard Precious Metals |
| and Mining Fund Semiannual Report |
| July 31, 2011 |
 |
> For the six months ended July 31, 2011, Vanguard Precious Metals and Mining Fund returned 8.88%.
> The fund outperformed its benchmark index but slightly trailed the average return of its peer funds.
> Diversified metals and mining firms and gold companies contributed the most to the fund’s return for the period.
| Contents | |
| Your Fund’s Total Returns. | 1 |
| Chairman’s Letter. | 2 |
| Advisor’s Report. | 6 |
| Fund Profile. | 9 |
| Performance Summary. | 10 |
| Financial Statements. | 11 |
| About Your Fund’s Expenses. | 20 |
| Trustees Approve Advisory Agreement. | 22 |
| Glossary. | 23 |
Please note: The opinions expressed in this report are just that—informed opinions. They should not be considered promises or advice.
Also, please keep in mind that the information and opinions cover the period through the date on the front of this report. Of course, the risks of investing in your fund are spelled out in the prospectus.
See the Glossary for definitions of investment terms used in this report.
Cover photograph: Jean Maher.
Your Fund’s Total Returns
Six Months Ended July 31, 2011
| Total | |
| Returns | |
| Vanguard Precious Metals and Mining Fund | 8.88% |
| S&P Custom Precious Metals and Mining Index | 3.76 |
| Precious Metal Funds Average | 9.63 |
| Precious Metal Funds Average: Derived from data provided by Lipper Inc. | |
Your Fund’s Performance at a Glance
January 31, 2011 , Through July 31, 2011
| Distributions Per Share | ||||
| Starting | Ending | Income | Capital | |
| Share Price | Share Price | Dividends | Gains | |
| Vanguard Precious Metals and Mining Fund | $24.15 | $26.24 | $0.053 | $0.000 |
1

Chairman’s Letter
Dear Shareholder,
A sharp rise in prices for precious metals, including gold and silver, early this year helped propel the returns of metals and mining companies above those of the broad U.S. and international stock markets. Vanguard Precious Metals and Mining Fund returned 8.88% for the six months ended July 31. Although the fund’s return was more than double that of its benchmark index, it slightly lagged the average return of peer funds.
The Precious Metals and Mining Fund’s significant exposure to diversified metals and mining stocks and gold stocks contributed the most to its performance during the period.
I want to note that on May 11, we lowered the minimum required investment for several Vanguard funds, including the Precious Metals and Mining Fund, to $3,000. This was part of our ongoing effort to increase the accessibility of our funds.
Stocks worldwide crept higher in a treacherous marketplace
Global stock markets struggled to find direction during the past six months, as every positive signal seemed to be paired with its negative. The good news included surprisingly strong corporate profits, which proved to be a source of investor optimism through much of the period.
The counterpoint was a series of increasingly glum economic reports. Expectations that the U.S. economic expansion would accelerate in the second half of the year gave way to anxiety about the possibility of
2
recession. The Dow Jones U.S. Total Stock Market Index finished the period with a return of 1.55%. Across the globe, stock returns were similarly modest.
Bonds rallied in the U.S. market as investors sought safety
Bond prices climbed amid the turbulence. Investors sought refuge from a collection of troubles: Europe’s debt dramas, economic shocks produced by the Japanese tsunami and its aftermath, and prolonged debate over raising the U.S. debt ceiling. For the full six months, the broad U.S. taxable bond market returned more than 4%. (Rising prices are a mixed blessing, of course; they imply lower yields on future investment.)
The yields on money market instruments such as Treasury bills remained near 0%, consistent with the Federal Reserve Board’s target for short-term interest rates.
The U.S. credit downgrade: A cause for concern, not panic
On August 5, after the close of our reporting period, Standard & Poor’s downgraded its credit rating of U.S. debt from AAA to AA+. S&P said its action was prompted, in large part, by concern about “the effectiveness, stability, and predictability of American policymaking and political institutions”— in other words, the political gridlock on vivid display during the debt-ceiling debate.
| Market Barometer | |||
| Total Returns | |||
| Periods Ended July 31, 2011 | |||
| Six | One | Five Years | |
| Months | Year | (Annualized) | |
| Stocks | |||
| Russell 1000 Index (Large-caps) | 1.62% | 20.68% | 2.80% |
| Russell 2000 Index (Small-caps) | 2.63 | 23.92 | 4.00 |
| Dow Jones U.S. Total Stock Market Index | 1.55 | 20.83 | 3.27 |
| MSCI All Country World Index ex USA (International) | 1.39 | 17.36 | 3.18 |
| Bonds | |||
| Barclays Capital U.S. Aggregate Bond Index (Broad | |||
| taxable market) | 4.23% | 4.44% | 6.57% |
| Barclays Capital Municipal Bond Index (Broad | |||
| tax-exempt market) | 6.27 | 3.24 | 4.90 |
| Citigroup Three-Month U.S. Treasury Bill Index | 0.05 | 0.13 | 1.78 |
| CPI | |||
| Consumer Price Index | 2.59% | 3.63% | 2.11% |
3
The downgrade was controversial, and the other major rating agencies reaffirmed their decision to continue giving the highest ratings to U.S. debt. At Vanguard, our credit analysts and economists regularly assess the financial strength of the United States and other sovereign borrowers. Our confidence in the “full faith and credit” of the U.S. government remains unshaken, and we have cautioned investors against overreacting to the S&P downgrade.
A few stocks drove much of the fund’s performance
The Precious Metals and Mining Fund’s advisor, M&G Investment Management Limited, aims to invest in companies that boast financial strength, high-quality assets, and sound leadership. The fund has a relatively small portfolio—about 50 stocks, compared with about 300 in its benchmark index. A large proportion of the fund’s assets are concentrated in a few holdings that the advisor believes have strong potential for long-term capital appreciation.
While the fund’s results are subject to fluctuations in commodity prices, its advisor tries to look past short-term swings when making portfolio decisions. During the period, for example, the advisor maintained a sizable commitment to a company that mines mineral sands, used in industrial applications, at a time when gold and silver prices were attracting all the attention. Iluka Resources (+132%), an Australian mineral sands producer, represented about 10% of the fund’s
Expense Ratios
Your Fund Compared With Its Peer Group
| Peer Group | ||
| Fund | Average | |
| Precious Metals and Mining Fund | 0.27% | 1.37% |
The fund expense ratio shown is from the prospectus dated May 26, 2011, and represents estimated costs for the current fiscal year. For the six months ended July 31, 2011, the fund’s annualized expense ratio was 0.27%. The peer-group expense ratio is derived from data provided by Lipper Inc. and captures information through year-end 2010.
Peer group: Precious Metal Funds.
4
assets, on average, during the period, and accounted for the lion’s share of the six-month return.
Not surprisingly, gold-related companies also played a key role in the fund’s strong performance. Producers of the yellow metal represented just under 40% of the fund’s assets, on average, during the period, and accounted for almost a third of its return. Gold prices, which have been approaching record levels, soared 22% during the six months as investors sought ways to guard against inflation and uncertainties in the global economy.
Other precious metals and minerals companies, a group that includes firms involved in the mining of silver, diamonds, and other metals, contributed less than 1 percentage point to the fund’s return. Silver prices (+42%) leapt higher than those of most other metals during the period (and experienced the most volatility); however, the fund’s silver-related holdings had limited impact on its overall return.
Weakness in base metal prices, including nickel (–9%), held back the fund’s return. Fear that a faltering global economy would cut demand for industrial metals hurt prices.
Stick to your long-term plan regardless of market conditions
In times of extreme market volatility, investing in precious metal and mining stocks is a bit like riding a roller coaster. Long-term investors in this fund know that the market’s swings can be sudden and dramatic. And, as all experienced investors have learned, we must expect the unexpected.
That means putting good news and bad news in perspective. What we can and should do is clearly define our long-term goals and develop a portfolio that includes stocks, bonds, and money market mutual funds and is consistent with our risk tolerance. This balanced approach has demonstrated its wisdom over decades.
Vanguard Precious Metals and Mining Fund, with its wide exposure to metals and mining companies around the world, can play a supporting role in such a well-balanced portfolio. Although the fund’s narrow focus can expose it to notable volatility, it can help diversify a portfolio of stock and bond funds by providing exposure to commodities that can behave differently from other parts of the market.
Before closing, I want to recognize M&G Investment Management’s Graham French, who is now in his 15th year as portfolio manager of the Precious Metals and Mining Fund. Mr. French and his entire team have earned our thanks for their distinguished service to Vanguard shareholders over a decade and a half at the helm.
As always, I thank you for continuing to entrust your assets to Vanguard.
Sincerely,

F. William McNabb III
Chairman and Chief Executive Officer
August 10, 2011
5
Advisor’s Report
Vanguard Precious Metals and Mining Fund produced a healthy return of 8.88% for the six months ended July 31, 2011. The fund ended ahead of its customized benchmark index but behind the average return of its peer funds.
Markets were unsettled during the period. Despite exogenous shocks such as uprisings in the Middle East and the tsunami in Japan, equity markets remained remarkably resilient for a time, reaching their highest levels since the 2008 financial crisis by late April. But they gave back much of the gain as the period progressed.
As systemic issues reemerged in the second half of the reporting period, risk-aversion returned as well. Sovereign-debt issues in peripheral Eurozone nations and, perhaps more alarmingly, the inability of U.S. legislators to agree on a new borrowing level and debt-reduction strategy knocked investor sentiment. Cash left equities for bond funds, and the gold price once again soared, rising by $300 per ounce to $1,627. Silver, also a beneficiary of fear, outperformed gold over the period, climbing by more than 40% to finish at $40 per ounce after declining somewhat from historic highs.
The rising gold bullion price was supported further by disappointing U.S. gross domestic product (GDP) growth figures that pointed toward a weaker economic outlook in “Western” economies. Non-precious metals and minerals, such as copper and iron ore, experienced greater price volatility, but ended the period broadly flat.
The main contribution to the fund’s performance came from Australian mineral sands producer Iluka Resources. Pricing power owing to the scarcity of zircon, ilmenite, and rutile has afforded Iluka, the largest of three global pure-play producers, relative immunity to the market contagion that has been affecting most mining companies.
Gold producers also have a built-in ability to repel such negative sentiment. As their revenues are inextricably linked to the price of gold, their profit margins can expand as the price rises. Once again Canada-based Centerra Gold performed strongly for the fund, thanks to increased output levels, a reduction in unit costs of production, and the high gold price. Moreover, budget allocated to exploratory projects is bearing fruit, as the company has announced a significant precious- and base-metal discovery in northeast Mongolia.
In February, Anatolia Minerals bought out Avoca Resources, forming gold producer Alacer Gold, with operations in both Turkey and Australia. This stock also helped the fund’s performance, thanks not only to the increase in operating margins but also to successful exploration that buoyed the company’s future commercial prospects.
Aquila Resources, an Australian coal and iron ore producer, and Eramet, the French manganese and nickel miner, were the two largest detractors from performance. Since November, Aquila has been engaged in a dispute with Brazilian mining company Vale over the shared Isaac Plains coal mine. The disagreement is affecting
6
production and thereby revenues. We retain high confidence in Aquila based on its valuable coal and iron ore assets, as both commodities continue to see strong demand. In the case of Eramet, falling commodity prices and concerns about the demand outlook for steel have adversely affected performance.
During the six months we continued to increase the fund’s exposure to several of its gold-related holdings. We added to our positions in Canadian-listed Minefinders, which operates the highly valuable, multimillion-ounce Dolores mine in Mexico, and in the gold exploration and production companies Medusa Mining, Eldorado Gold, and Centerra Gold. We opened a new position in Canadian-based gold miner NovaGold, quickly building it into a meaningful holding, and doubled our position in Alacer Gold.
The gold ETF market has made exposure to gold bullion more accessible for investors, forcing gold producers to compete for capital. A culture of capital discipline and thoughtful project appraisal is emerging, with companies initiating dividends, differentiating themselves, and rewarding investors. In a standout management decision for the industry, U.S.-listed Newmont Mining introduced a progressive policy linking its dividend to the gold price.
Although we have reduced the fund’s platinum holdings significantly in recent months, we continue to recognize the value of platinum and have sought to gain indirect access to the metal. We have been building a position in Umicore, which gives the fund exposure to the growing economic demand for platinum. Umicore is a producer and recycler of autocatalysts (minerals essential for vehicle production) in a market that is dominated by a few firms and is characterized by the capital-intensive process and high-quality product produced. Umicore recycles not only autocatalysts but also 19 metals, using hard-to-replicate technology. Moreover, the company has great capital discipline.
In contrast, we significantly reduced our position in Sherritt International, a Canadian-listed nickel and coal producer. Compared to less-substitutable base metals and minerals such as copper and zircon, nickel has weaker demand/supply dynamics and is therefore less resilient in the face of an economic slowdown. This has been reflected in the metal’s recent price decline. As production costs rise and the price of nickel continues to fall, Sherritt’s margins look set to be under pressure in the near term.
We trimmed our holdings in the Peruvian gold exploration company Cia de Minas Buenaventura and sold out of Australian metal recycler Sims Metal Management. Energy prices, a substantial input cost in the recycling process, remain high, reducing operating profits and affecting Sims Metal’s prospects for future growth. As part of our reduction in exposure to platinum miners, we sold most of our shares in South African Northam Platinum, and U.K.-listed Lonmin has been almost entirely removed from the portfolio. Production problems continue at Lonmin, and given rising energy prices, industrywide
7
labor issues, and a strengthening currency, the medium-term outlook for the company is challenged.
In a period of heightened uncertainty and the knock-on impact that this has on cyclical stocks, it is important to keep the fund’s core philosophy in mind. We retain our long-held conviction regarding the dependence of developing countries on accessing commodities for urbanization and industrialization. As always, we are intent on monitoring existing companies and discovering new enterprises with sound management reflected in their strong company fundamentals, cash-generative projects, and creation of long-term value for investors. Sections of the market that can benefit from both demand/supply imbalances and the unrelenting structural shift in economic power from “West” to “East” continue to be our focus as we look to unearth the most compelling investment opportunities for the fund.
Portfolio Managers:
Graham E. French
Matthew Vaight, UKSIP
M&G Investment Management Ltd.
August 10, 2011
8
Precious Metals and Mining Fund
Fund Profile
As of July 31, 2011
| Portfolio Characteristics | |||
| S&P | |||
| Precious | DJ | ||
| Metals and | U.S. Total | ||
| Mining | Market | ||
| Fund | Index | Index | |
| Number of Stocks | 51 | 331 | 3,753 |
| Median Market Cap | $4.6B | $27.4B | $31.4B |
| Price/Earnings Ratio | 26.8x | 15.9x | 16.3x |
| Price/Book Ratio | 2.8x | 2.3x | 2.2x |
| Return on Equity | 5.1% | 16.2% | 19.0% |
| Earnings Growth Rate | 5.2% | 4.6% | 6.3% |
| Dividend Yield | 1.2% | 1.3% | 1.8% |
| Foreign Holdings | 90.2% | 89.5% | 0.0% |
| Turnover Rate | |||
| (Annualized) | 30% | — | — |
| Ticker Symbol | VGPMX | — | — |
| Expense Ratio1 | 0.27% | — | — |
| Short-Term Reserves | 2.2% | — | — |
| Market Diversification (% of equity exposure) | |||
| Europe | |||
| United Kingdom | 8.6% | ||
| France | 8.2 | ||
| Germany | 4.9 | ||
| Belgium | 1.4 | ||
| Other | 0.2 | ||
| Subtotal | 23.3% | ||
| Pacific | |||
| Australia | 29.8% | ||
| Singapore | 3.8 | ||
| Subtotal | 33.6% | ||
| Emerging Markets | |||
| Other | 1.0% | ||
| North America | |||
| Canada | 33.8% | ||
| United States | 8.3 | ||
| Subtotal | 42.1% | ||
| Volatility Measures | ||
| S&P | ||
| Precious | DJ | |
| Metals and | U.S. Total | |
| Mining | Market | |
| Index | Index | |
| R-Squared | 0.92 | 0.71 |
| Beta | 1.04 | 1.58 |
| These measures show the degree and timing of the fund’s fluctuations compared with the indexes over 36 months. | ||
| Ten Largest Holdings (% of total net assets) | ||
| lluka Resources Ltd. | Diversified Metals | |
| & Mining | 9.4% | |
| Centerra Gold Inc. | Gold | 7.1 |
| Newmont Mining Corp. | Gold | 6.3 |
| Hochschild Mining plc | Precious Metals & | |
| Minerals | 6.1 | |
| OZ Minerals Ltd. | Diversified Metals | |
| & Mining | 4.9 | |
| Eldorado Gold Corp. | Gold | 4.8 |
| K+S AG | Fertilizers & | |
| Agricultural | ||
| Chemicals | 4.8 | |
| Imerys SA | Construction | |
| Materials | 4.8 | |
| Alacer Gold Corp. | Gold | 4.3 |
| Nevsun Resources Ltd. | Gold | 4.2 |
| Top Ten | 56.7% | |
| The holdings listed exclude any temporary cash investments and equity index products. | ||
Allocation by Region (% of equity exposure)
1 The expense ratio shown is from the prospectus dated May 26, 2011, and represents estimated costs for the current fiscal year. For the six months ended July 31, 2011, the annualized expense ratio was 0.27%.
9
Precious Metals and Mining Fund
Performance Summary
All of the returns in this report represent past performance, which is not a guarantee of future results that may be achieved by the fund. (Current performance may be lower or higher than the performance data cited. For performance data current to the most recent month-end, visit our website at vanguard.com/performance.) Note, too, that both investment returns and principal value can fluctuate widely, so an investor’s shares, when sold, could be worth more or less than their original cost. The returns shown do not reflect taxes that a shareholder would pay on fund distributions or on the sale of fund shares.
Fiscal-Year Total Returns (%): January 31, 2001, Through July 31, 2011
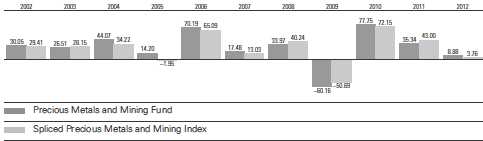
Note: For 2012, performance data reflect the six months ended July 31, 2011.
Average Annual Total Returns: Periods Ended June 30, 2011
This table presents returns through the latest calendar quarter—rather than through the end of the fiscal period.
Securities and Exchange Commission rules require that we provide this information.
| Inception | One | Five | Ten | |
| Date | Year | Years | Years | |
| Precious Metals and Mining Fund | 5/23/1984 | 41.82% | 7.90% | 20.78% |
Vanguard fund returns do not reflect the 1% fee on redemptions of shares held for less than one year.
See Financial Highlights for dividend and capital gains information.
10
Precious Metals and Mining Fund
Financial Statements (unaudited)
Statement of Net Assets
As of July 31, 2011
The fund reports a complete list of its holdings in regulatory filings four times in each fiscal year, at the quarter-ends. For the second and fourth fiscal quarters, the lists appear in the fund’s semiannual and annual reports to shareholders. For the first and third fiscal quarters, the fund files the lists with the Securities and Exchange Commission on Form N-Q. Shareholders can look up the fund’s Forms N-Q on the SEC’s website at sec.gov. Forms N-Q may also be reviewed and copied at the SEC’s Public Reference Room (see the back cover of this report for further information).
| Market | |||
| Value | |||
| Shares | ($000) | ||
| Common Stocks (98.2%) | |||
| Australia (29.3%) | |||
| 1 | Iluka Resources Ltd. | 25,359,898 | 494,386 |
| 1 | OZ Minerals Ltd. | 17,200,000 | 256,834 |
| *,1 | Aquila Resources Ltd. | 28,900,000 | 212,535 |
| 1 | Medusa Mining Ltd. | 24,000,000 | 185,973 |
| *,1 | St. Barbara Ltd. | 51,000,000 | 103,118 |
| *,1 | Resolute Mining Ltd. | 51,965,029 | 77,130 |
| *,1 | Cudeco Ltd. | 13,000,000 | 46,977 |
| 1 | Panoramic | ||
| Resources Ltd. | 19,700,000 | 38,434 | |
| * | Discovery Metals Ltd. | 14,672,690 | 23,415 |
| * | Atlas Iron Ltd. | 4,850,000 | 21,546 |
| *,1 | Equatorial | ||
| Resources Ltd. | 6,250,000 | 19,993 | |
| * | Ivanhoe Australia Ltd. | 4,000,000 | 11,220 |
| * | Galaxy Resources Ltd. | 11,363,638 | 8,503 |
| *,1 | Reed Resources Ltd. | 15,700,000 | 7,686 |
| * | Gindalbie Metals Ltd. | 8,000,000 | 6,929 |
| *,1 | Apex Minerals NL | 624,120,369 | 5,491 |
| BHP Billiton Ltd. | 100,000 | 4,573 | |
| *,1 | Speewah Metals Ltd. | 13,500,000 | 4,538 |
| *,1 | Drummond Gold Ltd. | 35,000,000 | 2,307 |
| * | Zambezi Resources Ltd. | 4,895,833 | 128 |
| * | MIL Resources Ltd. | 2,685,873 | 56 |
| 1,531,772 | |||
| Belgium (1.4%) | |||
| Umicore SA | 1,400,000 | 71,320 | |
| Canada (33.1%) | |||
| 1 | Centerra Gold Inc. | 18,950,000 | 371,483 |
| Eldorado Gold Corp. | 14,700,000 | 253,090 | |
| *,1 | Alacer Gold Corp. | 23,100,000 | 224,363 |
| 1 | Nevsun Resources Ltd. | 38,500,000 | 220,415 |
| *,^,1 | Minefinders Corp. | 11,900,000 | 173,859 |
| *,1 | Harry Winston | ||
| Diamond Corp. | 9,500,000 | 147,951 | |
| *,1 | SEMAFO Inc. | 15,700,000 | 140,165 |
| *,^ | NovaGold Resources Inc. | 11,235,914 | 112,584 |
| Market | |||
| Value | |||
| Shares | ($000) | ||
| Sherritt | |||
| International Corp. | 12,225,000 | 76,386 | |
| * | Claude Resources Inc. | 2,400,000 | 4,296 |
| * | Bear Creek Mining Corp. | 750,000 | 3,768 |
| * | Lake Shore Gold Corp. | 1,000,000 | 2,271 |
| Franco-Nevada Corp. | 50,000 | 2,091 | |
| 1,732,722 | |||
| France (8.0%) | |||
| Imerys SA | 3,650,000 | 250,619 | |
| Eramet | 610,000 | 169,740 | |
| 420,359 | |||
| Germany (4.8%) | |||
| K&S AG | 3,150,000 | 251,330 | |
| Indonesia (0.1%) | |||
| International Nickel | |||
| Indonesia Tbk PT | 12,500,000 | 6,228 | |
| Ireland (0.2%) | |||
| * | Kenmare Resources plc | 13,627,035 | 12,358 |
| Papua New Guinea (0.0%) | |||
| * | Bougainville Copper Ltd. | 2,000,000 | 2,136 |
| Peru (0.0%) | |||
| Cia de Minas | |||
| Buenaventura SA ADR | 50,000 | 2,047 | |
| Russia (0.6%) | |||
| Uralkali GDR | 650,000 | 31,807 | |
| Singapore (3.8%) | |||
| Noble Group Ltd. | 127,180,353 | 197,217 | |
| South Africa (0.3%) | |||
| Northam Platinum Ltd. | 3,000,000 | 16,632 | |
| United Kingdom (8.5%) | |||
| 1 | Hochschild Mining plc | 40,500,000 | 317,065 |
11
Precious Metals and Mining Fund
| Market | ||
| Value | ||
| Shares | ($000) | |
| Petropavlovsk plc | 8,800,000 | 114,933 |
| Lonmin plc | 400,000 | 8,294 |
| * Gemfields plc | 3,333,333 | 1,358 |
| 441,650 | ||
| United States (8.1%) | ||
| Newmont Mining Corp. | 5,900,000 | 328,099 |
| 1 AMCOL | ||
| International Corp. | 3,080,000 | 94,433 |
| 422,532 | ||
| Total Common Stocks | ||
| (Cost $3,710,833) | 5,140,110 | |
| Precious Metals (0.1%) | ||
| * Platinum Bullion | ||
| (In Troy Ounces) | 2,009 | 3,581 |
| Total Precious Metals | ||
| (Cost $1,213) | 3,581 | |
| Temporary Cash Investment (2.4%) | ||
| Money Market Fund (2.4%) | ||
| 2,3 Vanguard Market | ||
| Liquidity Fund, 0.114% | ||
| (Cost $127,405) | 127,404,874 | 127,405 |
| Total Investments (100.7%) | ||
| (Cost $3,839,451) | 5,271,096 | |
| Other Assets and Liabilities (-0.7%) | ||
| Other Assets | 54,817 | |
| Liabilities3 | (93,773) | |
| (38,956) | ||
| Net Assets (100%) | ||
| Applicable to 199,427,416 outstanding | ||
| $.001 par value shares of beneficial | ||
| interest (unlimited authorization) | 5,232,140 | |
| Net Asset Value Per Share | $26.24 | |
| Market | |
| Value | |
| ($000) | |
| Statement of Assets and Liabilities | |
| Assets | |
| Investments in Securities, at Value | 5,271,096 |
| Receivables for Investment | |
| Securities Sold | 37,109 |
| Other Assets | 17,708 |
| Total Assets | 5,325,913 |
| Liabilities | |
| Payables for Investment | |
| Securities Purchased | 56,069 |
| Other Liabilities | 37,704 |
| Total Liabilities | 93,773 |
| Net Assets | 5,232,140 |
| At July 31, 2011, net assets consisted of: | |
| Amount | |
| ($000) | |
| Paid-in Capital | 3,847,605 |
| Overdistributed Net Investment Income | (167,777) |
| Accumulated Net Realized Gains | 120,626 |
| Unrealized Appreciation (Depreciation) | |
| Investment Securities | 1,431,645 |
| Foreign Currencies | 41 |
| Net Assets | 5,232,140 |
See Note A in Notes to Financial Statements.
* Non-income-producing security.
^ Part of security position is on loan to broker-dealers. The total value of securities on loan is $8,594,000.
1 Considered an affiliated company of the fund as the fund owns more than 5% of the outstanding voting securities of such company.
2 Affiliated money market fund available only to Vanguard funds and certain trusts and accounts managed by Vanguard. Rate shown is the 7-day yield.
3 Includes $9,430,000 of collateral received for securities on loan.
ADR—American Depositary Receipt.
GDR—Global Depositary Receipt.
See accompanying Notes, which are an integral part of the Financial Statements.
12
Precious Metals and Mining Fund
Statement of Operations
| Six Months Ended | |
| July 31, 2011 | |
| ($000) | |
| Investment Income | |
| Income | |
| Dividends1,2 | 64,214 |
| Interest2 | 92 |
| Security Lending | 2,338 |
| Total Income | 66,644 |
| Expenses | |
| Investment Advisory Fees—Note B | |
| Basic Fee | 3,141 |
| Performance Adjustment | (1,171) |
| The Vanguard Group—Note C | |
| Management and Administrative | 4,425 |
| Marketing and Distribution | 571 |
| Custodian Fees | 273 |
| Shareholders’ Reports | 22 |
| Trustees’ Fees and Expenses | 6 |
| Total Expenses | 7,267 |
| Net Investment Income | 59,377 |
| Realized Net Gain (Loss) | |
| Investment Securities Sold 2 | 162,364 |
| Foreign Currencies | (1,598) |
| Realized Net Gain (Loss) | 160,766 |
| Change in Unrealized Appreciation (Depreciation) | |
| Investment Securities | 218,053 |
| Foreign Currencies | (93) |
| Change in Unrealized Appreciation (Depreciation) | 217,960 |
| Net Increase (Decrease) in Net Assets Resulting from Operations | 438,103 |
1 Dividends are net of foreign withholding taxes of $4,432,000.
2 Dividend income, interest income, and realized net gain (loss) from affiliated companies of the fund were $49,270,000, $92,000, and $109,599,000, respectively.
See accompanying Notes, which are an integral part of the Financial Statements.
13
Precious Metals and Mining Fund
Statement of Changes in Net Assets
| Six Months Ended | Year Ended | |
| July 31, | January 31, | |
| 2011 | 2011 | |
| ($000) | ($000) | |
| Increase (Decrease) in Net Assets | ||
| Operations | ||
| Net Investment Income | 59,377 | 26,820 |
| Realized Net Gain (Loss) | 160,766 | 138,087 |
| Change in Unrealized Appreciation (Depreciation) | 217,960 | 1,089,283 |
| Net Increase (Decrease) in Net Assets Resulting from Operations | 438,103 | 1,254,190 |
| Distributions | ||
| Net Investment Income | (10,948) | (221,507) |
| Realized Capital Gain | — | (38,436) |
| Total Distributions | (10,948) | (259,943) |
| Capital Share Transactions | ||
| Issued | 442,252 | 1,200,221 |
| Issued in Lieu of Cash Distributions | 10,102 | 239,830 |
| Redeemed1 | (677,453) | (1,088,329) |
| Net Increase (Decrease) from Capital Share Transactions | (225,099) | 351,722 |
| Total Increase (Decrease) | 202,056 | 1,345,969 |
| Net Assets | ||
| Beginning of Period | 5,030,084 | 3,684,115 |
| End of Period2 | 5,232,140 | 5,030,084 |
1 Net of redemption fees for fiscal 2012 and 2011 of $1,407,000 and $2,999,000, respectively.
2 Net Assets—End of Period includes undistributed (overdistributed) net investment income of ($167,777,000) and ($227,207,000).
See accompanying Notes, which are an integral part of the Financial Statements.
14
Precious Metals and Mining Fund
Financial Highlights
| Six Months | ||||||
| Ended | ||||||
| For a Share Outstanding | July 31, | Year Ended January 31, | ||||
| Throughout Each Period | 2011 | 2011 | 2010 | 2009 | 2008 | 2007 |
| Net Asset Value, Beginning of Period | $24.15 | $18.74 | $10.74 | $33.45 | $28.64 | $27.08 |
| Investment Operations | ||||||
| Net Investment Income | .2481 | .181 | .0932 | .653 | .9002 | .560 |
| Net Realized and Unrealized Gain (Loss) | ||||||
| on Investments3 | 1.895 | 6.521 | 8.207 | (19.849) | 8.362 | 4.027 |
| Total from Investment Operations | 2.143 | 6.702 | 8.300 | (19.196) | 9.262 | 4.587 |
| Distributions | ||||||
| Dividends from Net Investment Income | (.053) | (1.101) | (.300) | (.763) | (.670) | (.490) |
| Distributions from Realized Capital Gains | — | (.191) | — | (2.751) | (3.782) | (2.537) |
| Total Distributions | (.053) | (1.292) | (.300) | (3.514) | (4.452) | (3.027) |
| Net Asset Value, End of Period | $26.24 | $24.15 | $18.74 | $10.74 | $33.45 | $28.64 |
| Total Return4 | 8.88% | 35.35% | 77.75% | -60.16% | 33.97% | 17.48% |
| Ratios/Supplemental Data | ||||||
| Net Assets, End of Period (Millions) | $5,232 | $5,030 | $3,684 | $1,644 | $4,635 | $3,444 |
| Ratio of Total Expenses to | ||||||
| Average Net Assets5 | 0.27% | 0.27% | 0.27% | 0.30% | 0.28% | 0.35% |
| Ratio of Net Investment Income to | ||||||
| Average Net Assets | 1.86%1 | 0.61% | 0.59%2 | 2.17% | 2.70%2 | 1.88% |
| Portfolio Turnover Rate | 30% | 34% | 17% | 22% | 29% | 24% |
The expense ratio, net income ratio, and turnover rate for the current period have been annualized.
1 Net investment income per share and the ratio of net investment income to average net assets include $.101 and 0.38%, respectively, resulting from a special dividend from OZ Minerals Ltd. in May 2011.
2 Net investment income per share and the ratio of net investment income to average net assets for the year ended January 31, 2008, include $0.190 and 0.65%, respectively, resulting from a special dividend from Centennial Coal Co. Ltd. in January 2008. Based on additional information reported by the company in 2009, a portion of the special dividend was reallocated to return of capital. The reallocation reduced net investment income per share and the ratio of net investment income to average net assets for the year ended January 31, 2010, by $.134 and 0.90% respectively. The reallocation has no impact on net assets, net asset values per share, or total returns.
3 Includes increases from redemption fees of $.01, $.01, $.01, $.01, $.01, and $.03.
4 Total returns do not include transaction or account service fees that may have applied in the periods shown. Fund prospectuses provide information about any applicable transaction and account service fees.
5 Includes performance-based investment advisory fee increases (decreases) of (0.04%), (0.05%), (0.08%), 0.00%, (0.01%), and 0.01%.
See accompanying Notes, which are an integral part of the Financial Statements.
15
Precious Metals and Mining Fund
Notes to Financial Statements
Vanguard Precious Metals and Mining Fund is registered under the Investment Company Act of 1940 as an open-end investment company, or mutual fund. The fund invests in securities of foreign issuers, which may subject it to investment risks not normally associated with investing in securities of United States corporations.
A. The following significant accounting policies conform to generally accepted accounting principles for U.S. mutual funds. The fund consistently follows such policies in preparing its financial statements.
1. Security Valuation: Securities are valued as of the close of trading on the New York Stock Exchange (generally 4 p.m., Eastern time) on the valuation date. Equity securities are valued at the latest quoted sales prices or official closing prices taken from the primary market in which each security trades; such securities not traded on the valuation date are valued at the mean of the latest quoted bid and asked prices. Securities for which market quotations are not readily available, or whose values have been affected by events occurring before the fund’s pricing time but after the close of the securities’ primary markets, are valued at their fair values calculated according to procedures adopted by the board of trustees. These procedures include obtaining quotations from an independent pricing service, monitoring news to identify significant market- or security-specific events, and evaluating changes in the values of foreign market proxies (for example, ADRs, futures contracts, or exchange-traded funds), between the time the foreign markets close and the fund’s pricing time. When fair-value pricing is employed, the prices of securities used by a fund to calculate its net asset value may differ from quoted or published prices for the same securities. Precious metals are valued at the mean of the latest quoted bid and asked prices. Investments in Vanguard Market Liquidity Fund are valued at that fund’s net asset value.
2. Foreign Currency: Securities and other assets and liabilities denominated in foreign currencies are translated into U.S. dollars using exchange rates obtained from an independent third party as of the fund’s pricing time on the valuation date. Realized gains (losses) and unrealized appreciation (depreciation) on investment securities include the effects of changes in exchange rates since the securities were purchased, combined with the effects of changes in security prices. Fluctuations in the value of other assets and liabilities resulting from changes in exchange rates are recorded as unrealized foreign currency gains (losses) until the assets or liabilities are settled in cash, at which time they are recorded as realized foreign currency gains (losses).
3. Federal Income Taxes: The fund intends to continue to qualify as a regulated investment company and distribute all of its taxable income. Management has analyzed the fund’s tax positions taken for all open federal income tax years (January 31, 2008–2011), and for the period ended July 31, 2011, and has concluded that no provision for federal income tax is required in the fund’s financial statements.
4. Distributions: Distributions to shareholders are recorded on the ex-dividend date.
5. Security Lending: The fund may lend its securities to qualified institutional borrowers to earn additional income. Security loans are required to be secured at all times by collateral at least equal to the market value of securities loaned. The fund invests cash collateral received in Vanguard Market Liquidity Fund, and records a liability for the return of the collateral, during the period the securities are on loan. Security lending income represents fees charged to borrowers plus income earned on investing cash collateral, less expenses associated with the loan.
6. Other: Dividend income is recorded on the ex-dividend date. Interest income includes income distributions received from Vanguard Market Liquidity Fund and is accrued daily. Security transactions are accounted for on the date securities are bought or sold. Costs used to determine realized gains (losses) on the sale of investment securities are those of the specific securities sold. Fees assessed on redemptions of capital shares are credited to paid-in capital.
16
Precious Metals and Mining Fund
B. M&G Investment Management Ltd. provides investment advisory services to the fund for a fee calculated at an annual percentage rate of average net assets. The basic fee is subject to quarterly adjustments based on the fund’s performance for the preceding three years relative to the S&P Custom Precious Metals and Mining Index. For the six months ended July 31, 2011, the investment advisory fee represented an effective annual basic rate of 0.12% of the fund’s average net assets before a decrease of $1,171,000 (0.04%) based on performance.
C. The Vanguard Group furnishes at cost corporate management, administrative, marketing, and distribution services. The costs of such services are allocated to the fund under methods approved by the board of trustees. The fund has committed to provide up to 0.40% of its net assets in capital contributions to Vanguard. At July 31, 2011, the fund had contributed capital of $804,000 to Vanguard (included in Other Assets), representing 0.02% of the fund’s net assets and 0.32% of Vanguard’s capitalization. The fund’s trustees and officers are also directors and officers of Vanguard.
D. Various inputs may be used to determine the value of the fund’s investments. These inputs are summarized in three broad levels for financial statement purposes. The inputs or methodologies used to value securities are not necessarily an indication of the risk associated with investing in those securities.
Level 1—Quoted prices in active markets for identical securities.
Level 2—Other significant observable inputs (including quoted prices for similar securities, interest rates, prepayment speeds, credit risk, etc.).
Level 3—Significant unobservable inputs (including the fund’s own assumptions used to determine the fair value of investments).
The following table summarizes the fund’s investments as of July 31, 2011, based on the inputs used to value them:
| Level 1 | Level 2 | Level 3 | |
| Investments | ($000) | ($000) | ($000) |
| Common Stocks—North America | 2,155,254 | — | — |
| Common Stocks—Other | 2,047 | 2,982,809 | — |
| Precious Metals | 3,581 | — | — |
| Temporary Cash Investments | 127,405 | — | — |
| Total | 2,288,287 | 2,982,809 | — |
E. Distributions are determined on a tax basis and may differ from net investment income and realized capital gains for financial reporting purposes. Differences may be permanent or temporary. Permanent differences are reclassified among capital accounts in the financial statements to reflect their tax character. Temporary differences arise when certain items of income, expense, gain, or loss are recognized in different periods for financial statement and tax purposes; these differences will reverse at some time in the future. Differences in classification may also result from the treatment of short-term gains as ordinary income for tax purposes.
During the six months ended July 31, 2011, the fund realized net foreign currency losses of $1,598,000, which decreased distributable net income for tax purposes; accordingly, such losses have been reclassified from accumulated net realized gains to overdistributed net investment income.
17
Precious Metals and Mining Fund
Certain of the fund’s investments are in securities considered to be “passive foreign investment companies,” for which any unrealized appreciation and/or realized gains are required to be included in distributable net income for tax purposes. During the six months ended July 31, 2011, the fund realized gains on the sale of passive foreign investment companies of $12,599,000, which have been included in current and prior periods’ taxable income; accordingly, such gains have been reclassified from accumulated net realized gains to overdistributed net investment income. Passive foreign investment companies held at July 31, 2011, had unrealized appreciation of $184,909,000 as of October 31, 2010, the most recent mark-to-market date for tax purposes. This amount has been distributed and is reflected in the balance of overdistributed net investment income.
The fund’s tax-basis capital gains and losses are determined only at the end of each fiscal year. The fund realized losses of $29,139,000 during the period from November 1, 2010, through January 31, 2011, which are deferred and will be treated as realized for tax purposes in fiscal 2012. The fund will use these capital losses to offset net taxable capital gains, if any, realized during the year ending January 31, 2012; should the fund realize net capital losses for the year, the losses will be added to the loss carryforward balance above.
At July 31, 2011, the cost of investment securities for tax purposes was $4,024,360,000. Net unrealized appreciation of investment securities for tax purposes was $1,246,736,000, consisting of unrealized gains of $1,437,335,000 on securities that had risen in value since their purchase and $190,599,000 in unrealized losses on securities that had fallen in value since their purchase.
F. During the six months ended July 31, 2011, the fund purchased $780,743,000 of investment securities and sold $974,165,000 of investment securities, other than temporary cash investments.
G. Capital shares issued and redeemed were:
| Six Months Ended | Year Ended | |
| July 31, 2011 | January 31, 2011 | |
| Shares | Shares | |
| (000) | (000) | |
| Issued | 16,841 | 51,798 |
| Issued in Lieu of Cash Distributions | 401 | 9,325 |
| Redeemed | (26,081) | (49,471) |
| Net Increase (Decrease) in Shares Outstanding | (8,839) | 11,652 |
18
Precious Metals and Mining Fund
H. Certain of the fund’s investments are in companies that are considered to be affiliated companies of the fund because the fund owns more than 5% of the outstanding voting securities of the company. Transactions during the period in securities of these companies were as follows:
| Current Period Transactions | |||||
| Jan. 31, 2011 | Proceeds from | July 31, 2011 | |||
| Market | Purchases | Securities | Dividend | Market | |
| Value | at Cost | Sold | Income | Value | |
| ($000) | ($000) | ($000) | ($000) | ($000) | |
| Alacer Gold Corp | — | 37,063 | — | — | 224,363 |
| AMCOL International Corp. | 92,154 | — | — | 1,109 | 94,433 |
| Anatolia Minerals Development Ltd. | 127,401 | — | — | — | NA1 |
| Apex Minerals NL | 8,648 | 2,857 | — | — | 5,491 |
| Aquila Resources Ltd. | 241,802 | 23,570 | — | — | 212,535 |
| Centerra Gold Inc. | 288,870 | 18,237 | — | 6,305 | 371,483 |
| Cudeco Ltd. | 45,365 | — | — | — | 46,977 |
| Drummond Gold Ltd | 2,002 | 805 | — | — | 2,307 |
| Equatorial Resources Ltd. | 16,927 | 3,833 | — | — | 19,993 |
| Harry Winston Diamond Corp. | 105,450 | — | 3,910 | — | 147,951 |
| Hochschild Mining plc | 315,318 | — | — | 1,224 | 317,065 |
| Iluka Resources Ltd. | 358,880 | — | 272,123 | 2,968 | 494,386 |
| Imerys SA | 257,069 | — | 18,295 | 5,432 | NA2 |
| Medusa Mining Ltd. | 92,107 | 81,603 | ��� | 584 | 185,973 |
| Minefinders Corp. | 56,202 | 80,199 | — | — | 173,859 |
| Nevsun Resources Ltd. | 229,920 | — | — | 1,008 | 220,415 |
| OZ Minerals Ltd. | 275,736 | 16,674 | 7,542 | 28,732 | 256,834 |
| Panoramic Resources Ltd. | 46,214 | — | — | 808 | 38,434 |
| Reed Resources Ltd. | — | 9,141 | — | — | 7,686 |
| Resolute Mining Ltd. | 69,127 | — | — | — | 77,130 |
| SEMAFO Inc. | 198,122 | — | 32,128 | — | 140,165 |
| Sherritt International Corp. | 169,982 | — | 50,153 | 1,100 | NA2 |
| Speewah Metals Ltd. | — | 4,983 | — | — | 4,538 |
| St. Barbara Ltd. | 97,094 | — | — | — | 103,118 |
| 3,094,390 | 49,270 | 3,145,136 | |||
1 Not applicable—In February 2011, Anatolia Minerals Development Ltd. merged into Alacer Gold Corp.
2 Not applicable—At July 31, 2011, the security was still held, but the issuer was no longer an affiliated company of the fund.
I. In preparing the financial statements as of July 31, 2011, management considered the impact of subsequent events for potential recognition or disclosure in these financial statements.
19
About Your Fund’s Expenses
As a shareholder of the fund, you incur ongoing costs, which include costs for portfolio management, administrative services, and shareholder reports (like this one), among others. Operating expenses, which are deducted from a fund’s gross income, directly reduce the investment return of the fund.
A fund’s expenses are expressed as a percentage of its average net assets. This figure is known as the expense ratio. The following examples are intended to help you understand the ongoing costs (in dollars) of investing in your fund and to compare these costs with those of other mutual funds. The examples are based on an investment of $1,000 made at the beginning of the period shown and held for the entire period.
The accompanying table illustrates your fund’s costs in two ways:
• Based on actual fund return. This section helps you to estimate the actual expenses that you paid over the period. The ”Ending Account Value“ shown is derived from the fund‘s actual return, and the third column shows the dollar amount that would have been paid by an investor who started with $1,000 in the fund. You may use the information here, together with the amount you invested, to estimate the expenses that you paid over the period.
To do so, simply divide your account value by $1,000 (for example, an $8,600 account value divided by $1,000 = 8.6), then multiply the result by the number given for your fund under the heading ”Expenses Paid During Period.“
• Based on hypothetical 5% yearly return. This section is intended to help you compare your fund‘s costs with those of other mutual funds. It assumes that the fund had a yearly return of 5% before expenses, but that the expense ratio is unchanged. In this case—because the return used is not the fund’s actual return—the results do not apply to your investment. The example is useful in making comparisons because the Securities and Exchange Commission requires all mutual funds to calculate expenses based on a 5% return. You can assess your fund’s costs by comparing this hypothetical example with the hypothetical examples that appear in shareholder reports of other funds.
Note that the expenses shown in the table are meant to highlight and help you compare ongoing costs only and do not reflect transaction costs incurred by the fund for buying and selling securities. Further, the expenses do not include any purchase, redemption, or account service fees described in the fund prospectus. If such fees were applied to your account, your costs would be higher. Your fund does not carry a “sales load.”
The calculations assume no shares were bought or sold during the period. Your actual costs may have been higher or lower, depending on the amount of your investment and the timing of any purchases or redemptions.
You can find more information about the fund’s expenses, including annual expense ratios, in the Financial Statements section of this report. For additional information on operating expenses and other shareholder costs, please refer to your fund’s current prospectus.
20
| Six Months Ended July 31, 2011 | |||
| Beginning | Ending | Expenses | |
| Account Value | Account Value | Paid During | |
| Precious Metals and Mining Fund | 1/31/2011 | 7/31/2011 | Period |
| Based on Actual Fund Return | $1,000.00 | $1,088.83 | $1.40 |
| Based on Hypothetical 5% Yearly Return | 1,000.00 | 1,023.46 | 1.35 |
The calculations are based on expenses incurred in the most recent six-month period. The fund’s annualized six-month expense ratio for that period is 0.27%. The dollar amounts shown as “Expenses Paid” are equal to the annualized expense ratio multiplied by the average account value over the period, multiplied by the number of days in the most recent six-month period, then divided by the number of days in the most recent 12-month period.
21
Trustees Approve Advisory Agreement
The board of trustees of Vanguard Precious Metals and Mining Fund has renewed the fund’s investment advisory agreement with M&G Investment Management Limited. The board determined that the retention of the advisor was in the best interests of the fund and its shareholders.
The board based its decision upon an evaluation of the advisor’s investment staff, portfolio management process, and performance. The trustees considered the factors discussed below, among others. However, no single factor determined whether the board approved the agreement. Rather, it was the totality of the circumstances that drove the board’s decision.
Nature, extent, and quality of services
The board considered the quality of the fund’s investment management over both the short and long term, and took into account the organizational depth and stability of the advisor. The board noted that M&G, founded in 1931, specializes in managing equity and fixed income portfolios for both institutional and retail clients worldwide. The advisor continues to employ a sound process, selecting companies that are broadly representative of the metals and mining industries with emphasis on well-managed, returns-focused companies. The fund may be invested in rare minerals (such as diamonds), precious metals (such as gold, silver, and platinum), and base metals and minerals (such as coal). The advisor’s global equity research team—composed of six senior investment professionals and four analysts— conducts intensive fundamental analysis on companies in the industry, including regular company visits. The firm has advised the fund since the fund’s inception in 1984.
The board concluded that the advisor’s experience, stability, depth, and performance, among other factors, warranted continuation of the advisory agreement.
Investment performance
The board considered the short- and long-term performance of the fund, including any periods of outperformance or underperformance of a relevant benchmark and peer group. The board noted that the fund is more broadly diversified than its competitors—with the ability to invest up to half of the fund’s assets in non-precious metals and mining stocks. The board concluded that the advisor has carried out the fund’s investment strategy in disciplined fashion, and that performance results have allowed the fund to remain competitive versus its benchmark and peer group over the long term; however, short-term performance lagged. Information about the fund’s most recent performance can be found in the Performance Summary section of this report.
Cost
The board concluded that the fund’s expense ratio was well below the average expense ratio charged by funds in its peer group and that the fund’s advisory fee rate was also well below its peer-group average. Information about the fund’s expenses appears in the About Your Fund’s Expenses section of this report as well as in the Financial Statements section, which also includes information about the advisory fee rate.
The board did not consider profitability of M&G in determining whether to approve the advisory fee, because M&G is independent of Vanguard, and the advisory fee is the result of arm’s-length negotiations.
The benefit of economies of scale
The board concluded that the fund’s shareholders benefit from economies of scale because of breakpoints in the advisory fee schedule. The breakpoints reduce the effective rate of the fee as the fund’s assets increase.
The board will consider whether to renew the advisory agreement again after a one-year period.
22
Glossary
Beta. A measure of the magnitude of a fund’s past share-price fluctuations in relation to the ups and downs of a given market index. The index is assigned a beta of 1.00. Compared with a given index, a fund with a beta of 1.20 typically would have seen its share price rise or fall by 12% when the index rose or fell by 10%. For this report, beta is based on returns over the past 36 months for both the fund and the index. Note that a fund’s beta should be reviewed in conjunction with its R-squared (see definition). The lower the R-squared, the less correlation there is between the fund and the index, and the less reliable beta is as an indicator of volatility.
Dividend Yield. Dividend income earned by stocks, expressed as a percentage of the aggregate market value (or of net asset value, for a fund). The yield is determined by dividing the amount of the annual dividends by the aggregate value (or net asset value) at the end of the period. For a fund, the dividend yield is based solely on stock holdings and does not include any income produced by other investments.
Earnings Growth Rate. The average annual rate of growth in earnings over the past five years for the stocks now in a fund.
Equity Exposure. A measure that reflects a fund’s investments in stocks and stock futures. Any holdings in short-term reserves are excluded.
Expense Ratio. The percentage of a fund’s average net assets used to pay its annual administrative and advisory expenses. These expenses directly reduce returns to investors.
Foreign Holdings. The percentage of a fund represented by securities or depositary receipts of companies based outside the United States.
Inception Date. The date on which the assets of a fund (or one of its share classes) are first invested in accordance with the fund’s investment objective. For funds with a subscription period, the inception date is the day after that period ends. Investment performance is measured from the inception date.
Median Market Cap. An indicator of the size of companies in which a fund invests; the midpoint of market capitalization (market price x shares outstanding) of a fund’s stocks, weighted by the proportion of the fund’s assets invested in each stock. Stocks representing half of the fund’s assets have market capitalizations above the median, and the rest are below it.
Price/Book Ratio. The share price of a stock divided by its net worth, or book value, per share. For a fund, the weighted average price/book ratio of the stocks it holds.
R-Squared. A measure of how much of a fund’s past returns can be explained by the returns from the market in general, as measured by a given index. If a fund’s total returns were precisely synchronized with an index’s returns, its R-squared would be 1.00. If the fund’s returns bore no relationship to the index’s returns, its R-squared would be 0. For this report, R-squared is based on returns over the past 36 months for both the fund and the index.
Return on Equity. The annual average rate of return generated by a company during the past five years for each dollar of shareholder’s equity (net income divided by shareholder’s equity). For a fund, the weighted average return on equity for the companies whose stocks it holds.
23
Short-Term Reserves. The percentage of a fund invested in highly liquid, short-term securities that can be readily converted to cash.
Turnover Rate. An indication of the fund’s trading activity. Funds with high turnover rates incur higher transaction costs and may be more likely to distribute capital gains (which may be taxable to investors). The turnover rate excludes in-kind transactions, which have minimal impact on costs.
24
This page intentionally left blank.
This page intentionally left blank.
This page intentionally left blank.
The People Who Govern Your Fund
The trustees of your mutual fund are there to see that the fund is operated and managed in your best interests since, as a shareholder, you are a part owner of the fund. Your fund’s trustees also serve on the board of directors of The Vanguard Group, Inc., which is owned by the Vanguard funds and provides services to them on an at-cost basis.
A majority of Vanguard’s board members are independent, meaning that they have no affiliation with Vanguard or the funds they oversee, apart from the sizable personal investments they have made as private individuals. The independent board members have distinguished backgrounds in business, academia, and public service. Each of the trustees and executive officers oversees 178 Vanguard funds.
The following table provides information for each trustee and executive officer of the fund. More information about the trustees is in the Statement of Additional Information, which can be obtained, without charge, by contacting Vanguard at 800-662-7447, or online at vanguard.com.
| Interested Trustee1 | and President (2006–2008) of Rohm and Haas Co. |
| (chemicals); Director of Tyco International, Ltd. | |
| F. William McNabb III | (diversified manufacturing and services) and Hewlett- |
| Born 1957. Trustee Since July 2009. Chairman of the | Packard Co. (electronic computer manufacturing); |
| Board. Principal Occupation(s) During the Past Five | Senior Advisor at New Mountain Capital; Trustee |
| Years: Chairman of the Board of The Vanguard Group, | of The Conference Board; Member of the Board of |
| Inc., and of each of the investment companies served | Managers of Delphi Automotive LLP (automotive |
| by The Vanguard Group, since January 2010; Director | components). |
| of The Vanguard Group since 2008; Chief Executive | |
| Officer and President of The Vanguard Group and of | Amy Gutmann |
| each of the investment companies served by The | Born 1949. Trustee Since June 2006. Principal |
| Vanguard Group since 2008; Director of Vanguard | Occupation(s) During the Past Five Years: President |
| Marketing Corporation; Managing Director of The | of the University of Pennsylvania; Christopher H. |
| Vanguard Group (1995–2008). | Browne Distinguished Professor of Political Science |
| in the School of Arts and Sciences with secondary | |
| appointments at the Annenberg School for Commu- | |
| Independent Trustees | nication and the Graduate School of Education |
| of the University of Pennsylvania; Director of | |
| Emerson U. Fullwood | Carnegie Corporation of New York, Schuylkill River |
| Born 1948. Trustee Since January 2008. Principal | Development Corporation, and Greater Philadelphia |
| Occupation(s) During the Past Five Years: Executive | Chamber of Commerce; Trustee of the National |
| Chief Staff and Marketing Officer for North America | Constitution Center; Chair of the Presidential |
| and Corporate Vice President (retired 2008) of Xerox | Commission for the Study of Bioethical Issues. |
| Corporation (document management products and | |
| services); Executive in Residence and 2010 | JoAnn Heffernan Heisen |
| Distinguished Minett Professor at the Rochester | Born 1950. Trustee Since July 1998. Principal |
| Institute of Technology; Director of SPX Corporation | Occupation(s) During the Past Five Years: Corporate |
| (multi-industry manufacturing), the United Way of | Vice President and Chief Global Diversity Officer |
| Rochester, Amerigroup Corporation (managed health | (retired 2008) and Member of the Executive |
| care), the University of Rochester Medical Center, | Committee (1997–2008) of Johnson & Johnson |
| Monroe Community College Foundation, and North | (pharmaceuticals/consumer products); Director of |
| Carolina A&T University. | Skytop Lodge Corporation (hotels), the University |
| Medical Center at Princeton, the Robert Wood | |
| Rajiv L. Gupta | Johnson Foundation, and the Center for Work Life |
| Born 1945. Trustee Since December 2001.2 | Policy; Member of the Advisory Board of the |
| Principal Occupation(s) During the Past Five Years: | Maxwell School of Citizenship and Public Affairs |
| Chairman and Chief Executive Officer (retired 2009) | at Syracuse University. |
| F. Joseph Loughrey | Thomas J. Higgins | |
| Born 1949. Trustee Since October 2009. Principal | Born 1957. Chief Financial Officer Since September | |
| Occupation(s) During the Past Five Years: President | 2008. Principal Occupation(s) During the Past Five | |
| and Chief Operating Officer (retired 2009) and Vice | Years: Principal of The Vanguard Group, Inc.; Chief | |
| Chairman of the Board (2008–2009) of Cummins Inc. | Financial Officer of each of the investment companies | |
| (industrial machinery); Director of SKF AB (industrial | served by The Vanguard Group since 2008; Treasurer | |
| machinery), Hillenbrand, Inc. (specialized consumer | of each of the investment companies served by The | |
| services), the Lumina Foundation for Education, and | Vanguard Group (1998–2008). | |
| Oxfam America; Chairman of the Advisory Council | ||
| for the College of Arts and Letters and Member | Kathryn J. Hyatt | |
| of the Advisory Board to the Kellogg Institute for | Born 1955. Treasurer Since November 2008. Principal | |
| International Studies at the University of Notre Dame. | Occupation(s) During the Past Five Years: Principal | |
| of The Vanguard Group, Inc.; Treasurer of each of | ||
| André F. Perold | the investment companies served by The Vanguard | |
| Born 1952. Trustee Since December 2004. Principal | Group since 2008; Assistant Treasurer of each of the | |
| Occupation(s) During the Past Five Years: George | investment companies served by The Vanguard Group | |
| Gund Professor of Finance and Banking at the Harvard | (1988–2008). | |
| Business School (retired July 2011); Chief Investment | ||
| Officer and co-Managing Partner of HighVista | Heidi Stam | |
| Strategies LLC (private investment firm); Director of | Born 1956. Secretary Since July 2005. Principal | |
| Rand Merchant Bank; Overseer of the Museum of | Occupation(s) During the Past Five Years: Managing | |
| Fine Arts Boston. | Director of The Vanguard Group, Inc., since 2006; | |
| General Counsel of The Vanguard Group since 2005; | ||
| Alfred M. Rankin, Jr. | Secretary of The Vanguard Group and of each of the | |
| Born 1941. Trustee Since January 1993. Principal | investment companies served by The Vanguard Group | |
| Occupation(s) During the Past Five Years: Chairman, | since 2005; Director and Senior Vice President of | |
| President, and Chief Executive Officer of NACCO | Vanguard Marketing Corporation since 2005; | |
| Industries, Inc. (forklift trucks/housewares/lignite); | Principal of The Vanguard Group (1997–2006). | |
| Director of Goodrich Corporation (industrial products/ | ||
| aircraft systems and services) and the National | ||
| Association of Manufacturers; Chairman of the | Vanguard Senior Management Team | |
| Federal Reserve Bank of Cleveland; Vice Chairman | ||
| of University Hospitals of Cleveland; President of | R. Gregory Barton | Michael S. Miller |
| the Board of The Cleveland Museum of Art. | Mortimer J. Buckley | James M. Norris |
| Kathleen C. Gubanich | Glenn W. Reed | |
| Peter F. Volanakis | Paul A. Heller | George U. Sauter |
| Born 1955. Trustee Since July 2009. Principal | Martha G. King | |
| Occupation(s) During the Past Five Years: President | ||
| and Chief Operating Officer (retired 2010) of Corning | ||
| Incorporated (communications equipment); Director of | Chairman Emeritus and Senior Advisor | |
| Corning Incorporated (2000–2010) and Dow Corning | ||
| (2001–2010); Overseer of the Amos Tuck School of | John J. Brennan | |
| Business Administration at Dartmouth College. | Chairman, 1996–2009 | |
| Chief Executive Officer and President, 1996–2008 | ||
| Executive Officers | ||
| Founder | ||
| Glenn Booraem | ||
| Born 1967. Controller Since July 2010. Principal | John C. Bogle | |
| Occupation(s) During the Past Five Years: Principal | Chairman and Chief Executive Officer, 1974–1996 | |
| of The Vanguard Group, Inc.; Controller of each of | ||
| the investment companies served by The Vanguard | ||
| Group since 2010; Assistant Controller of each of | ||
| the investment companies served by The Vanguard | ||
| Group (2001–2010). | ||
1 Mr. McNabb is considered an “interested person,” as defined in the Investment Company Act of 1940, because he is an officer of the Vanguard funds.
2 December 2002 for Vanguard Equity Income Fund, Vanguard Growth Equity Fund, the Vanguard Municipal Bond Funds, and the Vanguard State Tax-Exempt Funds.
 | |
| P.O. Box 2600 | |
| Valley Forge, PA 19482-2600 |
Connect with Vanguard® > vanguard.com
| Fund Information > 800-662-7447 | |
| Direct Investor Account Services > 800-662-2739 | |
| Institutional Investor Services > 800-523-1036 | |
| Text Telephone for People | |
| With Hearing Impairment > 800-749-7273 | |
| This material may be used in conjunction | |
| with the offering of shares of any Vanguard | |
| fund only if preceded or accompanied by | |
| the fund’s current prospectus. | |
| All comparative mutual fund data are from Lipper Inc. or | |
| Morningstar, Inc., unless otherwise noted. | |
| You can obtain a free copy of Vanguard’s proxy voting | |
| guidelines by visiting vanguard.com/proxyreporting or by | |
| calling Vanguard at 800-662-2739. The guidelines are | |
| also available from the SEC’s website, sec.gov. In | |
| addition, you may obtain a free report on how your fund | |
| voted the proxies for securities it owned during the 12 | |
| months ended June 30. To get the report, visit either | |
| vanguard.com/proxyreporting or sec.gov. | |
| You can review and copy information about your fund at | |
| the SEC’s Public Reference Room in Washington, D.C. To | |
| find out more about this public service, call the SEC at | |
| 202-551-8090. Information about your fund is also | |
| available on the SEC’s website, and you can receive | |
| copies of this information, for a fee, by sending a | |
| request in either of two ways: via e-mail addressed to | |
| publicinfo@sec.gov or via regular mail addressed to the | |
| Public Reference Section, Securities and Exchange | |
| Commission, Washington, DC 20549-1520. | |
| © 2011 The Vanguard Group, Inc. | |
| All rights reserved. | |
| Vanguard Marketing Corporation, Distributor. | |
| Q532 092011 | |
| Vanguard Health Care Fund |
| Semiannual Report |
| July 31, 2011 |
 |
> For the six months ended July 31, 2011, Vanguard Health Care Fund returned more than 10%.
> The fund’s return was in line with that of its benchmark index for the period, and slightly ahead of the average return for global health/biotechnology funds.
> Pharmaceutical companies—which represented about half of the fund’s holdings, on average, for the period—contributed most significantly to returns.
| Contents | |
| Your Fund’s Total Returns. | 1 |
| Chairman’s Letter. | 2 |
| Advisor’s Report. | 6 |
| Fund Profile. | 8 |
| Performance Summary. | 10 |
| Financial Statements. | 11 |
| About Your Fund’s Expenses. | 24 |
| Trustees Approve Advisory Agreement. | 26 |
| Glossary. | 27 |
Please note: The opinions expressed in this report are just that—informed opinions. They should not be considered promises or advice.
Also, please keep in mind that the information and opinions cover the period through the date on the front of this report. Of course, the risks of investing in your fund are spelled out in the prospectus.
See the Glossary for definitions of investment terms used in this report.
Cover photograph: Jean Maher.
Your Fund’s Total Returns
| Six Months Ended July 31, 2011 | |
| Total | |
| Returns | |
| Vanguard Health Care Fund | |
| Investor Shares | 10.37% |
| Admiral™ Shares | 10.40 |
| MSCI All Country World Health Care Index | 10.36 |
| Global Health/Biotechnology Funds Average | 9.87 |
| Global Health/Biotechnology Funds Average: Derived from data provided by Lipper Inc. |
Admiral Shares carry lower expenses and are available to investors who meet certain account-balance requirements.
Your Fund’s Performance at a Glance
January 31, 2011 , Through July 31, 2011
| Distributions Per Share | ||||
| Starting | Ending | Income | Capital | |
| Share Price | Share Price | Dividends | Gains | |
| Vanguard Health Care Fund | ||||
| Investor Shares | $124.30 | $136.16 | $0.127 | $0.822 |
| Admiral Shares | 52.45 | 57.47 | 0.057 | 0.347 |
1

Chairman’s Letter
Dear Shareholder,
During the six months ended July 31, 2011 the health care sector returned to favor with investors, handily outperforming the broad stock market.
Vanguard Health Care Fund kept pace with the sector’s strong performance, returning more than 10%. The fund’s return was in line with that of its benchmark index and a few steps ahead of the average return of its peer funds. The fund’s pharmaceutical holdings—which accounted for about 50% of the fund, on average, during the period—contributed the most to returns.
Please note that on May 11, we lowered the minimum required investment for the Investor Shares of several Vanguard funds, including the Health Care Fund, to $3,000. This was done as part of our ongoing efforts to simplify how we offer Investor Shares and to increase the accessibility of our funds.
Stocks worldwide crept higher in a treacherous marketplace
Global stock markets struggled to find direction during the past six months, as every positive signal seemed to be paired with its negative. The good news included surprisingly strong corporate profits, which proved to be a source of investor optimism through much of the period.
The counterpoint was a series of increasingly glum economic reports. Expectations that the U.S. economic
2
expansion would accelerate in the second half of the year gave way to anxiety about the possibility of recession. The Dow Jones U.S. Total Stock Market Index finished the period with a return of 1.55%. Across the globe, stock returns were similarly modest.
Bonds rallied in the U.S. market as investors sought safety
Bond prices climbed amid the turbulence. Investors sought refuge from a collection of troubles: Europe’s debt dramas, economic shocks produced by the Japanese tsunami and its aftermath, and prolonged debate over raising the U.S. debt ceiling. For the full six months, the broad U.S. taxable bond market returned more than 4%. (Rising prices are a mixed blessing, of course; they imply lower yields on future investment.)
The yields on money market instruments such as Treasury bills remained near 0%, consistent with the Federal Reserve Board’s target for short-term interest rates.
The U.S. credit downgrade: a cause for concern, not panic
On August 5, after the close of our reporting period, Standard & Poor’s downgraded its credit rating of U.S. debt from AAA to AA+. S&P said its action was prompted, in large part, by concern about “the effectiveness, stability, and predictability of American policymaking and political institutions”—in other words, the political gridlock on vivid display during the debt-ceiling debate.
| Market Barometer | |||
| Total Returns | |||
| Periods Ended July 31, 2011 | |||
| Six | One | Five Years | |
| Months | Year | (Annualized) | |
| Stocks | |||
| Russell 1000 Index (Large-caps) | 1.62% | 20.68% | 2.80% |
| Russell 2000 Index (Small-caps) | 2.63 | 23.92 | 4.00 |
| Dow Jones U.S. Total Stock Market Index | 1.55 | 20.83 | 3.27 |
| MSCI All Country World Index ex USA (International) | 1.39 | 17.36 | 3.18 |
| Bonds | |||
| Barclays Capital U.S. Aggregate Bond Index (Broad | |||
| taxable market) | 4.23% | 4.44% | 6.57% |
| Barclays Capital Municipal Bond Index (Broad | |||
| tax-exempt market) | 6.27 | 3.24 | 4.90 |
| Citigroup Three-Month U.S. Treasury Bill Index | 0.05 | 0.13 | 1.78 |
| CPI | |||
| Consumer Price Index | 2.59% | 3.63% | 2.11% |
3
The downgrade was controversial, and the other major rating agencies reaffirmed their decision to continue giving the highest ratings to U.S. debt. At Vanguard, our credit analysts and economists regularly assess the financial strength of the United States and other sovereign borrowers. Our confidence in the “full faith and credit” of the U.S. government remains unshaken, and we have cautioned investors against overreacting to the S&P downgrade.
Health care reemerges as a market leader
After lagging the broad market for several years, health care stocks staged an impressive resurgence early in the period, as uncertainty over heath care reform diminished and investor sentiment toward the industry improved. When the economy’s recovery turned rocky over the final three months of the period, the sector—along with the rest of the market—lost some of its gains, but nevertheless finished the period with a strong, market-beating return.
Vanguard Health Care Fund’s return of more than 10% for the six months was driven in large part by pharmaceuticals, although performance was generally strong across the industry.
Stocks of pharmaceutical firms returned to favor as their prices became more attractive and investors grew more comfortable with how managements were handling the expiration of patents on valuable products and a challenging regulatory environment. The drug giants
Expense Ratios
Your Fund Compared With Its Peer Group
| Investor | Admiral | Peer Group | |
| Shares | Shares | Average | |
| Health Care Fund | 0.35% | 0.30% | 1.39% |
The fund expense ratios shown are from the prospectus dated May 26, 2011, and represent estimated costs for the current fiscal year. For the six months ended July 31, 2011, the fund’s annualized expense ratios were 0.35% for Investor Shares and 0.30% for Admiral Shares. The peer-group expense ratio is derived from data provided by Lipper Inc. and captures information through year-end 2010.
Peer group: Global Health/Biotechnology Funds.
4
also stand to benefit from increased wealth in emerging markets. As per-capita incomes increase, demand for better health care and brand-name drugs is opening up new opportunities for these firms.
Health care providers and services was another bright spot for the fund, with notable strength in managed health care. Stocks of managed care companies rose during the period as investor concerns over health care reform faded.
The advisor’s selections in biotech stocks had the biggest positive impact on returns relative to the benchmark. Biotech firms were strong performers during the period, mostly because of “label expansion,” which occurs when a drug that has been approved to treat one ailment gains approval from the Food and Drug Administration for the treatment of a second illness or set of patients.
Don’t let market volatility interfere with long-term goals
Stocks declined in each of the final three months of the recent half-year, but the losses didn’t completely erase the gains recorded over the period’s first half. While the Health Care Fund outperformed the broader market, it wasn’t immune from the recent volatility.
The return of turbulence to the market can be unsettling, particularly since many of us have fresh memories of the financial crisis of 2008–2009. But although it can be tempting to react rashly when the market swings one way or the other, it’s crucial not to let short-term volatility influence your investment decisions.
At Vanguard, we urge investors to create a long-term investment plan that suits their goals and risk tolerance and to stick with that plan regardless of what’s happening in the market. As part of that effort, Vanguard Health Care Fund can help diversify a well-balanced portfolio by providing broad exposure to the health care industry at a low cost.
As always, thank you for entrusting your assets to Vanguard.
Sincerely,

F. William McNabb III
Chairman and Chief Executive Officer
August 10, 2011
5
Advisor’s Report
Vanguard Health Care Fund gained about 10% for the six months ended July 31, 2011. The fund’s return was in line with that of its benchmark and slightly ahead of the average return for health/biotechnology funds. The Standard & Poor’s 500 Index, a proxy for the broader market, returned more than 1%.
The investment environment
The outperformance of health care stocks seemed to be driven by slower economic growth and the perceived safety of the health care sector relative to the broader market. It’s important to note that the improving backdrop for health care fundamentals also drove the higher returns, including diminished uncertainty related to health care reform and a marked improvement in approvals by the Food and Drug Administration (FDA).
Our successes
As in recent past periods, UnitedHealth Group was our largest contributor to performance on an absolute basis. UnitedHealth Group continued to lead a managed care group that has performed well overall. Managed care companies have benefited from lower medical costs and utilization as a result of the weak economy. Roche, a pharmaceutical manufacturer focused on oncology, antivirals, and diagnostics, was another top performer; the company rebounded from a period of weakness related to lowered expectations
Major Portfolio Changes
Six Months Ended July 31, 2011
| Additions | Comments |
| Bristol-Myers Squibb | Increased our position based on positive developments involving a |
| number of drugs in the company’s pipeline, such as apixiban and | |
| ipilimumab; these drugs will help Bristol-Myers Squibb overcome | |
| the patent expiration on Plavix. | |
| Merck | The market is too pessimistic about Merck’s ability to increase its |
| earnings over the long term; we increased our position as investor | |
| confusion over the new CEO’s decision to withdraw long-term | |
| guidance metrics provided an attractive buy opportunity. | |
| United Therapeutics | Added to our position amid a decline in the stock price as results |
| from an oral pulmonary arterial hypertension trial did not meet | |
| investors’ expectations but were encouraging in our view. | |
| Reductions | Comments |
| Cephalon | Trimmed our position after the stock rose when Teva |
| Pharmaceutical offered to buy the company, outbidding | |
| Valeant Pharmaceutical. | |
| Beckman Coulter | Trimmed and then eliminated our position when Danaher |
| completed a tender offer for the company. | |
| Genzyme | Eliminated our position after the stock rose following an |
| acquisition offer by Sanofi. | |
6
for the cancer drug Avastin. We continue to view Roche’s pipeline favorably. Forest Labs was another strong contributor. Although it faces patent expirations for some key drugs, we have been encouraged by the progress in its new-to-market and late-stage pipeline drugs.
Our shortfalls
Our exposure to Japan detracted from performance. Prices of Japanese shares held in the portfolio, including Daiichi Sankyo and Shionogi, declined along with equities in Japan overall. Daiichi Sankyo, a major pharmaceutical company, has two plants affected by March’s earthquake, but the impact should be temporary. We are excited about the potential for Daiichi Sankyo’s anticoagulant drug, edoxaban. The price of Shionogi, another pharmaceutical company, fell as the company revised its earnings forecast downward for the third time. Poor performance in the company’s U.S. business segment continues to weigh on the shares. We believe the company’s promising new HIV drug and continued increased sales of Crestor, the cholesterol drug that it licenses to AstraZeneca, will drive earnings growth going forward. We are also seeing signs that the Japanese equity market is improving.
The fund’s positioning
The health care industry continues to face risks, but it also has opportunities. While we see signs that the potential impact of health care reform on the industry may be manageable, significant uncertainty remains. Health care will continue to be in the spotlight as the United States and European countries struggle to reduce their debt burdens.
Emerging markets represent a growth frontier for the global therapeutic and device companies, which is positive for the sector. We are also encouraged by an improving trend at the FDA this year. And finally, unlike industries that tend to demonstrate a higher degree of sensitivity to adverse changes in the economy, the health care sector has historically demonstrated more defensive qualities.
We will continue to strive to identify early the drugs and devices with the best chances of changing medicine, as well as the service companies that are best positioned to capture opportunities along the health care chain. We will continue to stay diversified, focused on the long haul, and positioned in what we believe to be the most attractive health care stocks.
Edward P. Owens, CFA
Senior Vice President and Portfolio Manager
Jean M. Hynes, CFA
Senior Vice President and Associate Portfolio Manager
Wellington Management Company, LLP
August 12, 2011
7
Health Care Fund
Fund Profile
As of July 31, 2011
| Share-Class Characteristics | |||
| Investor | Admiral | ||
| Shares | Shares | ||
| Ticker Symbol | VGHCX | VGHAX | |
| Expense Ratio1 | 0.35% | 0.30% | |
| 30-Day SEC Yield | 1.53% | 1.58% | |
| Portfolio Characteristics | |||
| MSCI | DJ | ||
| ACWI | U.S. Total | ||
| Health | Market | ||
| Fund | Care | Index | |
| Number of Stocks | 78 | 137 | 3,753 |
| Median Market Cap | $24.8B | $50.9B | $31.4B |
| Price/Earnings Ratio | 14.8x | 17.0x | 16.3x |
| Price/Book Ratio | 2.2x | 2.5x | 2.2x |
| Return on Equity | 20.3% | 21.8% | 19.0% |
| Earnings Growth Rate | 8.1% | 7.3% | 6.3% |
| Dividend Yield | 2.4% | 2.8% | 1.8% |
| Foreign Holdings | 21.1% | 43.8% | 0.0% |
| Turnover Rate | |||
| (Annualized) | 5% | — | — |
| Short-Term Reserves | 9.8% | — | — |
| Volatility Measures | ||
| Spliced | DJ | |
| Health | U.S. Total | |
| Care | Market | |
| Index | Index | |
| R-Squared | 0.95 | 0.68 |
| Beta | 0.97 | 0.66 |
| These measures show the degree and timing of the fund’s fluctuations compared with the indexes over 36 months. | ||
| Ten Largest Holdings (% of total net assets) | ||
| Merck & Co. Inc. | Pharmaceuticals | 5.4% |
| Forest Laboratories Inc. | Pharmaceuticals | 4.4 |
| UnitedHealth Group Inc. | Managed Health | |
| Care | 4.3 | |
| Roche Holding AG | Pharmaceuticals | 4.1 |
| McKesson Corp. | Health Care | |
| Distributors | 3.7 | |
| Pfizer Inc. | Pharmaceuticals | 3.5 |
| Abbott Laboratories | Pharmaceuticals | 3.4 |
| AstraZeneca PLC | Pharmaceuticals | 3.3 |
| Amgen Inc. | Biotechnology | 3.0 |
| Eli Lilly & Co. | Pharmaceuticals | 3.0 |
| Top Ten | 38.1% | |
| The holdings listed exclude any temporary cash investments and equity index products. | ||
| Market Diversification (% of equity exposure) | ||
| Europe | ||
| Switzerland | 6.6% | |
| United Kingdom | 4.3 | |
| France | 1.0 | |
| Other | 2.0 | |
| Subtotal | 13.9% | |
| Pacific | ||
| Japan | 9.3% | |
| Middle East | 0.2% | |
| North America | ||
| United States | 76.6% | |
1 The expense ratios shown are from the prospectus dated May 26, 2011, and represent estimated costs for the current fiscal year. For the six months ended July 31, 2011, the annualized expense ratios were 0.35% for Investor Shares and 0.30% for Admiral Shares.
8
Health Care Fund
| Subindustry Diversification (% of equity exposure) | ||
| MSCI | ||
| ACWI | ||
| Health | ||
| Fund | Care | |
| Biotechnology | 8.4% | 7.8% |
| Consumer Staples | 2.0 | 0.0 |
| Health Care Distributors | 6.0 | 2.6 |
| Health Care Equipment | 8.9 | 11.2 |
| Health Care Facilities | 1.9 | 0.4 |
| Health Care Services | 3.3 | 4.8 |
| Health Care Supplies | 0.5 | 1.1 |
| Health Care Technology | 2.0 | 0.4 |
| Industrials | 0.4 | 0.0 |
| Life Sciences Tools & | ||
| Services | 0.3 | 3.1 |
| Managed Health Care | 14.5 | 5.2 |
| Materials | 1.2 | 0.0 |
| Pharmaceuticals | 50.6 | 63.4 |
9
Health Care Fund
Performance Summary
All of the returns in this report represent past performance, which is not a guarantee of future results that may be achieved by the fund. (Current performance may be lower or higher than the performance data cited. For performance data current to the most recent month-end, visit our website at vanguard.com/performance.) Note, too, that both investment returns and principal value can fluctuate widely, so an investor’s shares, when sold, could be worth more or less than their original cost. The returns shown do not reflect taxes that a shareholder would pay on fund distributions or on the sale of fund shares.
Fiscal-Year Total Returns (%): January 31, 2001, Through July 31, 2011
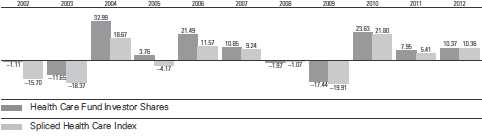
Note: For 2012, performance data reflect the six months ended July 31, 2011.
Average Annual Total Returns: Periods Ended June 30, 2011
This table presents returns through the latest calendar quarter—rather than through the end of the fiscal period.
Securities and Exchange Commission rules require that we provide this information.
| Inception | One | Five | Ten | |
| Date | Year | Years | Years | |
| Investor Shares | 5/23/1984 | 30.60% | 6.40% | 7.16% |
| Admiral Shares | 11/12/2001 | 30.65 | 6.47 | 7.751 |
| 1 Return since inception. | ||||
Vanguard fund returns do not reflect the 1% fee on redemptions of shares held for less than one year.
See Financial Highlights for dividend and capital gains information.
10
Health Care Fund
Financial Statements (unaudited)
Statement of Net Assets
As of July 31, 2011
The fund reports a complete list of its holdings in regulatory filings four times in each fiscal year, at the quarter-ends. For the second and fourth fiscal quarters, the lists appear in the fund’s semiannual and annual reports to shareholders. For the first and third fiscal quarters, the fund files the lists with the Securities and Exchange Commission on Form N-Q. Shareholders can look up the fund’s Forms N-Q on the SEC’s website at sec.gov. Forms N-Q may also be reviewed and copied at the SEC’s Public Reference Room (see the back cover of this report for further information).
| Market | |||
| Value | |||
| Shares | ($000) | ||
| Common Stocks (90.5%) | |||
| United States (69.3%) | |||
| Biotechnology (7.6%) | |||
| * | Amgen Inc. | 11,810,355 | 646,026 |
| * | Gilead Sciences Inc. | 8,007,100 | 339,181 |
| * | Biogen Idec Inc. | 2,270,000 | 231,245 |
| * | Vertex Pharmaceuticals | ||
| Inc. | 2,302,800 | 119,423 | |
| * | Cephalon Inc. | 1,017,230 | 81,317 |
| * | United Therapeutics Corp. | 1,004,500 | 57,638 |
| * | Onyx Pharmaceuticals Inc. | 1,307,200 | 43,112 |
| * | Cubist Pharmaceuticals | ||
| Inc. | 1,186,542 | 40,307 | |
| * | Regeneron | ||
| Pharmaceuticals Inc. | 600,000 | 31,836 | |
| * | Ironwood | ||
| Pharmaceuticals Inc. | 2,000,000 | 29,900 | |
| * | Amylin | ||
| Pharmaceuticals Inc. | 1,107,200 | 13,187 | |
| 1,633,172 | |||
| Chemicals (1.1%) | |||
| Sigma-Aldrich Corp. | 3,380,000 | 226,798 | |
| Food & Staples Retailing (1.8%) | |||
| Walgreen Co. | 9,744,700 | 380,433 | |
| Health Care Equipment & Supplies (8.5%) | |||
| St. Jude Medical Inc. | 8,710,900 | 405,057 | |
| Medtronic Inc. | 8,301,100 | 299,255 | |
| Becton Dickinson and Co. | 3,102,500 | 259,400 | |
| Baxter International Inc. | 3,700,000 | 215,229 | |
| * | Boston Scientific Corp. | 24,600,000 | 176,136 |
| * | CareFusion Corp. | 4,434,654 | 117,030 |
| * | Zimmer Holdings Inc. | 1,600,000 | 96,032 |
| DENTSPLY | |||
| International Inc. | 2,485,400 | 94,172 | |
| Market | |||
| Value | |||
| Shares | ($000) | ||
| Covidien plc | 1,750,000 | 88,882 | |
| *,^ | NuVasive Inc. | 1,680,103 | 48,085 |
| STERIS Corp. | 803,083 | 28,100 | |
| 1,827,378 | |||
| Health Care Providers & Services (23.1%) | |||
| UnitedHealth Group Inc. | 18,685,100 | 927,342 | |
| McKesson Corp. | 9,889,900 | 802,269 | |
| WellPoint Inc. | 7,602,400 | 513,542 | |
| Humana Inc. | 6,360,094 | 474,336 | |
| CIGNA Corp. | 7,510,600 | 373,803 | |
| Quest Diagnostics Inc. | 6,085,400 | 328,672 | |
| Cardinal Health Inc. | 6,236,708 | 272,918 | |
| *,1 | Coventry Health Care Inc. | 8,527,500 | 272,880 |
| * | Laboratory Corp. of | ||
| America Holdings | 2,681,360 | 243,360 | |
| Universal Health | |||
| Services Inc. Class B | 3,920,800 | 194,628 | |
| *,1 | Health Management | ||
| Associates Inc. Class A | 14,856,900 | 141,141 | |
| *,1 | Health Net Inc. | 4,663,458 | 131,136 |
| Aetna Inc. | 2,250,000 | 93,352 | |
| Owens & Minor Inc. | 3,000,000 | 91,500 | |
| * | Vanguard Health | ||
| Systems Inc. | 1,949,800 | 33,810 | |
| * | DaVita Inc. | 304,600 | 25,446 |
| * | WellCare Health Plans Inc. | 449,000 | 19,689 |
| * | Tenet Healthcare Corp. | 1,300,000 | 7,228 |
| 4,947,052 | |||
| Health Care Technology (1.8%) | |||
| * | Cerner Corp. | 5,900,000 | 392,291 |
| Life Sciences Tools & Services (0.3%) | |||
| * | Parexel International Corp. | 2,740,400 | 56,261 |
| Machinery (0.3%) | |||
| Pall Corp. | 1,404,600 | 69,640 | |
11
Health Care Fund
| Market | |||
| Value | |||
| Shares | ($000) | ||
| Pharmaceuticals (24.8%) | |||
| Merck & Co. Inc. | 33,830,248 | 1,154,626 | |
| *,1 | Forest Laboratories Inc. | 25,603,000 | 948,847 |
| Pfizer Inc. | 38,483,888 | 740,430 | |
| Abbott Laboratories | 14,300,000 | 733,876 | |
| Eli Lilly & Co. | 16,629,900 | 636,925 | |
| Bristol-Myers Squibb Co. | 11,028,361 | 316,073 | |
| Johnson & Johnson | 4,600,000 | 298,034 | |
| Perrigo Co. | 3,059,100 | 276,267 | |
| * | Watson | ||
| Pharmaceuticals Inc. | 1,750,000 | 117,478 | |
| * | Hospira Inc. | 1,095,070 | 55,980 |
| * | Salix Pharmaceuticals Ltd. | 1,000,000 | 38,780 |
| Warner Chilcott plc Class A | 232,200 | 4,881 | |
| 5,322,197 | |||
| Total United States | 14,855,222 | ||
| International (21.2%) | |||
| Belgium (0.6%) | |||
| UCB SA | 2,590,728 | 119,155 | |
| France (0.9%) | |||
| Sanofi | 1,871,976 | 145,454 | |
| Ipsen SA | 1,400,000 | 45,659 | |
| 191,113 | |||
| Germany (0.8%) | |||
| Bayer AG | 1,694,656 | 135,573 | |
| Fresenius Medical Care | |||
| AG & Co. KGaA | 611,950 | 46,966 | |
| 182,539 | |||
| Ireland (0.4%) | |||
| * | Elan Corp. plc ADR | 8,462,700 | 93,597 |
| Israel (0.2%) | |||
| Teva Pharmaceutical | |||
| Industries Ltd. ADR | 800,000 | 37,312 | |
| Japan (8.4%) | |||
| Astellas Pharma Inc. | 14,365,700 | 558,107 | |
| Takeda Pharmaceutical | |||
| Co. Ltd. | 5,649,900 | 269,489 | |
| Daiichi Sankyo Co. Ltd. | 13,001,500 | 268,674 | |
| ^ | Eisai Co. Ltd. | 5,793,700 | 235,152 |
| Shionogi & Co. Ltd. | 10,916,234 | 188,389 | |
| Mitsubishi Tanabe | |||
| Pharma Corp. | 7,100,000 | 128,642 | |
| Chugai Pharmaceutical | |||
| Co. Ltd. | 5,321,700 | 94,502 | |
| Ono Pharmaceutical | |||
| Co. Ltd. | 960,000 | 53,654 | |
| 1,796,609 | |||
| Market | ||
| Value | ||
| Shares | ($000) | |
| Switzerland (6.0%) | ||
| Roche Holding AG | 4,263,977 | 765,153 |
| Novartis AG | 4,869,880 | 298,534 |
| Roche Holding AG | ||
| (Bearer) | 664,320 | 123,994 |
| Novartis AG ADR | 1,461,400 | 89,438 |
| 1,277,119 | ||
| United Kingdom (3.9%) | ||
| AstraZeneca plc | 14,681,500 | 713,366 |
| GlaxoSmithKline plc ADR | 2,742,381 | 121,817 |
| 835,183 | ||
| Total International | 4,532,627 | |
| Total Common Stocks | ||
| (Cost $12,180,255) | 19,387,849 | |
| Temporary Cash Investments (10.3%) | ||
| Money Market Fund (0.3%) | ||
| 2,3 Vanguard Market | ||
| Liquidity Fund, 0.114% | 68,250,000 | 68,250 |
| Face | ||
| Amount | ||
| ($000) | ||
| Repurchase Agreements (8.1%) | ||
| Banc of America | ||
| Securities, LLC 0.180%, | ||
| 8/1/11 (Dated 7/29/11, | ||
| Repurchase Value | ||
| $28,800,000, collateralized | ||
| by Federal Home Loan | ||
| Mortgage Corp. 2.892%, | ||
| 1/1/41, and Federal | ||
| National Mortgage Assn. | ||
| 3.002%, 1/1/41) | 28,800 | 28,800 |
| BNP Paribas Securities | ||
| Corp. 0.200%, 8/1/11 | ||
| (Dated 7/29/11, | ||
| Repurchase Value | ||
| $333,006,000, | ||
| collateralized by Federal | ||
| Home Loan Mortgage | ||
| Corp. 4.000%–7.000%, | ||
| 12/1/22–7/1/41, and | ||
| Federal National Mortgage | ||
| Assn. 3.500%–7.000%, | ||
| 11/1/20–8/1/47) | 333,000 | 333,000 |
12
Health Care Fund
| Face | Market | |
| Amount | Value | |
| ($000) | ($000) | |
| Goldman Sachs & Co. | ||
| 0.190%, 8/1/11 (Dated | ||
| 7/29/11, Repurchase | ||
| Value $204,603,000, | ||
| collateralized by Federal | ||
| Home Loan Mortgage | ||
| Corp. 4.500%–5.000%, | ||
| 5/1/31–5/1/41, and | ||
| Federal National Mortgage | ||
| Assn. 3.500%–5.000%, | ||
| 2/1/26–11/1/40) | 204,600 | 204,600 |
| HSBC Bank USA 0.200%, | ||
| 8/1/11 (Dated 7/29/11, | ||
| Repurchase Value | ||
| $416,207,000, collateralized | ||
| by Federal National Mortgage | ||
| Assn. 3.500%–6.000%, | ||
| 4/1/25–8/1/41) | 416,200 | 416,200 |
| Morgan Stanley 0.200%, | ||
| 8/1/11 (Dated 7/29/11, | ||
| Repurchase Value | ||
| $2,200,000, collateralized | ||
| by Federal National | ||
| Mortgage Assn. | ||
| 5.000%, 4/1/38) | 2,200 | 2,200 |
| Barclays Capital Inc. | ||
| 0.180%, 8/1/11 (Dated | ||
| 7/29/11, Repurchase Value | ||
| $258,204,000, collateralized | ||
| by Government National | ||
| Mortgage Assn. 4.500%, | ||
| 4/20/40–7/15/41) | 258,200 | 258,200 |
| Deutsche Bank Securities, Inc. | ||
| 0.200%, 8/1/11 (Dated | ||
| 7/29/11, Repurchase | ||
| Value $389,606,000, | ||
| collateralized by U.S. | ||
| Treasury Bond 2.000%– | ||
| 3.000%, 7/15/12–1/15/16) | 389,600 | 389,600 |
| UBS Securities LLC 0.200%, | ||
| 8/1/11 (Dated 7/29/11, | ||
| Repurchase Value | ||
| $112,002,000, | ||
| collateralized by Federal | ||
| National Mortgage Assn. | ||
| 4.500%, 3/1/41–5/1/41) | 112,000 | 112,000 |
| 1,744,600 | ||
| Face | Market | |
| Amount | Value | |
| ($000) | ($000) | |
| Commercial Paper (1.9%) | ||
| General Electric Capital | ||
| Services Inc., 0.120%, | ||
| 9/6/11 | 200,000 | 199,976 |
| General Electric Capital | ||
| Services Inc., 0.220%, | ||
| 12/12/11 | 200,000 | 199,834 |
| 399,810 | ||
| Total Temporary Cash Investments | ||
| (Cost $2,212,663) | 2,212,660 | |
| Total Investments (100.8%) | ||
| (Cost $14,392,918) | 21,600,509 | |
| Other Assets and Liabilities (-0.8%) | ||
| Other Assets | 44,741 | |
| Liabilities3 | (209,297) | |
| (164,556) | ||
| Net Assets (100%) | 21,435,953 | |
| Statement of Assets and Liabilities | ||
| Assets | ||
| Investments in Securities, at Value | 21,600,509 | |
| Accrued Income Receivable | 33,303 | |
| Other Assets | 11,438 | |
| Total Assets | 21,645,250 | |
| Liabilities | ||
| Payables for Investment | ||
| Securities Purchased | 48,529 | |
| Security Lending Collateral Payable | ||
| to Brokers | 68,250 | |
| Payables for Capital Shares Redeemed | 15,448 | |
| Other Liabilities | 77,070 | |
| Total Liabilities | 209,297 | |
| Net Assets | 21,435,953 | |
13
Health Care Fund
| At July 31, 2011, net assets consisted of: | |
| Amount | |
| ($000) | |
| Paid-in Capital | 13,511,294 |
| Undistributed Net Investment Income | 153,344 |
| Accumulated Net Realized Gains | 573,113 |
| Unrealized Appreciation (Depreciation) | |
| Investment Securities | 7,207,591 |
| Forward Currency Contracts | (14,071) |
| Foreign Currencies | 4,682 |
| Net Assets | 21,435,953 |
| Investor Shares—Net Assets | |
| Applicable to 66,215,701 outstanding | |
| $.001 par value shares of beneficial | |
| interest (unlimited authorization) | 9,015,907 |
| Net Asset Value Per Share— | |
| Investor Shares | $136.16 |
| Admiral Shares—Net Assets | |
| Applicable to 216,116,756 outstanding | |
| $.001 par value shares of beneficial | |
| interest (unlimited authorization) | 12,420,046 |
| Net Asset Value Per Share— | |
| Admiral Shares | $57.47 |
See Note A in Notes to Financial Statements.
* Non-income-producing security.
^ Part of security position is on loan to broker-dealers. The total value of securities on loan is $63,132,000.
1 Considered an affiliated company of the fund as the fund owns more than 5% of the outstanding voting securities of such company.
2 Affiliated money market fund available only to Vanguard funds and certain trusts and accounts managed by Vanguard. Rate shown is the 7-day yield.
3 Includes $68,250,000 of collateral received for securities on loan.
ADR—American Depositary Receipt.
See accompanying Notes, which are an integral part of the Financial Statements.
14
Health Care Fund
Statement of Operations
| Six Months Ended | |
| July 31, 2011 | |
| ($000) | |
| Investment Income | |
| Income | |
| Dividends1,2 | 238,911 |
| Interest | 1,159 |
| Security Lending | 2,411 |
| Total Income | 242,481 |
| Expenses | |
| Investment Advisory Fees—Note B | 15,836 |
| The Vanguard Group—Note C | |
| Management and Administrative—Investor Shares | 7,931 |
| Management and Administrative—Admiral Shares | 8,007 |
| Marketing and Distribution—Investor Shares | 788 |
| Marketing and Distribution—Admiral Shares | 954 |
| Custodian Fees | 233 |
| Shareholders’ Reports—Investor Shares | 64 |
| Shareholders’ Reports—Admiral Shares | 18 |
| Trustees’ Fees and Expenses | 22 |
| Total Expenses | 33,853 |
| Net Investment Income | 208,628 |
| Realized Net Gain (Loss) | |
| Investment Securities Sold2 | 573,530 |
| Foreign Currencies and Forward Currency Contracts | (3,541) |
| Realized Net Gain (Loss) | 569,989 |
| Change in Unrealized Appreciation (Depreciation) | |
| Investment Securities | 1,271,560 |
| Foreign Currencies and Forward Currency Contracts | (7,003) |
| Change in Unrealized Appreciation (Depreciation) | 1,264,557 |
| Net Increase (Decrease) in Net Assets Resulting from Operations | 2,043,174 |
1 Dividends are net of foreign withholding taxes of $13,168,000.
2 Dividend income and realized net gain (loss) from affiliated companies of the fund were $0 and $77,399,000, respectively.
See accompanying Notes, which are an integral part of the Financial Statements.
15
Health Care Fund
Statement of Changes in Net Assets
| Six Months Ended | Year Ended | |
| July 31, | January 31, | |
| 2011 | 2011 | |
| ($000) | ($000) | |
| Increase (Decrease) in Net Assets | ||
| Operations | ||
| Net Investment Income | 208,628 | 332,268 |
| Realized Net Gain (Loss) | 569,989 | 495,846 |
| Change in Unrealized Appreciation (Depreciation) | 1,264,557 | 664,193 |
| Net Increase (Decrease) in Net Assets Resulting from Operations | 2,043,174 | 1,492,307 |
| Distributions | ||
| Net Investment Income | ||
| Investor Shares | (8,503) | (137,642) |
| Admiral Shares | (12,352) | (186,814) |
| Realized Capital Gain1 | ||
| Investor Shares | (55,033) | (249,625) |
| Admiral Shares | (75,195) | (269,464) |
| Total Distributions | (151,083) | (843,545) |
| Capital Share Transactions | ||
| Investor Shares | (230,072) | (3,590,779) |
| Admiral Shares | (131,302) | 2,535,574 |
| Net Increase (Decrease) from Capital Share Transactions | (361,374) | (1,055,205) |
| Total Increase (Decrease) | 1,530,717 | (406,443) |
| Net Assets | ||
| Beginning of Period | 19,905,236 | 20,311,679 |
| End of Period2 | 21,435,953 | 19,905,236 |
1 Includes fiscal 2012 and 2011 short-term gain distributions totaling $13,034,000 and $15,575,000, respectively. Short-term gain distributions are treated as ordinary income dividends for tax purposes.
2 Net Assets—End of Period includes undistributed (overdistributed) net investment income of $153,344,000 and ($36,363,000).
See accompanying Notes, which are an integral part of the Financial Statements.
16
Health Care Fund
Financial Highlights
Investor Shares
| Six Months | ||||||
| Ended | ||||||
| For a Share Outstanding | July 31, | Year Ended January 31, | ||||
| Throughout Each Period | 2011 | 2011 | 2010 | 2009 | 2008 | 2007 |
| Net Asset Value, Beginning of Period | $124.30 | $120.06 | $99.12 | $133.80 | $149.69 | $143.39 |
| Investment Operations | ||||||
| Net Investment Income | 1.181 | 2.046 | 1.902 | 1.998 | 2.7661 | 1.953 |
| Net Realized and Unrealized Gain (Loss) | ||||||
| on Investments | 11.628 | 7.404 | 21.530 | (25.229) | (5.317) | 13.107 |
| Total from Investment Operations | 12.809 | 9.450 | 23.432 | (23.231) | (2.551) | 15.060 |
| Distributions | ||||||
| Dividends from Net Investment Income | (.127) | (2.007) | (1.761) | (1.925) | (2.747) | (2.100) |
| Distributions from Realized Capital Gains | (.822) | (3.203) | (.731) | (9.524) | (10.592) | (6.660) |
| Total Distributions | (.949) | (5.210) | (2.492) | (11.449) | (13.339) | (8.760) |
| Net Asset Value, End of Period | $136.16 | $124.30 | $120.06 | $99.12 | $133.80 | $149.69 |
| Total Return2 | 10.37% | 7.95% | 23.63% | -17.44% | -1.97% | 10.85% |
| Ratios/Supplemental Data | ||||||
| Net Assets, End of Period (Millions) | $9,016 | $8,447 | $11,692 | $10,478 | $14,314 | $16,662 |
| Ratio of Total Expenses to | ||||||
| Average Net Assets | 0.35% | 0.35% | 0.36% | 0.29% | 0.26% | 0.25% |
| Ratio of Net Investment Income to | ||||||
| Average Net Assets | 1.95% | 1.67% | 1.73% | 1.64% | 1.78%1 | 1.33% |
| Portfolio Turnover Rate | 5% | 9% | 6% | 12% | 9% | 8% |
The expense ratio, net income ratio, and turnover rate for the current period have been annualized.
1 Net investment income per share and the ratio of net investment income to average net assets include $0.585 and 0.40%, respectively, resulting from a special dividend from Health Management Associates Class A in March 2007.
2 Total returns do not include transaction or account service fees that may have applied in the periods shown. Fund prospectuses provide information about any applicable transaction or account service fees.
See accompanying Notes, which are an integral part of the Financial Statements.
17
Health Care Fund
Financial Highlights
Admiral Shares
| Six Months | ||||||
| Ended | ||||||
| For a Share Outstanding | July 31, | Year Ended January 31, | ||||
| Throughout Each Period | 2011 | 2011 | 2010 | 2009 | 2008 | 2007 |
| Net Asset Value, Beginning of Period | $52.45 | $50.67 | $41.83 | $56.47 | $63.19 | $60.52 |
| Investment Operations | ||||||
| Net Investment Income | .513 | .891 | .835 | .879 | 1.2201 | .877 |
| Net Realized and Unrealized Gain (Loss) | ||||||
| on Investments | 4.911 | 3.115 | 9.091 | (10.648) | (2.257) | 5.542 |
| Total from Investment Operations | 5.424 | 4.006 | 9.926 | (9.769) | (1.037) | 6.419 |
| Distributions | ||||||
| Dividends from Net Investment Income | (.057) | (.874) | (.777) | (.852) | (1.212) | (.938) |
| Distributions from Realized Capital Gains | (.347) | (1.352) | (.309) | (4.019) | (4.471) | (2.811) |
| Total Distributions | (.404) | (2.226) | (1.086) | (4.871) | (5.683) | (3.749) |
| Net Asset Value, End of Period | $57.47 | $52.45 | $50.67 | $41.83 | $56.47 | $63.19 |
| Total Return2 | 10.40% | 7.99% | 23.72% | -17.38% | -1.90% | 10.96% |
| Ratios/Supplemental Data | ||||||
| Net Assets, End of Period (Millions) | $12,420 | $11,459 | $8,619 | $7,576 | $10,513 | $10,819 |
| Ratio of Total Expenses to | ||||||
| Average Net Assets | 0.30% | 0.30% | 0.29% | 0.22% | 0.18% | 0.17% |
| Ratio of Net Investment Income to | ||||||
| Average Net Assets | 2.00% | 1.72% | 1.80% | 1.71% | 1.86%1 | 1.41% |
| Portfolio Turnover Rate | 5% | 9% | 6% | 12% | 9% | 8% |
The expense ratio, net income ratio, and turnover rate for the current period have been annualized.
1 Net investment income per share and the ratio of net investment income to average net assets include $0.247 and 0.40%, respectively, resulting from a special dividend from Health Management Associates Class A in March 2007.
2 Total returns do not include transaction fees that may have applied in the periods shown. Fund prospectuses provide information about any applicable transaction fees.
See accompanying Notes, which are an integral part of the Financial Statements.
18
Health Care Fund
Notes to Financial Statements
Vanguard Health Care Fund is registered under the Investment Company Act of 1940 as an open-end investment company, or mutual fund. The fund invests in securities of foreign issuers, which may subject it to investment risks not normally associated with investing in securities of U.S. corporations. The fund offers two classes of shares: Investor Shares and Admiral Shares. Investor Shares are available to any investor who meets the fund’s minimum purchase requirements. Admiral Shares are designed for investors who meet certain administrative, service, and account-size criteria.
A. The following significant accounting policies conform to generally accepted accounting principles for U.S. mutual funds. The fund consistently follows such policies in preparing its financial statements.
1. Security Valuation: Securities are valued as of the close of trading on the New York Stock Exchange (generally 4 p.m., Eastern time) on the valuation date. Equity securities are valued at the latest quoted sales prices or official closing prices taken from the primary market in which each security trades; such securities not traded on the valuation date are valued at the mean of the latest quoted bid and asked prices. Securities for which market quotations are not readily available, or whose values have been affected by events occurring before the fund’s pricing time but after the close of the securities’ primary markets, are valued at their fair values calculated according to procedures adopted by the board of trustees. These procedures include obtaining quotations from an independent pricing service, monitoring news to identify significant market- or security-specific events, and evaluating changes in the values of foreign market proxies (for example, ADRs, futures contracts, or exchange-traded funds), between the time the foreign markets close and the fund’s pricing time. When fair-value pricing is employed, the prices of securities used by a fund to calculate its net asset value may differ from quoted or published prices for the same securities. Investments in Vanguard Market Liquidity Fund are valued at that fund’s net asset value. Temporary cash investments acquired over 60 days to maturity are valued using the latest bid prices or using valuations based on a matrix system (which considers such factors as security prices, yields, maturities, and ratings), both as furnished by independent pricing services. Other temporary cash investments are valued at amortized cost, which approximates market value.
2. Foreign Currency: Securities and other assets and liabilities denominated in foreign currencies are translated into U.S. dollars using exchange rates obtained from an independent third party as of the fund’s pricing time on the valuation date. Realized gains (losses) and unrealized appreciation (depreciation) on investment securities include the effects of changes in exchange rates since the securities were purchased, combined with the effects of changes in security prices. Fluctuations in the value of other assets and liabilities resulting from changes in exchange rates are recorded as unrealized foreign currency gains (losses) until the assets or liabilities are settled in cash, at which time they are recorded as realized foreign currency gains (losses).
3. Forward Currency Contracts: The fund enters into forward currency contracts to protect the value of securities and related receivables and payables against changes in future foreign exchange rates. The fund’s risks in using these contracts include movement in the values of the foreign currencies relative to the U.S. dollar and the ability of the counterparties to fulfill their obligations under the contracts. Counterparty risk is mitigated by entering into forward currency contracts only with highly rated counterparties, by a master netting arrangement between the fund and the counterparty, and by the
19
Health Care Fund
posting of collateral by the counterparty. The forward currency contracts contain provisions whereby a counterparty may terminate open contracts if the fund’s net assets decline below a certain level, triggering a payment by the fund if the fund is in a net liability position at the time of the termination. The payment amount would be reduced by any collateral the fund has posted. Any securities posted as collateral for open contracts are noted in the Statement of Net Assets.
Forward currency contracts are valued at their quoted daily prices obtained from an independent third party, adjusted for currency risk based on the expiration date of each contract. The aggregate principal amounts of the contracts are not recorded in the Statement of Net Assets. Fluctuations in the value of the contracts are recorded in the Statement of Net Assets as an asset (liability) and in the Statement of Operations as unrealized appreciation (depreciation) until the contracts are closed, when they are recorded as realized forward currency contract gains (losses).
4. Repurchase Agreements: The fund invests in repurchase agreements. Securities pledged as collateral for repurchase agreements are held by a custodian bank until the agreements mature. Each agreement requires that the market value of the collateral be sufficient to cover payments of interest and principal; however, in the event of default or bankruptcy by the other party to the agreement, retention of the collateral may be subject to legal proceedings.
5. Federal Income Taxes: The fund intends to continue to qualify as a regulated investment company and distribute all of its taxable income. Management has analyzed the fund’s tax positions taken for all open federal income tax years (January 31, 2008–2011), and for the period ended July 31, 2011, and has concluded that no provision for federal income tax is required in the fund’s financial statements.
6. Distributions: Distributions to shareholders are recorded on the ex-dividend date.
7. Security Lending: The fund may lend its securities to qualified institutional borrowers to earn additional income. Security loans are required to be secured at all times by collateral at least equal to the market value of securities loaned. The fund invests cash collateral received in Vanguard Market Liquidity Fund, and records a liability for the return of the collateral, during the period the securities are on loan. Security lending income represents fees charged to borrowers plus income earned on investing cash collateral, less expenses associated with the loan.
8. Other: Dividend income is recorded on the ex-dividend date. Interest income is accrued daily. Premiums and discounts on debt securities purchased are amortized and accreted, respectively, to interest income over the lives of the respective securities. Security transactions are accounted for on the date securities are bought or sold. Costs used to determine realized gains (losses) on the sale of investment securities are those of the specific securities sold. Fees assessed on redemptions of capital shares are credited to paid-in capital.
Each class of shares has equal rights as to assets and earnings, except that each class separately bears certain class-specific expenses related to maintenance of shareholder accounts (included in Management and Administrative expenses) and shareholder reporting. Marketing and distribution expenses are allocated to each class of shares based on a method approved by the board of trustees. Income, other non-class-specific expenses, and gains and losses on investments are allocated to each class of shares based on its relative net assets.
20
Health Care Fund
B. Wellington Management Company, LLP, provides investment advisory services to the fund for a fee calculated at an annual percentage rate of average net assets. For the six months ended July 31, 2011, the investment advisory fee represented an effective annual rate of 0.15% of the fund’s average net assets.
C. The Vanguard Group furnishes at cost corporate management, administrative, marketing, and distribution services. The costs of such services are allocated to the fund under methods approved by the board of trustees. The fund has committed to provide up to 0.40% of its net assets in capital contributions to Vanguard. At July 31, 2011, the fund had contributed capital of $3,494,000 to Vanguard (included in Other Assets), representing 0.02% of the fund’s net assets and 1.40% of Vanguard’s capitalization. The fund’s trustees and officers are also directors and officers of Vanguard.
D. Various inputs may be used to determine the value of the fund’s investments. These inputs are summarized in three broad levels for financial statement purposes. The inputs or methodologies used to value securities are not necessarily an indication of the risk associated with investing in those securities.
Level 1—Quoted prices in active markets for identical securities.
Level 2—Other significant observable inputs (including quoted prices for similar securities, interest rates, prepayment speeds, credit risk, etc.).
Level 3—Significant unobservable inputs (including the fund’s own assumptions used to determine the fair value of investments).
The following table summarizes the fund’s investments as of July 31, 2011, based on the inputs used to value them:
| Level 1 | Level 2 | Level 3 | |
| Investments | ($000) | ($000) | ($000) |
| Common Stocks—U.S. | 14,855,222 | — | — |
| Common Stocks—International | 342,164 | 4,190,463 | — |
| Temporary Cash Investments | 68,250 | 2,144,410 | — |
| Forward Currency Contracts—Liabilities | — | (14,071) | — |
| Total | 15,265,636 | 6,320,802 | — |
At July 31, 2011, the fund had open forward currency contracts to receive and deliver currencies as follows. Unrealized appreciation (depreciation) on open forward currency contracts is treated as realized gain (loss) for tax purposes.
| Unrealized | ||||||
| Contract | Appreciation | |||||
| Settlement | Contract Amount (000) | (Depreciation) | ||||
| Counterparty | Date | Receive | Deliver | ($000) | ||
| UBS AG | 8/25/11 | USD | 116,540 | JPY | 9,531,218 | (7,035) |
| Barclays Bank plc | 8/25/11 | USD | 116,540 | JPY | 9,531,218 | (7,036) |
JPY—Japanese yen.
USD—U.S. dollar.
21
Health Care Fund
E. Distributions are determined on a tax basis and may differ from net investment income and realized capital gains for financial reporting purposes. Differences may be permanent or temporary. Permanent differences are reclassified among capital accounts in the financial statements to reflect their tax character. Temporary differences arise when certain items of income, expense, gain, or loss are recognized in different periods for financial statement and tax purposes; these differences will reverse at some time in the future. Differences in classification may also result from the treatment of short-term gains as ordinary income for tax purposes. The fund’s tax-basis capital gains and losses are determined only at the end of each fiscal year.
During the six months ended July 31, 2011, the fund realized net foreign currency gains of $1,934,000, which increased distributable net income for tax purposes; accordingly, such gains have been reclassified from accumulated net realized gains to undistributed net investment income. Certain of the fund’s investments are in securities considered to be “passive foreign investment companies,” for which any unrealized appreciation and/or realized gains are required to be included in distributable net income for tax purposes. Passive foreign investment companies held at July 31, 2011, had unrealized appreciation of $15,895,000, as of January 31, 2011, the most recent mark-to-market date for tax purposes. This amount has been distributed and is reflected in the balance of undistributed net investment income.
At July 31, 2011, the cost of investment securities for tax purposes was $14,408,813,000. Net unrealized appreciation of investment securities for tax purposes was $7,191,696,000, consisting of unrealized gains of $7,625,553,000 on securities that had risen in value since their purchase and $433,857,000 in unrealized losses on securities that had fallen in value since their purchase.
F. During the six months ended July 31, 2011, the fund purchased $530,774,000 of investment securities and sold $1,510,217,000 of investment securities, other than temporary cash investments.
G. Capital share transactions for each class of shares were:
| Six Months Ended | Year Ended | |||
| July 31, 2011 | January 31, 2011 | |||
| Amount | Shares | Amount | Shares | |
| ($000) | (000) | ($000) | (000) | |
| Investor Shares | ||||
| Issued | 331,831 | 2,450 | 498,477 | 4,155 |
| Issued in Lieu of Cash Distributions | 60,769 | 482 | 369,784 | 3,003 |
| Redeemed1 | (622,672) | (4,672) | (4,459,040) | (36,589) |
| Net Increase (Decrease)—Investor Shares | (230,072) | (1,740) | (3,590,779) | (29,431) |
| Admiral Shares | ||||
| Issued | 343,684 | 6,049 | 3,306,725 | 63,748 |
| Issued in Lieu of Cash Distributions | 80,099 | 1,507 | 414,764 | 7,993 |
| Redeemed1 | (555,085) | (9,893) | (1,185,915) | (23,405) |
| Net Increase (Decrease)—Admiral Shares | (131,302) | (2,337) | 2,535,574 | 48,336 |
| 1 Net of redemption fees for fiscal 2012 and 2011 of $218,000 and $727,000, respectively (fund totals). | ||||
22
Health Care Fund
H. Certain of the fund’s investments are in companies that are considered to be affiliated companies of the fund because the fund owns more than 5% of the outstanding voting securities of the company. Transactions during the period in securities of these companies were as follows:
| Current Period Transactions | |||||
| Jan. 31, 2011 | Proceeds from | July 31, 2011 | |||
| Market | Purchases | Securities | Dividend | Market | |
| Value | at Cost | Sold | Income | Value | |
| ($000) | ($000) | ($000) | ($000) | ($000) | |
| Cephalon Inc. | 337,419 | 5,721 | 375,219 | — | NA1 |
| Coventry Health Care Inc. | 258,566 | — | 3,203 | — | 272,880 |
| Forest Laboratories Inc. | 914,668 | — | 94,611 | — | 948,847 |
| Health Management | |||||
| Associates Inc. Class A | 131,558 | 6,851 | 2,845 | — | 141,141 |
| Health Net Inc. | NA2 | — | — | — | 131,136 |
| NuVasive Inc. | 59,526 | — | 14,774 | — | NA1 |
| 1,701,737 | 1,494,004 | ||||
1 Not applicable—At July 31, 2011, the security was still held, but the issuer was no longer an affiliated company of the fund.
2 Not applicable—At January 31, 2011, the issuer was not an affiliated company of the fund.
I. In preparing the financial statements as of July 31, 2011, management considered the impact of subsequent events for potential recognition or disclosure in these financial statements.
23
About Your Fund’s Expenses
As a shareholder of the fund, you incur ongoing costs, which include costs for portfolio management, administrative services, and shareholder reports (like this one), among others. Operating expenses, which are deducted from a fund’s gross income, directly reduce the investment return of the fund.
A fund’s expenses are expressed as a percentage of its average net assets. This figure is known as the expense ratio. The following examples are intended to help you understand the ongoing costs (in dollars) of investing in your fund and to compare these costs with those of other mutual funds. The examples are based on an investment of $1,000 made at the beginning of the period shown and held for the entire period.
The accompanying table illustrates your fund’s costs in two ways:
• Based on actual fund return. This section helps you to estimate the actual expenses that you paid over the period. The ”Ending Account Value“ shown is derived from the fund‘s actual return, and the third column shows the dollar amount that would have been paid by an investor who started with $1,000 in the fund. You may use the information here, together with the amount you invested, to estimate the expenses that you paid over the period.
To do so, simply divide your account value by $1,000 (for example, an $8,600 account value divided by $1,000 = 8.6), then multiply the result by the number given for your fund under the heading ”Expenses Paid During Period.“
• Based on hypothetical 5% yearly return. This section is intended to help you compare your fund‘s costs with those of other mutual funds. It assumes that the fund had a yearly return of 5% before expenses, but that the expense ratio is unchanged. In this case—because the return used is not the fund’s actual return—the results do not apply to your investment. The example is useful in making comparisons because the Securities and Exchange Commission requires all mutual funds to calculate expenses based on a 5% return. You can assess your fund’s costs by comparing this hypothetical example with the hypothetical examples that appear in shareholder reports of other funds.
Note that the expenses shown in the table are meant to highlight and help you compare ongoing costs only and do not reflect transaction costs incurred by the fund for buying and selling securities. Further, the expenses do not include any purchase, redemption, or account service fees described in the fund prospectus. If such fees were applied to your account, your costs would be higher. Your fund does not carry a “sales load.”
The calculations assume no shares were bought or sold during the period. Your actual costs may have been higher or lower, depending on the amount of your investment and the timing of any purchases or redemptions.
You can find more information about the fund’s expenses, including annual expense ratios, in the Financial Statements section of this report. For additional information on operating expenses and other shareholder costs, please refer to your fund’s current prospectus.
24
| Six Months Ended July 31, 2011 | |||
| Beginning | Ending | Expenses | |
| Account Value | Account Value | Paid During | |
| Health Care Fund | 1/31/2011 | 7/31/2011 | Period |
| Based on Actual Fund Return | |||
| Investor Shares | $1,000.00 | $1,103.67 | $1.83 |
| Admiral Shares | 1,000.00 | 1,104.04 | 1.57 |
| Based on Hypothetical 5% Yearly Return | |||
| Investor Shares | $1,000.00 | $1,023.06 | $1.76 |
| Admiral Shares | 1,000.00 | 1,023.31 | 1.51 |
The calculations are based on expenses incurred in the most recent six-month period. The fund’s annualized six-month expense ratios for that period are 0.35% for Investor Shares and 0.30% for Admiral Shares. The dollar amounts shown as “Expenses Paid” are equal to the annualized expense ratio multiplied by the average account value over the period, multiplied by the number of days in the most recent six-month period, then divided by the number of days in the most recent 12-month period.
25
Trustees Approve Advisory Agreement
The board of trustees of Vanguard Health Care Fund has renewed the fund’s investment advisory agreement with Wellington Management Company, LLP. The board determined that the retention of the advisor was in the best interests of the fund and its shareholders.
The board based its decision upon an evaluation of the advisor’s investment staff, portfolio management process, and performance. The trustees considered the factors discussed below, among others. However, no single factor determined whether the board approved the agreement. Rather, it was the totality of the circumstances that drove the board’s decision.
Nature, extent, and quality of services
The board considered the quality of the fund’s investment management over both the short and long term and the organizational depth and stability of the advisory firm. The board noted that Wellington Management, founded in 1928, is among the nation’s oldest and most respected institutional investment managers. Edward P. Owens has managed the Health Care Fund since its inception in 1984 and Jean M. Hynes has co-managed the fund since 2008. They are aided by a team of three experienced health care analysts. This health care team uses intensive fundamental analysis to identify companies with high-quality balance sheets, strong management, and the potential for new products that lead to above-average growth in revenue and earnings. The advisor invests in stocks broadly representing the health care industry, seeking to maintain exposure across five primary subsectors: health services, medical products, specialty pharmaceuticals, major pharmaceuticals, and international markets.
The board concluded that the advisor’s experience, stability, depth, and performance, among other factors, warranted continuation of the advisory agreement.
Investment performance
The board considered the short- and long-term performance of the fund, including any periods of outperformance or underperformance of a relevant benchmark and peer group. The board concluded that the advisor has carried out the fund’s investment strategy in disciplined fashion, and noted that the fund has outperformed its benchmark and peer group over the short and long term. Information about the fund’s most recent performance can be found in the Performance Summary section of this report.
Cost
The board concluded that the fund’s expense ratio was well below the average expense ratio charged by funds in its peer group and that the fund’s advisory fee rate was also well below its peer-group average. Information about the fund’s expenses appears in the About Your Fund’s Expenses section of this report as well as in the Financial Statements section, which also includes information about the advisory fee rate.
The board did not consider profitability of Wellington Management in determining whether to approve the advisory fee, because Wellington Management is independent of Vanguard, and the advisory fee is the result of arm’s-length negotiations.
The benefit of economies of scale
The board concluded that the fund’s shareholders benefit from economies of scale because of breakpoints in the fund’s advisory fee schedule. The breakpoints reduce the effective rate of the fee as the fund’s assets increase.
The board will consider whether to renew the advisory agreement again after a one-year period.
26
Glossary
30-Day SEC Yield. A fund’s 30-day SEC yield is derived using a formula specified by the U.S. Securities and Exchange Commission. Under the formula, data related to the fund’s security holdings in the previous 30 days are used to calculate the fund’s hypothetical net income for that period, which is then annualized and divided by the fund’s estimated average net assets over the calculation period. For the purposes of this calculation, a security’s income is based on its current market yield to maturity (in the case of bonds), its actual income (for asset-backed securities), or its projected dividend yield (for stocks). Because the SEC yield represents hypothetical annualized income, it will differ—at times significantly—from the fund’s actual experience. As a result, the fund’s income distributions may be higher or lower than implied by the SEC yield.
Beta. A measure of the magnitude of a fund’s past share-price fluctuations in relation to the ups and downs of a given market index. The index is assigned a beta of 1.00. Compared with a given index, a fund with a beta of 1.20 typically would have seen its share price rise or fall by 12% when the index rose or fell by 10%. For this report, beta is based on returns over the past 36 months for both the fund and the index. Note that a fund’s beta should be reviewed in conjunction with its R-squared (see definition). The lower the R-squared, the less correlation there is between the fund and the index, and the less reliable beta is as an indicator of volatility.
Dividend Yield. Dividend income earned by stocks, expressed as a percentage of the aggregate market value (or of net asset value, for a fund). The yield is determined by dividing the amount of the annual dividends by the aggregate value (or net asset value) at the end of the period. For a fund, the dividend yield is based solely on stock holdings and does not include any income produced by other investments.
Earnings Growth Rate. The average annual rate of growth in earnings over the past five years for the stocks now in a fund.
Equity Exposure. A measure that reflects a fund’s investments in stocks and stock futures. Any holdings in short-term reserves are excluded.
Expense Ratio. The percentage of a fund’s average net assets used to pay its annual administrative and advisory expenses. These expenses directly reduce returns to investors.
Foreign Holdings. The percentage of a fund represented by securities or depositary receipts of companies based outside the United States.
Inception Date. The date on which the assets of a fund (or one of its share classes) are first invested in accordance with the fund’s investment objective. For funds with a subscription period, the inception date is the day after that period ends. Investment performance is measured from the inception date.
Median Market Cap. An indicator of the size of companies in which a fund invests; the midpoint of market capitalization (market price x shares outstanding) of a fund’s stocks, weighted by the proportion of the fund’s assets invested in each stock. Stocks representing half of the fund’s assets have market capitalizations above the median, and the rest are below it.
Price/Book Ratio. The share price of a stock divided by its net worth, or book value, per share. For a fund, the weighted average price/book ratio of the stocks it holds.
27
Price/Earnings Ratio. The ratio of a stock’s current price to its per-share earnings over the past year. For a fund, the weighted average P/E of the stocks it holds. P/E is an indicator of market expectations about corporate prospects; the higher the P/E, the greater the expectations for a company’s future growth.
R-Squared. A measure of how much of a fund’s past returns can be explained by the returns from the market in general, as measured by a given index. If a fund’s total returns were precisely synchronized with an index’s returns, its R-squared would be 1.00. If the fund’s returns bore no relationship to the index’s returns, its R-squared would be 0. For this report, R-squared is based on returns over the past 36 months for both the fund and the index.
Return on Equity. The annual average rate of return generated by a company during the past five years for each dollar of shareholder’s equity (net income divided by shareholder’s equity). For a fund, the weighted average return on equity for the companies whose stocks it holds.
Short-Term Reserves. The percentage of a fund invested in highly liquid, short-term securities that can be readily converted to cash.
Turnover Rate. An indication of the fund’s trading activity. Funds with high turnover rates incur higher transaction costs and may be more likely to distribute capital gains (which may be taxable to investors). The turnover rate excludes in-kind transactions, which have minimal impact on costs.
28
This page intentionally left blank.
This page intentionally left blank.
This page intentionally left blank.
The People Who Govern Your Fund
The trustees of your mutual fund are there to see that the fund is operated and managed in your best interests since, as a shareholder, you are a part owner of the fund. Your fund’s trustees also serve on the board of directors of The Vanguard Group, Inc., which is owned by the Vanguard funds and provides services to them on an at-cost basis.
A majority of Vanguard’s board members are independent, meaning that they have no affiliation with Vanguard or the funds they oversee, apart from the sizable personal investments they have made as private individuals. The independent board members have distinguished backgrounds in business, academia, and public service. Each of the trustees and executive officers oversees 178 Vanguard funds.
The following table provides information for each trustee and executive officer of the fund. More information about the trustees is in the Statement of Additional Information, which can be obtained, without charge, by contacting Vanguard at 800-662-7447, or online at vanguard.com.
| Interested Trustee1 | and President (2006–2008) of Rohm and Haas Co. |
| (chemicals); Director of Tyco International, Ltd. | |
| F. William McNabb III | (diversified manufacturing and services) and Hewlett- |
| Born 1957. Trustee Since July 2009. Chairman of the | Packard Co. (electronic computer manufacturing); |
| Board. Principal Occupation(s) During the Past Five | Senior Advisor at New Mountain Capital; Trustee |
| Years: Chairman of the Board of The Vanguard Group, | of The Conference Board; Member of the Board of |
| Inc., and of each of the investment companies served | Managers of Delphi Automotive LLP (automotive |
| by The Vanguard Group, since January 2010; Director | components). |
| of The Vanguard Group since 2008; Chief Executive | |
| Officer and President of The Vanguard Group and of | Amy Gutmann |
| each of the investment companies served by The | Born 1949. Trustee Since June 2006. Principal |
| Vanguard Group since 2008; Director of Vanguard | Occupation(s) During the Past Five Years: President |
| Marketing Corporation; Managing Director of The | of the University of Pennsylvania; Christopher H. |
| Vanguard Group (1995–2008). | Browne Distinguished Professor of Political Science |
| in the School of Arts and Sciences with secondary | |
| appointments at the Annenberg School for Commu- | |
| Independent Trustees | nication and the Graduate School of Education |
| of the University of Pennsylvania; Director of | |
| Emerson U. Fullwood | Carnegie Corporation of New York, Schuylkill River |
| Born 1948. Trustee Since January 2008. Principal | Development Corporation, and Greater Philadelphia |
| Occupation(s) During the Past Five Years: Executive | Chamber of Commerce; Trustee of the National |
| Chief Staff and Marketing Officer for North America | Constitution Center; Chair of the Presidential |
| and Corporate Vice President (retired 2008) of Xerox | Commission for the Study of Bioethical Issues. |
| Corporation (document management products and | |
| services); Executive in Residence and 2010 | JoAnn Heffernan Heisen |
| Distinguished Minett Professor at the Rochester | Born 1950. Trustee Since July 1998. Principal |
| Institute of Technology; Director of SPX Corporation | Occupation(s) During the Past Five Years: Corporate |
| (multi-industry manufacturing), the United Way of | Vice President and Chief Global Diversity Officer |
| Rochester, Amerigroup Corporation (managed health | (retired 2008) and Member of the Executive |
| care), the University of Rochester Medical Center, | Committee (1997–2008) of Johnson & Johnson |
| Monroe Community College Foundation, and North | (pharmaceuticals/consumer products); Director of |
| Carolina A&T University. | Skytop Lodge Corporation (hotels), the University |
| Medical Center at Princeton, the Robert Wood | |
| Rajiv L. Gupta | Johnson Foundation, and the Center for Work Life |
| Born 1945. Trustee Since December 2001.2 | Policy; Member of the Advisory Board of the |
| Principal Occupation(s) During the Past Five Years: | Maxwell School of Citizenship and Public Affairs |
| Chairman and Chief Executive Officer (retired 2009) | at Syracuse University. |
| F. Joseph Loughrey | Thomas J. Higgins | |
| Born 1949. Trustee Since October 2009. Principal | Born 1957. Chief Financial Officer Since September | |
| Occupation(s) During the Past Five Years: President | 2008. Principal Occupation(s) During the Past Five | |
| and Chief Operating Officer (retired 2009) and Vice | Years: Principal of The Vanguard Group, Inc.; Chief | |
| Chairman of the Board (2008–2009) of Cummins Inc. | Financial Officer of each of the investment companies | |
| (industrial machinery); Director of SKF AB (industrial | served by The Vanguard Group since 2008; Treasurer | |
| machinery), Hillenbrand, Inc. (specialized consumer | of each of the investment companies served by The | |
| services), the Lumina Foundation for Education, and | Vanguard Group (1998–2008). | |
| Oxfam America; Chairman of the Advisory Council | ||
| for the College of Arts and Letters and Member | Kathryn J. Hyatt | |
| of the Advisory Board to the Kellogg Institute for | Born 1955. Treasurer Since November 2008. Principal | |
| International Studies at the University of Notre Dame. | Occupation(s) During the Past Five Years: Principal | |
| of The Vanguard Group, Inc.; Treasurer of each of | ||
| André F. Perold | the investment companies served by The Vanguard | |
| Born 1952. Trustee Since December 2004. Principal | Group since 2008; Assistant Treasurer of each of the | |
| Occupation(s) During the Past Five Years: George | investment companies served by The Vanguard Group | |
| Gund Professor of Finance and Banking at the Harvard | (1988–2008). | |
| Business School (retired July 2011); Chief Investment | ||
| Officer and co-Managing Partner of HighVista | Heidi Stam | |
| Strategies LLC (private investment firm); Director of | Born 1956. Secretary Since July 2005. Principal | |
| Rand Merchant Bank; Overseer of the Museum of | Occupation(s) During the Past Five Years: Managing | |
| Fine Arts Boston. | Director of The Vanguard Group, Inc., since 2006; | |
| General Counsel of The Vanguard Group since 2005; | ||
| Alfred M. Rankin, Jr. | Secretary of The Vanguard Group and of each of the | |
| Born 1941. Trustee Since January 1993. Principal | investment companies served by The Vanguard Group | |
| Occupation(s) During the Past Five Years: Chairman, | since 2005; Director and Senior Vice President of | |
| President, and Chief Executive Officer of NACCO | Vanguard Marketing Corporation since 2005; | |
| Industries, Inc. (forklift trucks/housewares/lignite); | Principal of The Vanguard Group (1997–2006). | |
| Director of Goodrich Corporation (industrial products/ | ||
| aircraft systems and services) and the National | ||
| Association of Manufacturers; Chairman of the | Vanguard Senior Management Team | |
| Federal Reserve Bank of Cleveland; Vice Chairman | ||
| of University Hospitals of Cleveland; President of | R. Gregory Barton | Michael S. Miller |
| the Board of The Cleveland Museum of Art. | Mortimer J. Buckley | James M. Norris |
| Kathleen C. Gubanich | Glenn W. Reed | |
| Peter F. Volanakis | Paul A. Heller | George U. Sauter |
| Born 1955. Trustee Since July 2009. Principal | Martha G. King | |
| Occupation(s) During the Past Five Years: President | ||
| and Chief Operating Officer (retired 2010) of Corning | ||
| Incorporated (communications equipment); Director of | Chairman Emeritus and Senior Advisor | |
| Corning Incorporated (2000–2010) and Dow Corning | ||
| (2001–2010); Overseer of the Amos Tuck School of | John J. Brennan | |
| Business Administration at Dartmouth College. | Chairman, 1996–2009 | |
| Chief Executive Officer and President, 1996–2008 | ||
| Executive Officers | ||
| Founder | ||
| Glenn Booraem | ||
| Born 1967. Controller Since July 2010. Principal | John C. Bogle | |
| Occupation(s) During the Past Five Years: Principal | Chairman and Chief Executive Officer, 1974–1996 | |
| of The Vanguard Group, Inc.; Controller of each of | ||
| the investment companies served by The Vanguard | ||
| Group since 2010; Assistant Controller of each of | ||
| the investment companies served by The Vanguard | ||
| Group (2001–2010). | ||
1 Mr. McNabb is considered an “interested person,” as defined in the Investment Company Act of 1940, because he is an officer of the Vanguard funds.
2 December 2002 for Vanguard Equity Income Fund, Vanguard Growth Equity Fund, the Vanguard Municipal Bond Funds, and the Vanguard State Tax-Exempt Funds.
 | |
| P.O. Box 2600 | |
| Valley Forge, PA 19482-2600 |
Connect with Vanguard® > vanguard.com
| Fund Information > 800-662-7447 | CFA® is a trademark owned by CFA Institute. |
| Direct Investor Account Services > 800-662-2739 | |
| Institutional Investor Services > 800-523-1036 | |
| Text Telephone for People | |
| With Hearing Impairment > 800-749-7273 | |
| This material may be used in conjunction | |
| with the offering of shares of any Vanguard | |
| fund only if preceded or accompanied by | |
| the fund’s current prospectus. | |
| All comparative mutual fund data are from Lipper Inc. or | |
| Morningstar, Inc., unless otherwise noted. | |
| You can obtain a free copy of Vanguard’s proxy voting | |
| guidelines by visiting vanguard.com/proxyreporting or by | |
| calling Vanguard at 800-662-2739. The guidelines are | |
| also available from the SEC’s website, sec.gov. In | |
| addition, you may obtain a free report on how your fund | |
| voted the proxies for securities it owned during the 12 | |
| months ended June 30. To get the report, visit either | |
| vanguard.com/proxyreporting or sec.gov. | |
| You can review and copy information about your fund at | |
| the SEC’s Public Reference Room in Washington, D.C. To | |
| find out more about this public service, call the SEC at | |
| 202-551-8090. Information about your fund is also | |
| available on the SEC’s website, and you can receive | |
| copies of this information, for a fee, by sending a | |
| request in either of two ways: via e-mail addressed to | |
| publicinfo@sec.gov or via regular mail addressed to the | |
| Public Reference Section, Securities and Exchange | |
| Commission, Washington, DC 20549-1520. | |
| © 2011 The Vanguard Group, Inc. | |
| All rights reserved. | |
| Vanguard Marketing Corporation, Distributor. | |
| Q522 092011 | |
| Vanguard REIT Index Fund |
| Semiannual Report |
| July 31, 2011 |
 |
> For the six months ended July 31, 2011, Vanguard REIT Index Fund returned more than 8%.
> The fund closely tracked its target index, the MSCI US REIT Index, and slightly outpaced the average return of its peers.
> REITs continued their strong performance, outdistancing the broad stock market for the period.
| Contents | |
| Your Fund’s Total Returns. | 1 |
| Chairman’s Letter. | 2 |
| Fund Profile. | 6 |
| Performance Summary. | 7 |
| Financial Statements. | 8 |
| About Your Fund’s Expenses. | 25 |
| Trustees Approve Advisory Arrangement. | 27 |
| Glossary. | 28 |
 REIT Index Fund
Please note: The opinions expressed in this report are just that—informed opinions. They should not be considered promises or advice.
Also, please keep in mind that the information and opinions cover the period through the date on the front of this report. Of course, the risks of investing in your fund are spelled out in the prospectus.
See the Glossary for definitions of investment terms used in this report.
Cover photograph: Jean Maher.
Your Fund’s Total Returns
Six Months Ended July 31, 2011
| Total | |
| Returns | |
| Vanguard REIT Index Fund | |
| Investor Shares | 8.36% |
| Admiral™ Shares | 8.46 |
| Signal® Shares | 8.44 |
| Institutional Shares | 8.48 |
| ETF Shares | |
| Market Price | 8.49 |
| Net Asset Value | 8.46 |
| MSCI US REIT Index | 8.46 |
| Real Estate Funds Average | 8.04 |
| Real Estate Funds Average: Derived from data provided by Lipper Inc. | |
Admiral Shares carry lower expenses and are available to investors who meet certain account-balance requirements. Signal Shares and Institutional Shares are available to certain institutional investors who meet specific administrative, service, and account-size criteria. The Vanguard ETF® Shares shown are traded on the NYSE Arca exchange and are available only through brokers. The table provides ETF returns based on both the NYSE Arca market price and the net asset value for a share. U.S. Pat. No. 6,879,964 B2; 7,337,138.
For the ETF Shares, the market price is determined by the midpoint of the bid-offer spread as of the closing time of the New York Stock Exchange (generally 4 p.m., Eastern time). The net asset value is also determined as of the NYSE closing time. For more information about how the ETF Shares' market prices have compared with their net asset value, visit vanguard.com, select your ETF, and then select the Price and Performance tab. The ETF premium/discount analysis there shows the percentages of days on which the ETF Shares' market price was above or below the NAV.
Your Fund’s Performance at a Glance
January 31, 2011 , Through July 31, 2011
| Distributions Per Share | |||||
| Starting | Ending | Income | Capital | Return of | |
| Share Price | Share Price | Dividends | Gains | Capital | |
| Vanguard REIT Index Fund | |||||
| Investor Shares | $18.99 | $20.27 | $0.289 | $0.000 | $0.000 |
| Admiral Shares | 81.03 | 86.51 | 1.291 | 0.000 | 0.000 |
| Signal Shares | 21.63 | 23.09 | 0.344 | 0.000 | 0.000 |
| Institutional Shares | 12.54 | 13.39 | 0.201 | 0.000 | 0.000 |
| ETF Shares | 57.17 | 61.04 | 0.911 | 0.000 | 0.000 |
1

Chairman’s Letter
Dear Shareholder,
For the six months ended July 31, 2011, Vanguard REIT Index Fund returned more than 8%. The fund’s performance was in line with that of its benchmark, the MSCI US REIT Index, and slightly ahead of the average return of competitive real estate funds.
Over the past two years, REITs have outperformed the broad U.S. stock market during a period of generally rising prices, although returns drifted down a bit toward the end of the most recent six-month period. All six subsectors of the REIT market posted gains. Retail REITs made the largest contribution to performance, while residential REITs posted the largest absolute return.
Stocks worldwide crept higher in a treacherous marketplace
Global stock markets struggled to find direction during the past six months, as every positive signal seemed to be paired with its negative. The good news included surprisingly strong corporate profits, which proved a source of investor optimism through much of the period.
The counterpoint was a series of increasingly glum economic reports. Expectations that the U.S. economic expansion would accelerate in the second half of the year gave way to anxiety about the possibility of recession. The Dow Jones
2
U.S. Total Stock Market Index finished the period with a return of 1.55%. Across the globe, stock returns were similarly modest.
Bonds rallied in the U.S. market as investors sought safety
Bond prices climbed amid the turbulence. Investors sought refuge from a collection of troubles: Europe’s debt dramas, economic shocks produced by the Japanese tsunami and its aftermath, and prolonged debate over raising the U.S. debt ceiling. For the full six months, the broad U.S. taxable bond market returned more than 4%. (Rising prices are a mixed blessing, of course; they imply lower yields on future investment.) The yields on money market instruments such as Treasury bills remained near 0%, consistent with the Federal Reserve Board’s target for short-term interest rates.
The U.S. credit downgrade: A cause for concern, not panic
On August 5, after the close of our reporting period, Standard & Poor’s downgraded its credit rating of U.S. government bonds from AAA to AA+. S&P said its action was prompted, in large part, by concern about “the effectiveness, stability, and predictability of American policymaking and political institutions”—in other words, the political gridlock on vivid display during the debt- ceiling debate.
The downgrade was controversial, and the other major rating agencies reaffirmed their decision to continue giving the highest ratings to U.S. debt. At Vanguard, our credit analysts and economists regularly assess the financial
| Market Barometer | |||
| Total Returns | |||
| Periods Ended July 31, 2011 | |||
| Six | One | Five Years | |
| Months | Year | (Annualized) | |
| Stocks | |||
| Russell 1000 Index (Large-caps) | 1.62% | 20.68% | 2.80% |
| Russell 2000 Index (Small-caps) | 2.63 | 23.92 | 4.00 |
| Dow Jones U.S. Total Stock Market Index | 1.55 | 20.83 | 3.27 |
| MSCI All Country World Index ex USA (International) | 1.39 | 17.36 | 3.18 |
| Bonds | |||
| Barclays Capital U.S. Aggregate Bond Index (Broad | |||
| taxable market) | 4.23% | 4.44% | 6.57% |
| Barclays Capital Municipal Bond Index (Broad | |||
| tax-exempt market) | 6.27 | 3.24 | 4.90 |
| Citigroup Three-Month U.S. Treasury Bill Index | 0.05 | 0.13 | 1.78 |
| CPI | |||
| Consumer Price Index | 2.59% | 3.63% | 2.11% |
3
strength of the United States and other sovereign borrowers. Our confidence in the “full faith and credit” of the U.S. government remains unshaken, and we have cautioned investors against overreacting to the S&P downgrade.
REITs continued to benefit from low rates and sustained demand
The REIT Index Fund returned better than 10% in the first four months of the period, then tailed off a bit in the summer for a final result of 8.36% (Investor Shares).
REITs have continued to attract investors for their generous dividends during a time of ultralow interest rates. The fund’s yield at July 31 was 3.5%, about double that of the broad stock market. (Because regulations require REITs to distribute nearly all of their earnings, their dividends are not directly comparable to those of a typical operating company.)
Many REITs have continued to strengthen their balance sheets by taking advantage of low rates for business loans. Many have also benefited from rising residential rents and limited new construction, which has undergirded demand for existing space while the economy continues to slowly recover from the severe recession.
The two biggest contributors to the fund’s return for the six months were retail and residential REITs. Retail REITs (+12%), which make up the second-largest sector, have seen sustained demand for shopping space as consumer spending has perked up.
Expense Ratios
Your Fund Compared With Its Peer Group
| Peer | ||||||
| Investor | Admiral | Signal | Institutional | ETF | Group | |
| Shares | Shares | Shares | Shares | Shares | Average | |
| REIT Index Fund | 0.26% | 0.12% | 0.12% | 0.08% | 0.12% | 1.44% |
The fund expense ratios shown are from the prospectus dated May 26, 2011, and represent estimated costs for the current fiscal year. For the six months ended July 31, 2011, the fund’s annualized expense ratios were 0.24% for Investor Shares, 0.10% for Admiral Shares, 0.10% for Signal Shares, 0.08% for Institutional Shares, and 0.10% for ETF Shares. The peer-group expense ratio is derived from data provided by Lipper Inc. and captures information through year-end 2010.
Peer group: Real Estate Funds.
4
Residential REITs, which invest in apartment buildings, posted the highest total return (+17%). Demand for rental units continued as the home-buying market lingered in the doldrums. Office REITs (+8%) also did well, as the commercial real estate market remained strong.
Specialized REITs, which invest in hotels, self-storage firms, and health care facilities, logged the weakest return (+2%) amid concerns about reduced leisure travel.
Because the benchmark tracked by the fund is relatively concentrated—the ten largest positions make up nearly half of its market value—the portfolio’s key drivers tend to be the largest companies. Indeed, the top ten holdings accounted for more than half of the fund’s advance for the six months.
An allocation to REITs can provide useful diversification
The REIT Index Fund offers convenient, low-cost exposure to the U.S. real estate market—and can sometimes provide a counterweight to the ups and downs of the broader stock market. However, any portfolio that focuses on a single sector can be volatile. REITs have provided generous returns for the past several years, but it’s important to remember that in other years they have trailed the returns of the broad market.
That is why we believe it is important to build a diversified portfolio that includes a broad swath of both the stock and bond markets that can help you garner their long-term gains while also helping to reduce your exposure to risk. The REIT Index Fund can play a role by providing additional diversification in such a prudent investment plan.
Thank you for your confidence in Vanguard.
Sincerely,

F. William McNabb III
Chairman and Chief Executive Officer
August 10, 2011
5
REIT Index Fund
Fund Profile
As of July 31, 2011
| Share-Class Characteristics | |||||
| Investor | Admiral | Signal | Institutional | ETF | |
| Shares | Shares | Shares | Shares | Shares | |
| Ticker Symbol | VGSIX | VGSLX | VGRSX | VGSNX | VNQ |
| Expense Ratio1 | 0.26% | 0.12% | 0.12% | 0.08% | 0.12% |
| Portfolio Characteristics | |||
| DJ | |||
| U.S. Total | |||
| MSCI US | Market | ||
| Fund | REIT Index | Index | |
| Number of Stocks | 106 | 105 | 3,753 |
| Median Market Cap | $9.3B | $9.3B | $31.4B |
| Price/Earnings Ratio | 87.8x | 87.1x | 16.3x |
| Price/Book Ratio | 2.2x | 2.2x | 2.2x |
| Return on Equity | 5.1% | 5.1% | 19.0% |
| Earnings Growth Rate | -2.0% | -2.1% | 6.3% |
| Dividend Yield | 3.5% | 3.5% | 1.8% |
| Foreign Holdings | 0.0% | 0.0% | 0.0% |
| Turnover Rate | |||
| (Annualized) | 9% | — | — |
| Short-Term Reserves | 0.8% | — | — |
| Dividend Yield: This yield may include some payments that represent a return of capital, capital gains distributions, or both by the underlying REITs. These amounts are determined by each REIT at the end of its fiscal year. | |||
| Subindustry Diversification (% of equity exposure) | |||
| MSCI US | |||
| Fund | REIT Index | ||
| Diversified REITs | 7.3% | 7.3% | |
| Industrial REITs | 6.0 | 6.0 | |
| Office REITs | 16.8 | 16.8 | |
| Residential REITs | 18.1 | 18.0 | |
| Retail REITs | 25.8 | 25.7 | |
| Specialized REITs | 26.0 | 26.2 | |
| Volatility Measures | ||
| DJ | ||
| REIT | U.S. Total | |
| Spliced | Market | |
| Index | Index | |
| R-Squared | 1.00 | 0.70 |
| Beta | 1.00 | 1.50 |
| These measures show the degree and timing of the fund’s fluctuations compared with the indexes over 36 months. | ||
| Ten Largest Holdings (% of total net assets) | ||
| Simon Property Group | ||
| Inc. | Retail REITs | 9.6% |
| Equity Residential | Residential REITs | 4.9 |
| Public Storage | Specialized REITs | 4.7 |
| ProLogis Inc. | Industrial REITs | 4.4 |
| Vornado Realty Trust | Diversified REITs | 4.2 |
| Boston Properties Inc. | Office REITs | 4.1 |
| Ventas Inc. | Specialized REITs | 4.0 |
| HCP Inc. | Specialized REITs | 4.0 |
| AvalonBay Communities | ||
| Inc. | Residential REITs | 3.1 |
| Host Hotel & Resorts | ||
| Inc. | Specialized REITs | 2.9 |
| Top Ten | 45.9% | |
| The holdings listed exclude any temporary cash investments and equity index products. | ||
1 The expense ratios shown are from the prospectus dated May 26, 2011, and represent estimated costs for the current fiscal year. For the six months ended July 31, 2011, the annualized expense ratios were 0.24% for Investor Shares, 0.10% for Admiral Shares, 0.10% for Signal Shares, 0.08% for Institutional Shares, and 0.10% for ETF Shares.
6
REIT Index Fund
Performance Summary
All of the returns in this report represent past performance, which is not a guarantee of future results that may be achieved by the fund. (Current performance may be lower or higher than the performance data cited. For performance data current to the most recent month-end, visit our website at vanguard.com/performance.) Note, too, that both investment returns and principal value can fluctuate widely, so an investor’s shares, when sold, could be worth more or less than their original cost. The returns shown do not reflect taxes that a shareholder would pay on fund distributions or on the sale of fund shares.
Fiscal-Year Total Returns (%): January 31, 2001, Through July 31, 2011

REIT Spliced Index: MSCI US REIT Index adjusted to include a 2% cash position (Lipper Money Market Average) through April 30, 2009; MSCI US REIT Index thereafter.
Note: For 2012, performance data reflect the six months ended July 31, 2011.
Average Annual Total Returns: Periods Ended June 30, 2011
This table presents returns through the latest calendar quarter—rather than through the end of the fiscal period.
Securities and Exchange Commission rules require that we provide this information.
| Inception | One | Five | Ten | |
| Date | Year | Years | Years | |
| Investor Shares | 5/13/1996 | 33.94% | 2.83% | 10.59% |
| Admiral Shares | 11/12/2001 | 34.10 | 2.95 | 11.551 |
| Signal Shares | 6/4/2007 | 34.12 | — | -1.661 |
| Institutional Shares | 12/2/2003 | 34.07 | 2.97 | 9.311 |
| ETF Shares | 9/23/2004 | |||
| Market Price | 34.03 | 2.96 | 8.311 | |
| Net Asset Value | 34.08 | 2.95 | 8.311 | |
| 1 Return since inception. | ||||
Vanguard fund returns do not reflect the 1% fee on redemptions of shares held for less than one year. The fee does not apply to the ETF Shares.
See Financial Highlights for dividend and capital gains information.
7
REIT Index Fund
Financial Statements (unaudited)
Statement of Net Assets
As of July 31, 2011
The fund reports a complete list of its holdings in regulatory filings four times in each fiscal year, at the quarter-ends. For the second and fourth fiscal quarters, the lists appear in the fund’s semiannual and annual reports to shareholders. For the first and third fiscal quarters, the fund files the lists with the Securities and Exchange Commission on Form N-Q. Shareholders can look up the fund’s Forms N-Q on the SEC’s website at sec.gov. Forms N-Q may also be reviewed and copied at the SEC’s Public Reference Room (see the back cover of this report for further information).
| Market | |||
| Value | |||
| Shares | ($000) | ||
| Real Estate Investment Trusts (99.1%)1 | |||
| Diversified REITs (7.2%) | |||
| 2 | Vornado Realty Trust | 9,398,984 | 879,275 |
| 2 | Liberty Property Trust | 6,522,262 | 221,496 |
| 2 | Washington REIT | 3,751,386 | 120,119 |
| 2 | Colonial Properties Trust | 4,236,520 | 91,297 |
| PS Business Parks Inc. | 1,123,880 | 63,848 | |
| 2 | Cousins Properties Inc. | 5,309,881 | 45,187 |
| 2 | Investors Real Estate | ||
| Trust | 4,520,918 | 36,755 | |
| 2 | Retail Opportunity | ||
| Investments Corp. | 2,383,498 | 26,504 | |
| 2 | Winthrop Realty Trust | 1,645,755 | 18,202 |
| 2 | CapLease Inc. | 3,675,002 | 16,354 |
| 1,519,037 | |||
| Industrial REITs (6.0%) | |||
| 2 | ProLogis Inc. | 25,837,024 | 920,573 |
| 2 | DuPont Fabros | ||
| Technology Inc. | 3,463,394 | 88,282 | |
| 2 | DCT Industrial Trust Inc. | 13,970,663 | 75,721 |
| 2 | EastGroup Properties Inc. | 1,535,521 | 68,361 |
| *,2 | First Industrial Realty | ||
| Trust Inc. | 4,672,451 | 55,369 | |
| 2 | First Potomac Realty | ||
| Trust | 2,841,984 | 44,392 | |
| 1,252,698 | |||
| Office REITs (16.6%) | |||
| 2 | Boston Properties Inc. | 8,109,651 | 870,652 |
| 2 | SL Green Realty Corp. | 4,486,086 | 367,949 |
| ^,2 | Digital Realty Trust Inc. | 5,194,520 | 317,957 |
| 2 | Alexandria Real Estate | ||
| Equities Inc. | 3,441,425 | 282,197 | |
| 2 | Piedmont Office Realty | ||
| Trust Inc. Class A | 9,829,154 | 201,989 | |
| 2 | Duke Realty Corp. | 14,375,581 | 201,833 |
| 2 | Mack-Cali Realty Corp. | 4,889,631 | 162,678 |
| 2 | BioMed Realty Trust Inc. | 7,474,324 | 146,646 |
| 2 | Highwoods | ||
| Properties Inc. | 4,081,996 | 140,543 | |
| Market | |||
| Value | |||
| Shares | ($000) | ||
| 2 | Douglas Emmett Inc. | 6,720,797 | 134,416 |
| 2 | Kilroy Realty Corp. | 3,283,015 | 126,659 |
| 2 | Corporate Office | ||
| Properties Trust | 4,047,864 | 125,767 | |
| 2 | Brandywine Realty Trust | 7,658,074 | 91,820 |
| CommonWealth REIT | 3,676,654 | 86,843 | |
| 2 | Lexington Realty Trust | 8,060,892 | 67,711 |
| Government Properties | |||
| Income Trust | 2,141,107 | 52,950 | |
| 2 | Franklin Street | ||
| Properties Corp. | 4,172,512 | 52,615 | |
| 2 | Parkway Properties Inc. | 1,248,630 | 22,013 |
| 2 | Coresite Realty Corp. | 1,120,416 | 18,868 |
| Hudson Pacific | |||
| Properties Inc. | 1,112,178 | 16,961 | |
| 3,489,067 | |||
| Residential REITs (17.9%) | |||
| 2 | Equity Residential | 16,714,092 | 1,033,265 |
| 2 | AvalonBay | ||
| Communities Inc. | 4,892,815 | 656,567 | |
| 2 | UDR Inc. | 12,193,970 | 320,823 |
| 2 | Camden Property Trust | 3,972,535 | 266,438 |
| 2 | Essex Property Trust Inc. | 1,831,355 | 257,049 |
| 2 | BRE Properties Inc. | 4,180,190 | 219,376 |
| 2 | Apartment Investment & | ||
| Management Co. | 6,725,083 | 183,595 | |
| 2 | Mid-America Apartment | ||
| Communities Inc. | 2,033,180 | 143,929 | |
| 2 | Home Properties Inc. | 2,162,031 | 141,656 |
| 2 | American Campus | ||
| Communities Inc. | 3,800,824 | 141,467 | |
| 2 | Equity Lifestyle | ||
| Properties Inc. | 2,063,479 | 134,456 | |
| 2 | Post Properties Inc. | 2,784,564 | 118,066 |
| 2 | Sun Communities Inc. | 1,126,617 | 43,116 |
| 2 | Associated Estates | ||
| Realty Corp. | 2,361,626 | 42,863 | |
| 2 | Education Realty | ||
| Trust Inc. | 4,114,360 | 36,124 | |
8
REIT Index Fund
| Market | |||
| Value | |||
| Shares | ($000) | ||
| 2 | Campus Crest | ||
| Communities Inc. | 1,749,593 | 20,960 | |
| 3,759,750 | |||
| Retail REITs (25.6%) | |||
| 2 | Simon Property | ||
| Group Inc. | 16,650,953 | 2,006,606 | |
| 2 | Kimco Realty Corp. | 23,099,996 | 439,593 |
| General Growth | |||
| Properties Inc. | 24,612,228 | 413,732 | |
| 2 | Macerich Co. | 7,408,524 | 393,615 |
| 2 | Federal Realty | ||
| Investment Trust | 3,497,517 | 305,473 | |
| 2 | Realty Income Corp. | 7,155,943 | 232,282 |
| 2 | Regency Centers Corp. | 4,661,721 | 209,404 |
| 2 | Taubman Centers Inc. | 3,176,069 | 190,247 |
| Developers Diversified | |||
| Realty Corp. | 11,698,474 | 170,915 | |
| 2 | Weingarten Realty | ||
| Investors | 6,512,393 | 167,499 | |
| 2 | CBL & Associates | ||
| Properties Inc. | 8,000,083 | 142,081 | |
| 2 | Tanger Factory Outlet | ||
| Centers | 4,625,787 | 126,978 | |
| 2 | National Retail | ||
| Properties Inc. | 4,768,254 | 119,635 | |
| Equity One Inc. | 3,589,804 | 69,642 | |
| 2 | Glimcher Realty Trust | 5,686,068 | 56,008 |
| 2 | Acadia Realty Trust | 2,295,414 | 48,181 |
| Alexander’s Inc. | 116,250 | 46,616 | |
| 2 | Inland Real Estate Corp. | 5,003,143 | 44,128 |
| 2 | Pennsylvania REIT | 2,994,940 | 43,726 |
| Getty Realty Corp. | 1,500,387 | 34,809 | |
| Saul Centers Inc. | 684,883 | 27,019 | |
| 2 | Ramco-Gershenson | ||
| Properties Trust | 2,162,409 | 26,533 | |
| Urstadt Biddle | |||
| Properties Inc. Class A | 1,120,915 | 19,885 | |
| Cedar Shopping | |||
| Centers Inc. | 3,205,278 | 15,898 | |
| 2 | Kite Realty Group Trust | 3,428,968 | 15,567 |
| Urstadt Biddle | |||
| Properties Inc. | 69,255 | 1,161 | |
| 5,367,233 | |||
| Specialized REITs (25.8%) | |||
| Public Storage | 8,180,327 | 978,612 | |
| 2 | Ventas Inc. | 15,571,661 | 842,894 |
| 2 | HCP Inc. | 22,820,273 | 838,189 |
| 2 | Host Hotels & | ||
| Resorts Inc. | 38,673,138 | 612,969 | |
| 2 | Health Care REIT Inc. | 9,781,312 | 516,258 |
| 2 | Hospitality Properties | ||
| Trust | 6,411,667 | 161,895 | |
| Senior Housing | |||
| Properties Trust | 6,645,956 | 159,104 | |
| Market | |||
| Value | |||
| Shares | ($000) | ||
| 2 | Entertainment Properties | ||
| Trust | 2,646,013 | 123,013 | |
| 2 | LaSalle Hotel Properties | 4,619,815 | 115,542 |
| 2 | Omega Healthcare | ||
| Investors Inc. | 5,693,904 | 111,828 | |
| 2 | Extra Space Storage Inc. | 5,005,214 | 106,411 |
| 2 | DiamondRock | ||
| Hospitality Co. | 9,425,674 | 96,330 | |
| 2 | Healthcare Realty | ||
| Trust Inc. | 3,825,907 | 74,988 | |
| 2 | Medical Properties | ||
| Trust Inc. | 6,355,270 | 74,738 | |
| 2 | Sovran Self Storage Inc. | 1,574,696 | 63,854 |
| National Health | |||
| Investors Inc. | 1,339,935 | 60,954 | |
| *,2 | Sunstone Hotel | ||
| Investors Inc. | 6,692,094 | 59,626 | |
| 2 | U-Store-It Trust | 5,332,338 | 56,789 |
| 2 | Pebblebrook Hotel Trust | 2,815,914 | 55,671 |
| * | Strategic Hotels & | ||
| Resorts Inc. | 7,757,375 | 52,750 | |
| 2 | LTC Properties Inc. | 1,699,034 | 46,129 |
| 2 | Hersha Hospitality Trust | ||
| Class A | 8,669,374 | 45,427 | |
| Ashford Hospitality | |||
| Trust Inc. | 3,095,028 | 33,736 | |
| *,2 | FelCor Lodging Trust Inc. | 6,537,105 | 33,601 |
| 2 | Sabra Healthcare | ||
| REIT Inc. | 2,009,201 | 28,953 | |
| 2 | Universal Health Realty | ||
| Income Trust | 685,465 | 28,248 | |
| 2 | Chesapeake Lodging | ||
| Trust | 1,685,183 | 27,805 | |
| 2 | Cogdell Spencer Inc. | 2,753,123 | 16,409 |
| 5,422,723 | |||
| Total Real Estate Investment Trusts | |||
| (Cost $17,895,506) | 20,810,508 | ||
| Temporary Cash Investment (0.8%)1 | |||
| Money Market Fund (0.8%) | |||
| 3,4 | Vanguard Market | ||
| Liquidity Fund, 0.114% | |||
| (Cost $171,754) | 171,753,911 | 171,754 | |
| Total Investments (99.9%) | |||
| (Cost $18,067,260) | 20,982,262 | ||
| Other Assets and Liabilities (0.1%) | |||
| Other Assets | 82,026 | ||
| Liabilities4 | (69,661) | ||
| 12,365 | |||
| Net Assets (100%) | 20,994,627 | ||
9
REIT Index Fund
| Market | |
| Value• | |
| ($000) | |
| Statement of Assets and Liabilities | |
| Assets | |
| Investments in Securities, at Value | 20,982,262 |
| Accrued Income Receivable | 46,598 |
| Other Assets | 35,428 |
| Total Assets | 21,064,288 |
| Liabilities | |
| Payables for Investment Securities | |
| Purchased | 33,151 |
| Other Liabilities4 | 36,510 |
| Total Liabilities | 69,661 |
| Net Assets | 20,994,627 |
| At July 31, 2011, net assets consisted of: | |
| Amount�� | |
| ($000) | |
| Paid-in Capital | 18,433,440 |
| Overdistributed Net Investment Income | (76,775) |
| Accumulated Net Realized Losses | (304,224) |
| Unrealized Appreciation (Depreciation) | |
| Investment Securities | 2,915,002 |
| Swap Contracts | 27,184 |
| Net Assets | 20,994,627 |
| Investor Shares—Net Assets | |
| Applicable to 136,576,303 outstanding | |
| $.001 par value shares of beneficial | |
| interest (unlimited authorization) | 2,768,637 |
| Net Asset Value Per Share— | |
| Investor Shares | $20.27 |
| Amount | |
| ($000) | |
| Admiral Shares—Net Assets | |
| Applicable to 61,208,354 outstanding | |
| $.001 par value shares of beneficial | |
| interest (unlimited authorization) | 5,295,182 |
| Net Asset Value Per Share— | |
| Admiral Shares | $86.51 |
| Signal Shares—Net Assets | |
| Applicable to 48,931,292 outstanding | |
| $.001 par value shares of beneficial | |
| interest (unlimited authorization) | 1,130,011 |
| Net Asset Value Per Share— | |
| Signal Shares | $23.09 |
| Institutional Shares—Net Assets | |
| Applicable to 149,069,002 outstanding | |
| $.001 par value shares of beneficial | |
| interest (unlimited authorization) | 1,996,123 |
| Net Asset Value Per Share— | |
| Institutional Shares | $13.39 |
| ETF Shares—Net Assets | |
| Applicable to 160,630,723 outstanding | |
| $.001 par value shares of beneficial | |
| interest (unlimited authorization) | 9,804,674 |
| Net Asset Value Per Share— | |
| ETF Shares | $61.04 |
See Note A in Notes to Financial Statements.
* Non-income-producing security.
^ Part of security position is on loan to broker-dealers. The total value of securities on loan is $23,137,000.
1 The fund invests a portion of its assets in Real Estate Investment Trusts through the use of swap contracts. After giving effect to swap investments, the fund’s effective Real Estate Investment Trust and temporary cash investment positions represent 100.0% and (0.1%), respectively, of net assets.
2 Considered an affiliated company of the fund as the fund owns more than 5% of the outstanding voting securities of such company.
3 Affiliated money market fund available only to Vanguard funds and certain trusts and accounts managed by Vanguard. Rate shown is the 7-day yield.
4 Includes $23,814,000 of collateral received for securities on loan.
REIT—Real Estate Investment Trust.
See accompanying Notes, which are an integral part of the Financial Statements.
10
REIT Index Fund
Statement of Operations
| Six Months Ended | |
| July 31, 2011 | |
| ($000) | |
| Investment Income | |
| Income | |
| Dividends1 | 239,054 |
| Interest1 | 87 |
| Security Lending | 314 |
| Total Income | 239,455 |
| Expenses | |
| The Vanguard Group—Note B | |
| Investment Advisory Services | 486 |
| Management and Administrative—Investor Shares | 2,713 |
| Management and Administrative—Admiral Shares | 1,968 |
| Management and Administrative—Signal Shares | 334 |
| Management and Administrative—Institutional Shares | 408 |
| Management and Administrative—ETF Shares | 2,936 |
| Marketing and Distribution—Investor Shares | 405 |
| Marketing and Distribution—Admiral Shares | 391 |
| Marketing and Distribution—Signal Shares | 125 |
| Marketing and Distribution—Institutional Shares | 250 |
| Marketing and Distribution—ETF Shares | 1,258 |
| Custodian Fees | 132 |
| Shareholders’ Reports—Investor Shares | 35 |
| Shareholders’ Reports—Admiral Shares | 16 |
| Shareholders’ Reports—Signal Shares | 5 |
| Shareholders’ Reports—Institutional Shares | 8 |
| Shareholders’ Reports—ETF Shares | 10 |
| Trustees’ Fees and Expenses | 10 |
| Total Expenses | 11,490 |
| Net Investment Income | 227,965 |
| Realized Net Gain (Loss) | |
| Capital Gain Distributions Received | 49,351 |
| Investment Securities Sold | 102,384 |
| Swap Contracts | (160) |
| Realized Net Gain (Loss)1 | 151,575 |
| Change in Unrealized Appreciation (Depreciation) | |
| Investment Securities | 1,180,653 |
| Swap Contracts | 7,393 |
| Change in Unrealized Appreciation (Depreciation) | 1,188,046 |
| Net Increase (Decrease) in Net Assets Resulting from Operations | 1,567,586 |
1 Dividend income, interest income, and realized net gain (loss) from affiliated companies of the fund were $211,970,000, $87,000, and $85,150,000, respectively.
See accompanying Notes, which are an integral part of the Financial Statements.
11
REIT Index Fund
Statement of Changes in Net Assets
| Six Months Ended | Year Ended | |
| July 31, | January 31, | |
| 2011 | 2011 | |
| ($000) | ($000) | |
| Increase (Decrease) in Net Assets | ||
| Operations | ||
| Net Investment Income | 227,965 | 330,632 |
| Realized Net Gain (Loss) | 151,575 | 707,808 |
| Change in Unrealized Appreciation (Depreciation) | 1,188,046 | 3,581,425 |
| Net Increase (Decrease) in Net Assets Resulting from Operations | 1,567,586 | 4,619,865 |
| Distributions | ||
| Net Investment Income | ||
| Investor Shares | (39,800) | (135,406) |
| Admiral Shares | (77,529) | (88,776) |
| Signal Shares | (15,437) | (23,109) |
| Institutional Shares | (27,957) | (48,372) |
| ETF Shares | (139,328) | (227,850) |
| Realized Capital Gain | ||
| Investor Shares | — | — |
| Admiral Shares | — | — |
| Signal Shares | — | — |
| Institutional Shares | — | — |
| ETF Shares | — | — |
| Total Distributions | (300,051) | (523,513) |
| Capital Share Transactions | ||
| Investor Shares | (69,118) | (2,088,856) |
| Admiral Shares | 251,562 | 2,816,862 |
| Signal Shares | 232,507 | 165,550 |
| Institutional Shares | 265,636 | 345,514 |
| ETF Shares | 1,149,288 | 1,620,012 |
| Net Increase (Decrease) from Capital Share Transactions | 1,829,875 | 2,859,082 |
| Total Increase (Decrease) | 3,097,410 | 6,955,434 |
| Net Assets | ||
| Beginning of Period | 17,897,217 | 10,941,783 |
| End of Period1 | 20,994,627 | 17,897,217 |
| 1 Net Assets—End of Period includes undistributed (overdistributed) net investment income of ($76,775,000) and ($4,689,000). | ||
See accompanying Notes, which are an integral part of the Financial Statements.
12
REIT Index Fund
Financial Highlights
Investor Shares
| Six Months | ||||||
| Ended | ||||||
| For a Share Outstanding | July 31, | Year Ended January 31, | ||||
| Throughout Each Period | 2011 | 2011 | 2010 | 2009 | 2008 | 2007 |
| Net Asset Value, Beginning of Period | $18.99 | $14.05 | $10.02 | $20.38 | $27.76 | $21.29 |
| Investment Operations | ||||||
| Net Investment Income | .221 | .399 | .477 | .593 | .615 | .530 |
| Net Realized and Unrealized Gain (Loss) | ||||||
| on Investments1 | 1.348 | 5.144 | 4.192 | (9.975) | (6.985) | 7.000 |
| Total from Investment Operations | 1.569 | 5.543 | 4.669 | (9.382) | (6.370) | 7.530 |
| Distributions | ||||||
| Dividends from Net Investment Income | (.289) | (.603) | (.481) | (.571) | (.622) | (.534) |
| Distributions from Realized Capital Gains | — | — | — | (.125) | (.199) | (.413) |
| Return of Capital | — | — | (.158) | (.282) | (.189) | (.113) |
| Total Distributions | (.289) | (.603) | (.639) | (.978) | (1.010) | (1.060) |
| Net Asset Value, End of Period | $20.27 | $18.99 | $14.05 | $10.02 | $20.38 | $27.76 |
| Total Return2 | 8.36% | 40.02% | 48.51% | -47.82% | -23.28% | 36.32% |
| Ratios/Supplemental Data | ||||||
| Net Assets, End of Period (Millions) | $2,769 | $2,658 | $3,572 | $2,274 | $4,046 | $6,827 |
| Ratio of Total Expenses to | ||||||
| Average Net Assets | 0.24% | 0.26% | 0.26% | 0.21% | 0.20% | 0.21% |
| Ratio of Net Investment Income to | ||||||
| Average Net Assets | 2.22% | 2.22% | 3.94% | 3.36% | 2.52% | 2.27% |
| Portfolio Turnover Rate3 | 9% | 12% | 16% | 10% | 13% | 11% |
The expense ratio, net income ratio, and turnover rate for the current period have been annualized.
1 Includes increases from redemption fees of $0.00, $0.00, $0.00, $0.00, $0.02, and $0.00.
2 Total returns do not include transaction or account service fees that may have applied in the periods shown. Fund prospectuses provide information about any applicable transaction and account service fees.
3 Excludes the value of portfolio securities received or delivered as a result of in-kind purchases or redemptions of the fund’s capital shares, including ETF Creation Units.
See accompanying Notes, which are an integral part of the Financial Statements.
13
REIT Index Fund
Financial Highlights
Admiral Shares
| Six Months | ||||||
| Ended | ||||||
| For a Share Outstanding | July 31, | Year Ended January 31, | ||||
| Throughout Each Period | 2011 | 2011 | 2010 | 2009 | 2008 | 2007 |
| Net Asset Value, Beginning of Period | $81.03 | $59.95 | $42.74 | $86.94 | $118.46 | $90.82 |
| Investment Operations | ||||||
| Net Investment Income | 1.000 | 1.806 | 2.083 | 2.581 | 2.707 | 2.328 |
| Net Realized and Unrealized Gain (Loss) | ||||||
| on Investments1 | 5.771 | 21.948 | 17.909 | (42.527) | (29.817) | 29.903 |
| Total from Investment Operations | 6.771 | 23.754 | 19.992 | (39.946) | (27.110) | 32.231 |
| Distributions | ||||||
| Dividends from Net Investment Income | (1.291) | (2.674) | (2.094) | (2.491) | (2.735) | (2.341) |
| Distributions from Realized Capital Gains | — | — | — | (.535) | (.849) | (1.761) |
| Return of Capital | — | — | (.688) | (1.228) | (.826) | (.489) |
| Total Distributions | (1.291) | (2.674) | (2.782) | (4.254) | (4.410) | (4.591) |
| Net Asset Value, End of Period | $86.51 | $81.03 | $59.95 | $42.74 | $86.94 | $118.46 |
| Total Return2 | 8.46% | 40.21% | 48.73% | -47.77% | -23.23% | 36.46% |
| Ratios/Supplemental Data | ||||||
| Net Assets, End of Period (Millions) | $5,295 | $4,715 | $1,296 | $873 | $1,706 | $3,392 |
| Ratio of Total Expenses to | ||||||
| Average Net Assets | 0.10% | 0.12% | 0.13% | 0.11% | 0.10% | 0.14% |
| Ratio of Net Investment Income to | ||||||
| Average Net Assets | 2.36% | 2.36% | 4.07% | 3.46% | 2.62% | 2.34% |
| Portfolio Turnover Rate3 | 9% | 12% | 16% | 10% | 13% | 11% |
The expense ratio, net income ratio, and turnover rate for the current period have been annualized.
1 Includes increases from redemption fees of $0.00, $0.00, $0.01, $0.02, $0.10, and $0.02.
2 Total returns do not include transaction fees that may have applied in the periods shown. Fund prospectuses provide information about any applicable transaction fees.
3 Excludes the value of portfolio securities received or delivered as a result of in-kind purchases or redemptions of the fund’s capital shares, including ETF Creation Units.
See accompanying Notes, which are an integral part of the Financial Statements.
14
REIT Index Fund
Financial Highlights
Signal Shares
| Six Months | June 4, | ||||
| Ended | 20071 to | ||||
| July 31, | Year Ended January 31, | Jan. 31, | |||
| For a Share Outstanding Throughout Each Period | 2011 | 2011 | 2010 | 2009 | 2008 |
| Net Asset Value, Beginning of Period | $21.63 | $16.00 | $11.41 | $23.21 | $30.05 |
| Investment Operations | |||||
| Net Investment Income | .266 | .483 | .557 | .688 | .470 |
| Net Realized and Unrealized Gain (Loss) | |||||
| on Investments | 1.538 | 5.862 | 4.775 | (11.353) | (6.311) |
| Total from Investment Operations | 1.804 | 6.345 | 5.332 | (10.665) | (5.841) |
| Distributions | |||||
| Dividends from Net Investment Income | (.344) | (.715) | (.559) | (.664) | (.620) |
| Distributions from Realized Capital Gains | — | — | — | (.143) | (.192) |
| Return of Capital | — | — | (.183) | (.328) | (.187) |
| Total Distributions | (.344) | (.715) | (.742) | (1.135) | (.999) |
| Net Asset Value, End of Period | $23.09 | $21.63 | $16.00 | $11.41 | $23.21 |
| Total Return2 | 8.44% | 40.25% | 48.68% | -47.77% | -19.68% |
| Ratios/Supplemental Data | |||||
| Net Assets, End of Period (Millions) | $1,130 | $835 | $489 | $350 | $538 |
| Ratio of Total Expenses to | |||||
| Average Net Assets | 0.10% | 0.12% | 0.14% | 0.11% | 0.10%3 |
| Ratio of Net Investment Income to | |||||
| Average Net Assets | 2.36% | 2.36% | 4.06% | 3.46% | 2.62%3 |
| Portfolio Turnover Rate4 | 9% | 12% | 16% | 10% | 13% |
The expense ratio, net income ratio, and turnover rate for the current period have been annualized.
1 Inception.
2 Total returns do not include transaction fees that may have applied in the periods shown. Fund prospectuses provide information about any applicable transaction fees.
3 Annualized.
4 Excludes the value of portfolio securities received or delivered as a result of in-kind purchases or redemptions of the fund’s capital shares including ETF Creation Units.
See accompanying Notes, which are an integral part of the Financial Statements.
15
REIT Index Fund
Financial Highlights
Institutional Shares
| Six Months | ||||||
| Ended | ||||||
| For a Share Outstanding | July 31, | Year Ended January 31, | ||||
| Throughout Each Period | 2011 | 2011 | 2010 | 2009 | 2008 | 2007 |
| Net Asset Value, Beginning of Period | $12.54 | $9.28 | $6.61 | $13.46 | $18.33 | $14.06 |
| Investment Operations | ||||||
| Net Investment Income | .155 | .284 | .326 | .401 | .420 | .366 |
| Net Realized and Unrealized Gain (Loss) | ||||||
| on Investments1 | .896 | 3.395 | 2.777 | (6.591) | (4.605) | 4.621 |
| Total from Investment Operations | 1.051 | 3.679 | 3.103 | (6.190) | (4.185) | 4.987 |
| Distributions | ||||||
| Dividends from Net Investment Income | (.201) | (.419) | (.326) | (.386) | (.426) | (.368) |
| Distributions from Realized Capital Gains | — | — | — | (.083) | (.131) | (.273) |
| Return of Capital | — | — | (.107) | (.191) | (.128) | (.076) |
| Total Distributions | (.201) | (.419) | (.433) | (.660) | (.685) | (.717) |
| Net Asset Value, End of Period | $13.39 | $12.54 | $9.28 | $6.61 | $13.46 | $18.33 |
| Total Return2 | 8.48% | 40.24% | 48.90% | -47.82% | -23.18% | 36.45% |
| Ratios/Supplemental Data | ||||||
| Net Assets, End of Period (Millions) | $1,996 | $1,614 | $907 | $504 | $722 | $960 |
| Ratio of Total Expenses to | ||||||
| Average Net Assets | 0.08% | 0.08% | 0.09% | 0.09% | 0.09% | 0.10% |
| Ratio of Net Investment Income to | ||||||
| Average Net Assets | 2.38% | 2.40% | 4.11% | 3.48% | 2.63% | 2.38% |
| Portfolio Turnover Rate3 | 9% | 12% | 16% | 10% | 13% | 11% |
The expense ratio, net income ratio, and turnover rate for the current period have been annualized.
1 Includes increases from redemption fees of $0.00, $0.00, $0.00, $0.00, $0.01, and $0.00.
2 Total returns do not include transaction fees that may have applied in the periods shown. Fund prospectuses provide information about any applicable transaction fees.
3 Excludes the value of portfolio securities received or delivered as a result of in-kind purchases or redemptions of the fund’s capital shares, including ETF Creation Units.
See accompanying Notes, which are an integral part of the Financial Statements.
16
REIT Index Fund
Financial Highlights
ETF Shares
| Six Months | ||||||
| Ended | ||||||
| For a Share Outstanding | July 31, | Year Ended January 31, | ||||
| Throughout Each Period | 2011 | 2011 | 2010 | 2009 | 2008 | 2007 |
| Net Asset Value, Beginning of Period | $57.17 | $42.30 | $30.14 | $61.31 | $83.55 | $64.07 |
| Investment Operations | ||||||
| Net Investment Income | .706 | 1.278 | 1.473 | 1.820 | 1.908 | 1.654 |
| Net Realized and Unrealized Gain (Loss) | ||||||
| on Investments1 | 4.075 | 15.483 | 12.651 | (29.990) | (21.037) | 21.080 |
| Total from Investment Operations | 4.781 | 16.761 | 14.124 | (28.170) | (19.129) | 22.734 |
| Distributions | ||||||
| Dividends from Net Investment Income | (.911) | (1.891) | (1.478) | (1.757) | (1.931) | (1.665) |
| Distributions from Realized Capital Gains | — | — | — | (.377) | (.598) | (1.242) |
| Return of Capital | — | — | (.486) | (.866) | (.582) | (.347) |
| Total Distributions | (.911) | (1.891) | (1.964) | (3.000) | (3.111) | (3.254) |
| Net Asset Value, End of Period | $61.04 | $57.17 | $42.30 | $30.14 | $61.31 | $83.55 |
| Total Return | 8.46% | 40.19% | 48.74% | -47.77% | -23.23% | 36.48% |
| Ratios/Supplemental Data | ||||||
| Net Assets, End of Period (Millions) | $9,805 | $8,075 | $4,678 | $1,414 | $2,082 | $1,713 |
| Ratio of Total Expenses to | ||||||
| Average Net Assets | 0.10% | 0.12% | 0.13% | 0.11% | 0.10% | 0.12% |
| Ratio of Net Investment Income to | ||||||
| Average Net Assets | 2.36% | 2.36% | 4.07% | 3.46% | 2.62% | 2.36% |
| Portfolio Turnover Rate2 | 9% | 12% | 16% | 10% | 13% | 11% |
The expense ratio, net income ratio, and turnover rate for the current period have been annualized.
1 Includes increases from redemption fees of $0.00, $0.01, $0.01, $0.01, $0.04, and $0.01.
2 Excludes the value of portfolio securities received or delivered as a result of in-kind purchases or redemptions of the fund’s capital shares, including ETF Creation Units.
See accompanying Notes, which are an integral part of the Financial Statements.
17
REIT Index Fund
Notes to Financial Statements
Vanguard REIT Index Fund is registered under the Investment Company Act of 1940 as an open-end investment company, or mutual fund. The fund offers five classes of shares: Investor Shares, Admiral Shares, Signal Shares, Institutional Shares, and ETF Shares. Investor Shares are available to any investor who meets the fund’s minimum purchase requirements. Admiral Shares, Signal Shares, and Institutional Shares are designed for investors who meet certain administrative, service, and account-size criteria. ETF Shares are listed for trading on the NYSE Arca, Inc.; they can be purchased and sold through a broker.
A. The following significant accounting policies conform to generally accepted accounting principles for U.S. mutual funds. The fund consistently follows such policies in preparing its financial statements.
1. Security Valuation: Securities are valued as of the close of trading on the New York Stock Exchange (generally 4 p.m., Eastern time) on the valuation date. Equity securities are valued at the latest quoted sales prices or official closing prices taken from the primary market in which each security trades; such securities not traded on the valuation date are valued at the mean of the latest quoted bid and asked prices. Securities for which market quotations are not readily available, or whose values have been materially affected by events occurring before the fund’s pricing time but after the close of the securities’ primary markets, are valued by methods deemed by the board of trustees to represent fair value. Investments in Vanguard Market Liquidity Fund are valued at that fund’s net asset value.
2. Swap Contracts: The fund enters into swap transactions to earn the total return on a specified security or index. Under the terms of the swaps, the fund receives the total return (either receiving the increase or paying the decrease) on a reference index, applied to a notional principal amount. In return, the fund agrees to pay the counterparty a floating rate, which is reset periodically based on short-term interest rates, applied to the same notional amount. At the same time, the fund invests an amount approximating the notional amount of the swap in high-quality temporary cash investments.
The notional amounts of swap contracts are not recorded in the Statement of Net Assets. Swaps are valued daily based on market quotations received from independent pricing services or recognized dealers and the change in value is recorded as unrealized appreciation (depreciation) until periodic payments are made, or the swap terminates, at which time realized gain (loss) is recorded. The primary risk associated with the swaps is that a counterparty will default on its obligation to pay net amounts due to the fund. The fund’s maximum risk of loss from counterparty credit risk is the amount of unrealized appreciation on the swap contract. This risk is mitigated by entering into swaps only with highly rated counterparties, by a master netting arrangement between the fund and the counterparty, and by the posting of collateral by the counterparty. The swap contracts contain provisions whereby a counterparty may terminate open contracts if the fund’s net assets decline below a certain level, triggering a payment by the fund if the fund is in a net liability position at the time of the termination. The payment amount would be reduced by any collateral the fund has posted. Any securities posted as collateral for open contracts are noted in the Statement of Net Assets.
3. Federal Income Taxes: The fund intends to continue to qualify as a regulated investment company and distribute all of its taxable income. Management has analyzed the fund’s tax positions taken for all open federal income tax years (January 31, 2008–2011), and for the period ended July 31, 2011, and has concluded that no provision for federal income tax is required in the fund’s financial statements.
4. Distributions: Distributions to shareholders are recorded on the ex-dividend date.
18
REIT Index Fund
5. Security Lending: The fund may lend its securities to qualified institutional borrowers to earn additional income. Security loans are required to be secured at all times by collateral at least equal to the market value of securities loaned. The fund invests cash collateral received in Vanguard Market Liquidity Fund, and records a liability for the return of the collateral, during the period the securities are on loan. Security lending income represents fees charged to borrowers plus income earned on investing cash collateral, less expenses associated with the loan.
6. Other: Distributions received from REITs are recorded on the ex-dividend date. Each REIT reports annually the tax character of its distributions. Dividend income, capital gain distributions received, and unrealized appreciation (depreciation) reflect the amounts of taxable income, capital gain, and return of capital reported by the REITs, and management’s estimates of such amounts for REIT distributions for which actual information has not been reported. Interest income includes income distributions received from Vanguard Market Liquidity Fund and is accrued daily. Security transactions are accounted for on the date securities are bought or sold. Costs used to determine realized gains (losses) on the sale of investment securities are those of the specific securities sold. Fees assessed on redemptions of capital shares are credited to paid-in capital.
Each class of shares has equal rights as to assets and earnings, except that each class separately bears certain class-specific expenses related to maintenance of shareholder accounts (included in Management and Administrative expenses) and shareholder reporting. Marketing and distribution expenses are allocated to each class of shares based on a method approved by the board of trustees. Income, other non-class-specific expenses, and gains and losses on investments are allocated to each class of shares based on its relative net assets.
B. The Vanguard Group furnishes at cost investment advisory, corporate management, administrative, marketing, and distribution services. The costs of such services are allocated to the fund under methods approved by the board of trustees. The fund has committed to provide up to 0.40% of its net assets in capital contributions to Vanguard. At July 31, 2011, the fund had contributed capital of $3,226,000 to Vanguard (included in Other Assets), representing 0.02% of the fund’s net assets and 1.29% of Vanguard’s capitalization. The fund’s trustees and officers are also directors and officers of Vanguard.
C. Various inputs may be used to determine the value of the fund’s investments. These inputs are summarized in three broad levels for financial statement purposes. The inputs or methodologies used to value securities are not necessarily an indication of the risk associated with investing in those securities.
Level 1—Quoted prices in active markets for identical securities.
Level 2—Other significant observable inputs (including quoted prices for similar securities, interest rates, prepayment speeds, credit risk, etc.).
Level 3—Significant unobservable inputs (including the fund’s own assumptions used to determine the fair value of investments).
The following table summarizes the fund’s investments as of July 31, 2011, based on the inputs used to value them:
| Level 1 | Level 2 | Level 3 | |
| Investments | ($000) | ($000) | ($000) |
| Real Estate Investment Trusts | 20,810,508 | — | — |
| Temporary Cash Investments | 171,754 | — | — |
| Swap Contracts—Assets | — | 28,913 | — |
| Swap Contracts—Liabilities | — | (1,729) | — |
| Total | 20,982,262 | 27,184 | — |
19
REIT Index Fund
D. At July 31, 2011, the fund had the following open total return swap contracts:
| Floating | Unrealized | ||||
| Notional | Interest Rate | Appreciation | |||
| Termination | Amount | Received | (Depreciation) | ||
| Reference Entity | Date | Counterparty | ($000) | (Paid) | ($000) |
| MSCI US REIT Total Return | |||||
| Swap Gross Index | 8/4/11 | GSI | 76,981 | (0.035%)1 | 27,983 |
| CommonWealth REIT | 7/2/12 | GSI | 25,840 | (0.536%)2 | (1,729) |
| Senior Housing Properties Trust | 7/11/12 | GSI | 45,315 | (0.535%)2 | 861 |
| Senior Housing Properties Trust | 7/12/12 | GSI | 2,363 | (0.556%)2 | 30 |
| Hospitality Properties Trust | 8/30/12 | GSI | 7,536 | (0.537%)–(0.541%)2 | 39 |
GSI—Goldman Sachs International.
1 Based on one-month London InterBank Offered Rate (LIBOR) as of the most recent payment date less a 0.15% spread.
2 Based on one-month London InterBank Offered Rate (LIBOR) as of the most recent payment date plus a 0.35% spread.
At July 31, 2011, the counterparty had deposited in segregated accounts securities with a value sufficient to cover substantially all amounts due to the fund in connection with open swap contracts.
Realized and unrealized gains (losses) on certain of the fund’s swap contracts are treated as ordinary income (loss) for tax purposes. Accordingly, realized losses of $160,000 on swap contracts have been reclassified from accumulated net realized losses to overdistributed net investment income.
E. Distributions are determined on a tax basis and may differ from net investment income and realized capital gains for financial reporting purposes. Differences may be permanent or temporary. Permanent differences are reclassified among capital accounts in the financial statements to reflect their tax character. Temporary differences arise when certain items of income, expense, gain, or loss are recognized in different periods for financial statement and tax purposes; these differences will reverse at some time in the future. Differences in classification may also result from the treatment of short-term gains as ordinary income for tax purposes.
During the six months ended July 31, 2011, the fund realized $193,023,000 of net capital gains resulting from in-kind redemptions—in which shareholders exchanged fund shares for securities held by the fund rather than for cash. Because such gains are not taxable to the fund, and are not distributed to shareholders, they have been reclassified from accumulated net realized losses to paid-in capital.
The fund’s tax-basis capital gains and losses are determined only at the end of each fiscal year. For tax purposes, at January 31, 2011, the fund had available capital loss carryforwards totaling $73,864,000 to offset future net capital gains through January 31, 2018. In addition, the fund realized losses of $178,176,000 during the period from November 1, 2010, through January 31, 2011, which are deferred and will be treated as realized for tax purposes in fiscal 2012. The fund will use these capital losses to offset net taxable capital gains, if any, realized during the year ending January 31, 2012; should the fund realize net capital losses for the year, the losses will be added to the loss carryforward balance above.
At July 31, 2011, the cost of investment securities for tax purposes was $18,067,260,000. Net unrealized appreciation of investment securities for tax purposes was $2,915,002,000, consisting of unrealized gains of $3,560,903,000 on securities that had risen in value since their purchase and $645,901,000 in unrealized losses on securities that had fallen in value since their purchase.
20
REIT Index Fund
F. During the six months ended July 31, 2011, the fund purchased $3,140,865,000 of investment securities and sold $1,358,640,000 of investment securities, other than temporary cash investments.
G. Capital share transactions for each class of shares were:
| Six Months Ended | Year Ended | |||
| July 31, 2011 | January 31, 2011 | |||
| Amount | Shares | Amount | Shares | |
| ($000) | (000) | ($000) | (000) | |
| Investor Shares | ||||
| Issued | 366,520 | 18,613 | 1,119,064 | 66,009 |
| Issued in Lieu of Cash Distributions | 38,202 | 1,996 | 127,317 | 7,559 |
| Redeemed1 | (473,840) | (24,020) | (3,335,237) | (187,837) |
| Net Increase (Decrease)—Investor Shares | (69,118) | (3,411) | (2,088,856) | (114,269) |
| Admiral Shares | ||||
| Issued | 464,074 | 5,519 | 3,046,641 | 39,695 |
| Issued in Lieu of Cash Distributions | 69,144 | 846 | 76,303 | 1,031 |
| Redeemed1 | (281,656) | (3,345) | (306,082) | (4,162) |
| Net Increase (Decrease)—Admiral Shares | 251,562 | 3,020 | 2,816,862 | 36,564 |
| Signal Shares | ||||
| Issued | 348,089 | 15,453 | 321,123 | 16,049 |
| Issued in Lieu of Cash Distributions | 13,069 | 599 | 19,720 | 1,017 |
| Redeemed1 | (128,651) | (5,744) | (175,293) | (8,979) |
| Net Increase (Decrease)—Signal Shares | 232,507 | 10,308 | 165,550 | 8,087 |
| Institutional Shares | ||||
| Issued | 346,434 | 26,527 | 520,734 | 46,474 |
| Issued in Lieu of Cash Distributions | 25,290 | 2,000 | 43,165 | 3,829 |
| Redeemed1 | (106,088) | (8,104) | (218,385) | (19,340) |
| Net Increase (Decrease)—Institutional Shares | 265,636 | 20,423 | 345,514 | 30,963 |
| ETF Shares | ||||
| Issued | 1,572,224 | 26,477 | 2,900,778 | 55,854 |
| Issued in Lieu of Cash Distributions | — | — | — | — |
| Redeemed1 | (422,936) | (7,100) | (1,280,766) | (25,200) |
| Net Increase (Decrease)—ETF Shares | 1,149,288 | 19,377 | 1,620,012 | 30,654 |
| 1 Net of redemption fees for fiscal 2012 and 2011 of $394,000 and $1,715,000, respectively (fund totals). | ||||
21
REIT Index Fund
H. Certain of the fund’s investments are in companies that are considered to be affiliated companies of the fund because the fund owns more than 5% of the outstanding voting securities of the company. Transactions during the period in securities of these companies were as follows:
| Current Period Transactions | |||||
| Jan. 31, 2011 | Proceeds from | July 31, 2011 | |||
| Market | Purchases | Securities | Dividend | Market | |
| Value | at Cost | Sold | Income | Value | |
| ($000) | ($000) | ($000) | ($000) | ($000) | |
| Acadia Realty Trust | 40,311 | 5,060 | 2,823 | 670 | 48,181 |
| Alexandria Real Estate | |||||
| Equities Inc. | 226,629 | 54,377 | 16,057 | 2,493 | 282,197 |
| AMB Property Corp. | 306,798 | 29,936 | 21,891 | 3,351 | NA1 |
| American Campus | |||||
| Communities Inc. | 114,126 | 16,728 | 7,606 | 432 | 141,467 |
| Apartment Investment & | |||||
| Management Co. | 162,533 | 19,279 | 10,003 | 153 | 183,595 |
| Associated Estates Realty Corp. | 32,287 | 4,677 | 1,761 | 794 | 42,863 |
| AvalonBay Communities Inc. | 536,504 | 70,015 | 37,559 | 4,522 | 656,567 |
| BioMed Realty Trust Inc. | 124,720 | 16,865 | 7,869 | 1,745 | 146,646 |
| Boston Properties Inc. | 714,506 | 98,197 | 43,908 | 6,043 | 870,652 |
| Brandywine Realty Trust | 83,207 | 11,256 | 5,446 | 2,155 | 91,820 |
| BRE Properties Inc. | 155,336 | 46,130 | 12,241 | 1,566 | 219,376 |
| Camden Property Trust | 201,759 | 30,926 | 10,947 | 2,296 | 266,438 |
| Campus Crest Communities Inc. | — | 22,547 | 187 | 275 | 20,960 |
| CapLease Inc. | 17,153 | 4,067 | 931 | 148 | 16,354 |
| CBL & Associates Properties Inc. | 121,604 | 23,675 | 7,406 | 2,923 | 142,081 |
| Chesapeake Lodging Trust | 17,155 | 14,536 | 1,201 | 662 | 27,805 |
| Cogdell Spencer Inc. | — | 16,641 | 139 | 272 | 16,409 |
| Colonial Properties Trust | NA2 | 15,263 | 4,229 | 737 | 91,297 |
| CommonWealth REIT | 104,486 | 24,998 | 32,376 | 3,193 | NA3 |
| Coresite Realty Corp. | — | 19,906 | 152 | 143 | 18,868 |
| Corporate Office Properties Trust | 130,927 | 24,844 | 9,097 | 2,549 | 125,767 |
| Cousins Properties Inc. | NA2 | 5,036 | 2,882 | 367 | 45,187 |
| DCT Industrial Trust Inc. | 63,617 | 17,687 | 4,101 | 1,154 | 75,721 |
| DiamondRock Hospitality Co. | 109,137 | 12,035 | 7,185 | 1,485 | 96,330 |
| Digital Realty Trust Inc. | 258,083 | 42,347 | 15,894 | 6,904 | 317,957 |
| Douglas Emmett Inc. | NA2 | 20,478 | 5,997 | — | 134,416 |
| Duke Realty Corp. | 187,260 | 22,917 | 13,099 | 2,115 | 201,833 |
| DuPont Fabros Technology Inc. | 73,806 | 9,990 | 4,097 | 753 | 88,282 |
| EastGroup Properties Inc. | 63,886 | 7,673 | 4,629 | 1,335 | 68,361 |
| Education Realty Trust Inc. | 29,855 | 3,858 | 1,471 | — | 36,124 |
| Entertainment Properties Trust | 116,245 | 14,126 | 8,513 | 2,811 | 123,013 |
| Equity Lifestyle Properties Inc. | 90,236 | 34,377 | 5,303 | 1,197 | 134,456 |
22
REIT Index Fund
| Current Period Transactions | |||||
| Jan. 31, 2011 | Proceeds from | July 31, 2011 | |||
| Market | Purchases | Securities | Dividend | Market | |
| Value | at Cost | Sold | Income | Value | |
| ($000) | ($000) | ($000) | ($000) | ($000) | |
| Equity Residential | 834,696 | 130,071 | 53,326 | 4,611 | 1,033,265 |
| Essex Property Trust Inc. | 191,192 | 34,171 | 10,785 | 3,207 | 257,049 |
| Extra Space Storage Inc. | 86,814 | 16,947 | 6,730 | 1,181 | 106,411 |
| Federal Realty Investment Trust | 268,442 | 33,914 | 20,634 | 4,426 | 305,473 |
| FelCor Lodging Trust Inc. | 37,074 | 12,112 | 4,395 | — | 33,601 |
| First Industrial Realty Trust Inc. | NA2 | 22,499 | 4,497 | — | 55,369 |
| First Potomac Realty Trust | 42,369 | 5,735 | 2,326 | 819 | 44,392 |
| Franklin Street Properties Corp. | NA2 | 6,794 | 2,942 | 1,080 | 52,615 |
| Glimcher Realty Trust | 46,936 | 6,135 | 2,748 | 149 | 56,008 |
| HCP Inc. | 735,442 | 168,108 | 57,710 | 11,769 | 838,189 |
| Health Care REIT Inc. | 386,747 | 130,267 | 34,513 | 7,324 | 516,258 |
| Healthcare Realty Trust Inc. | 72,625 | 11,887 | 3,807 | 1,150 | 74,988 |
| Hersha Hospitality Trust Class A | NA2 | 6,961 | 2,930 | 312 | 45,427 |
| Highwoods Properties Inc. | 127,528 | 15,849 | 9,388 | 1,647 | 140,543 |
| Home Properties Inc. | 113,412 | 14,444 | 7,089 | 1,252 | 141,656 |
| Hospitality Properties Trust | 166,756 | 18,863 | 26,237 | 5,968 | 161,895 |
| Host Hotels & Resorts Inc. | 666,656 | 83,750 | 36,623 | 1,884 | 612,969 |
| Inland Real Estate Corp. | NA2 | 9,271 | 1,788 | 1,087 | 44,128 |
| Investors Real Estate Trust | 37,726 | 4,288 | 1,556 | 613 | 36,755 |
| Kilroy Realty Corp. | 108,501 | 25,517 | 8,430 | 778 | 126,659 |
| Kimco Realty Corp. | 398,942 | 49,929 | 30,595 | 5,743 | 439,593 |
| Kite Realty Group Trust | 18,139 | 1,782 | 1,797 | 28 | 15,567 |
| LaSalle Hotel Properties | 105,317 | 30,088 | 7,272 | 946 | 115,542 |
| Lexington Realty Trust | NA2 | 14,036 | 4,810 | 1,369 | 67,711 |
| Liberty Property Trust | 214,922 | 24,947 | 13,373 | 5,282 | 221,496 |
| LTC Properties Inc. | NA2 | 14,409 | 2,357 | 1,197 | 46,129 |
| Macerich Co. | 344,024 | 43,381 | 26,480 | 3,148 | 393,615 |
| Mack-Cali Realty Corp. | 151,101 | 30,479 | 11,260 | 3,590 | 162,678 |
| Medical Properties Trust Inc. | 66,357 | 8,291 | 4,721 | 1,415 | 74,738 |
| Mid-America Apartment | |||||
| Communities Inc. | 113,621 | 22,463 | 5,926 | 1,564 | 143,929 |
| National Retail Properties Inc. | 112,590 | 13,656 | 7,670 | 3,327 | 119,635 |
| Nationwide Health Properties Inc. | 252,397 | 32,934 | 14,298 | 5,736 | NA4 |
| Omega Healthcare Investors Inc. | 114,744 | 18,002 | 5,735 | 3,114 | 111,828 |
| Parkway Properties Inc. | 20,131 | 2,048 | 1,036 | 121 | 22,013 |
| Pebblebrook Hotel Trust | 42,336 | 19,943 | 3,601 | 585 | 55,671 |
| Pennsylvania REIT | 39,004 | 4,921 | 2,862 | 882 | 43,726 |
23
| REIT Index Fund | |||||
| Current Period Transactions | |||||
| Jan. 31, 2011 | Proceeds from | July 31, 2011 | |||
| Market | Purchases | Securities | Dividend | Market | |
| Value | at Cost | Sold | Income | Value | |
| ($000) | ($000) | ($000) | ($000) | ($000) | |
| Piedmont Office Realty Trust Inc. | |||||
| Class A | NA2 | 103,383 | 7,239 | 4,248 | 201,989 |
| Post Properties Inc. | 97,936 | 12,425 | 6,981 | 69 | 118,066 |
| ProLogis | 451,601 | 51,965 | 68,534 | 3,406 | NA1 |
| ProLogis Inc. | NA1 | 79,280 | 44,679 | — | 920,573 |
| Ramco-Gershenson | |||||
| Properties Trust | 25,193 | 3,665 | 1,038 | 513 | 26,533 |
| Realty Income Corp. | 222,337 | 44,022 | 16,545 | 4,518 | 232,282 |
| Regency Centers Corp. | 191,767 | 23,369 | 14,026 | 2,351 | 209,404 |
| Retail Opportunity | |||||
| Investments Corp. | 22,249 | 2,469 | 1,284 | 399 | 26,504 |
| Sabra Healthcare REIT Inc. | 23,841 | 12,291 | 1,009 | 449 | 28,953 |
| Senior Housing Properties Trust | 170,540 | 28,707 | 51,657 | 4,078 | NA3 |
| Simon Property Group Inc. | 1,614,275 | 217,146 | 136,103 | 20,664 | 2,006,606 |
| SL Green Realty Corp. | 309,255 | 40,711 | 22,151 | 878 | 367,949 |
| Sovran Self Storage Inc. | 57,636 | 7,115 | 4,111 | 901 | 63,854 |
| Strategic Hotels & Resorts Inc. | 45,290 | 6,117 | 9,275 | — | NA3 |
| Sun Communities Inc. | NA2 | 8,275 | 1,376 | 258 | 43,116 |
| Sunstone Hotel Investors Inc. | 65,475 | 7,553 | 4,784 | — | 59,626 |
| Tanger Factory Outlet Centers | 114,860 | 14,002 | 7,912 | 1,443 | 126,978 |
| Taubman Centers Inc. | 155,550 | 21,170 | 9,535 | 1,887 | 190,247 |
| UDR Inc. | 228,881 | 76,676 | 14,810 | 1,519 | 320,823 |
| Universal Health Realty | |||||
| Income Trust | 23,004 | 2,999 | 900 | 584 | 28,248 |
| U-Store-It Trust | NA2 | 10,493 | 2,339 | 312 | 56,789 |
| Ventas Inc. | 473,402 | 107,366 | 29,498 | 11,016 | 842,894 |
| Vornado Realty Trust | NA2 | 100,583 | 56,639 | 5,244 | 879,275 |
| Washington REIT | 104,158 | 16,741 | 5,268 | 1,998 | 120,119 |
| Weingarten Realty Investors | 152,390 | 18,772 | 11,231 | 2,249 | 167,499 |
| Winthrop Realty Trust | NA2 | 5,025 | 798 | 439 | 18,202 |
| 14,548,347 | 211,970 | 18,505,073 | |||
1 Not applicable—In June 2011, AMB Property Corp. merged with ProLogis to form ProLogis Inc.
2 Not applicable—At January 31, 2011, the issuer was not an affiliated company of the fund.
3 Not applicable—At July 31, 2011, the security was still held, but the issuer was no longer an affiliated company of the fund.
4 Not applicable—In July 2011, Nationwide Health Properties Inc. merged into Ventas Inc.
I. In preparing the financial statements as of July 31, 2011, management considered the impact of subsequent events for potential recognition or disclosure in these financial statements.
24
About Your Fund’s Expenses
As a shareholder of the fund, you incur ongoing costs, which include costs for portfolio management, administrative services, and shareholder reports (like this one), among others. Operating expenses, which are deducted from a fund’s gross income, directly reduce the investment return of the fund.
A fund’s expenses are expressed as a percentage of its average net assets. This figure is known as the expense ratio. The following examples are intended to help you understand the ongoing costs (in dollars) of investing in your fund and to compare these costs with those of other mutual funds. The examples are based on an investment of $1,000 made at the beginning of the period shown and held for the entire period.
The accompanying table illustrates your fund’s costs in two ways:
• Based on actual fund return. This section helps you to estimate the actual expenses that you paid over the period. The ”Ending Account Value“ shown is derived from the fund‘s actual return, and the third column shows the dollar amount that would have been paid by an investor who started with $1,000 in the fund. You may use the information here, together with the amount you invested, to estimate the expenses that you paid over the period.
To do so, simply divide your account value by $1,000 (for example, an $8,600 account value divided by $1,000 = 8.6), then multiply the result by the number given for your fund under the heading ”Expenses Paid During Period.“
• Based on hypothetical 5% yearly return. This section is intended to help you compare your fund‘s costs with those of other mutual funds. It assumes that the fund had a yearly return of 5% before expenses, but that the expense ratio is unchanged. In this case—because the return used is not the fund’s actual return—the results do not apply to your investment. The example is useful in making comparisons because the Securities and Exchange Commission requires all mutual funds to calculate expenses based on a 5% return. You can assess your fund’s costs by comparing this hypothetical example with the hypothetical examples that appear in shareholder reports of other funds.
Note that the expenses shown in the table are meant to highlight and help you compare ongoing costs only and do not reflect transaction costs incurred by the fund for buying and selling securities. Further, the expenses do not include any purchase, redemption, or account service fees described in the fund prospectus. If such fees were applied to your account, your costs would be higher. Your fund does not carry a “sales load.”
The calculations assume no shares were bought or sold during the period. Your actual costs may have been higher or lower, depending on the amount of your investment and the timing of any purchases or redemptions.
You can find more information about the fund’s expenses, including annual expense ratios, in the Financial Statements section of this report. For additional information on operating expenses and other shareholder costs, please refer to your fund’s current prospectus.
25
| Six Months Ended July 31, 2011 | |||
| Beginning | Ending | Expenses | |
| Account Value | Account Value | Paid During | |
| REIT Index Fund | 1/31/2011 | 7/31/2011 | Period |
| Based on Actual Fund Return | |||
| Investor Shares | $1,000.00 | $1,083.58 | $1.24 |
| Admiral Shares | 1,000.00 | 1,084.57 | 0.52 |
| Signal Shares | 1,000.00 | 1,084.41 | 0.52 |
| Institutional Shares | 1,000.00 | 1,084.83 | 0.41 |
| ETF Shares | 1,000.00 | 1,084.57 | 0.52 |
| Based on Hypothetical 5% Yearly Return | |||
| Investor Shares | $1,000.00 | $1,023.60 | $1.20 |
| Admiral Shares | 1,000.00 | 1,024.30 | 0.50 |
| Signal Shares | 1,000.00 | 1,024.30 | 0.50 |
| Institutional Shares | 1,000.00 | 1,024.40 | 0.40 |
| ETF Shares | 1,000.00 | 1,024.30 | 0.50 |
The calculations are based on expenses incurred in the most recent six-month period. The fund’s annualized six-month expense ratios for that period are 0.24% for Investor Shares, 0.10% for Admiral Shares, 0.10% for Signal Shares, 0.08% for Institutional Shares, and 0.10% for ETF Shares. The dollar amounts shown as “Expenses Paid” are equal to the annualized expense ratio multiplied by the average account value over the period, multiplied by the number of days in the most recent six-month period, then divided by the number of days in the most recent 12-month period.
26
Trustees Approve Advisory Arrangement
The board of trustees of Vanguard REIT Index Fund has renewed the fund’s investment advisory arrangement with The Vanguard Group, Inc. Vanguard—through its Quantitative Equity Group—serves as the investment advisor to the fund. The board determined that continuing the fund’s internalized management structure was in the best interests of the fund and its shareholders.
The board based its decision upon an evaluation of the advisor’s investment staff, portfolio management process, and performance. The trustees considered the factors discussed below, among others. However, no single factor determined whether the board approved the arrangement. Rather, it was the totality of the circumstances that drove the board’s decision.
Nature, extent, and quality of services
The board considered the quality of the fund’s investment management over both the short and long term, and took into account the organizational depth and stability of the advisor. The board noted that Vanguard has been managing investments for more than three decades. The Quantitative Equity Group adheres to a sound, disciplined investment management process; the team has considerable experience, stability, and depth.
The board concluded that Vanguard’s experience, stability, depth, and performance, among other factors, warranted continuation of the advisory arrangement.
Investment performance
The board considered the short- and long-term performance of the fund, including any periods of outperformance or underperformance of its target index and peer group. The board concluded that the fund has performed in line with expectations, and that its results have been consistent with its investment strategy. Information about the fund’s most recent performance can be found in the Performance Summary section of this report.
Cost
The board concluded that the fund’s expense ratio was well below the average expense ratio charged by funds in its peer group and that the fund’s advisory fee rate was also well below its peer-group average. Information about the fund’s expenses appears in the About Your Fund’s Expenses section of this report as well as in the Financial Statements section.
The board does not conduct a profitability analysis of Vanguard, because of Vanguard’s unique “at-cost” structure. Unlike most other mutual fund management companies, Vanguard is owned by the funds it oversees, and produces “profits” only in the form of reduced expenses for fund shareholders.
The benefit of economies of scale
The board concluded that the fund’s low-cost arrangement with Vanguard ensures that the fund will realize economies of scale as it grows, with the cost to shareholders declining as the fund’s assets increase.
The board will consider whether to renew the advisory arrangement again after a one-year period.
27
Glossary
Beta. A measure of the magnitude of a fund’s past share-price fluctuations in relation to the ups and downs of a given market index. The index is assigned a beta of 1.00. Compared with a given index, a fund with a beta of 1.20 typically would have seen its share price rise or fall by 12% when the index rose or fell by 10%. For this report, beta is based on returns over the past 36 months for both the fund and the index. Note that a fund’s beta should be reviewed in conjunction with its R-squared (see definition). The lower the R-squared, the less correlation there is between the fund and the index, and the less reliable beta is as an indicator of volatility.
Dividend Yield. Dividend income earned by stocks, expressed as a percentage of the aggregate market value (or of net asset value, for a fund). The yield is determined by dividing the amount of the annual dividends by the aggregate value (or net asset value) at the end of the period. For a fund, the dividend yield is based solely on stock holdings and does not include any income produced by other investments. This yield may include some payments that represent a return of capital, capital gains distributions, or both by the underlying stocks.
Earnings Growth Rate. The average annual rate of growth in earnings over the past five years for the stocks now in a fund.
Expense Ratio. The percentage of a fund’s average net assets used to pay its annual administrative and advisory expenses. These expenses directly reduce returns to investors.
Foreign Holdings. The percentage of a fund represented by securities or depositary receipts of companies based outside the United States.
Inception Date. The date on which the assets of a fund (or one of its share classes) are first invested in accordance with the fund’s investment objective. For funds with a subscription period, the inception date is the day after that period ends. Investment performance is measured from the inception date.
Median Market Cap. An indicator of the size of companies in which a fund invests; the midpoint of market capitalization (market price x shares outstanding) of a fund’s stocks, weighted by the proportion of the fund’s assets invested in each stock. Stocks representing half of the fund’s assets have market capitalizations above the median, and the rest are below it.
Price/Book Ratio. The share price of a stock divided by its net worth, or book value, per share. For a fund, the weighted average price/book ratio of the stocks it holds.
Price/Earnings Ratio. The ratio of a stock’s current price to its per-share earnings over the past year. For a fund, the weighted average P/E of the stocks it holds. P/E is an indicator of market expectations about corporate prospects; the higher the P/E, the greater the expectations for a company’s future growth.
R-Squared. A measure of how much of a fund’s past returns can be explained by the returns from the market in general, as measured by a given index. If a fund’s total returns were precisely synchronized with an index’s returns, its R-squared would be 1.00. If the fund’s returns bore no relationship to the index’s returns, its R-squared would be 0. For this report, R-squared is based on returns over the past 36 months for both the fund and the index.
28
Return on Equity. The annual average rate of return generated by a company during the past five years for each dollar of shareholder’s equity (net income divided by shareholder’s equity). For a fund, the weighted average return on equity for the companies whose stocks it holds.
Short-Term Reserves. The percentage of a fund invested in highly liquid, short-term securities that can be readily converted to cash.
Turnover Rate. An indication of the fund’s trading activity. Funds with high turnover rates incur higher transaction costs and may be more likely to distribute capital gains (which may be taxable to investors). The turnover rate excludes in-kind transactions, which have minimal impact on costs.
29
This page intentionally left blank.
This page intentionally left blank.
The People Who Govern Your Fund
The trustees of your mutual fund are there to see that the fund is operated and managed in your best interests since, as a shareholder, you are a part owner of the fund. Your fund’s trustees also serve on the board of directors of The Vanguard Group, Inc., which is owned by the Vanguard funds and provides services to them on an at-cost basis.
A majority of Vanguard’s board members are independent, meaning that they have no affiliation with Vanguard or the funds they oversee, apart from the sizable personal investments they have made as private individuals. The independent board members have distinguished backgrounds in business, academia, and public service. Each of the trustees and executive officers oversees 178 Vanguard funds.
The following table provides information for each trustee and executive officer of the fund. More information about the trustees is in the Statement of Additional Information, which can be obtained, without charge, by contacting Vanguard at 800-662-7447, or online at vanguard.com.
| Interested Trustee1 | and President (2006–2008) of Rohm and Haas Co. |
| (chemicals); Director of Tyco International, Ltd. | |
| F. William McNabb III | (diversified manufacturing and services) and Hewlett- |
| Born 1957. Trustee Since July 2009. Chairman of the | Packard Co. (electronic computer manufacturing); |
| Board. Principal Occupation(s) During the Past Five | Senior Advisor at New Mountain Capital; Trustee |
| Years: Chairman of the Board of The Vanguard Group, | of The Conference Board; Member of the Board of |
| Inc., and of each of the investment companies served | Managers of Delphi Automotive LLP (automotive |
| by The Vanguard Group, since January 2010; Director | components). |
| of The Vanguard Group since 2008; Chief Executive | |
| Officer and President of The Vanguard Group and of | Amy Gutmann |
| each of the investment companies served by The | Born 1949. Trustee Since June 2006. Principal |
| Vanguard Group since 2008; Director of Vanguard | Occupation(s) During the Past Five Years: President |
| Marketing Corporation; Managing Director of The | of the University of Pennsylvania; Christopher H. |
| Vanguard Group (1995–2008). | Browne Distinguished Professor of Political Science |
| in the School of Arts and Sciences with secondary | |
| appointments at the Annenberg School for Commu- | |
| Independent Trustees | nication and the Graduate School of Education |
| of the University of Pennsylvania; Director of | |
| Emerson U. Fullwood | Carnegie Corporation of New York, Schuylkill River |
| Born 1948. Trustee Since January 2008. Principal | Development Corporation, and Greater Philadelphia |
| Occupation(s) During the Past Five Years: Executive | Chamber of Commerce; Trustee of the National |
| Chief Staff and Marketing Officer for North America | Constitution Center; Chair of the Presidential |
| and Corporate Vice President (retired 2008) of Xerox | Commission for the Study of Bioethical Issues. |
| Corporation (document management products and | |
| services); Executive in Residence and 2010 | JoAnn Heffernan Heisen |
| Distinguished Minett Professor at the Rochester | Born 1950. Trustee Since July 1998. Principal |
| Institute of Technology; Director of SPX Corporation | Occupation(s) During the Past Five Years: Corporate |
| (multi-industry manufacturing), the United Way of | Vice President and Chief Global Diversity Officer |
| Rochester, Amerigroup Corporation (managed health | (retired 2008) and Member of the Executive |
| care), the University of Rochester Medical Center, | Committee (1997–2008) of Johnson & Johnson |
| Monroe Community College Foundation, and North | (pharmaceuticals/consumer products); Director of |
| Carolina A&T University. | Skytop Lodge Corporation (hotels), the University |
| Medical Center at Princeton, the Robert Wood | |
| Rajiv L. Gupta | Johnson Foundation, and the Center for Work Life |
| Born 1945. Trustee Since December 2001.2 | Policy; Member of the Advisory Board of the |
| Principal Occupation(s) During the Past Five Years: | Maxwell School of Citizenship and Public Affairs |
| Chairman and Chief Executive Officer (retired 2009) | at Syracuse University. |
| F. Joseph Loughrey | Thomas J. Higgins | |
| Born 1949. Trustee Since October 2009. Principal | Born 1957. Chief Financial Officer Since September | |
| Occupation(s) During the Past Five Years: President | 2008. Principal Occupation(s) During the Past Five | |
| and Chief Operating Officer (retired 2009) and Vice | Years: Principal of The Vanguard Group, Inc.; Chief | |
| Chairman of the Board (2008–2009) of Cummins Inc. | Financial Officer of each of the investment companies | |
| (industrial machinery); Director of SKF AB (industrial | served by The Vanguard Group since 2008; Treasurer | |
| machinery), Hillenbrand, Inc. (specialized consumer | of each of the investment companies served by The | |
| services), the Lumina Foundation for Education, and | Vanguard Group (1998–2008). | |
| Oxfam America; Chairman of the Advisory Council | ||
| for the College of Arts and Letters and Member | Kathryn J. Hyatt | |
| of the Advisory Board to the Kellogg Institute for | Born 1955. Treasurer Since November 2008. Principal | |
| International Studies at the University of Notre Dame. | Occupation(s) During the Past Five Years: Principal | |
| of The Vanguard Group, Inc.; Treasurer of each of | ||
| André F. Perold | the investment companies served by The Vanguard | |
| Born 1952. Trustee Since December 2004. Principal | Group since 2008; Assistant Treasurer of each of the | |
| Occupation(s) During the Past Five Years: George | investment companies served by The Vanguard Group | |
| Gund Professor of Finance and Banking at the Harvard | (1988–2008). | |
| Business School (retired July 2011); Chief Investment | ||
| Officer and co-Managing Partner of HighVista | Heidi Stam | |
| Strategies LLC (private investment firm); Director of | Born 1956. Secretary Since July 2005. Principal | |
| Rand Merchant Bank; Overseer of the Museum of | Occupation(s) During the Past Five Years: Managing | |
| Fine Arts Boston. | Director of The Vanguard Group, Inc., since 2006; | |
| General Counsel of The Vanguard Group since 2005; | ||
| Alfred M. Rankin, Jr. | Secretary of The Vanguard Group and of each of the | |
| Born 1941. Trustee Since January 1993. Principal | investment companies served by The Vanguard Group | |
| Occupation(s) During the Past Five Years: Chairman, | since 2005; Director and Senior Vice President of | |
| President, and Chief Executive Officer of NACCO | Vanguard Marketing Corporation since 2005; | |
| Industries, Inc. (forklift trucks/housewares/lignite); | Principal of The Vanguard Group (1997–2006). | |
| Director of Goodrich Corporation (industrial products/ | ||
| aircraft systems and services) and the National | ||
| Association of Manufacturers; Chairman of the | Vanguard Senior Management Team | |
| Federal Reserve Bank of Cleveland; Vice Chairman | ||
| of University Hospitals of Cleveland; President of | R. Gregory Barton | Michael S. Miller |
| the Board of The Cleveland Museum of Art. | Mortimer J. Buckley | James M. Norris |
| Kathleen C. Gubanich | Glenn W. Reed | |
| Peter F. Volanakis | Paul A. Heller | George U. Sauter |
| Born 1955. Trustee Since July 2009. Principal | Martha G. King | |
| Occupation(s) During the Past Five Years: President | ||
| and Chief Operating Officer (retired 2010) of Corning | ||
| Incorporated (communications equipment); Director of | Chairman Emeritus and Senior Advisor | |
| Corning Incorporated (2000–2010) and Dow Corning | ||
| (2001–2010); Overseer of the Amos Tuck School of | John J. Brennan | |
| Business Administration at Dartmouth College. | Chairman, 1996–2009 | |
| Chief Executive Officer and President, 1996–2008 | ||
| Executive Officers | ||
| Founder | ||
| Glenn Booraem | ||
| Born 1967. Controller Since July 2010. Principal | John C. Bogle | |
| Occupation(s) During the Past Five Years: Principal | Chairman and Chief Executive Officer, 1974–1996 | |
| of The Vanguard Group, Inc.; Controller of each of | ||
| the investment companies served by The Vanguard | ||
| Group since 2010; Assistant Controller of each of | ||
| the investment companies served by The Vanguard | ||
| Group (2001–2010). | ||
1 Mr. McNabb is considered an “interested person,” as defined in the Investment Company Act of 1940, because he is an officer of the Vanguard funds.
2 December 2002 for Vanguard Equity Income Fund, Vanguard Growth Equity Fund, the Vanguard Municipal Bond Funds, and the Vanguard State Tax-Exempt Funds.
 | |
| P.O. Box 2600 | |
| Valley Forge, PA 19482-2600 |
Connect with Vanguard® > vanguard.com
| Fund Information > 800-662-7447 | The funds or securities referred to herein are not |
| Direct Investor Account Services > 800-662-2739 | sponsored, endorsed, or promoted by MSCI, and MSCI |
| bears no liability with respect to any such funds or | |
| Institutional Investor Services > 800-523-1036 | securities. For any such funds or securities, the |
| Text Telephone for People | prospectus or the Statement of Additional Information |
| With Hearing Impairment > 800-749-7273 | contains a more detailed description of the limited |
| relationship MSCI has with The Vanguard Group and | |
| This material may be used in conjunction | any related funds. |
| with the offering of shares of any Vanguard | |
| fund only if preceded or accompanied by | |
| the fund’s current prospectus. | |
| All comparative mutual fund data are from Lipper Inc. or | |
| Morningstar, Inc., unless otherwise noted. | |
| You can obtain a free copy of Vanguard’s proxy voting | |
| guidelines by visiting vanguard.com/proxyreporting or by | |
| calling Vanguard at 800-662-2739. The guidelines are | |
| also available from the SEC’s website, sec.gov. In | |
| addition, you may obtain a free report on how your fund | |
| voted the proxies for securities it owned during the 12 | |
| months ended June 30. To get the report, visit either | |
| vanguard.com/proxyreporting or sec.gov. | |
| You can review and copy information about your fund at | |
| the SEC’s Public Reference Room in Washington, D.C. To | |
| find out more about this public service, call the SEC at | |
| 202-551-8090. Information about your fund is also | |
| available on the SEC’s website, and you can receive | |
| copies of this information, for a fee, by sending a | |
| request in either of two ways: via e-mail addressed to | |
| publicinfo@sec.gov or via regular mail addressed to the | |
| Public Reference Section, Securities and Exchange | |
| Commission, Washington, DC 20549-1520. | |
| © 2011 The Vanguard Group, Inc. | |
| All rights reserved. | |
| Vanguard Marketing Corporation, Distributor. | |
| Q1232 092011 | |
| Vanguard Dividend Growth Fund |
| Semiannual Report |
| July 31, 2011 |
 |
> Vanguard Dividend Growth Fund returned 2.74% for the six months ended July 31, 2011.
> The fund’s return surpassed both that of its benchmark index and the average return of its peer funds.
> Health care holdings contributed the most to the fund’s return.
| Contents | |
| Your Fund’s Total Returns. | 1 |
| Chairman’s Letter. | 2 |
| Advisor’s Report. | 7 |
| Fund Profile. | 9 |
| Performance Summary. | 10 |
| Financial Statements. | 11 |
| About Your Fund’s Expenses. | 19 |
| Glossary. | 21 |
Please note: The opinions expressed in this report are just that—informed opinions. They should not be considered promises or advice.
Also, please keep in mind that the information and opinions cover the period through the date on the front of this report. Of course, the risks of investing in your fund are spelled out in the prospectus.
See the Glossary for definitions of investment terms used in this report.
Cover photograph: Jean Maher.
Your Fund’s Total Returns
| Six Months Ended July 31, 2011 | |
| Total | |
| Returns | |
| Vanguard Dividend Growth Fund | 2.74% |
| Dividend Achievers Select Index | 2.38 |
| Large-Cap Core Funds Average | 0.70 |
| Large-Cap Core Funds Average: Derived from data provided by Lipper Inc. | |
Your Fund’s Performance at a Glance
January 31, 2011 , Through July 31, 2011
| Distributions Per Share | ||||
| Starting | Ending | Income | Capital | |
| Share Price | Share Price | Dividends | Gains | |
| Vanguard Dividend Growth Fund | $14.68 | $14.93 | $0.155 | $0.000 |
1

Chairman’s Letter
Dear Shareholder,
For the six months ended July 31, 2011, Vanguard Dividend Growth Fund returned 2.74%. This return was slightly better than that of its benchmark, the Dividend Achievers Select Index, and exceeded the average return of large-cap core funds.
As the economy’s recovery turned rocky over the final three months of the period and the stock market slumped, the fund’s focus on relatively stable companies allowed it to weather the downturn a bit better than the broad market.
Large-cap health care stocks, historically a rich source of dividends, boosted the fund’s performance, as did its consumer staples and energy holdings. Poor stock selection in the consumer discretionary and industrial sectors hurt results.
Stocks worldwide crept higher in a treacherous marketplace
Global stock markets struggled to find direction during the past six months, as every positive signal seemed to be paired with its negative. The good news included surprisingly strong corporate profits, which proved a source of investor optimism through much of the period.
The counterpoint was a series of increasingly glum economic reports. Expectations that the U.S. economic expansion would accelerate in the second half of the year gave way
2
to anxiety about the possibility of recession. The Dow Jones U.S. Total Stock Market Index finished the period with a return of 1.55%. Across the globe, stock returns were similarly modest.
Bonds rallied in the U.S. market as investors sought safety
Bond prices climbed amid the turbulence. Investors sought refuge from a collection of troubles: Europe’s debt dramas, economic shocks produced by the Japanese tsunami and its aftermath, and prolonged debate over raising the U.S. debt ceiling. For the full six months, the broad U.S. taxable bond market returned more than 4%. (Rising prices are a mixed blessing, of course; they imply lower yields on future investment.)
The yields on money market instruments such as Treasury bills remained near 0%, consistent with the Federal Reserve Board’s target for short-term interest rates.
The U.S. credit downgrade: a cause for concern, not panic
On August 5, after the close of our reporting period, Standard & Poor’s downgraded its credit rating of U.S. debt from AAA to AA+. S&P said its action was prompted, in large part, by concern about “the effectiveness, stability, and predictability of American policymaking and political institutions”—in other words, the political gridlock on vivid display during the debt-ceiling debate.
| Market Barometer | |||
| Total Returns | |||
| Periods Ended July 31, 2011 | |||
| Six | One | Five Years | |
| Months | Year | (Annualized) | |
| Stocks | |||
| Russell 1000 Index (Large-caps) | 1.62% | 20.68% | 2.80% |
| Russell 2000 Index (Small-caps) | 2.63 | 23.92 | 4.00 |
| Dow Jones U.S. Total Stock Market Index | 1.55 | 20.83 | 3.27 |
| MSCI All Country World Index ex USA (International) | 1.39 | 17.36 | 3.18 |
| Bonds | |||
| Barclays Capital U.S. Aggregate Bond Index (Broad | |||
| taxable market) | 4.23% | 4.44% | 6.57% |
| Barclays Capital Municipal Bond Index (Broad | |||
| tax-exempt market) | 6.27 | 3.24 | 4.90 |
| Citigroup Three-Month U.S. Treasury Bill Index | 0.05 | 0.13 | 1.78 |
| CPI | |||
| Consumer Price Index | 2.59% | 3.63% | 2.11% |
3
The downgrade was controversial, and the other major rating agencies reaffirmed their decision to continue giving the highest ratings to U.S. debt. At Vanguard, our credit analysts and economists regularly assess the financial strength of the United States and other sovereign borrowers. Our confidence in the “full faith and credit” of the U.S. government remains unshaken, and we have cautioned investors against overreacting to the S&P downgrade.
Health care holdings paced fund’s performance
The Dividend Growth Fund invests in large companies with strong balance sheets that have the potential to increase their dividends over time. Wellington Management Company, the fund’s advisor, seeks companies that will increase their cash flow and earnings over time, eventually leading to larger dividend payouts to shareholders.
The fund trailed during the earlier stages of the financial markets’ recovery as opportunistic investors favored riskier, more speculative stocks. But its high-quality holdings held up relatively well both as the comeback continued and during the recent volatile stretch. Solid companies––whose capital resources, financial strength, and positive business outlook bode well for dividend increases––tended to be more attractive to the investment community than their smaller, less proven counterparts.
Expense Ratios
Your Fund Compared With Its Peer Group
| Peer Group | ||
| Fund | Average | |
| Dividend Growth Fund | 0.34% | 1.26% |
The fund expense ratio shown is from the prospectus dated May 26, 2011, and represents estimated costs for the current fiscal year. For the six months ended July 31, 2011, the fund’s annualized expense ratio was 0.34%. The peer-group expense ratio is derived from data provided by Lipper Inc. and captures information through year-end 2010.
Peer group: Large-Cap Core Funds.
4
Health care, the fund’s largest sector, contributed the most to returns. The advisor’s holdings also boosted performance relative to the benchmark. Especially notable were selections in the pharmaceutical industry, which is expected to benefit as health care spending increases along with wealth in emerging markets. Managed health care, which achieved steady growth in the face of fading regulatory concerns, was also a bright spot for the fund.
Two other sectors in which the fund had considerable exposure, consumer staples and energy, were also significant contributors to results. The advisor displayed prudent stock selection in both sectors, identifying, for example, top performers in the retail drug category while sidestepping trouble spots elsewhere in consumer staples. Its choices were also solid in the oil and gas industry. Utilities and telecommunication services, the fund’s sectors with the highest returns, were also its two smallest allocations and so boosted results only slightly.
Industrial stocks turned in the poorest showing for the fund, returning about –6% as factories in the United States and abroad, facing the lighter demand of a sputtering economy, continued to cut production. Although stock selection was subpar, the advisor’s decision to limit exposure to the sector limited losses.
While consumer discretionary stocks outpaced the broader market over the period as corporate earnings remained strong, the fund was held back by its holdings in this sector. The fund missed out, for example, on opportunities in the restaurant industry and in the specialty retail group. Results were mixed in information technology, where the advisor’s decision to double the sector weighting was offset by poor stock selection.
Look at the long term when creating an investment plan
Stocks declined in each of the final three months of the half-year, though these declines didn’t completely erase the gains from the first three months of the period. The return of turbulence to the market can be unsettling for investors, most of whom have fresh memories of the financial crisis of 2008–2009. It’s uncertain whether the market will rebound quickly from the latest turmoil or deteriorate further. The stock market can be wildly unpredictable, especially in the short term.
Of course, it can be tempting to react rashly when the markets don’t behave according to plan, but it’s crucial not to let short-term trends or market swings result in impulsive investment decisions. That’s why at Vanguard we counsel you to maintain a long-term approach. One of the best ways to do this is to create a diversified investment plan that includes
5
a mix of stocks, bonds, and short-term investments that matches your long-term goals, risk tolerance, and time horizon.
With its experienced managers, low-cost advantage, and emphasis on solid companies with the potential to increase their dividends, Vanguard Dividend Growth Fund can play an important role in such a long-term, well-diversified portfolio.
Thank you for entrusting your assets to Vanguard.
Sincerely,

F. William McNabb III
Chairman and Chief Executive Officer
August 10, 2011
6
Advisor’s Report
Vanguard Dividend Growth Fund returned about 3% for the six-month period ended July 31, 2011. The fund’s return exceeded that of the Dividend Achievers Select Index and the average return of its peer funds.
The investment environment
There seem to be three dimensions or aspects to the current investment environment. The first involves fundamentals: How is the global economy behaving, and how are individual companies doing? Second, there is the regulatory and political aspect; increasingly, the actions of governments and their related entities affect global markets. And finally, there is the market dimension: Are forces outside of fundamentals or the regulatory or political situation—such as rapid program trading or liquidity flows—driving the market? In our view, the excessive market volatility of late seems to have been driven largely by the second and third aspects rather than the first.
While this investment environment is a challenging one, uncertainty does present an opportunity to improve a portfolio if one remains narrowly focused on a well-conceived strategy. We think our approach, centered on quality and driven by a focus on dividend growth, will produce good long-term results.
The fund’s successes
On an absolute basis, most sectors contributed to the fund’s performance for the period, with the information technology, energy, and health care sectors contributing the most. Among the portfolio’s top absolute contributors were IBM, ADP, and McDonald’s.
Based on current data, the portfolio is expected to produce asset-weighted dividend growth of 14.7% for 2011. The current portfolio produced dividend growth of 14.2% in calendar 2010 and 9.8% in calendar 2009. [These figures aren’t comparable to the fund’s dividend distributions. They incorporate our projections and assume there is no change in the holdings, or significant cash flows into or out of the fund, over the entire period.] Our “run rate” calculation is a rough estimate of potential dividend growth, as it merely takes a company’s current declared dividend rate, annualizes that rate, and compares it to the previous calendar year’s actual dividend rate. It does not reflect dividend increases that may be announced later in the year, nor does it take into account the actual dollar size of the increases. Therefore, companies in the early stages of dividend growth tend to show large percentage increases when this calculation is used, even though their absolute cash dividend may be small. Despite these shortcomings, we believe the calculation provides a reasonably accurate report card.
Among the more notable run rate increases thus far in 2011 were those by Microsoft (16.4%) and General Dynamics (14.6%). While neither percentage represents the highest growth rates in the fund, they do represent healthy increases
7
by large, well-established companies with long histories of dividend growth. Such companies constitute the heart of the fund.
The fund’s shortfalls
The industrial sector failed to produce a positive return and was the largest detractor from performance. The financial and consumer discretionary sectors also failed to make a positive contribution, but their returns were only slightly negative. A number of individual stocks also detracted from the fund’s performance; PNC Financial, Waste Management, and Lowe’s were among the more noteworthy.
While we would prefer all stocks in the fund to perform well at all times, it is inevitable that some holdings will detract from the fund’s performance over a given period. We assess a stock’s contribution to the fund over a longer time frame and with an eye consistently focused on dividend action. We expect PNC Financial, Waste Management, and Lowe’s to raise their dividends meaningfully over the next five years.
The fund’s positioning and investment strategy
Our primary objective is to identify companies that we believe will steadily and reliably increase their dividend payments. We seek to fulfill this objective by carefully building the portfolio one stock at a time, giving central consideration to each company’s dividend growth prospects. Our industry weightings result from this process. The fund has significant positions in the health care, energy, consumer staples, and information technology sectors, while having less exposure to the utilities, telecommunication services, and financial sectors.
At our last writing, we asserted that “global economic conditions have undeniably improved.” That statement seems more open to question now, especially in light of several recent developments, including the U.S. debt rating downgrade and further deterioration in the European financial framework.
We believe our investment approach is designed to capture much of the upside in any global economic improvement. It’s also important to note that the high-quality business models that typify dividend-growing companies should help mitigate the risks that have become much more obvious of late.
Donald J. Kilbride
Senior Vice President and Equity Portfolio Manager
Wellington Management Company, LLP
August 11, 2011
8
Dividend Growth Fund
Fund Profile
As of July 31, 2011
| Portfolio Characteristics | |||
| Dividend | DJ | ||
| Achievers | U.S. Total | ||
| Select | Market | ||
| Fund | Index | Index | |
| Number of Stocks | 47 | 127 | 3,753 |
| Median Market Cap | $42.7B | $41.3B | $31.4B |
| Price/Earnings Ratio | 13.5x | 14.6x | 16.3x |
| Price/Book Ratio | 2.6x | 2.9x | 2.2x |
| Return on Equity | 24.0% | 23.4% | 19.0% |
| Earnings Growth Rate | 7.0% | 5.1% | 6.3% |
| Dividend Yield | 2.7% | 2.4% | 1.8% |
| Foreign Holdings | 6.3% | 0.0% | 0.0% |
| Turnover Rate | |||
| (Annualized) | 13% | — | — |
| Ticker Symbol | VDIGX | — | — |
| Expense Ratio1 | 0.34% | — | — |
| 30-Day SEC Yield | 2.25% | — | — |
| Short-Term Reserves | 3.5% | — | — |
| Sector Diversification (% of equity exposure) | |||
| Dividend | DJ | ||
| Achievers | U.S. Total | ||
| Select | Market | ||
| Fund | Index | Index | |
| Consumer | |||
| Discretionary | 9.6% | 12.6% | 12.3% |
| Consumer Staples | 15.3 | 23.9 | 9.8 |
| Energy | 12.6 | 15.5 | 11.5 |
| Financials | 8.4 | 6.5 | 15.3 |
| Health Care | 16.3 | 5.8 | 11.1 |
| Industrials | 14.7 | 21.3 | 11.1 |
| Information | |||
| Technology | 15.9 | 6.6 | 18.8 |
| Materials | 3.9 | 6.0 | 4.4 |
| Telecommunication | |||
| Services | 1.4 | 0.1 | 2.5 |
| Utilities | 1.9 | 1.7 | 3.2 |
| Volatility Measures | ||
| DJ | ||
| Dividend | U.S. Total | |
| Growth | Market | |
| Spliced Index | Index | |
| R-Squared | 0.95 | 0.95 |
| Beta | 0.81 | 0.77 |
| These measures show the degree and timing of the fund’s fluctuations compared with the indexes over 36 months. | ||
| Ten Largest Holdings (% of total net assets) | ||
| Automatic Data | Data Processing & | |
| Processing Inc. | Outsourced | |
| Services | 3.4% | |
| Exxon Mobil Corp. | Integrated Oil & | |
| Gas | 3.1 | |
| Microsoft Corp. | Systems Software | 3.0 |
| International Business | IT Consulting & | |
| Machines Corp. | Other Services | 2.9 |
| PepsiCo Inc. | Soft Drinks | 2.8 |
| Cardinal Health Inc. | Health Care | |
| Distributors | 2.7 | |
| General Dynamics Corp. | Aerospace & | |
| Defense | 2.7 | |
| Johnson & Johnson | Pharmaceuticals | 2.7 |
| BG Group plc | Integrated Oil & | |
| Gas | 2.7 | |
| Target Corp. | General | |
| Merchandise Stores | 2.6 | |
| Top Ten | 28.6% | |
| The holdings listed exclude any temporary cash investments and equity index products. | ||
Investment Focus
1 The expense ratio shown is from the prospectus dated May 26, 2011, and represents estimated costs for the current fiscal year. For the six months ended July 31, 2011, the annualized expense ratio was 0.34%.
9
Dividend Growth Fund
Performance Summary
All of the returns in this report represent past performance, which is not a guarantee of future results that may be achieved by the fund. (Current performance may be lower or higher than the performance data cited. For performance data current to the most recent month-end, visit our website at vanguard.com/performance.) Note, too, that both investment returns and principal value can fluctuate widely, so an investor’s shares, when sold, could be worth more or less than their original cost. The returns shown do not reflect taxes that a shareholder would pay on fund distributions or on the sale of fund shares.
Fiscal-Year Total Returns (%): January 31, 2001, Through July 31, 2011

Dividend Growth Spliced Index: Prior to December 6, 2002, the comparative benchmark was known as the Utilities Composite Index. The index weightings were: 40% S&P Utilities Index, 40% S&P Telephone Index, and 20% Lehman Brothers Utility Bond Index through April 30, 1999; 63.75% S&P Utilities Index, 21.25% S&P Telephone Index, and 15% Lehman Brothers Utility Bond Index through March 31, 2000; 75% S&P Utilities Index and 25% S&P Telephone Index through December 31, 2001; and 75% S&P Utilities Index and 25% S&P Integrated Telecommunication Services Index through December 6, 2002. The fund’s benchmark was the Russell 1000 Index through January 31, 2010, after which it was changed to the Dividend Achievers Select Index. The Dividend Achievers Select Index is administered exclusively for Vanguard by Mergent, Inc.
Note: Prior to December 6, 2002, the fund was known as the Utilities Income Fund. For 2012, performance data reflect the six months ended July 31, 2011.
Average Annual Total Returns: Periods Ended June 30, 2011
This table presents returns through the latest calendar quarter—rather than through the end of the fiscal period.
Securities and Exchange Commission rules require that we provide this information.
| Inception | One | Five | Ten | |
| Date | Year | Years | Years | |
| Dividend Growth Fund | 5/15/1992 | 29.51% | 6.03% | 3.63% |
See Financial Highlights for dividend and capital gains information.
10
Dividend Growth Fund
Financial Statements (unaudited)
Statement of Net Assets
As of July 31, 2011
The fund reports a complete list of its holdings in regulatory filings four times in each fiscal year, at the quarter-ends. For the second and fourth fiscal quarters, the lists appear in the fund’s semiannual and annual reports to shareholders. For the first and third fiscal quarters, the fund files the lists with the Securities and Exchange Commission on Form N-Q. Shareholders can look up the fund’s Forms N-Q on the SEC’s website at sec.gov. Forms N-Q may also be reviewed and copied at the SEC’s Public Reference Room (see the back cover of this report for further information).
| Market | ||
| Value | ||
| Shares | ($000) | |
| Common Stocks (96.5%) | ||
| Consumer Discretionary (9.2%) | ||
| Target Corp. | 2,970,434 | 152,948 |
| NIKE Inc. Class B | 1,264,408 | 113,986 |
| McDonald’s Corp. | 1,277,640 | 110,490 |
| Lowe’s Cos. Inc. | 4,580,667 | 98,851 |
| Mattel Inc. | 2,108,608 | 56,216 |
| 532,491 | ||
| Consumer Staples (14.8%) | ||
| PepsiCo Inc. | 2,483,236 | 159,027 |
| Sysco Corp. | 4,969,247 | 152,009 |
| Colgate-Palmolive Co. | 1,562,171 | 131,816 |
| Procter & Gamble Co. | 2,026,509 | 124,610 |
| CVS Caremark Corp. | 3,019,898 | 109,773 |
| Wal-Mart Stores Inc. | 1,710,447 | 90,158 |
| Coca-Cola Co. | 1,255,230 | 85,368 |
| 852,761 | ||
| Energy (12.2%) | ||
| Exxon Mobil Corp. | 2,218,673 | 177,028 |
| BG Group plc | 6,511,053 | 153,510 |
| Chevron Corp. | 1,297,139 | 134,928 |
| Enbridge Inc. | 3,651,198 | 120,088 |
| ConocoPhillips | 1,624,565 | 116,953 |
| 702,507 | ||
| Financials (8.1%) | ||
| ACE Ltd. | 1,935,686 | 129,652 |
| Wells Fargo & Co. | 3,692,660 | 103,173 |
| PNC Financial Services | ||
| Group Inc. | 1,767,288 | 95,946 |
| Marsh & McLennan | ||
| Cos. Inc. | 2,409,130 | 71,045 |
| Chubb Corp. | 1,123,605 | 70,203 |
| 470,019 | ||
| Health Care (15.7%) | ||
| Cardinal Health Inc. | 3,590,057 | 157,101 |
| Johnson & Johnson | 2,376,024 | 153,943 |
| Abbott Laboratories | 2,774,260 | 142,375 |
| Medtronic Inc. | 3,865,194 | 139,340 |
| Market | ||
| Value | ||
| Shares | ($000) | |
| Pfizer Inc. | 7,006,395 | 134,803 |
| UnitedHealth Group Inc. | 1,866,295 | 92,624 |
| AstraZeneca plc ADR | 1,857,083 | 90,087 |
| 910,273 | ||
| Industrials (14.2%) | ||
| General Dynamics Corp. | 2,287,370 | 155,861 |
| United Parcel Service | ||
| Inc. Class B | 2,032,288 | 140,675 |
| Northrop Grumman | ||
| Corp. | 1,966,593 | 118,998 |
| Honeywell International | ||
| Inc. | 1,965,438 | 104,365 |
| Waste Management Inc. | 2,738,385 | 86,232 |
| Lockheed Martin Corp. | 1,124,756 | 85,178 |
| United Technologies | ||
| Corp. | 788,927 | 65,355 |
| Emerson Electric Co. | 1,246,741 | 61,202 |
| 817,866 | ||
| Information Technology (15.3%) | ||
| Automatic Data | ||
| Processing Inc. | 3,783,350 | 194,805 |
| Microsoft Corp. | 6,371,976 | 174,592 |
| International Business | ||
| Machines Corp. | 921,780 | 167,626 |
| Western Union Co. | 7,545,467 | 146,457 |
| Accenture plc Class A | 1,853,163 | 109,596 |
| Oracle Corp. | 3,010,084 | 92,048 |
| 885,124 | ||
| Materials (3.8%) | ||
| Ecolab Inc. | 2,236,606 | 111,830 |
| Praxair Inc. | 1,045,351 | 108,340 |
| 220,170 | ||
| Telecommunication Services (1.4%) | ||
| AT&T Inc. | 2,675,247 | 78,278 |
| Utilities (1.8%) | ||
| Dominion Resources Inc. | 2,175,887 | 105,422 |
| Total Common Stocks | ||
| (Cost $4,812,091) | 5,574,911 | |
11
Dividend Growth Fund
| Face | Market | |
| Amount | Value | |
| ($000) | ($000) | |
| Temporary Cash Investment (3.5%) | ||
| Repurchase Agreement (3.5%) | ||
| Morgan Stanley 0.200%, | ||
| 8/1/11 (Dated 7/29/11, | ||
| Repurchase Value | ||
| $203,103,000, collateralized | ||
| by Federal National | ||
| Mortgage Assn. | ||
| 3.000%–7.000%, | ||
| 9/1/24–7/1/47) | ||
| (Cost $203,100) | 203,100 | 203,100 |
| Total Investments (100.0%) | ||
| (Cost $5,015,191) | 5,778,011 | |
| Other Assets and Liabilities (0.0%) | ||
| Other Assets | 29,602 | |
| Liabilities | (28,310) | |
| 1,292 | ||
| Net Assets (100%) | ||
| Applicable to 386,991,311 outstanding | ||
| $.001 par value shares of beneficial | ||
| interest (unlimited authorization) | 5,779,303 | |
| Net Asset Value Per Share | $14.93 | |
| At July 31, 2011, net assets consisted of: | |
| Amount | |
| ($000) | |
| Paid-in Capital | 5,098,421 |
| Undistributed Net Investment Income | 6,446 |
| Accumulated Net Realized Losses | (88,384) |
| Unrealized Appreciation (Depreciation) | 762,820 |
| Net Assets | 5,779,303 |
See Note A in Notes to Financial Statements.
ADR—American Depositary Receipt.
See accompanying Notes, which are an integral part of the Financial Statements.
12
Dividend Growth Fund
Statement of Operations
| Six Months Ended | |
| July 31, 2011 | |
| ($000) | |
| Investment Income | |
| Income | |
| Dividends1 | 71,308 |
| Interest | 85 |
| Security Lending | 169 |
| Total Income | 71,562 |
| Expenses | |
| Investment Advisory Fees—Note B | |
| Basic Fee | 2,914 |
| Performance Adjustment | 820 |
| The Vanguard Group—Note C | |
| Management and Administrative | 4,710 |
| Marketing and Distribution | 715 |
| Custodian Fees | 37 |
| Shareholders’ Reports | 40 |
| Trustees’ Fees and Expenses | 6 |
| Total Expenses | 9,242 |
| Net Investment Income | 62,320 |
| Realized Net Gain (Loss) | |
| Investment Securities Sold | 21,418 |
| Foreign Currencies | 8 |
| Realized Net Gain (Loss) | 21,426 |
| Change in Unrealized Appreciation (Depreciation) of Investment Securities | 51,052 |
| Net Increase (Decrease) in Net Assets Resulting from Operations | 134,798 |
| 1 Dividends are net of foreign withholding taxes of $240,000. | |
See accompanying Notes, which are an integral part of the Financial Statements.
13
Dividend Growth Fund
Statement of Changes in Net Assets
| Six Months Ended | Year Ended | |
| July 31, | January 31, | |
| 2011 | 2011 | |
| ($000) | ($000) | |
| Increase (Decrease) in Net Assets | ||
| Operations | ||
| Net Investment Income | 62,320 | 83,102 |
| Realized Net Gain (Loss) | 21,426 | 20,217 |
| Change in Unrealized Appreciation (Depreciation) | 51,052 | 504,924 |
| Net Increase (Decrease) in Net Assets Resulting from Operations | 134,798 | 608,243 |
| Distributions | ||
| Net Investment Income | (58,475) | (80,042) |
| Realized Capital Gain | — | — |
| Total Distributions | (58,475) | (80,042) |
| Capital Share Transactions | ||
| Issued | 1,121,411 | 2,215,256 |
| Issued in Lieu of Cash Distributions | 49,970 | 67,883 |
| Redeemed | (463,538) | (630,529) |
| Net Increase (Decrease) from Capital Share Transactions | 707,843 | 1,652,610 |
| Total Increase (Decrease) | 784,166 | 2,180,811 |
| Net Assets | ||
| Beginning of Period | 4,995,137 | 2,814,326 |
| End of Period1 | 5,779,303 | 4,995,137 |
| 1 Net Assets—End of Period includes undistributed net investment income of $6,446,000 and $2,593,000. | ||
See accompanying Notes, which are an integral part of the Financial Statements.
14
Dividend Growth Fund
Financial Highlights
| Six Months | ||||||
| Ended | ||||||
| For a Share Outstanding | July 31, | Year Ended January 31, | ||||
| Throughout Each Period | 2011 | 2011 | 2010 | 2009 | 2008 | 2007 |
| Net Asset Value, Beginning of Period | $14.68 | $12.82 | $10.42 | $14.38 | $14.74 | $12.75 |
| Investment Operations | ||||||
| Net Investment Income | .164 | .283 | .291 | .264 | .290 | .260 |
| Net Realized and Unrealized Gain (Loss) | ||||||
| on Investments | .241 | 1.850 | 2.401 | (3.960) | (.270) | 1.990 |
| Total from Investment Operations | .405 | 2.133 | 2.692 | (3.696) | .020 | 2.250 |
| Distributions | ||||||
| Dividends from Net Investment Income | (.155) | (.273) | (.292) | (.264) | (.280) | (.260) |
| Distributions from Realized Capital Gains | — | — | — | — | (.100) | — |
| Total Distributions | (.155) | (.273) | (.292) | (.264) | (.380) | (.260) |
| Net Asset Value, End of Period | $14.93 | $14.68 | $12.82 | $10.42 | $14.38 | $14.74 |
| Total Return1 | 2.74% | 16.85% | 26.01% | -25.97% | -0.01% | 17.84% |
| Ratios/Supplemental Data | ||||||
| Net Assets, End of Period (Millions) | $5,779 | $4,995 | $2,814 | $1,745 | $1,326 | $1,243 |
| Ratio of Total Expenses to | ||||||
| Average Net Assets2 | 0.34% | 0.34% | 0.38% | 0.36% | 0.32% | 0.38% |
| Ratio of Net Investment Income to | ||||||
| Average Net Assets | 2.26% | 2.25% | 2.59% | 2.25% | 1.91% | 1.93% |
| Portfolio Turnover Rate | 13% | 17% | 24% | 28% | 36% | 41% |
The expense ratio, net income ratio, and turnover rate for the current period have been annualized.
1 Total returns do not include account service fees that may have applied in the periods shown. Fund prospectuses provide information about any applicable account service fees.
2 Includes performance-based investment advisory fee increases (decreases) of 0.03%, 0.03%, 0.03%, 0.03%, 0.00%, and 0.01%.
See accompanying Notes, which are an integral part of the Financial Statements.
15
Dividend Growth Fund
Notes to Financial Statements
Vanguard Dividend Growth Fund is registered under the Investment Company Act of 1940 as an open-end investment company, or mutual fund.
A. The following significant accounting policies conform to generally accepted accounting principles for U.S. mutual funds. The fund consistently follows such policies in preparing its financial statements.
1. Security Valuation: Securities are valued as of the close of trading on the New York Stock Exchange (generally 4 p.m., Eastern time) on the valuation date. Equity securities are valued at the latest quoted sales prices or official closing prices taken from the primary market in which each security trades; such securities not traded on the valuation date are valued at the mean of the latest quoted bid and asked prices. Securities for which market quotations are not readily available, or whose values have been affected by events occurring before the fund’s pricing time but after the close of the securities’ primary markets, are valued at their fair values calculated according to procedures adopted by the board of trustees. These procedures include obtaining quotations from an independent pricing service, monitoring news to identify significant market- or security-specific events, and evaluating changes in the values of foreign market proxies (for example, ADRs, futures contracts, or exchange-traded funds), between the time the foreign markets close and the fund’s pricing time. When fair-value pricing is employed, the prices of securities used by a fund to calculate its net asset value may differ from quoted or published prices for the same securities. Investments in Vanguard Market Liquidity Fund are valued at that fund’s net asset value. Temporary cash investments acquired over 60 days to maturity are valued using the latest bid prices or using valuations based on a matrix system (which considers such factors as security prices, yields, maturities, and ratings), both as furnished by independent pricing services. Other temporary cash investments are valued at amortized cost, which approximates market value.
2. Foreign Currency: Securities and other assets and liabilities denominated in foreign currencies are translated into U.S. dollars using exchange rates obtained from an independent third party as of the fund’s pricing time on the valuation date. Realized gains (losses) and unrealized appreciation (depreciation) on investment securities include the effects of changes in exchange rates since the securities were purchased, combined with the effects of changes in security prices. Fluctuations in the value of other assets and liabilities resulting from changes in exchange rates are recorded as unrealized foreign currency gains (losses) until the assets or liabilities are settled in cash, at which time they are recorded as realized foreign currency gains (losses).
3. Repurchase Agreements: The fund invests in repurchase agreements. Securities pledged as collateral for repurchase agreements are held by a custodian bank until the agreements mature. Each agreement requires that the market value of the collateral be sufficient to cover payments of interest and principal; however, in the event of default or bankruptcy by the other party to the agreement, retention of the collateral may be subject to legal proceedings.
4. Federal Income Taxes: The fund intends to continue to qualify as a regulated investment company and distribute all of its taxable income. Management has analyzed the fund’s tax positions taken for all open federal income tax years (January 31, 2008–2011), and for the period ended July 31, 2011, and has concluded that no provision for federal income tax is required in the fund’s financial statements.
5. Distributions: Distributions to shareholders are recorded on the ex-dividend date.
6. Security Lending: The fund may lend its securities to qualified institutional borrowers to earn additional income. Security loans are required to be secured at all times by collateral at least equal to the market value of securities loaned. The fund invests cash collateral received in Vanguard Market
16
Dividend Growth Fund
Liquidity Fund, and records a liability for the return of the collateral, during the period the securities are on loan. Security lending income represents fees charged to borrowers plus income earned on investing cash collateral, less expenses associated with the loan.
7. Other: Dividend income is recorded on the ex-dividend date. Interest income is accrued daily. Security transactions are accounted for on the date securities are bought or sold. Costs used to determine realized gains (losses) on the sale of investment securities are those of the specific securities sold.
B. Wellington Management Company, LLP provides investment advisory services to the fund for a fee calculated at an annual percentage rate of average net assets. The basic fee is subject to quarterly adjustments based on the fund’s performance for the preceding three years relative to the Russell 1000 Index for periods prior to February 1, 2010, and the current benchmark, the Dividend Achievers Select Index, beginning February 1, 2010. The benchmark change will be fully phased in by January 2013. For the six months ended July 31, 2011, the investment advisory fee represented an effective annual basic rate of 0.11% of the fund’s average net assets before an increase of $820,000 (0.03%) based on performance.
C. The Vanguard Group furnishes at cost corporate management, administrative, marketing, and distribution services. The costs of such services are allocated to the fund under methods approved by the board of trustees. The fund has committed to provide up to 0.40% of its net assets in capital contributions to Vanguard. At July 31, 2011, the fund had contributed capital of $928,000 to Vanguard (included in Other Assets), representing 0.02% of the fund’s net assets and 0.37% of Vanguard’s capitalization. The fund’s trustees and officers are also directors and officers of Vanguard.
D. Various inputs may be used to determine the value of the fund’s investments. These inputs are summarized in three broad levels for financial statement purposes. The inputs or methodologies used to value securities are not necessarily an indication of the risk associated with investing in those securities.
Level 1—Quoted prices in active markets for identical securities.
Level 2—Other significant observable inputs (including quoted prices for similar securities, interest rates, prepayment speeds, credit risk, etc.).
Level 3—Significant unobservable inputs (including the fund’s own assumptions used to determine the fair value of investments).
The following table summarizes the fund’s investments as of July 31, 2011, based on the inputs used to value them:
| Level 1 | Level 2 | Level 3 | |
| Investments | ($000) | ($000) | ($000) |
| Common Stocks | 5,421,401 | 153,510 | — |
| Temporary Cash Investments | — | 203,100 | — |
| Total | 5,421,401 | 356,610 | — |
E. Distributions are determined on a tax basis and may differ from net investment income and realized capital gains for financial reporting purposes. Differences may be permanent or temporary. Permanent differences are reclassified among capital accounts in the financial statements to reflect their tax character. Temporary differences arise when certain items of income, expense, gain, or loss
17
Dividend Growth Fund
are recognized in different periods for financial statement and tax purposes; these differences will reverse at some time in the future. Differences in classification may also result from the treatment of short-term gains as ordinary income for tax purposes.
During the six months ended July 31, 2011, the fund realized net foreign currency gains of $8,000, which increased distributable net income for tax purposes; accordingly, such gains have been reclassified from accumulated net realized losses to undistributed net investment income.
The fund’s tax-basis capital gains and losses are determined only at the end of each fiscal year. For tax purposes, at January 31, 2011, the fund had available capital loss carryforwards totaling $107,793,000 to offset future net capital gains through January 31, 2018. In addition, the fund realized losses of $133,000 during the period from November 1, 2010, through January 31, 2011, which are deferred and will be treated as realized for tax purposes in fiscal 2012. The fund will use these capital losses to offset net taxable capital gains, if any, realized during the year ending January 31, 2012; should the fund realize net capital losses for the year, the losses will be added to the loss carryforward balance above.
At July 31, 2011, the cost of investment securities for tax purposes was $5,015,191,000. Net unrealized appreciation of investment securities for tax purposes was $762,820,000, consisting of unrealized gains of $816,068,000 on securities that had risen in value since their purchase and $53,248,000 in unrealized losses on securities that had fallen in value since their purchase.
F. During the six months ended July 31, 2011, the fund purchased $1,052,650,000 of investment securities and sold $360,374,000 of investment securities, other than temporary cash investments.
G. Capital shares issued and redeemed were:
| Six Months Ended | Year Ended | |
| July 31, 2011 | January 31, 2011 | |
| Shares | Shares | |
| (000) | (000) | |
| Issued | 73,978 | 162,602 |
| Issued in Lieu of Cash Distributions | 3,272 | 5,031 |
| Redeemed | (30,599) | (46,786) |
| Net Increase (Decrease) in Shares Outstanding | 46,651 | 120,847 |
H. In preparing the financial statements as of July 31, 2011, management considered the impact of subsequent events for potential recognition or disclosure in these financial statements.
18
About Your Fund’s Expenses
As a shareholder of the fund, you incur ongoing costs, which include costs for portfolio management, administrative services, and shareholder reports (like this one), among others. Operating expenses, which are deducted from a fund’s gross income, directly reduce the investment return of the fund.
A fund’s expenses are expressed as a percentage of its average net assets. This figure is known as the expense ratio. The following examples are intended to help you understand the ongoing costs (in dollars) of investing in your fund and to compare these costs with those of other mutual funds. The examples are based on an investment of $1,000 made at the beginning of the period shown and held for the entire period.
The accompanying table illustrates your fund’s costs in two ways:
• Based on actual fund return. This section helps you to estimate the actual expenses that you paid over the period. The ”Ending Account Value“ shown is derived from the fund‘s actual return, and the third column shows the dollar amount that would have been paid by an investor who started with $1,000 in the fund. You may use the information here, together with the amount you invested, to estimate the expenses that you paid over the period.
To do so, simply divide your account value by $1,000 (for example, an $8,600 account value divided by $1,000 = 8.6), then multiply the result by the number given for your fund under the heading ”Expenses Paid During Period.“
• Based on hypothetical 5% yearly return. This section is intended to help you compare your fund‘s costs with those of other mutual funds. It assumes that the fund had a yearly return of 5% before expenses, but that the expense ratio is unchanged. In this case—because the return used is not the fund’s actual return—the results do not apply to your investment. The example is useful in making comparisons because the Securities and Exchange Commission requires all mutual funds to calculate expenses based on a 5% return. You can assess your fund’s costs by comparing this hypothetical example with the hypothetical examples that appear in shareholder reports of other funds.
Note that the expenses shown in the table are meant to highlight and help you compare ongoing costs only and do not reflect transaction costs incurred by the fund for buying and selling securities. Further, the expenses do not include any purchase, redemption, or account service fees described in the fund prospectus. If such fees were applied to your account, your costs would be higher. Your fund does not carry a “sales load.”
The calculations assume no shares were bought or sold during the period. Your actual costs may have been higher or lower, depending on the amount of your investment and the timing of any purchases or redemptions.
You can find more information about the fund’s expenses, including annual expense ratios, in the Financial Statements section of this report. For additional information on operating expenses and other shareholder costs, please refer to your fund’s current prospectus.
19
| Six Months Ended July 31, 2011 | |||
| Beginning | Ending | Expenses | |
| Account Value | Account Value | Paid During | |
| Dividend Growth Fund | 1/31/2011 | 7/31/2011 | Period |
| Based on Actual Fund Return | $1,000.00 | $1,027.35 | $1.71 |
| Based on Hypothetical 5% Yearly Return | 1,000.00 | 1,023.11 | 1.71 |
The calculations are based on expenses incurred in the most recent six-month period. The fund’s annualized six-month expense ratio for that period is 0.34%. The dollar amounts shown as “Expenses Paid” are equal to the annualized expense ratio multiplied by the average account value over the period, multiplied by the number of days in the most recent six-month period, then divided by the number of days in the most recent 12-month period.
20
Glossary
30-Day SEC Yield. A fund’s 30-day SEC yield is derived using a formula specified by the U.S. Securities and Exchange Commission. Under the formula, data related to the fund’s security holdings in the previous 30 days are used to calculate the fund’s hypothetical net income for that period, which is then annualized and divided by the fund’s estimated average net assets over the calculation period. For the purposes of this calculation, a security’s income is based on its current market yield to maturity (in the case of bonds), its actual income (for asset-backed securities), or its projected dividend yield (for stocks). Because the SEC yield represents hypothetical annualized income, it will differ—at times significantly—from the fund’s actual experience. As a result, the fund’s income distributions may be higher or lower than implied by the SEC yield.
Beta. A measure of the magnitude of a fund’s past share-price fluctuations in relation to the ups and downs of a given market index. The index is assigned a beta of 1.00. Compared with a given index, a fund with a beta of 1.20 typically would have seen its share price rise or fall by 12% when the index rose or fell by 10%. For this report, beta is based on returns over the past 36 months for both the fund and the index. Note that a fund’s beta should be reviewed in conjunction with its R-squared (see definition). The lower the R-squared, the less correlation there is between the fund and the index, and the less reliable beta is as an indicator of volatility.
Dividend Yield. Dividend income earned by stocks, expressed as a percentage of the aggregate market value (or of net asset value, for a fund). The yield is determined by dividing the amount of the annual dividends by the aggregate value (or net asset value) at the end of the period. For a fund, the dividend yield is based solely on stock holdings and does not include any income produced by other investments.
Earnings Growth Rate. The average annual rate of growth in earnings over the past five years for the stocks now in a fund.
Equity Exposure. A measure that reflects a fund’s investments in stocks and stock futures. Any holdings in short-term reserves are excluded.
Expense Ratio. The percentage of a fund’s average net assets used to pay its annual administrative and advisory expenses. These expenses directly reduce returns to investors.
Foreign Holdings. The percentage of a fund represented by securities or depositary receipts of companies based outside the United States.
Inception Date. The date on which the assets of a fund (or one of its share classes) are first invested in accordance with the fund’s investment objective. For funds with a subscription period, the inception date is the day after that period ends. Investment performance is measured from the inception date.
Median Market Cap. An indicator of the size of companies in which a fund invests; the midpoint of market capitalization (market price x shares outstanding) of a fund’s stocks, weighted by the proportion of the fund’s assets invested in each stock. Stocks representing half of the fund’s assets have market capitalizations above the median, and the rest are below it.
Price/Book Ratio. The share price of a stock divided by its net worth, or book value, per share. For a fund, the weighted average price/book ratio of the stocks it holds.
21
Price/Earnings Ratio. The ratio of a stock’s current price to its per-share earnings over the past year. For a fund, the weighted average P/E of the stocks it holds. P/E is an indicator of market expectations about corporate prospects; the higher the P/E, the greater the expectations for a company’s future growth.
R-Squared. A measure of how much of a fund’s past returns can be explained by the returns from the market in general, as measured by a given index. If a fund’s total returns were precisely synchronized with an index’s returns, its R-squared would be 1.00. If the fund’s returns bore no relationship to the index’s returns, its R-squared would be 0. For this report, R-squared is based on returns over the past 36 months for both the fund and the index.
Return on Equity. The annual average rate of return generated by a company during the past five years for each dollar of shareholder’s equity (net income divided by shareholder’s equity). For a fund, the weighted average return on equity for the companies whose stocks it holds.
Short-Term Reserves. The percentage of a fund invested in highly liquid, short-term securities that can be readily converted to cash.
Turnover Rate. An indication of the fund’s trading activity. Funds with high turnover rates incur higher transaction costs and may be more likely to distribute capital gains (which may be taxable to investors). The turnover rate excludes in-kind transactions, which have minimal impact on costs.
22
This page intentionally left blank.
The People Who Govern Your Fund
The trustees of your mutual fund are there to see that the fund is operated and managed in your best interests since, as a shareholder, you are a part owner of the fund. Your fund’s trustees also serve on the board of directors of The Vanguard Group, Inc., which is owned by the Vanguard funds and provides services to them on an at-cost basis.
A majority of Vanguard’s board members are independent, meaning that they have no affiliation with Vanguard or the funds they oversee, apart from the sizable personal investments they have made as private individuals. The independent board members have distinguished backgrounds in business, academia, and public service. Each of the trustees and executive officers oversees 178 Vanguard funds.
The following table provides information for each trustee and executive officer of the fund. More information about the trustees is in the Statement of Additional Information, which can be obtained, without charge, by contacting Vanguard at 800-662-7447, or online at vanguard.com.
| Interested Trustee1 | and President (2006–2008) of Rohm and Haas Co. |
| (chemicals); Director of Tyco International, Ltd. | |
| F. William McNabb III | (diversified manufacturing and services) and Hewlett- |
| Born 1957. Trustee Since July 2009. Chairman of the | Packard Co. (electronic computer manufacturing); |
| Board. Principal Occupation(s) During the Past Five | Senior Advisor at New Mountain Capital; Trustee |
| Years: Chairman of the Board of The Vanguard Group, | of The Conference Board; Member of the Board of |
| Inc., and of each of the investment companies served | Managers of Delphi Automotive LLP (automotive |
| by The Vanguard Group, since January 2010; Director | components). |
| of The Vanguard Group since 2008; Chief Executive | |
| Officer and President of The Vanguard Group and of | Amy Gutmann |
| each of the investment companies served by The | Born 1949. Trustee Since June 2006. Principal |
| Vanguard Group since 2008; Director of Vanguard | Occupation(s) During the Past Five Years: President |
| Marketing Corporation; Managing Director of The | of the University of Pennsylvania; Christopher H. |
| Vanguard Group (1995–2008). | Browne Distinguished Professor of Political Science |
| in the School of Arts and Sciences with secondary | |
| appointments at the Annenberg School for Commu- | |
| Independent Trustees | nication and the Graduate School of Education |
| of the University of Pennsylvania; Director of | |
| Emerson U. Fullwood | Carnegie Corporation of New York, Schuylkill River |
| Born 1948. Trustee Since January 2008. Principal | Development Corporation, and Greater Philadelphia |
| Occupation(s) During the Past Five Years: Executive | Chamber of Commerce; Trustee of the National |
| Chief Staff and Marketing Officer for North America | Constitution Center; Chair of the Presidential |
| and Corporate Vice President (retired 2008) of Xerox | Commission for the Study of Bioethical Issues. |
| Corporation (document management products and | |
| services); Executive in Residence and 2010 | JoAnn Heffernan Heisen |
| Distinguished Minett Professor at the Rochester | Born 1950. Trustee Since July 1998. Principal |
| Institute of Technology; Director of SPX Corporation | Occupation(s) During the Past Five Years: Corporate |
| (multi-industry manufacturing), the United Way of | Vice President and Chief Global Diversity Officer |
| Rochester, Amerigroup Corporation (managed health | (retired 2008) and Member of the Executive |
| care), the University of Rochester Medical Center, | Committee (1997–2008) of Johnson & Johnson |
| Monroe Community College Foundation, and North | (pharmaceuticals/consumer products); Director of |
| Carolina A&T University. | Skytop Lodge Corporation (hotels), the University |
| Medical Center at Princeton, the Robert Wood | |
| Rajiv L. Gupta | Johnson Foundation, and the Center for Work Life |
| Born 1945. Trustee Since December 2001.2 | Policy; Member of the Advisory Board of the |
| Principal Occupation(s) During the Past Five Years: | Maxwell School of Citizenship and Public Affairs |
| Chairman and Chief Executive Officer (retired 2009) | at Syracuse University. |
| F. Joseph Loughrey | Thomas J. Higgins | |
| Born 1949. Trustee Since October 2009. Principal | Born 1957. Chief Financial Officer Since September | |
| Occupation(s) During the Past Five Years: President | 2008. Principal Occupation(s) During the Past Five | |
| and Chief Operating Officer (retired 2009) and Vice | Years: Principal of The Vanguard Group, Inc.; Chief | |
| Chairman of the Board (2008–2009) of Cummins Inc. | Financial Officer of each of the investment companies | |
| (industrial machinery); Director of SKF AB (industrial | served by The Vanguard Group since 2008; Treasurer | |
| machinery), Hillenbrand, Inc. (specialized consumer | of each of the investment companies served by The | |
| services), the Lumina Foundation for Education, and | Vanguard Group (1998–2008). | |
| Oxfam America; Chairman of the Advisory Council | ||
| for the College of Arts and Letters and Member | Kathryn J. Hyatt | |
| of the Advisory Board to the Kellogg Institute for | Born 1955. Treasurer Since November 2008. Principal | |
| International Studies at the University of Notre Dame. | Occupation(s) During the Past Five Years: Principal | |
| of The Vanguard Group, Inc.; Treasurer of each of | ||
| André F. Perold | the investment companies served by The Vanguard | |
| Born 1952. Trustee Since December 2004. Principal | Group since 2008; Assistant Treasurer of each of the | |
| Occupation(s) During the Past Five Years: George | investment companies served by The Vanguard Group | |
| Gund Professor of Finance and Banking at the Harvard | (1988–2008). | |
| Business School (retired July 2011); Chief Investment | ||
| Officer and co-Managing Partner of HighVista | Heidi Stam | |
| Strategies LLC (private investment firm); Director of | Born 1956. Secretary Since July 2005. Principal | |
| Rand Merchant Bank; Overseer of the Museum of | Occupation(s) During the Past Five Years: Managing | |
| Fine Arts Boston. | Director of The Vanguard Group, Inc., since 2006; | |
| General Counsel of The Vanguard Group since 2005; | ||
| Alfred M. Rankin, Jr. | Secretary of The Vanguard Group and of each of the | |
| Born 1941. Trustee Since January 1993. Principal | investment companies served by The Vanguard Group | |
| Occupation(s) During the Past Five Years: Chairman, | since 2005; Director and Senior Vice President of | |
| President, and Chief Executive Officer of NACCO | Vanguard Marketing Corporation since 2005; | |
| Industries, Inc. (forklift trucks/housewares/lignite); | Principal of The Vanguard Group (1997–2006). | |
| Director of Goodrich Corporation (industrial products/ | ||
| aircraft systems and services) and the National | ||
| Association of Manufacturers; Chairman of the | Vanguard Senior Management Team | |
| Federal Reserve Bank of Cleveland; Vice Chairman | ||
| of University Hospitals of Cleveland; President of | R. Gregory Barton | Michael S. Miller |
| the Board of The Cleveland Museum of Art. | Mortimer J. Buckley | James M. Norris |
| Kathleen C. Gubanich | Glenn W. Reed | |
| Peter F. Volanakis | Paul A. Heller | George U. Sauter |
| Born 1955. Trustee Since July 2009. Principal | Martha G. King | |
| Occupation(s) During the Past Five Years: President | ||
| and Chief Operating Officer (retired 2010) of Corning | ||
| Incorporated (communications equipment); Director of | Chairman Emeritus and Senior Advisor | |
| Corning Incorporated (2000–2010) and Dow Corning | ||
| (2001–2010); Overseer of the Amos Tuck School of | John J. Brennan | |
| Business Administration at Dartmouth College. | Chairman, 1996–2009 | |
| Chief Executive Officer and President, 1996–2008 | ||
| Executive Officers | ||
| Founder | ||
| Glenn Booraem | ||
| Born 1967. Controller Since July 2010. Principal | John C. Bogle | |
| Occupation(s) During the Past Five Years: Principal | Chairman and Chief Executive Officer, 1974–1996 | |
| of The Vanguard Group, Inc.; Controller of each of | ||
| the investment companies served by The Vanguard | ||
| Group since 2010; Assistant Controller of each of | ||
| the investment companies served by The Vanguard | ||
| Group (2001–2010). | ||
1 Mr. McNabb is considered an “interested person,” as defined in the Investment Company Act of 1940, because he is an officer of the Vanguard funds.
2 December 2002 for Vanguard Equity Income Fund, Vanguard Growth Equity Fund, the Vanguard Municipal Bond Funds, and the Vanguard State Tax-Exempt Funds.
 | |
| P.O. Box 2600 | |
| Valley Forge, PA 19482-2600 |
Connect with Vanguard® > vanguard.com
| Fund Information > 800-662-7447 | |
| Direct Investor Account Services > 800-662-2739 | |
| Institutional Investor Services > 800-523-1036 | |
| Text Telephone for People | |
| With Hearing Impairment > 800-749-7273 | |
| This material may be used in conjunction | |
| with the offering of shares of any Vanguard | |
| fund only if preceded or accompanied by | |
| the fund’s current prospectus. | |
| All comparative mutual fund data are from Lipper Inc. or | |
| Morningstar, Inc., unless otherwise noted. | |
| You can obtain a free copy of Vanguard’s proxy voting | |
| guidelines by visiting vanguard.com/proxyreporting or by | |
| calling Vanguard at 800-662-2739. The guidelines are | |
| also available from the SEC’s website, sec.gov. In | |
| addition, you may obtain a free report on how your fund | |
| voted the proxies for securities it owned during the 12 | |
| months ended June 30. To get the report, visit either | |
| vanguard.com/proxyreporting or sec.gov. | |
| You can review and copy information about your fund at | |
| the SEC’s Public Reference Room in Washington, D.C. To | |
| find out more about this public service, call the SEC at | |
| 202-551-8090. Information about your fund is also | |
| available on the SEC’s website, and you can receive | |
| copies of this information, for a fee, by sending a | |
| request in either of two ways: via e-mail addressed to | |
| publicinfo@sec.gov or via regular mail addressed to the | |
| Public Reference Section, Securities and Exchange | |
| Commission, Washington, DC 20549-1520. | |
| © 2011 The Vanguard Group, Inc. | |
| All rights reserved. | |
| Vanguard Marketing Corporation, Distributor. | |
| Q572 092011 | |
| Vanguard Dividend Appreciation |
| Index Fund Semiannual Report |
| July 31, 2011 |
 |
> For the six months ended July 31, 2011, Vanguard Dividend Appreciation Index Fund returned more than 2%.
> The fund closely tracked the return of its target index, the Dividend Achievers Select Index, and outpaced the average return of large-capitalization core funds.
> Six of the index’s ten market sectors gained ground, with consumer discretionary, energy, and information technology among the leading contributors.
| Contents | |
| Your Fund’s Total Returns. | 1 |
| Chairman’s Letter. | 2 |
| Fund Profile. | 6 |
| Performance Summary. | 7 |
| Financial Statements. | 8 |
| About Your Fund’s Expenses. | 18 |
| Trustees Approve Advisory Arrangement. | 20 |
| Glossary. | 21 |
Please note: The opinions expressed in this report are just that—informed opinions. They should not be considered promises or advice.
Also, please keep in mind that the information and opinions cover the period through the date on the front of this report. Of course, the risks of investing in your fund are spelled out in the prospectus.
See the Glossary for definitions of investment terms used in this report.
Cover photograph: Jean Maher.
Your Fund’s Total Returns
| Six Months Ended July 31, 2011 | |
| Total | |
| Returns | |
| Vanguard Dividend Appreciation Index Fund | |
| Investor Shares | 2.38% |
| ETF Shares | |
| Market Price | 2.36 |
| Net Asset Value | 2.44 |
| Dividend Achievers Select Index | 2.38 |
| Large-Cap Core Funds Average | 0.70 |
| Large-Cap Core Funds Average: Derived from data provided by Lipper Inc. | |
The Vanguard ETF® Shares shown are traded on the NYSE Arca exchange and are available only through brokers. The table provides ETF returns based on both the NYSE Arca market price and the net asset value for a share. U.S. Pat. No. 6,879,964 B2; 7,337,138.
For the ETF Shares, the market price is determined by the midpoint of the bid-offer spread as of the closing time of the New York Stock Exchange (generally 4 p.m., Eastern time). The net asset value is also determined as of the NYSE closing time. For more information about how the ETF Shares' market prices have compared with their net asset value, visit vanguard.com, select your ETF, and then select the Price and Performance tab. The ETF premium/discount analysis there shows the percentages of days on which the ETF Shares' market price was above or below the NAV.
Your Fund’s Performance at a Glance
January 31, 2011 , Through July 31, 2011
| Distributions Per Share | ||||
| Starting | Ending | Income | Capital | |
| Share Price | Share Price | Dividends | Gains | |
| Vanguard Dividend Appreciation Index Fund | ||||
| Investor Shares | $21.33 | $21.63 | $0.209 | $0.000 |
| ETF Shares | 53.32 | 54.07 | 0.555 | 0.000 |
1

Chairman’s Letter
Dear Shareholder,
Vanguard Dividend Appreciation Index Fund returned a bit more than 2% for the six months ended July 31, 2011, in line with the return of its benchmark, the Dividend Achievers Select Index, and ahead of the average return of large-company core funds.
Like its target index, the fund focuses on large, profitable companies with a history of increasing dividends. As the economic recovery stumbled over the last three months of the period and the U.S. stock market slumped, the fund’s portfolio of relatively stable companies allowed it to weather the downturn slightly better than the broad market did.
Even with a small increase in the price of Investor Shares, their 30-day SEC yield rose slightly, from 2.02% at the start of the period to 2.15% at the end, as corporate dividends continued their recent upward trend.
Stocks worldwide crept higher in a treacherous marketplace
Global stock markets struggled to find direction during the past six months, as every positive signal seemed to be paired with its negative. The good news included surprisingly strong corporate profits, which proved a source of investor optimism through much of the period.
2
The counterpoint was a series of increasingly glum economic reports. Expectations that the U.S. economic expansion would accelerate in the second half of the year gave way to anxiety about the possibility of recession. The Dow Jones U.S. Total Stock market Index finished the period with a return of 1.55%. Across the globe, stock returns were similarly modest.
Bonds rallied in the U.S. market as investors sought safety
Bond prices climbed amid the turbulence. Investors sought refuge from a collection of troubles: Europe’s debt dramas, economic shocks produced by the Japanese tsunami and its aftermath, and prolonged debate over raising the U.S. debt ceiling. For the full six months, the broad U.S. taxable bond market returned more than 4% as bond prices rose. (Rising prices are a mixed blessing, of course; they imply lower yields on future investment.)
The yields on money market instruments such as Treasury bills remained near 0%, consistent with the Federal Reserve Board’s target for short-term interest rates.
The U.S. credit downgrade: A cause for concern, not panic
On August 5, after the close of our reporting period, Standard & Poor’s downgraded its credit rating of U.S. debt from AAA to AA+. S&P said its action was prompted, in large part,
| Market Barometer | |||
| Total Returns | |||
| Periods Ended July 31, 2011 | |||
| Six | One | Five Years | |
| Months | Year | (Annualized) | |
| Stocks | |||
| Russell 1000 Index (Large-caps) | 1.62% | 20.68% | 2.80% |
| Russell 2000 Index (Small-caps) | 2.63 | 23.92 | 4.00 |
| Dow Jones U.S. Total Stock Market Index | 1.55 | 20.83 | 3.27 |
| MSCI All Country World Index ex USA (International) | 1.39 | 17.36 | 3.18 |
| Bonds | |||
| Barclays Capital U.S. Aggregate Bond Index (Broad | |||
| taxable market) | 4.23% | 4.44% | 6.57% |
| Barclays Capital Municipal Bond Index (Broad | |||
| tax-exempt market) | 6.27 | 3.24 | 4.90 |
| Citigroup Three-Month U.S. Treasury Bill Index | 0.05 | 0.13 | 1.78 |
| CPI | |||
| Consumer Price Index | 2.59% | 3.63% | 2.11% |
3
by concern about “the effectiveness, stability, and predictability of American policymaking and political institutions”—in other words, the political gridlock on vivid display during the debt-ceiling debate.
The downgrade was controversial, and the other major rating agencies reaffirmed their decision to continue giving the highest ratings to U.S. debt. At Vanguard, our credit analysts and economists regularly assess the financial strength of the United States and other sovereign borrowers. Our confidence in the “full faith and credit” of the U.S. government remains unshaken, and we have cautioned investors against overreacting to the S&P downgrade.
Consumer discretionary and tech stocks were the best performers
As many firms returned to profitability in the past two years, dividends began to flow more freely. The fund benefited as established companies that pay regular dividends became attractive to investors seeking an alternative to lower-yielding stock or fixed income investments. However, this favorable environment was countered by adverse developments in the global economy that weighed on stock market sentiment.
Among the fund’s ten sectors, its consumer discretionary stocks performed best, returning about 10% as investors were encouraged by an increase in
Expense Ratios
Your Fund Compared With Its Peer Group
| Investor | ETF | Peer Group | |
| Shares | Shares | Average | |
| Dividend Appreciation Index Fund | 0.30% | 0.18% | 1.26% |
The fund expense ratios shown are from the prospectus dated May 26, 2011, and represent estimated costs for the current fiscal year. For the six months ended July 31, 2011, the fund’s annualized expense ratios were 0.25% for Investor Shares and 0.13% for ETF Shares. The peer-group expense ratio is derived from data provided by Lipper Inc. and captures information through year-end 2010.
Peer group: Large-Cap Core Funds.
4
consumer spending on goods and services other than necessities. The results from consumer staples (+3%), the fund’s largest sector, were less robust.
Information technology (+9%) was also a strong performer, as the fund’s handful of IT holdings—which mirror the stocks in its target index—outpaced the sector’s return in the broad market. Energy (+4%) also helped, as rising oil prices lifted giant integrated oil and gas companies.
Financials (–4%) dragged on performance, mostly because of the struggles of asset management and insurance firms. The fund’s second-largest sector, industrials (–2%), also retreated amid concerns that a slowing global economy would soften demand for machinery and equipment.
Stay focused on the long term when creating an investment plan
Stocks declined in each of the final three months of the recent half-year, but the losses didn’t completely erase the gains recorded over the period’s first half. While the Dividend Appreciation Index Fund outperformed the broader market, it wasn’t immune from the recent volatility.
The return of market turbulence can be unsettling for investors, particularly while memories of the financial crisis of 2008–2009 are still fresh. Stocks can be wildly unpredictable, especially in the short term, and no one knows whether they will rebound quickly or fall further.
Of course, it’s tempting to react rashly when the markets don’t behave according to plan, but it’s crucial not to let short-term swings goad you into impulsive decisions. That’s why, at Vanguard, we counsel you to maintain a long-term approach. One of the best ways to do this is to create a diversified plan that includes a mix of stocks, bonds, and short-term investments that matches your long-term goals, risk tolerance, and time horizon.
The index-tracking experience of the fund’s investment advisor, Vanguard Quantitative Equity Group, along with the fund’s low-cost advantage and emphasis on companies with strong dividend-paying records, make Vanguard Dividend Appreciation Index Fund a valuable component of a long-term portfolio.
Thank you for your confidence in Vanguard.
Sincerely,

F. William McNabb III
Chairman and Chief Executive Officer
August 10, 2011
5
Dividend Appreciation Index Fund
Fund Profile
As of July 31, 2011
| Share-Class Characteristics | |||
| Investor | ETF | ||
| Shares | Shares | ||
| Ticker Symbol | VDAIX | VIG | |
| Expense Ratio1 | 0.30% | 0.18% | |
| 30-Day SEC Yield | 2.15% | 2.27% | |
| Portfolio Characteristics | |||
| Dividend | DJ | ||
| Achievers | U.S. Total | ||
| Select | Market | ||
| Fund | Index | Index | |
| Number of Stocks | 127 | 127 | 3,753 |
| Median Market Cap | $41.3B | $41.3B | $31.4B |
| Price/Earnings Ratio | 14.6x | 14.6x | 16.3x |
| Price/Book Ratio | 2.9x | 2.9x | 2.2x |
| Return on Equity | 23.4% | 23.4% | 19.0% |
| Earnings Growth Rate | 5.1% | 5.1% | 6.3% |
| Dividend Yield | 2.4% | 2.4% | 1.8% |
| Foreign Holdings | 0.0% | 0.0% | 0.0% |
| Turnover Rate | |||
| (Annualized) | 3% | — | — |
| Short-Term Reserves | 0.0% | — | — |
| Sector Diversification (% of equity exposure) | |||
| Dividend | DJ | ||
| Achievers | U.S. Total | ||
| Select | Market | ||
| Fund | Index | Index | |
| Consumer | |||
| Discretionary | 12.6% | 12.6% | 12.3% |
| Consumer Staples | 23.9 | 23.9 | 9.8 |
| Energy | 15.5 | 15.5 | 11.5 |
| Financials | 6.5 | 6.5 | 15.3 |
| Health Care | 5.8 | 5.8 | 11.1 |
| Industrials | 21.3 | 21.3 | 11.1 |
| Information | |||
| Technology | 6.6 | 6.6 | 18.8 |
| Materials | 6.0 | 6.0 | 4.4 |
| Telecommunication | |||
| Services | 0.1 | 0.1 | 2.5 |
| Utilities | 1.7 | 1.7 | 3.2 |
| Volatility Measures | ||
| Dividend | DJ | |
| Achievers | U.S. Total | |
| Select | Market | |
| Index | Index | |
| R-Squared | 1.00 | 0.95 |
| Beta | 1.00 | 0.80 |
| These measures show the degree and timing of the fund’s fluctuations compared with the indexes over 36 months. | ||
| Ten Largest Holdings (% of total net assets) | ||
| McDonald's Corp. | Restaurants | 4.6% |
| International Business | IT Consulting & | |
| Machines Corp. | Other Services | 4.5 |
| Chevron Corp. | Integrated Oil & | |
| Gas | 4.4 | |
| Coca-Cola Co. | Soft Drinks | 4.3 |
| ConocoPhillips | Integrated Oil & | |
| Gas | 4.1 | |
| United Technologies | Aerospace & | |
| Corp. | Defense | 4.0 |
| Exxon Mobil Corp. | Integrated Oil & | |
| Gas | 4.0 | |
| PepsiCo Inc. | Soft Drinks | 3.9 |
| Procter & Gamble Co. | Household | |
| Products | 3.8 | |
| Wal-Mart Stores Inc. | Hypermarkets & | |
| Super Centers | 3.7 | |
| Top Ten | 41.3% | |
| The holdings listed exclude any temporary cash investments and equity index products. | ||
Investment Focus
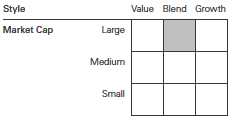
1 The expense ratios shown are from the prospectus dated May 26, 2011, and represent estimated costs for the current fiscal year. For the six months ended July 31, 2011, the annualized expense ratios were 0.25% for Investor Shares and 0.13% for ETF Shares.
6
Dividend Appreciation Index Fund
Performance Summary
All of the returns in this report represent past performance, which is not a guarantee of future results that may be achieved by the fund. (Current performance may be lower or higher than the performance data cited. For performance data current to the most recent month-end, visit our website at vanguard.com/performance.) Note, too, that both investment returns and principal value can fluctuate widely, so an investor’s shares, when sold, could be worth more or less than their original cost. The returns shown do not reflect taxes that a shareholder would pay on fund distributions or on the sale of fund shares.
Fiscal-Year Total Returns (%): April 27, 2006, Through July 31, 2011

Average Annual Total Returns: Periods Ended June 30, 2011
This table presents returns through the latest calendar quarter—rather than through the end of the fiscal period.
Securities and Exchange Commission rules require that we provide this information.
| Inception | One | Five | Since | |
| Date | Year | Years | Inception | |
| Investor Shares | 4/27/2006 | 29.74% | 4.64% | 4.11% |
| ETF Shares | 4/21/2006 | |||
| Market Price | 29.84 | 4.75 | 4.27 | |
| Net Asset Value | 29.91 | 4.76 | 4.28 |
See Financial Highlights for dividend and capital gains information.
7
Dividend Appreciation Index Fund
Financial Statements (unaudited)
Statement of Net Assets
As of July 31, 2011
The fund reports a complete list of its holdings in regulatory filings four times in each fiscal year, at the quarter-ends. For the second and fourth fiscal quarters, the lists appear in the fund’s semiannual and annual reports to shareholders. For the first and third fiscal quarters, the fund files the lists with the Securities and Exchange Commission on Form N-Q. Shareholders can look up the fund’s Forms N-Q on the SEC’s website at sec.gov. Forms N-Q may also be reviewed and copied at the SEC’s Public Reference Room (see the back cover of this report for further information).
| Market | ||
| Value | ||
| Shares | ($000) | |
| Common Stocks (100.0%) | ||
| Consumer Discretionary (12.6%) | ||
| McDonald’s Corp. | 4,492,853 | 388,542 |
| Target Corp. | 3,303,729 | 170,109 |
| Lowe’s Cos. Inc. | 6,044,332 | 130,437 |
| TJX Cos. Inc. | 1,774,880 | 98,151 |
| VF Corp. | 496,600 | 58,003 |
| McGraw-Hill Cos. Inc. | 1,391,079 | 57,869 |
| Ross Stores Inc. | 533,826 | 40,448 |
| Genuine Parts Co. | 712,060 | 37,853 |
| Family Dollar Stores Inc. | 586,275 | 31,137 |
| Polaris Industries Inc. | 155,283 | 18,409 |
| John Wiley & Sons Inc. | ||
| Class A | 232,881 | 11,658 |
| Meredith Corp. | 171,872 | 5,130 |
| Matthews International | ||
| Corp. Class A | 130,093 | 4,708 |
| 1,052,454 | ||
| Consumer Staples (23.9%) | ||
| Coca-Cola Co. | 5,327,681 | 362,336 |
| PepsiCo Inc. | 5,095,286 | 326,302 |
| Procter & Gamble Co. | 5,204,866 | 320,047 |
| Wal-Mart Stores Inc. | 5,802,460 | 305,848 |
| Colgate-Palmolive Co. | 2,282,986 | 192,638 |
| Walgreen Co. | 4,272,242 | 166,788 |
| Archer-Daniels-Midland | ||
| Co. | 2,927,927 | 88,950 |
| Avon Products Inc. | 2,009,233 | 52,702 |
| JM Smucker Co. | 563,790 | 43,931 |
| Hormel Foods Corp. | 1,228,720 | 35,596 |
| Brown-Forman Corp. | ||
| Class B | 407,279 | 29,959 |
| McCormick & Co. Inc. | 563,818 | 27,430 |
| Church & Dwight Co. Inc. | 663,733 | 26,775 |
| Casey’s General Stores | ||
| Inc. | 171,729 | 7,728 |
| Lancaster Colony Corp. | 121,168 | 7,286 |
| Tootsie Roll Industries Inc. | 172,288 | 4,833 |
| 1,999,149 | ||
| Market | ||
| Value | ||
| Shares | ($000) | |
| Energy (15.5%) | ||
| Chevron Corp. | 3,525,608 | 366,734 |
| ConocoPhillips | 4,813,985 | 346,559 |
| Exxon Mobil Corp. | 4,181,851 | 333,670 |
| EOG Resources Inc. | 1,209,985 | 123,418 |
| Murphy Oil Corp. | 966,896 | 62,094 |
| Helmerich & Payne Inc. | 432,888 | 29,891 |
| Energen Corp. | 324,328 | 19,073 |
| CARBO Ceramics Inc. | 97,359 | 15,195 |
| 1,296,634 | ||
| Financials (6.5%) | ||
| Franklin Resources Inc. | 1,001,159 | 127,107 |
| Aflac Inc. | 2,166,272 | 99,778 |
| Chubb Corp. | 1,371,982 | 85,721 |
| T Rowe Price Group Inc. | 1,149,105 | 65,269 |
| SEI Investments Co. | 902,578 | 17,853 |
| Erie Indemnity Co. | ||
| Class A | 227,972 | 16,802 |
| Commerce Bancshares | ||
| Inc. | 399,614 | 16,348 |
| Cullen/Frost Bankers Inc. | 292,545 | 15,762 |
| HCC Insurance Holdings | ||
| Inc. | 519,105 | 15,641 |
| Eaton Vance Corp. | 549,940 | 14,749 |
| Transatlantic Holdings Inc. | 287,400 | 14,718 |
| Brown & Brown Inc. | 642,159 | 14,005 |
| Prosperity Bancshares Inc. | 214,750 | 8,919 |
| UMB Financial Corp. | 189,827 | 7,878 |
| StanCorp Financial Group | ||
| Inc. | 203,122 | 6,756 |
| Westamerica | ||
| Bancorporation | 131,505 | 6,172 |
| RLI Corp. | 90,178 | 5,695 |
| Bank of the Ozarks Inc. | 75,028 | 3,898 |
| Bancfirst Corp. | 69,932 | 2,667 |
| First Financial Corp. | 57,191 | 1,892 |
| Southside Bancshares Inc. | 71,466 | 1,417 |
| 549,047 |
8
Dividend Appreciation Index Fund
| Market | ||
| Value | ||
| Shares | ($000) | |
| Health Care (5.8%) | ||
| Medtronic Inc. | 4,868,398 | 175,506 |
| Stryker Corp. | 1,804,542 | 98,059 |
| Becton Dickinson and Co. | 1,038,600 | 86,837 |
| Cardinal Health Inc. | 1,581,020 | 69,185 |
| CR Bard Inc. | 383,124 | 37,807 |
| Owens & Minor Inc. | 288,053 | 8,786 |
| West Pharmaceutical | ||
| Services Inc. | 147,598 | 6,475 |
| 482,655 | ||
| Industrials (21.3%) | ||
| United Technologies Corp. | 4,044,628 | 335,057 |
| 3M Co. | 3,318,608 | 289,183 |
| Caterpillar Inc. | 2,847,668 | 281,321 |
| Emerson Electric Co. | 3,422,979 | 168,034 |
| Illinois Tool Works Inc. | 2,282,306 | 113,659 |
| General Dynamics Corp. | 1,653,157 | 112,646 |
| Parker Hannifin Corp. | 726,612 | 57,417 |
| CH Robinson Worldwide | ||
| Inc. | 761,335 | 55,052 |
| Dover Corp. | 820,256 | 49,601 |
| WW Grainger Inc. | 328,713 | 48,771 |
| Stanley Black & Decker | ||
| Inc. | 692,210 | 45,527 |
| Fastenal Co. | 1,351,204 | 45,468 |
| Roper Industries Inc. | 423,233 | 34,549 |
| Donaldson Co. Inc. | 351,652 | 19,474 |
| Pentair Inc. | 453,042 | 16,676 |
| Nordson Corp. | 305,004 | 15,564 |
| Carlisle Cos. Inc. | 289,039 | 12,495 |
| Graco Inc. | 270,052 | 11,863 |
| CLARCOR Inc. | 231,641 | 10,206 |
| Harsco Corp. | 356,277 | 9,766 |
| AO Smith Corp. | 191,531 | 7,943 |
| Brady Corp. Class A | 233,112 | 6,900 |
| Mine Safety Appliances | ||
| Co. | 161,729 | 5,518 |
| ABM Industries Inc. | 233,646 | 5,257 |
| Franklin Electric Co. Inc. | 106,313 | 4,641 |
| Raven Industries Inc. | 83,339 | 4,403 |
| Tennant Co. | 83,086 | 3,557 |
| NACCO Industries Inc. | ||
| Class A | 37,081 | 3,370 |
| Gorman-Rupp Co. | 93,583 | 3,049 |
| Universal Forest | ||
| Products Inc. | 86,283 | 2,543 |
| Badger Meter Inc. | 67,059 | 2,447 |
| 1,781,957 | ||
| Information Technology (6.6%) | ||
| International Business | ||
| Machines Corp. | 2,073,882 | 377,136 |
| Automatic Data | ||
| Processing Inc. | 2,301,143 | 118,486 |
| Linear Technology Corp. | 1,023,931 | 30,001 |
| Market | ||
| Value | ||
| Shares | ($000) | |
| Factset Research | ||
| Systems Inc. | 206,461 | 19,013 |
| Jack Henry & Associates | ||
| Inc. | 391,991 | 11,348 |
| 555,984 | ||
| Materials (6.0%) | ||
| Praxair Inc. | 1,397,471 | 144,834 |
| Air Products & Chemicals | ||
| Inc. | 984,933 | 87,393 |
| PPG Industries Inc. | 742,045 | 62,480 |
| Ecolab Inc. | 1,073,323 | 53,666 |
| Sigma-Aldrich Corp. | 553,705 | 37,154 |
| Sherwin-Williams Co. | 481,030 | 37,121 |
| Albemarle Corp. | 425,732 | 28,345 |
| Aptargroup Inc. | 307,405 | 15,693 |
| Bemis Co. Inc. | 492,841 | 15,574 |
| Valspar Corp. | 442,322 | 14,539 |
| HB Fuller Co. | 218,979 | 5,006 |
| Stepan Co. | 45,638 | 3,619 |
| 505,424 | ||
| Telecommunication Services (0.1%) | ||
| Telephone & | ||
| Data Systems Inc. | 259,083 | 7,348 |
| Atlantic Tele-Network Inc. | 69,976 | 2,643 |
| Shenandoah | ||
| Telecommunications Co. | 107,523 | 1,705 |
| 11,696 | ||
| Utilities (1.7%) | ||
| Northeast Utilities | 807,085 | 27,441 |
| National Fuel Gas Co. | 378,654 | 27,407 |
| MDU Resources Group | ||
| Inc. | 864,760 | 18,644 |
| UGI Corp. | 507,148 | 15,367 |
| Questar Corp. | 824,179 | 15,190 |
| Aqua America Inc. | 624,406 | 13,206 |
| New Jersey Resources | ||
| Corp. | 189,676 | 8,272 |
| South Jersey Industries | ||
| Inc. | 136,335 | 6,885 |
| California Water Service | ||
| Group | 190,805 | 3,494 |
| American States Water Co. | 83,985 | 2,871 |
| SJW Corp. | 81,821 | 1,924 |
| 140,701 | ||
| Total Investments (100.0%) | ||
| (Cost $7,636,989) | 8,375,701 | |
| Other Assets and Liabilities (0.0%) | ||
| Other Assets | 16,011 | |
| Liabilities | (15,508) | |
| 503 | ||
| Net Assets (100%) | 8,376,204 | |
9
Dividend Appreciation Index Fund
| At July 31, 2011, net assets consisted of: | |
| Amount | |
| ($000) | |
| Paid-in Capital | 7,855,158 |
| Undistributed Net Investment Income | 10,870 |
| Accumulated Net Realized Losses | (228,536) |
| Unrealized Appreciation (Depreciation) | 738,712 |
| Net Assets | 8,376,204 |
| Investor Shares—Net Assets | |
| Applicable to 76,665,672 outstanding | |
| $.001 par value shares of beneficial | |
| interest (unlimited authorization) | 1,658,505 |
| Net Asset Value Per Share— | |
| Investor Shares | $21.63 |
| ETF Shares—Net Assets | |
| Applicable to 124,241,392 outstanding | |
| $.001 par value shares of beneficial | |
| interest (unlimited authorization) | 6,717,699 |
| Net Asset Value Per Share— | |
| ETF Shares | $54.07 |
See Note A in Notes to Financial Statements.
See accompanying Notes, which are an integral part of the Financial Statements.
10
Dividend Appreciation Index Fund
Statement of Operations
| Six Months Ended | |
| July 31, 2011 | |
| ($000) | |
| Investment Income | |
| Income | |
| Dividends | 90,179 |
| Interest1 | 3 |
| Security Lending | 1 |
| Total Income | 90,183 |
| Expenses | |
| The Vanguard Group—Note B | |
| Investment Advisory Services | 201 |
| Management and Administrative—Investor Shares | 1,770 |
| Management and Administrative—ETF Shares | 3,009 |
| Marketing and Distribution—Investor Shares | 213 |
| Marketing and Distribution—ETF Shares | 795 |
| Custodian Fees | 39 |
| Shareholders’ Reports—Investor Shares | 7 |
| Shareholders’ Reports—ETF Shares | 73 |
| Trustees’ Fees and Expenses | 3 |
| Total Expenses | 6,110 |
| Net Investment Income | 84,073 |
| Realized Net Gain (Loss) on Investment Securities Sold | 42,748 |
| Change in Unrealized Appreciation (Depreciation) of Investment Securities | (2,950) |
| Net Increase (Decrease) in Net Assets Resulting from Operations | 123,871 |
| 1 Interest income from an affiliated company of the fund was $3,000. | |
See accompanying Notes, which are an integral part of the Financial Statements.
11
Dividend Appreciation Index Fund
Statement of Changes in Net Assets
| Six Months Ended | Year Ended | |
| July 31, | January 31, | |
| 2011 | 2011 | |
| ($000) | ($000) | |
| Increase (Decrease) in Net Assets | ||
| Operations | ||
| Net Investment Income | 84,073 | 95,486 |
| Realized Net Gain (Loss) | 42,748 | 62,018 |
| Change in Unrealized Appreciation (Depreciation) | (2,950) | 607,952 |
| Net Increase (Decrease) in Net Assets Resulting from Operations | 123,871 | 765,456 |
| Distributions | ||
| Net Investment Income | ||
| Investor Shares | (15,337) | (19,694) |
| ETF Shares | (62,108) | (74,247) |
| Realized Capital Gain | ||
| Investor Shares | — | — |
| ETF Shares | — | — |
| Total Distributions | (77,445) | (93,941) |
| Capital Share Transactions | ||
| Investor Shares | 221,868 | 655,145 |
| ETF Shares | 1,702,368 | 2,547,856 |
| Net Increase (Decrease) from Capital Share Transactions | 1,924,236 | 3,203,001 |
| Total Increase (Decrease) | 1,970,662 | 3,874,516 |
| Net Assets | ||
| Beginning of Period | 6,405,542 | 2,531,026 |
| End of Period1 | 8,376,204 | 6,405,542 |
| 1 Net Assets—End of Period includes undistributed net investment income of $10,870,000 and $4,242,000. | ||
See accompanying Notes, which are an integral part of the Financial Statements.
12
Dividend Appreciation Index Fund
Financial Highlights
Investor Shares
| Six Months | April 27, | |||||
| Ended | 20061 to | |||||
| For a Share Outstanding | July 31, | Year Ended January 31, | Jan. 31, | |||
| Throughout Each Period | 2011 | 2011 | 2010 | 2009 | 2008 | 2007 |
| Net Asset Value, Beginning of Period | $21.33 | $18.33 | $14.79 | $21.40 | $21.84 | $20.05 |
| Investment Operations | ||||||
| Net Investment Income | .224 | .392 | .369 | .387 | .325 | .214 |
| Net Realized and Unrealized Gain (Loss) | ||||||
| on Investments | .285 | 3.006 | 3.543 | (6.614) | (.438) | 1.782 |
| Total from Investment Operations | .509 | 3.398 | 3.912 | (6.227) | (.113) | 1.996 |
| Distributions | ||||||
| Dividends from Net Investment Income | (.209) | (.398) | (.372) | (.383) | (.327) | (.206) |
| Distributions from Realized Capital Gains | — | — | — | — | — | — |
| Total Distributions | (.209) | (.398) | (.372) | (.383) | (.327) | (.206) |
| Net Asset Value, End of Period | $21.63 | $21.33 | $18.33 | $14.79 | $21.40 | $21.84 |
| Total Return2 | 2.38% | 18.75% | 26.80% | -29.48% | -0.58% | 10.02% |
| Ratios/Supplemental Data | ||||||
| Net Assets, End of Period (Millions) | $1,659 | $1,421 | $613 | $386 | $357 | $163 |
| Ratio of Total Expenses to | ||||||
| Average Net Assets | 0.25% | 0.30% | 0.35% | 0.36% | 0.40% | 0.40%3 |
| Ratio of Net Investment Income to | ||||||
| Average Net Assets | 2.10% | 2.13% | 2.24% | 2.25% | 1.56% | 1.53%3 |
| Portfolio Turnover Rate4 | 3% | 15% | 20% | 34% | 17% | 21% |
The expense ratio, net income ratio, and turnover rate for the current period have been annualized.
1 Inception.
2 Total returns do not include account service fees that may have applied in the periods shown. Fund prospectuses provide information about any applicable account service fees.
3 Annualized.
4 Excludes the value of portfolio securities received or delivered as a result of in-kind purchases or redemptions of the fund’s capital shares, including ETF Creation Units.
See accompanying Notes, which are an integral part of the Financial Statements.
13
Dividend Appreciation Index Fund
Financial Highlights
ETF Shares
| Six Months | April 21, | |||||
| Ended | 20061 to | |||||
| For a Share Outstanding | July 31, | Year Ended January 31, | Jan. 31, | |||
| Throughout Each Period | 2011 | 2011 | 2010 | 2009 | 2008 | 2007 |
| Net Asset Value, Beginning of Period | $53.32 | $45.81 | $36.96 | $53.48 | $54.60 | $49.94 |
| Investment Operations | ||||||
| Net Investment Income | .590 | 1.034 | .973 | 1.032 | .873 | .555 |
| Net Realized and Unrealized Gain (Loss) | ||||||
| on Investments | .715 | 7.524 | 8.856 | (16.526) | (1.120) | 4.631 |
| Total from Investment Operations | 1.305 | 8.558 | 9.829 | (15.494) | (.247) | 5.186 |
| Distributions | ||||||
| Dividends from Net Investment Income | (.555) | (1.048) | (.979) | (1.026) | (.873) | (.526) |
| Distributions from Realized Capital Gains | — | — | — | — | — | — |
| Total Distributions | (.555) | (1.048) | (.979) | (1.026) | (.873) | (.526) |
| Net Asset Value, End of Period | $54.07 | $53.32 | $45.81 | $36.96 | $53.48 | $54.60 |
| Total Return | 2.44% | 18.91% | 26.95% | -29.38% | -0.51% | 10.45% |
| Ratios/Supplemental Data | ||||||
| Net Assets, End of Period (Millions) | $6,718 | $4,985 | $1,918 | $805 | $302 | $111 |
| Ratio of Total Expenses to | ||||||
| Average Net Assets | 0.13% | 0.18% | 0.23% | 0.24% | 0.28% | 0.28%2 |
| Ratio of Net Investment Income to | ||||||
| Average Net Assets | 2.22% | 2.25% | 2.36% | 2.37% | 1.68% | 1.65%2 |
| Portfolio Turnover Rate3 | 3% | 15% | 20% | 34% | 17% | 21% |
The expense ratio, net income ratio, and turnover rate for the current period have been annualized.
1 Inception.
2 Annualized.
3 Excludes the value of portfolio securities received or delivered as a result of in-kind purchases or redemptions of the fund’s capital shares, including ETF Creation Units.
See accompanying Notes, which are an integral part of the Financial Statements.
14
Dividend Appreciation Index Fund
Notes to Financial Statements
Vanguard Dividend Appreciation Index Fund is registered under the Investment Company Act of 1940 as an open-end investment company, or mutual fund. The fund offers two classes of shares: Investor Shares and ETF Shares. Investor Shares are available to any investor who meets the fund’s minimum purchase requirements. ETF Shares are listed for trading on the NYSE Arca, Inc.; they can be purchased and sold through a broker.
A. The following significant accounting policies conform to generally accepted accounting principles for U.S. mutual funds. The fund consistently follows such policies in preparing its financial statements.
1. Security Valuation: Securities are valued as of the close of trading on the New York Stock Exchange (generally 4 p.m., Eastern time) on the valuation date. Equity securities are valued at the latest quoted sales prices or official closing prices taken from the primary market in which each security trades; such securities not traded on the valuation date are valued at the mean of the latest quoted bid and asked prices. Securities for which market quotations are not readily available, or whose values have been materially affected by events occurring before the fund’s pricing time but after the close of the securities’ primary markets, are valued by methods deemed by the board of trustees to represent fair value. Investments in Vanguard Market Liquidity Fund are valued at that fund’s net asset value.
2. Federal Income Taxes: The fund intends to continue to qualify as a regulated investment company and distribute all of its taxable income. Management has analyzed the fund’s tax positions taken for all open federal income tax years (January 31, 2008–2011), and for the period ended July 31, 2011, and has concluded that no provision for federal income tax is required in the fund’s financial statements.
3. Distributions: Distributions to shareholders are recorded on the ex-dividend date.
4. Security Lending: The fund may lend its securities to qualified institutional borrowers to earn additional income. Security loans are required to be secured at all times by collateral at least equal to the market value of securities loaned. The fund invests cash collateral received in Vanguard Market Liquidity Fund, and records a liability for the return of the collateral, during the period the securities are on loan. Security lending income represents fees charged to borrowers plus income earned on investing cash collateral, less expenses associated with the loan.
5. Other: Dividend income is recorded on the ex-dividend date. Interest income includes income distributions received from Vanguard Market Liquidity Fund and is accrued daily. Security transactions are accounted for on the date securities are bought or sold. Costs used to determine realized gains (losses) on the sale of investment securities are those of the specific securities sold.
Each class of shares has equal rights as to assets and earnings, except that each class separately bears certain class-specific expenses related to maintenance of shareholder accounts (included in Management and Administrative expenses) and shareholder reporting. Marketing and distribution expenses are allocated to each class of shares based on a method approved by the board of trustees. Income, other non-class-specific expenses, and gains and losses on investments are allocated to each class of shares based on its relative net assets.
B. The Vanguard Group furnishes at cost investment advisory, corporate management, administrative, marketing, and distribution services. The costs of such services are allocated to the fund under methods approved by the board of trustees. The fund has committed to provide up to 0.40% of its net assets in capital contributions to Vanguard. At July 31, 2011, the fund had contributed capital of $1,336,000 to Vanguard (included in Other Assets), representing 0.02% of the fund’s net assets and 0.53% of Vanguard’s capitalization. The fund’s trustees and officers are also directors and officers of Vanguard.
15
Dividend Appreciation Index Fund
C. Various inputs may be used to determine the value of the fund’s investments. These inputs are summarized in three broad levels for financial statement purposes. The inputs or methodologies used to value securities are not necessarily an indication of the risk associated with investing in those securities.
Level 1—Quoted prices in active markets for identical securities.
Level 2—Other significant observable inputs (including quoted prices for similar securities, interest rates, prepayment speeds, credit risk, etc.).
Level 3—Significant unobservable inputs (including the fund’s own assumptions used to determine the fair value of investments).
At July 31, 2011, 100% of the fund’s investments were valued based on Level 1 inputs.
D. Distributions are determined on a tax basis and may differ from net investment income and realized capital gains for financial reporting purposes. Differences may be permanent or temporary. Permanent differences are reclassified among capital accounts in the financial statements to reflect their tax character. Temporary differences arise when certain items of income, expense, gain, or loss are recognized in different periods for financial statement and tax purposes; these differences will reverse at some time in the future. Differences in classification may also result from the treatment of short-term gains as ordinary income for tax purposes.
During the six months ended July 31, 2011, the fund realized $34,526,000 of net capital gains resulting from in-kind redemptions—in which shareholders exchanged fund shares for securities held by the fund rather than for cash. Because such gains are not taxable to the fund, and are not distributed to shareholders, they have been reclassified from accumulated net realized losses to paid-in capital.
The fund’s tax-basis capital gains and losses are determined only at the end of each fiscal year. For tax purposes, at January 31, 2011, the fund had available capital loss carryforwards totaling $191,649,000 to offset future net capital gains of $609,000 through January 31, 2016, $22,242,000 through January 31, 2017, $146,149,000 through January 31, 2018, and $22,649,000 through January 31, 2019. In addition, the fund realized losses of $42,826,000 during the period from November 1, 2010, through January 31, 2011, which are deferred and will be treated as realized for tax purposes in fiscal 2012. The fund will use these capital losses to offset net taxable capital gains, if any, realized during the year ending January 31, 2012; should the fund realize net capital losses for the year, the losses will be added to the loss carryforward balance above.
At July 31, 2011, the cost of investment securities for tax purposes was $7,636,989,000. Net unrealized appreciation of investment securities for tax purposes was $738,712,000, consisting of unrealized gains of $817,459,000 on securities that had risen in value since their purchase and $78,747,000 in unrealized losses on securities that had fallen in value since their purchase.
E. During the six months ended July 31, 2011, the fund purchased $2,163,366,000 of investment securities and sold $226,986,000 of investment securities, other than temporary cash investments.
16
Dividend Appreciation Index Fund
F. Capital share transactions for each class of shares were:
| Six Months Ended | Year Ended | |||
| July 31, 2011 | January 31, 2011 | |||
| Amount | Shares | Amount | Shares | |
| ($000) | (000) | ($000) | (000) | |
| Investor Shares | ||||
| Issued | 393,568 | 17,785 | 764,953 | 38,773 |
| Issued in Lieu of Cash Distributions | 13,653 | 624 | 18,250 | 928 |
| Redeemed | (185,353) | (8,355) | (128,058) | (6,510) |
| Net Increase (Decrease)—Investor Shares | 221,868 | 10,054 | 655,145 | 33,191 |
| ETF Shares | ||||
| Issued | 1,802,664 | 32,558 | 3,186,243 | 64,200 |
| Issued in Lieu of Cash Distributions | — | — | — | — |
| Redeemed | (100,296) | (1,800) | (638,387) | (12,600) |
| Net Increase (Decrease)—ETF Shares | 1,702,368 | 30,758 | 2,547,856 | 51,600 |
G. In preparing the financial statements as of July 31, 2011, management considered the impact of subsequent events for potential recognition or disclosure in these financial statements.
17
About Your Fund’s Expenses
As a shareholder of the fund, you incur ongoing costs, which include costs for portfolio management, administrative services, and shareholder reports (like this one), among others. Operating expenses, which are deducted from a fund’s gross income, directly reduce the investment return of the fund.
A fund’s expenses are expressed as a percentage of its average net assets. This figure is known as the expense ratio. The following examples are intended to help you understand the ongoing costs (in dollars) of investing in your fund and to compare these costs with those of other mutual funds. The examples are based on an investment of $1,000 made at the beginning of the period shown and held for the entire period.
The accompanying table illustrates your fund’s costs in two ways:
• Based on actual fund return. This section helps you to estimate the actual expenses that you paid over the period. The ”Ending Account Value“ shown is derived from the fund‘s actual return, and the third column shows the dollar amount that would have been paid by an investor who started with $1,000 in the fund. You may use the information here, together with the amount you invested, to estimate the expenses that you paid over the period.
To do so, simply divide your account value by $1,000 (for example, an $8,600 account value divided by $1,000 = 8.6), then multiply the result by the number given for your fund under the heading ”Expenses Paid During Period.“
• Based on hypothetical 5% yearly return. This section is intended to help you compare your fund‘s costs with those of other mutual funds. It assumes that the fund had a yearly return of 5% before expenses, but that the expense ratio is unchanged. In this case—because the return used is not the fund’s actual return—the results do not apply to your investment. The example is useful in making comparisons because the Securities and Exchange Commission requires all mutual funds to calculate expenses based on a 5% return. You can assess your fund’s costs by comparing this hypothetical example with the hypothetical examples that appear in shareholder reports of other funds.
Note that the expenses shown in the table are meant to highlight and help you compare ongoing costs only and do not reflect transaction costs incurred by the fund for buying and selling securities. Further, the expenses do not include any purchase, redemption, or account service fees described in the fund prospectus. If such fees were applied to your account, your costs would be higher. Your fund does not carry a “sales load.”
The calculations assume no shares were bought or sold during the period. Your actual costs may have been higher or lower, depending on the amount of your investment and the timing of any purchases or redemptions.
You can find more information about the fund’s expenses, including annual expense ratios, in the Financial Statements section of this report. For additional information on operating expenses and other shareholder costs, please refer to your fund’s current prospectus.
18
| Six Months Ended July 31, 2011 | |||
| Beginning | Ending | Expenses | |
| Account Value | Account Value | Paid During | |
| Dividend Appreciation Index Fund | 1/31/2011 | 7/31/2011 | Period |
| Based on Actual Fund Return | |||
| Investor Shares | $1,000.00 | $1,023.78 | $1.25 |
| ETF Shares | 1,000.00 | 1,024.43 | 0.65 |
| Based on Hypothetical 5% Yearly Return | |||
| Investor Shares | $1,000.00 | $1,023.55 | $1.25 |
| ETF Shares | 1,000.00 | 1,024.15 | 0.65 |
The calculations are based on expenses incurred in the most recent six-month period. The fund’s annualized six-month expense ratios for that period are 0.25% for Investor Shares and 0.13% for ETF Shares. The dollar amounts shown as “Expenses Paid” are equal to the annualized expense ratio multiplied by the average account value over the period, multiplied by the number of days in the most recent six-month period, then divided by the number of days in the most recent 12-month period.
19
Trustees Approve Advisory Arrangement
The board of trustees of Vanguard Dividend Appreciation Index Fund has renewed the fund’s investment advisory arrangement with The Vanguard Group, Inc. Vanguard—through its Quantitative Equity Group—serves as investment advisor for the fund. The board determined that continuing the fund’s internalized management structure was in the best interests of the fund and its shareholders.
The board based its decision upon an evaluation of the advisor’s investment staff, portfolio management process, and performance. The trustees considered the factors discussed below, among others. However, no single factor determined whether the board approved the arrangement. Rather, it was the totality of the circumstances that drove the board’s decision.
Nature, extent, and quality of services
The board considered the quality of the fund’s investment management since the fund’s inception in 2006, and took into account the organizational depth and stability of the advisor. The board noted that Vanguard has been managing investments for more than three decades. The Quantitative Equity Group adheres to a sound, disciplined investment management process; the team has considerable experience, stability, and depth.
The board concluded that Vanguard’s experience, stability, depth, and performance, among other factors, warranted continuation of the advisory arrangement.
Investment performance
The board considered the fund’s performance since inception, including any periods of outperformance or underperformance of its target index and peer group. The board concluded that the fund has performed in line with expectations, and that the results have been consistent with the fund’s investment strategy. Information about the fund’s most recent performance can be found in the Performance Summary section of this report.
Cost
The board concluded that the fund’s expense ratio was well below the average expense ratio charged by funds in its peer group and that the fund’s advisory fee rate was also well below its peer-group average. Information about the fund’s expenses appears in the About Your Fund’s Expenses section of this report as well as in the Financial Statements section.
The board does not conduct a profitability analysis of Vanguard, because of Vanguard’s unique “at-cost” structure. Unlike most other mutual fund management companies, Vanguard is owned by the funds it oversees, and produces “profits” only in the form of reduced expenses for fund shareholders.
The benefit of economies of scale
The board concluded that the fund’s low-cost arrangement with Vanguard ensures that the fund will realize economies of scale as it grows, with the cost to shareholders declining as the fund’s assets increase.
The board will consider whether to renew the advisory arrangement again after a one-year period.
20
Glossary
30-Day SEC Yield. A fund’s 30-day SEC yield is derived using a formula specified by the U.S. Securities and Exchange Commission. Under the formula, data related to the fund’s security holdings in the previous 30 days are used to calculate the fund’s hypothetical net income for that period, which is then annualized and divided by the fund’s estimated average net assets over the calculation period. For the purposes of this calculation, a security’s income is based on its current market yield to maturity (in the case of bonds), its actual income (for asset-backed securities), or its projected dividend yield (for stocks). Because the SEC yield represents hypothetical annualized income, it will differ—at times significantly—from the fund’s actual experience. As a result, the fund’s income distributions may be higher or lower than implied by the SEC yield.
Beta. A measure of the magnitude of a fund’s past share-price fluctuations in relation to the ups and downs of a given market index. The index is assigned a beta of 1.00. Compared with a given index, a fund with a beta of 1.20 typically would have seen its share price rise or fall by 12% when the index rose or fell by 10%. For this report, beta is based on returns over the past 36 months for both the fund and the index. Note that a fund’s beta should be reviewed in conjunction with its R-squared (see definition). The lower the R-squared, the less correlation there is between the fund and the index, and the less reliable beta is as an indicator of volatility.
Dividend Yield. Dividend income earned by stocks, expressed as a percentage of the aggregate market value (or of net asset value, for a fund). The yield is determined by dividing the amount of the annual dividends by the aggregate value (or net asset value) at the end of the period. For a fund, the dividend yield is based solely on stock holdings and does not include any income produced by other investments.
Earnings Growth Rate. The average annual rate of growth in earnings over the past five years for the stocks now in a fund.
Equity Exposure. A measure that reflects a fund’s investments in stocks and stock futures. Any holdings in short-term reserves are excluded.
Expense Ratio. The percentage of a fund’s average net assets used to pay its annual administrative and advisory expenses. These expenses directly reduce returns to investors.
Foreign Holdings. The percentage of a fund represented by securities or depositary receipts of companies based outside the United States.
Inception Date. The date on which the assets of a fund (or one of its share classes) are first invested in accordance with the fund’s investment objective. For funds with a subscription period, the inception date is the day after that period ends. Investment performance is measured from the inception date.
Median Market Cap. An indicator of the size of companies in which a fund invests; the midpoint of market capitalization (market price x shares outstanding) of a fund’s stocks, weighted by the proportion of the fund’s assets invested in each stock. Stocks representing half of the fund’s assets have market capitalizations above the median, and the rest are below it.
Price/Book Ratio. The share price of a stock divided by its net worth, or book value, per share. For a fund, the weighted average price/book ratio of the stocks it holds.
21
Price/Earnings Ratio. The ratio of a stock’s current price to its per-share earnings over the past year. For a fund, the weighted average P/E of the stocks it holds. P/E is an indicator of market expectations about corporate prospects; the higher the P/E, the greater the expectations for a company’s future growth.
R-Squared. A measure of how much of a fund’s past returns can be explained by the returns from the market in general, as measured by a given index. If a fund’s total returns were precisely synchronized with an index’s returns, its R-squared would be 1.00. If the fund’s returns bore no relationship to the index’s returns, its R-squared would be 0. For this report, R-squared is based on returns over the past 36 months for both the fund and the index.
Return on Equity. The annual average rate of return generated by a company during the past five years for each dollar of shareholder’s equity (net income divided by shareholder’s equity). For a fund, the weighted average return on equity for the companies whose stocks it holds.
Short-Term Reserves. The percentage of a fund invested in highly liquid, short-term securities that can be readily converted to cash.
Turnover Rate. An indication of the fund’s trading activity. Funds with high turnover rates incur higher transaction costs and may be more likely to distribute capital gains (which may be taxable to investors). The turnover rate excludes in-kind transactions, which have minimal impact on costs.
22
This page intentionally left blank.
The People Who Govern Your Fund
The trustees of your mutual fund are there to see that the fund is operated and managed in your best interests since, as a shareholder, you are a part owner of the fund. Your fund’s trustees also serve on the board of directors of The Vanguard Group, Inc., which is owned by the Vanguard funds and provides services to them on an at-cost basis.
A majority of Vanguard’s board members are independent, meaning that they have no affiliation with Vanguard or the funds they oversee, apart from the sizable personal investments they have made as private individuals. The independent board members have distinguished backgrounds in business, academia, and public service. Each of the trustees and executive officers oversees 178 Vanguard funds.
The following table provides information for each trustee and executive officer of the fund. More information about the trustees is in the Statement of Additional Information, which can be obtained, without charge, by contacting Vanguard at 800-662-7447, or online at vanguard.com.
| Interested Trustee1 | and President (2006–2008) of Rohm and Haas Co. |
| (chemicals); Director of Tyco International, Ltd. | |
| F. William McNabb III | (diversified manufacturing and services) and Hewlett- |
| Born 1957. Trustee Since July 2009. Chairman of the | Packard Co. (electronic computer manufacturing); |
| Board. Principal Occupation(s) During the Past Five | Senior Advisor at New Mountain Capital; Trustee |
| Years: Chairman of the Board of The Vanguard Group, | of The Conference Board; Member of the Board of |
| Inc., and of each of the investment companies served | Managers of Delphi Automotive LLP (automotive |
| by The Vanguard Group, since January 2010; Director | components). |
| of The Vanguard Group since 2008; Chief Executive | |
| Officer and President of The Vanguard Group and of | Amy Gutmann |
| each of the investment companies served by The | Born 1949. Trustee Since June 2006. Principal |
| Vanguard Group since 2008; Director of Vanguard | Occupation(s) During the Past Five Years: President |
| Marketing Corporation; Managing Director of The | of the University of Pennsylvania; Christopher H. |
| Vanguard Group (1995–2008). | Browne Distinguished Professor of Political Science |
| in the School of Arts and Sciences with secondary | |
| appointments at the Annenberg School for Commu- | |
| Independent Trustees | nication and the Graduate School of Education |
| of the University of Pennsylvania; Director of | |
| Emerson U. Fullwood | Carnegie Corporation of New York, Schuylkill River |
| Born 1948. Trustee Since January 2008. Principal | Development Corporation, and Greater Philadelphia |
| Occupation(s) During the Past Five Years: Executive | Chamber of Commerce; Trustee of the National |
| Chief Staff and Marketing Officer for North America | Constitution Center; Chair of the Presidential |
| and Corporate Vice President (retired 2008) of Xerox | Commission for the Study of Bioethical Issues. |
| Corporation (document management products and | |
| services); Executive in Residence and 2010 | JoAnn Heffernan Heisen |
| Distinguished Minett Professor at the Rochester | Born 1950. Trustee Since July 1998. Principal |
| Institute of Technology; Director of SPX Corporation | Occupation(s) During the Past Five Years: Corporate |
| (multi-industry manufacturing), the United Way of | Vice President and Chief Global Diversity Officer |
| Rochester, Amerigroup Corporation (managed health | (retired 2008) and Member of the Executive |
| care), the University of Rochester Medical Center, | Committee (1997–2008) of Johnson & Johnson |
| Monroe Community College Foundation, and North | (pharmaceuticals/consumer products); Director of |
| Carolina A&T University. | Skytop Lodge Corporation (hotels), the University |
| Medical Center at Princeton, the Robert Wood | |
| Rajiv L. Gupta | Johnson Foundation, and the Center for Work Life |
| Born 1945. Trustee Since December 2001.2 | Policy; Member of the Advisory Board of the |
| Principal Occupation(s) During the Past Five Years: | Maxwell School of Citizenship and Public Affairs |
| Chairman and Chief Executive Officer (retired 2009) | at Syracuse University. |
| F. Joseph Loughrey | Thomas J. Higgins | |
| Born 1949. Trustee Since October 2009. Principal | Born 1957. Chief Financial Officer Since September | |
| Occupation(s) During the Past Five Years: President | 2008. Principal Occupation(s) During the Past Five | |
| and Chief Operating Officer (retired 2009) and Vice | Years: Principal of The Vanguard Group, Inc.; Chief | |
| Chairman of the Board (2008–2009) of Cummins Inc. | Financial Officer of each of the investment companies | |
| (industrial machinery); Director of SKF AB (industrial | served by The Vanguard Group since 2008; Treasurer | |
| machinery), Hillenbrand, Inc. (specialized consumer | of each of the investment companies served by The | |
| services), the Lumina Foundation for Education, and | Vanguard Group (1998–2008). | |
| Oxfam America; Chairman of the Advisory Council | ||
| for the College of Arts and Letters and Member | Kathryn J. Hyatt | |
| of the Advisory Board to the Kellogg Institute for | Born 1955. Treasurer Since November 2008. Principal | |
| International Studies at the University of Notre Dame. | Occupation(s) During the Past Five Years: Principal | |
| of The Vanguard Group, Inc.; Treasurer of each of | ||
| André F. Perold | the investment companies served by The Vanguard | |
| Born 1952. Trustee Since December 2004. Principal | Group since 2008; Assistant Treasurer of each of the | |
| Occupation(s) During the Past Five Years: George | investment companies served by The Vanguard Group | |
| Gund Professor of Finance and Banking at the Harvard | (1988–2008). | |
| Business School (retired July 2011); Chief Investment | ||
| Officer and co-Managing Partner of HighVista | Heidi Stam | |
| Strategies LLC (private investment firm); Director of | Born 1956. Secretary Since July 2005. Principal | |
| Rand Merchant Bank; Overseer of the Museum of | Occupation(s) During the Past Five Years: Managing | |
| Fine Arts Boston. | Director of The Vanguard Group, Inc., since 2006; | |
| General Counsel of The Vanguard Group since 2005; | ||
| Alfred M. Rankin, Jr. | Secretary of The Vanguard Group and of each of the | |
| Born 1941. Trustee Since January 1993. Principal | investment companies served by The Vanguard Group | |
| Occupation(s) During the Past Five Years: Chairman, | since 2005; Director and Senior Vice President of | |
| President, and Chief Executive Officer of NACCO | Vanguard Marketing Corporation since 2005; | |
| Industries, Inc. (forklift trucks/housewares/lignite); | Principal of The Vanguard Group (1997–2006). | |
| Director of Goodrich Corporation (industrial products/ | ||
| aircraft systems and services) and the National | ||
| Association of Manufacturers; Chairman of the | Vanguard Senior Management Team | |
| Federal Reserve Bank of Cleveland; Vice Chairman | ||
| of University Hospitals of Cleveland; President of | R. Gregory Barton | Michael S. Miller |
| the Board of The Cleveland Museum of Art. | Mortimer J. Buckley | James M. Norris |
| Kathleen C. Gubanich | Glenn W. Reed | |
| Peter F. Volanakis | Paul A. Heller | George U. Sauter |
| Born 1955. Trustee Since July 2009. Principal | Martha G. King | |
| Occupation(s) During the Past Five Years: President | ||
| and Chief Operating Officer (retired 2010) of Corning | ||
| Incorporated (communications equipment); Director of | Chairman Emeritus and Senior Advisor | |
| Corning Incorporated (2000–2010) and Dow Corning | ||
| (2001–2010); Overseer of the Amos Tuck School of | John J. Brennan | |
| Business Administration at Dartmouth College. | Chairman, 1996–2009 | |
| Chief Executive Officer and President, 1996–2008 | ||
| Executive Officers | ||
| Founder | ||
| Glenn Booraem | ||
| Born 1967. Controller Since July 2010. Principal | John C. Bogle | |
| Occupation(s) During the Past Five Years: Principal | Chairman and Chief Executive Officer, 1974–1996 | |
| of The Vanguard Group, Inc.; Controller of each of | ||
| the investment companies served by The Vanguard | ||
| Group since 2010; Assistant Controller of each of | ||
| the investment companies served by The Vanguard | ||
| Group (2001–2010). | ||
1 Mr. McNabb is considered an “interested person,” as defined in the Investment Company Act of 1940, because he is an officer of the Vanguard funds.
2 December 2002 for Vanguard Equity Income Fund, Vanguard Growth Equity Fund, the Vanguard Municipal Bond Funds, and the Vanguard State Tax-Exempt Funds.
 | |
| P.O. Box 2600 | |
| Valley Forge, PA 19482-2600 |
Connect with Vanguard® > vanguard.com
| Fund Information > 800-662-7447 | “Dividend Achievers” is a trademark of Mergent, Inc., |
| Direct Investor Account Services > 800-662-2739 | and has been licensed for use by The Vanguard Group, |
| Institutional Investor Services > 800-523-1036 | Inc. Vanguard mutual funds are not sponsored, |
| Text Telephone for People | endorsed, sold, or promoted by Mergent, and Mergent |
| With Hearing Impairment > 800-749-7273 | makes no representation regarding the advisability of |
| investing in the funds. | |
| This material may be used in conjunction | |
| with the offering of shares of any Vanguard | |
| fund only if preceded or accompanied by | |
| the fund’s current prospectus. | |
| All comparative mutual fund data are from Lipper Inc. or | |
| Morningstar, Inc., unless otherwise noted. | |
| You can obtain a free copy of Vanguard’s proxy voting | |
| guidelines by visiting vanguard.com/proxyreporting or by | |
| calling Vanguard at 800-662-2739. The guidelines are | |
| also available from the SEC’s website, sec.gov. In | |
| addition, you may obtain a free report on how your fund | |
| voted the proxies for securities it owned during the 12 | |
| months ended June 30. To get the report, visit either | |
| vanguard.com/proxyreporting or sec.gov. | |
| You can review and copy information about your fund at | |
| the SEC’s Public Reference Room in Washington, D.C. To | |
| find out more about this public service, call the SEC at | |
| 202-551-8090. Information about your fund is also | |
| available on the SEC’s website, and you can receive | |
| copies of this information, for a fee, by sending a | |
| request in either of two ways: via e-mail addressed to | |
| publicinfo@sec.gov or via regular mail addressed to the | |
| Public Reference Section, Securities and Exchange | |
| Commission, Washington, DC 20549-1520. | |
| © 2011 The Vanguard Group, Inc. | |
| All rights reserved. | |
| Vanguard Marketing Corporation, Distributor. | |
| Q6022 092011 | |
Item 2: Code of Ethics.
Not Applicable.
Item 3: Audit Committee Financial Expert.
Not Applicable.
Item 4: Principal Accountant Fees and Services.
Not Applicable.
Item 5: Audit Committee of Listed Registrants.
Not Applicable.
Item 6: Investments.
Not Applicable.
Item 7: Disclosure of Proxy Voting Policies and Procedures for Closed-End Management Investment Companies.
Not Applicable.
Item 8: Portfolio Managers of Closed-End Management Investment Companies.
Not Applicable.
Item 9: Purchase of Equity Securities by Closed-End Management Investment Company and Affiliated Purchasers.
Not Applicable.
Item 10: Submission of Matters to a Vote of Security Holders.
Not Applicable.
Item 11: Controls and Procedures.
(a) Disclosure Controls and Procedures. The Principal Executive and Financial Officers concluded that the Registrant's Disclosure Controls and Procedures are effective based on their evaluation of the Disclosure Controls and Procedures as of a date within 90 days of the filing date of this report.
(b) Internal Control Over Financial Reporting. There were no significant changes in Registrant’s Internal Control Over Financial Reporting or in other factors that could significantly affect this control subsequent to the date of the evaluation, including any corrective actions with regard to significant deficiencies and material weaknesses.
Item 12: Exhibits.
(a) Certifications.
Pursuant to the requirements of the Securities Exchange Act of 1934 and the Investment Company Act of 1940, the registrant has duly caused this report to be signed on its behalf by the undersigned, thereunto duly authorized.
| VANGUARD SPECIALIZED FUNDS | |
| By: | /s/ F. WILLIAM MCNABB III* |
| F. WILLIAM MCNABB III | |
| CHIEF EXECUTIVE OFFICER | |
| Date: September 22, 2011 | |
Pursuant to the requirements of the Securities Exchange Act of 1934 and the Investment Company Act of 1940, this report has been signed below by the following persons on behalf of the registrant and in the capacities and on the dates indicated.
| VANGUARD SPECIALIZED FUNDS | |
| By: | /s/ F. WILLIAM MCNABB III* |
| F. WILLIAM MCNABB III | |
| CHIEF EXECUTIVE OFFICER | |
| Date: September 22, 2011 | |
| VANGUARD SPECIALIZED FUNDS | |
| By: | /s/ THOMAS J. HIGGINS* |
| THOMAS J. HIGGINS | |
| CHIEF FINANCIAL OFFICER | |
| Date: September 22, 2011 | |
* By: /s/ Heidi Stam
Heidi Stam, pursuant to a Power of Attorney filed on April 26, 2010, see file Number 33-53683, Incorporated by Reference.