UNITED STATES
SECURITIES AND EXCHANGE COMMISSION
Washington, D.C. 20549
FORM N-CSR
CERTIFIED SHAREHOLDER REPORT
OF
REGISTERED MANAGEMENT INVESTMENT COMPANIES
Investment Company Act file number: 811-03916
| Name of Registrant: | Vanguard Specialized Funds |
| Address of Registrant: | P.O. Box 2600 |
Valley Forge, PA 19482
| Name and address of agent for service: | Anne E. Robinson, Esquire |
P.O. Box 876
Valley Forge, PA 19482
Registrant’s telephone number, including area code: (610) 669-1000
Date of fiscal year end: January 31
Date of reporting period: February 1, 2022—January 31, 2023
Item 1: Reports to Shareholders

Your Fund’s Performance at a Glance | 1 |
Advisor's Report | 2 |
About Your Fund’s Expenses | 5 |
Performance Summary | 7 |
Financial Statements | 9 |
| • | For the 12 months ended January 31, 2023, Vanguard Energy Fund returned 16.72% for Investor Shares and 16.83% for Admiral Shares. It outpaced the 11.88% return of its benchmark index. |
| • | Despite some relief in midsummer and toward the end of the period, it was a volatile, challenging time for financial markets. Early on, inflation readings around much of the world continued climbing to multidecade highs amid supply chain bottlenecks, rising energy and food prices, and broader price increases in goods and services. Central banks responded by aggressively tightening monetary policy. Later, it appeared that inflation might have peaked, and central banks began slowing their pace of interest rate hikes. |
| • | Sticky inflation, dramatic rate hikes, and fears of a recession weighed heavily on sentiment in the stock market. Energy was one of the few sectors that posted positive returns for the 12-month period. |
| • | The fund’s stock selection in integrated oil and gas companies lagged those in the benchmark. That and the fund’s underweight to that sector were the largest detractors to relative performance. However, this was more than offset by stock selection in other sectors—notably in oil and gas refining and marketing, and electric utilities—that boosted absolute and relative results. The fund’s overweight to oil and gas exploration and production also helped relative performance. |
| Average Annual Total Returns Periods Ended January 31, 2023 | |||
| One Year | Three Years | Five Years | |
| Stocks | |||
| Russell 1000 Index (Large-caps) | -8.55% | 9.66% | 9.38% |
| Russell 2000 Index (Small-caps) | -3.38 | 7.51 | 5.54 |
| Russell 3000 Index (Broad U.S. market) | -8.24 | 9.51 | 9.12 |
| FTSE All-World ex US Index (International) | -5.39 | 4.15 | 1.73 |
| Bonds | |||
| Bloomberg U.S. Aggregate Float Adjusted Index (Broad taxable market) | -8.40% | -2.34% | 0.89% |
| Bloomberg Municipal Bond Index (Broad tax-exempt market) | -3.25 | -0.42 | 2.07 |
| FTSE Three-Month U.S. Treasury Bill Index | 1.87 | 0.78 | 1.29 |
| CPI | |||
| Consumer Price Index | 6.41% | 5.06% | 3.83% |
| • | Based on actual fund return. This section helps you to estimate the actual expenses that you paid over the period. The ”Ending Account Value“ shown is derived from the fund‘s actual return, and the third column shows the dollar amount that would have been paid by an investor who started with $1,000 in the fund. You may use the information here, together with the amount you invested, to estimate the expenses that you paid over the period. |
| • | Based on hypothetical 5% yearly return. This section is intended to help you compare your fund‘s costs with those of other mutual funds. It assumes that the fund had a yearly return of 5% before expenses, but that the expense ratio is unchanged. In this case—because the return used is not the fund’s actual return—the results do not apply to your investment. The example is useful in making comparisons because the Securities and Exchange Commission requires all mutual funds to calculate expenses based on a 5% return. You can assess your fund’s costs by comparing this hypothetical example with the hypothetical examples that appear in shareholder reports of other funds. |
| Six Months Ended January 31, 2023 | |||
| Beginning Account Value 7/31/2022 | Ending Account Value 1/31/2023 | Expenses Paid During Period | |
| Based on Actual Fund Return | |||
| Energy Fund | |||
| Investor Shares | $1,000.00 | $1,089.20 | $2.53 |
| Admiral™ Shares | 1,000.00 | 1,089.60 | 2.11 |
| Based on Hypothetical 5% Yearly Return | |||
| Energy Fund | |||
| Investor Shares | $1,000.00 | $1,022.79 | $2.45 |
| Admiral Shares | 1,000.00 | 1,023.19 | 2.04 |
| Average Annual Total Returns Periods Ended January 31, 2023 | |||||
| One Year | Five Years | Ten Years | Final Value of a $10,000 Investment | ||
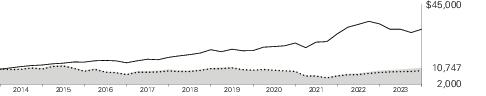
 | Energy Fund Investor Shares | 16.72% | 0.13% | 0.72% | $10,747 |
 | Spliced Energy Index | 11.88 | -2.23 | -0.84 | 9,194 |
 | Dow Jones U.S. Total Stock Market Float Adjusted Index | -8.42 | 8.99 | 12.19 | 31,581 |
| One Year | Five Years | Ten Years | Final Value of a $50,000 Investment | ||
| Energy Fund Admiral Shares | 16.83% | 0.21% | 0.80% | $54,137 | |
| Spliced Energy Index | 11.88 | -2.23 | -0.84 | 45,972 | |
| Dow Jones U.S. Total Stock Market Float Adjusted Index | -8.42 | 8.99 | 12.19 | 157,905 | |
| United States | 53.4% |
| United Kingdom | 17.9 |
| France | 9.9 |
| Canada | 6.5 |
| Italy | 3.3 |
| Spain | 2.4 |
| Norway | 2.0 |
| India | 1.6 |
| Germany | 1.3 |
| Brazil | 1.0 |
| Other | 0.7 |
| Shares | Market Value• ($000) | ||
| Common Stocks (99.1%) | |||
| Brazil (1.0%) | |||
| Petroleo Brasileiro SA | 10,733,525 | 62,291 | |
| Canada (6.4%) | |||
| Cenovus Energy Inc. | 9,517,662 | 190,163 | |
| 1 | Enbridge Inc. | 3,586,487 | 146,851 |
| ARC Resources Ltd. | 1,735,762 | 20,168 | |
| TC Energy Corp. | 426,524 | 18,378 | |
| TC Energy Corp. (XTSE) | 398,407 | 17,187 | |
| 392,747 | |||
| China (0.7%) | |||
| China Yangtze Power Co. Ltd. Class A | 13,244,460 | 40,793 | |
| France (9.8%) | |||
| TotalEnergies SE | 4,006,239 | 247,669 | |
| Engie SA (XPAR) | 12,909,716 | 183,316 | |
| TotalEnergies SE ADR | 2,761,952 | 171,352 | |
| 602,337 | |||
| Germany (1.3%) | |||
| RWE AG | 1,840,525 | 81,938 | |
| India (1.6%) | |||
| Power Grid Corp. of India Ltd. | 37,222,540 | 98,779 | |
| Italy (3.3%) | |||
| Tenaris SA | 6,229,860 | 110,398 | |
| Enel SpA | 15,780,455 | 92,917 | |
| 203,315 | |||
| Norway (2.0%) | |||
| Equinor ASA | 3,973,475 | 121,098 | |
| Russia (0.0%) | |||
| *,2 | LUKOIL PJSC ADR | 1,423,477 | — |
| Spain (2.4%) | |||
| Iberdrola SA (XMAD) | 12,033,572 | 141,175 | |
| Iberdrola SA | 201,835 | 2,358 | |
| 143,533 | |||
| United Kingdom (17.7%) | |||
| Shell plc (XLON) | 11,675,963 | 342,780 | |
| BP plc | 45,226,687 | 273,181 | |
| Shell plc ADR | 3,863,908 | 227,237 | |
| BP plc ADR | 3,529,398 | 127,870 | |
| National Grid plc | 8,844,572 | 112,440 | |
| 1,083,508 | |||
| Shares | Market Value• ($000) | ||
| United States (52.9%) | |||
| Marathon Petroleum Corp. | 3,629,400 | 466,450 | |
| ConocoPhillips | 3,719,886 | 453,343 | |
| Duke Energy Corp. | 1,751,647 | 179,456 | |
| Diamondback Energy Inc. | 1,114,821 | 162,898 | |
| NextEra Energy Inc. | 2,167,740 | 161,778 | |
| Exelon Corp. | 3,768,354 | 158,987 | |
| EOG Resources Inc. | 1,167,829 | 154,445 | |
| Coterra Energy Inc. | 6,120,212 | 153,189 | |
| Southern Co. | 2,087,721 | 141,297 | |
| FirstEnergy Corp. | 3,334,765 | 136,559 | |
| Chesapeake Energy Corp. | 1,507,060 | 130,692 | |
| Sempra Energy (XNYS) | 799,397 | 128,167 | |
| American Electric Power Co. Inc. | 1,313,994 | 123,463 | |
| Edison International | 1,746,546 | 120,337 | |
| Williams Cos. Inc. | 3,153,024 | 101,654 | |
| Schlumberger NV | 1,519,225 | 86,565 | |
| Constellation Energy Corp. | 897,726 | 76,630 | |
| CenterPoint Energy Inc. | 2,528,118 | 76,147 | |
| Targa Resources Corp. | 983,114 | 73,753 | |
| * | First Solar Inc. | 354,172 | 62,901 |
| Avangrid Inc. | 1,106,747 | 46,672 | |
| Pioneer Natural Resources Co. | 188,653 | 43,456 | |
| 3,238,839 | |||
| Total Common Stocks (Cost $4,404,902) | 6,069,178 | ||
| Temporary Cash Investments (2.8%) | |||
| Money Market Fund (1.8%) | |||
| 3,4 | Vanguard Market Liquidity Fund 4.437% | 1,097,977 | 109,787 |
| Face Amount ($000) | Market Value• ($000) | ||
| Repurchase Agreement (1.0%) | |||
| NatWest Markets plc, 4.260%, 2/1/23 (Dated 1/31/23, Repurchase Value $62,907,000, collateralized by U.S. Treasury Note/Bond 2.375%, 4/30/26, with a value of $64,158,000) | 62,900 | 62,900 | |
| Total Temporary Cash Investments (Cost $172,686) | 172,687 | ||
| Total Investments (101.9%) (Cost $4,577,588) | 6,241,865 | ||
| Other Assets and Liabilities—Net (-1.9%) | (115,896) | ||
| Net Assets (100%) | 6,125,969 | ||
| Cost is in $000. | |||
| • | See Note A in Notes to Financial Statements. |
| * | Non-income-producing security. |
| 1 | Includes partial security positions on loan to broker-dealers. The total value of securities on loan is $104,411,000. |
| 2 | Security value determined using significant unobservable inputs. |
| 3 | Affiliated money market fund available only to Vanguard funds and certain trusts and accounts managed by Vanguard. Rate shown is the 7-day yield. |
| 4 | Collateral of $109,650,000 was received for securities on loan. |
| ADR—American Depositary Receipt. |
| ($000s, except shares, footnotes, and per-share amounts) | Amount |
| Assets | |
| Investments in Securities, at Value1 | |
| Unaffiliated Issuers (Cost $4,467,802) | 6,132,078 |
| Affiliated Issuers (Cost $109,786) | 109,787 |
| Total Investments in Securities | 6,241,865 |
| Investment in Vanguard | 228 |
| Foreign Currency, at Value (Cost $180) | 179 |
| Receivables for Investment Securities Sold | 18,377 |
| Receivables for Accrued Income | 6,644 |
| Receivables for Capital Shares Issued | 2,325 |
| Total Assets | 6,269,618 |
| Liabilities | |
| Due to Custodian | 1,622 |
| Payables for Investment Securities Purchased | 18,388 |
| Collateral for Securities on Loan | 109,650 |
| Payables to Investment Advisor | 4,127 |
| Payables for Capital Shares Redeemed | 5,138 |
| Payables to Vanguard | 825 |
| Deferred Foreign Capital Gains Taxes | 3,899 |
| Total Liabilities | 143,649 |
| Net Assets | 6,125,969 |
| 1 Includes $104,411,000 of securities on loan. | |
| At January 31, 2023, net assets consisted of: | |
| Paid-in Capital | 4,882,222 |
| Total Distributable Earnings (Loss) | 1,243,747 |
| Net Assets | 6,125,969 |
| Investor Shares—Net Assets | |
| Applicable to 41,994,923 outstanding $.001 par value shares of beneficial interest (unlimited authorization) | 1,949,974 |
| Net Asset Value Per Share—Investor Shares | $46.43 |
| Admiral Shares—Net Assets | |
| Applicable to 47,934,110 outstanding $.001 par value shares of beneficial interest (unlimited authorization) | 4,175,995 |
| Net Asset Value Per Share—Admiral Shares | $87.12 |
| Year Ended January 31, 2023 | |
| ($000) | |
| Investment Income | |
| Income | |
| Dividends1 | 300,110 |
| Interest2 | 1,220 |
| Securities Lending—Net | 158 |
| Total Income | 301,488 |
| Expenses | |
| Investment Advisory Fees—Note B | |
| Basic Fee | 8,871 |
| Performance Adjustment | 3,520 |
| The Vanguard Group—Note C | |
| Management and Administrative—Investor Shares | 4,280 |
| Management and Administrative—Admiral Shares | 6,026 |
| Marketing and Distribution—Investor Shares | 111 |
| Marketing and Distribution—Admiral Shares | 158 |
| Custodian Fees | 98 |
| Auditing Fees | 31 |
| Shareholders’ Reports—Investor Shares | 84 |
| Shareholders’ Reports—Admiral Shares | 41 |
| Trustees’ Fees and Expenses | 2 |
| Other Expenses | 348 |
| Total Expenses | 23,570 |
| Expenses Paid Indirectly | (9) |
| Net Expenses | 23,561 |
| Net Investment Income | 277,927 |
| Realized Net Gain (Loss) | |
| Investment Securities Sold2,3 | 264,307 |
| Foreign Currencies | (2,045) |
| Realized Net Gain (Loss) | 262,262 |
| Change in Unrealized Appreciation (Depreciation) | |
| Investment Securities2,4 | 339,360 |
| Foreign Currencies | 279 |
| Change in Unrealized Appreciation (Depreciation) | 339,639 |
| Net Increase (Decrease) in Net Assets Resulting from Operations | 879,828 |
| 1 | Dividends are net of foreign withholding taxes of $12,111,000. |
| 2 | Interest income, realized net gain (loss), and change in unrealized appreciation (depreciation) from an affiliated company of the fund were $0, $50,000, and $1,000, respectively. Purchases and sales are for temporary cash investment purposes. |
| 3 | Realized gain (loss) is net of foreign capital gain taxes of $38,000. |
| 4 | The change in unrealized appreciation (depreciation) is net of the change in deferred foreign capital gains taxes of ($321,000). |
| Year Ended January 31, | ||
| 2023 ($000) | 2022 ($000) | |
| Increase (Decrease) in Net Assets | ||
| Operations | ||
| Net Investment Income | 277,927 | 177,015 |
| Realized Net Gain (Loss) | 262,262 | 116,270 |
| Change in Unrealized Appreciation (Depreciation) | 339,639 | 1,155,587 |
| Net Increase (Decrease) in Net Assets Resulting from Operations | 879,828 | 1,448,872 |
| Distributions | ||
| Investor Shares | (85,883) | (57,404) |
| Admiral Shares | (187,798) | (119,222) |
| Total Distributions | (273,681) | (176,626) |
| Capital Share Transactions | ||
| Investor Shares | (18,400) | (14,569) |
| Admiral Shares | 159,170 | 7,935 |
| Net Increase (Decrease) from Capital Share Transactions | 140,770 | (6,634) |
| Total Increase (Decrease) | 746,917 | 1,265,612 |
| Net Assets | ||
| Beginning of Period | 5,379,052 | 4,113,440 |
| End of Period | 6,125,969 | 5,379,052 |
| Investor Shares | |||||
| For a Share Outstanding Throughout Each Period | Year Ended January 31, | ||||
| 2023 | 2022 | 2021 | 2020 | 2019 | |
| Net Asset Value, Beginning of Period | $41.64 | $31.66 | $43.28 | $47.85 | $55.62 |
| Investment Operations | |||||
| Net Investment Income1 | 2.099 | 1.364 | 1.449 | 1.519 | 1.300 |
| Net Realized and Unrealized Gain (Loss) on Investments | 4.807 | 10.019 | (11.669) | (4.524) | (7.788) |
| Total from Investment Operations | 6.906 | 11.383 | (10.220) | (3.005) | (6.488) |
| Distributions | |||||
| Dividends from Net Investment Income | (2.116) | (1.403) | (1.400) | (1.565) | (1.282) |
| Distributions from Realized Capital Gains | — | — | — | — | — |
| Total Distributions | (2.116) | (1.403) | (1.400) | (1.565) | (1.282) |
| Net Asset Value, End of Period | $46.43 | $41.64 | $31.66 | $43.28 | $47.85 |
| Total Return2 | 16.72% | 36.33% | -23.55% | -6.55% | -11.48% |
| Ratios/Supplemental Data | |||||
| Net Assets, End of Period (Millions) | $1,950 | $1,771 | $1,363 | $1,793 | $2,265 |
| Ratio of Total Expenses to Average Net Assets3 | 0.46%4 | 0.41% | 0.37% | 0.32% | 0.37% |
| Ratio of Net Investment Income to Average Net Assets | 4.70% | 3.68% | 4.49% | 3.20% | 2.42% |
| Portfolio Turnover Rate | 16% | 14% | 55% | 48% | 31% |
| 1 | Calculated based on average shares outstanding. |
| 2 | Total returns do not include account service fees that may have applied in the periods shown. Fund prospectuses provide information about any applicable account service fees. |
| 3 | Includes performance-based investment advisory fee increases (decreases) of 0.06%, 0.02%, (0.02%), (0.06%), and (0.01%). |
| 4 | The ratio of expenses to average net assets for the period net of reduction from broker commission abatement arrangements was 0.46%. |
| Admiral Shares | |||||
| For a Share Outstanding Throughout Each Period | Year Ended January 31, | ||||
| 2023 | 2022 | 2021 | 2020 | 2019 | |
| Net Asset Value, Beginning of Period | $78.12 | $59.39 | $81.18 | $89.77 | $104.35 |
| Investment Operations | |||||
| Net Investment Income1 | 4.014 | 2.615 | 2.787 | 2.926 | 2.511 |
| Net Realized and Unrealized Gain (Loss) on Investments | 9.026 | 18.794 | (21.903) | (8.512) | (14.600) |
| Total from Investment Operations | 13.040 | 21.409 | (19.116) | (5.586) | (12.089) |
| Distributions | |||||
| Dividends from Net Investment Income | (4.040) | (2.679) | (2.674) | (3.004) | (2.491) |
| Distributions from Realized Capital Gains | — | — | — | — | — |
| Total Distributions | (4.040) | (2.679) | (2.674) | (3.004) | (2.491) |
| Net Asset Value, End of Period | $87.12 | $78.12 | $59.39 | $81.18 | $89.77 |
| Total Return2 | 16.83% | 36.43% | -23.47% | -6.50% | -11.40% |
| Ratios/Supplemental Data | |||||
| Net Assets, End of Period (Millions) | $4,176 | $3,608 | $2,751 | $4,388 | $5,606 |
| Ratio of Total Expenses to Average Net Assets3 | 0.38%4 | 0.33% | 0.29% | 0.24% | 0.29% |
| Ratio of Net Investment Income to Average Net Assets | 4.78% | 3.76% | 4.60% | 3.28% | 2.50% |
| Portfolio Turnover Rate | 16% | 14% | 55% | 48% | 31% |
| 1 | Calculated based on average shares outstanding. |
| 2 | Total returns do not include account service fees that may have applied in the periods shown. Fund prospectuses provide information about any applicable account service fees. |
| 3 | Includes performance-based investment advisory fee increases (decreases) of 0.06%, 0.02%, (0.02%), (0.06%), and (0.01%). |
| 4 | The ratio of expenses to average net assets for the period net of reduction from broker commission abatement arrangements was 0.38%. |
| A. | The following significant accounting policies conform to generally accepted accounting principles for U.S. investment companies. The fund consistently follows such policies in preparing its financial statements. |
| B. | Wellington Management Company llp provides investment advisory services to the fund for a fee calculated at an annual percentage rate of average net assets. The basic fee is subject to quarterly adjustments based on the fund's performance relative to the MSCI ACWI Energy Index for periods prior to October 21, 2020, and to the current benchmark MSCI ACWI Energy + Utilities Index, beginning October 21, 2020, for the preceding three years. The benchmark change will be fully phased in by October 2023. For the year ended January 31, 2023, the investment advisory fee paid represented an effective annual basic rate of 0.15% of the fund’s average net assets, before a net increase of $3,520,000 (0.06%) based on performance. |
| C. | In accordance with the terms of a Funds' Service Agreement (the “FSA”) between Vanguard and the fund, Vanguard furnishes to the fund corporate management, administrative, marketing, and distribution services at Vanguard’s cost of operations (as defined by the FSA). These costs of operations are allocated to the fund based on methods and guidelines approved by the board of trustees and are generally settled twice a month. |
| D. | The fund has asked its investment advisor to direct certain security trades, subject to obtaining the best price and execution, to brokers who have agreed to rebate to the fund part of the commissions generated. Such rebates are used solely to reduce the fund’s management and administrative expenses. For the year ended January 31, 2023, these arrangements reduced the fund’s expenses by $9,000 (an annual rate of less than 0.01% of average net assets). |
| E. | Various inputs may be used to determine the value of the fund’s investments. These inputs are summarized in three broad levels for financial statement purposes. The inputs or methodologies used to value securities are not necessarily an indication of the risk associated with investing in those securities. |
| Level 1 ($000) | Level 2 ($000) | Level 3 ($000) | Total ($000) | |
| Investments | ||||
| Assets | ||||
| Common Stocks—North and South America | 3,693,877 | — | — | 3,693,877 |
| Common Stocks—Other | 526,459 | 1,848,842 | — | 2,375,301 |
| Temporary Cash Investments | 109,787 | 62,900 | — | 172,687 |
| Total | 4,330,123 | 1,911,742 | — | 6,241,865 |
| F. | Permanent differences between book-basis and tax-basis components of net assets are reclassified among capital accounts in the financial statements to reflect their tax character. These reclassifications have no effect on net assets or net asset value per share. As of period end, permanent differences primarily attributable to the accounting for applicable foreign currency transactions and tax expense on capital gains were reclassified between the individual components of total distributable earnings (loss). |
| Amount ($000) | |
| Undistributed Ordinary Income | 11,515 |
| Undistributed Long-Term Gains | — |
| Capital Loss Carryforwards | (426,695) |
| Qualified Late-Year Losses | — |
| Net Unrealized Gains (Losses) | 1,658,927 |
| Year Ended January 31, | ||
| 2023 Amount ($000) | 2022 Amount ($000) | |
| Ordinary Income* | 273,681 | 176,626 |
| Long-Term Capital Gains | — | — |
| Total | 273,681 | 176,626 |
| * | Includes short-term capital gains, if any. |
| Amount ($000) | |
| Tax Cost | 4,579,311 |
| Gross Unrealized Appreciation | 1,800,978 |
| Gross Unrealized Depreciation | (138,423) |
| Net Unrealized Appreciation (Depreciation) | 1,662,555 |
| G. | During the year ended January 31, 2023, the fund purchased $1,112,425,000 of investment securities and sold $947,361,000 of investment securities, other than temporary cash investments. |
| H. | Capital share transactions for each class of shares were: |
| Year Ended January 31, | |||||
| 2023 | 2022 | ||||
| Amount ($000) | Shares (000) | Amount ($000) | Shares (000) | ||
| Investor Shares | |||||
| Issued | 545,067 | 12,243 | 433,225 | 11,662 | |
| Issued in Lieu of Cash Distributions | 79,747 | 1,759 | 53,100 | 1,381 | |
| Redeemed | (643,214) | (14,541) | (500,894) | (13,551) | |
| Net Increase (Decrease)—Investor Shares | (18,400) | (539) | (14,569) | (508) | |
| Admiral Shares | |||||
| Issued | 1,135,398 | 13,603 | 851,809 | 12,163 | |
| Issued in Lieu of Cash Distributions | 166,639 | 1,960 | 105,042 | 1,455 | |
| Redeemed | (1,142,867) | (13,815) | (948,916) | (13,745) | |
| Net Increase (Decrease)—Admiral Shares | 159,170 | 1,748 | 7,935 | (127) | |
| I. | Management has determined that no events or transactions occurred subsequent to January 31, 2023, that would require recognition or disclosure in these financial statements. |
Philadelphia, Pennsylvania
March 23, 2023
| Matthew Benchener | Thomas M. Rampulla |
| Joseph Brennan | Karin A. Risi |
| Mortimer J. Buckley | Anne E. Robinson |
| Gregory Davis | Michael Rollings |
| John James | Nitin Tandon |
| Chris D. Mclsaac | Lauren Valente |

All rights reserved.
Vanguard Marketing Corporation, Distributor.

| 1 | |
| 2 | |
| 6 | |
| 8 | |
| 10 |
| • | Vanguard Global Capital Cycles Fund returned 13.81% for the 12 months ended January 31, 2023, more than 17 percentage points higher than its performance benchmark, the S&P Global BMI Metals & Mining 25% Weighted Index. |
| • | Despite some relief in midsummer and toward the end of the period, it was a volatile, challenging time for financial markets. Early on, inflation across much of the world continued climbing to multidecade highs amid supply-chain bottlenecks, rising energy and food prices, and broader price increases in goods and services. Central banks responded by aggressively tightening monetary policy. Later, it appeared that inflation might have peaked, and central banks began slowing their pace of interest rate hikes. |
| • | In this environment, the majority of the sectors the fund invests in had positive returns. Strong stock selection in materials and financials, the two largest sectors, contributed most to the fund’s outperformance. Real estate was the biggest net detractor. |
| • | By market, U.S. and U.K. stocks contributed the most to performance, while an underweight allocation to Australia proved a net detractor. |
| • | Over the decade ended January 31, 2023, the fund’s average annual return of –0.49% lagged the 0.15% return of its spliced benchmark index. |
| Average Annual Total Returns Periods Ended January 31, 2023 | |||
| One Year | Three Years | Five Years | |
| Stocks | |||
| Russell 1000 Index (Large-caps) | -8.55% | 9.66% | 9.38% |
| Russell 2000 Index (Small-caps) | -3.38 | 7.51 | 5.54 |
| Russell 3000 Index (Broad U.S. market) | -8.24 | 9.51 | 9.12 |
| FTSE All-World ex US Index (International) | -5.39 | 4.15 | 1.73 |
| Bonds | |||
| Bloomberg U.S. Aggregate Float Adjusted Index (Broad taxable market) | -8.40% | -2.34% | 0.89% |
| Bloomberg Municipal Bond Index (Broad tax-exempt market) | -3.25 | -0.42 | 2.07 |
| FTSE Three-Month U.S. Treasury Bill Index | 1.87 | 0.78 | 1.29 |
| CPI | |||
| Consumer Price Index | 6.41% | 5.06% | 3.83% |
and Equity Portfolio Manager
| • | Based on actual fund return. This section helps you to estimate the actual expenses that you paid over the period. The ”Ending Account Value“ shown is derived from the fund’s actual return, and the third column shows the dollar amount that would have been paid by an investor who started with $1,000 in the fund. You may use the information here, together with the amount you invested, to estimate the expenses that you paid over the period. |
| • | Based on hypothetical 5% yearly return. This section is intended to help you compare your fund‘s costs with those of other mutual funds. It assumes that the fund had a yearly return of 5% before expenses, but that the expense ratio is unchanged. In this case—because the return used is not the fund’s actual return—the results do not apply to your investment. The example is useful in making comparisons because the Securities and Exchange Commission requires all mutual funds to calculate expenses based on a 5% return. You can assess your fund’s costs by comparing this hypothetical example with the hypothetical examples that appear in shareholder reports of other funds. |
| Six Months Ended January 31, 2023 | |||
| Global Capital Cycles Fund | Beginning Account Value 7/31/2022 | Ending Account Value 1/31/2023 | Expenses Paid During Period |
| Based on Actual Fund Return | $1,000.00 | $1,178.30 | $2.42 |
| Based on Hypothetical 5% Yearly Return | 1,000.00 | 1,022.99 | 2.24 |
| Average Annual Total Returns Periods Ended January 31, 2023 | |||||
| One Year | Five Years | Ten Years | Final Value of a $10,000 Investment | ||
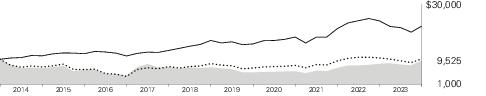
 | Global Capital Cycles Fund | 13.81% | 6.08% | -0.49% | $9,525 |
 | Spliced Global Capital Cycles Index | -3.30 | 3.75 | 0.15 | 10,151 |
 | MSCI All Country World Index | -7.99 | 5.53 | 8.24 | 22,073 |
| United States | 27.8% |
| United Kingdom | 26.4 |
| Canada | 16.4 |
| China | 5.3 |
| Australia | 3.8 |
| Japan | 3.6 |
| Germany | 3.4 |
| Switzerland | 2.4 |
| Italy | 2.4 |
| Sweden | 1.6 |
| Brazil | 1.5 |
| Austria | 1.5 |
| France | 1.4 |
| South Korea | 1.0 |
| Other | 1.5 |
| Shares | Market Value• ($000) | |||||
| Common Stocks (92.0%) | ||||||
| Australia (3.4%) | ||||||
| 1 | BHP Group Ltd. ADR | 409,441 | 28,722 | |||
| BHP Group Ltd. (XASX) | 677,588 | 23,731 | ||||
| 52,453 | ||||||
| Austria (1.4%) | ||||||
| 2 | BAWAG Group AG | 336,663 | 20,855 | |||
| Brazil (1.4%) | ||||||
| Vale SA Class B ADR | 1,154,895 | 21,573 | ||||
| Canada (15.1%) | ||||||
| Barrick Gold Corp. | 8,017,404 | 156,740 | ||||
| Intact Financial Corp. | 270,193 | 39,198 | ||||
| Endeavour Mining plc | 720,255 | 16,970 | ||||
| Agnico Eagle Mines Ltd. | 286,965 | 16,208 | ||||
| * | Foran Mining Corp. | 314,757 | 793 | |||
| 229,909 | ||||||
| China (4.9%) | ||||||
| * | Alibaba Group Holding Ltd. | 1,762,644 | 24,234 | |||
| Ping An Insurance Group Co. of China Ltd. Class H | 2,920,174 | 22,683 | ||||
| Contemporary Amperex Technology Co. Ltd. Class A | 189,139 | 13,120 | ||||
| * | Baidu Inc. Class A | 633,893 | 10,656 | |||
| * | XPeng Inc. Class A | 592,432 | 3,118 | |||
| 73,811 | ||||||
| France (1.3%) | ||||||
| STMicroelectronics NV | 355,632 | 16,746 | ||||
| Rubis SCA | 103,412 | 2,894 | ||||
| 19,640 | ||||||
| Germany (3.1%) | ||||||
| Bayer AG (Registered) | 545,555 | 33,958 | ||||
| * | Hypoport SE | 98,728 | 13,450 | |||
| 47,408 | ||||||
| Greece (0.6%) | ||||||
| * | Public Power Corp. SA | 1,080,483 | 8,608 | |||
| Shares | Market Value• ($000) | |||||
| Hong Kong (0.8%) | ||||||
| AIA Group Ltd. | 1,092,248 | 12,351 | ||||
| Italy (2.2%) | ||||||
| UniCredit SpA | 1,729,248 | 33,774 | ||||
| Japan (3.3%) | ||||||
| Panasonic Holdings Corp. | 2,446,600 | 22,688 | ||||
| Mitsubishi UFJ Financial Group Inc. | 2,247,800 | 16,465 | ||||
| T&D Holdings Inc. | 711,540 | 11,389 | ||||
| 50,542 | ||||||
| South Korea (0.9%) | ||||||
| * | Coupang Inc. Class A | 793,662 | 13,405 | |||
| Sweden (1.5%) | ||||||
| SKF AB Class B | 1,252,691 | 22,171 | ||||
| Switzerland (2.2%) | ||||||
| Novartis AG (Registered) | 373,666 | 33,783 | ||||
| United Kingdom (24.3%) | ||||||
| Glencore plc | 10,251,133 | 68,651 | ||||
| Anglo American plc | 1,303,992 | 56,242 | ||||
| 1 | Rio Tinto plc ADR | 567,573 | 45,037 | |||
| Unilever plc | 811,595 | 41,310 | ||||
| * | Nomad Foods Ltd. | 2,169,446 | 38,594 | |||
| Standard Chartered plc | 2,917,552 | 24,506 | ||||
| * | Haleon plc | 6,026,994 | 24,153 | |||
| Centamin plc | 14,554,379 | 19,952 | ||||
| * | Babcock International Group plc | 4,009,566 | 15,148 | |||
| * | John Wood Group plc | 7,774,205 | 13,629 | |||
| Serco Group plc | 6,226,714 | 11,215 | ||||
| Fresnillo plc | 1,020,765 | 10,369 | ||||
| 368,806 | ||||||
| United States (25.6%) | ||||||
| American Electric Power Co. Inc. | 1,074,552 | 100,965 | ||||
| BWX Technologies Inc. | 1,201,722 | 73,137 | ||||
| * | Enstar Group Ltd. | 175,285 | 42,472 | |||
| Viper Energy Partners LP | 1,212,762 | 38,505 | ||||
| Schlumberger Ltd. | 523,533 | 29,831 | ||||
| Merck & Co. Inc. | 267,474 | 28,729 | ||||
| Shares | Market Value• ($000) | |||||
| Intel Corp. | 920,517 | 26,014 | ||||
| Exelon Corp. | 331,845 | 14,000 | ||||
| * | Diamond Offshore Drilling Inc. | 1,165,041 | 13,351 | |||
| * | Fluor Corp. | 318,722 | 11,713 | |||
| Mosaic Co. | 205,876 | 10,199 | ||||
| * | Metals Acquisition Corp. Warrants Exp. 7/12/26 | 330,300 | 233 | |||
| 389,149 | ||||||
| Total Common Stocks (Cost $1,157,924) | 1,398,238 | |||||
| Temporary Cash Investments (8.5%) | ||||||
| Money Market Fund (8.5%) | ||||||
| 3,4 | Vanguard Market Liquidity Fund, 4.437% (Cost $128,747) | 1,287,611 | 128,748 | |||
| Total Investments (100.5%) (Cost $1,286,671) | 1,526,986 | |||||
| Other Assets and Liabilities—Net (-0.5%) | (6,973) | |||||
| Net Assets (100%) | 1,520,013 | |||||
| Cost is in $000. |
| • | See Note A in Notes to Financial Statements. |
| * | Non-income-producing security. |
| 1 | Includes partial security positions on loan to broker-dealers. The total value of securities on loan is $24,485,000. |
| 2 | Security exempt from registration under Rule 144A of the Securities Act of 1933. Such securities may be sold in transactions exempt from registration, normally to qualified institutional buyers. At January 31, 2023, the aggregate value was $20,855,000, representing 1.4% of net assets. |
| 3 | Affiliated money market fund available only to Vanguard funds and certain trusts and accounts managed by Vanguard. Rate shown is the 7-day yield. |
| 4 | Collateral of $25,126,000 was received for securities on loan. |
| ADR—American Depositary Receipt. |
| ($000s, except shares, footnotes, and per-share amounts) | Amount |
| Assets | |
| Investments in Securities, at Value1 | |
| Unaffiliated Issuers (Cost $1,157,924) | 1,398,238 |
| Affiliated Issuers (Cost $128,747) | 128,748 |
| Total Investments in Securities | 1,526,986 |
| Investment in Vanguard | 53 |
| Foreign Currency, at Value (Cost $202) | 201 |
| Receivables for Investment Securities Sold | 27,958 |
| Receivables for Accrued Income | 1,748 |
| Receivables for Capital Shares Issued | 854 |
| Total Assets | 1,557,800 |
| Liabilities | |
| Due to Custodian | 3,464 |
| Payables for Investment Securities Purchased | 7,631 |
| Collateral for Securities on Loan | 25,126 |
| Payables for Capital Shares Redeemed | 634 |
| Payables to Investment Advisor | 694 |
| Payables to Vanguard | 238 |
| Total Liabilities | 37,787 |
| Net Assets | 1,520,013 |
| 1 Includes $24,485,000 of securities on loan. | |
| At January 31, 2023, net assets consisted of: | |
| Paid-in Capital | 3,363,644 |
| Total Distributable Earnings (Loss) | (1,843,631) |
| Net Assets | 1,520,013 |
| Net Assets | |
| Applicable to 122,273,792 outstanding $.001 par value shares of beneficial interest (unlimited authorization) | 1,520,013 |
| Net Asset Value Per Share | $12.43 |
| Year Ended January 31, 2023 | |
| ($000) | |
| Investment Income | |
| Income | |
| Dividends1 | 48,459 |
| Non-Cash Dividends | 5,209 |
| Interest2 | 722 |
| Securities Lending—Net | 135 |
| Total Income | 54,525 |
| Expenses | |
| Investment Advisory Fees—Note B | |
| Basic Fee | 2,037 |
| Performance Adjustment | 664 |
| The Vanguard Group—Note C | |
| Management and Administrative | 3,024 |
| Marketing and Distribution | 72 |
| Custodian Fees | 34 |
| Auditing Fees | 27 |
| Shareholders’ Reports | 58 |
| Trustees’ Fees and Expenses | — |
| Other Expenses | 101 |
| Total Expenses | 6,017 |
| Expenses Paid Indirectly | (1) |
| Net Expenses | 6,016 |
| Net Investment Income | 48,509 |
| Realized Net Gain (Loss) | |
| Investment Securities Sold2,3 | 104,928 |
| Foreign Currencies | (952) |
| Realized Net Gain (Loss) | 103,976 |
| Change in Unrealized Appreciation (Depreciation) | |
| Investment Securities2,4 | 17,807 |
| Foreign Currencies | 21 |
| Change in Unrealized Appreciation (Depreciation) | 17,828 |
| Net Increase (Decrease) in Net Assets Resulting from Operations | 170,313 |
| 1 | Dividends are net of foreign withholding taxes of $2,027,000. |
| 2 | Interest income, realized net gain (loss), capital gain distributions received, and change in unrealized appreciation (depreciation) from an affiliated company of the fund were $722,000, $53,000, less than $1,000, and (less than $1,000), respectively. Purchases and sales are for temporary cash investment purposes. |
| 3 | Realized Gain (Loss) is net of foreign capital gains taxes of $3,277,000. |
| 4 | The change in unrealized appreciation (depreciation) is net of the change in deferred foreign capital gains taxes of ($3,105,000). |
| Year Ended January 31, | ||
| 2023 ($000) | 2022 ($000) | |
| Increase (Decrease) in Net Assets | ||
| Operations | ||
| Net Investment Income | 48,509 | 43,390 |
| Realized Net Gain (Loss) | 103,976 | 166,516 |
| Change in Unrealized Appreciation (Depreciation) | 17,828 | 41,453 |
| Net Increase (Decrease) in Net Assets Resulting from Operations | 170,313 | 251,359 |
| Distributions | ||
| Total Distributions | (44,720) | (42,400) |
| Capital Share Transactions | ||
| Issued | 320,924 | 228,666 |
| Issued in Lieu of Cash Distributions | 38,683 | 36,640 |
| Redeemed | (324,685) | (296,930) |
| Net Increase (Decrease) from Capital Share Transactions | 34,922 | (31,624) |
| Total Increase (Decrease) | 160,515 | 177,335 |
| Net Assets | ||
| Beginning of Period | 1,359,498 | 1,182,163 |
| End of Period | 1,520,013 | 1,359,498 |
| For a Share Outstanding Throughout Each Period | Year Ended January 31, | ||||
| 2023 | 2022 | 2021 | 2020 | 2019 | |
| Net Asset Value, Beginning of Period | $11.28 | $9.57 | $7.97 | $7.62 | $10.57 |
| Investment Operations | |||||
| Net Investment Income1 | .392 | .356 | .197 | .212 | .122 |
| Net Realized and Unrealized Gain (Loss) on Investments | 1.134 | 1.715 | 1.597 | .337 | (2.858) |
| Total from Investment Operations | 1.526 | 2.071 | 1.794 | .549 | (2.736) |
| Distributions | |||||
| Dividends from Net Investment Income | (.376) | (.361) | (.194) | (.199) | (.214) |
| Distributions from Realized Capital Gains | — | — | — | — | — |
| Total Distributions | (.376) | (.361) | (.194) | (.199) | (.214) |
| Net Asset Value, End of Period | $12.43 | $11.28 | $9.57 | $7.97 | $7.62 |
| Total Return2 | 13.81% | 21.74% | 22.63% | 7.11% | -26.17% |
| Ratios/Supplemental Data | |||||
| Net Assets, End of Period (Millions) | $1,520 | $1,359 | $1,182 | $1,212 | $1,399 |
| Ratio of Total Expenses to Average Net Assets3 | 0.43%4 | 0.36% | 0.35% | 0.38% | 0.33% |
| Ratio of Net Investment Income to Average Net Assets | 3.45% | 3.28% | 2.43% | 2.68% | 1.38% |
| Portfolio Turnover Rate | 63% | 57% | 70% | 56% | 110% |
| 1 | Calculated based on average shares outstanding. |
| 2 | Total returns do not include account service fees that may have applied in the periods shown. Fund prospectuses provide information about any applicable account service fees. |
| 3 | Includes performance-based investment advisory fee increases (decreases) of 0.05%, (0.01%), (0.03%), 0.00%, and (0.04%). |
| 4 | The ratio of expenses to average net assets for the period net of reduction from custody fee offset arrangements was 0.43%. |
| Level 1 ($000) | Level 2 ($000) | Level 3 ($000) | Total ($000) | |
| Investments | ||||
| Assets | ||||
| Common Stocks—North and South America | 640,631 | — | — | 640,631 |
| Common Stocks—Other | 125,758 | 631,849 | — | 757,607 |
| Temporary Cash Investments | 128,748 | — | — | 128,748 |
| Total | 895,137 | 631,849 | — | 1,526,986 |
| Amount ($000) | |
| Undistributed Ordinary Income | 845 |
| Undistributed Long-Term Gains | — |
| Net Unrealized Gains (Losses) | 238,916 |
| Capital Loss Carryforwards | (2,084,162) |
| Qualified Late-Year Losses | — |
| Other Temporary Differences | 770 |
| Total | (1,843,631) |
| Year Ended January 31, | ||
| 2023 Amount ($000) | 2022 Amount ($000) | |
| Ordinary Income* | 44,720 | 42,400 |
| Long-Term Capital Gains | — | — |
| Total | 44,720 | 42,400 |
| * | Includes short-term capital gains, if any. |
| Amount ($000) | |
| Tax Cost | 1,288,098 |
| Gross Unrealized Appreciation | 282,981 |
| Gross Unrealized Depreciation | (44,093) |
| Net Unrealized Appreciation (Depreciation) | 238,888 |
| Year Ended January 31, | |||
| 2023 Shares (000) | 2022 Shares (000) | ||
| Issued | 27,145 | 21,067 | |
| Issued in Lieu of Cash Distributions | 3,366 | 3,333 | |
| Redeemed | (28,764) | (27,397) | |
| Net Increase (Decrease) in Shares Outstanding | 1,747 | (2,997) | |
Philadelphia, Pennsylvania
March 23, 2023
| Matthew Benchener | Thomas M. Rampulla |
| Joseph Brennan | Karin A. Risi |
| Mortimer J. Buckley | Anne E. Robinson |
| Gregory Davis | Michael Rollings |
| John James | Nitin Tandon |
| Chris D. McIsaac | Lauren Valente |

Who Are Deaf or Hard of Hearing > 800-749-7273
All rights reserved.
Vanguard Marketing Corporation, Distributor.

Your Fund’s Performance at a Glance | 1 |
Advisor's Report | 2 |
About Your Fund’s Expenses | 5 |
Performance Summary | 7 |
Financial Statements | 9 |
| • | For the 12 months ended January 31, 2023, Vanguard Health Care Fund returned 6.57% for Investor Shares and 6.63% for Admiral Shares. These results outpaced the 1.13% return of the fund’s benchmark index. |
| • | Despite some relief in midsummer and toward the end of the period, it was a volatile, challenging time for financial markets. Early on, inflation readings across much of the world continued climbing to multidecade highs amid supply chain bottlenecks, rising energy and food prices, and broader price increases in goods and services. Central banks responded by aggressively tightening monetary policy. Later, it appeared that inflation might have peaked, and central banks began slowing their pace of interest rate hikes. |
| • | Sticky inflation, dramatic rate hikes, and fears of a recession weighed heavily on sentiment in the stock market. Health care was one of the few sectors that posted positive returns for the 12 months. |
| • | The fund’s performance relative to the benchmark was bolstered primarily by stock selection, most notably in biotechnology and pharmaceuticals. The fund’s allocations among subsectors, especially an overweight to biotechnology, also boosted relative performance. |
| Average Annual Total Returns Periods Ended January 31, 2023 | |||
| One Year | Three Years | Five Years | |
| Stocks | |||
| Russell 1000 Index (Large-caps) | -8.55% | 9.66% | 9.38% |
| Russell 2000 Index (Small-caps) | -3.38 | 7.51 | 5.54 |
| Russell 3000 Index (Broad U.S. market) | -8.24 | 9.51 | 9.12 |
| FTSE All-World ex US Index (International) | -5.39 | 4.15 | 1.73 |
| Bonds | |||
| Bloomberg U.S. Aggregate Float Adjusted Index (Broad taxable market) | -8.40% | -2.34% | 0.89% |
| Bloomberg Municipal Bond Index (Broad tax-exempt market) | -3.25 | -0.42 | 2.07 |
| FTSE Three-Month U.S. Treasury Bill Index | 1.87 | 0.78 | 1.29 |
| CPI | |||
| Consumer Price Index | 6.41% | 5.06% | 3.83% |
| • | Based on actual fund return. This section helps you to estimate the actual expenses that you paid over the period. The ”Ending Account Value“ shown is derived from the fund‘s actual return, and the third column shows the dollar amount that would have been paid by an investor who started with $1,000 in the fund. You may use the information here, together with the amount you invested, to estimate the expenses that you paid over the period. |
| • | Based on hypothetical 5% yearly return. This section is intended to help you compare your fund‘s costs with those of other mutual funds. It assumes that the fund had a yearly return of 5% before expenses, but that the expense ratio is unchanged. In this case—because the return used is not the fund’s actual return—the results do not apply to your investment. The example is useful in making comparisons because the Securities and Exchange Commission requires all mutual funds to calculate expenses based on a 5% return. You can assess your fund’s costs by comparing this hypothetical example with the hypothetical examples that appear in shareholder reports of other funds. |
| Six Months Ended January 31, 2023 | |||
| Beginning Account Value 7/31/2022 | Ending Account Value 1/31/2023 | Expenses Paid During Period | |
| Based on Actual Fund Return | |||
| Health Care Fund | |||
| Investor Shares | $1,000.00 | $1,038.90 | $1.80 |
| Admiral™ Shares | 1,000.00 | 1,039.20 | 1.54 |
| Based on Hypothetical 5% Yearly Return | |||
| Health Care Fund | |||
| Investor Shares | $1,000.00 | $1,023.44 | $1.79 |
| Admiral Shares | 1,000.00 | 1,023.69 | 1.53 |
| Average Annual Total Returns Periods Ended January 31, 2023 | |||||
| One Year | Five Years | Ten Years | Final Value of a $10,000 Investment | ||
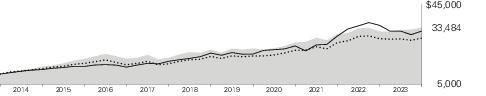
 | Health Care Fund Investor Shares | 6.57% | 8.50% | 12.85% | $33,484 |
 | MSCI All Country World Index Health Care Index | 1.13 | 8.29 | 10.87 | 28,067 |
 | Dow Jones U.S. Total Stock Market Float Adjusted Index | -8.42 | 8.99 | 12.19 | 31,581 |
| One Year | Five Years | Ten Years | Final Value of a $50,000 Investment | ||
| Health Care Fund Admiral Shares | 6.63% | 8.56% | 12.90% | $168,254 | |
| MSCI All Country World Index Health Care Index | 1.13 | 8.29 | 10.87 | 140,334 | |
| Dow Jones U.S. Total Stock Market Float Adjusted Index | -8.42 | 8.99 | 12.19 | 157,905 | |
| United States | 72.2% |
| Japan | 8.8 |
| United Kingdom | 6.9 |
| Switzerland | 5.3 |
| Belgium | 3.1 |
| Denmark | 2.2 |
| China | 1.1 |
| Other | 0.4 |
| Shares | Market Value• ($000) | ||
| Common Stocks (98.3%) | |||
| Belgium (3.1%) | |||
| 1 | UCB SA | 10,923,125 | 896,839 |
| * | Argenx SE | 1,339,326 | 510,131 |
| * | Galapagos NV | 1,175,458 | 52,024 |
| 1,458,994 | |||
| Brazil (0.0%) | |||
| *,2 | Hapvida Participacoes e Investimentos SA | 8,909,471 | 9,039 |
| China (1.1%) | |||
| 2 | WuXi AppTec Co. Ltd. Class H | 9,838,416 | 127,841 |
| * | Legend Biotech Corp. ADR | 1,483,204 | 74,902 |
| * | Zai Lab Ltd. | 14,229,400 | 59,519 |
| Yifeng Pharmacy Chain Co. Ltd. Class A | 6,945,794 | 58,463 | |
| *,2 | Wuxi Biologics Cayman Inc. | 6,756,200 | 56,417 |
| * | Zai Lab Ltd. ADR | 1,085,794 | 45,755 |
| Shandong Weigao Group Medical Polymer Co. Ltd. Class H | 24,872,000 | 41,347 | |
| *,2 | Remegen Co. Ltd. Class H | 4,397,500 | 35,558 |
| Shenzhen Mindray Bio-Medical Electronics Co. Ltd. Class A (XSHE) | 452,517 | 22,372 | |
| *,2 | Everest Medicines Ltd. | 2,139,500 | 6,836 |
| 529,010 | |||
| Denmark (2.2%) | |||
| * | Genmab A/S | 2,088,852 | 818,614 |
| * | Ascendis Pharma A/S ADR | 942,809 | 116,984 |
| *,3 | Genmab A/S ADR | 2,285,855 | 89,491 |
| 1,025,089 | |||
| Italy (0.2%) | |||
| DiaSorin SpA | 552,359 | 71,906 | |
| Amplifon SpA | 1,439,109 | 39,738 | |
| 111,644 | |||
| Japan (8.6%) | |||
| Daiichi Sankyo Co. Ltd. | 43,891,190 | 1,378,488 | |
| 1 | Eisai Co. Ltd. | 18,623,177 | 1,152,216 |
| Chugai Pharmaceutical Co. Ltd. | 17,516,900 | 454,127 | |
| Shares | Market Value• ($000) | ||
| Ono Pharmaceutical Co. Ltd. | 19,628,460 | 425,912 | |
| Astellas Pharma Inc. | 22,277,204 | 327,923 | |
| Terumo Corp. | 6,976,400 | 203,085 | |
| Nippon Shinyaku Co. Ltd. | 1,977,800 | 101,790 | |
| Asahi Intecc Co. Ltd. | 2,023,500 | 35,501 | |
| 4,079,042 | |||
| Spain (0.1%) | |||
| Almirall SA | 3,142,775 | 31,667 | |
| Switzerland (5.2%) | |||
| Novartis AG (Registered) | 21,530,502 | 1,946,553 | |
| Alcon Inc. | 3,393,208 | 256,047 | |
| Lonza Group AG (Registered) | 352,632 | 201,156 | |
| Tecan Group AG (Registered) | 203,082 | 85,228 | |
| 2,488,984 | |||
| United Kingdom (6.8%) | |||
| AstraZeneca plc | 19,440,938 | 2,547,006 | |
| GSK plc | 22,646,145 | 397,780 | |
| Hikma Pharmaceuticals plc | 6,910,934 | 146,195 | |
| * | Abcam plc ADR | 7,161,997 | 99,337 |
| Genus plc | 1,004,385 | 36,024 | |
| 3,226,342 | |||
| United States (71.0%) | |||
| UnitedHealth Group Inc. | 5,901,234 | 2,945,837 | |
| Eli Lilly & Co. | 7,644,984 | 2,631,021 | |
| Pfizer Inc. | 48,324,782 | 2,134,022 | |
| Merck & Co. Inc. | 18,307,050 | 1,966,360 | |
| * | Biogen Inc. | 4,887,203 | 1,421,687 |
| Stryker Corp. | 5,156,679 | 1,308,817 | |
| Elevance Health Inc. | 2,560,815 | 1,280,382 | |
| Danaher Corp. | 4,433,654 | 1,172,169 | |
| * | Boston Scientific Corp. | 25,019,385 | 1,157,147 |
| * | Regeneron Pharmaceuticals Inc. | 1,522,435 | 1,154,721 |
| Thermo Fisher Scientific Inc. | 2,024,414 | 1,154,584 | |
| Abbott Laboratories | 9,932,377 | 1,098,024 | |
| Humana Inc. | 2,102,867 | 1,076,037 | |
| * | Alnylam Pharmaceuticals Inc. | 4,718,518 | 1,068,273 |
| * | Vertex Pharmaceuticals Inc. | 3,181,078 | 1,027,806 |
| Shares | Market Value• ($000) | ||
| HCA Healthcare Inc. | 3,130,156 | 798,409 | |
| Zoetis Inc. | 4,787,260 | 792,244 | |
| * | Edwards Lifesciences Corp. | 9,662,088 | 741,082 |
| * | Centene Corp. | 8,903,692 | 678,818 |
| * | Seagen Inc. | 4,583,727 | 639,338 |
| * | Moderna Inc. | 3,493,282 | 615,027 |
| Agilent Technologies Inc. | 3,576,445 | 543,906 | |
| * | Insulet Corp. | 1,720,456 | 494,321 |
| Laboratory Corp. of America Holdings | 1,485,818 | 374,604 | |
| * | IQVIA Holdings Inc. | 1,559,767 | 357,826 |
| * | Align Technology Inc. | 1,245,662 | 335,992 |
| * | agilon health Inc. | 14,265,479 | 310,417 |
| Teleflex Inc. | 1,217,493 | 296,362 | |
| * | Illumina Inc. | 1,377,704 | 295,104 |
| * | Waters Corp. | 811,122 | 266,518 |
| * | Sarepta Therapeutics Inc. | 1,904,084 | 237,953 |
| * | Acadia Healthcare Co. Inc. | 2,711,116 | 227,788 |
| * | Molina Healthcare Inc. | 729,664 | 227,531 |
| * | Exact Sciences Corp. | 2,807,222 | 189,544 |
| * | Apellis Pharmaceuticals Inc. | 3,222,912 | 169,944 |
| *,1 | Agios Pharmaceuticals Inc. | 5,148,413 | 151,775 |
| * | Alkermes plc | 4,619,968 | 132,316 |
| *,1 | Ironwood Pharmaceuticals Inc. Class A | 10,902,066 | 125,592 |
| Royalty Pharma plc Class A | 3,053,455 | 119,665 | |
| * | Blueprint Medicines Corp. | 2,379,137 | 111,201 |
| * | Intra-Cellular Therapies Inc. | 2,295,196 | 109,986 |
| Encompass Health Corp. | 1,753,507 | 109,507 | |
| * | Mirati Therapeutics Inc. | 1,981,533 | 105,834 |
| * | Karuna Therapeutics Inc. | 514,899 | 102,666 |
| * | Cytokinetics Inc. | 2,281,868 | 96,934 |
| * | Denali Therapeutics Inc. | 3,056,783 | 92,529 |
| * | Syndax Pharmaceuticals Inc. | 3,092,082 | 88,743 |
| * | Oak Street Health Inc. | 2,978,154 | 86,545 |
| * | REVOLUTION Medicines Inc. | 2,991,103 | 79,982 |
| * | Immunocore Holdings plc ADR | 1,174,442 | 71,958 |
| * | Syneos Health Inc. | 1,911,256 | 68,652 |
| * | Intellia Therapeutics Inc. | 1,534,651 | 65,131 |
| * | Sage Therapeutics Inc. | 1,406,483 | 62,363 |
| * | Amedisys Inc. | 603,050 | 58,291 |
| * | Vaxcyte Inc. | 1,271,342 | 57,655 |
| * | PTC Therapeutics Inc. | 1,235,744 | 56,708 |
| * | Evolent Health Inc. Class A | 1,734,142 | 55,874 |
| * | Reata Pharmaceuticals Inc. Class A | 1,237,211 | 53,608 |
| * | Charles River Laboratories International Inc. | 210,626 | 51,235 |
| * | Surgery Partners Inc. | 1,504,178 | 49,939 |
| * | Prothena Corp. plc | 852,512 | 48,210 |
| * | TG Therapeutics Inc. | 3,066,304 | 46,700 |
| Shares | Market Value• ($000) | ||
| * | Glaukos Corp. | 934,746 | 45,849 |
| * | Amicus Therapeutics Inc. | 3,307,491 | 43,130 |
| * | Ultragenyx Pharmaceutical Inc. | 900,000 | 40,797 |
| * | Kymera Therapeutics Inc. | 877,191 | 32,789 |
| * | Celldex Therapeutics Inc. | 734,330 | 32,355 |
| *,1 | 2seventy bio Inc. | 2,046,666 | 27,835 |
| * | Rocket Pharmaceuticals Inc. | 1,199,337 | 26,062 |
| * | NanoString Technologies Inc. | 1,416,596 | 14,988 |
| 33,713,019 | |||
| Total Common Stocks (Cost $28,715,157) | 46,672,830 | ||
| Temporary Cash Investments (1.7%) | |||
| Money Market Fund (0.0%) | |||
| 4,5 | Vanguard Market Liquidity Fund 4.437% | 6,690 | 669 |
| Face Amount ($000) | |||
| Repurchase Agreements (1.6%) | |||
| Bank of America Securities LLC, 4.300%, 2/1/23 (Dated 1/31/23, Repurchase Value $61,507,000, collateralized by Ginnie Mae 4.000%–4.500%, 6/20/52–9/20/52, with a value of $62,730,000) | 61,500 | 61,500 | |
| Bank of Nova Scotia, 4.250%, 2/1/23 (Dated 1/31/23, Repurchase Value $79,009,000, collateralized by U.S. Treasury Note/Bond 0.375%–7.625%, 4/15/24–5/15/45, with a value of $80,590,000) | 79,000 | 79,000 | |
| Barclays Capital Inc., 4.230%, 2/1/23 (Dated 1/31/23, Repurchase Value $148,317,000, collateralized by U.S. Treasury Note/Bond 0.375%–1.250%, 12/31/25–11/30/26, with a value of $151,266,000) | 148,300 | 148,300 | |
| Face Amount ($000) | Market Value• ($000) | ||
| BNP Paribas Securities Corp., 4.300%, 2/1/23 (Dated 1/31/23, Repurchase Value $27,903,000, collateralized by Fannie Mae 2.500%, 2/1/51, Freddie Mac 2.000%–6.000%, 12/1/51–2/1/53, Ginnie Mae 2.500%–6.000%, 7/15/24–10/20/51, and U.S. Treasury Bill 0.000%, 3/21/23–6/1/23, with a value of $28,458,000) | 27,900 | 27,900 | |
| Credit Agricole Securities, 4.250%, 2/1/23 (Dated 1/31/23, Repurchase Value $8,001,000, collateralized by U.S. Treasury Note/Bond 2.875%, 11/15/46, with a value of $8,160,000) | 8,000 | 8,000 | |
| HSBC Bank USA, 4.260%, 2/1/23 (Dated 1/31/23, Repurchase Value $54,706,000, collateralized by U.S. Treasury Bill 0.000%, 1/25/24, with a value of $55,794,000) | 54,700 | 54,700 | |
| HSBC Bank USA, 4.300%, 2/1/23 (Dated 1/31/23, Repurchase Value $1,500,000, collateralized by Fannie Mae 5.000%, 10/1/52, with a value of $1,530,000) | 1,500 | 1,500 | |
| Natixis SA, 4.250%, 2/1/23 (Dated 1/31/23, Repurchase Value $21,903,000, collateralized by Federal Home Loan Bank 3.000%, 2/24/37, U.S. Treasury Inflation Indexed Note/Bond 0.125%, 2/15/51, and U.S. Treasury Note/Bond 2.500%–6.625%, 2/15/27–2/15/36, with a value of $22,338,000) | 21,900 | 21,900 |
| Face Amount ($000) | Market Value• ($000) | ||
| Nomura International plc, 4.280%, 2/1/23 (Dated 1/31/23, Repurchase Value $197,023,000, collateralized by U.S. Treasury Note/Bond 0.250%–4.750%, 9/30/25–2/15/41, with a value of $200,940,000) | 197,000 | 197,000 | |
| RBC Capital Markets LLC, 4.270%, 2/1/23 (Dated 1/31/23, Repurchase Value $147,117,000, collateralized by Fannie Mae 3.500%, 2/1/43, U.S. Treasury Inflation Indexed Note/Bond 0.500%, 4/15/24, and U.S. Treasury Note/Bond 0.375%–3.250%, 12/31/25–6/30/29, with a value of $150,042,000) | 147,100 | 147,100 | |
| 746,900 | |||
| U.S. Government and Agency Obligations (0.1%) | |||
| United States Treasury Bill, 4.320%–4.339%, 4/4/23 | 50,000 | 49,613 | |
| Total Temporary Cash Investments (Cost $797,188) | 797,182 | ||
| Total Investments (100.0%) (Cost $29,512,345) | 47,470,012 | ||
| Other Assets and Liabilities—Net (0.0%) | 7,413 | ||
| Net Assets (100%) | 47,477,425 | ||
| Cost is in $000. | |||
| • | See Note A in Notes to Financial Statements. |
| * | Non-income-producing security. |
| 1 | Considered an affiliated company of the fund as the fund owns more than 5% of the outstanding voting securities of such company. |
| 2 | Security exempt from registration under Rule 144A of the Securities Act of 1933. Such securities may be sold in transactions exempt from registration, normally to qualified institutional buyers. At January 31, 2023, the aggregate value was $235,691,000, representing 0.5% of net assets. |
| 3 | Includes partial security positions on loan to broker-dealers. The total value of securities on loan is $564,000. |
| 4 | Affiliated money market fund available only to Vanguard funds and certain trusts and accounts managed by Vanguard. Rate shown is the 7-day yield. |
| 5 | Collateral of $576,000 was received for securities on loan. |
| ADR—American Depositary Receipt. |
| ($000s, except shares, footnotes, and per-share amounts) | Amount |
| Assets | |
| Investments in Securities, at Value1 | |
| Unaffiliated Issuers (Cost $27,587,286) | 45,115,086 |
| Affiliated Issuers (Cost $1,925,059) | 2,354,926 |
| Total Investments in Securities | 47,470,012 |
| Investment in Vanguard | 1,801 |
| Cash | 68 |
| Foreign Currency, at Value (Cost $1,482) | 1,394 |
| Receivables for Investment Securities Sold | 14,833 |
| Receivables for Accrued Income | 59,392 |
| Receivables for Capital Shares Issued | 4,046 |
| Total Assets | 47,551,546 |
| Liabilities | |
| Payables for Investment Securities Purchased | 30,760 |
| Collateral for Securities on Loan | 576 |
| Payables to Investment Advisor | 18,673 |
| Payables for Capital Shares Redeemed | 20,898 |
| Payables to Vanguard | 3,214 |
| Total Liabilities | 74,121 |
| Net Assets | 47,477,425 |
| 1 Includes $564,000 of securities on loan. | |
| At January 31, 2023, net assets consisted of: | |
| Paid-in Capital | 28,125,477 |
| Total Distributable Earnings (Loss) | 19,351,948 |
| Net Assets | 47,477,425 |
| Investor Shares—Net Assets | |
| Applicable to 35,259,414 outstanding $.001 par value shares of beneficial interest (unlimited authorization) | 7,495,969 |
| Net Asset Value Per Share—Investor Shares | $212.59 |
| Admiral Shares—Net Assets | |
| Applicable to 446,008,662 outstanding $.001 par value shares of beneficial interest (unlimited authorization) | 39,981,456 |
| Net Asset Value Per Share—Admiral Shares | $89.64 |
| Year Ended January 31, 2023 | |
| ($000) | |
| Investment Income | |
| Income | |
| Dividends—Unaffiliated Issuers1 | 483,582 |
| Dividends—Affiliated Issuers2 | 29,407 |
| Interest—Unaffiliated Issuers | 15,562 |
| Securities Lending—Net | 1,173 |
| Total Income | 529,724 |
| Expenses | |
| Investment Advisory Fees—Note B | |
| Basic Fee | 67,269 |
| Performance Adjustment | 1,628 |
| The Vanguard Group—Note C | |
| Management and Administrative—Investor Shares | 13,365 |
| Management and Administrative—Admiral Shares | 53,190 |
| Marketing and Distribution—Investor Shares | 344 |
| Marketing and Distribution—Admiral Shares | 984 |
| Custodian Fees | 767 |
| Auditing Fees | 30 |
| Shareholders’ Reports—Investor Shares | 166 |
| Shareholders’ Reports—Admiral Shares | 162 |
| Trustees’ Fees and Expenses | 16 |
| Other Expenses | 130 |
| Total Expenses | 138,051 |
| Expenses Paid Indirectly | (55) |
| Net Expenses | 137,996 |
| Net Investment Income | 391,728 |
| Realized Net Gain (Loss) | |
| Investment Securities Sold—Unaffiliated Issuers | 2,863,025 |
| Investment Securities Sold—Affiliated Issuers | (807,486) |
| Foreign Currencies | (1,453) |
| Realized Net Gain (Loss) | 2,054,086 |
| Change in Unrealized Appreciation (Depreciation) | |
| Investment Securities—Unaffiliated Issuers | (229,200) |
| Investment Securities—Affiliated Issuers | 779,448 |
| Foreign Currencies | (1,226) |
| Change in Unrealized Appreciation (Depreciation) | 549,022 |
| Net Increase (Decrease) in Net Assets Resulting from Operations | 2,994,836 |
| 1 | Dividends are net of foreign withholding taxes of $15,841,000. |
| 2 | Dividends are net of foreign withholding taxes of $6,251,000. |
| Year Ended January 31, | ||
| 2023 ($000) | 2022 ($000) | |
| Increase (Decrease) in Net Assets | ||
| Operations | ||
| Net Investment Income | 391,728 | 430,364 |
| Realized Net Gain (Loss) | 2,054,086 | 4,838,005 |
| Change in Unrealized Appreciation (Depreciation) | 549,022 | (2,985,233) |
| Net Increase (Decrease) in Net Assets Resulting from Operations | 2,994,836 | 2,283,136 |
| Distributions | ||
| Investor Shares | (407,436) | (650,696) |
| Admiral Shares | (2,190,665) | (3,443,247) |
| Total Distributions | (2,598,101) | (4,093,943) |
| Capital Share Transactions | ||
| Investor Shares | (56,992) | (610,620) |
| Admiral Shares | (289,544) | 737,980 |
| Net Increase (Decrease) from Capital Share Transactions | (346,536) | 127,360 |
| Total Increase (Decrease) | 50,199 | (1,683,447) |
| Net Assets | ||
| Beginning of Period | 47,427,226 | 49,110,673 |
| End of Period | 47,477,425 | 47,427,226 |
| Investor Shares | |||||
| For a Share Outstanding Throughout Each Period | Year Ended January 31, | ||||
| 2023 | 2022 | 2021 | 2020 | 2019 | |
| Net Asset Value, Beginning of Period | $210.54 | $218.60 | $204.57 | $203.34 | $215.96 |
| Investment Operations | |||||
| Net Investment Income1 | 1.654 | 1.869 | 2.005 | 2.506 | 2.375 |
| Net Realized and Unrealized Gain (Loss) on Investments | 11.988 | 8.949 | 29.203 | 23.326 | 2.489 |
| Total from Investment Operations | 13.642 | 10.818 | 31.208 | 25.832 | 4.864 |
| Distributions | |||||
| Dividends from Net Investment Income | (1.659) | (1.951) | (1.886) | (2.428) | (2.323) |
| Distributions from Realized Capital Gains | (9.933) | (16.927) | (15.292) | (22.174) | (15.161) |
| Total Distributions | (11.592) | (18.878) | (17.178) | (24.602) | (17.484) |
| Net Asset Value, End of Period | $212.59 | $210.54 | $218.60 | $204.57 | $203.34 |
| Total Return2 | 6.57% | 4.48% | 16.16% | 13.16% | 2.76% |
| Ratios/Supplemental Data | |||||
| Net Assets, End of Period (Millions) | $7,496 | $7,493 | $8,342 | $8,729 | $8,850 |
| Ratio of Total Expenses to Average Net Assets3 | 0.34%4 | 0.30% | 0.32% | 0.32% | 0.34% |
| Ratio of Net Investment Income to Average Net Assets | 0.80% | 0.82% | 0.95% | 1.25% | 1.12% |
| Portfolio Turnover Rate | 19% | 15% | 18% | 18% | 16% |
| 1 | Calculated based on average shares outstanding. |
| 2 | Total returns do not include account service fees that may have applied in the periods shown. Fund prospectuses provide information about any applicable account service fees. |
| 3 | Includes performance-based investment advisory fee increases (decreases) of 0.00%, (0.04%), (0.01%), (0.02%), and 0.00%. |
| 4 | The ratio of expenses to average net assets for the period net of reduction from custody fee offset and broker commission abatement arrangements was 0.34%. |
| Admiral Shares | |||||
| For a Share Outstanding Throughout Each Period | Year Ended January 31, | ||||
| 2023 | 2022 | 2021 | 2020 | 2019 | |
| Net Asset Value, Beginning of Period | $88.77 | $92.17 | $86.27 | $85.75 | $91.08 |
| Investment Operations | |||||
| Net Investment Income1 | .750 | .830 | .883 | 1.097 | 1.036 |
| Net Realized and Unrealized Gain (Loss) on Investments | 5.052 | 3.780 | 12.316 | 9.844 | 1.057 |
| Total from Investment Operations | 5.802 | 4.610 | 13.199 | 10.941 | 2.093 |
| Distributions | |||||
| Dividends from Net Investment Income | (.743) | (.870) | (.849) | (1.068) | (1.027) |
| Distributions from Realized Capital Gains | (4.189) | (7.140) | (6.450) | (9.353) | (6.396) |
| Total Distributions | (4.932) | (8.010) | (7.299) | (10.421) | (7.423) |
| Net Asset Value, End of Period | $89.64 | $88.77 | $92.17 | $86.27 | $85.75 |
| Total Return2 | 6.63% | 4.53% | 16.21% | 13.22% | 2.81% |
| Ratios/Supplemental Data | |||||
| Net Assets, End of Period (Millions) | $39,981 | $39,934 | $40,769 | $38,126 | $37,888 |
| Ratio of Total Expenses to Average Net Assets3 | 0.29%4 | 0.25% | 0.27% | 0.27% | 0.28% |
| Ratio of Net Investment Income to Average Net Assets | 0.86% | 0.86% | 0.99% | 1.30% | 1.18% |
| Portfolio Turnover Rate | 19% | 15% | 18% | 18% | 16% |
| 1 | Calculated based on average shares outstanding. |
| 2 | Total returns do not include account service fees that may have applied in the periods shown. Fund prospectuses provide information about any applicable account service fees. |
| 3 | Includes performance-based investment advisory fee increases (decreases) of 0.00%, (0.04%), (0.01%), (0.02%), and 0.00%. |
| 4 | The ratio of expenses to average net assets for the period net of reduction from custody fee offset and broker commission abatement arrangements was 0.29%. |
| A. | The following significant accounting policies conform to generally accepted accounting principles for U.S. investment companies. The fund consistently follows such policies in preparing its financial statements. |
| B. | Wellington Management Company llp provides investment advisory services to the fund for a fee calculated at an annual percentage rate of average net assets. The basic fee is subject to quarterly adjustments based on the fund’s performance relative to the MSCI All Country World Health Care Index for the preceding three years. For the year ended January 31, 2023, the investment advisory fee represented an effective annual basic rate of 0.14% of the fund’s average net assets, before a net increase of $1,628,000 (0.00%) based on performance. |
| C. | In accordance with the terms of a Funds' Service Agreement (the “FSA”) between Vanguard and the fund, Vanguard furnishes to the fund corporate management, administrative, marketing, and distribution services at Vanguard’s cost of operations (as defined by the FSA). These costs of operations are allocated to the fund based on methods and guidelines approved by the board of trustees and are generally settled twice a month. |
| D. | The fund has asked its investment advisor to direct certain security trades, subject to obtaining the best price and execution, to brokers who have agreed to rebate to the fund part of the commissions generated. Such rebates are used solely to reduce the fund’s management and administrative expenses. The fund’s custodian bank has also agreed to reduce its fees when the fund maintains cash on deposit in the non-interest-bearing custody account. For the year ended January 31, 2023, these arrangements reduced the fund’s management and administrative expenses by $53,000 and custodian fees by $2,000. The total expense reduction represented an effective annual rate of less than 0.01% of the fund’s average net assets. |
| E. | Various inputs may be used to determine the value of the fund’s investments. These inputs are summarized in three broad levels for financial statement purposes. The inputs or methodologies used to value securities are not necessarily an indication of the risk associated with investing in those securities. |
| Level 1 ($000) | Level 2 ($000) | Level 3 ($000) | Total ($000) | |
| Investments | ||||
| Assets | ||||
| Common Stocks—North and South America | 33,722,058 | — | — | 33,722,058 |
| Common Stocks—Other | 426,469 | 12,524,303 | — | 12,950,772 |
| Temporary Cash Investments | 669 | 796,513 | — | 797,182 |
| Total | 34,149,196 | 13,320,816 | — | 47,470,012 |
| F. | Permanent differences between book-basis and tax-basis components of net assets are reclassified among capital accounts in the financial statements to reflect their tax character. These reclassifications have no effect on net assets or net asset value per share. As of period end, |
| Amount ($000) | |
| Paid-in Capital | 61,730 |
| Total Distributable Earnings (Loss) | (61,730) |
| Amount ($000) | |
| Undistributed Ordinary Income | 21,088 |
| Undistributed Long-Term Gains | 1,474,284 |
| Capital Loss Carryforwards | — |
| Qualified Late-Year Losses | — |
| Net Unrealized Gains (Losses) | 17,856,576 |
| Year Ended January 31, | ||
| 2023 Amount ($000) | 2022 Amount ($000) | |
| Ordinary Income* | 386,442 | 966,751 |
| Long-Term Capital Gains | 2,211,659 | 3,127,192 |
| Total | 2,598,101 | 4,093,943 |
| * | Includes short-term capital gains, if any. |
| Amount ($000) | |
| Tax Cost | 29,613,839 |
| Gross Unrealized Appreciation | 20,297,006 |
| Gross Unrealized Depreciation | (2,440,832) |
| Net Unrealized Appreciation (Depreciation) | 17,856,174 |
| G. | During the year ended January 31, 2023, the fund purchased $8,773,240,000 of investment securities and sold $11,222,909,000 of investment securities, other than temporary cash investments. |
| H. | Capital share transactions for each class of shares were: |
| Year Ended January 31, | |||||
| 2023 | 2022 | ||||
| Amount ($000) | Shares (000) | Amount ($000) | Shares (000) | ||
| Investor Shares | |||||
| Issued | 421,032 | 2,016 | 629,952 | 2,783 | |
| Issued in Lieu of Cash Distributions | 383,037 | 1,809 | 609,552 | 2,709 | |
| Redeemed | (861,061) | (4,158) | (1,850,124) | (8,061) | |
| Net Increase (Decrease)—Investor Shares | (56,992) | (333) | (610,620) | (2,569) | |
| Admiral Shares | |||||
| Issued | 917,744 | 10,465 | 1,787,859 | 18,432 | |
| Issued in Lieu of Cash Distributions | 1,929,691 | 21,616 | 3,027,419 | 31,867 | |
| Redeemed | (3,136,979) | (35,909) | (4,077,298) | (42,774) | |
| Net Increase (Decrease)—Admiral Shares | (289,544) | (3,828) | 737,980 | 7,525 | |
| I. | Certain of the fund’s investments were in companies that were considered to be affiliated companies of the fund because the fund owned more than 5% of the outstanding voting securities of the company or the issuer was another member of The Vanguard Group. Transactions during the period in securities of these companies were as follows: |
| Current Period Transactions | ||||||||
| Jan. 31, 2022 Market Value ($000) | Purchases at Cost ($000) | Proceeds from Securities Sold ($000) | Realized Net Gain (Loss) ($000) | Change in Unrealized App. (Dep.) ($000) | Income ($000) | Capital Gain Distributions Received ($000) | Jan. 31, 2023 Market Value ($000) | |
| 2seventy bio Inc. | 38,211 | — | — | — | (10,376) | — | — | 27,835 |
| Agios Pharmaceuticals Inc. | 159,034 | — | — | — | (7,259) | — | — | 151,775 |
| Alkermes plc | 301,083 | — | 201,154 | (86,001) | 118,388 | — | — | NA1 |
| Bluebird Bio Inc. | 48,445 | — | 25,566 | (331,131) | 308,252 | — | — | — |
| Eisai Co. Ltd. | 894,327 | 45,294 | 24,013 | (1,449) | 238,057 | 20,009 | — | 1,152,216 |
| Ironwood Pharmaceuticals Inc. Class A | 121,558 | — | — | — | 4,034 | — | — | 125,592 |
| Nektar Therapeutics Class A | 126,587 | — | 31,437 | (403,000) | 307,850 | — | — | — |
| UCB SA | 1,018,749 | 90,308 | 46,817 | 14,097 | (179,498) | 9,398 | — | 896,839 |
| Vanguard Market Liquidity Fund | 4,711 | NA2 | NA2 | (2) | — | — | — | 669 |
| Total | 2,712,705 | 135,602 | 328,987 | (807,486) | 779,448 | 29,407 | — | 2,354,926 |
| 1 | Not applicable—at January 31, 2023, the security was still held, but the issuer was no longer an affiliated company of the fund. |
| 2 | Not applicable—purchases and sales are for temporary cash investment purposes. |
| J. | Management has determined that no events or transactions occurred subsequent to January 31, 2023, that would require recognition or disclosure in these financial statements. |
Philadelphia, Pennsylvania
March 23, 2023
| Matthew Benchener | Thomas M. Rampulla |
| Joseph Brennan | Karin A. Risi |
| Mortimer J. Buckley | Anne E. Robinson |
| Gregory Davis | Michael Rollings |
| John James | Nitin Tandon |
| Chris D. Mclsaac | Lauren Valente |

All rights reserved.
Vanguard Marketing Corporation, Distributor.

| Vanguard Real Estate Index Fund |
| Vanguard Real Estate II Index Fund |
| 1 | |
| 2 | |
| 4 | |
| 29 |
| • | For the 12 months ended January 31, 2023, returns for Vanguard Real Estate Index Fund ranged from –11.39% for Investor Shares to –11.27% for Institutional Shares, –11.26% for Admiral Shares, and –11.25% for ETF Shares (based on net asset value). Vanguard Real Estate II Index Fund returned –11.23%. The results slightly lagged those of the funds’ benchmark index. |
| • | Despite some relief in midsummer and toward the end of the period, it was a volatile, challenging time for financial markets. Early on, inflation readings around much of the world continued climbing to multidecade highs amid supply chain bottlenecks, rising energy and food prices, and broader price increases in goods and services. Central banks responded by aggressively tightening monetary policy. Later, it appeared that inflation might have peaked, and central banks began slowing their pace of interest rate hikes. |
| • | Sticky inflation, dramatic rate hikes, and fears of a recession weighed heavily on sentiment in the stock market. |
| • | The majority of the 12 sectors recorded negative returns for the 12 months. Real estate operating companies, mortgage and office REITs, and real estate services performed the worst. |
| • | For the 10 years ended January 31, 2023, average annual returns for the Real Estate Index Fund ranged from 6.95% for Investor Shares to 7.08% for the Real Estate ETF, 7.09% for Admiral Shares, and 7.11% for Institutional Shares, in line with its benchmark’s return. The Real Estate Index II Fund launched in 2017 and doesn’t have a 10-year record. |
| Average Annual Total Returns Periods Ended January 31, 2023 | |||
| One Year | Three Years | Five Years | |
| Stocks | |||
| Russell 1000 Index (Large-caps) | -8.55% | 9.66% | 9.38% |
| Russell 2000 Index (Small-caps) | -3.38 | 7.51 | 5.54 |
| Russell 3000 Index (Broad U.S. market) | -8.24 | 9.51 | 9.12 |
| FTSE All-World ex US Index (International) | -5.39 | 4.15 | 1.73 |
| Bonds | |||
| Bloomberg U.S. Aggregate Float Adjusted Index (Broad taxable market) | -8.40% | -2.34% | 0.89% |
| Bloomberg Municipal Bond Index (Broad tax-exempt market) | -3.25 | -0.42 | 2.07 |
| FTSE Three-Month U.S. Treasury Bill Index | 1.87 | 0.78 | 1.29 |
| CPI | |||
| Consumer Price Index | 6.41% | 5.06% | 3.83% |
| • | Based on actual fund return. This section helps you to estimate the actual expenses that you paid over the period. The ”Ending Account Value“ shown is derived from the fund’s actual return, and the third column shows the dollar amount that would have been paid by an investor who started with $1,000 in the fund. You may use the information here, together with the amount you invested, to estimate the expenses that you paid over the period. |
| • | Based on hypothetical 5% yearly return. This section is intended to help you compare your fund‘s costs with those of other mutual funds. It assumes that the fund had a yearly return of 5% before expenses, but that the expense ratio is unchanged. In this case—because the return used is not the fund’s actual return—the results do not apply to your investment. The example is useful in making comparisons because the Securities and Exchange Commission requires all mutual funds to calculate expenses based on a 5% return. You can assess your fund’s costs by comparing this hypothetical example with the hypothetical examples that appear in shareholder reports of other funds. |
| Six Months Ended January 31, 2023 | |||
| Beginning Account Value 7/31/2022 | Ending Account Value 1/31/2023 | Expenses Paid During Period | |
| Based on Actual Fund Return | |||
| Real Estate Index Fund | |||
| Investor Shares | $1,000.00 | $943.00 | $1.27 |
| ETF Shares | 1,000.00 | 943.70 | 0.59 |
| Admiral™ Shares | 1,000.00 | 943.40 | 0.59 |
| Institutional Shares | 1,000.00 | 943.50 | 0.49 |
| Real Estate II Index Fund | $1,000.00 | $943.70 | $0.39 |
| Based on Hypothetical 5% Yearly Return | |||
| Real Estate Index Fund | |||
| Investor Shares | $1,000.00 | $1,023.89 | $1.33 |
| ETF Shares | 1,000.00 | 1,024.60 | 0.61 |
| Admiral Shares | 1,000.00 | 1,024.60 | 0.61 |
| Institutional Shares | 1,000.00 | 1,024.70 | 0.51 |
| Real Estate II Index Fund | $1,000.00 | $1,024.80 | $0.41 |

| Average Annual Total Returns Periods Ended January 31, 2023 | |||||
| One Year | Five Years | Ten Years | Final Value of a $10,000 Investment | ||
 | Real Estate Index Fund Investor Shares | -11.39% | 6.52% | 6.95% | $19,573 |
 | Real Estate Spliced Index | -11.15 | 6.77 | 7.19 | 20,031 |
 | Dow Jones U.S. Total Stock Market Float Adjusted Index | -8.42 | 8.99 | 12.19 | 31,581 |
| One Year | Five Years | Ten Years | Final Value of a $10,000 Investment | ||
| Real Estate Index Fund ETF Shares Net Asset Value | -11.25% | 6.64% | 7.08% | $19,824 | |
| Real Estate Index Fund ETF Shares Market Price | -11.24 | 6.64 | 7.08 | 19,821 | |
| Real Estate Spliced Index | -11.15 | 6.77 | 7.19 | 20,031 | |
| Dow Jones U.S. Total Stock Market Float Adjusted Index | -8.42 | 8.99 | 12.19 | 31,581 | |
| Average Annual Total Returns Periods Ended January 31, 2023 | |||||
| One Year | Five Years | Ten Years | Final Value of a $10,000 Investment | ||
| Real Estate Index Fund Admiral Shares | -11.26% | 6.66% | 7.09% | $19,845 | |
| Real Estate Spliced Index | -11.15 | 6.77 | 7.19 | 20,031 | |
| Dow Jones U.S. Total Stock Market Float Adjusted Index | -8.42 | 8.99 | 12.19 | 31,581 | |
| One Year | Five Years | Ten Years | Final Value of a $5,000,000 Investment | ||
| Real Estate Index Fund Institutional Shares | -11.27% | 6.68% | 7.11% | $9,938,961 | |
| Real Estate Spliced Index | -11.15 | 6.77 | 7.19 | 10,015,355 | |
| Dow Jones U.S. Total Stock Market Float Adjusted Index | -8.42 | 8.99 | 12.19 | 15,790,549 | |
| Cumulative Returns of ETF Shares: January 31, 2013, Through January 31, 2023 | |||
| One Year | Five Years | Ten Years | |
| Real Estate Index Fund ETF Shares Market Price | -11.24% | 37.94% | 98.21% |
| Real Estate Index Fund ETF Shares Net Asset Value | -11.25 | 37.94 | 98.24 |
| Real Estate Spliced Index | -11.15 | 38.72 | 100.31 |
| Diversified Real Estate Activities | 0.1% |
| Diversified REITs | 3.0 |
| Health Care REITs | 7.9 |
| Hotel & Resort REITs | 2.8 |
| Industrial REITs | 12.6 |
| Office REITs | 5.5 |
| Real Estate Development | 0.3 |
| Real Estate Operating Companies | 0.4 |
| Real Estate Services | 4.1 |
| Residential REITs | 13.6 |
| Retail REITs | 12.6 |
| Specialized REITs | 37.1 |
| Shares | Market Value• ($000) | |||||
| Equity Real Estate Investment Trusts (REITs) (95.0%) | ||||||
| Diversified REITs (2.6%) | ||||||
| WP Carey Inc. | 8,608,205 | 736,260 | ||||
| STORE Capital Corp. | 11,353,001 | 365,680 | ||||
| Essential Properties Realty Trust Inc. | 6,299,864 | 160,521 | ||||
| Broadstone Net Lease Inc. | 7,722,008 | 139,846 | ||||
| Global Net Lease Inc. | 4,629,492 | 69,211 | ||||
| American Assets Trust Inc. | 2,296,988 | 65,372 | ||||
| Alexander & Baldwin Inc. | 3,246,506 | 64,995 | ||||
| Empire State Realty Trust Inc. Class A | 6,163,089 | 51,400 | ||||
| Armada Hoffler Properties Inc. | 3,019,416 | 38,286 | ||||
| iStar Inc. | 3,807,294 | 35,332 | ||||
| Gladstone Commercial Corp. | 1,761,403 | 29,926 | ||||
| 1 | NexPoint Diversified Real Estate Trust | 1,405,990 | 18,404 | |||
| One Liberty Properties Inc. | 752,349 | 18,139 | ||||
| 1,793,372 | ||||||
| Health Care REITs (6.9%) | ||||||
| Welltower Inc. | 19,927,089 | 1,495,329 | ||||
| Ventas Inc. | 17,836,395 | 924,104 | ||||
| Healthpeak Properties Inc. | 24,077,458 | 661,648 | ||||
| Healthcare Realty Trust Inc. Class A | 16,980,986 | 365,601 | ||||
| Medical Properties Trust Inc. | 26,728,489 | 346,134 | ||||
| Omega Healthcare Investors Inc. | 10,446,488 | 307,545 | ||||
| Physicians Realty Trust | 10,096,143 | 160,125 | ||||
| Sabra Health Care REIT Inc. | 10,309,979 | 139,185 | ||||
| National Health Investors Inc. | 1,993,214 | 117,261 | ||||
| CareTrust REIT Inc. | 4,330,908 | 89,736 | ||||
| LTC Properties Inc. | 1,808,103 | 68,979 | ||||
| Shares | Market Value• ($000) | |||||
| Community Healthcare Trust Inc. | 1,063,187 | 45,589 | ||||
| Universal Health Realty Income Trust | 585,063 | 32,067 | ||||
| Global Medical REIT Inc. | 2,774,558 | 31,158 | ||||
| Diversified Healthcare Trust | 10,716,655 | 8,481 | ||||
| 4,792,942 | ||||||
| Hotel & Resort REITs (2.5%) | ||||||
| Host Hotels & Resorts Inc. | 31,900,770 | 601,330 | ||||
| Ryman Hospitality Properties Inc. | 2,338,106 | 217,187 | ||||
| Apple Hospitality REIT Inc. | 9,700,839 | 171,996 | ||||
| Park Hotels & Resorts Inc. | 10,030,773 | 147,553 | ||||
| Sunstone Hotel Investors Inc. | 9,477,828 | 104,161 | ||||
| Pebblebrook Hotel Trust | 5,868,441 | 96,242 | ||||
| RLJ Lodging Trust | 7,265,444 | 91,327 | ||||
| DiamondRock Hospitality Co. | 9,416,148 | 90,677 | ||||
| Xenia Hotels & Resorts Inc. | 5,105,117 | 76,066 | ||||
| Service Properties Trust | 7,374,649 | 65,708 | ||||
| Summit Hotel Properties Inc. | 4,766,517 | 40,611 | ||||
| Chatham Lodging Trust | 2,070,669 | 29,424 | ||||
| 1,732,282 | ||||||
| Industrial REITs (11.0%) | ||||||
| Prologis Inc. | 41,187,127 | 5,324,672 | ||||
| Rexford Industrial Realty Inc. | 7,633,409 | 484,492 | ||||
| Americold Realty Trust Inc. | 12,018,685 | 377,507 | ||||
| EastGroup Properties Inc. | 1,944,393 | 327,144 | ||||
| First Industrial Realty Trust Inc. | 5,894,270 | 314,459 | ||||
| STAG Industrial Inc. | 7,998,344 | 284,741 | ||||
| Terreno Realty Corp. | 3,371,074 | 217,198 | ||||
| LXP Industrial Trust | 12,485,278 | 144,205 | ||||
| Shares | Market Value• ($000) | |||||
| Innovative Industrial Properties Inc. | 1,248,492 | 112,090 | ||||
| Plymouth Industrial REIT Inc. | 1,789,256 | 40,044 | ||||
| Industrial Logistics Properties Trust | 2,910,003 | 12,833 | ||||
| 7,639,385 | ||||||
| Office REITs (4.8%) | ||||||
| Alexandria Real Estate Equities Inc. | 6,916,996 | 1,111,838 | ||||
| Boston Properties Inc. | 6,644,087 | 495,250 | ||||
| Kilroy Realty Corp. | 4,693,244 | 192,611 | ||||
| Cousins Properties Inc. | 6,756,799 | 185,271 | ||||
| Vornado Realty Trust | 7,273,008 | 177,389 | ||||
| Highwoods Properties Inc. | 4,695,483 | 142,602 | ||||
| Corporate Office Properties Trust | 5,014,539 | 140,758 | ||||
| Douglas Emmett Inc. | 7,846,678 | 131,432 | ||||
| Equity Commonwealth | 4,960,886 | 126,602 | ||||
| SL Green Realty Corp. | 2,870,606 | 118,125 | ||||
| JBG SMITH Properties | 4,595,791 | 92,559 | ||||
| Hudson Pacific Properties Inc. | 6,324,828 | 72,040 | ||||
| Easterly Government Properties Inc. Class A | 3,852,655 | 62,567 | ||||
| * | Veris Residential Inc. | 3,456,969 | 59,806 | |||
| Piedmont Office Realty Trust Inc. Class A | 5,511,535 | 58,422 | ||||
| Paramount Group Inc. | 8,053,502 | 51,945 | ||||
| Brandywine Realty Trust | 7,664,789 | 50,281 | ||||
| Office Properties Income Trust | 2,160,075 | 37,067 | ||||
| Orion Office REIT Inc. | 2,524,592 | 24,362 | ||||
| City Office REIT Inc. | 1,852,461 | 18,228 | ||||
| Franklin Street Properties Corp. | 4,133,818 | 12,732 | ||||
| *,2 | New York REIT Liquidating LLC | 1,208 | 14 | |||
| 3,361,901 | ||||||
| Other (12.1%)3 | ||||||
| 4,5 | Vanguard Real Estate II Index Fund | 387,519,976 | 8,471,187 | |||
| Residential REITs (11.8%) | ||||||
| AvalonBay Communities Inc. | 6,239,635 | 1,107,161 | ||||
| Equity Residential | 15,344,227 | 976,660 | ||||
| Invitation Homes Inc. | 27,236,187 | 885,176 | ||||
| Sun Communities Inc. | 5,503,127 | 863,220 | ||||
| Mid-America Apartment Communities Inc. | 5,151,214 | 858,810 | ||||
| Essex Property Trust Inc. | 2,906,001 | 656,960 | ||||
| UDR Inc. | 14,498,842 | 617,506 | ||||
| Equity LifeStyle Properties Inc. | 7,888,333 | 566,225 | ||||
| Camden Property Trust | 4,515,888 | 556,403 | ||||
| Shares | Market Value• ($000) | |||||
| American Homes 4 Rent Class A | 12,915,399 | 442,869 | ||||
| Apartment Income REIT Corp. Class A | 6,879,792 | 263,221 | ||||
| Independence Realty Trust Inc. | 9,908,240 | 186,572 | ||||
| Elme Communities | 3,901,427 | 74,907 | ||||
| NexPoint Residential Trust Inc. | 1,031,206 | 52,076 | ||||
| Apartment Investment & Management Co. Class A | 6,781,782 | 50,931 | ||||
| Centerspace | 685,372 | 46,345 | ||||
| UMH Properties Inc. | 2,332,058 | 41,790 | ||||
| * | Bluerock Homes Trust Inc. | 149 | 3 | |||
| 8,246,835 | ||||||
| Retail REITs (11.0%) | ||||||
| Realty Income Corp. | 27,558,427 | 1,869,288 | ||||
| Simon Property Group Inc. | 14,207,415 | 1,825,085 | ||||
| Kimco Realty Corp. | 27,598,339 | 619,859 | ||||
| Regency Centers Corp. | 6,872,112 | 457,889 | ||||
| National Retail Properties Inc. | 7,903,313 | 374,222 | ||||
| Federal Realty Investment Trust | 3,248,876 | 362,347 | ||||
| Brixmor Property Group Inc. | 13,373,567 | 314,680 | ||||
| Spirit Realty Capital Inc. | 6,084,329 | 266,980 | ||||
| Agree Realty Corp. | 3,562,592 | 265,876 | ||||
| Kite Realty Group Trust | 9,778,298 | 212,189 | ||||
| Phillips Edison & Co. Inc. | 5,206,159 | 174,510 | ||||
| Macerich Co. | 9,588,248 | 131,743 | ||||
| SITE Centers Corp. | 8,599,633 | 117,385 | ||||
| Tanger Factory Outlet Centers Inc. | 4,659,047 | 89,034 | ||||
| Retail Opportunity Investments Corp. | 5,559,816 | 88,012 | ||||
| Urban Edge Properties | 5,242,911 | 82,576 | ||||
| InvenTrust Properties Corp. | 3,010,096 | 74,861 | ||||
| Acadia Realty Trust | 4,238,675 | 65,827 | ||||
| Getty Realty Corp. | 1,773,350 | 64,603 | ||||
| NETSTREIT Corp. | 2,249,128 | 45,275 | ||||
| Necessity Retail REIT Inc. Class A | 5,942,915 | 40,590 | ||||
| RPT Realty | 3,796,833 | 39,791 | ||||
| Saul Centers Inc. | 639,248 | 27,366 | ||||
| Urstadt Biddle Properties Inc. Class A | 1,334,058 | 25,054 | ||||
| Alexander's Inc. | 102,436 | 24,306 | ||||
| CBL & Associates Properties Inc. | 566,768 | 15,104 | ||||
| Shares | Market Value• ($000) | |||||
| Urstadt Biddle Properties Inc. | 16,032 | 269 | ||||
| *,2 | Spirit MTA REIT | 2,071,263 | — | |||
| 7,674,721 | ||||||
| Specialized REITs (32.3%) | ||||||
| American Tower Corp. | 20,776,071 | 4,641,167 | ||||
| Equinix Inc. | 4,064,086 | 2,999,824 | ||||
| Crown Castle Inc. | 19,323,658 | 2,862,027 | ||||
| Public Storage | 7,049,932 | 2,145,576 | ||||
| SBA Communications Corp. Class A | 4,813,893 | 1,432,278 | ||||
| Digital Realty Trust Inc. | 12,200,029 | 1,398,367 | ||||
| VICI Properties Inc. Class A | 37,576,692 | 1,284,371 | ||||
| Weyerhaeuser Co. | 33,035,120 | 1,137,399 | ||||
| Extra Space Storage Inc. | 5,975,557 | 943,122 | ||||
| Iron Mountain Inc. | 12,971,309 | 707,974 | ||||
| Gaming & Leisure Properties Inc. | 11,451,516 | 613,343 | ||||
| CubeSmart | 10,015,763 | 458,622 | ||||
| Lamar Advertising Co. Class A | 3,887,242 | 414,147 | ||||
| Life Storage Inc. | 3,765,098 | 406,781 | ||||
| Rayonier Inc. | 6,533,800 | 237,765 | ||||
| PotlatchDeltic Corp. | 3,596,091 | 176,029 | ||||
| National Storage Affiliates Trust | 3,891,493 | 158,773 | ||||
| EPR Properties | 3,346,235 | 142,148 | ||||
| Outfront Media Inc. | 6,225,151 | 123,881 | ||||
| Four Corners Property Trust Inc. | 3,635,636 | 104,561 | ||||
| Uniti Group Inc. | 10,593,083 | 69,808 | ||||
| 1 | Safehold Inc. | 1,100,744 | 38,482 | |||
| Gladstone Land Corp. | 1,451,595 | 28,364 | ||||
| 22,524,809 | ||||||
| Total Equity Real Estate Investment Trusts (REITs) (Cost $61,308,066) | 66,237,434 | |||||
| Real Estate Management & Development (4.3%) | ||||||
| Diversified Real Estate Activities (0.1%) | ||||||
| St. Joe Co. | 1,446,722 | 68,141 | ||||
| RMR Group Inc. Class A | 690,879 | 21,431 | ||||
| 89,572 | ||||||
| Real Estate Development (0.2%) | ||||||
| * | Howard Hughes Corp. | 1,670,153 | 142,781 | |||
| * | Forestar Group Inc. | 887,144 | 13,201 | |||
| 155,982 | ||||||
| Real Estate Operating Companies (0.4%) | ||||||
| DigitalBridge Group Inc. | 7,317,660 | 108,301 | ||||
| Kennedy-Wilson Holdings Inc. | 5,537,251 | 99,006 | ||||
| *,1 | Seritage Growth Properties Class A | 1,623,385 | 19,724 | |||
| Shares | Market Value• ($000) | |||||
| * | FRP Holdings Inc. | 273,865 | 15,383 | |||
| *,1 | WeWork Inc. | 7,893,023 | 12,550 | |||
| 254,964 | ||||||
| Real Estate Services (3.6%) | ||||||
| * | CBRE Group Inc. Class A | 14,331,530 | 1,225,489 | |||
| * | Jones Lang LaSalle Inc. | 2,138,169 | 395,283 | |||
| * | Zillow Group Inc. Class C | 7,062,314 | 312,225 | |||
| * | Zillow Group Inc. Class A | 2,635,902 | 113,238 | |||
| * | Cushman & Wakefield plc | 6,549,668 | 94,512 | |||
| Newmark Group Inc. Class A | 7,046,602 | 60,389 | ||||
| 1 | eXp World Holdings Inc. | 3,047,437 | 47,510 | |||
| * | Anywhere Real Estate Inc. | 5,101,407 | 43,260 | |||
| * | Compass Inc. Class A | 10,606,305 | 42,637 | |||
| Marcus & Millichap Inc. | 1,160,691 | 42,064 | ||||
| * | Opendoor Technologies Inc. | 18,220,853 | 39,904 | |||
| *,1 | Redfin Corp. | 4,000,946 | 29,927 | |||
| RE/MAX Holdings Inc. Class A | 836,768 | 19,087 | ||||
| Douglas Elliman Inc. | 3,260,615 | 15,195 | ||||
| * | Doma Holdings Inc. | 5,139,837 | 3,649 | |||
| *,1 | Offerpad Solutions Inc. | 2,606,443 | 2,391 | |||
| 2,486,760 | ||||||
| Total Real Estate Management & Development (Cost $3,883,149) | 2,987,278 | |||||
| Shares | Market Value• ($000) | |||||
| Temporary Cash Investments (0.6%) | ||||||
| Money Market Fund (0.6%) | ||||||
| 6,7 | Vanguard Market Liquidity Fund, 4.437% (Cost $399,812) | 3,999,300 | 399,890 | |||
| Total Investments (99.9%) (Cost $65,591,027) | 69,624,602 | |||||
| Other Assets and Liabilities—Net (0.1%) | 48,464 | |||||
| Net Assets (100%) | 69,673,066 | |||||
| Cost is in $000. |
| • | See Note A in Notes to Financial Statements. |
| * | Non-income-producing security. |
| 1 | Includes partial security positions on loan to broker-dealers. The total value of securities on loan is $34,913,000. |
| 2 | Security value determined using significant unobservable inputs. |
| 3 | “Other” represents securities that are not classified by the fund’s benchmark index. |
| 4 | Considered an affiliated company of the fund as the issuer is another member of The Vanguard Group. |
| 5 | Represents a wholly owned subsidiary of the fund. See accompanying financial statements for Vanguard Real Estate II Index Fund's Schedule of Investments. |
| 6 | Affiliated money market fund available only to Vanguard funds and certain trusts and accounts managed by Vanguard. Rate shown is the 7-day yield. |
| 7 | Collateral of $38,046,000 was received for securities on loan. |
| REIT—Real Estate Investment Trust. |
| Over-the-Counter Total Return Swaps | ||||||
| Reference Entity | Termination Date | Counterparty | Notional Amount ($000) | Floating Interest Rate Received (Paid)1 (%) | Value and Unrealized Appreciation ($000) | Value and Unrealized (Depreciation) ($000) |
| American Homes 4 Rent Class A | 8/31/23 | BANA | 31,647 | (4.477) | 4,247 | — |
| Digital Realty Trust Inc. | 8/31/23 | BANA | 37,601 | (4.477) | 5,708 | — |
| Digital Realty Trust Inc. | 1/31/24 | GSI | 28,655 | (4.607) | — | — |
| Equity Residential | 8/31/23 | BANA | 35,400 | (4.477) | 3,042 | — |
| Redfin Corp. | 1/31/24 | GSI | 2,618 | (4.557) | — | — |
| Simon Property Group Inc. | 1/31/24 | GSI | 51,384 | (4.607) | — | — |
| VICI Properties Inc. Class A | 8/31/23 | BANA | 174,960 | (4.877) | 11,054 | — |
| Welltower Inc. | 8/31/23 | BANA | 49,163 | (4.477) | 6,946 | — |
| 30,997 | — | |||||
| 1 | Based on USD Overnight Bank Funding Rate as of the most recent payment date. Floating interest payment received/paid monthly. |
| BANA—Bank of America, N.A. | |
| GSI—Goldman Sachs International. |
| ($000s, except shares, footnotes, and per-share amounts) | Amount |
| Assets | |
| Investments in Securities, at Value1 | |
| Unaffiliated Issuers (Cost $57,813,711) | 60,753,525 |
| Affiliated Issuers (Cost $399,812) | 399,890 |
| Vanguard Real Estate II Index Fund (Cost $7,377,504) | 8,471,187 |
| Total Investments in Securities | 69,624,602 |
| Investment in Vanguard | 2,082 |
| Receivables for Investment Securities Sold | 24,622 |
| Receivables for Accrued Income | 56,541 |
| Receivables for Capital Shares Issued | 21,640 |
| Unrealized Appreciation—Over-the-Counter Swap Contracts | 30,997 |
| Total Assets | 69,760,484 |
| Liabilities | |
| Due to Custodian | 5,465 |
| Payables for Investment Securities Purchased | 7,203 |
| Collateral for Securities on Loan | 38,046 |
| Payables for Capital Shares Redeemed | 33,384 |
| Payables to Vanguard | 3,320 |
| Total Liabilities | 87,418 |
| Net Assets | 69,673,066 |
| 1 Includes $34,913,000 of securities on loan. | |
| Statement of Assets and Liabilities (continued) | |
| At January 31, 2023, net assets consisted of: | |
| ($000s, except shares, footnotes, and per-share amounts) | Amount |
| Paid-in Capital | 68,336,414 |
| Total Distributable Earnings (Loss) | 1,336,652 |
| Net Assets | 69,673,066 |
| Investor Shares—Net Assets | |
| Applicable to 4,205,462 outstanding $.001 par value shares of beneficial interest (unlimited authorization) | 127,243 |
| Net Asset Value Per Share—Investor Shares | $30.26 |
| ETF Shares—Net Assets | |
| Applicable to 404,429,314 outstanding $.001 par value shares of beneficial interest (unlimited authorization) | 36,825,433 |
| Net Asset Value Per Share—ETF Shares | $91.06 |
| Admiral Shares—Net Assets | |
| Applicable to 171,331,723 outstanding $.001 par value shares of beneficial interest (unlimited authorization) | 22,110,207 |
| Net Asset Value Per Share—Admiral Shares | $129.05 |
| Institutional Shares—Net Assets | |
| Applicable to 531,216,655 outstanding $.001 par value shares of beneficial interest (unlimited authorization) | 10,610,183 |
| Net Asset Value Per Share—Institutional Shares | $19.97 |
| Year Ended January 31, 2023 | |
| ($000) | |
| Investment Income | |
| Income | |
| Dividends—Unaffiliated Issuers | 1,564,425 |
| Dividends—Affiliated Issuers | 68,745 |
| Dividends—Vanguard Real Estate II Index Fund | 198,144 |
| Interest—Affiliated Issuers | 6,278 |
| Securities Lending—Net | 2,046 |
| Total Income | 1,839,638 |
| Expenses | |
| The Vanguard Group—Note B | |
| Investment Advisory Services | 1,611 |
| Management and Administrative—Investor Shares | 366 |
| Management and Administrative—ETF Shares | 41,166 |
| Management and Administrative—Admiral Shares | 24,207 |
| Management and Administrative—Institutional Shares | 9,674 |
| Marketing and Distribution—Investor Shares | 9 |
| Marketing and Distribution—ETF Shares | 1,585 |
| Marketing and Distribution—Admiral Shares | 890 |
| Marketing and Distribution—Institutional Shares | 333 |
| Custodian Fees | 169 |
| Auditing Fees | 37 |
| Shareholders’ Reports—Investor Shares | 1 |
| Shareholders’ Reports—ETF Shares | 1,654 |
| Shareholders’ Reports—Admiral Shares | 427 |
| Shareholders’ Reports—Institutional Shares | 181 |
| Trustees’ Fees and Expenses | 25 |
| Other Expenses | 38 |
| Total Expenses | 82,373 |
| Expenses Paid Indirectly | (95) |
| Net Expenses | 82,278 |
| Net Investment Income | 1,757,360 |
| Realized Net Gain (Loss) | |
| Capital Gain Distributions Received—Unaffiliated Issuers | 329,013 |
| Capital Gain Distributions Received—Affiliated Issuers | 2 |
| Capital Gain Distributions Received—Vanguard Real Estate II Index Fund | 90,589 |
| Investment Securities Sold—Unaffiliated Issuers1 | 2,537,306 |
| Investment Securities Sold—Affiliated Issuers2 | 41,663 |
| Investment Securities Sold—Vanguard Real Estate II Index Fund | — |
| Statement of Operations (continued) | |
| Year Ended January 31, 2023 | |
| ($000) | |
| Swap Contracts | (50,078) |
| Realized Net Gain (Loss) | 2,948,495 |
| Change in Unrealized Appreciation (Depreciation) | |
| Investment Securities—Unaffiliated Issuers | (13,306,186) |
| Investment Securities—Affiliated Issuers | 128,233 |
| Investment Securities—Vanguard Real Estate II Index Fund | (1,360,121) |
| Swap Contracts | 30,997 |
| Change in Unrealized Appreciation (Depreciation) | (14,507,077) |
| Net Increase (Decrease) in Net Assets Resulting from Operations | (9,801,222) |
| 1 | Includes $3,058,163,000 of net gain (loss) resulting from in-kind redemptions. |
| 2 | Includes $69,236,000 of net gain (loss) resulting from in-kind redemptions. |
| Year Ended January 31, | ||
| 2023 ($000) | 2022 ($000) | |
| Increase (Decrease) in Net Assets | ||
| Operations | ||
| Net Investment Income | 1,757,360 | 1,487,532 |
| Realized Net Gain (Loss) | 2,948,495 | 2,507,302 |
| Change in Unrealized Appreciation (Depreciation) | (14,507,077) | 14,077,791 |
| Net Increase (Decrease) in Net Assets Resulting from Operations | (9,801,222) | 18,072,625 |
| Distributions | ||
| Net Investment Income and/or Realized Capital Gains | ||
| Investor Shares | (3,184) | (3,637) |
| ETF Shares | (893,338) | (811,715) |
| Admiral Shares | (518,210) | (463,925) |
| Institutional Shares | (253,055) | (220,900) |
| Return of Capital | ||
| Investor Shares | (1,590) | (1,874) |
| ETF Shares | (446,081) | (418,428) |
| Admiral Shares | (258,764) | (239,147) |
| Institutional Shares | (126,361) | (113,871) |
| Total Distributions | (2,500,583) | (2,273,497) |
| Capital Share Transactions | ||
| Investor Shares | (41,427) | (35,113) |
| ETF Shares | (3,046,898) | 6,252,486 |
| Admiral Shares | 34,532 | 1,052,588 |
| Institutional Shares | 306,763 | 221,639 |
| Net Increase (Decrease) from Capital Share Transactions | (2,747,030) | 7,491,600 |
| Total Increase (Decrease) | (15,048,835) | 23,290,728 |
| Net Assets | ||
| Beginning of Period | 84,721,901 | 61,431,173 |
| End of Period | 69,673,066 | 84,721,901 |
| Investor Shares | |||||
| For a Share Outstanding Throughout Each Period | Year Ended January 31, | ||||
| 2023 | 2022 | 2021 | 2020 | 2019 | |
| Net Asset Value, Beginning of Period | $35.37 | $28.23 | $31.21 | $27.69 | $26.40 |
| Investment Operations | |||||
| Net Investment Income1 | .684 | .602 | .586 | .719 | .787 |
| Net Realized and Unrealized Gain (Loss) on Investments | (4.766) | 7.475 | (2.498) | 3.801 | 1.639 |
| Total from Investment Operations | (4.082) | 8.077 | (1.912) | 4.520 | 2.426 |
| Distributions | |||||
| Dividends from Net Investment Income | (.686) | (.620) | (.624) | (.752) | (.851) |
| Distributions from Realized Capital Gains | — | — | — | — | — |
| Return of Capital | (.342) | (.317) | (.444) | (.248) | (.285) |
| Total Distributions | (1.028) | (.937) | (1.068) | (1.000) | (1.136) |
| Net Asset Value, End of Period | $30.26 | $35.37 | $28.23 | $31.21 | $27.69 |
| Total Return2 | -11.39% | 28.73% | -5.88% | 16.59% | 9.53% |
| Ratios/Supplemental Data | |||||
| Net Assets, End of Period (Millions) | $127 | $196 | $188 | $243 | $1,871 |
| Ratio of Total Expenses to Average Net Assets | 0.26%3 | 0.26% | 0.26% | 0.26% | 0.25% |
| Ratio of Net Investment Income to Average Net Assets | 2.18% | 1.77% | 2.18% | 2.48% | 3.02% |
| Portfolio Turnover Rate4 | 7% | 7% | 8% | 6% | 24% |
| 1 | Calculated based on average shares outstanding. |
| 2 | Total returns do not include account service fees that may have applied in the periods shown. Fund prospectuses provide information about any applicable account service fees. |
| 3 | The ratio of expenses to average net assets for the period net of reduction from custody fee offset arrangements was 0.25%. |
| 4 | Excludes the value of portfolio securities received or delivered as a result of in-kind purchases or redemptions of the fund’s capital shares, including ETF Creation Units. |
| ETF Shares | |||||
| For a Share Outstanding Throughout Each Period | Year Ended January 31, | ||||
| 2023 | 2022 | 2021 | 2020 | 2019 | |
| Net Asset Value, Beginning of Period | $106.44 | $84.96 | $93.93 | $83.36 | $79.47 |
| Investment Operations | |||||
| Net Investment Income1 | 2.240 | 1.960 | 1.889 | 2.335 | 2.487 |
| Net Realized and Unrealized Gain (Loss) on Investments | (14.394) | 22.486 | (7.525) | 11.379 | 4.934 |
| Total from Investment Operations | (12.154) | 24.446 | (5.636) | 13.714 | 7.421 |
| Distributions | |||||
| Dividends from Net Investment Income | (2.152) | (1.943) | (1.947) | (2.364) | (2.646) |
| Distributions from Realized Capital Gains | — | — | — | — | — |
| Return of Capital | (1.074) | (1.023) | (1.387) | (.780) | (.885) |
| Total Distributions | (3.226) | (2.966) | (3.334) | (3.144) | (3.531) |
| Net Asset Value, End of Period | $91.06 | $106.44 | $84.96 | $93.93 | $83.36 |
| Total Return | -11.25% | 28.88% | -5.80% | 16.70% | 9.70% |
| Ratios/Supplemental Data | |||||
| Net Assets, End of Period (Millions) | $36,825 | $46,673 | $32,064 | $37,682 | $30,857 |
| Ratio of Total Expenses to Average Net Assets | 0.12%2 | 0.12% | 0.12% | 0.12% | 0.12% |
| Ratio of Net Investment Income to Average Net Assets | 2.38% | 1.90% | 2.33% | 2.60% | 3.15% |
| Portfolio Turnover Rate3 | 7% | 7% | 8% | 6% | 24% |
| 1 | Calculated based on average shares outstanding. |
| 2 | The ratio of expenses to average net assets for the period net of reduction from custody fee offset arrangements was 0.12%. |
| 3 | Excludes the value of portfolio securities received or delivered as a result of in-kind purchases or redemptions of the fund’s capital shares, including ETF Creation Units. |
| Admiral Shares | |||||
| For a Share Outstanding Throughout Each Period | Year Ended January 31, | ||||
| 2023 | 2022 | 2021 | 2020 | 2019 | |
| Net Asset Value, Beginning of Period | $150.85 | $120.40 | $133.12 | $118.14 | $112.63 |
| Investment Operations | |||||
| Net Investment Income1 | 3.201 | 2.761 | 2.677 | 3.315 | 3.507 |
| Net Realized and Unrealized Gain (Loss) on Investments | (20.428) | 31.890 | (10.672) | 16.121 | 7.008 |
| Total from Investment Operations | (17.227) | 34.651 | (7.995) | 19.436 | 10.515 |
| Distributions | |||||
| Dividends from Net Investment Income | (3.050) | (2.770) | (2.759) | (3.350) | (3.751) |
| Distributions from Realized Capital Gains | — | — | — | — | — |
| Return of Capital | (1.523) | (1.431) | (1.966) | (1.106) | (1.254) |
| Total Distributions | (4.573) | (4.201) | (4.725) | (4.456) | (5.005) |
| Net Asset Value, End of Period | $129.05 | $150.85 | $120.40 | $133.12 | $118.14 |
| Total Return2 | -11.26% | 28.91% | -5.74% | 16.73% | 9.69% |
| Ratios/Supplemental Data | |||||
| Net Assets, End of Period (Millions) | $22,110 | $25,764 | $19,702 | $23,274 | $18,223 |
| Ratio of Total Expenses to Average Net Assets | 0.12%3 | 0.12% | 0.12% | 0.12% | 0.11% |
| Ratio of Net Investment Income to Average Net Assets | 2.41% | 1.90% | 2.33% | 2.60% | 3.16% |
| Portfolio Turnover Rate4 | 7% | 7% | 8% | 6% | 24% |
| 1 | Calculated based on average shares outstanding. |
| 2 | Total returns do not include account service fees that may have applied in the periods shown. Fund prospectuses provide information about any applicable account service fees. |
| 3 | The ratio of expenses to average net assets for the period net of reduction from custody fee offset arrangements was 0.12%. |
| 4 | Excludes the value of portfolio securities received or delivered as a result of in-kind purchases or redemptions of the fund’s capital shares, including ETF Creation Units. |
| Institutional Shares | |||||
| For a Share Outstanding Throughout Each Period | Year Ended January 31, | ||||
| 2023 | 2022 | 2021 | 2020 | 2019 | |
| Net Asset Value, Beginning of Period | $23.35 | $18.64 | $20.60 | $18.28 | $17.43 |
| Investment Operations | |||||
| Net Investment Income1 | .500 | .432 | .421 | .518 | .543 |
| Net Realized and Unrealized Gain (Loss) on Investments | (3.168) | 4.933 | (1.646) | 2.496 | 1.085 |
| Total from Investment Operations | (2.668) | 5.365 | (1.225) | 3.014 | 1.628 |
| Distributions | |||||
| Dividends from Net Investment Income | (.475) | (.432) | (.429) | (.522) | (.583) |
| Distributions from Realized Capital Gains | — | — | — | — | — |
| Return of Capital | (.237) | (.223) | (.306) | (.172) | (.195) |
| Total Distributions | (.712) | (.655) | (.735) | (.694) | (.778) |
| Net Asset Value, End of Period | $19.97 | $23.35 | $18.64 | $20.60 | $18.28 |
| Total Return | -11.27% | 28.91% | -5.68% | 16.77% | 9.70% |
| Ratios/Supplemental Data | |||||
| Net Assets, End of Period (Millions) | $10,610 | $12,089 | $9,478 | $10,027 | $8,206 |
| Ratio of Total Expenses to Average Net Assets | 0.10%2 | 0.10% | 0.10% | 0.10% | 0.09% |
| Ratio of Net Investment Income to Average Net Assets | 2.43% | 1.92% | 2.37% | 2.63% | 3.18% |
| Portfolio Turnover Rate3 | 7% | 7% | 8% | 6% | 24% |
| 1 | Calculated based on average shares outstanding. |
| 2 | The ratio of expenses to average net assets for the period net of reduction from custody fee offset arrangements was 0.10%. |
| 3 | Excludes the value of portfolio securities received or delivered as a result of in-kind purchases or redemptions of the fund’s capital shares, including ETF Creation Units. |
| Level 1 ($000) | Level 2 ($000) | Level 3 ($000) | Total ($000) | |
| Investments | ||||
| Assets | ||||
| Common Stocks | 69,224,698 | — | 14 | 69,224,712 |
| Temporary Cash Investments | 399,890 | — | — | 399,890 |
| Total | 69,624,588 | — | 14 | 69,624,602 |
| Derivative Financial Instruments | ||||
| Assets | ||||
| Swap Contracts | — | 30,997 | — | 30,997 |
| Amount ($000) | |
| Paid-in Capital | 3,137,196 |
| Total Distributable Earnings (Loss) | (3,137,196) |
| Amount ($000) | |
| Undistributed Ordinary Income | — |
| Undistributed Long-Term Gains | — |
| Net Unrealized Gains (Losses) | 3,729,779 |
| Capital Loss Carryforwards | (2,572,771) |
| Qualified Late-Year Losses | — |
| Other Temporary Differences | 179,644 |
| Total | 1,336,652 |
| Year Ended January 31, | ||
| 2023 Amount ($000) | 2022 Amount ($000) | |
| Ordinary Income* | 1,667,787 | 1,500,177 |
| Long-Term Capital Gains | — | — |
| Return of Capital | 832,796 | 773,321 |
| Total | 2,500,583 | 2,273,498 |
| * | Includes short-term capital gains, if any. |
| Amount ($000) | |
| Tax Cost | 65,894,823 |
| Gross Unrealized Appreciation | 11,273,876 |
| Gross Unrealized Depreciation | (7,544,097) |
| Net Unrealized Appreciation (Depreciation) | 3,729,779 |
| Year Ended January 31, | |||||
| 2023 | 2022 | ||||
| Amount ($000) | Shares (000) | Amount ($000) | Shares (000) | ||
| Investor Shares | |||||
| Issued | 12,156 | 378 | 40,853 | 1,192 | |
| Issued in Lieu of Cash Distributions | 4,774 | 163 | 5,511 | 161 | |
| Redeemed | (58,357) | (1,875) | (81,477) | (2,463) | |
| Net Increase (Decrease)—Investor Shares | (41,427) | (1,334) | (35,113) | (1,110) | |
| ETF Shares | |||||
| Issued | 6,166,911 | 65,225 | 12,323,320 | 119,786 | |
| Issued in Lieu of Cash Distributions | — | — | — | — | |
| Redeemed | (9,213,809) | (99,300) | (6,070,834) | (58,700) | |
| Net Increase (Decrease)—ETF Shares | (3,046,898) | (34,075) | 6,252,486 | 61,086 | |
| Admiral Shares | |||||
| Issued | 2,666,411 | 20,054 | 4,265,102 | 29,377 | |
| Issued in Lieu of Cash Distributions | 682,639 | 5,494 | 616,726 | 4,188 | |
| Redeemed | (3,314,518) | (25,007) | (3,829,240) | (26,405) | |
| Net Increase (Decrease)—Admiral Shares | 34,532 | 541 | 1,052,588 | 7,160 | |
| Year Ended January 31, | |||||
| 2023 | 2022 | ||||
| Amount ($000) | Shares (000) | Amount ($000) | Shares (000) | ||
| Institutional Shares | |||||
| Issued | 2,009,244 | 97,409 | 2,230,405 | 98,845 | |
| Issued in Lieu of Cash Distributions | 357,630 | 18,606 | 311,998 | 13,695 | |
| Redeemed | (2,060,111) | (102,593) | (2,320,764) | (103,325) | |
| Net Increase (Decrease)—Institutional Shares | 306,763 | 13,422 | 221,639 | 9,215 | |
| Current Period Transactions | ||||||||
| Jan. 31, 2022 Market Value ($000) | Purchases at Cost ($000) | Proceeds from Securities Sold1 ($000) | Realized Net Gain (Loss) ($000) | Change in Unrealized App. (Dep.) ($000) | Income ($000) | Capital Gain Distributions Received ($000) | Jan. 31, 2023 Market Value ($000) | |
| Easterly Government Properties Inc. | 90,343 | 13,288 | 22,120 | (553) | (16,183) | 1,997 | — | NA2 |
| Equity Commonwealth | NA3 | 20,421 | 43,382 | (2,063) | 64 | 5,071 | — | NA2 |
| Hudson Pacific Properties Inc. | NA3 | 16,823 | 30,465 | (18,155) | (68,244) | 6,832 | — | NA2 |
| Vanguard Market Liquidity Fund | 147,613 | NA4 | NA4 | 15 | 55 | 6,278 | 2 | 399,890 |
| Vanguard Real Estate II Index Fund | 9,542,041 | 337,315 | — | — | (1,360,121) | 198,144 | 90,589 | 8,471,187 |
| VICI Properties Inc. | NA3,5 | 594,465 | 424,164 | 62,419 | 212,541 | 54,845 | — | NA2 |
| Total | 9,779,997 | 982,312 | 520,131 | 41,663 | (1,231,888) | 273,167 | 90,591 | 8,871,077 |
| 1 | Does not include adjustments related to return of capital. |
| 2 | Not applicable—at January 31, 2023, the security was still held, but the issuer was no longer an affiliated company of the fund. |
| 3 | Not applicable—at January 31, 2022, the issuer was not an affiliated company of the fund. |
| 4 | Not applicable—purchases and sales are for temporary cash investment purposes. |
| 5 | Not applicable—in April 2022, VICI Properties Inc. acquired MGM Growth Properties LLC. |

| Average Annual Total Returns Periods Ended January 31, 2023 | |||||
| One Year | Five Years | Since Inception (9/26/2017) | Final Value of a $100,000,000 Investment | ||
| Real Estate II Index Fund | -11.23% | 6.70% | 5.67% | $134,285,670 |
| Real Estate Spliced Index | -11.15 | 6.77 | 5.74 | 134,763,810 |
| Dow Jones U.S. Total Stock Market Float Adjusted Index | -8.42 | 8.99 | 10.92 | 174,033,800 |
| Diversified Real Estate Activities | 0.2% |
| Diversified REITs | 2.9 |
| Health Care REITs | 7.9 |
| Hotel & Resort REITs | 2.8 |
| Industrial REITs | 12.4 |
| Office REITs | 5.5 |
| Real Estate Development | 0.3 |
| Real Estate Operating Companies | 0.4 |
| Real Estate Services | 4.1 |
| Residential REITs | 13.6 |
| Retail REITs | 12.6 |
| Specialized REITs | 37.3 |
| Shares | Market Value• ($000) | |||||
| Equity Real Estate Investment Trusts (REITs) (94.9%) | ||||||
| Diversified REITs (2.9%) | ||||||
| WP Carey Inc. | 1,222,290 | 104,542 | ||||
| STORE Capital Corp. | 1,612,144 | 51,927 | ||||
| Essential Properties Realty Trust Inc. | 895,719 | 22,823 | ||||
| Broadstone Net Lease Inc. | 1,097,179 | 19,870 | ||||
| Global Net Lease Inc. | 659,032 | 9,853 | ||||
| American Assets Trust Inc. | 326,198 | 9,284 | ||||
| Alexander & Baldwin Inc. | 461,014 | 9,229 | ||||
| Empire State Realty Trust Inc. Class A | 876,755 | 7,312 | ||||
| Armada Hoffler Properties Inc. | 428,464 | 5,433 | ||||
| iStar Inc. | 541,478 | 5,025 | ||||
| Gladstone Commercial Corp. | 250,489 | 4,256 | ||||
| NexPoint Diversified Real Estate Trust | 200,024 | 2,618 | ||||
| One Liberty Properties Inc. | 106,880 | 2,577 | ||||
| 254,749 | ||||||
| Health Care REITs (7.9%) | ||||||
| Welltower Inc. | 2,936,055 | 220,322 | ||||
| Ventas Inc. | 2,532,696 | 131,219 | ||||
| Healthpeak Properties Inc. | 3,419,232 | 93,960 | ||||
| Healthcare Realty Trust Inc. Class A | 2,411,439 | 51,918 | ||||
| 1 | Medical Properties Trust Inc. | 3,795,895 | 49,157 | |||
| Omega Healthcare Investors Inc. | 1,483,327 | 43,669 | ||||
| Physicians Realty Trust | 1,435,547 | 22,768 | ||||
| Sabra Health Care REIT Inc. | 1,463,753 | 19,761 | ||||
| National Health Investors Inc. | 282,818 | 16,638 | ||||
| CareTrust REIT Inc. | 614,701 | 12,737 | ||||
| LTC Properties Inc. | 256,575 | 9,788 | ||||
| Community Healthcare Trust Inc. | 151,103 | 6,479 | ||||
| Shares | Market Value• ($000) | |||||
| Universal Health Realty Income Trust | 83,070 | 4,553 | ||||
| Global Medical REIT Inc. | 394,880 | 4,435 | ||||
| Diversified Healthcare Trust | 1,510,063 | 1,195 | ||||
| 688,599 | ||||||
| Hotel & Resort REITs (2.8%) | ||||||
| Host Hotels & Resorts Inc. | 4,529,546 | 85,382 | ||||
| Ryman Hospitality Properties Inc. | 332,092 | 30,848 | ||||
| Apple Hospitality REIT Inc. | 1,377,563 | 24,424 | ||||
| Park Hotels & Resorts Inc. | 1,026,200 | 15,095 | ||||
| Sunstone Hotel Investors Inc. | 1,344,618 | 14,777 | ||||
| Pebblebrook Hotel Trust | 832,720 | 13,657 | ||||
| RLJ Lodging Trust | 1,030,971 | 12,959 | ||||
| DiamondRock Hospitality Co. | 1,336,171 | 12,867 | ||||
| Xenia Hotels & Resorts Inc. | 724,666 | 10,798 | ||||
| Service Properties Trust | 1,045,623 | 9,317 | ||||
| Summit Hotel Properties Inc. | 676,855 | 5,767 | ||||
| Chatham Lodging Trust | 294,311 | 4,182 | ||||
| 240,073 | ||||||
| Industrial REITs (12.4%) | ||||||
| Prologis Inc. | 5,848,437 | 756,086 | ||||
| Rexford Industrial Realty Inc. | 1,083,911 | 68,796 | ||||
| EastGroup Properties Inc. | 276,035 | 46,443 | ||||
| Americold Realty Trust Inc. | 1,457,078 | 45,767 | ||||
| First Industrial Realty Trust Inc. | 836,745 | 44,640 | ||||
| STAG Industrial Inc. | 1,135,488 | 40,423 | ||||
| Terreno Realty Corp. | 478,790 | 30,848 | ||||
| LXP Industrial Trust | 1,773,744 | 20,487 | ||||
| Innovative Industrial Properties Inc. | 177,341 | 15,922 | ||||
| Plymouth Industrial REIT Inc. | 253,867 | 5,682 | ||||
| Industrial Logistics Properties Trust | 416,776 | 1,838 | ||||
| 1,076,932 | ||||||
| Shares | Market Value• ($000) | |||||
| Office REITs (5.5%) | ||||||
| Alexandria Real Estate Equities Inc. | 982,123 | 157,866 | ||||
| Boston Properties Inc. | 943,551 | 70,332 | ||||
| Kilroy Realty Corp. | 666,203 | 27,341 | ||||
| Cousins Properties Inc. | 959,195 | 26,301 | ||||
| Vornado Realty Trust | 1,032,690 | 25,187 | ||||
| Highwoods Properties Inc. | 666,545 | 20,243 | ||||
| Corporate Office Properties Trust | 712,501 | 20,000 | ||||
| Douglas Emmett Inc. | 1,114,112 | 18,661 | ||||
| Equity Commonwealth | 705,107 | 17,994 | ||||
| 1 | SL Green Realty Corp. | 407,189 | 16,756 | |||
| JBG SMITH Properties | 653,519 | 13,162 | ||||
| Hudson Pacific Properties Inc. | 897,852 | 10,227 | ||||
| Easterly Government Properties Inc. Class A | 546,152 | 8,870 | ||||
| * | Veris Residential Inc. | 490,802 | 8,491 | |||
| Piedmont Office Realty Trust Inc. Class A | 781,797 | 8,287 | ||||
| Paramount Group Inc. | 1,143,174 | 7,374 | ||||
| Brandywine Realty Trust | 1,084,906 | 7,117 | ||||
| Office Properties Income Trust | 306,675 | 5,263 | ||||
| Orion Office REIT Inc. | 357,915 | 3,454 | ||||
| City Office REIT Inc. | 263,546 | 2,593 | ||||
| Franklin Street Properties Corp. | 590,918 | 1,820 | ||||
| 477,339 | ||||||
| Residential REITs (13.6%) | ||||||
| AvalonBay Communities Inc. | 885,998 | 157,211 | ||||
| Equity Residential | 2,264,001 | 144,104 | ||||
| Invitation Homes Inc. | 3,867,562 | 125,696 | ||||
| Sun Communities Inc. | 781,453 | 122,579 | ||||
| Mid-America Apartment Communities Inc. | 731,459 | 121,949 | ||||
| Essex Property Trust Inc. | 412,599 | 93,276 | ||||
| UDR Inc. | 2,058,674 | 87,679 | ||||
| Equity LifeStyle Properties Inc. | 1,120,051 | 80,397 | ||||
| Camden Property Trust | 641,214 | 79,004 | ||||
| American Homes 4 Rent Class A | 1,982,924 | 67,994 | ||||
| Apartment Income REIT Corp. Class A | 976,919 | 37,377 | ||||
| Independence Realty Trust Inc. | 1,408,056 | 26,514 | ||||
| Elme Communities | 553,414 | 10,626 | ||||
| NexPoint Residential Trust Inc. | 146,387 | 7,392 | ||||
| Apartment Investment & Management Co. Class A | 964,549 | 7,244 | ||||
| Shares | Market Value• ($000) | |||||
| Centerspace | 97,523 | 6,594 | ||||
| UMH Properties Inc. | 331,073 | 5,933 | ||||
| 1,181,569 | ||||||
| Retail REITs (12.6%) | ||||||
| Simon Property Group Inc. | 2,074,197 | 266,451 | ||||
| Realty Income Corp. | 3,913,115 | 265,427 | ||||
| Kimco Realty Corp. | 3,919,129 | 88,024 | ||||
| Regency Centers Corp. | 975,762 | 65,015 | ||||
| National Retail Properties Inc. | 1,122,346 | 53,143 | ||||
| Federal Realty Investment Trust | 461,506 | 51,472 | ||||
| Brixmor Property Group Inc. | 1,898,578 | 44,674 | ||||
| Spirit Realty Capital Inc. | 863,856 | 37,906 | ||||
| Agree Realty Corp. | 505,859 | 37,752 | ||||
| Kite Realty Group Trust | 1,388,585 | 30,132 | ||||
| Phillips Edison & Co. Inc. | 739,322 | 24,782 | ||||
| Macerich Co. | 1,361,425 | 18,706 | ||||
| SITE Centers Corp. | 1,221,116 | 16,668 | ||||
| Tanger Factory Outlet Centers Inc. | 661,005 | 12,632 | ||||
| Retail Opportunity Investments Corp. | 789,232 | 12,494 | ||||
| Urban Edge Properties | 744,040 | 11,719 | ||||
| InvenTrust Properties Corp. | 426,949 | 10,618 | ||||
| Acadia Realty Trust | 601,824 | 9,346 | ||||
| Getty Realty Corp. | 251,894 | 9,176 | ||||
| NETSTREIT Corp. | 318,416 | 6,410 | ||||
| Necessity Retail REIT Inc. Class A | 843,319 | 5,760 | ||||
| RPT Realty | 538,528 | 5,644 | ||||
| Saul Centers Inc. | 90,858 | 3,890 | ||||
| Urstadt Biddle Properties Inc. Class A | 191,345 | 3,593 | ||||
| Alexander's Inc. | 14,595 | 3,463 | ||||
| CBL & Associates Properties Inc. | 80,280 | 2,139 | ||||
| *,2 | Spirit MTA REIT | 257,871 | — | |||
| 1,097,036 | ||||||
| Specialized REITs (37.2%) | ||||||
| American Tower Corp. | 2,950,127 | 659,029 | ||||
| Equinix Inc. | 577,084 | 425,963 | ||||
| Crown Castle Inc. | 2,743,886 | 406,397 | ||||
| Public Storage | 1,001,058 | 304,662 | ||||
| Digital Realty Trust Inc. | 1,821,104 | 208,735 | ||||
| VICI Properties Inc. Class A | 6,102,367 | 208,579 | ||||
| SBA Communications Corp. Class A | 683,548 | 203,376 | ||||
| Weyerhaeuser Co. | 4,690,809 | 161,505 | ||||
| Extra Space Storage Inc. | 848,508 | 133,920 | ||||
| Iron Mountain Inc. | 1,841,970 | 100,535 | ||||
| Gaming & Leisure Properties Inc. | 1,626,169 | 87,098 | ||||
| CubeSmart | 1,422,150 | 65,120 | ||||
| Shares | Market Value• ($000) | |||||
| Lamar Advertising Co. Class A | 552,007 | 58,811 | ||||
| Life Storage Inc. | 534,715 | 57,771 | ||||
| Rayonier Inc. | 927,884 | 33,766 | ||||
| PotlatchDeltic Corp. | 510,642 | 24,996 | ||||
| National Storage Affiliates Trust | 552,342 | 22,535 | ||||
| 1 | EPR Properties | 475,386 | 20,194 | |||
| Outfront Media Inc. | 882,979 | 17,571 | ||||
| Four Corners Property Trust Inc. | 516,003 | 14,840 | ||||
| Uniti Group Inc. | 1,504,029 | 9,911 | ||||
| 1 | Safehold Inc. | 156,502 | 5,471 | |||
| Gladstone Land Corp. | 206,103 | 4,027 | ||||
| 3,234,812 | ||||||
| Total Equity Real Estate Investment Trusts (REITs) (Cost $7,046,202) | 8,251,109 | |||||
| Real Estate Management & Development (4.9%) | ||||||
| Diversified Real Estate Activities (0.1%) | ||||||
| St. Joe Co. | 205,390 | 9,674 | ||||
| RMR Group Inc. Class A | 98,011 | 3,040 | ||||
| 12,714 | ||||||
| Real Estate Development (0.3%) | ||||||
| * | Howard Hughes Corp. | 237,215 | 20,280 | |||
| * | Forestar Group Inc. | 125,880 | 1,873 | |||
| 22,153 | ||||||
| Real Estate Operating Companies (0.4%) | ||||||
| DigitalBridge Group Inc. | 1,038,243 | 15,366 | ||||
| Kennedy-Wilson Holdings Inc. | 785,464 | 14,044 | ||||
| *,1 | Seritage Growth Properties Class A | 230,514 | 2,801 | |||
| * | FRP Holdings Inc. | 38,782 | 2,178 | |||
| *,1 | WeWork Inc. | 1,130,344 | 1,797 | |||
| 36,186 | ||||||
| Real Estate Services (4.1%) | ||||||
| * | CBRE Group Inc. Class A | 2,035,540 | 174,059 | |||
| * | Jones Lang LaSalle Inc. | 303,629 | 56,132 | |||
| * | Zillow Group Inc. Class C | 1,005,072 | 44,434 | |||
| * | Zillow Group Inc. Class A | 372,098 | 15,985 | |||
| Shares | Market Value• ($000) | |||||
| * | Cushman & Wakefield plc | 929,688 | 13,415 | |||
| Newmark Group Inc. Class A | 998,822 | 8,560 | ||||
| 1 | eXp World Holdings Inc. | 432,629 | 6,745 | |||
| * | Anywhere Real Estate Inc. | 724,552 | 6,144 | |||
| * | Compass Inc. Class A | 1,506,201 | 6,055 | |||
| Marcus & Millichap Inc. | 164,344 | 5,956 | ||||
| *,1 | Opendoor Technologies Inc. | 2,593,429 | 5,680 | |||
| *,1 | Redfin Corp. | 617,367 | 4,618 | |||
| RE/MAX Holdings Inc. Class A | 119,118 | 2,717 | ||||
| Douglas Elliman Inc. | 461,492 | 2,150 | ||||
| *,1 | Doma Holdings Inc. | 719,697 | 511 | |||
| *,1 | Offerpad Solutions Inc. | 357,193 | 328 | |||
| 353,489 | ||||||
| Total Real Estate Management & Development (Cost $508,696) | 424,542 | |||||
| Temporary Cash Investments (0.7%) | ||||||
| Money Market Fund (0.7%) | ||||||
| 3,4 | Vanguard Market Liquidity Fund, 4.437% (Cost $58,760) | 587,679 | 58,762 | |||
| Total Investments (100.5%) (Cost $7,613,658) | 8,734,413 | |||||
| Other Assets and Liabilities—Net (-0.5%) | (44,578) | |||||
| Net Assets (100%) | 8,689,835 | |||||
| Cost is in $000. |
| • | See Note A in Notes to Financial Statements. |
| * | Non-income-producing security. |
| 1 | Includes partial security positions on loan to broker-dealers. The total value of securities on loan is $48,513,000. |
| 2 | Security value determined using significant unobservable inputs. |
| 3 | Affiliated money market fund available only to Vanguard funds and certain trusts and accounts managed by Vanguard. Rate shown is the 7-day yield. |
| 4 | Collateral of $51,019,000 was received for securities on loan. |
| REIT—Real Estate Investment Trust. |
| Over-the-Counter Total Return Swaps | ||||||
| Reference Entity | Termination Date | Counterparty | Notional Amount ($000) | Floating Interest Rate Received (Paid)1 (%) | Value and Unrealized Appreciation ($000) | Value and Unrealized (Depreciation) ($000) |
| Americold Realty Trust Inc. | 1/31/24 | GSI | 7,853 | (4.557) | — | — |
| Park Hotels & Resorts Inc. | 1/31/24 | GSI | 5,884 | (4.557) | — | — |
| — | — | |||||
| 1 | Based on USD Overnight Bank Funding Rate as of the most recent payment date. Floating interest payment received/paid monthly. |
| GSI—Goldman Sachs International. |
| ($000s, except shares, footnotes, and per-share amounts) | Amount |
| Assets | |
| Investments in Securities, at Value1 | |
| Unaffiliated Issuers (Cost $7,554,898) | 8,675,651 |
| Affiliated Issuers (Cost $58,760) | 58,762 |
| Total Investments in Securities | 8,734,413 |
| Investment in Vanguard | 296 |
| Cash | 6,315 |
| Receivables for Accrued Income | 7,898 |
| Total Assets | 8,748,922 |
| Liabilities | |
| Payables for Investment Securities Purchased | 7,344 |
| Collateral for Securities on Loan | 51,019 |
| Payables for Capital Shares Redeemed | 428 |
| Payables to Vanguard | 296 |
| Total Liabilities | 59,087 |
| Net Assets | 8,689,835 |
| 1 Includes $48,513,000 of securities on loan. | |
| At January 31, 2023, net assets consisted of: | |
| Paid-in Capital | 7,582,685 |
| Total Distributable Earnings (Loss) | 1,107,150 |
| Net Assets | 8,689,835 |
| Net Assets | |
| Applicable to 397,480,558 outstanding $.001 par value shares of beneficial interest (unlimited authorization) | 8,689,835 |
| Net Asset Value Per Share | $21.86 |
| Year Ended January 31, 2023 | |
| ($000) | |
| Investment Income | |
| Income | |
| Dividends | 218,246 |
| Interest1 | 92 |
| Securities Lending—Net | 235 |
| Total Income | 218,573 |
| Expenses | |
| The Vanguard Group—Note B | |
| Investment Advisory Services | 704 |
| Management and Administrative | 5,890 |
| Marketing and Distribution | 127 |
| Custodian Fees | 79 |
| Auditing Fees | 37 |
| Shareholders’ Reports | — |
| Trustees’ Fees and Expenses | 2 |
| Other Expenses | 18 |
| Total Expenses | 6,857 |
| Expenses Paid Indirectly | (9) |
| Net Expenses | 6,848 |
| Net Investment Income | 211,725 |
| Realized Net Gain (Loss) | |
| Capital Gain Distributions Received | 48,674 |
| Investment Securities Sold1 | 22,717 |
| Swap Contracts | (1,111) |
| Realized Net Gain (Loss) | 70,280 |
| Change in Unrealized Appreciation (Depreciation) | |
| Investment Securities1 | (1,336,365) |
| Swap Contracts | — |
| Change in Unrealized Appreciation (Depreciation) | (1,336,365) |
| Net Increase (Decrease) in Net Assets Resulting from Operations | (1,054,360) |
| 1 | Interest income, realized net gain (loss), and change in unrealized appreciation (depreciation) from an affiliated company of the fund were $92,000, ($3,000), and $2,000, respectively. Purchases and sales are for temporary cash investment purposes. |
| Year Ended January 31, | ||
| 2023 ($000) | 2022 ($000) | |
| Increase (Decrease) in Net Assets | ||
| Operations | ||
| Net Investment Income | 211,725 | 176,897 |
| Realized Net Gain (Loss) | 70,280 | 53,384 |
| Change in Unrealized Appreciation (Depreciation) | (1,336,365) | 1,912,230 |
| Net Increase (Decrease) in Net Assets Resulting from Operations | (1,054,360) | 2,142,511 |
| Distributions | ||
| Net Investment Income and/or Realized Capital Gains | (291,773) | (186,333) |
| Return of Capital | (48,996) | (76,790) |
| Total Distributions | (340,769) | (263,123) |
| Capital Share Transactions | ||
| Issued | 203,267 | — |
| Issued in Lieu of Cash Distributions | 340,769 | 263,123 |
| Redeemed | (1,113) | — |
| Net Increase (Decrease) from Capital Share Transactions | 542,923 | 263,123 |
| Total Increase (Decrease) | (852,206) | 2,142,511 |
| Net Assets | ||
| Beginning of Period | 9,542,041 | 7,399,530 |
| End of Period | 8,689,835 | 9,542,041 |
| For a Share Outstanding Throughout Each Period | Year Ended January 31, | ||||
| 2023 | 2022 | 2021 | 2020 | 2019 | |
| Net Asset Value, Beginning of Period | $25.69 | $20.50 | $22.64 | $20.10 | $19.17 |
| Investment Operations | |||||
| Net Investment Income1 | .558 | .484 | .471 | .571 | .611 |
| Net Realized and Unrealized Gain (Loss) on Investments | (3.493) | 5.427 | (1.808) | 2.752 | 1.176 |
| Total from Investment Operations | (2.935) | 5.911 | (1.337) | 3.323 | 1.787 |
| Distributions | |||||
| Dividends from Net Investment Income | (.528) | (.477) | (.465) | (.590) | (.626) |
| Distributions from Realized Capital Gains | (.238) | (.034) | — | — | — |
| Return of Capital | (.129) | (.210) | (.338) | (.193) | (.231) |
| Total Distributions | (.895) | (.721) | (.803) | (.783) | (.857) |
| Net Asset Value, End of Period | $21.86 | $25.69 | $20.50 | $22.64 | $20.10 |
| Total Return | -11.23% | 28.96% | -5.70% | 16.78% | 9.68% |
| Ratios/Supplemental Data | |||||
| Net Assets, End of Period (Millions) | $8,690 | $9,542 | $7,400 | $7,848 | $6,719 |
| Ratio of Total Expenses to Average Net Assets | 0.08%2 | 0.08% | 0.08% | 0.08% | 0.08% |
| Ratio of Net Investment Income to Average Net Assets | 2.47% | 1.95% | 2.41% | 2.63% | 3.22% |
| Portfolio Turnover Rate | 5%3 | 6% | 4% | 3% | 23% |
| 1 | Calculated based on average shares outstanding. |
| 2 | The ratio of expenses to average net assets for the period net of reduction from custody fee offset arrangements was 0.08%. |
| 3 | Excludes the value of portfolio securities received or delivered as a result of in-kind purchases or redemptions of the fund’s capital shares. |
| Level 1 ($000) | Level 2 ($000) | Level 3 ($000) | Total ($000) | |
| Investments | ||||
| Assets | ||||
| Common Stocks | 8,675,651 | — | — | 8,675,651 |
| Temporary Cash Investments | 58,762 | — | — | 58,762 |
| Total | 8,734,413 | — | — | 8,734,413 |
| Derivative Financial Instruments | ||||
| Assets | ||||
| Swap Contracts | — | — | — | — |
| Amount ($000) | |
| Undistributed Ordinary Income | — |
| Undistributed Long-Term Gains | — |
| Net Unrealized Gains (Losses) | 1,081,493 |
| Capital Loss Carryforwards | — |
| Qualified Late-Year Losses | — |
| Other Temporary Differences | 25,657 |
| Total | 1,107,150 |
| Year Ended January 31, | ||
| 2023 Amount ($000) | 2022 Amount ($000) | |
| Ordinary Income* | 198,902 | 180,753 |
| Long-Term Capital Gains | 92,871 | 5,580 |
| Return of Capital | 48,996 | 76,790 |
| Total | 340,769 | 263,123 |
| * | Includes short-term capital gains, if any. |
| Amount ($000) | |
| Tax Cost | 7,652,920 |
| Gross Unrealized Appreciation | 2,006,428 |
| Gross Unrealized Depreciation | (924,935) |
| Net Unrealized Appreciation (Depreciation) | 1,081,493 |
| Year Ended January 31, | |||
| 2023 Shares (000) | 2022 Shares (000) | ||
| Issued | 9,838 | — | |
| Issued in Lieu of Cash Distributions | 16,244 | 10,506 | |
| Redeemed | (52) | — | |
| Net Increase (Decrease) in Shares Outstanding | 26,030 | 10,506 | |
Philadelphia, Pennsylvania
March 23, 2023
| Matthew Benchener | Thomas M. Rampulla |
| Joseph Brennan | Karin A. Risi |
| Mortimer J. Buckley | Anne E. Robinson |
| Gregory Davis | Michael Rollings |
| John James | Nitin Tandon |
| Chris D. McIsaac | Lauren Valente |

Who Are Deaf or Hard of Hearing > 800-749-7273
All rights reserved.
U.S. Patent No. 6,879,964.
Vanguard Marketing Corporation, Distributor.

Your Fund’s Performance at a Glance | 1 |
Advisor's Report | 2 |
About Your Fund’s Expenses | 5 |
Performance Summary | 7 |
Financial Statements | 9 |
Trustees Approve Advisory Arrangement | 23 |
| • | For the fiscal year ended January 31, 2023, Vanguard Dividend Growth Fund returned –0.76%, outperforming its benchmark’s –1.94% return. |
| • | Despite some relief in midsummer and toward the end of the period, it was a volatile, challenging time for financial markets. Early on, inflation readings across much of the world continued climbing to multidecade highs amid supply chain bottlenecks, rising energy and food prices, and broader price increases in goods and services. Central banks responded by aggressively tightening monetary policy. Later, it appeared that inflation might have peaked, and central banks began slowing their pace of interest rate hikes. |
| • | Sticky inflation, dramatic rate increases, and fears of a recession weighed heavily on sentiment in the stock market. |
| • | Stock selection in the industrial and consumer discretionary sectors helped the Dividend Growth Fund’s relative returns most. Other relative contributors included stock selection in financials as well as an underweight position in the poorly performing information technology sector. The greatest relative detractors included stock selection in health care and materials. |
| Average Annual Total Returns Periods Ended January 31, 2023 | |||
| One Year | Three Years | Five Years | |
| Stocks | |||
| Russell 1000 Index (Large-caps) | -8.55% | 9.66% | 9.38% |
| Russell 2000 Index (Small-caps) | -3.38 | 7.51 | 5.54 |
| Russell 3000 Index (Broad U.S. market) | -8.24 | 9.51 | 9.12 |
| FTSE All-World ex US Index (International) | -5.39 | 4.15 | 1.73 |
| Bonds | |||
| Bloomberg U.S. Aggregate Float Adjusted Index (Broad taxable market) | -8.40% | -2.34% | 0.89% |
| Bloomberg Municipal Bond Index (Broad tax-exempt market) | -3.25 | -0.42 | 2.07 |
| FTSE Three-Month U.S. Treasury Bill Index | 1.87 | 0.78 | 1.29 |
| CPI | |||
| Consumer Price Index | 6.41% | 5.06% | 3.83% |
| • | Based on actual fund return. This section helps you to estimate the actual expenses that you paid over the period. The ”Ending Account Value“ shown is derived from the fund‘s actual return, and the third column shows the dollar amount that would have been paid by an investor who started with $1,000 in the fund. You may use the information here, together with the amount you invested, to estimate the expenses that you paid over the period. |
| • | Based on hypothetical 5% yearly return. This section is intended to help you compare your fund‘s costs with those of other mutual funds. It assumes that the fund had a yearly return of 5% before expenses, but that the expense ratio is unchanged. In this case—because the return used is not the fund’s actual return—the results do not apply to your investment. The example is useful in making comparisons because the Securities and Exchange Commission requires all mutual funds to calculate expenses based on a 5% return. You can assess your fund’s costs by comparing this hypothetical example with the hypothetical examples that appear in shareholder reports of other funds. |
| Six Months Ended January 31, 2023 | |||
| Dividend Growth Fund | Beginning Account Value 7/31/2022 | Ending Account Value 1/31/2023 | Expenses Paid During Period |
| Based on Actual Fund Return | $1,000.00 | $1,019.30 | $1.53 |
| Based on Hypothetical 5% Yearly Return | 1,000.00 | 1,023.69 | 1.53 |
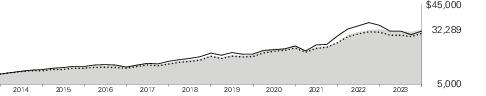
| Average Annual Total Returns Periods Ended January 31, 2023 | |||||
| One Year | Five Years | Ten Years | Final Value of a $10,000 Investment | ||
 | Dividend Growth Fund | -0.76% | 10.84% | 12.44% | $32,289 |
 | Dividend Growth Spliced Index | -1.94 | 9.97 | 11.78 | 30,458 |
 | Dow Jones U.S. Total Stock Market Float Adjusted Index | -8.42 | 8.99 | 12.19 | 31,581 |
| Consumer Discretionary | 12.8% |
| Consumer Staples | 15.1 |
| Financials | 9.2 |
| Health Care | 18.3 |
| Industrials | 20.8 |
| Information Technology | 15.6 |
| Materials | 5.2 |
| Real Estate | 3.0 |
| Shares | Market Value• ($000) | ||
| Common Stocks (97.1%) | |||
| Consumer Discretionary (12.5%) | |||
| TJX Cos. Inc. | 26,774,678 | 2,191,775 | |
| NIKE Inc. Class B | 14,480,107 | 1,843,752 | |
| McDonald's Corp. | 5,996,876 | 1,603,564 | |
| Home Depot Inc. | 3,153,585 | 1,022,298 | |
| 6,661,389 | |||
| Consumer Staples (14.7%) | |||
| Colgate-Palmolive Co. | 21,242,045 | 1,583,170 | |
| PepsiCo Inc. | 8,539,179 | 1,460,370 | |
| Procter & Gamble Co. | 10,138,846 | 1,443,569 | |
| Coca-Cola Co. | 20,650,771 | 1,266,305 | |
| Costco Wholesale Corp. | 2,191,388 | 1,120,106 | |
| Diageo plc | 21,972,876 | 960,788 | |
| 7,834,308 | |||
| Financials (9.0%) | |||
| Marsh & McLennan Cos. Inc. | 8,807,118 | 1,540,453 | |
| Chubb Ltd. | 6,094,600 | 1,386,461 | |
| American Express Co. | 6,899,286 | 1,206,892 | |
| PNC Financial Services Group Inc. | 4,001,572 | 661,980 | |
| 4,795,786 | |||
| Health Care (17.8%) | |||
| UnitedHealth Group Inc. | 3,967,182 | 1,980,378 | |
| Stryker Corp. | 6,905,037 | 1,752,567 | |
| Johnson & Johnson | 8,267,659 | 1,351,101 | |
| Danaher Corp. | 4,766,298 | 1,260,114 | |
| Medtronic plc | 12,684,304 | 1,061,549 | |
| Merck & Co. Inc. | 7,847,792 | 842,931 | |
| Baxter International Inc. | 16,576,448 | 757,378 | |
| Pfizer Inc. | 11,049,853 | 487,962 | |
| 9,493,980 | |||
| Industrials (20.2%) | |||
| Honeywell International Inc. | 8,697,718 | 1,813,300 | |
| Northrop Grumman Corp. | 3,430,395 | 1,536,954 | |
| Shares | Market Value• ($000) | ||
| Raytheon Technologies Corp. | 13,730,740 | 1,371,014 | |
| General Dynamics Corp. | 5,570,714 | 1,298,311 | |
| Union Pacific Corp. | 5,721,760 | 1,168,326 | |
| United Parcel Service Inc. Class B (XNYS) | 5,921,866 | 1,096,907 | |
| Canadian National Railway Co. | 9,141,864 | 1,088,188 | |
| Lockheed Martin Corp. | 1,823,908 | 844,944 | |
| Deere & Co. | 1,417,859 | 599,528 | |
| 10,817,472 | |||
| Information Technology (15.1%) | |||
| Microsoft Corp. | 6,418,825 | 1,590,649 | |
| Visa Inc. Class A | 6,888,638 | 1,585,833 | |
| Mastercard Inc. Class A | 3,732,371 | 1,383,217 | |
| Texas Instruments Inc. | 7,514,084 | 1,331,571 | |
| Accenture plc Class A | 4,558,827 | 1,272,141 | |
| Automatic Data Processing Inc. | 4,143,705 | 935,690 | |
| 8,099,101 | |||
| Materials (5.0%) | |||
| Linde plc | 4,442,957 | 1,470,352 | |
| Ecolab Inc. | 7,904,944 | 1,223,923 | |
| 2,694,275 | |||
| Real Estate (2.8%) | |||
| American Tower Corp. | 3,574,792 | 798,573 | |
| Public Storage | 2,390,232 | 727,443 | |
| 1,526,016 | |||
| Total Common Stocks (Cost $29,177,761) | 51,922,327 | ||
| Temporary Cash Investments (2.7%) | |||
| Money Market Fund (0.0%) | |||
| 1 | Vanguard Market Liquidity Fund, 4.437% | 262 | 26 |
| Face Amount ($000) | Market Value• ($000) | ||
| Repurchase Agreements (2.7%) | |||
| Credit Agricole Securities 4.250%, 2/1/23 (Dated 1/31/23, Repurchase Value $100,112,000, collateralized by U.S. Treasury Inflation Indexed Note/Bond 0.125%, 1/15/30, with a value of $102,102,000) | 100,100 | 100,100 | |
| Natixis SA 4.250%, 2/1/23 (Dated 1/31/23, Repurchase Value $558,866,000, collateralized by Federal Home Loan Bank 2.080%–3.000%, 2/24/37– 9/25/45, U.S. Treasury Inflation Indexed Note/Bond 4.657%, 7/31/23, and U.S. Treasury Note/Bond 0.125%–6.625%, 4/15/23–11/15/52, with a value of $569,976,000) | 558,800 | 558,800 | |
| NatWest Markets plc 4.260%, 2/1/23 (Dated 1/31/23, Repurchase Value $519,461,000, collateralized by U.S. Treasury Bill 0.000%, 2/9/23–1/25/24, and U.S. Treasury Inflation Indexed Note/Bond 4.554%–4.829%, 4/30/23–1/31/25, with a value of $529,788,000) | 519,400 | 519,400 | |
| Face Amount ($000) | Market Value• ($000) | ||
| Societe Generale 4.260%, 2/1/23 (Dated 1/31/23, Repurchase Value $266,232,000, collateralized by Federal National Mortgage Assn. 3.000%–5.000%, 9/1/46–7/1/56, with a value of $271,524,000) | 266,200 | 266,200 | |
| 1,444,500 | |||
| Total Temporary Cash Investments (Cost $1,444,526) | 1,444,526 | ||
| Total Investments (99.8%) (Cost $30,622,287) | 53,366,853 | ||
| Other Assets and Liabilities—Net (0.2%) | 85,254 | ||
| Net Assets (100%) | 53,452,107 | ||
| Cost is in $000. | |||
| • | See Note A in Notes to Financial Statements. |
| 1 | Affiliated money market fund available only to Vanguard funds and certain trusts and accounts managed by Vanguard. Rate shown is the 7-day yield. |
| ($000s, except shares, footnotes, and per-share amounts) | Amount |
| Assets | |
| Investments in Securities, at Value | |
| Unaffiliated Issuers (Cost $30,622,261) | 53,366,827 |
| Affiliated Issuers (Cost $26) | 26 |
| Total Investments in Securities | 53,366,853 |
| Investment in Vanguard | 2,003 |
| Receivables for Investment Securities Sold | 47,594 |
| Receivables for Accrued Income | 69,579 |
| Receivables for Capital Shares Issued | 22,998 |
| Total Assets | 53,509,027 |
| Liabilities | |
| Foreign Currency Due to Custodian, at Value (Proceeds $3) | 3 |
| Due to Custodian | 115 |
| Payables to Investment Advisor | 19,078 |
| Payables for Capital Shares Redeemed | 34,467 |
| Payables to Vanguard | 3,257 |
| Total Liabilities | 56,920 |
| Net Assets | 53,452,107 |
| At January 31, 2023, net assets consisted of: | |
| Paid-in Capital | 30,645,277 |
| Total Distributable Earnings (Loss) | 22,806,830 |
| Net Assets | 53,452,107 |
| Net Assets | |
| Applicable to 1,509,222,120 outstanding $.001 par value shares of beneficial interest (unlimited authorization) | 53,452,107 |
| Net Asset Value Per Share | $35.42 |
| Year Ended January 31, 2023 | |
| ($000) | |
| Investment Income | |
| Income | |
| Dividends1 | 1,010,865 |
| Interest2 | 27,212 |
| Securities Lending—Net | 1 |
| Total Income | 1,038,078 |
| Expenses | |
| Investment Advisory Fees—Note B | |
| Basic Fee | 68,639 |
| Performance Adjustment | 14,424 |
| The Vanguard Group—Note C | |
| Management and Administrative | 69,964 |
| Marketing and Distribution | 2,771 |
| Custodian Fees | 273 |
| Auditing Fees | 28 |
| Shareholders’ Reports | 568 |
| Trustees’ Fees and Expenses | 18 |
| Other Expenses | 16 |
| Total Expenses | 156,701 |
| Expenses Paid Indirectly | (27) |
| Net Expenses | 156,674 |
| Net Investment Income | 881,404 |
| Realized Net Gain (Loss) | |
| Investment Securities Sold2 | 952,240 |
| Foreign Currencies | (1,508) |
| Realized Net Gain (Loss) | 950,732 |
| Change in Unrealized Appreciation (Depreciation) of Investment Securities2 | (2,275,243) |
| Net Increase (Decrease) in Net Assets Resulting from Operations | (443,107) |
| 1 | Dividends are net of foreign withholding taxes of $3,080,000. |
| 2 | Interest income, realized net gain (loss), and change in unrealized appreciation (depreciation) from an affiliated company of the fund were $0, $0, and less than $1,000, respectively. Purchases and sales are for temporary cash investment purposes. |
| Year Ended January 31, | ||
| 2023 ($000) | 2022 ($000) | |
| Increase (Decrease) in Net Assets | ||
| Operations | ||
| Net Investment Income | 881,404 | 808,227 |
| Realized Net Gain (Loss) | 950,732 | 3,426,528 |
| Change in Unrealized Appreciation (Depreciation) | (2,275,243) | 7,167,222 |
| Net Increase (Decrease) in Net Assets Resulting from Operations | (443,107) | 11,401,977 |
| Distributions | ||
| Total Distributions | (3,115,838) | (2,973,671) |
| Capital Share Transactions | ||
| Issued | 6,800,227 | 5,053,981 |
| Issued in Lieu of Cash Distributions | 2,759,975 | 2,627,602 |
| Redeemed | (6,734,733) | (7,022,848) |
| Net Increase (Decrease) from Capital Share Transactions | 2,825,469 | 658,735 |
| Total Increase (Decrease) | (733,476) | 9,087,041 |
| Net Assets | ||
| Beginning of Period | 54,185,583 | 45,098,542 |
| End of Period | 53,452,107 | 54,185,583 |
| For a Share Outstanding Throughout Each Period | Year Ended January 31, | ||||
| 2023 | 2022 | 2021 | 2020 | 2019 | |
| Net Asset Value, Beginning of Period | $37.85 | $31.82 | $30.63 | $26.03 | $27.85 |
| Investment Operations | |||||
| Net Investment Income1 | .596 | .576 | .557 | .536 | .520 |
| Net Realized and Unrealized Gain (Loss) on Investments | (.893) | 7.593 | 1.572 | 5.499 | (.178) |
| Total from Investment Operations | (.297) | 8.169 | 2.129 | 6.035 | .342 |
| Distributions | |||||
| Dividends from Net Investment Income | (.590) | (.574) | (.539) | (.525) | (.526) |
| Distributions from Realized Capital Gains | (1.543) | (1.565) | (.400) | (.910) | (1.636) |
| Total Distributions | (2.133) | (2.139) | (.939) | (1.435) | (2.162) |
| Net Asset Value, End of Period | $35.42 | $37.85 | $31.82 | $30.63 | $26.03 |
| Total Return2 | -0.76% | 25.66% | 7.03% | 23.33% | 1.63% |
| Ratios/Supplemental Data | |||||
| Net Assets, End of Period (Millions) | $53,452 | $54,186 | $45,099 | $43,024 | $32,856 |
| Ratio of Total Expenses to Average Net Assets3 | 0.30%4 | 0.27% | 0.26% | 0.27% | 0.22% |
| Ratio of Net Investment Income to Average Net Assets | 1.68% | 1.56% | 1.85% | 1.82% | 1.93% |
| Portfolio Turnover Rate | 11% | 15% | 15% | 17% | 23% |
| 1 | Calculated based on average shares outstanding. |
| 2 | Total returns do not include account service fees that may have applied in the periods shown. Fund prospectuses provide information about any applicable account service fees. |
| 3 | Includes performance-based investment advisory fee increases (decreases) of 0.03%, (0.00%), (0.01%), 0.00%, and (0.05%). |
| 4 | The ratio of expenses to average net assets for the period net of reduction from custody fee offset and broker commission abatement arrangements was 0.30%. |
| A. | The following significant accounting policies conform to generally accepted accounting principles for U.S. investment companies. The fund consistently follows such policies in preparing its financial statements. |
| B. | Wellington Management Company llp provides investment advisory services to the fund for a fee calculated at an annual percentage rate of average net assets. The basic fee is subject to quarterly adjustments based on the fund’s performance relative to the NASDAQ US Dividend Achievers Select Index for periods prior to September 20, 2021, and to the current benchmark S&P U.S. Dividend Growers Index, beginning September 20, 2021, for the preceding three years. The benchmark change will be fully phased in by October 2024. For the year ended January 31, 2023, the investment advisory fee represented an effective annual basic rate of 0.13% of the fund’s average net assets, before a net increase of $14,424,000 (0.03%) based on performance. |
| C. | In accordance with the terms of a Funds' Service Agreement (the “FSA”) between Vanguard and the fund, Vanguard furnishes to the fund corporate management, administrative, marketing, and distribution services at Vanguard’s cost of operations (as defined by the FSA). These costs of operations are allocated to the fund based on methods and guidelines approved by the board of trustees and are generally settled twice a month. |
| D. | The fund has asked its investment advisor to direct certain security trades, subject to obtaining the best price and execution, to brokers who have agreed to rebate to the fund part of the commissions generated. Such rebates are used solely to reduce the fund’s management and |
| E. | Various inputs may be used to determine the value of the fund’s investments. These inputs are summarized in three broad levels for financial statement purposes. The inputs or methodologies used to value securities are not necessarily an indication of the risk associated with investing in those securities. |
| Level 1 ($000) | Level 2 ($000) | Level 3 ($000) | Total ($000) | |
| Investments | ||||
| Assets | ||||
| Common Stocks | 50,961,539 | 960,788 | — | 51,922,327 |
| Temporary Cash Investments | 26 | 1,444,500 | — | 1,444,526 |
| Total | 50,961,565 | 2,405,288 | — | 53,366,853 |
| F. | Permanent differences between book-basis and tax-basis components of net assets are reclassified among capital accounts in the financial statements to reflect their tax character. These reclassifications have no effect on net assets or net asset value per share. As of period end, permanent differences primarily attributable to the accounting for applicable foreign currency transactions and distributions in connection with fund share redemptions were reclassified between the following accounts: |
| Amount ($000) | |
| Paid-in Capital | 76,043 |
| Total Distributable Earnings (Loss) | (76,043) |
| Amount ($000) | |
| Undistributed Ordinary Income | 65,688 |
| Undistributed Long-Term Gains | — |
| Capital Loss Carryforwards | — |
| Qualified Late-Year Losses | — |
| Net Unrealized Gains (Losses) | 22,741,142 |
| Year Ended January 31, | ||
| 2023 Amount ($000) | 2022 Amount ($000) | |
| Ordinary Income* | 988,587 | 1,045,281 |
| Long-Term Capital Gains | 2,127,251 | 1,928,390 |
| Total | 3,115,838 | 2,973,671 |
| * | Includes short-term capital gains, if any. |
| Amount ($000) | |
| Tax Cost | 30,625,711 |
| Gross Unrealized Appreciation | 23,682,241 |
| Gross Unrealized Depreciation | (941,099) |
| Net Unrealized Appreciation (Depreciation) | 22,741,142 |
| G. | During the year ended January 31, 2023, the fund purchased $5,830,917,000 of investment securities and sold $6,366,263,000 of investment securities, other than temporary cash investments. |
| H. | Capital shares issued and redeemed were: |
| Year Ended January 31, | ||
| 2023 Shares (000) | 2022 Shares (000) | |
| Issued | 191,019 | 137,831 |
| Issued in Lieu of Cash Distributions | 76,943 | 68,554 |
| Redeemed | (190,197) | (192,414) |
| Net Increase (Decrease) in Shares Outstanding | 77,765 | 13,971 |
| I. | Management has determined that no events or transactions occurred subsequent to January 31, 2023, that would require recognition or disclosure in these financial statements. |
Philadelphia, Pennsylvania
March 23, 2023
| Matthew Benchener | Thomas M. Rampulla |
| Joseph Brennan | Karin A. Risi |
| Mortimer J. Buckley | Anne E. Robinson |
| Gregory Davis | Michael Rollings |
| John James | Nitin Tandon |
| Chris D. Mclsaac | Lauren Valente |

All rights reserved.
Vanguard Marketing Corporation, Distributor.

Your Fund’s Performance at a Glance | 1 |
About Your Fund’s Expenses | 2 |
Performance Summary | 4 |
Financial Statements | 7 |
| • | For the 12 months ended January 31, 2023, Vanguard Dividend Appreciation Index Fund returned –2.02% for both ETF Shares (based on net asset value) and Admiral Shares. Those results were in line with the –1.94% return of its benchmark index after taking into account the cost of running the fund. |
| • | Despite some relief in midsummer and toward the end of the period, it was a volatile, challenging time for financial markets. Early on, inflation readings across much of the world continued climbing to multidecade highs amid supply chain bottlenecks, rising energy and food prices, and broader price increases in goods and services. Central banks responded by aggressively tightening monetary policy. Later, it appeared that inflation might have peaked, and central banks began slowing their pace of interest rate hikes. |
| • | Sticky inflation, dramatic rate hikes, and fears of a recession weighed heavily on sentiment in the stock market. |
| • | From a sector perspective, the largest contributors to the fund’s performance were industrials and health care. Information technology, consumer discretionary, and communication services detracted most. |
| Average Annual Total Returns Periods Ended January 31, 2023 | |||
| One Year | Three Years | Five Years | |
| Stocks | |||
| Russell 1000 Index (Large-caps) | -8.55% | 9.66% | 9.38% |
| Russell 2000 Index (Small-caps) | -3.38 | 7.51 | 5.54 |
| Russell 3000 Index (Broad U.S. market) | -8.24 | 9.51 | 9.12 |
| FTSE All-World ex US Index (International) | -5.39 | 4.15 | 1.73 |
| Bonds | |||
| Bloomberg U.S. Aggregate Float Adjusted Index (Broad taxable market) | -8.40% | -2.34% | 0.89% |
| Bloomberg Municipal Bond Index (Broad tax-exempt market) | -3.25 | -0.42 | 2.07 |
| FTSE Three-Month U.S. Treasury Bill Index | 1.87 | 0.78 | 1.29 |
| CPI | |||
| Consumer Price Index | 6.41% | 5.06% | 3.83% |
| • | Based on actual fund return. This section helps you to estimate the actual expenses that you paid over the period. The ”Ending Account Value“ shown is derived from the fund‘s actual return, and the third column shows the dollar amount that would have been paid by an investor who started with $1,000 in the fund. You may use the information here, together with the amount you invested, to estimate the expenses that you paid over the period. |
| • | Based on hypothetical 5% yearly return. This section is intended to help you compare your fund‘s costs with those of other mutual funds. It assumes that the fund had a yearly return of 5% before expenses, but that the expense ratio is unchanged. In this case—because the return used is not the fund’s actual return—the results do not apply to your investment. The example is useful in making comparisons because the Securities and Exchange Commission requires all mutual funds to calculate expenses based on a 5% return. You can assess your fund’s costs by comparing this hypothetical example with the hypothetical examples that appear in shareholder reports of other funds. |
| Six Months Ended January 31, 2023 | |||
| Beginning Account Value 7/31/2022 | Ending Account Value 1/31/2023 | Expenses Paid During Period | |
| Based on Actual Fund Return | |||
| Dividend Appreciation Index Fund | |||
| ETF Shares | $1,000.00 | $1,031.00 | $0.31 |
| Admiral™ Shares | 1,000.00 | 1,031.10 | 0.41 |
| Based on Hypothetical 5% Yearly Return | |||
| Dividend Appreciation Index Fund | |||
| ETF Shares | $1,000.00 | $1,024.90 | $0.31 |
| Admiral Shares | 1,000.00 | 1,024.80 | 0.41 |
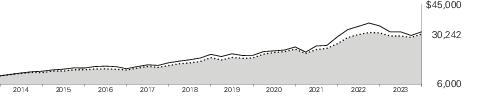
| Average Annual Total Returns Periods Ended January 31, 2023 | |||||
| One Year | Five Years | Ten Years | Final Value of a $10,000 Investment | ||
 | Dividend Appreciation Index Fund ETF Shares Net Asset Value | -2.02% | 9.89% | 11.70% | $30,242 |
| Dividend Appreciation Index Fund ETF Shares Market Price | -2.02 | 9.88 | 11.70 | 30,235 | |
 | Spliced S&P U.S. Dividend Growers Index | -1.94 | 9.97 | 11.78 | 30,458 |
 | Dow Jones U.S. Total Stock Market Float Adjusted Index | -8.42 | 8.99 | 12.19 | 31,581 |
| One Year | Five Years | Since Inception (12/19/2013) | Final Value of a $10,000 Investment | ||
| Dividend Appreciation Index Fund Admiral Shares | -2.02% | 9.88% | 10.74% | $25,357 | |
| Spliced S&P U.S. Dividend Growers Index | -1.94 | 9.97 | 10.83 | 25,533 | |
| Dow Jones U.S. Total Stock Market Float Adjusted Index | -8.42 | 8.99 | 10.84 | 25,566 | |
| One Year | Five Years | Ten Years | |
| Dividend Appreciation Index Fund ETF Shares Market Price | -2.02% | 60.20% | 202.35% |
| Dividend Appreciation Index Fund ETF Shares Net Asset Value | -2.02 | 60.27 | 202.42 |
| Spliced S&P U.S. Dividend Growers Index | -1.94 | 60.85 | 204.58 |
| Communication Services | 1.9% |
| Consumer Discretionary | 9.7 |
| Consumer Staples | 12.9 |
| Energy | 0.1 |
| Financials | 15.6 |
| Health Care | 15.1 |
| Industrials | 13.3 |
| Information Technology | 23.3 |
| Materials | 4.9 |
| Utilities | 3.2 |
| Shares | Market Value• ($000) | ||
| Common Stocks (99.7%) | |||
| Communication Services (1.8%) | |||
| Comcast Corp. Class A | 27,613,767 | 1,086,602 | |
| Activision Blizzard Inc. | 4,523,310 | 346,350 | |
| John Wiley & Sons Inc. Class A | 272,740 | 12,491 | |
| 1,445,443 | |||
| Consumer Discretionary (9.7%) | |||
| Home Depot Inc. | 6,570,662 | 2,130,011 | |
| McDonald's Corp. | 4,651,251 | 1,243,744 | |
| NIKE Inc. Class B | 8,009,526 | 1,019,853 | |
| Lowe's Cos. Inc. | 4,051,158 | 843,654 | |
| Starbucks Corp. | 7,478,275 | 816,179 | |
| Target Corp. | 2,977,937 | 512,622 | |
| Tractor Supply Co. | 701,370 | 159,905 | |
| Genuine Parts Co. | 895,249 | 150,241 | |
| Best Buy Co. Inc. | 1,301,429 | 115,463 | |
| Pool Corp. | 247,755 | 95,537 | |
| Service Corp. International | 978,218 | 72,535 | |
| VF Corp. | 2,118,967 | 65,561 | |
| Williams-Sonoma Inc. | 432,285 | 58,332 | |
| Whirlpool Corp. | 355,766 | 55,353 | |
| Churchill Downs Inc. | 209,193 | 51,901 | |
| Lithia Motors Inc. Class A | 173,244 | 45,598 | |
| Gentex Corp. | 1,487,048 | 43,883 | |
| Polaris Inc. | 346,965 | 39,845 | |
| Thor Industries Inc. | 340,457 | 32,456 | |
| Monro Inc. | 199,455 | 10,152 | |
| Dillard's Inc. Class A | 23,185 | 9,119 | |
| Aaron's Co. Inc. | 196,562 | 2,880 | |
| 7,574,824 | |||
| Consumer Staples (12.9%) | |||
| Procter & Gamble Co. | 15,192,759 | 2,163,145 | |
| Coca-Cola Co. | 24,717,257 | 1,515,662 | |
| PepsiCo Inc. | 8,744,393 | 1,495,466 | |
| Costco Wholesale Corp. | 2,800,786 | 1,431,594 | |
| Walmart Inc. | 9,010,574 | 1,296,351 | |
| Colgate-Palmolive Co. | 5,305,038 | 395,384 | |
| Archer-Daniels-Midland Co. | 3,489,293 | 289,088 | |
| Sysco Corp. | 3,250,580 | 251,790 | |
| Hershey Co. | 933,151 | 209,586 | |
| Kroger Co. | 3,183,052 | 142,060 | |
| Church & Dwight Co. Inc. | 1,561,422 | 126,257 | |
| Tyson Foods Inc. Class A | 1,853,906 | 121,894 | |
| Shares | Market Value• ($000) | ||
| McCormick & Co. Inc. | 1,588,681 | 119,342 | |
| Clorox Co. | 782,161 | 113,171 | |
| J M Smucker Co. | 676,637 | 103,390 | |
| Hormel Foods Corp. | 1,837,992 | 83,279 | |
| Brown-Forman Corp. Class B | 1,160,944 | 77,296 | |
| Casey's General Stores Inc. | 236,801 | 55,864 | |
| Ingredion Inc. | 416,040 | 42,769 | |
| Lancaster Colony Corp. | 125,599 | 24,104 | |
| WD-40 Co. | 86,932 | 15,173 | |
| J & J Snack Foods Corp. | 94,985 | 13,611 | |
| Nu Skin Enterprises Inc. Class A | 316,609 | 13,576 | |
| Andersons Inc. | 201,474 | 7,410 | |
| SpartanNash Co. | 222,713 | 7,056 | |
| Tootsie Roll Industries Inc. | 114,668 | 5,129 | |
| 10,119,447 | |||
| Energy (0.1%) | |||
| Texas Pacific Land Corp. | 39,115 | 78,068 | |
| Financials (15.6%) | |||
| JPMorgan Chase & Co. | 18,628,254 | 2,607,210 | |
| S&P Global Inc. | 2,114,964 | 792,985 | |
| Goldman Sachs Group Inc. | 2,150,787 | 786,779 | |
| BlackRock Inc. | 955,302 | 725,275 | |
| Chubb Ltd. | 2,636,055 | 599,676 | |
| Marsh & McLennan Cos. Inc. | 3,150,177 | 550,997 | |
| Aon plc Class A (XNYS) | 1,347,779 | 429,510 | |
| PNC Financial Services Group Inc. | 2,576,613 | 426,249 | |
| Truist Financial Corp. | 8,423,179 | 416,021 | |
| CME Group Inc. | 2,284,797 | 403,632 | |
| Moody's Corp. | 1,000,827 | 323,017 | |
| Travelers Cos. Inc. | 1,517,367 | 289,999 | |
| Aflac Inc. | 3,644,302 | 267,856 | |
| Arthur J Gallagher & Co. | 1,331,087 | 260,520 | |
| Bank of New York Mellon Corp. | 4,795,012 | 242,484 | |
| Ameriprise Financial Inc. | 681,537 | 238,620 | |
| Allstate Corp. | 1,720,154 | 220,988 | |
| State Street Corp. | 2,327,197 | 212,543 | |
| Discover Financial Services | 1,765,287 | 206,062 | |
| T Rowe Price Group Inc. | 1,391,122 | 162,024 | |
| Fifth Third Bancorp | 4,358,398 | 158,166 | |
| Shares | Market Value• ($000) | ||
| Raymond James Financial Inc. | 1,218,991 | 137,466 | |
| Cincinnati Financial Corp. | 998,058 | 112,930 | |
| FactSet Research Systems Inc. | 240,838 | 101,860 | |
| W R Berkley Corp. | 1,297,106 | 90,979 | |
| Brown & Brown Inc. | 1,492,010 | 87,372 | |
| MarketAxess Holdings Inc. | 238,770 | 86,877 | |
| Cboe Global Markets Inc. | 673,358 | 82,742 | |
| Globe Life Inc. | 574,418 | 69,418 | |
| Reinsurance Group of America Inc. | 427,474 | 64,878 | |
| American Financial Group Inc. | 443,756 | 63,275 | |
| RenaissanceRe Holdings Ltd. | 290,161 | 56,782 | |
| Cullen/Frost Bankers Inc. | 406,443 | 52,951 | |
| Commerce Bancshares Inc. | 728,238 | 48,472 | |
| Assurant Inc. | 335,268 | 44,453 | |
| Prosperity Bancshares Inc. | 578,774 | 43,906 | |
| SEI Investments Co. | 656,839 | 41,006 | |
| Erie Indemnity Co. Class A | 158,865 | 38,819 | |
| SouthState Corp. | 484,312 | 38,551 | |
| Morningstar Inc. | 158,604 | 38,522 | |
| Primerica Inc. | 234,536 | 37,936 | |
| Lincoln National Corp. | 1,001,402 | 35,480 | |
| RLI Corp. | 256,790 | 34,012 | |
| Bank OZK | 701,499 | 32,037 | |
| Axis Capital Holdings Ltd. | 487,492 | 30,502 | |
| Hanover Insurance Group Inc. | 225,805 | 30,389 | |
| Evercore Inc. Class A | 227,839 | 29,576 | |
| First Financial Bankshares Inc. | 822,798 | 29,308 | |
| Home BancShares Inc. | 1,203,734 | 28,733 | |
| UMB Financial Corp. | 276,551 | 24,942 | |
| Assured Guaranty Ltd. | 379,580 | 23,762 | |
| Independent Bank Corp. (XNGS) | 290,859 | 23,179 | |
| American Equity Investment Life Holding Co. | 440,884 | 21,008 | |
| Community Bank System Inc. | 342,454 | 19,763 | |
| BOK Financial Corp. | 185,771 | 18,670 | |
| Simmons First National Corp. Class A | 824,687 | 18,399 | |
| Atlantic Union Bankshares Corp. | 472,929 | 18,298 | |
| First Merchants Corp. | 383,048 | 16,333 | |
| International Bancshares Corp. | 333,009 | 15,608 | |
| Towne Bank | 421,317 | 12,838 | |
| Cohen & Steers Inc. | 157,970 | 11,606 | |
| Lakeland Financial Corp. | 160,524 | 11,351 | |
| Stock Yards Bancorp Inc. | 184,657 | 11,072 | |
| Sandy Spring Bancorp Inc. | 284,640 | 9,621 | |
| Westamerica BanCorp | 171,923 | 9,552 | |
| BancFirst Corp. | 108,958 | 9,385 |
| Shares | Market Value• ($000) | ||
| Horace Mann Educators Corp. | 259,732 | 9,249 | |
| Lakeland Bancorp Inc. | 421,266 | 8,118 | |
| Federal Agricultural Mortgage Corp. Class C | 57,702 | 7,673 | |
| Southside Bancshares Inc. | 196,604 | 7,447 | |
| Tompkins Financial Corp. | 81,380 | 6,130 | |
| 1st Source Corp. | 107,205 | 5,273 | |
| Horizon Bancorp Inc. | 244,500 | 3,824 | |
| First Financial Corp. | 70,355 | 3,160 | |
| Bank of Marin Bancorp | 93,815 | 2,859 | |
| Southern Missouri Bancorp Inc. | 47,917 | 2,320 | |
| 12,241,285 | |||
| Health Care (15.0%) | |||
| UnitedHealth Group Inc. | 5,933,763 | 2,962,075 | |
| Johnson & Johnson | 16,603,468 | 2,713,339 | |
| Abbott Laboratories | 11,073,306 | 1,224,154 | |
| Bristol-Myers Squibb Co. | 13,749,187 | 998,878 | |
| Elevance Health Inc. | 1,516,652 | 758,311 | |
| Medtronic plc | 8,449,183 | 707,112 | |
| Stryker Corp. | 2,139,336 | 542,985 | |
| Becton Dickinson and Co. | 1,826,997 | 460,805 | |
| Humana Inc. | 804,221 | 411,520 | |
| McKesson Corp. | 918,053 | 347,648 | |
| AmerisourceBergen Corp. Class A | 1,021,618 | 172,613 | |
| STERIS plc | 632,926 | 130,705 | |
| West Pharmaceutical Services Inc. | 470,147 | 124,871 | |
| Quest Diagnostics Inc. | 745,608 | 110,708 | |
| Chemed Corp. | 94,400 | 47,685 | |
| Ensign Group Inc. | 353,926 | 33,004 | |
| Perrigo Co. plc | 857,169 | 32,075 | |
| Embecta Corp. | 366,604 | 9,675 | |
| Atrion Corp. | 8,508 | 5,848 | |
| LeMaitre Vascular Inc. | 120,171 | 5,670 | |
| National HealthCare Corp. | 85,864 | 5,112 | |
| 11,804,793 | |||
| Industrials (13.2%) | |||
| Honeywell International Inc. | 4,285,714 | 893,486 | |
| United Parcel Service Inc. Class B (XNYS) | 4,635,232 | 858,584 | |
| Caterpillar Inc. | 3,304,833 | 833,776 | |
| Union Pacific Corp. | 3,940,991 | 804,711 | |
| Lockheed Martin Corp. | 1,499,958 | 694,871 | |
| Illinois Tool Works Inc. | 1,774,726 | 418,906 | |
| Northrop Grumman Corp. | 933,399 | 418,200 | |
| CSX Corp. | 13,353,476 | 412,889 | |
| Eaton Corp. plc | 2,526,016 | 409,745 | |
| Waste Management Inc. | 2,372,632 | 367,117 | |
| Emerson Electric Co. | 3,780,281 | 341,057 | |
| General Dynamics Corp. | 1,437,869 | 335,110 | |
| L3Harris Technologies Inc. | 1,208,865 | 259,688 | |
| Cintas Corp. | 546,182 | 242,363 | |
| Cummins Inc. | 899,065 | 224,353 | |
| Rockwell Automation Inc. | 727,792 | 205,259 | |
| Fastenal Co. | 3,635,751 | 183,787 | |
| Shares | Market Value• ($000) | ||
| WW Grainger Inc. | 285,537 | 168,318 | |
| Republic Services Inc. Class A | 1,306,518 | 163,080 | |
| Dover Corp. | 891,325 | 135,330 | |
| Xylem Inc. | 1,144,277 | 119,016 | |
| IDEX Corp. | 478,563 | 114,702 | |
| Expeditors International of Washington Inc. | 1,010,174 | 109,250 | |
| JB Hunt Transport Services Inc. | 526,403 | 99,517 | |
| Snap-on Inc. | 339,359 | 84,409 | |
| Stanley Black & Decker Inc. | 939,644 | 83,920 | |
| Nordson Corp. | 340,933 | 82,949 | |
| Carlisle Cos. Inc. | 328,815 | 82,487 | |
| Hubbell Inc. Class B | 340,998 | 78,058 | |
| Toro Co. | 672,355 | 74,981 | |
| CH Robinson Worldwide Inc. | 746,451 | 74,772 | |
| Graco Inc. | 1,069,831 | 73,091 | |
| Allegion plc | 558,063 | 65,600 | |
| Lincoln Electric Holdings Inc. | 366,850 | 61,216 | |
| Robert Half International Inc. | 700,456 | 58,810 | |
| Regal Rexnord Corp. | 420,714 | 58,563 | |
| HEICO Corp. Class A | 437,841 | 58,531 | |
| Pentair plc | 1,044,662 | 57,853 | |
| A O Smith Corp. | 816,921 | 55,306 | |
| Lennox International Inc. | 204,388 | 53,268 | |
| Donaldson Co. Inc. | 778,589 | 48,545 | |
| HEICO Corp. | 254,093 | 43,437 | |
| MDU Resources Group Inc. | 1,294,001 | 39,998 | |
| Applied Industrial Technologies Inc. | 245,181 | 35,112 | |
| MSA Safety Inc. | 233,672 | 31,871 | |
| Ryder System Inc. | 319,143 | 30,130 | |
| ManpowerGroup Inc. | 321,079 | 27,985 | |
| GATX Corp. | 224,367 | 25,679 | |
| Insperity Inc. | 227,690 | 25,171 | |
| Franklin Electric Co. Inc. | 247,502 | 22,349 | |
| Hillenbrand Inc. | 442,593 | 20,740 | |
| ABM Industries Inc. | 420,179 | 19,711 | |
| Brady Corp. Class A | 298,733 | 15,973 | |
| McGrath RentCorp. | 153,786 | 15,308 | |
| Trinity Industries Inc. | 521,841 | 15,013 | |
| Griffon Corp. | 304,797 | 12,460 | |
| Lindsay Corp. | 69,473 | 10,881 | |
| Standex International Corp. | 76,796 | 8,875 | |
| Tennant Co. | 116,738 | 8,187 | |
| Matthews International Corp. Class A | 198,439 | 7,350 | |
| Apogee Enterprises Inc. | 145,657 | 6,823 | |
| Douglas Dynamics Inc. | 148,124 | 5,986 | |
| Gorman-Rupp Co. | 142,569 | 4,096 | |
| 10,398,609 | |||
| Information Technology (23.3%) | |||
| Microsoft Corp. | 10,914,783 | 2,704,792 | |
| Visa Inc. Class A | 10,054,987 | 2,314,759 | |
| Mastercard Inc. Class A | 5,418,822 | 2,008,215 | |
| Broadcom Inc. | 2,564,255 | 1,500,115 | |
| Cisco Systems Inc. | 26,077,639 | 1,269,199 | |
| Accenture plc Class A | 3,999,446 | 1,116,045 | |
| Texas Instruments Inc. | 5,763,735 | 1,021,391 | |
| QUALCOMM Inc. | 7,075,296 | 942,500 | |
| Shares | Market Value• ($000) | ||
| Oracle Corp. | 9,991,111 | 883,814 | |
| Intuit Inc. | 1,790,198 | 756,663 | |
| Automatic Data Processing Inc. | 2,642,802 | 596,771 | |
| Analog Devices Inc. | 3,341,758 | 573,011 | |
| KLA Corp. | 905,671 | 355,458 | |
| Amphenol Corp. Class A | 3,772,355 | 300,921 | |
| Roper Technologies Inc. | 673,638 | 287,475 | |
| Motorola Solutions Inc. | 1,061,490 | 272,814 | |
| Microchip Technology Inc. | 3,484,649 | 270,478 | |
| TE Connectivity Ltd. | 2,024,094 | 257,364 | |
| Paychex Inc. | 2,035,450 | 235,827 | |
| HP Inc. | 5,982,916 | 174,342 | |
| Corning Inc. | 4,969,578 | 171,997 | |
| Broadridge Financial Solutions Inc. | 745,373 | 112,074 | |
| Jack Henry & Associates Inc. | 471,051 | 84,832 | |
| Littelfuse Inc. | 156,697 | 40,223 | |
| Badger Meter Inc. | 184,930 | 21,433 | |
| Cass Information Systems Inc. | 77,926 | 3,784 | |
| 18,276,297 | |||
| Materials (4.9%) | |||
| Linde plc | 3,139,565 | 1,039,008 | |
| Air Products and Chemicals Inc. | 1,406,620 | 450,836 | |
| Sherwin-Williams Co. | 1,497,907 | 354,390 | |
| Nucor Corp. | 1,712,879 | 289,511 | |
| Ecolab Inc. | 1,573,311 | 243,596 | |
| Albemarle Corp. | 743,763 | 209,332 | |
| PPG Industries Inc. | 1,492,257 | 194,501 | |
| International Flavors & Fragrances Inc. | 1,618,504 | 182,017 | |
| Avery Dennison Corp. | 514,056 | 97,383 | |
| Reliance Steel & Aluminum Co. | 372,509 | 84,727 | |
| Packaging Corp. of America | 588,876 | 84,033 | |
| Celanese Corp. Class A | 638,542 | 78,668 | |
| RPM International Inc. | 820,140 | 73,739 | |
| Eastman Chemical Co. | 796,269 | 70,207 | |
| Royal Gold Inc. | 416,452 | 52,902 | |
| AptarGroup Inc. | 413,588 | 47,827 | |
| Sonoco Products Co. | 618,522 | 37,798 | |
| Ashland Inc. | 336,725 | 36,794 | |
| Silgan Holdings Inc. | 529,811 | 28,551 | |
| Westlake Corp. | 218,998 | 26,882 | |
| Cabot Corp. | 356,519 | 26,856 | |
| Balchem Corp. | 203,835 | 26,627 | |
| HB Fuller Co. | 337,172 | 23,299 | |
| Avient Corp. | 542,227 | 21,971 | |
| Sensient Technologies Corp. | 268,349 | 20,311 | |
| Scotts Miracle-Gro Co. | 258,532 | 18,663 | |
| Quaker Chemical Corp. | 86,426 | 17,015 | |
| Stepan Co. | 134,926 | 14,820 | |
| Worthington Industries Inc. | 191,276 | 10,878 | |
| Hawkins Inc. | 122,181 | 4,765 | |
| 3,867,907 | |||
| Utilities (3.2%) | |||
| NextEra Energy Inc. | 12,620,378 | 941,859 | |
| Xcel Energy Inc. | 3,474,573 | 238,946 | |
| WEC Energy Group Inc. | 2,003,283 | 188,289 | |
| Eversource Energy | 2,211,772 | 182,095 | |
| Shares | Market Value• ($000) | ||
| American Water Works Co. Inc. | 1,154,688 | 180,697 | |
| DTE Energy Co. | 1,230,440 | 143,186 | |
| CMS Energy Corp. | 1,843,538 | 116,493 | |
| Atmos Energy Corp. | 868,960 | 102,138 | |
| Alliant Energy Corp. | 1,595,115 | 86,184 | |
| Essential Utilities Inc. | 1,516,671 | 70,874 | |
| IDACORP Inc. | 320,721 | 33,935 | |
| National Fuel Gas Co. | 578,213 | 33,571 | |
| New Jersey Resources Corp. | 613,546 | 30,628 | |
| ONE Gas Inc. | 343,600 | 28,299 | |
| American States Water Co. | 234,960 | 22,126 | |
| California Water Service Group | 348,889 | 21,342 | |
| MGE Energy Inc. | 228,365 | 16,696 | |
| Chesapeake Utilities Corp. | 112,244 | 14,152 | |
| SJW Group | 170,773 | 13,219 | |
| Middlesex Water Co. | 111,994 | 9,392 | |
| York Water Co. | 89,059 | 4,048 | |
| 2,478,169 | |||
| Total Common Stocks (Cost $59,906,736) | 78,284,842 | ||
| Shares | Market Value• ($000) | ||
| Temporary Cash Investments (0.2%) | |||
| Money Market Fund (0.2%) | |||
| 1 | Vanguard Market Liquidity Fund, 4.437% (Cost $159,229) | 1,592,681 | 159,252 |
| Total Investments (99.9%) (Cost $60,065,965) | 78,444,094 | ||
| Other Assets and Liabilities—Net (0.1%) | 89,140 | ||
| Net Assets (100%) | 78,533,234 | ||
| Cost is in $000. | |||
| • | See Note A in Notes to Financial Statements. |
| 1 | Affiliated money market fund available only to Vanguard funds and certain trusts and accounts managed by Vanguard. Rate shown is the 7-day yield. |
| Futures Contracts | ||||
| ($000) | ||||
| Expiration | Number of Long (Short) Contracts | Notional Amount | Value and Unrealized Appreciation (Depreciation) | |
| Long Futures Contracts | ||||
| E-mini S&P 500 Index | March 2023 | 480 | 98,160 | 3,450 |
| Over-the-Counter Total Return Swaps | ||||||
| Reference Entity | Termination Date | Counterparty | Notional Amount ($000) | Floating Interest Rate Received (Paid)1 (%) | Value and Unrealized Appreciation ($000) | Value and Unrealized (Depreciation) ($000) |
| Kroger Co. | 1/31/24 | GSI | 44,630 | (4.570) | — | — |
| Visa Inc. Class A | 8/31/23 | BANA | 102,443 | (4.227) | — | (315) |
| — | (315) | |||||
| 1 | Based on 1M USD Overnight Bank Funding Rate as of the most recent payment date. Floating interest payment received/paid monthly. |
| 1M—1-month. | |
| BANA—Bank of America, N.A. | |
| GSI—Goldman Sachs International. |
| ($000s, except shares, footnotes, and per-share amounts) | Amount |
| Assets | |
| Investments in Securities, at Value | |
| Unaffiliated Issuers (Cost $59,906,736) | 78,284,842 |
| Affiliated Issuers (Cost $159,229) | 159,252 |
| Total Investments in Securities | 78,444,094 |
| Investment in Vanguard | 2,921 |
| Cash Collateral Pledged—Futures Contracts | 5,090 |
| Cash Collateral Pledged—Over-the-Counter Swap Contracts | 2,040 |
| Receivables for Investment Securities Sold | 10,106 |
| Receivables for Accrued Income | 71,869 |
| Receivables for Capital Shares Issued | 7,485 |
| Variation Margin Receivable—Futures Contracts | 1,380 |
| Total Assets | 78,544,985 |
| Liabilities | |
| Due to Custodian | 120 |
| Payables for Investment Securities Purchased | 2,123 |
| Payables for Capital Shares Redeemed | 7,030 |
| Payables to Vanguard | 2,163 |
| Unrealized Depreciation—Over-the-Counter Swap Contracts | 315 |
| Total Liabilities | 11,751 |
| Net Assets | 78,533,234 |
| At January 31, 2023, net assets consisted of: | |
| Paid-in Capital | 62,556,656 |
| Total Distributable Earnings (Loss) | 15,976,578 |
| Net Assets | 78,533,234 |
| ETF Shares—Net Assets | |
| Applicable to 422,764,818 outstanding $.001 par value shares of beneficial interest (unlimited authorization) | 66,062,087 |
| Net Asset Value Per Share—ETF Shares | $156.26 |
| Admiral Shares—Net Assets | |
| Applicable to 294,086,548 outstanding $.001 par value shares of beneficial interest (unlimited authorization) | 12,471,147 |
| Net Asset Value Per Share—Admiral Shares | $42.41 |
| Year Ended January 31, 2023 | |
| ($000) | |
| Investment Income | |
| Income | |
| Dividends | 1,524,292 |
| Interest1 | 3,566 |
| Securities Lending—Net | 2 |
| Total Income | 1,527,860 |
| Expenses | |
| The Vanguard Group—Note B | |
| Investment Advisory Services | 1,751 |
| Management and Administrative—ETF Shares | 32,337 |
| Management and Administrative—Admiral Shares | 8,701 |
| Marketing and Distribution—ETF Shares | 2,551 |
| Marketing and Distribution—Admiral Shares | 445 |
| Custodian Fees | 300 |
| Auditing Fees | 32 |
| Shareholders’ Reports—ETF Shares | 1,388 |
| Shareholders’ Reports—Admiral Shares | 170 |
| Trustees’ Fees and Expenses | 27 |
| Other Expenses | 37 |
| Total Expenses | 47,739 |
| Expenses Paid Indirectly | (4) |
| Net Expenses | 47,735 |
| Net Investment Income | 1,480,125 |
| Realized Net Gain (Loss) | |
| Investment Securities Sold1,2 | 2,782,977 |
| Futures Contracts | (27,234) |
| Swap Contracts | 2,186 |
| Realized Net Gain (Loss) | 2,757,929 |
| Change in Unrealized Appreciation (Depreciation) | |
| Investment Securities1 | (5,755,218) |
| Futures Contracts | 8,999 |
| Swap Contracts | (317) |
| Change in Unrealized Appreciation (Depreciation) | (5,746,536) |
| Net Increase (Decrease) in Net Assets Resulting from Operations | (1,508,482) |
| 1 | Interest income, realized net gain (loss), capital gain distributions received, and change in unrealized appreciation (depreciation) from an affiliated company of the fund were $3,463,000, ($3,000), less than $1,000, and $23,000, respectively. Purchases and sales are for temporary cash investment purposes. |
| 2 | Includes $3,222,592,000 of net gain (loss) resulting from in-kind redemptions. |
| Year Ended January 31, | ||
| 2023 ($000) | 2022 ($000) | |
| Increase (Decrease) in Net Assets | ||
| Operations | ||
| Net Investment Income | 1,480,125 | 1,283,185 |
| Realized Net Gain (Loss) | 2,757,929 | 7,696,290 |
| Change in Unrealized Appreciation (Depreciation) | (5,746,536) | 3,906,835 |
| Net Increase (Decrease) in Net Assets Resulting from Operations | (1,508,482) | 12,886,310 |
| Distributions | ||
| ETF Shares | (1,250,613) | (1,043,492) |
| Admiral Shares | (233,770) | (206,613) |
| Total Distributions | (1,484,383) | (1,250,105) |
| Capital Share Transactions | ||
| ETF Shares | 2,946,879 | 4,113,142 |
| Admiral Shares | 87,399 | 215,802 |
| Net Increase (Decrease) from Capital Share Transactions | 3,034,278 | 4,328,944 |
| Total Increase (Decrease) | 41,413 | 15,965,149 |
| Net Assets | ||
| Beginning of Period | 78,491,821 | 62,526,672 |
| End of Period | 78,533,234 | 78,491,821 |
| ETF Shares | |||||
| For a Share Outstanding Throughout Each Period | Year Ended January 31, | ||||
| 2023 | 2022 | 2021 | 2020 | 2019 | |
| Net Asset Value, Beginning of Period | $162.69 | $137.11 | $125.38 | $104.09 | $107.10 |
| Investment Operations | |||||
| Net Investment Income1 | 2.982 | 2.736 | 2.299 | 2.214 | 2.084 |
| Net Realized and Unrealized Gain (Loss) on Investments | (6.439) | 25.504 | 11.728 | 21.210 | (3.056) |
| Total from Investment Operations | (3.457) | 28.240 | 14.027 | 23.424 | (.972) |
| Distributions | |||||
| Dividends from Net Investment Income | (2.973) | (2.660) | (2.297) | (2.134) | (2.038) |
| Distributions from Realized Capital Gains | — | — | — | — | — |
| Total Distributions | (2.973) | (2.660) | (2.297) | (2.134) | (2.038) |
| Net Asset Value, End of Period | $156.26 | $162.69 | $137.11 | $125.38 | $104.09 |
| Total Return | -2.02% | 20.71% | 11.44% | 22.68% | -0.87% |
| Ratios/Supplemental Data | |||||
| Net Assets, End of Period (Millions) | $66,062 | $65,589 | $51,842 | $42,217 | $30,969 |
| Ratio of Total Expenses to Average Net Assets | 0.06%2 | 0.06% | 0.06% | 0.06% | 0.06% |
| Ratio of Net Investment Income to Average Net Assets | 1.96% | 1.74% | 1.84% | 1.90% | 2.01% |
| Portfolio Turnover Rate3 | 12% | 26% | 25% | 14% | 16% |
| 1 | Calculated based on average shares outstanding. |
| 2 | The ratio of expenses to average net assets for the period net of reduction from custody fee offset arrangements was 0.06%. |
| 3 | Excludes the value of portfolio securities received or delivered as a result of in-kind purchases or redemptions of the fund’s capital shares, including ETF Creation Units. |
| Admiral Shares | |||||
| For a Share Outstanding Throughout Each Period | Year Ended January 31, | ||||
| 2023 | 2022 | 2021 | 2020 | 2019 | |
| Net Asset Value, Beginning of Period | $44.15 | $37.21 | $34.03 | $28.25 | $29.07 |
| Investment Operations | |||||
| Net Investment Income1 | .801 | .734 | .617 | .594 | .560 |
| Net Realized and Unrealized Gain (Loss) on Investments | (1.743) | 6.920 | 3.179 | 5.757 | (.830) |
| Total from Investment Operations | (.942) | 7.654 | 3.796 | 6.351 | (.270) |
| Distributions | |||||
| Dividends from Net Investment Income | (.798) | (.714) | (.616) | (.571) | (.550) |
| Distributions from Realized Capital Gains | — | — | — | — | — |
| Total Distributions | (.798) | (.714) | (.616) | (.571) | (.550) |
| Net Asset Value, End of Period | $42.41 | $44.15 | $37.21 | $34.03 | $28.25 |
| Total Return2 | -2.02% | 20.67% | 11.44% | 22.65% | -0.89% |
| Ratios/Supplemental Data | |||||
| Net Assets, End of Period (Millions) | $12,471 | $12,903 | $10,685 | $9,955 | $6,755 |
| Ratio of Total Expenses to Average Net Assets | 0.08%3 | 0.08% | 0.08% | 0.08% | 0.08% |
| Ratio of Net Investment Income to Average Net Assets | 1.94% | 1.72% | 1.82% | 1.87% | 1.99% |
| Portfolio Turnover Rate4 | 12% | 26% | 25% | 14% | 16% |
| 1 | Calculated based on average shares outstanding. |
| 2 | Total returns do not include account service fees that may have applied in the periods shown. Fund prospectuses provide information about any applicable account service fees. |
| 3 | The ratio of expenses to average net assets for the period net of reduction from custody fee offset arrangements was 0.08%. |
| 4 | Excludes the value of portfolio securities received or delivered as a result of in-kind purchases or redemptions of the fund’s capital shares, including ETF Creation Units. |
| A. | The following significant accounting policies conform to generally accepted accounting principles for U.S. investment companies. The fund consistently follows such policies in preparing its financial statements. |
| B. | In accordance with the terms of a Funds' Service Agreement (the “FSA”) between Vanguard and the fund, Vanguard furnishes to the fund investment advisory, corporate management, administrative, marketing, and distribution services at Vanguard’s cost of operations (as defined by the FSA). These costs of operations are allocated to the fund based on methods and guidelines approved by the board of trustees and are generally settled twice a month. |
| C. | The fund’s custodian bank has agreed to reduce its fees when the fund maintains cash on deposit in the non-interest-bearing custody account. For the year ended January 31, 2023, custodian fee offset arrangements reduced the fund’s expenses by $4,000 (an annual rate of less than 0.01% of average net assets). |
| D. | Various inputs may be used to determine the value of the fund’s investments and derivatives. These inputs are summarized in three broad levels for financial statement purposes. The inputs or methodologies used to value securities are not necessarily an indication of the risk associated with investing in those securities. |
| Level 1 ($000) | Level 2 ($000) | Level 3 ($000) | Total ($000) | |
| Investments | ||||
| Assets | ||||
| Common Stocks | 78,284,842 | — | — | 78,284,842 |
| Temporary Cash Investments | 159,252 | — | — | 159,252 |
| Total | 78,444,094 | — | — | 78,444,094 |
| Derivative Financial Instruments | ||||
| Assets | ||||
| Futures Contracts1 | 3,450 | — | — | 3,450 |
| Swap Contracts | — | — | — | — |
| Total | 3,450 | — | — | 3,450 |
| Liabilities | ||||
| Swap Contracts | — | 315 | — | 315 |
| 1 | Includes cumulative appreciation (depreciation) on futures contracts and centrally cleared swaps, if any, as reported in the Schedule of Investments. Only current day’s variation margin is reported within the Statement of Assets and Liabilities. |
| E. | Permanent differences between book-basis and tax-basis components of net assets are reclassified among capital accounts in the financial statements to reflect their tax character. These reclassifications have no effect on net assets or net asset value per share. As of period end, permanent differences primarily attributable to the accounting for applicable in-kind redemptions and swap agreements were reclassified between the following accounts: |
| Amount ($000) | |
| Paid-in Capital | 3,222,290 |
| Total Distributable Earnings (Loss) | (3,222,290) |
| Amount ($000) | |
| Undistributed Ordinary Income | 125,286 |
| Undistributed Long-Term Gains | — |
| Capital Loss Carryforwards | (2,492,949) |
| Qualified Late-Year Losses | — |
| Net Unrealized Gains (Losses) | 18,344,241 |
| Year Ended January 31, | ||
| 2023 Amount ($000) | 2022 Amount ($000) | |
| Ordinary Income* | 1,484,383 | 1,250,105 |
| Long-Term Capital Gains | — | — |
| Total | 1,484,383 | 1,250,105 |
| * | Includes short-term capital gains, if any. |
| Amount ($000) | |
| Tax Cost | 60,099,853 |
| Gross Unrealized Appreciation | 20,171,860 |
| Gross Unrealized Depreciation | (1,827,619) |
| Net Unrealized Appreciation (Depreciation) | 18,344,241 |
| F. | During the year ended January 31, 2023, the fund purchased $19,080,149,000 of investment securities and sold $16,031,896,000 of investment securities, other than temporary cash investments. Purchases and sales include $9,593,420,000 and $6,953,201,000, respectively, in connection with in-kind purchases and redemptions of the fund's capital shares. |
| G. | Capital share transactions for each class of shares were: |
| Year Ended January 31, | |||||
| 2023 | 2022 | ||||
| Amount ($000) | Shares (000) | Amount ($000) | Shares (000) | ||
| ETF Shares | |||||
| Issued | 9,908,220 | 64,894 | 22,417,718 | 148,569 | |
| Issued in Lieu of Cash Distributions | — | — | — | — | |
| Redeemed | (6,961,341) | (45,275) | (18,304,576) | (123,525) | |
| Net Increase (Decrease)—ETF Shares | 2,946,879 | 19,619 | 4,113,142 | 25,044 | |
| Admiral Shares | |||||
| Issued | 1,662,170 | 40,062 | 1,970,820 | 46,680 | |
| Issued in Lieu of Cash Distributions | 199,774 | 4,966 | 176,877 | 4,201 | |
| Redeemed | (1,774,545) | (43,189) | (1,931,895) | (45,799) | |
| Net Increase (Decrease)—Admiral Shares | 87,399 | 1,839 | 215,802 | 5,082 | |
| H. | Management has determined that no events or transactions occurred subsequent to January 31, 2023, that would require recognition or disclosure in these financial statements. |
Philadelphia, Pennsylvania
March 23, 2023
| Matthew Benchener | Thomas M. Rampulla |
| Joseph Brennan | Karin A. Risi |
| Mortimer J. Buckley | Anne E. Robinson |
| Gregory Davis | Michael Rollings |
| John James | Nitin Tandon |
| Chris D. Mclsaac | Lauren Valente |

All rights reserved.
U.S. Patent Nos. 6,879,964.
Vanguard Marketing Corporation, Distributor.

| 1 | |
| 2 | |
| 6 | |
| 8 | |
| 10 | |
| 24 |
| • | Vanguard Global ESG Select Stock Fund returned –2.39% for Investor Shares and –2.27% for Admiral Shares for the 12 months ended January 31, 2023. It outperformed its benchmark, the FTSE All-World Index, which returned –7.53%. |
| • | Despite some relief in midsummer and toward the end of the period, it was a volatile, challenging time for financial markets. Early on, inflation across much of the world continued climbing to multidecade highs amid supply-chain bottlenecks, rising energy and food prices, and broader price increases in goods and services. Central banks responded by aggressively tightening monetary policy. Later, it appeared that inflation might have peaked, and central banks began slowing their pace of interest rate hikes. |
| • | The fund had negative absolute returns in seven of the 10 industry sectors it invests in. Materials detracted most relative to the benchmark. Information technology, consumer discretionary, and financials were net contributors. |
| • | By market, U.S., Spanish, and Hong Kong stocks lifted relative returns the most. Canadian, Danish, and French stocks were net detractors, as was a lack of holdings in Australia. |
| • | From the fund’s June 5, 2019, inception through January 31, 2023, its annualized average returns of 13.34% for Investor Shares and 13.46% for Admiral Shares outpaced the benchmark’s 9.33% average return. |
| Average Annual Total Returns Periods Ended January 31, 2023 | |||
| One Year | Three Years | Five Years | |
| Stocks | |||
| Russell 1000 Index (Large-caps) | -8.55% | 9.66% | 9.38% |
| Russell 2000 Index (Small-caps) | -3.38 | 7.51 | 5.54 |
| Russell 3000 Index (Broad U.S. market) | -8.24 | 9.51 | 9.12 |
| FTSE All-World ex US Index (International) | -5.39 | 4.15 | 1.73 |
| Bonds | |||
| Bloomberg U.S. Aggregate Float Adjusted Index (Broad taxable market) | -8.40% | -2.34% | 0.89% |
| Bloomberg Municipal Bond Index (Broad tax-exempt market) | -3.25 | -0.42 | 2.07 |
| FTSE Three-Month U.S. Treasury Bill Index | 1.87 | 0.78 | 1.29 |
| CPI | |||
| Consumer Price Index | 6.41% | 5.06% | 3.83% |
| • | Companies with high returns on capital and strong stewardship are advantaged in outperforming peers and the market. |
| • | Patience and portfolio construction are two core disciplines that allow us to focus and develop differentiated insights that ultimately drive shareholder returns over the long term. |
| • | Active ownership through engagement and proxy voting are fiduciary responsibilities that can positively influence company behavior and reinforce the tenets that we believe lead to sustained outperformance. |
Equity Portfolio Manager
Equity Portfolio Manager
| • | Based on actual fund return. This section helps you to estimate the actual expenses that you paid over the period. The ”Ending Account Value“ shown is derived from the fund’s actual return, and the third column shows the dollar amount that would have been paid by an investor who started with $1,000 in the fund. You may use the information here, together with the amount you invested, to estimate the expenses that you paid over the period. |
| • | Based on hypothetical 5% yearly return. This section is intended to help you compare your fund‘s costs with those of other mutual funds. It assumes that the fund had a yearly return of 5% before expenses, but that the expense ratio is unchanged. In this case—because the return used is not the fund’s actual return—the results do not apply to your investment. The example is useful in making comparisons because the Securities and Exchange Commission requires all mutual funds to calculate expenses based on a 5% return. You can assess your fund’s costs by comparing this hypothetical example with the hypothetical examples that appear in shareholder reports of other funds. |
| Six Months Ended January 31, 2023 | |||
| Beginning Account Value 7/31/2022 | Ending Account Value 1/31/2023 | Expenses Paid During Period | |
| Based on Actual Fund Return | |||
| Global ESG Select Stock Fund | |||
| Investor Shares | $1,000.00 | $1,063.40 | $3.02 |
| Admiral™ Shares | 1,000.00 | 1,064.00 | 2.50 |
| Based on Hypothetical 5% Yearly Return | |||
| Global ESG Select Stock Fund | |||
| Investor Shares | $1,000.00 | $1,022.28 | $2.96 |
| Admiral Shares | 1,000.00 | 1,022.79 | 2.45 |
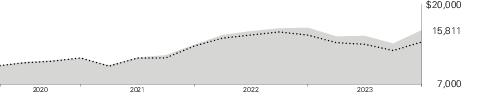
| Average Annual Total Returns Periods Ended January 31, 2023 | ||||
| One Year | Since Inception (6/5/2019) | Final Value of a $10,000 Investment | ||
 | Global ESG Select Stock Fund Investor Shares | -2.39% | 13.34% | $15,811 |
 | FTSE All-World Index | -7.53 | 9.33 | 13,859 |
| One Year | Since Inception (6/5/2019) | Final Value of a $50,000 Investment | ||
| Global ESG Select Stock Fund Admiral Shares | -2.27% | 13.46% | $79,355 | |
| FTSE All-World Index | -7.53 | 9.33 | 69,293 | |
| United States | 43.7% |
| Netherlands | 10.0 |
| United Kingdom | 8.7 |
| France | 6.9 |
| Spain | 6.3 |
| Japan | 5.4 |
| Taiwan | 5.0 |
| Canada | 4.9 |
| Switzerland | 3.4 |
| Hong Kong | 3.0 |
| Singapore | 2.7 |
| Shares | Market Value• ($000) | |||||
| Common Stocks (97.6%) | ||||||
| Canada (4.7%) | ||||||
| Bank of Nova Scotia | 488,311 | 26,435 | ||||
| BCE Inc. | 312,349 | 14,766 | ||||
| 41,201 | ||||||
| France (6.8%) | ||||||
| Cie Generale des Etablissements Michelin SCA | 788,409 | 24,929 | ||||
| Schneider Electric SE | 107,188 | 17,388 | ||||
| L'Oreal SA | 39,851 | 16,455 | ||||
| 58,772 | ||||||
| Hong Kong (2.9%) | ||||||
| AIA Group Ltd. | 2,247,119 | 25,410 | ||||
| Japan (5.3%) | ||||||
| Recruit Holdings Co. Ltd. | 920,800 | 29,613 | ||||
| Mitsubishi UFJ Financial Group Inc. | 2,264,800 | 16,589 | ||||
| 46,202 | ||||||
| Netherlands (9.8%) | ||||||
| Koninklijke DSM NV | 212,027 | 27,267 | ||||
| ING Groep NV | 1,787,369 | 25,882 | ||||
| ASML Holding NV (Registered) NYRS | 26,764 | 17,687 | ||||
| Wolters Kluwer NV | 123,960 | 13,514 | ||||
| ASML Holding NV | 815 | 539 | ||||
| 84,889 | ||||||
| Singapore (2.6%) | ||||||
| DBS Group Holdings Ltd. | 828,187 | 22,673 | ||||
| Spain (6.1%) | ||||||
| Industria de Diseno Textil SA | 996,668 | 31,117 | ||||
| Iberdrola SA (XMAD) | 1,846,964 | 21,668 | ||||
| * | Iberdrola SA | 30,045 | 351 | |||
| 53,136 | ||||||
| Switzerland (3.3%) | ||||||
| Novartis AG (Registered) | 321,418 | 29,059 | ||||
| Taiwan (4.9%) | ||||||
| Taiwan Semiconductor Manufacturing Co. Ltd. | 2,393,163 | 42,232 | ||||
| Shares | Market Value• ($000) | |||||
| United Kingdom (8.5%) | ||||||
| GSK plc | 1,285,242 | 22,575 | ||||
| National Grid plc | 1,643,180 | 20,889 | ||||
| Compass Group plc | 633,920 | 15,143 | ||||
| Diageo plc | 342,738 | 14,987 | ||||
| 73,594 | ||||||
| United States (42.7%) | ||||||
| Microsoft Corp. | 179,736 | 44,540 | ||||
| Prologis Inc. | 237,297 | 30,678 | ||||
| Visa Inc. Class A | 133,047 | 30,629 | ||||
| Home Depot Inc. | 89,739 | 29,091 | ||||
| Northern Trust Corp. | 290,466 | 28,166 | ||||
| Texas Instruments Inc. | 152,957 | 27,106 | ||||
| * | Edwards Lifesciences Corp. | 335,234 | 25,712 | |||
| Cisco Systems Inc. | 517,824 | 25,202 | ||||
| Merck & Co. Inc. | 223,602 | 24,017 | ||||
| Deere & Co. | 46,883 | 19,824 | ||||
| Ecolab Inc. | 113,661 | 17,598 | ||||
| Progressive Corp. | 114,250 | 15,578 | ||||
| Accenture plc Class A | 54,731 | 15,273 | ||||
| Colgate-Palmolive Co. | 185,575 | 13,831 | ||||
| Trane Technologies plc | 73,147 | 13,102 | ||||
| Automatic Data Processing Inc. | 45,990 | 10,385 | ||||
| 370,732 | ||||||
| Total Common Stocks (Cost $754,296) | 847,900 | |||||
| Shares | Market Value• ($000) | |||||
| Temporary Cash Investments (2.7%) | ||||||
| Money Market Fund (2.7%) | ||||||
| 1 | Vanguard Market Liquidity Fund, 4.437% (Cost $23,400) | 234,043 | 23,402 | |||
| Total Investments (100.3%) (Cost $777,696) | 871,302 | |||||
| Other Assets and Liabilities—Net (-0.3%) | (2,357) | |||||
| Net Assets (100%) | 868,945 | |||||
| Cost is in $000. |
| • | See Note A in Notes to Financial Statements. |
| * | Non-income-producing security. |
| 1 | Affiliated money market fund available only to Vanguard funds and certain trusts and accounts managed by Vanguard. Rate shown is the 7-day yield. |
| ($000s, except shares, footnotes, and per-share amounts) | Amount |
| Assets | |
| Investments in Securities, at Value | |
| Unaffiliated Issuers (Cost $754,296) | 847,900 |
| Affiliated Issuers (Cost $23,400) | 23,402 |
| Total Investments in Securities | 871,302 |
| Investment in Vanguard | 30 |
| Foreign Currency, at Value (Cost $942) | 942 |
| Receivables for Investment Securities Sold | 9 |
| Receivables for Accrued Income | 1,033 |
| Receivables for Capital Shares Issued | 1,719 |
| Total Assets | 875,035 |
| Liabilities | |
| Payables for Investment Securities Purchased | 5,221 |
| Payables for Capital Shares Redeemed | 272 |
| Payables to Investment Advisor | 499 |
| Payables to Vanguard | 98 |
| Total Liabilities | 6,090 |
| Net Assets | 868,945 |
| At January 31, 2023, net assets consisted of: | |
| Paid-in Capital | 787,966 |
| Total Distributable Earnings (Loss) | 80,979 |
| Net Assets | 868,945 |
| Investor Shares—Net Assets | |
| Applicable to 6,004,802 outstanding $.001 par value shares of beneficial interest (unlimited authorization) | 177,808 |
| Net Asset Value Per Share—Investor Shares | $29.61 |
| Admiral Shares—Net Assets | |
| Applicable to 18,665,759 outstanding $.001 par value shares of beneficial interest (unlimited authorization) | 691,137 |
| Net Asset Value Per Share—Admiral Shares | $37.03 |
| Year Ended January 31, 2023 | |
| ($000) | |
| Investment Income | |
| Income | |
| Dividends1 | 17,942 |
| Interest2 | 339 |
| Total Income | 18,281 |
| Expenses | |
| Investment Advisory Fees—Note B | |
| Basic Fee | 1,684 |
| Performance Adjustment | 174 |
| The Vanguard Group—Note C | |
| Management and Administrative—Investor Shares | 458 |
| Management and Administrative—Admiral Shares | 1,224 |
| Marketing and Distribution—Investor Shares | 14 |
| Marketing and Distribution—Admiral Shares | 29 |
| Custodian Fees | 25 |
| Auditing Fees | 33 |
| Shareholders’ Reports—Investor Shares | 26 |
| Shareholders’ Reports—Admiral Shares | 11 |
| Trustees’ Fees and Expenses | — |
| Other Expenses | 28 |
| Total Expenses | 3,706 |
| Net Investment Income | 14,575 |
| Realized Net Gain (Loss) | |
| Investment Securities Sold2 | (12,581) |
| Foreign Currencies | (338) |
| Realized Net Gain (Loss) | (12,919) |
| Change in Unrealized Appreciation (Depreciation) | |
| Investment Securities2 | (12,481) |
| Foreign Currencies | 11 |
| Change in Unrealized Appreciation (Depreciation) | (12,470) |
| Net Increase (Decrease) in Net Assets Resulting from Operations | (10,814) |
| 1 | Dividends are net of foreign withholding taxes of $1,245,000. |
| 2 | Interest income, realized net gain (loss), capital gain distributions received, and change in unrealized appreciation (depreciation) from an affiliated company of the fund were $339,000, ($5,000), less than $1,000, and $2,000, respectively. Purchases and sales are for temporary cash investment purposes. |
| Year Ended January 31, | ||
| 2023 ($000) | 2022 ($000) | |
| Increase (Decrease) in Net Assets | ||
| Operations | ||
| Net Investment Income | 14,575 | 9,979 |
| Realized Net Gain (Loss) | (12,919) | 9,849 |
| Change in Unrealized Appreciation (Depreciation) | (12,470) | 70,974 |
| Net Increase (Decrease) in Net Assets Resulting from Operations | (10,814) | 90,802 |
| Distributions | ||
| Investor Shares | (3,362) | (4,101) |
| Admiral Shares | (13,272) | (14,372) |
| Total Distributions | (16,634) | (18,473) |
| Capital Share Transactions | ||
| Investor Shares | 15,722 | 65,231 |
| Admiral Shares | 105,498 | 304,765 |
| Net Increase (Decrease) from Capital Share Transactions | 121,220 | 369,996 |
| Total Increase (Decrease) | 93,772 | 442,325 |
| Net Assets | ||
| Beginning of Period | 775,173 | 332,848 |
| End of Period | 868,945 | 775,173 |
| Investor Shares | ||||
| For a Share Outstanding Throughout Each Period | Year Ended January 31, | May 21, 20191 to January 31, 2020 | ||
| 2023 | 2022 | 2021 | ||
| Net Asset Value, Beginning of Period | $30.97 | $26.32 | $22.34 | $20.00 |
| Investment Operations | ||||
| Net Investment Income2 | .524 | .487 | .378 | .258 |
| Net Realized and Unrealized Gain (Loss) on Investments | (1.298) | 5.004 | 3.866 | 2.257 |
| Total from Investment Operations | (.774) | 5.491 | 4.244 | 2.515 |
| Distributions | ||||
| Dividends from Net Investment Income | (.467) | (.386) | (.229) | (.167) |
| Distributions from Realized Capital Gains | (.119) | (.455) | (.035) | (.008) |
| Total Distributions | (.586) | (.841) | (.264) | (.175) |
| Net Asset Value, End of Period | $29.61 | $30.97 | $26.32 | $22.34 |
| Total Return3 | -2.39% | 20.86% | 19.06% | 12.57% |
| Ratios/Supplemental Data | ||||
| Net Assets, End of Period (Millions) | $178 | $169 | $86 | $34 |
| Ratio of Total Expenses to Average Net Assets | 0.57%4 | 0.56%4 | 0.55%4 | 0.58%5,6 |
| Ratio of Net Investment Income to Average Net Assets | 1.88% | 1.61% | 1.62% | 1.81%5 |
| Portfolio Turnover Rate | 38% | 19% | 21% | 15% |
| 1 | The subscription period for the fund was May 21, 2019, to June 4, 2019, during which time all assets were held in cash. Performance measurement began June 5, 2019, the first business day after the subscription period, at a net asset value of $20.00. |
| 2 | Calculated based on average shares outstanding. |
| 3 | Total returns do not include account service fees that may have applied in the periods shown. Fund prospectuses provide information about any applicable account service fees. |
| 4 | Includes performance-based investment advisory fee increases (decreases) of 0.02%, 0.01%, and 0.00%. |
| 5 | Annualized. |
| 6 | The ratio of expenses to average net assets for the period net of reduction from custody fee offset arrangements was 0.55%. |
| Admiral Shares | ||||
| For a Share Outstanding Throughout Each Period | Year Ended January 31, | May 21, 20191 to January 31, 2020 | ||
| 2023 | 2022 | 2021 | ||
| Net Asset Value, Beginning of Period | $38.73 | $32.91 | $27.93 | $25.00 |
| Investment Operations | ||||
| Net Investment Income2 | .684 | .649 | .504 | .338 |
| Net Realized and Unrealized Gain (Loss) on Investments | (1.609) | 6.258 | 4.830 | 2.823 |
| Total from Investment Operations | (.925) | 6.907 | 5.334 | 3.161 |
| Distributions | ||||
| Dividends from Net Investment Income | (.626) | (.517) | (.310) | (.221) |
| Distributions from Realized Capital Gains | (.149) | (.570) | (.044) | (.010) |
| Total Distributions | (.775) | (1.087) | (.354) | (.231) |
| Net Asset Value, End of Period | $37.03 | $38.73 | $32.91 | $27.93 |
| Total Return3 | -2.27% | 20.99% | 19.17% | 12.64% |
| Ratios/Supplemental Data | ||||
| Net Assets, End of Period (Millions) | $691 | $606 | $247 | $74 |
| Ratio of Total Expenses to Average Net Assets | 0.47%4 | 0.46%4 | 0.45%4 | 0.48%5,6 |
| Ratio of Net Investment Income to Average Net Assets | 1.97% | 1.71% | 1.71% | 1.89%5 |
| Portfolio Turnover Rate | 38% | 19% | 21% | 15% |
| 1 | The subscription period for the fund was May 21, 2019, to June 4, 2019, during which time all assets were held in cash. Performance measurement began June 5, 2019, the first business day after the subscription period, at a net asset value of $25.00. |
| 2 | Calculated based on average shares outstanding. |
| 3 | Total returns do not include account service fees that may have applied in the periods shown. Fund prospectuses provide information about any applicable account service fees. |
| 4 | Includes performance-based investment advisory fee increases (decreases) of 0.02%, 0.01%, and 0.00%. |
| 5 | Annualized. |
| 6 | The ratio of expenses to average net assets for the period net of reduction from custody fee offset arrangements was 0.45%. |
| Level 1 ($000) | Level 2 ($000) | Level 3 ($000) | Total ($000) | |
| Investments | ||||
| Assets | ||||
| Common Stocks—North and South America | 411,933 | — | — | 411,933 |
| Common Stocks—Other | 17,687 | 418,280 | — | 435,967 |
| Temporary Cash Investments | 23,402 | — | — | 23,402 |
| Total | 453,022 | 418,280 | — | 871,302 |
| Amount ($000) | |
| Undistributed Ordinary Income | 1,338 |
| Undistributed Long-Term Gains | — |
| Capital Loss Carryforwards | (12,594) |
| Qualified Late-Year Losses | — |
| Net Unrealized Gains (Losses) | 92,177 |
| Year Ended January 31, | ||
| 2023 Amount ($000) | 2022 Amount ($000) | |
| Ordinary Income* | 16,027 | 15,894 |
| Long-Term Capital Gains | 607 | 2,579 |
| Total | 16,634 | 18,473 |
| * | Includes short-term capital gains, if any. |
| Amount ($000) | |
| Tax Cost | 779,130 |
| Gross Unrealized Appreciation | 124,068 |
| Gross Unrealized Depreciation | (31,896) |
| Net Unrealized Appreciation (Depreciation) | 92,172 |
| Year Ended January 31, | |||||
| 2023 | 2022 | ||||
| Amount ($000) | Shares (000) | Amount ($000) | Shares (000) | ||
| Investor Shares | |||||
| Issued | 51,485 | 1,829 | 125,865 | 4,203 | |
| Issued in Lieu of Cash Distributions | 2,932 | 104 | 3,550 | 113 | |
| Redeemed | (38,695) | (1,394) | (64,184) | (2,117) | |
| Net Increase (Decrease)—Investor Shares | 15,722 | 539 | 65,231 | 2,199 | |
| Admiral Shares | |||||
| Issued | 229,900 | 6,607 | 414,883 | 11,050 | |
| Issued in Lieu of Cash Distributions | 11,097 | 317 | 11,765 | 301 | |
| Redeemed | (135,499) | (3,904) | (121,883) | (3,207) | |
| Net Increase (Decrease)—Admiral Shares | 105,498 | 3,020 | 304,765 | 8,144 | |
Philadelphia, Pennsylvania
March 23, 2023
| Matthew Benchener | Thomas M. Rampulla |
| Joseph Brennan | Karin A. Risi |
| Mortimer J. Buckley | Anne E. Robinson |
| Gregory Davis | Michael Rollings |
| John James | Nitin Tandon |
| Chris D. McIsaac | Lauren Valente |

Who Are Deaf or Hard of Hearing > 800-749-7273
All rights reserved.
Vanguard Marketing Corporation, Distributor.
Item 2: Code of Ethics.
The Registrant has adopted a code of ethics that applies to the Registrant’s principal executive officer, principal financial officer, principal accounting officer or controller or persons performing similar functions. The Code of Ethics was amended during the reporting period covered by this report to make certain technical, non-material changes.
Item 3: Audit Committee Financial Expert.
All members of the Audit Committee have been determined by the Registrant’s Board of Trustees to be Audit Committee Financial Experts and to be independent: F. Joseph Loughrey, Mark Loughridge, Sarah Bloom Raskin, and Peter F. Volanakis.
Item 4: Principal Accountant Fees and Services.
(a) Audit Fees.
Audit Fees of the Registrant.
Fiscal Year Ended January 31, 2023: $218,000
Fiscal Year Ended January 31, 2022: $224,000
Aggregate Audit Fees of Registered Investment Companies in the Vanguard Group.
Fiscal Year Ended January 31, 2023: $10,494,508
Fiscal Year Ended January 31, 2022: $11,244,694
Includes fees billed in connection with audits of the Registrant, other registered investment companies in the Vanguard complex, The Vanguard Group, Inc., and Vanguard Marketing Corporation.
(b) Audit-Related Fees.
Fiscal Year Ended January 31, 2023: $2,757,764
Fiscal Year Ended January 31, 2022: $2,955,181
Includes fees billed in connection with assurance and related services provided to the Registrant, other registered investment companies in the Vanguard complex, The Vanguard Group, Inc., and Vanguard Marketing Corporation.
(c) Tax Fees.
Fiscal Year Ended January 31, 2023: $5,202,689
Fiscal Year Ended January 31, 2022: $2,047,574
Includes fees billed in connection with tax compliance, planning, and advice services provided to the Registrant, other registered investment companies in the Vanguard complex, The Vanguard Group, Inc., and Vanguard Marketing Corporation.
(d) All Other Fees.
Fiscal Year Ended January 31, 2023: $298,000
Fiscal Year Ended January 31, 2022: $280,000
Includes fees billed for services related to tax reported information provided to the Registrant, other registered investment companies in the Vanguard complex, The Vanguard Group, Inc., and Vanguard Marketing Corporation.
(e) (1) Pre-Approval Policies. The policy of the Registrant’s Audit Committee is to consider, and, if appropriate, approve before the principal accountant is engaged for such services, all specific audit and non-audit services provided to: the Registrant, other registered investment companies in the Vanguard complex, The Vanguard Group, Inc., and entities controlled by The Vanguard Group, Inc. that provide ongoing services to the Registrant. In making a determination, the Audit Committee considers whether the services are consistent with maintaining the principal accountant’s independence.
In the event of a contingency situation in which the principal accountant is needed to provide services in between scheduled Audit Committee meetings, the Chairman of the Audit Committee would be called on to consider and, if appropriate, pre-approve audit or permitted non-audit services in an amount sufficient to complete services through the next Audit Committee meeting, and to determine if such services would be consistent with maintaining the accountant’s independence. At the next scheduled Audit Committee meeting, services and fees would be presented to the Audit Committee for formal consideration, and, if appropriate, approval by the entire Audit Committee. The Audit Committee would again consider whether such services and fees are consistent with maintaining the principal accountant’s independence.
The Registrant’s Audit Committee is informed at least annually of all audit and non-audit services provided by the principal accountant to the Vanguard complex, whether such services are provided to: the Registrant, other registered investment companies in the Vanguard complex, The Vanguard Group, Inc., or other entities controlled by The Vanguard Group, Inc. that provide ongoing services to the Registrant.
(2) No percentage of the principal accountant’s fees or services were approved pursuant to the waiver provision of paragraph (c)(7)(i)(C) of Rule 2-01 of Regulation S-X.
(f) For the most recent fiscal year, over 50% of the hours worked under the principal accountant’s engagement were not performed by persons other than full-time, permanent employees of the principal accountant.
(g) Aggregate Non-Audit Fees.
Fiscal Year Ended January 31, 2023: $5,500,689
Fiscal Year Ended January 31, 2022: $2,327,574
Includes fees billed for non-audit services provided to the Registrant, other registered investment companies in the Vanguard complex, The Vanguard Group, Inc., and Vanguard Marketing Corporation.
(h) For the most recent fiscal year, the Audit Committee has determined that the provision of all non-audit services was consistent with maintaining the principal accountant’s independence.
Item 5: Audit Committee of Listed Registrants.
The Registrant is a listed issuer as defined in rule 10A-3 under the Securities Exchange Act of 1934 (“Exchange Act”). The Registrant has a separately-designated standing audit committee established in accordance with Section 3(a)(58)(A) of the Exchange Act. The Registrant’s audit committee members are: F. Joseph Loughrey, Mark Loughridge, Sarah Bloom Raskin, and Peter F. Volanakis.
Item 6: Investments.
Not applicable. The complete schedule of investments is included as part of the report to shareholders filed under Item 1 of this Form.
Item 7: Disclosure of Proxy Voting Policies and Procedures for Closed-End Management Investment Companies.
Not applicable.
Item 8: Portfolio Managers of Closed-End Management Investment Companies.
Not applicable.
Item 9: Purchase of Equity Securities by Closed-End Management Investment Company and Affiliated Purchasers.
Not applicable.
Item 10: Submission of Matters to a Vote of Security Holders.
Not applicable.
Item 11: Controls and Procedures.
(a) Disclosure Controls and Procedures. The Principal Executive and Financial Officers concluded that the Registrant’s Disclosure Controls and Procedures are effective based on their evaluation of the Disclosure Controls and Procedures as of a date within 90 days of the filing date of this report.
(b) Internal Control Over Financial Reporting. There were no significant changes in the Registrant’s Internal Control Over Financial Reporting or in other factors that could significantly affect this control subsequent to the date of the evaluation, including any corrective actions with regard to significant deficiencies and material weaknesses.
Item 12: Disclosure of Securities Lending Activities for Closed-End Management Investment Companies.
Not applicable.
Item 13: Exhibits.
| (a)(1) | Code of Ethics filed herewith. |
| (a)(2) | Certifications filed herewith. |
| (b) | Certifications filed herewith. |
Pursuant to the requirements of the Securities Exchange Act of 1934 and the Investment Company Act of 1940, the registrant has duly caused this report to be signed on its behalf by the undersigned, thereunto duly authorized.
| VANGUARD SPECIALIZED FUNDS | |||
| BY: | /s/ MORTIMER J. BUCKLEY* | ||
| MORTIMER J. BUCKLEY | |||
| CHIEF EXECUTIVE OFFICER | |||
Date: March 24, 2023
Pursuant to the requirements of the Securities Exchange Act of 1934 and the Investment Company Act of 1940, this report has been signed below by the following persons on behalf of the registrant and in the capacities and on the dates indicated.
| VANGUARD SPECIALIZED FUNDS | |||
| BY: | /s/ MORTIMER J. BUCKLEY* | ||
| MORTIMER J. BUCKLEY | |||
| CHIEF EXECUTIVE OFFICER | |||
Date: March 24, 2023
| VANGUARD SPECIALIZED FUNDS | |||
| BY: | /s/ CHRISTINE BUCHANAN* | ||
| CHRISTINE BUCHANAN | |||
| CHIEF FINANCIAL OFFICER | |||
Date: March 24, 2023
* By: /s/ Anne E. Robinson
Anne E. Robinson, pursuant to a Power of Attorney filed on March 29, 2023 (see File Number 2-11444), Incorporated by Reference.