UNITED STATES
SECURITIES AND EXCHANGE COMMISSION
Washington, D.C. 20549
FORM N-CSR
CERTIFIED SHAREHOLDER REPORT
OF
REGISTERED MANAGEMENT COMPANY
| Investment Company Act file number: | 811-3919 |
| Name of Registrant: | Vanguard Star Funds |
| Address of Registrant: | P.O. Box 2600
Valley Forge, PA 19482 |
| Name and address of agent for service: | Heidi Stam, Esquire
P.O. Box 876
Valley Forge, PA 19482 |
Registrant’s telephone number, including area code: (610) 669-1000
| Date of fiscal year end: | October 31 |
| Date of reporting period: | November 1, 2005 - April 30, 2006 |
| Item 1: | Reports to Shareholders |
Vanguard® STAR® Fund | |
| |
| |
> Semiannual Report | |
| |
| |
April 30, 2006 | |
| 
|
| |
| |
| |
| |
| |
> | Vanguard STAR Fund returned 8.9% for the six months as stocks rallied and bonds struggled. |
> | STAR outperformed its benchmark, but trailed the average return of its peer group. |
> | STAR’s international funds were the period’s standouts. |
Contents | |
| |
Your Fund’s Total Returns | 1 |
Chairman’s Letter | 2 |
Fund Profile | 6 |
Performance Summary | 7 |
Financial Statements | 8 |
About Your Fund’s Expenses | 15 |
Glossary | 17 |
Please note: The opinions expressed in this report are just that—informed opinions. They should not be considered promises or advice. Also, please keep in mind that the information and opinions cover the period through the date on the cover of this report. Of course, the risks of investing in your fund are spelled out in the prospectus.
Your Fund’s Total Returns
Six Months Ended April 30, 2006 | |
| Total |
| Return |
Vanguard STAR Fund | 8.9% |
STAR Composite Index1 | 8.5 |
STAR Composite Average2 | 9.5 |
Your Fund’s Performance at a Glance |
October 31, 2005–April 30, 2006 | | | | |
| | | | |
| | | Distributions Per Share |
| Starting | Ending | Income | Capital |
| Share Price | Share Price | Dividends | Gains |
Vanguard STAR Fund | $19.14 | $20.49 | $0.290 | $0.055 |
1 The STAR Composite Index is weighted 50% Morgan Stanley Capital International (MSCI) US Broad Market Index, 25% Lehman Brothers Aggregate Bond Index, 12.5% Lehman 1–5 Year U.S. Credit Index, and 12.5% MSCI Europe, Australasia, Far East (EAFE) Index.
2 The STAR Composite Average, which is derived from data provided by Lipper Inc., is weighted 50% average general equity fund, 25% average fixed income fund, 12.5% average 1–5 year investment-grade fund, and 12.5% average international fund.
1

Chairman’s Letter
Dear Shareholder,
In a strong stock market and a challenging bond market, Vanguard STAR Fund returned 8.9% during the fiscal half-year ended April 30, 2006. This result surpassed that of the STAR Composite Index, but trailed a composite of peer-group funds weighted to approximate STAR Fund’s asset allocation.
STAR Fund’s solid six-month result was the product of good-to-exceptional performance in its stock holdings, particularly those of Vanguard International Growth and International Value Funds, which capitalized on powerful rallies overseas. As interest rates rose, STAR’s bond funds were a modest drag on performance.
Stocks continued their healthy climb despite high energy prices
Following a lackluster finish in 2005, U.S. stock prices climbed steadily during the first four months of 2006, ending near a five-year high. Despite continuing worries over rising energy costs and the possibility of inflation, investors’ confidence in the economy remained firm. The job market remained tight and retail sales were strong during the fiscal half-year.
2
Small-capitalization stocks in the United States continued to outperform their large-cap counterparts, as has been the general trend since the bear market ended in 2002. During the half-year, small-caps bested large-caps by a margin of 9 percentage points. International stocks continued to produce outstanding gains, most notably in Japan and emerging markets.
The Fed continued its measured pace of raising short-term rates
For the six-month period, bonds provided slim returns as rising interest rates put a lid on bond performance. On March 28, the Federal Reserve Board raised its target for the federal funds rate to 4.75%, continuing its gradual tightening of monetary policy to defuse the threat of inflation. This was the
Fed’s 15th consecutive rate increase since June 2004. (Shortly after the close of the fiscal period, the Fed extended its streak of rate increases to 16, raising its target to 5.00%.) Interest rate movements followed a normal pattern during the period, rising across the maturity spectrum. Short-term and municipal securities outperformed long-term bonds.
A strong performance in buoyant stock markets
During the past six months, the eight actively managed stock funds that make up STAR’s equity allocation returned more than 14%, a strong six-month result that exceeded the broad U.S. stock market’s gain. The STAR “fund-of-funds” portfolio includes stocks of all sizes and valuations, in proportions similar to those of the market.
Market Barometer | | | |
| | | Total Returns |
| Periods Ended April 30, 2006 |
| Six Months | One Year | Five Years1 |
Stocks | | | |
Russell 1000 Index (Large-caps) | 9.9 % | 16.7% | 3.4% |
Russell 2000 Index (Small-caps) | 18.9 | 33.5 | 10.9 |
Dow Jones Wilshire 5000 Index (Entire market) | 11.1 | 18.9 | 4.5 |
MSCI All Country World Index ex USA (International) | 25.0 | 38.1 | 11.4 |
| | | |
Bonds | | | |
Lehman Aggregate Bond Index (Broad taxable market) | 0.6% | 0.7% | 5.2% |
Lehman Municipal Bond Index | 1.6 | 2.2 | 5.4 |
Citigroup 3-Month Treasury Bill Index | 2.0 | 3.6 | 2.1 |
| | | |
| | | |
CPI | | | |
Consumer Price Index | 1.2% | 3.5% | 2.6% |
| | | |
| | | |
| | | |
| | | |
1 Annualized. | | | |
3
It’s a mark of the general strength in U.S. stocks that the 9.5% return of Windsor™ II, STAR’s largest holding, could be called a modest disappointment. Large-value stocks, the fund’s typical quarry, returned more than 12% during the six months, implying that Windsor II missed some opportunities. Vanguard Explorer™ Fund returned 18.6%, but again, this powerful gain was less than returns generated by small- and mid-sized growth stocks as a group. Vanguard Windsor, PRIMECAP, and Morgan™ Growth Funds, by contrast, handily outpaced their comparative standards, making up some of the relative shortfall. (Vanguard U.S. Growth Fund’s return was on par with that of large growth stocks.)
As stock markets rallied overseas, STAR’s international funds were standouts. The International Value and International Growth Funds bested their benchmarks, benefiting from modest allocations to surging emerging markets stocks. Though hardly the largest holdings, these two funds were among the most significant contributors to STAR’s six-month result.
Like the fixed income markets as a whole, STAR’s bond funds struggled during the first half of the fiscal year. Rising interest rates put pressure on bond prices, particularly those of longer-term bonds. Vanguard Long-Term Investment-Grade Fund returned –2.7%; the Short-Term Investment-Grade Fund produced a 1.7% return; and the GNMA Fund returned 1.1%, putting the combined performance of STAR’s bond holdings near 0%.
A two-decade test of enduring investment principles
Vanguard’s investment philosophy is based on the principles of balance and diversification, the benefits of low costs, and the need for a long-term perspective. These principles have guided our oversight of STAR, a single portfolio managed by talented investment advisors, since its 1985 inception. If the past 20-years-plus can be considered a real-world test of these principles, the results are a powerful validation of their value.
Annualized Expense Ratios | | |
Your fund compared with a benchmark | | |
| Average | Composite |
| Weighted | Benchmark |
| Expense | Expense |
| Ratio1 | Ratio2 |
STAR Fund | 0.36% | 1.30% |
1 For underlying funds, annualized.
2 Based on the STAR Composite Average, which is weighted 50% average general equity fund, 25% average fixed income fund, 12.5% average 1–5 year investment-grade fund , and 12.5% average international fund. The figure is derived from data provided by Lipper Inc. and captures information through year-end 2005.
4
Since its March 29, 1985, inception, STAR has returned an annualized 11.1%. The fund’s roughly 60% allocation to stocks has allowed it to participate in the powerful bull markets of the past two decades, while its sizable allocation to fixed income investments has provided some protection during the stock market’s periodic downturns. Broad diversification across markets has limited the fund’s exposure to any single industry—technology during the late 1990s, for example—while low costs and talented managers have kept the fund a step ahead of its unmanaged benchmark.
Whether STAR represents the bulk of your investment assets, or just a portion, these same guiding principles can help you manage your own investment plan. Thank you for entrusting your assets to Vanguard.
Sincerely,

John J. Brennan
Chairman and Chief Executive Officer
May 11, 2006
| | Total Returns |
Vanguard Fund | Percentage of | Six Months Ended |
(Investor Shares) | STAR’s Assets1 | April 30, 2006 |
Stock Funds | | |
Windsor II Fund | 16.3% | 9.5% |
Windsor Fund | 8.9 | 14.2 |
PRIMECAP Fund | 6.9 | 15.0 |
Morgan Growth Fund | 6.9 | 12.3 |
U.S. Growth Fund | 6.8 | 6.9 |
International Value Fund | 6.3 | 27.5 |
International Growth Fund | 6.3 | 24.2 |
Explorer Fund | 4.3 | 18.6 |
Bond Funds | | |
GNMA Fund | 12.5% | 1.1% |
Long-Term Investment-Grade Fund | 12.5 | –2.7 |
Short-Term Investments | | |
Short-Term Investment-Grade Fund | 12.3% | 1.7% |
Combined | 100.0% | 8.9% |
| | |
| | |
| | |
| | |
| | |
| | |
1 As of April 30, 2006. | | |
5
Fund Profile | |
As of April 30, 2006 | |
| |
| |
Financial Attributes | |
| |
Yield | 2.5% |
Expense Ratio | 0% |
Average Weighted Expense Ratio1 | 0.36% |
Allocation to Underlying Vanguard Funds | |
| |
Stock Funds | |
Windsor II Fund | 16.3% |
Windsor Fund | 8.9 |
PRIMECAP Fund | 6.9 |
Morgan Growth Fund | 6.9 |
U.S. Growth Fund | 6.8 |
International Value Fund | 6.3 |
International Growth Fund | 6.3 |
Explorer Fund | 4.3 |
Bond Funds | |
GNMA Fund | 12.5% |
Long-Term Investment-Grade Fund | 12.5 |
Short-Term Investments | |
Short-Term Investment-Grade Fund | 12.3% |
Total | 100.0% |
Volatility Measures | | |
| | Composite |
| Fund | Index2 |
R-Squared | 0.98 | 1.00 |
Beta | 1.05 | 1.00 |
Equity Investment Focus
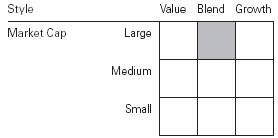
Fixed Income Investment Focus
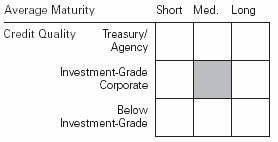
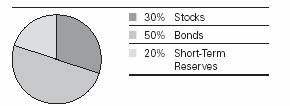
Fund Asset Allocation

1 For underlying funds, annualized.
2 The STAR Composite Index is weighted 50% MSCI US Broad Market Index, 25% Lehman Aggregate Bond Index, 12.5% Lehman 1–5 Year U.S. Credit Index, and 12.5% MSCI EAFE Index.
See page 17 for a glossary of investment terms.
6
Performance Summary
All of the returns in this report represent past performance, which is not a guarantee of future results that may be achieved by the fund. (Current performance may be lower or higher than the performance data cited. For performance data current to the most recent month-end, visit our website at www.vanguard.com.) Note, too, that both investment returns and principal value can fluctuate widely, so an investor’s shares, when sold, could be worth more or less than their original cost. The returns shown do not reflect taxes that a shareholder would pay on fund distributions or on the sale of fund shares.
Fiscal-Year Total Returns (%): October 31, 1995–April 30, 2006 | | | |
| | | | |
| | | STAR Fund | Composite1 |
Fiscal | Capital | Income | Total | Total |
Year | Return | Return | Return | Return |
1996 | 13.1% | 4.3% | 17.4% | 14.3% |
1997 | 17.9 | 4.1 | 22.0 | 19.5 |
1998 | 5.8 | 3.4 | 9.2 | 4.4 |
1999 | 7.3 | 3.4 | 10.7 | 15.7 |
2000 | 8.6 | 3.9 | 12.5 | 14.0 |
2001 | –6.4 | 3.3 | –3.1 | –13.4 |
2002 | –9.4 | 2.9 | –6.5 | –8.4 |
2003 | 15.7 | 3.3 | 19.0 | 18.1 |
2004 | 7.5 | 2.6 | 10.1 | 7.7 |
2005 | 6.8 | 2.5 | 9.3 | 8.2 |
20062 | 7.4 | 1.5 | 8.9 | 9.5 |
| | | | | | |
Average Annual Total Returns: Periods Ended March 31, 2006
This table presents average annual total returns through the latest calendar quarter—rather than through the end of the fiscal period. Securities and Exchange Commission rules require that we provide this information.
| | | | | | Ten Years |
| Inception Date | One Year | Five Years | Capital | Income | Total |
STAR Fund | 3/29/1985 | 12.20% | 7.24% | 6.31% | 3.28% | 9.59% |
1 The STAR Composite Average, which is derived from data provided by Lipper Inc., is weighted 62.5% average general equity fund, 25% average fixed income fund, and 12.5% average money market fund through December 31, 2002; and 50% average general equity fund, 25% average fixed income fund, 12.5% average 1–5 year investment-grade fund, and 12.5% average international fund thereafter.
2 Six months ended April 30, 2006.
Note: See Financial Highlights table on page 12 for dividend and capital gains information.
7
Financial Statements (unaudited)
Statement of Net Assets
As of April 30, 2006
The fund provides a complete list of its holdings four times in each fiscal year, at the quarter-ends. For the second and fourth fiscal quarters, the lists appear in the fund’s semiannual and annual reports to shareholders. For the first and third fiscal quarters, the fund files the lists with the Securities and Exchange Commission on Form N-Q. Shareholders can look up the fund’s Forms N-Q on the SEC’s website at www.sec.gov. Forms N-Q may also be reviewed and copied at the SEC’s Public Reference Room (see the back cover of this report for further information).
| | Market |
| | Value• |
| Shares | ($000) |
Investment Companies (100.0%) | | |
U.S. Stock Funds (50.1%) | | |
Vanguard Windsor II Fund Investor Shares | 63,988,937 | 2,131,471 |
Vanguard Windsor Fund Investor Shares | 62,793,651 | 1,162,938 |
Vanguard PRIMECAP Fund Investor Shares | 12,757,981 | 906,072 |
Vanguard Morgan Growth Fund Investor Shares | 47,991,102 | 901,753 |
Vanguard U.S. Growth Fund Investor Shares | 48,907,348 | 889,625 |
Vanguard Explorer Fund Investor Shares | 6,698,507 | 561,402 |
| | 6,553,261 |
International Stock Funds (12.6%) | | |
Vanguard International Value Fund Investor Shares | 20,447,465 | 828,327 |
Vanguard International Growth Fund Investor Shares | 34,218,086 | 825,682 |
| | 1,654,009 |
Bond Funds (24.9%) | | |
Vanguard GNMA Fund Investor Shares | 161,655,201 | 1,629,484 |
Vanguard Long-Term Investment-Grade Fund Investor Shares | 184,495,881 | 1,629,099 |
| | 3,258,583 |
Short Term Bond Fund (12.2%) | | |
Vanguard Short-Term Investment-Grade Fund Investor Shares | 153,234,974 | 1,602,838 |
| | |
Money Market Fund (0.2%) | | |
Vanguard Market Liquidity Fund, 4.771%1 | 25,659,773 | 25,660 |
Total Investments | | |
(Cost $9,826,738) | | 13,094,351 |
8
| Market |
| Value• |
| ($000) |
Other Assets And Liabilities (0.0%) | |
Other Assets | 29,113 |
Liabilities | (30,861) |
| (1,748) |
Net Assets (100%) | |
Applicable to 639,015,090 outstanding $.001 par value shares | |
of beneficial interest (unlimited authorization) | 13,092,603 |
Net Asset Value Per Share | $20.49 |
At April 30, 2006, net assets consisted of:2 | | |
| Amount | Per |
| ($000) | Share |
Paid-in Capital | 9,604,632 | $15.03 |
Undistributed Net Investment Income | 74,859 | .12 |
Accumulated Net Realized Gains | 145,499 | .23 |
Unrealized Appreciation | 3,267,613 | 5.11 |
Net Assets | 13,092,603 | $20.49 |
• See Note A in Notes to Financial Statements.
1 Affiliated money market fund available only to Vanguard funds and certain trusts and accounts managed by Vanguard. Rate shown is the 7-day yield.
2 See Note C in Notes to Financial Statements for the tax-basis components of net assets.
9
Statement of Operations
| Six Months Ended |
| April 30, 2006 |
| ($000) |
Investment Income | |
Income | |
Income Distributions Received | 177,040 |
Net Investment Income—Note B | 177,040 |
Realized Net Gain (Loss) | |
Capital Gain Distributions Received | 237,360 |
Investment Securities Sold | 15,479 |
Realized Net Gain (Loss) | 252,839 |
Change in Unrealized Appreciation (Depreciation) of Investment Securities | 614,286 |
Net Increase (Decrease) in Net Assets Resulting from Operations | 1,044,165 |
10
Statement of Changes in Net Assets
| Six Months Ended | Year Ended |
| Apr. 30, | Oct. 31, |
| 2006 | 2005 |
| ($000) | ($000) |
Increase (Decrease) in Net Assets | | |
Operations | | |
Net Investment Income | 177,040 | 269,847 |
Realized Net Gain (Loss) | 252,839 | (21,550) |
Change in Unrealized Appreciation (Depreciation) | 614,286 | 706,472 |
Net Increase (Decrease) in Net Assets Resulting from Operations | 1,044,165 | 954,769 |
Distributions | | |
Net Investment Income | (175,468) | (253,820) |
Realized Capital Gain1 | (33,278) | — |
Total Distributions | (208,746) | (253,820) |
Capital Share Transactions—Note E | | |
Issued | 1,103,104 | 1,469,838 |
Issued in Lieu of Cash Distributions | 201,835 | 245,455 |
Redeemed | (594,798) | (951,914) |
Net Increase (Decrease) from Capital Share Transactions | 710,141 | 763,379 |
Total Increase (Decrease) | 1,545,560 | 1,464,328 |
Net Assets | | |
Beginning of Period | 11,547,043 | 10,082,715 |
End of Period2 | 13,092,603 | 11,547,043 |
1 Includes fiscal 2006 short-term gain distributions totaling $33,278,000. Short-term gain distributions are treated as ordinary income dividends for tax purposes.
2 Net Assets—End of Period includes undistributed net investment income of $74,859,000 and $73,287,000.
11
Financial Highlights
| | | | | | |
| Six Months | | | | | | |
| Ended | | | | Jan. 1 to | Year Ended |
For a Share Outstanding | Apr. 30, | Year Ended October 31, | Oct. 31, | Dec. 31, |
Throughout Each Period | 2006 | 2005 | 2004 | 2003 | 2002 | 20011 | 2000 |
Net Asset Value, | | | | | | | |
Beginning of Period | $19.14 | $17.92 | $16.67 | $14.41 | $15.92 | $17.81 | $18.21 |
Investment Operations | | | | | | | |
Net Investment Income | .290 | .46 | .41 | .40 | .480 | .41 | .65 |
Capital Gain | | | | | | | |
Distributions Received | .380 | .01 | — | — | .181 | — | 1.07 |
Net Realized and Unrealized | | | | | | | |
Gain (Loss) on Investments | 1.025 | 1.19 | 1.26 | 2.28 | (1.656) | (1.19) | .17 |
Total from | | | | | | | |
Investment Operations | 1.695 | 1.66 | 1.67 | 2.68 | (.995) | (.78) | 1.89 |
Distributions | | | | | | | |
Dividends from | | | | | | | |
Net Investment Income | (.290) | (.44) | (.42) | (.42) | (.500) | (.26) | (.64) |
Distributions from | | | | | | | |
Realized Capital Gains | (.055) | — | — | — | (.015) | (.85) | (1.65) |
Total Distributions | (.345) | (.44) | (.42) | (.42) | (.515) | (1.11) | (2.29) |
Net Asset Value, | | | | | | | |
End of Period | $20.49 | $19.14 | $17.92 | $16.67 | $14.41 | $15.92 | $17.81 |
| | | | | | | |
Total Return | 8.93% | 9.33% | 10.14% | 18.96% | –6.53% | –4.47% | 10.96% |
| | | | | | | |
Ratios/Supplemental Data | | | | | | | |
Net Assets, | | | | | | | |
End of Period (Millions) | $13,093 | $11,547 | $10,083 | $8,671 | $7,225 | $7,850 | $8,119 |
Ratio of Total Expenses to | | | | | | | |
Average Net Assets—Note B | 0%2 | 0% | 0% | 0% | 0% | 0% | 0% |
Ratio of Net Investment | | | | | | | |
Income to Average Net Assets | 2.56%3 | 2.44% | 2.39% | 2.60% | 3.07% | 2.91%3 | 3.57% |
Portfolio Turnover Rate | 6%3 | 6% | 6% | 15% | 12% | 6% | 17% |
1 The fund’s fiscal year-end changed from December 31 to October 31, effective October 31, 2001.
2 The average weighted annualized expense ratio of the underlying funds was 0.36%.
3 Annualized.
See accompanying Notes, which are an integral part of the Financial Statements.
12
Notes to Financial Statements
Vanguard STAR Fund is registered under the Investment Company Act of 1940 as an open-end investment company, or mutual fund. The fund follows a balanced investment strategy by investing in selected Vanguard funds. The fund invests 60% to 70% of its net assets in stock funds (predominantly large-capitalization U.S. stock funds), 20% to 30% in intermediate- to long-term bond funds, and 10% to 20% in a short-term bond fund.
A. The following significant accounting policies conform to generally accepted accounting principles for U.S. mutual funds. The fund consistently follows such policies in preparing its financial statements.
1. Valuation: Investments are valued at the net asset value of each underlying Vanguard fund determined as of the close of the New York Stock Exchange (generally 4:00 p.m. Eastern time) on the valuation date.
2. Federal Income Taxes: The fund intends to continue to qualify as a regulated investment company and distribute all of its taxable income. Accordingly, no provision for federal income taxes is required in the financial statements.
3. Distributions: Distributions to shareholders are recorded on the ex-dividend date.
4. Other: Income and capital gain distributions received are recorded on the ex-dividend date. Security transactions are accounted for on the date securities are bought or sold. Costs used to determine realized gains (losses) on the sale of investment securities are those of the specific securities sold.
B. Under a service agreement, The Vanguard Group furnishes corporate management, administrative, marketing, and distribution services to the fund. The service agreement provides that Vanguard will reimburse the fund’s expenses to the extent of savings in administrative and marketing costs realized by Vanguard in the operation of the fund. Accordingly, all expenses incurred by the fund during the six months ended April 30, 2006, were reimbursed by Vanguard. The fund’s trustees and officers are also directors and officers of Vanguard.
C. Distributions are determined on a tax basis and may differ from net investment income and realized capital gains for financial reporting purposes. Differences may be permanent or temporary. Permanent differences are reclassified among capital accounts in the financial statements to reflect their tax character. Temporary differences arise when certain items of income, expense, gain, or loss are recognized in different periods for financial statement and tax purposes; these differences will reverse at some time in the future. Differences in classification may also result from the treatment of short-term gains as ordinary income for tax purposes.
The fund’s tax-basis capital gains and losses are determined only at the end of each fiscal year. For tax purposes, at October 31, 2005, the fund had available realized losses of $73,047,000 to offset future net capital gains of $5,692,000 through October 31, 2010, $48,395,000 through October 31, 2011, and $18,960,000 through October 31, 2013. The fund will use these capital losses to offset net taxable capital gains, if any, realized during the year ending October 31, 2006; should the fund realize net capital losses for the year, the losses will be added to the loss carryforward balances above.
At April 30, 2006, net unrealized appreciation of investment securities for tax purposes was $3,267,613,000, consisting of unrealized gains of $3,333,659,000 on securities that had risen in value since their purchase and $66,046,000 in unrealized losses on securities that had fallen in value since their purchase.
13
D. During the six months ended April 30, 2006, the fund purchased $1,302,245,000 of investment securities and sold $399,241,000 of investment securities other than temporary cash investments.
E. Capital shares issued and redeemed were:
| Six Months Ended | | Year Ended |
| April 30, 2006 | | October 31, 2005 |
| Shares | | Shares |
| (000) | | (000) |
Issued | 55,113 | | 78,208 |
Issued in Lieu of Cash Distributions | 10,261 | | 13,096 |
Redeemed | (29,700) | | (50,569) |
Net Increase (Decrease) in Shares Outstanding | 35,674 | | 40,735 |
14
About Your Fund’s Expenses
As a shareholder of the fund, you incur ongoing costs, which include costs for portfolio management, administrative services, and shareholder reports (like this one), among others. Operating expenses, which are deducted from a fund’s gross income, directly reduce the investment return of the fund.
A typical fund’s expenses are expressed as a percentage of its average net assets. The STAR Fund has no direct expenses, but bears its proportionate share of the expenses of the underlying funds in which it invests. These indirect expenses make up the fund’s average weighted expense ratio, also expressed as a percentage of average net assets.
The following examples are intended to help you understand the ongoing costs (in dollars) of investing in your fund and to compare these costs with those of other mutual funds. The examples are based on an investment of $1,000 made at the beginning of the period shown and held for the entire period The costs are calculated using the fund’s average weighted expense ratio.
The table below illustrates your fund’s costs in two ways:
• Based on actual fund return. This section helps you to estimate the actual expenses that you paid over the period. The “Ending Account Value” shown is derived from the fund’s actual return, and the third column shows the dollar amount that would have been paid by an investor who started with $1,000 in the fund. You may use the information here, together with the amount you invested, to estimate the expenses that you paid over the period.
To do so, simply divide your account value by $1,000 (for example, an $8,600 account value divided by $1,000 = 8.6), then multiply the result by the number given for your fund under the heading “Expenses Paid During Period.”
• Based on hypothetical 5% yearly return. This section is intended to help you compare your fund’s costs with those of other mutual funds. It assumes that the fund had a yearly return of 5% before expenses, but that the expense ratio is unchanged. In this case—because the return used is not the fund’s actual return—the results do not apply to your investment. The example is useful in making comparisons because the Securities and Exchange Commission requires all mutual funds to calculate expenses based on a 5% return. You can assess your fund’s costs by comparing this hypothetical example with the hypothetical examples that appear in shareholder reports of other funds.
Six Months Ended April 30, 2006 | | | |
| | | |
| Beginning | Ending | Expenses |
| Account Value | Account Value | Paid During |
STAR Fund | 10/31/2005 | 4/30/2006 | Period1 |
Based on Actual Fund Return | $1,000.00 | $1,089.31 | $1.86 |
Based on Hypothetical 5% Yearly Return | 1,000.00 | 1,023.01 | 1.81 |
1 These calculations are based on expenses incurred in the most recent fiscal period of each underlying fund. STAR Fund’s annualized average weighted expense ratio as of April 30, 2006, was 0.36%. The dollar amounts shown as “Expenses Paid” are equal to the annualized average weighted expense ratio multiplied by the average account value over the period, multiplied by the number of days in the most recent six-month period, then divided by the number of days in the most recent 12-month period.
15
Note that the expenses shown in the table are meant to highlight and help you compare ongoing costs only and do not reflect any transactional costs or account maintenance fees. They do not include your fund’s low-balance fee, which is described in the prospectus. If this fee were applied to your account, your costs would be higher. Your fund does not charge transaction fees, such as purchase or redemption fees, nor does it carry a “sales load.”
The calculations assume no shares were bought or sold during the period. Your actual costs may have been higher or lower, depending on the amount of your investment and the timing of any purchases or redemptions.
You can find more information about the fund’s expenses, including annual expense ratios, in the Financial Statements section of this report. For additional information on operating expenses and other shareholder costs, please refer to the fund prospectus.
16
Glossary
Average Weighted Expense Ratio. Funds that invest in other Vanguard funds incur no direct expenses, but do bear proportionate shares of the operating, administrative, and advisory expenses of the underlying funds. The average weighted expense ratio is the average of these expense ratios, weighted in proportion to the amount of the fund invested in each underlying fund.
Beta. A measure of the magnitude of a fund’s past share-price fluctuations in relation to the ups and downs of a given market index. The index is assigned a beta of 1.00. Compared with a given index, a fund with a beta of 1.20 typically would have seen its share price rise or fall by 12% when the index rose or fell by 10%. A fund’s beta should be reviewed in conjunction with its R-squared (see definition below). The lower the R-squared, the less correlation there is between the fund and the index, and the less reliable beta is as an indicator of volatility.
Expense Ratio. The percentage of a fund’s average net assets used to pay its annual administrative and advisory expenses. These expenses directly reduce returns to investors.
R-Squared. A measure of how much of a fund’s past returns can be explained by the returns from the market in general, as measured by a given index. If a fund’s total returns were precisely synchronized with an index’s returns, its R-squared would be 1.00. If the fund’s returns bore no relationship to the index’s returns, its R-squared would be 0.
Yield. A snapshot of a fund’s income from interest and dividends. The yield, expressed as a percentage of the fund’s net asset value, is based on income earned over the past 30 days and is annualized, or projected forward for the coming year.
17
This page intentionally left blank.
This page intentionally left blank.
The People Who Govern Your Fund
The trustees of your mutual fund are there to see that the fund is operated and managed in your best interests since, as a shareholder, you are a part owner of the fund. Your fund trustees also serve on the board of directors of The Vanguard Group, Inc., which is owned by the Vanguard funds and provides services to them on an at-cost basis.
A majority of Vanguard’s board members are independent, meaning that they have no affiliation with Vanguard or the funds they oversee, apart from the sizable personal investments they have made as private individuals.
Our independent board members bring distinguished backgrounds in business, academia, and public service to their task of working with Vanguard officers to establish the policies and oversee the activities of the funds. Among board members’ responsibilities are selecting investment advisors for the funds; monitoring fund operations, performance, and costs; reviewing contracts; nominating and selecting new trustees/directors; and electing Vanguard officers.
Each trustee serves a fund until its termination; or until the trustee’s retirement, resignation, or death; or otherwise as specified in the fund’s organizational documents. Any trustee may be removed at a shareholders’ meeting by a vote representing two-thirds of the net asset value of all shares of the fund together with shares of other Vanguard funds organized within the same trust. The table on these two pages shows information for each trustee and executive officer of the fund. The mailing address of the trustees and officers is P.O. Box 876, Valley Forge, PA 19482.
Chairman of the Board, Chief Executive Officer, and Trustee |
| |
John J. Brennan1 | |
Born 1954 | Principal Occupation(s) During the Past Five Years: Chairman of the Board, Chief Executive Officer, and Director/Trustee of The Vanguard Group, Inc., |
Trustee since May 1987; | and of each of the investment companies served by The Vanguard Group. |
Chairman of the Board and | |
Chief Executive Officer | |
135 Vanguard Funds Overseen | |
| |
Independent Trustees | |
| |
Charles D. Ellis | |
Born 1937 | Principal Occupation(s) During the Past Five Years: Applecore Partners (pro bono ventures in education); Senior Advisor to Greenwich Associates |
Trustee since January 2001 | (international business strategy consulting); Successor Trustee of Yale University; Overseer of the Stern School of Business at New York |
135 Vanguard Funds Overseen | University; Trustee of the Whitehead Institute for Biomedical Research. |
| |
| |
Rajiv L. Gupta | |
Born 1945 | Principal Occupation(s) During the Past Five Years: Chairman and Chief Executive Officer of Rohm and Haas Co. (chemicals); Board Member of the |
Trustee since December 20012 | American Chemistry Council; Director of Tyco International, Ltd. (diversified |
135 Vanguard Funds Overseen | manufacturing and services) (since 2005); Trustee of Drexel University and of the Chemical Heritage Foundation. |
| |
JoAnn Heffernan Heisen | |
Born 1950 | Principal Occupation(s) During the Past Five Years: Corporate Vice President and Chief Global Diversity Officer (since January 2006), Vice President |
Trustee since July 1998 | and Chief Information Officer (1997–2005), and Member of the Executive Committee of Johnson & Johnson (pharmaceuticals/consumer products); |
135 Vanguard Funds Overseen | Director of the University Medical Center at Princeton and Women’s Research and Education Institute. |
André F. Perold | |
Born 1952 | Principal Occupation(s) During the Past Five Years: George Gund Professor of |
Trustee since December 2004 | Finance and Banking, Harvard Business School (since 2000); Senior Associate |
135 Vanguard Funds Overseen | Dean, Director of Faculty Recruiting, and Chair of Finance Faculty, Harvard |
| Business School; Director and Chairman of UNX, Inc. (equities trading firm) |
| (since 2003); Director of registered investment companies advised by Merrill |
| Lynch Investment Managers and affiliates (1985–2004), Genbel Securities |
| Limited (South African financial services firm) (1999–2003), Gensec Bank |
| (1999–2003), Sanlam, Ltd. (South African insurance company) (2001–2003), and Stockback, Inc. (credit card firm) (2000–2002). |
| |
Alfred M. Rankin, Jr. | |
Born 1941 | Principal Occupation(s) During the Past Five Years: Chairman, President, Chief |
Trustee since January 1993 | Executive Officer, and Director of NACCO Industries, Inc. (forklift trucks/housewares/ |
135 Vanguard Funds Overseen | lignite); Director of Goodrich Corporation (industrial products/aircraft systems and |
| services); Director of Standard Products Company (supplier for the automotive |
| industry) until 1998. |
| |
J. Lawrence Wilson | |
Born 1936 | Principal Occupation(s) During the Past Five Years: Retired Chairman and Chief |
Trustee since April 1985 | Executive Officer of Rohm and Haas Co. (chemicals); Director of Cummins Inc. |
135 Vanguard Funds Overseen | (diesel engines), MeadWestvaco Corp. (packaging products), and Amerisource- |
| Bergen Corp. (pharmaceutical distribution); Trustee of Vanderbilt University and |
| of Culver Educational Foundation. |
| |
Executive Officers1 | |
| |
Heidi Stam | |
Born 1956 | Principal Occupation(s) During the Past Five Years: Principal of The Vanguard |
Secretary since July 2005 | Group, Inc., since November 1997; General Counsel of The Vanguard Group |
135 Vanguard Funds Overseen | since July 2005; Secretary of The Vanguard Group and of each of the investment |
| companies served by The Vanguard Group since July 2005. |
| |
Thomas J. Higgins | |
Born 1957 | Principal Occupation(s) During the Past Five Years: Principal of The Vanguard |
Treasurer since July 1998 | Group, Inc.; Treasurer of each of the investment companies served by The Vanguard Group. |
135 Vanguard Funds Overseen | |
| |
Vanguard Senior Management Team |
| |
R. Gregory Barton | |
Mortimer J. Buckley | |
James H. Gately | |
Kathleen C. Gubanich | |
F. William McNabb, III | |
Michael S. Miller | |
Ralph K. Packard | |
George U. Sauter | |
| |
Founder | |
| |
John C. Bogle | |
Chairman and Chief Executive Officer, 1974–1996 |
1 Officers of the funds are “interested persons” as defined in the Investment Company Act of 1940.
2 December 2002 for Vanguard Equity Income Fund, Vanguard Growth Equity Fund, the Vanguard Municipal Bond Funds, and the Vanguard State Tax-Exempt Funds.
More information about the trustees is in the Statement of Additional Information, available from The Vanguard Group.
P.O. Box 2600
Valley Forge, PA 19482-2600
Connect with Vanguard™ > www.vanguard.com
Fund Information > 800-662-7447 | Vanguard, STAR, Connect with Vanguard, Windsor, Explorer, Morgan, and the ship logo are trademarks of The Vanguard Group, Inc. | |
| |
Direct Investor Account Services > 800-662-2739 | |
| |
Institutional Investor Services > 800-523-1036 | | |
| All other marks are the exclusive property of their respective owners. | |
Text Telephone > 800-952-3335 | |
| | |
| All comparative mutual fund data are from Lipper Inc. or Morningstar, Inc., unless otherwise noted. | |
| |
This material may be used in conjunction with the offering of shares of any Vanguard fund only if preceded or accompanied by the fund’s current prospectus. | | |
You can obtain a free copy of Vanguard’s proxy voting guidelines by visiting our website, www.vanguard.com, and searching for “proxy voting guidelines,” or by calling Vanguard at 800-662-2739. They are also available from the SEC’s website, www.sec.gov. In addition, you may obtain a free report on how your fund voted the proxies for securities it owned during the 12 months ended June 30. To get the report, visit either www.vanguard.com or www.sec.gov. | |
| |
| |
| |
| |
| | |
| You can review and copy information about your fund at the SEC’s Public Reference Room in Washington, D.C. To find out more about this public service, call the SEC at 202-551-8090. Information about your fund is also available on the SEC’s website, and you can receive copies of this information, for a fee, by sending a request in either of two ways: via e-mail addressed to publicinfo@sec.gov or via regular mail addressed to the Public Reference Section, Securities and Exchange Commission, Washington, DC 20549-0102. | |
| |
| |
| |
| |
| |
| |
| |
| |
| |
| | |
| | |
| | |
| © 2006 The Vanguard Group, Inc. | |
| All rights reserved. | |
| Vanguard Marketing Corporation, Distributor. | |
| | |
| Q562 062006 | |
Vanguard® LifeStrategy® Funds | |
| |
| |
> Semiannual Report | |
| |
| |
| |
| |
| |
April 30, 2006 | |
| |
| |
| |
| |
| |
| |
|
|
| |
| |
| |
| |
| |
| |
Vanguard LifeStrategy Income Fund | |
| |
Vanguard LifeStrategy Conservative Growth Fund |
| |
Vanguard LifeStrategy Moderate Growth Fund |
| |
Vanguard LifeStrategy Growth Fund | |
> Robust economic growth spurred stock markets to strong gains over the six months ended April 30, 2006, which favored the two more aggressive LifeStrategy portfolios.
> Weak returns for bonds restrained returns for the two more conservative LifeStrategy funds.
> For the six-month period, results for the four funds ranged from 3.5% for the most conservative fund to 11.4% for the most aggressive.
Contents | |
| |
Your Fund’s Total Returns | 1 |
Chairman’s Letter | 2 |
LifeStrategy Income Fund | 7 |
LifeStrategy Conservative Growth Fund | 16 |
LifeStrategy Moderate Growth Fund | 25 |
LifeStrategy Growth Fund | 34 |
About Your Fund’s Expenses | 43 |
Glossary | 45 |
Please note: The opinions expressed in this report are just that—informed opinions. They should not be considered promises or advice. Also, please keep in mind that the information and opinions cover the period through the date on the cover of this report. Of course, the risks of investing in your fund are spelled out in the prospectus.
Your Fund’s Total Returns
Six Months Ended April 30, 2006 | |
| Total |
| Return |
Vanguard LifeStrategy Income Fund | 3.5% |
Income Composite Index1 | 2.8 |
Income Composite Average2 | 3.6 |
| |
Vanguard LifeStrategy Conservative Growth Fund | 6.1% |
Conservative Growth Composite Index1 | 5.4 |
Conservative Growth Composite Average2 | 6.3 |
| |
Vanguard LifeStrategy Moderate Growth Fund | 8.6% |
Moderate Growth Composite Index1 | 7.9 |
Moderate Growth Composite Average2 | 9.0 |
| |
Vanguard LifeStrategy Growth Fund | 11.4% |
Growth Composite Index1 | 10.6 |
Growth Composite Average2 | 11.8 |
Your Fund’s Performance at a Glance |
October 31, 2005–April 30, 2006 | | | | | |
| | | | | |
| | | Distributions Per Share | |
| Starting | Ending | | | |
| Share | Share | Income | Capital | SEC |
| Price | Price | Dividends | Gains | Yield3 |
Vanguard LifeStrategy Income Fund | $13.38 | $13.58 | $0.26 | $0.00 | 3.63% |
Vanguard LifeStrategy Conservative | | | | | |
Growth Fund | 15.24 | 15.91 | 0.26 | 0.00 | 3.02 |
Vanguard LifeStrategy Moderate | | | | | |
Growth Fund | 18.09 | 19.36 | 0.27 | 0.00 | 2.58 |
Vanguard LifeStrategy Growth Fund | 20.37 | 22.42 | 0.26 | 0.00 | 1.98 |
1 Total returns for the composite indexes are derived by applying the funds’ target allocations to the results of the following benchmarks: for U.S. stocks, the MSCI US Broad Market Index; for international stocks, the Morgan Stanley Capital International Europe, Australasia, Far East (MSCI EAFE) Index; for bonds, the Lehman Brothers Aggregate Bond Index; and for short-term investments, the Lehman 1–3 Year U.S. Credit Index.
2 Each average is a blended composite that weights the return of the average comparable mutual fund for each asset class in proportion to the target weighting of the appropriate LifeStrategy Fund. All average returns for funds are derived from data provided by Lipper Inc. The Income Composite Average is weighted 60% average fixed income fund, 20% average general equity fund, and 20% average money market fund. The Conservative Growth Composite Average is weighted 40% average fixed income fund, 35% average general equity fund, 20% average money market fund, and 5% average international fund. The Moderate Growth Composite Average is weighted 50% average general equity fund, 40% average fixed income fund, and 10% average international fund. The Growth Composite Average is weighted 65% average general equity fund, 20% average fixed income fund, and 15% average international fund.
3 30-day advertised yield net of expenses at month-end.
1
Chairman’s Letter
Dear Shareholder,
Stock markets responded briskly to robust economic growth around the globe over the six-month period that ended April 30, 2006, translating into strong gains across the LifeStrategy Fund lineup. Six-month returns ranged from 11.4% for the LifeStrategy Growth Fund to 3.5% for the LifeStrategy Income Fund.
All four funds have one-quarter of their assets invested in Vanguard Asset Allocation Fund, which changes its allocations to stocks, bonds, and cash depending on which asset class is expected to have the highest return. The Asset Allocation Fund held 100% stocks during the six-month period, boosting returns for all four LifeStrategy Funds, as stocks significantly outperformed fixed income investments.
The four funds outpaced their composite benchmark indexes but lagged their composite peer-group averages by less than half a percentage point.
The table on page 1 presents the funds’ starting and ending net asset values for the period, distributions, and annualized yields. The LifeStrategy Income Fund saw its yield increase 9 basis points (0.09%) to 3.63% during the six-month period.
2
Stocks continued their healthy climb despite high energy prices
Following a lackluster finish in 2005, U.S. stock prices climbed steadily during the first four months of 2006, ending near a five-year high. Despite continuing worries over rising energy costs and the possibility of inflation, investors’ confidence in the economy remained firm. The job market remained tight and retail sales were strong during the fiscal half-year.
Small-capitalization stocks in the United States continued to outperform their large-cap counterparts, as has been the general trend since the bear market ended in 2002. During the half-year, small-caps bested large-caps by a margin of 9 percentage points.
International stocks continued to produce outstanding gains, most notably in Japan and emerging markets.
The Fed continued its measured pace of raising short-term rates
For the six-month period, bonds provided slim returns as rising interest rates put a lid on bond performance. On March 28, the Federal Reserve Board raised its target for the federal funds rate to 4.75%, continuing its gradual tightening of monetary policy to defuse the threat of inflation. This was the Fed’s 15th consecutive rate increase since June 2004. (Shortly after the close of the fiscal period, the Fed extended its streak of rate increases to 16, raising its target to 5.00%.) Interest rate movements followed a normal pattern during the period, rising
Market Barometer | | | |
| | | Total Returns |
| | Periods Ended April 30, 2006 |
| Six Months | One Year | Five Years1 |
Stocks | | | |
Russell 1000 Index (Large-caps) | 9.9% | 16.7% | 3.4% |
Russell 2000 Index (Small-caps) | 18.9 | 33.5 | 10.9 |
Dow Jones Wilshire 5000 Index (Entire market) | 11.1 | 18.9 | 4.5 |
MSCI All Country World Index ex USA (International) | 25.0 | 38.1 | 11.4 |
| | | |
Bonds | | | |
Lehman Aggregate Bond Index (Broad taxable market) | 0.6% | 0.7% | 5.2% |
Lehman Municipal Bond Index | 1.6 | 2.2 | 5.4 |
Citigroup 3-Month Treasury Bill Index | 2.0 | 3.6 | 2.1 |
| | | |
CPI | | | |
Consumer Price Index | 1.2% | 3.5% | 2.6% |
| | | |
| | | |
| | | |
| | | |
1 Annualized. | | | |
3
across the maturity spectrum. Short-term and municipal securities outperformed long-term bonds.
International exposure continues to be a differentiator among funds
The LifeStrategy Funds are “funds of funds,” made up of varying combinations of underlying Vanguard mutual funds, primarily index funds that track the broad U.S. and international stock markets and the broad U.S. bond market. Performance for the six-month period—as in recent years—turned on whether each LifeStrategy Fund was exposed to international stocks. Vanguard Total International Stock Index Fund gained 24.2% during the fiscal half-year, a stellar return that boosted returns for the LifeStrategy Growth, LifeStrategy Moderate Growth, and LifeStrategy
Conservative Growth Funds. These funds have international weightings of 15%, 10%, and 5%, respectively. (You can review the proportions of your fund’s underlying holdings on the Fund Profile page.)
As mentioned earlier, all four funds have a 25% weighting in Vanguard Asset Allocation Fund, which gained 9.4% during the six months. The gain was similar to the 10.9% return for the Vanguard Total Stock Market Index Fund, also a holding in all four funds, at weightings of 50%, 35%, 20%, and 5%, respectively, as you move from LifeStrategy Growth to LifeStrategy Income.
Fixed income markets were less generous to investors, as bond prices adjusted downward to calibrate with rising interest rates. (As rates rise, the prices of existing
Annualized Expense Ratios | | |
Your fund compared with its peer group | | |
| Average | Peer-Group |
| Weighted | Expense |
| Expense Ratio1 | Ratio2 |
LifeStrategy Income Fund | 0.25% | 1.00% |
LifeStrategy Conservative Growth Fund | 0.25 | 1.11 |
LifeStrategy Moderate Growth Fund | 0.26 | 1.28 |
LifeStrategy Growth Fund | 0.26 | 1.39 |
1 | For underlying funds; annualized. The LifeStrategy Funds do not have expenses of their own, but they bear their share of the expenses of the underlying funds. |
2 | Peer groups are (from top to bottom) the Income Composite Average, the Conservative Growth Composite Average, the Moderate Growth Composite Average, and the Growth Composite Average. Each average is a blended composite that weights the expense of the average comparable mutual fund for each asset class in proportion to the target weighting of the appropriate LifeStrategy Fund. Peer-group expense ratios are derived from data provided by Lipper Inc. and capture information through year-end 2005. |
4
bonds fall until their yields to maturity are equal to those available from newly issued bonds.) Vanguard Total Bond Market Index Fund returned 0.5% during the six-month period; it has weightings of 10%, 30%, 30%, and 50%, in the four LifeStrategy funds, moving from growth to income. Vanguard Short-Term Investment-Grade Fund did slightly better, owing to the shorter average maturity of its bonds. The fund gained 1.7%; it is a holding in two of the funds—LifeStrategy Conservative Growth and LifeStrategy Income—at a 20% weighting in both.
LifeStrategy Funds serve a variety of needs
Vanguard LifeStrategy Funds offer four approaches to allocating assets among broadly diversified funds, primarily index funds. Relative returns during the most recent period provide a short-term illustration of our expectation for the funds over the long term. In exchange for accepting a higher level of risk and volatility, the most aggressive investors were rewarded with the highest return. In exchange for accepting more limited risk, conservative investors received lower returns, albeit better results than those available from an all-bond portfolio. There is no guarantee that returns will always follow this pattern—as anyone who invested during the most recent bear market knows. However, stocks have outperformed bonds over the long run, while bond-heavy portfolios have produced higher and steadier income for investors—truisms reflected in the options presented by the LifeStrategy series.
Total Returns | | | |
| Six Months Ended April 30, 2006 |
| Vanguard | Mutual | |
| Fund | Fund Average1 | Difference |
LifeStrategy Income Fund | 3.5% | 3.6% | –0.1% |
LifeStrategy Conservative Growth Fund | 6.1 | 6.3 | –0.2 |
LifeStrategy Moderate Growth Fund | 8.6 | 9.0 | –0.4 |
LifeStrategy Growth Fund | 11.4 | 11.8 | –0.4 |
| 1 | Each average is a blended composite that weights the the return of the average comparable mutual fund for each asset class in proportion to the target weighting of the appropriate LifeStrategy Fund. All average returns for funds are derived from data provided by Lipper Inc. |
5
Whether a Vanguard LifeStrategy Fund is the primary component of your investment program or just one part of it, each fund’s strategy can serve as a model for any portfolio. The funds’ emphasis on balance and broad diversification can put you in a good position to reach your long-term financial goals. We enhance the benefits of this approach by keeping your investment costs as low as possible. Unlike most funds-of-funds, those at Vanguard charge no fee on top of the expense ratios of the underlying funds, which are themselves extremely low compared with those of peer mutual funds. A bargain? No, simply the Vanguard philosophy that a greater share of the funds’ returns belongs with you, not us.
Thank you for entrusting your assets to Vanguard.
Sincerely,
John J. Brennan
Chairman and Chief Executive Officer
May 10, 2006
Target and Actual Asset Allocations
| Percentages as of April 30, 2006 |
| | | | | | Short-Term |
| Stocks1 | | Bonds | | Reserves |
| Target | Actual | | Target | Actual | | Target | Actual |
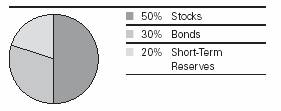
LifeStrategy Income Fund | 20% | 30% | | 60% | 50% | | 20% | 20% |
LifeStrategy Conservative Growth Fund | 40 | 50 | | 40 | 30 | | 20 | 20 |
LifeStrategy Moderate Growth Fund | 60 | 70 | | 40 | 30 | | 0 | 0 |
LifeStrategy Growth Fund | 80 | 90 | | 20 | 10 | | 0 | 0 |
| | | | | | | | | |
| 1 | Actual international stock positions for the Income, Conservative Growth, Moderate Growth, and Growth Funds equaled 0%, 5%, 10%, and 15% of assets respectively. |
6
LifeStrategy Income Fund
Fund Profile
As of April 30, 2006
Financial Attributes | |
| |
Yield | 3.6% |
Expense Ratio | 0% |
Average Weighted Expense Ratio1 | 0.25% |
Volatility Measures | | |
| | Income |
| | Composite |
| Fund | Index2 |
R-Squared | 0.97 | 1.00 |
Beta | 1.05 | 1.00 |
Allocation to Underlying Vanguard Funds |
| |
Total Bond Market Index Fund | 50.1% |
Asset Allocation Fund | 25.0 |
Short-Term Investment-Grade Fund | 19.9 |
Total Stock Market Index Fund | 5.0 |
Total | 100.0% |
Equity Investment Focus

Fixed Income Investment Focus

Fund Asset Allocation
1 For underlying funds; annualized.
2 60% Lehman Aggregate Bond Index, 20% Dow Jones Wilshire 5000 Index, and 20% Citigroup 3-Month Treasury Index through August 31, 2003; 60% Lehman Aggregate Bond Index, 20% Dow Jones Wilshire 5000 Index, and 20% Lehman 1–3 Year Credit Index through April 22, 2005; and 60% Lehman Aggregate Bond Index, 20% MSCI US Broad Market Index, and 20% Lehman 1–3 Year Credit Index thereafter.
See page 45 for a glossary of investment terms.
7
LifeStrategy Income Fund
Performance Summary
All of the returns in this report represent past performance, which is not a guarantee of future results that may be achieved by the fund. (Current performance may be lower or higher than the performance data cited. For performance data current to the most recent month-end, visit our website at www.vanguard.com.) Note, too, that both investment returns and principal value can fluctuate widely, so an investor’s shares, when sold, could be worth more or less than their original cost. The returns shown do not reflect taxes that a shareholder would pay on fund distributions or on the sale of fund shares.
Fiscal-Year Total Returns (%): October 31, 1995–April 30, 2006 |
| | | | Income |
Fiscal | Capital | Income | Total | Composite |
Year | Return | Return | Return | Index1 |
1996 | 4.2% | 5.5% | 9.7% | 8.9% |
1997 | 7.6 | 5.9 | 13.5 | 12.5 |
1998 | 6.8 | 5.4 | 12.2 | 10.0 |
1999 | 0.1 | 5.2 | 5.3 | 6.1 |
2000 | 1.7 | 5.8 | 7.5 | 7.4 |
2001 | –0.7 | 5.5 | 4.8 | 3.7 |
2002 | –5.3 | 4.5 | –0.8 | 1.3 |
2003 | 6.1 | 3.8 | 9.9 | 8.2 |
2004 | 2.8 | 3.4 | 6.2 | 5.9 |
2005 | –0.1 | 3.5 | 3.4 | 3.0 |
20062 | 1.5 | 2.0 | 3.5 | 2.8 |
Average Annual Total Returns: Periods Ended March 31, 2006
This table presents average annual total returns through the latest calendar quarter—rather than through the end of the fiscal period. Securities and Exchange Commission rules require that we provide this information.
| | | | | | Ten Years |
| Inception Date | One Year | Five Years | Capital | Income | Total |
LifeStrategy Income Fund | 9/30/1994 | 5.31% | 5.17% | 2.26% | 4.78% | 7.04% |
1 60% Lehman Aggregate Bond Index, 20% Dow Jones Wilshire 5000 Index, and 20% Citigroup 3-Month Treasury Index through August 31, 2003; 60% Lehman Aggregate Bond Index, 20% Dow Jones Wilshire 5000 Index, and 20% Lehman 1–3 Year Credit Index through April 22, 2005; and 60% Lehman Aggregate Bond Index, 20% MSCI US Broad Market Index, and 20% Lehman 1–3 Year Credit Index thereafter.
2 Six months ended April 30, 2006.
Note: See Financial Highlights table on page 13 for dividend and capital gains information.
8
LifeStrategy Income Fund
Financial Statements (unaudited)
Statement of Net Assets
As of April 30, 2006
The fund provides a complete list of its holdings four times in each fiscal year, at the quarter-ends. For the second and fourth fiscal quarters, the lists appear in the fund’s semiannual and annual reports to shareholders. For the first and third fiscal quarters, the fund files the lists with the Securities and Exchange Commission on Form N-Q. Shareholders can look up the fund’s Forms N-Q on the SEC’s website at www.sec.gov. Forms N-Q may also be reviewed and copied at the SEC’s Public Reference Room (see the back cover of this report for further information).
| | Market |
| | Value• |
| Shares | ($000) |
Investment Companies (99.9%) | | |
U.S. Stock Fund (5.0%) | | |
Vanguard Total Stock Market Index Fund Investor Shares | 2,558,882 | 81,475 |
| | |
Balanced Fund (25.0%) | | |
Vanguard Asset Allocation Fund Investor Shares | 15,254,859 | 407,610 |
| | |
Bond Fund (50.0%) | | |
Vanguard Total Bond Market Index Fund Investor Shares | 83,191,970 | 816,113 |
| | |
Short-Term Bond Fund (19.8%) | | |
Vanguard Short-Term Investment-Grade Fund Investor Shares | 31,014,309 | 324,410 |
| | |
Money Market Fund (0.1%) | | |
1 Vanguard Market Liquidity Fund, 4.771% | 2,282,377 | 2,282 |
Total Investment Companies (Cost $1,536,792) | | 1,631,890 |
Other Assets and Liabilities (0.1%) | | |
Other Assets | | 8,505 |
Liabilities | | (6,886) |
| | 1,619 |
Net Assets (100%) | | |
Applicable to 120,272,252 outstanding $.001 par value | | |
shares of beneficial interest (unlimited authorization) | | 1,633,509 |
Net Asset Value Per Share | | $13.58 |
9
LifeStrategy Income Fund
At April 30, 2006, net assets consisted of:2 | | |
| Amount | Per |
| ($000) | Share |
Paid-in Capital | 1,527,502 | $12.70 |
Undistributed Net Investment Income | 5,749 | .05 |
Accumulated Net Realized Gains | 5,160 | .04 |
Unrealized Appreciation | 95,098 | .79 |
Net Assets | 1,633,509 | $13.58 |
• See Note A in Notes to Financial Statements.
1 Affiliated money market fund available only to Vanguard funds and certain trusts and accounts managed by Vanguard. Rate shown is the 7-day yield.
2 See Note C in Notes to Financial Statements for the tax-basis components of net assets.
10
LifeStrategy Income Fund
Statement of Operations
| Six Months Ended |
| April 30, 2006 |
| ($000) |
Investment Income | |
Income | |
Income Distributions Received | 31,265 |
Net Investment Income—Note B | 31,265 |
Realized Net Gain (Loss) | |
Capital Gain Distributions Received | — |
Investment Securities Sold | 6,079 |
Realized Net Gain (Loss) | 6,079 |
Change in Unrealized Appreciation (Depreciation) of Investment Securities | 21,412 |
Net Increase (Decrease) in Net Assets Resulting from Operations | 58,756 |
11
LifeStrategy Income Fund
Statement of Changes in Net Assets
| Six Months Ended | Year Ended |
| Apr. 30, | Oct. 31, |
| 2006 | 2005 |
| ($000) | ($000) |
Increase (Decrease) in Net Assets | | |
Operations | | |
Net Investment Income | 31,265 | 59,375 |
Realized Net Gain (Loss) | 6,079 | 1,019 |
Change in Unrealized Appreciation (Depreciation) | 21,412 | (4,535) |
Net Increase (Decrease) in Net Assets Resulting from Operations | 58,756 | 55,859 |
Distributions | | |
Net Investment Income | (32,214) | (58,036) |
Realized Capital Gain | — | — |
Total Distributions | (32,214) | (58,036) |
Capital Share Transactions—Note E | | |
Issued | 166,614 | 456,934 |
Issued in Lieu of Cash Distributions | 29,908 | 53,907 |
Redeemed | (341,164) | (368,124) |
Net Increase (Decrease) from Capital Share Transactions | (144,642) | 142,717 |
Total Increase (Decrease) | (118,100) | 140,540 |
Net Assets | | |
Beginning of Period | 1,751,609 | 1,611,069 |
End of Period1 | 1,633,509 | 1,751,609 |
1 Net Assets—End of Period includes undistributed net investment income of $5,749,000 and $6,698,000.
12
LifeStrategy Income Fund
Financial Highlights
| For a Share Outstanding | Six Months
Ended
Apr. 30, | Year Ended October 31,
| Jan. 1 to
Oct. 31, | Year Ended
Dec. 31, |
|---|
| Throughout Each Period | 2006 | 2005 | 2004 | 2003 | 2002 | 20011 | 2000 |
|---|
|
| Net Asset Value, | | | | | | | |
| Beginning of Period | $13.38 | $13.39 | $13.03 | $12.28 | $12.97 | $13.01 | $12.82 |
|
| Investment Operations |
| Net Investment Income | .26 | .47 | .43 | .44 | .57 | .52 | .74 |
|
| Capital Gain |
| Distributions Received | — | — | .01 | — | — | — | .04 |
|
| Net Realized and Unrealized |
| Gain (Loss) on Investments | .20 | (.02) | .35 | .76 | (.67) | (.09) | .23 |
|
| Total from |
| Investment Operations | .46 | .45 | .79 | 1.20 | (.10) | .43 | 1.01 |
|
| Distributions |
| Dividends from |
| Net Investment Income | (.26) | (.46) | (.43) | (.45) | (.59) | (.45) | (.74) |
|
| Distributions from |
| Realized Capital Gains | — | — | — | — | — | (.02) | (.08) |
|
| Total Distributions | (.26) | (.46) | (.43) | (.45) | (.59) | (.47) | (.82) |
|
| Net Asset Value, |
| End of Period | $13.58 | $13.38 | $13.39 | $13.03 | $12.28 | $12.97 | $13.01 |
|
| Total Return | 3.45% | 3.39% | 6.15% | 9.95% | –0.79% | 3.42% | 8.06% |
|
| Ratios/Supplemental Data |
|
| Net Assets, |
| End of Period (Millions) | $1,634 | $1,752 | $1,611 | $1,305 | $1,001 | $790 | $632 |
|
| Ratio of Total Expenses to |
| Average Net Assets—Note B | 0%2 | 0% | 0% | 0% | 0% | 0% | 0% |
|
| Ratio of Net Investment |
| Income to Average |
| Net Assets | 3.75%3 | 3.47% | 3.31% | 3.53% | 4.64% | 4.87%3 | 5.84% |
|
| Portfolio Turnover Rate | 16%3 | 6% | 4% | 4% | 10% | 4% | 17% |
|
1 | The fund’s fiscal year-end changed from December 31 to October 31, effective October 31, 2001. |
2 | The average weighted expense ratio of the underlying funds was 0.25%. |
3 | Annualized. |
13
LifeStrategy Income Fund
Notes to Financial Statements
Vanguard LifeStrategy Income Fund is registered under the Investment Company Act of 1940 as an open-end investment company, or mutual fund. The fund files reports with the SEC under the company name Vanguard STAR Funds. The fund follows a balanced investment strategy by investing in selected Vanguard funds to achieve its targeted allocation of assets to U.S. stocks, bonds, and short-term reserves.
A. The following significant accounting policies conform to generally accepted accounting principles for U.S. mutual funds. The fund consistently follows such policies in preparing its financial statements.
1. Valuation: Investments are valued at the net asset value of each underlying Vanguard fund determined as of the close of the New York Stock Exchange (generally 4:00 p.m. Eastern time) on the valuation date.
2. Federal Income Taxes: The fund intends to continue to qualify as a regulated investment company and distribute all of its taxable income. Accordingly, no provision for federal income taxes is required in the financial statements.
3. Distributions: Distributions to shareholders are recorded on the ex-dividend date.
4. Other: Income and capital gain distributions received are recorded on the ex-dividend date. Security transactions are accounted for on the date securities are bought or sold. Costs used to determine realized gains (losses) on the sale of investment securities are those of the specific securities sold.
B. Under a service agreement, The Vanguard Group furnishes corporate management, administrative, marketing, and distribution services to the fund. The service agreement provides that Vanguard will reimburse the fund’s expenses to the extent of savings in administrative and marketing costs realized by Vanguard in the operation of the fund. Accordingly, all expenses incurred by the fund during the six months ended April 30, 2006, were reimbursed by Vanguard. The fund’s trustees and officers are also directors and officers of Vanguard.
C. Distributions are determined on a tax basis and may differ from net investment income and realized capital gains for financial reporting purposes. Differences may be permanent or temporary. Permanent differences are reclassified among capital accounts in the financial statements to reflect their tax character. Temporary differences arise when certain items of income, expense, gain, or loss are recognized in different periods for financial statement and tax purposes; these differences will reverse at some time in the future. Differences in classification may also result from the treatment of short-term gains as ordinary income for tax purposes.
The fund’s tax-basis capital gains and losses are determined only at the end of each fiscal year. For tax purposes, at October 31, 2005, the fund had available realized losses of $260,000 to offset future net capital gains through October 31, 2011. The fund will use these capital losses to offset net taxable capital gains, if any, realized during the year ending October 31, 2006; should the fund realize net capital losses for the year, the losses will be added to the loss carryforward balance above.
At April 30, 2006, net unrealized appreciation of investment securities for tax purposes was $95,098,000, consisting of unrealized gains of $129,834,000 on securities that had risen in value since their purchase
and $34,736,000 in unrealized losses on securities that had fallen in value since their purchase.
14
LifeStrategy Income Fund
D. During the six months ended April 30, 2006, the fund purchased $137,256,000 of investment securities and sold $284,811,000 of investment securities other than temporary cash investments.
E. Capital shares issued and redeemed were:
| Six Months Ended | | Year Ended |
| April 30, 2006 | | October 31, 2005 |
| (000) | | (000) |
Issued | 12,282 | | 33,860 |
Issued in Lieu of Cash Distributions | 2,208 | | 4,009 |
Redeemed | (25,129) | | (27,277) |
Net Increase (Decrease) in Shares Outstanding | (10,639) | | 10,592 |
15
LifeStrategy Conservative Growth Fund
Fund Profile
As of April 30, 2006
Financial Attributes | |
| |
Yield | 3.0% |
Expense Ratio | 0% |
Average Weighted Expense Ratio1 | 0.25% |
Volatility Measures | | |
| | Conservative |
| | Growth |
| | Composite |
| Fund | Index2 |
R-Squared | 0.99 | 1.00 |
Beta | 1.11 | 1.00 |
Allocation to Underlying Vanguard Funds |
| |
Total Bond Market Index Fund | 30.1% |
Asset Allocation Fund | 25.1 |
Total Stock Market Index Fund | 20.0 |
Short-Term Investment-Grade Fund | 19.8 |
Total International Stock Index Fund | 5.0 |
Total | 100.0% |
Equity Investment Focus
Fixed Income Investment Focus
Fund Asset Allocation
1 For underlying funds; annualized.
2 40% Lehman Aggregate Bond Index, 35% Dow Jones Wilshire 5000 Index, 20% Citigroup 3-Month Treasury Index, and 5% MSCI EAFE Index through August 31, 2003; 40% Lehman Aggregate Bond Index, 35% Dow Jones Wilshire 5000 Index, 20% Lehman 1–3 Year Credit Index, and 5% MSCI EAFE Index through April 22, 2005; and 40% Lehman Aggregate Bond Index, 35% MSCI US Broad Market Index, 20% Lehman 1–3 Year Credit Index, and 5% MSCI EAFE Index thereafter.
See page 45 for a glossary of investment terms.
16
LifeStrategy Conservative Growth Fund
Performance Summary
All of the returns in this report represent past performance, which is not a guarantee of future results that may be achieved by the fund. (Current performance may be lower or higher than the performance data cited. For performance data current to the most recent month-end, visit our website at www.vanguard.com.) Note, too, that both investment returns and principal value can fluctuate widely, so an investor’s shares, when sold, could be worth more or less than their original cost. The returns shown do not reflect taxes that a shareholder would pay on fund distributions or on the sale of fund shares.
Fiscal-Year Total Returns (%): October 31, 1995–April 30, 2006 |
| | | | Conservative |
| | | | Growth |
Fiscal | Capital | Income | Total | Composite |
Year | Return | Return | Return | Index1 |
1996 | 7.2% | 4.9% | 12.1% | 11.4% |
1997 | 11.5 | 4.9 | 16.4 | 15.7 |
1998 | 8.5 | 4.5 | 13.0 | 11.0 |
1999 | 5.5 | 4.5 | 10.0 | 11.0 |
2000 | 2.5 | 4.8 | 7.3 | 7.0 |
2001 | –7.6 | 4.3 | –3.3 | –4.6 |
2002 | –7.7 | 3.6 | –4.1 | –2.5 |
2003 | 10.6 | 3.4 | 14.0 | 12.2 |
2004 | 4.7 | 2.8 | 7.5 | 7.2 |
2005 | 2.8 | 3.0 | 5.8 | 5.2 |
20062 | 4.4 | 1.7 | 6.1 | 5.4 |
Average Annual Total Returns: Periods Ended March 31, 2006
This table presents average annual total returns through the latest calendar quarter—rather than through the end of the fiscal period. Securities and Exchange Commission rules require that we provide this information.
| | | | Ten Years |
| Inception Date | One Year | Five Years | Capital | Income | Total |
LifeStrategy Conservative Growth Fund | 9/30/1994 | 8.22% | 5.80% | 3.66% | 3.98% | 7.64% |
1 40% Lehman Aggregate Bond Index, 35% Dow Jones Wilshire 5000 Index, 20% Citigroup 3-Month Treasury Index, and 5% MSCI EAFE Index through August 31, 2003; 40% Lehman Aggregate Bond Index, 35% Dow Jones Wilshire 5000 Index, 20% Lehman 1–3 Year Credit Index, and 5% MSCI EAFE Index through April 22, 2005; and 40% Lehman Aggregate Bond Index, 35% MSCI US Broad Market Index, 20% Lehman 1–3 Year Credit Index, and 5% MSCI EAFE Index thereafter.
2 Six months ended April 30, 2006.
Note: See Financial Highlights table on page 22 for dividend and capital gains information.
17
LifeStrategy Conservative Growth Fund
Financial Statements (unaudited)
Statement of Net Assets
As of April 30, 2006
The fund provides a complete list of its holdings four times in each fiscal year, at the quarter-ends. For the second and fourth fiscal quarters, the lists appear in the fund’s semiannual and annual reports to shareholders. For the first and third fiscal quarters, the fund files the lists with the Securities and Exchange Commission on Form N-Q. Shareholders can look up the fund’s Forms N-Q on the SEC’s website at www.sec.gov. Forms N-Q may also be reviewed and copied at the SEC’s Public Reference Room (see the back cover of this report for further information).
| | Market |
| | Value• |
| Shares | ($000) |
Investment Companies (99.9%) | | |
U.S. Stock Fund (19.9%) | | |
Vanguard Total Stock Market Index Fund Investor Shares | 28,915,955 | 920,684 |
| | |
International Stock Fund (5.0%) | | |
Vanguard Total International Stock Index Fund | 14,175,701 | 232,765 |
| | |
Balanced Fund (25.1%) | | |
Vanguard Asset Allocation Fund Investor Shares | 43,320,213 | 1,157,516 |
| | |
Bond Fund (30.0%) | | |
Vanguard Total Bond Market Index Fund Investor Shares | 141,390,058 | 1,387,036 |
| | |
Short-Term Bond Fund (19.8%) | | |
Vanguard Short-Term Investment-Grade Fund Investor Shares | 87,182,672 | 911,931 |
| | |
Money Market Fund (0.1%) | | |
1 Vanguard Market Liquidity Fund, 4.771% | 6,009,555 | 6,010 |
Total Investment Companies (Cost $4,060,160) | | 4,615,942 |
Other Assets and Liabilities (0.1%) | | |
Other Assets | | 19,994 |
Liabilities | | (16,252) |
| | 3,742 |
Net Assets (100%) | | |
Applicable to 290,424,827 outstanding $.001 par value | | |
shares of beneficial interest (unlimited authorization) | | 4,619,684 |
Net Asset Value Per Share | | $15.91 |
18
LifeStrategy Conservative Growth Fund
April 30, 2006, net assets consisted of:2 | | |
| Amount | Per |
| ($000) | Share |
Paid-in Capital | 4,059,584 | $13.99 |
Undistributed Net Investment Income | 9,882 | .03 |
Accumulated Net Realized Losses | (5,564) | (.02) |
Unrealized Appreciation | 555,782 | 1.91 |
Net Assets | 4,619,684 | $15.91 |
• See Note A in Notes to Financial Statements.
1 Affiliated money market fund available only to Vanguard funds and certain trusts and accounts managed by Vanguard. Rate shown is the 7-day yield.
2 See Note C in Notes to Financial Statements for the tax-basis components of net assets.
19
LifeStrategy Conservative Growth Fund
Statement of Operations
| Six Months Ended |
| April 30, 2006 |
| ($000) |
Investment Income | |
Income | |
Income Distributions Received | 71,054 |
Net Investment Income—Note B | 71,054 |
Realized Net Gain (Loss) | |
Capital Gain Distributions Received | — |
Investment Securities Sold | 6,299 |
Realized Net Gain (Loss) | 6,299 |
Change in Unrealized Appreciation (Depreciation) of Investment Securities | 180,850 |
Net Increase (Decrease) in Net Assets Resulting from Operations | 258,203 |
20
LifeStrategy Conservative Growth Fund
Statement of Changes in Net Assets
| Six Months Ended | Year Ended |
| Apr. 30, | Oct. 31, |
| 2006 | 2005 |
| ($000) | ($000) |
Increase (Decrease) in Net Assets | | |
Operations | | |
Net Investment Income | 71,054 | 113,239 |
Realized Net Gain (Loss) | 6,299 | 1,845 |
Change in Unrealized Appreciation (Depreciation) | 180,850 | 90,441 |
Net Increase (Decrease) in Net Assets Resulting from Operations | 258,203 | 205,525 |
Distributions | | |
Net Investment Income | (72,764) | (110,215) |
Realized Capital Gain | — | — |
Total Distributions | (72,764) | (110,215) |
Capital Share Transactions—Note E | | |
Issued | 702,433 | 1,055,629 |
Issued in Lieu of Cash Distributions | 70,779 | 106,775 |
Redeemed | (418,241) | (641,824) |
Net Increase (Decrease) from Capital Share Transactions | 354,971 | 520,580 |
Total Increase (Decrease) | 540,410 | 615,890 |
Net Assets | | |
Beginning of Period | 4,079,274 | 3,463,384 |
End of Period1 | 4,619,684 | 4,079,274 |
1 Net Assets—End of Period includes undistributed net investment income of $9,882,000 and $11,592,000.
21
LifeStrategy Conservative Growth Fund
Financial Highlights
| | | | | | | |
| Six Months
Ended | | | | Jan. 1 to | Year Ended |
For a Share Outstanding | Apr. 30, | Year Ended October 31, | Oct. 31, | Dec. 31, |
Throughout Each Period | 2006 | 2005 | 2004 | 2003 | 2002 | 20011 | 2000 |
Net Asset Value, | | | | | | | |
Beginning of Period | $15.24 | $14.83 | $14.17 | $12.81 | $13.88 | $14.71 | $15.10 |
Investment Operations | | | | | | | |
Net Investment Income | .25 | .44 | .40 | .39 | .51 | .45 | .70 |
Capital Gain | | | | | | | |
Distributions Received | — | — | (.02) | — | — | — | .06 |
Net Realized and Unrealized | | | | | | | |
Gain (Loss) on Investments | .68 | .41 | .67 | 1.37 | (1.06) | (.84) | (.29) |
Total from | | | | | | | |
Investment Operations | .93 | .85 | 1.05 | 1.76 | (.55) | (.39) | .47 |
Distributions | | | | | | | |
Dividends from | | | | | | | |
Net Investment Income | (.26) | (.44) | (.39) | (.40) | (.52) | (.40) | (.70) |
Distributions from | | | | | | | |
Realized Capital Gains | — | — | — | — | — | (.04) | (.16) |
Total Distributions | (.26) | (.44) | (.39) | (.40) | (.52) | (.44) | (.86) |
Net Asset Value, | | | | | | | |
End of Period | $15.91 | $15.24 | $14.83 | $14.17 | $12.81 | $13.88 | $14.71 |
| | | | | | | |
Total Return | 6.14% | 5.77% | 7.49% | 13.99% | –4.11% | –2.61% | 3.12% |
| | | | | | | |
Ratios/Supplemental Data | | | | | | | |
Net Assets, | | | | | | | |
End of Period (Millions) | $4,620 | $4,079 | $3,463 | $2,795 | $2,133 | $1,954 | $1,897 |
Ratio of Total Expenses to | | | | | | | |
Average Net Assets—Note B | 0%2 | 0% | 0% | 0% | 0% | 0% | 0% |
Ratio of Net Investment | | | | | | | |
Income to Average | | | | | | | |
Net Assets | 3.14%3 | 2.95% | 2.74% | 2.92% | 3.79% | 3.78%3 | 4.73% |
Portfolio Turnover Rate | 5%3 | 7% | 5% | 5% | 12% | 14% | 9% |
1 The fund’s fiscal year-end changed from December 31 to October 31, effective October 31, 2001.
2 The average weighted expense ratio of the underlying funds was 0.25%.
3 Annualized.
22
LifeStrategy Conservative Growth Fund
Notes to Financial Statements
Vanguard LifeStrategy Conservative Growth Fund is registered under the Investment Company Act of 1940 as an open-end investment company, or mutual fund. The fund files reports with the SEC under the company name Vanguard STAR Funds. The fund follows a balanced investment strategy by investing in selected Vanguard funds to achieve its targeted allocation of assets to U.S. stocks, international stocks, bonds, and short-term reserves.
A. The following significant accounting policies conform to generally accepted accounting principles for U.S. mutual funds. The fund consistently follows such policies in preparing its financial statements.
1. Valuation: Investments are valued at the net asset value of each underlying Vanguard fund determined as of the close of the New York Stock Exchange (generally 4:00 p.m. Eastern time) on the valuation date.
2. Federal Income Taxes: The fund intends to continue to qualify as a regulated investment company and distribute all of its taxable income. Accordingly, no provision for federal income taxes is required in the financial statements.
3. Distributions: Distributions to shareholders are recorded on the ex-dividend date.
4. Other: Income and capital gain distributions received are recorded on the ex-dividend date. Security transactions are accounted for on the date securities are bought or sold. Costs used to determine realized gains (losses) on the sale of investment securities are those of the specific securities sold.
B. Under a service agreement, The Vanguard Group furnishes corporate management, administrative, marketing, and distribution services to the fund. The service agreement provides that Vanguard will reimburse the fund’s expenses to the extent of savings in administrative and marketing costs realized by Vanguard in the operation of the fund. Accordingly, all expenses incurred by the fund during the six months ended April 30, 2006, were reimbursed by Vanguard. The fund’s trustees and officers are also directors and officers of Vanguard.
C. Distributions are determined on a tax basis and may differ from net investment income and realized capital gains for financial reporting purposes. Differences may be permanent or temporary. Permanent differences are reclassified among capital accounts in the financial statements to reflect their tax character. Temporary differences arise when certain items of income, expense, gain, or loss are recognized in different periods for financial statement and tax purposes; these differences will reverse at some time in the future. Differences in classification may also result from the treatment of short-term gains as ordinary income for tax purposes.
The fund’s tax-basis capital gains and losses are determined only at the end of each fiscal year. For tax purposes, at October 31, 2005, the fund had available realized losses of $10,993,000 to offset future net
capital gains of $4,499,000 through October 31, 2009; $1,074,000 through October 31, 2010; $4,848,000 through October 31, 2011; and $572,000 through October 31, 2012. The fund will use these capital losses to offset net taxable capital gains, if any, realized during the year ending October 31, 2006; should the fund realize net capital losses for the year, the losses will be added to the loss carryforward balances above.
At April 30, 2006, net unrealized appreciation of investment securities for tax purposes was $555,782,000, consisting of unrealized gains of $615,679,000 on securities that had risen in value since their purchase and $59,897,000 in unrealized losses on securities that had fallen in value since their purchase.
23
LifeStrategy Conservative Growth Fund
D. During the six months ended April 30, 2006, the fund purchased $483,449,000 of investment securities and sold $120,095,000 of investment securities other than temporary cash investments.
E. Capital shares issued and redeemed were:
| Six Months Ended | | Year Ended |
| April 30, 2006 | | October 31, 2005 |
| (000) | | (000) |
Issued | 44,841 | | 69,357 |
Issued in Lieu of Cash Distributions | 4,526 | | 7,025 |
Redeemed | (26,639) | | (42,155) |
Net Increase (Decrease) in Shares Outstanding | 22,728 | | 34,227 |
24
LifeStrategy Moderate Growth Fund
Fund Profile
As of April 30, 2006
Financial Attributes | |
| |
Yield | 2.6% |
Expense Ratio | 0% |
Average Weighted Expense Ratio1 | 0.26% |
Volatility Measures | | |
| | Moderate |
| | Growth |
| | Composite |
| Fund | Index2 |
R-Squared | 1.00 | 1.00 |
Beta | 1.07 | 1.00 |
Allocation to Underlying Vanguard Funds |
| |
Total Stock Market Index Fund | 35.0% |
Total Bond Market Index Fund | 29.8 |
Asset Allocation Fund | 25.0 |
Total International Stock Index Fund | 10.2 |
Total | 100.0% |
Equity Investment Focus
Fixed Income Investment Focus
Fund Asset Allocation
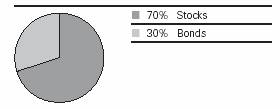
1 For underlying funds; annualized.
2 50% Dow Jones Wilshire 5000 Index, 40% Lehman Aggregate Bond Index, and 10% MSCI EAFE Index through April 22, 2005; and 50% MSCI US Broad Market Index, 40% Lehman Aggregate Bond Index, and 10% MSCI EAFE Index thereafter.
See page 45 for a glossary of investment terms.
25
LifeStrategy Moderate Growth Fund
Performance Summary
All of the returns in this report represent past performance, which is not a guarantee of future results that may be achieved by the fund. (Current performance may be lower or higher than the performance data cited. For performance data current to the most recent month-end, visit our website at www.vanguard.com.) Note, too, that both investment returns and principal value can fluctuate widely, so an investor’s shares, when sold, could be worth more or less than their original cost. The returns shown do not reflect taxes that a shareholder would pay on fund distributions or on the sale of fund shares.
Fiscal-Year Total Returns (%): October 31, 1995–April 30, 2006 |
| | | | Moderate |
| | | | Growth |
Fiscal | Capital | Income | Total | Composite |
Year | Return | Return | Return | Index1 |
1996 | 10.9% | 3.7% | 14.6% | 14.2% |
1997 | 15.7 | 3.9 | 19.6 | 19.6 |
1998 | 10.8 | 3.5 | 14.3 | 12.8 |
1999 | 10.7 | 3.6 | 14.3 | 15.0 |
2000 | 3.8 | 3.4 | 7.2 | 6.9 |
2001 | –13.7 | 3.0 | –10.7 | –10.9 |
2002 | –10.1 | 2.8 | –7.3 | –5.5 |
2003 | 15.0 | 3.1 | 18.1 | 16.9 |
2004 | 6.9 | 2.5 | 9.4 | 9.1 |
2005 | 5.4 | 2.6 | 8.0 | 7.5 |
20062 | 7.0 | 1.6 | 8.6 | 7.9 |
Average Annual Total Returns: Periods Ended March 31, 2006
This table presents average annual total returns through the latest calendar quarter—rather than through the end of the fiscal period. Securities and Exchange Commission rules require that we provide this information.
| | | | | | Ten Years |
| Inception Date | One Year | Five Years | Capital | Income | Total |
LifeStrategy Moderate Growth Fund | 9/30/1994 | 11.07% | 6.43% | 5.12% | 3.15% | 8.27% |
1 50% Dow Jones Wilshire 5000 Index, 40% Lehman Aggregate Bond Index, and 10% MSCI EAFE Index through April 22, 2005; and 50% MSCI US Broad Market Index, 40% Lehman Aggregate Bond Index, and 10% MSCI EAFE Index thereafter.
2 Six months ended April 30, 2006.
Note: See Financial Highlights table on page 31 for dividend and capital gains information.
26
LifeStrategy Moderate Growth Fund
Financial Statements (unaudited)
Statement of Net Assets
As of April 30, 2006
The fund provides a complete list of its holdings four times in each fiscal year, at the quarter-ends. For the second and fourth fiscal quarters, the lists appear in the fund’s semiannual and annual reports to shareholders. For the first and third fiscal quarters, the fund files the lists with the Securities and Exchange Commission on Form N-Q. Shareholders can look up the fund’s Forms N-Q on the SEC’s website at www.sec.gov. Forms N-Q may also be reviewed and copied at the SEC’s Public Reference Room (see the back cover of this report for further information).
| | Market |
| | Value• |
| Shares | ($000) |
Investment Companies (99.9%) | | |
U.S. Stock Fund (34.9%) | | |
Vanguard Total Stock Market Index Fund Investor Shares | 94,666,832 | 3,014,192 |
| | |
International Stock Fund (10.1%) | | |
Vanguard Total International Stock Index Fund | 53,329,181 | 875,665 |
| | |
Balanced Fund (25.0%) | | |
Vanguard Asset Allocation Fund Investor Shares | 80,533,227 | 2,151,848 |
| | |
Bond Fund (29.8%) | | |
Vanguard Total Bond Market Index Fund Investor Shares | 261,630,388 | 2,566,594 |
| | |
Money Market Fund (0.1%) | | |
1 Vanguard Market Liquidity Fund, 4.771% | 5,629,358 | 5,629 |
Total Investment Companies (Cost $7,135,977) | | 8,613,928 |
Other Assets and Liabilities (0.1%) | | |
Other Assets | | 27,887 |
Liabilities | | (22,048) |
| | 5,839 |
Net Assets (100%) | | |
Applicable to 445,231,231 outstanding $.001 par value | | |
shares of beneficial interest (unlimited authorization) | | 8,619,767 |
Net Asset Value Per Share | | $19.36 |
27
LifeStrategy Moderate Growth Fund
At April 30, 2006, net assets consisted of:2 | | |
| Amount | Per |
| ($000) | Share |
Paid-in Capital | 7,096,828 | $15.94 |
Undistributed Net Investment Income | 52,596 | .12 |
Accumulated Net Realized Losses | (7,608) | (.02) |
Unrealized Appreciation | 1,477,951 | 3.32 |
Net Assets | 8,619,767 | $19.36 |
•See Note A in Notes to Financial Statements.
1 Affiliated money market fund available only to Vanguard funds and certain trusts and accounts managed by Vanguard. Rate shown is the 7-day yield.
2 See Note C in Notes to Financial Statements for the tax-basis components of net assets.
28
LifeStrategy Moderate Growth Fund
Statement of Operations
| Six Months Ended |
| April 30, 2006 |
| ($000) |
Investment Income | |
Income | |
Income Distributions Received | 119,962 |
Net Investment Income—Note B | 119,962 |
Realized Net Gain (Loss) | |
Capital Gain Distributions Received | — |
Investment Securities Sold | 16,601 |
Realized Net Gain (Loss) | 16,601 |
Change in Unrealized Appreciation (Depreciation) of Investment Securities | 537,166 |
Net Increase (Decrease) in Net Assets Resulting from Operations | 673,729 |
29
LifeStrategy Moderate Growth Fund
Statement of Changes in Net Assets
| Six Months Ended | Year Ended |
| Apr. 30, | Oct. 31, |
| 2006 | 2005 |
| ($000) | ($000) |
Increase (Decrease) in Net Assets | | |
Operations | | |
Net Investment Income | 119,962 | 191,229 |
Realized Net Gain (Loss) | 16,601 | 1,974 |
Change in Unrealized Appreciation (Depreciation) | 537,166 | 348,929 |
Net Increase (Decrease) in Net Assets Resulting from Operations | 673,729 | 542,132 |
Distributions | | |
Net Investment Income | (117,732) | (176,538) |
Realized Capital Gain | — | — |
Total Distributions | (117,732) | (176,538) |
Capital Share Transactions—Note E | | |
Issued | 1,006,991 | 1,811,826 |
Issued in Lieu of Cash Distributions | 116,416 | 174,485 |
Redeemed | (837,775) | (1,169,645) |
Net Increase (Decrease) from Capital Share Transactions | 285,632 | 816,666 |
Total Increase (Decrease) | 841,629 | 1,182,260 |
Net Assets | | |
Beginning of Period | 7,778,138 | 6,595,878 |
End of Period1 | 8,619,767 | 7,778,138 |
1 Net Assets—End of Period includes undistributed net investment income of $52,596,000 and $50,366,000.
30
LifeStrategy Moderate Growth Fund
Financial Highlights
| Six Months | | | | | | |
| Ended | | | | Jan. 1 to | Year Ended |
For a Share Outstanding | Apr. 30, | Year Ended October 31, | Oct. 31, | Dec. 31, |
Throughout Each Period | 2006 | 2005 | 2004 | 2003 | 2002 | 20011 | 2000 |
Net Asset Value, | | | | | | | |
Beginning of Period | $18.09 | $17.17 | $16.06 | $13.96 | $15.52 | $17.25 | $18.18 |
Investment Operations | | | | | | | |
Net Investment Income | .27 | .47 | .39 | .345 | .45 | .35 | .64 |
Capital Gain | | | | | | | |
Distributions Received | — | — | .03 | — | .01 | — | .08 |
Net Realized and Unrealized | | | | | | | |
Gain (Loss) on Investments | 1.27 | .89 | 1.07 | 2.130 | (1.55) | (1.80) | (.87) |
Total from | | | | | | | |
Investment Operations | 1.54 | 1.36 | 1.49 | 2.475 | (1.09) | (1.45) | (.15) |
Distributions | | | | | | | |
Dividends from | | | | | | | |
Net Investment Income | (.27) | (.44) | (.38) | (.375) | (.47) | (.22) | (.64) |
Distributions from | | | | | | | |
Realized Capital Gains | — | — | — | — | — | (.06) | (.14) |
Total Distributions | (.27) | (.44) | (.38) | (.375) | (.47) | (.28) | (.78) |
Net Asset Value, | | | | | | | |
End of Period | $19.36 | $18.09 | $17.17 | $16.06 | $13.96 | $15.52 | $17.25 |
| | | | | | | |
Total Return | 8.58% | 7.97% | 9.37% | 18.06% | –7.30% | –8.48% | –0.88% |
| | | | | | | |
Ratios/Supplemental Data | | | | | | | |
Net Assets, | | | | | | | |
End of Period (Millions) | $8,620 | $7,778 | $6,596 | $5,246 | $3,897 | $4,077 | $3,911 |
Ratio of Total Expenses to | | | | | | | |
Average Net Assets—Note B | 0%2 | 0% | 0% | 0% | 0% | 0% | 0% |
Ratio of Net Investment | | | | | | | |
Income to Average | | | | | | | |
Net Assets | 2.71%3 | 2.61% | 2.36% | 2.39% | 2.98% | 2.69%3 | 3.59% |
Portfolio Turnover Rate | 11%3 | 8% | 6% | 5% | 15% | 16% | 12% |
1 The fund’s fiscal year-end changed from December 31 to October 31, effective October 31, 2001.
2 The average weighted expense ratio of the underlying funds was 0.26%.
3 Annualized.
31
LifeStrategy Moderate Growth Fund
Notes to Financial Statements
Vanguard LifeStrategy Moderate Growth Fund is registered under the Investment Company Act of 1940 as an open-end investment company, or mutual fund. The fund files reports with the SEC under the company name Vanguard STAR Funds. The fund follows a balanced investment strategy by investing in selected Vanguard funds to achieve its targeted allocation of assets to U.S. stocks, international stocks, bonds, and short-term reserves.
A. The following significant accounting policies conform to generally accepted accounting principles for U.S. mutual funds. The fund consistently follows such policies in preparing its financial statements.
1. Valuation: Investments are valued at the net asset value of each underlying Vanguard fund determined as of the close of the New York Stock Exchange (generally 4:00 p.m. Eastern time) on the valuation date.
2. Federal Income Taxes: The fund intends to continue to qualify as a regulated investment company and distribute all of its taxable income. Accordingly, no provision for federal income taxes is required in the financial statements.
3. Distributions: Distributions to shareholders are recorded on the ex-dividend date.
4. Other: Income and capital gain distributions received are recorded on the ex-dividend date. Security transactions are accounted for on the date securities are bought or sold. Costs used to determine realized gains (losses) on the sale of investment securities are those of the specific securities sold.
B. Under a service agreement, The Vanguard Group furnishes corporate management, administrative, marketing, and distribution services to the fund. The service agreement provides that Vanguard will reimburse the fund’s expenses to the extent of savings in administrative and marketing costs realized by Vanguard in the operation of the fund. Accordingly, all expenses incurred by the fund during the six months ended April 30, 2006, were reimbursed by Vanguard. The fund’s trustees and officers are also directors and officers of Vanguard and the funds in which the fund invests.
C. Distributions are determined on a tax basis and may differ from net investment income and realized capital gains for financial reporting purposes. Differences may be permanent or temporary. Permanent differences are reclassified among capital accounts in the financial statements to reflect their tax character. Temporary differences arise when certain items of income, expense, gain, or loss are recognized in different periods for financial statement and tax purposes; these differences will reverse at some time in the future. Differences in classification may also result from the treatment of short-term gains as ordinary income for tax purposes.
The fund’s tax-basis capital gains and losses are determined only at the end of each fiscal year. For tax purposes, at October 31, 2005, the fund had available realized losses of $21,663,000 to offset future net
capital gains of $8,488,000 through October 31, 2009; $8,038,000 through October 31, 2010; and $5,137,000 through October 31, 2011. The fund will use these capital losses to offset net taxable capital gains, if any, realized during the year ending October 31, 2006; should the fund realize net capital losses for the year, the losses will be added to the loss carryforward balances above.
At April 30, 2006, net unrealized appreciation of investment securities for tax purposes was $1,477,951,000, consisting of unrealized gains of $1,543,521,000 on securities that had risen in value since their purchase and $65,570,000 in unrealized losses on securities that had fallen in value since their purchase.
32
LifeStrategy Moderate Growth Fund
D. During the six months ended April 30, 2006, the fund purchased $733,515,000 of investment securities and sold $445,930,000 of investment securities, other than U.S. government securities and temporary cash investments.
E. Capital shares issued and redeemed were:
| Six Months Ended | | Year Ended |
| April 30, 2006 | | October 31, 2005 |
| (000) | | (000) |
Issued | 53,465 | | 101,565 |
Issued in Lieu of Cash Distributions | 6,283 | | 9,775 |
Redeemed | (44,562) | | (65,526) |
Net Increase (Decrease) in Shares Outstanding | 15,186 | | 45,814 |
33
LifeStrategy Growth Fund
Fund Profile
As of April 30, 2006
Financial Attributes | |
| |
Yield | 2.0% |
Expense Ratio | 0% |
Average Weighted Expense Ratio1 | 0.26% |
Volatility Measures | | |
| | Growth |
| | Composite |
| Fund | Index2 |
R-Squared | 1.00 | 1.00 |
Beta | 1.07 | 1.00 |
Allocation to Underlying Vanguard Funds |
| |
Total Stock Market Index Fund | 49.8% |
Asset Allocation Fund | 25.0 |
Total International Stock Index Fund | 15.3 |
Total Bond Market Index Fund | 9.9 |
Total | 100.0% |
Equity Investment Focus
Fixed Income Investment Focus
Fund Asset Allocation
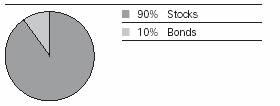
1 For underlying funds; annualized.
2 65% Dow Jones Wilshire 5000 Index, 20% Lehman Aggregate Bond Index, and 15% MSCI EAFE Index through April 22, 2005; and 65% MSCI US Broad Market Index, 20% Lehman Aggregate Bond Index, and 15% MSCI EAFE Index thereafter.
See page 45 for a glossary of investment terms.
34
LifeStrategy Growth Fund
Performance Summary
All of the returns in this report represent past performance, which is not a guarantee of future results that may be achieved by the fund. (Current performance may be lower or higher than the performance data cited. For performance data current to the most recent month-end, visit our website at www.vanguard.com.) Note, too, that both investment returns and principal value can fluctuate widely, so an investor’s shares, when sold, could be worth more or less than their original cost. The returns shown do not reflect taxes that a shareholder would pay on fund distributions or on the sale of fund shares.
Fiscal-Year Total Returns (%): October 31, 1995–April 30, 2006 |
| | | | Growth |
Fiscal | Capital | Income | Total | Composite |
Year | Return | Return | Return | Index1 |
1996 | 14.2% | 2.9% | 17.1% | 16.8% |
1997 | 19.5 | 3.0 | 22.5 | 22.7 |
1998 | 12.2 | 2.6 | 14.8 | 13.5 |
1999 | 16.6 | 2.8 | 19.4 | 20.0 |
2000 | 4.3 | 2.5 | 6.8 | 6.4 |
2001 | –20.1 | 1.9 | –18.2 | –18.4 |
2002 | –12.7 | 1.8 | –10.9 | –9.4 |
2003 | 19.9 | 2.2 | 22.1 | 20.9 |
2004 | 8.8 | 1.9 | 10.7 | 10.4 |
2005 | 8.1 | 2.2 | 10.3 | 9.8 |
20062 | 10.1 | 1.3 | 11.4 | 10.6 |
Average Annual Total Returns: Periods Ended March 31, 2006
This table presents average annual total returns through the latest calendar quarter—rather than through the end of the fiscal period. Securities and Exchange Commission rules require that we provide this information.
| | | | | | Ten Years |
| Inception Date | One Year | Five Years | Capital | Income | Total |
LifeStrategy Growth Fund | 9/30/1994 | 14.16% | 6.75% | 6.30% | 2.31% | 8.61% |
1 65% Dow Jones Wilshire 5000 Index, 20% Lehman Aggregate Bond Index, and 15% MSCI EAFE Index through April 22, 2005; and 65% MSCI US Broad Market Index, 20% Lehman Aggregate Bond Index, and 15% MSCI EAFE Index thereafter.
2 Six months ended April 30, 2006.
Note: See Financial Highlights table on page 40 for dividend and capital gains information.
35
LifeStrategy Growth Fund
Financial Statements (unaudited)
Statement of Net Assets
As of April 30, 2006
The fund provides a complete list of its holdings four times in each fiscal year, at the quarter-ends. For the second and fourth fiscal quarters, the lists appear in the fund’s semiannual and annual reports to shareholders. For the first and third fiscal quarters, the fund files the lists with the Securities and Exchange Commission on Form N-Q. Shareholders can look up the fund’s Forms N-Q on the SEC’s website at www.sec.gov. Forms N-Q may also be reviewed and copied at the SEC’s Public Reference Room (see the back cover of this report for further information).
| | Market |
| | Value• |
| Shares | ($000) |
Investment Companies (99.9%) | | |
U.S. Stock Fund (49.7%) | | |
Vanguard Total Stock Market Index Fund Investor Shares | 120,668,672 | 3,842,091 |
| | |
International Stock Fund (15.3%) | | |
Vanguard Total International Stock Index Fund | 71,898,198 | 1,180,568 |
| | |
Balanced Fund (24.9%) | | |
Vanguard Asset Allocation Fund Investor Shares | 72,062,725 | 1,925,516 |
| | |
Bond Fund (9.8%) | | |
Vanguard Total Bond Market Index Fund Investor Shares | 77,404,441 | 759,338 |
| | |
Money Market Fund (0.2%) | | |
1 Vanguard Market Liquidity Fund, 4.771% | 11,353,431 | 11,353 |
Total Investment Companies (Cost $6,087,870) | | 7,718,866 |
Other Assets and Liabilities (0.1%) | | |
Other Assets | | 22,320 |
Liabilities | | (14,817) |
| | 7,503 |
Net Assets (100%) | | |
Applicable to 344,691,938 outstanding $.001 par value | | |
shares of beneficial interest (unlimited authorization) | | 7,726,369 |
Net Asset Value Per Share | | $22.42 |
36
LifeStrategy Growth Fund
At April 30, 2006, net assets consisted of:2 | | |
| Amount | Per |
| ($000) | Share |
Paid-in Capital | 6,090,201 | $17.67 |
Undistributed Net Investment Income | 27,529 | .08 |
Accumulated Net Realized Losses | (22,357) | (.06) |
Unrealized Appreciation | 1,630,996 | 4.73 |
Net Assets | 7,726,369 | $22.42 |
• See Note A in Notes to Financial Statements.
1 Affiliated money market fund available only to Vanguard funds and certain trusts and accounts managed by Vanguard. Rate shown is the 7-day yield.
2 See Note C in Notes to Financial Statements for the tax-basis components of net assets.
37
LifeStrategy Growth Fund
Statement of Operations
| Six Months Ended |
| April 30, 2006 |
| ($000) |
Investment Income | |
Income | |
Income Distributions Received | 87,496 |
Net Investment Income—Note B | 87,496 |
Realized Net Gain (Loss) | |
Capital Gain Distributions Received | — |
Investment Securities Sold | 8,003 |
Realized Net Gain (Loss) | 8,003 |
Change in Unrealized Appreciation (Depreciation) of Investment Securities | 673,299 |
Net Increase (Decrease) in Net Assets Resulting from Operations | 768,798 |
38
LifeStrategy Growth Fund
Statement of Changes in Net Assets
| Six Months Ended | Year Ended |
| Apr. 30, | Oct. 31, |
| 2006 | 2005 |
| ($000) | ($000) |
Increase (Decrease) in Net Assets | | |
Operations | | |
Net Investment Income | 87,496 | 130,547 |
Realized Net Gain (Loss) | 8,003 | 198 |
Change in Unrealized Appreciation (Depreciation) | 673,299 | 456,988 |
Net Increase (Decrease) in Net Assets Resulting from Operations | 768,798 | 587,733 |
Distributions | | |
Net Investment Income | (85,909) | (122,372) |
Realized Capital Gain | — | — |
Total Distributions | (85,909) | (122,372) |
Capital Share Transactions—Note E | | |
Issued | 915,061 | 1,347,140 |
Issued in Lieu of Cash Distributions | 84,967 | 120,945 |
Redeemed | (561,239) | (863,880) |
Net Increase (Decrease) from Capital Share Transactions | 438,789 | 604,205 |
Total Increase (Decrease) | 1,121,678 | 1,069,566 |
Net Assets | | |
Beginning of Period | 6,604,691 | 5,535,125 |
End of Period1 | 7,726,369 | 6,604,691 |
1 Net Assets—End of Period includes undistributed net investment income of $27,529,000 and $25,942,000.
39
LifeStrategy Growth Fund
Financial Highlights
| | | | | | | |
| Six Months
Ended | | | | Jan. 1 to | Year Ended |
For a Share Outstanding | Apr. 30, | Year Ended October 31, | Oct. 31, | Dec. 31, |
Throughout Each Period | 2006 | 2005 | 2004 | 2003 | 2002 | 20011 | 2000 |
Net Asset Value, | | | | | | | |
Beginning of Period | $20.37 | $18.84 | $17.32 | $14.45 | $16.56 | $19.59 | $21.41 |
Investment Operations | | | | | | | |
Net Investment Income | .26 | .42 | .32 | .28 | .34 | .23 | .51 |
Capital Gain | | | | | | | |
Distributions Received | — | — | .16 | — | — | — | .10 |
Net Realized and Unrealized | | | | | | | |
Gain (Loss) on Investments | 2.05 | 1.51 | 1.36 | 2.87 | (2.10) | (3.04) | (1.75) |
Total from | | | | | | | |
Investment Operations | 2.31 | 1.93 | 1.84 | 3.15 | (1.76) | (2.81) | (1.14) |
Distributions | | | | | | | |
Dividends from | | | | | | | |
Net Investment Income | (.26) | (.40) | (.32) | (.28) | (.35) | (.16) | (.51) |
Distributions from | | | | | | | |
Realized Capital Gains | — | — | — | — | — | (.06) | (.17) |
Total Distributions | (.26) | (.40) | (.32) | (.28) | (.35) | (.22) | (.68) |
Net Asset Value, | | | | | | | |
End of Period | $22.42 | $20.37 | $18.84 | $17.32 | $14.45 | $16.56 | $19.59 |
| | | | | | | |
Total Return | 11.42% | 10.30% | 10.70% | 22.12% | –10.91% | –14.43% | –5.44% |
| | | | | | | |
Ratios/Supplemental Data | | | | | | | |
Net Assets, | | | | | | | |
End of Period (Millions) | $7,726 | $6,605 | $5,535 | $4,422 | $3,209 | $3,512 | $3,738 |
Ratio of Total Expenses to | | | | | | | |
Average Net Assets—Note B | 0%2 | 0% | 0% | 0% | 0% | 0% | 0% |
Ratio of Net Investment | | | | | | | |
Income to Average | | | | | | | |
Net Assets | 2.12%3 | 2.09% | 1.79% | 1.79% | 2.12% | 1.53%3 | 2.49% |
Portfolio Turnover Rate | 4%3 | 4% | 5% | 2% | 7% | 7% | 6% |
1 The fund’s fiscal year-end changed from December 31 to October 31, effective October 31, 2001.
2 The average weighted expense ratio of the underlying funds was 0.26%.
3 Annualized.
40
LifeStrategy Growth Fund
Notes to Financial Statements
Vanguard LifeStrategy Growth Fund is registered under the Investment Company Act of 1940 as an open-end investment company, or mutual fund. The fund files reports with the SEC under the company name Vanguard STAR Funds. The fund follows a balanced investment strategy by investing in selected Vanguard funds to achieve its targeted allocation of assets to U.S. stocks, international stocks, bonds, and short-term reserves.
A. The following significant accounting policies conform to generally accepted accounting principles for U.S. mutual funds. The fund consistently follows such policies in preparing its financial statements.
1. Valuation: Investments are valued at the net asset value of each underlying Vanguard fund determined as of the close of the New York Stock Exchange (generally 4:00 p.m. Eastern time) on the valuation date.
2. Federal Income Taxes: The fund intends to continue to qualify as a regulated investment company and distribute all of its taxable income. Accordingly, no provision for federal income taxes is required in the financial statements.
3. Distributions: Distributions to shareholders are recorded on the ex-dividend date.
4. Other: Income and capital gain distributions received are recorded on the ex-dividend date. Security transactions are accounted for on the date securities are bought or sold. Costs used to determine realized gains (losses) on the sale of investment securities are those of the specific securities sold.
B. Under a service agreement, The Vanguard Group furnishes corporate management, administrative, marketing, and distribution services to the fund. The service agreement provides that Vanguard will reimburse the fund’s expenses to the extent of savings in administrative and marketing costs realized by Vanguard in the operation of the fund. Accordingly, all expenses incurred by the fund during the six months ended April 30, 2006, were reimbursed by Vanguard. The fund’s trustees and officers are also directors and officers of Vanguard and the funds in which the fund invests.
C. Distributions are determined on a tax basis and may differ from net investment income and realized capital gains for financial reporting purposes. Differences may be permanent or temporary. Permanent differences are reclassified among capital accounts in the financial statements to reflect their tax character. Temporary differences arise when certain items of income, expense, gain, or loss are recognized in different periods for financial statement and tax purposes; these differences will reverse at
some time in the future. Differences in classification may also result from the treatment of short-term gains as ordinary income for tax purposes.
The fund’s tax-basis capital gains and losses are determined only at the end of each fiscal year. For tax purposes, at October 31, 2005, the fund had available realized losses of $28,125,000 to offset future net capital gains of $975,000 through October 31, 2009, $24,197,000 through October 31, 2010, and $2,953,000 through October 31, 2011. The fund will use these capital losses to offset net taxable capital gains, if any, realized during the year ending October 31, 2006; should the fund realize net capital losses for the year, the losses will be added to the loss carryforward balances above.
At April 30, 2006, net unrealized appreciation of investment securities for tax purposes was $1,630,996,000, consisting of unrealized gains of $1,648,645,000 on securities that had risen in value since their purchase and $17,649,000 in unrealized losses on securities that had fallen in value since their purchase.
41
LifeStrategy Growth Fund
D. During the six months ended April 30, 2006, the fund purchased $593,874,000 of investment securities and sold $159,359,000 of investment securities, other than U.S. government securities and temporary cash investments.
E. Capital shares issued and redeemed were:
| Six Months Ended | | Year Ended |
| April 30, 2006 | | October 31, 2005 |
| (000) | | (000) |
Issued | 42,472 | | 67,504 |
Issued in Lieu of Cash Distributions | 4,029 | | 6,061 |
Redeemed | (25,986) | | (43,217) |
Net Increase (Decrease) in Shares Outstanding | 20,515 | | 30,348 |
42
About Your Fund’s Expenses
As a shareholder of the fund, you incur ongoing costs, which include costs for portfolio management, administrative services, and shareholder reports (like this one), among others. Operating expenses, which are deducted from a fund’s gross income, directly reduce the investment return of the fund.
A typical fund’s expenses are expressed as a percentage of its average net assets. The LifeStrategy Funds have no direct expenses, but each fund bears its proportionate share of the expenses of the underlying funds in which it invests. These indirect expenses make up the fund’s average weighted expense ratio, also expressed as a percentage of average net assets.
The following examples are intended to help you understand the ongoing costs (in dollars) of investing in your fund and to compare these costs with those of other mutual funds. The examples are based on an investment of $1,000 made at the beginning of the period shown and held for the entire period. The costs are calculated using each fund’s average weighted expense ratio.
The table on page 44 illustrates your fund’s costs in two ways:
• Based on actual fund return. This section helps you to estimate the actual expenses that you paid over the period. The “Ending Account Value” shown is derived from the fund’s actual return, and the third column shows the dollar amount that would have been paid by an investor who started with $1,000 in the fund. You may use the information here, together with the amount you invested, to estimate the expenses that you paid over the period.
To do so, simply divide your account value by $1,000 (for example, an $8,600 account value divided by $1,000 = 8.6), then multiply the result by the number given for your fund under the heading “Expenses Paid During Period.”
• Based on hypothetical 5% yearly return. This section is intended to help you compare your fund’s costs with those of other mutual funds. It assumes that the fund had a yearly return of 5% before expenses, but that the expense ratio is unchanged. In this case—because the return used is not the fund’s actual return—the results do not apply to your investment. The example is useful in making comparisons because the Securities and Exchange Commission requires all mutual funds to calculate expenses based on a 5% return. You can assess your fund’s costs by comparing this hypothetical example with the hypothetical examples that appear in shareholder reports of other funds.
43
Six Months Ended April 30, 2006 | | | |
| Beginning | Ending | Expenses |
| Account Value | Account Value | Paid During |
| 10/31/2005 | 4/30/2006 | Period1 |
Based on Actual Fund Return | | | |
LifeStrategy Income Fund | $1,000.00 | $1,034.51 | $1.26 |
LifeStrategy Conservative Growth Fund | 1,000.00 | 1,061.39 | 1.28 |
LifeStrategy Moderate Growth Fund | 1,000.00 | 1,085.80 | 1.34 |
LifeStrategy Growth Fund | 1,000.00 | 1,114.21 | 1.36 |
Based on Hypothetical 5% Yearly Return | | | |
LifeStrategy Income Fund | $1,000.00 | $1,023.55 | $1.25 |
LifeStrategy Conservative Growth Fund | 1,000.00 | 1,023.55 | 1.25 |
LifeStrategy Moderate Growth Fund | 1,000.00 | 1,023.51 | 1.30 |
LifeStrategy Growth Fund | 1,000.00 | 1,023.51 | 1.30 |
Note that the expenses shown in the table are meant to highlight and help you compare ongoing costs only and do not reflect any transactional costs or account maintenance fees. They do not include your fund’s low-balance fee, which is described in the prospectus. If this fee were applied to your account, your costs would be higher. Your fund does not charge transaction fees, such as purchase or redemption fees, nor does it carry a “sales load.”
The calculations assume no shares were bought or sold during the period. Your actual costs may have been higher or lower, depending on the amount of your investment and the timing of any purchases or redemptions.
You can find more information about the fund’s expenses, including annual expense ratios, in the Financial Statements section of this report. For additional information on operating expenses and other shareholder costs, please refer to the appropriate fund prospectus.
1 These calculations are based on expenses incurred in the most recent fiscal period of each underlying fund. The LifeStrategy Funds’ average weighted expense ratios as of April 30, 2006, are (in order as listed from top to bottom above) 0.25%, 0.25%, 0.26%, and 0.26%. The dollar amounts shown as “Expenses Paid” are equal to the annualized average weighted expense ratio for the underlying funds, multiplied by the average account value over the period, multiplied by the number of days in the most recent six-month period, then divided by the number of days in the most recent 12-month period.
44
Glossary
Average Weighted Expense Ratio. Funds that invest in other Vanguard funds incur no direct expenses, but do bear proportionate shares of the operating, administrative, and advisory expenses of the underlying funds. The average weighted expense ratio is the average of these expense ratios, weighted in proportion to the amount of the fund invested in each underlying fund.
Beta. A measure of the magnitude of a fund’s past share-price fluctuations in relation to the ups and downs of a given market index. The index is assigned a beta of 1.00. Compared with a given index, a fund with a beta of 1.20 typically would have seen its share price rise or fall by 12% when the index rose or fell by 10%. A fund’s beta should be reviewed in conjunction with its R-squared (see definition below). The lower the R-squared, the less correlation there is between the fund and the index, and the less reliable beta is as an indicator of volatility.
Expense Ratio. The percentage of a fund’s average net assets used to pay its annual administrative and advisory expenses. These expenses directly reduce returns to investors.
R-Squared. A measure of how much of a fund’s past returns can be explained by the returns from the market in general, as measured by a given index. If a fund’s total returns were precisely synchronized with an index’s returns, its R-squared would be 1.00. If the fund’s returns bore no relationship to the index’s returns, its R-squared would be 0.
Yield. A snapshot of a fund’s income from interest and dividends. The yield, expressed as a percentage of the fund’s net asset value, is based on income earned over the past 30 days and is annualized, or projected forward for the coming year.
45
This page intentionally left blank.
This page intentionally left blank.
The People Who Govern Your Fund
The trustees of your mutual fund are there to see that the fund is operated and managed in your best interests since, as a shareholder, you are a part owner of the fund. Your fund trustees also serve on the board of directors of The Vanguard Group, Inc., which is owned by the Vanguard funds and provides services to them on an at-cost basis.
A majority of Vanguard’s board members are independent, meaning that they have no affiliation with Vanguard or the funds they oversee, apart from the sizable personal investments they have made as private individuals.
Our independent board members bring distinguished backgrounds in business, academia, and public service to their task of working with Vanguard officers to establish the policies and oversee the activities of the funds. Among board members’ responsibilities are selecting investment advisors for the funds; monitoring fund operations, performance, and costs; reviewing contracts; nominating and selecting new trustees/directors; and electing Vanguard officers.
Each trustee serves a fund until its termination; or until the trustee’s retirement, resignation, or death; or otherwise as specified in the fund’s organizational documents. Any trustee may be removed at a shareholders’ meeting by a vote representing two-thirds of the net asset value of all shares of the fund together with shares of other Vanguard funds organized within the same trust. The table on these two pages shows information for each trustee and executive officer of the fund. The mailing address of the trustees and officers is P.O. Box 876, Valley Forge, PA 19482.
Chairman of the Board, Chief Executive Officer, and Trustee |
| |
John J. Brennan1 | |
Born 1954 | Principal Occupation(s) During the Past Five Years: Chairman of the Board, Chief Executive Officer, and Director/Trustee of The Vanguard Group, Inc., |
Trustee since May 1987; | and of each of the investment companies served by The Vanguard Group. |
Chairman of the Board and | |
Chief Executive Officer | |
135 Vanguard Funds Overseen | |
| |
Independent Trustees | |
| |
Charles D. Ellis | |
Born 1937 | Principal Occupation(s) During the Past Five Years: Applecore Partners (pro bono ventures in education); Senior Advisor to Greenwich Associates |
Trustee since January 2001 | (international business strategy consulting); Successor Trustee of Yale University; Overseer of the Stern School of Business at New York |
135 Vanguard Funds Overseen | University; Trustee of the Whitehead Institute for Biomedical Research. |
| |
| |
Rajiv L. Gupta | |
Born 1945 | Principal Occupation(s) During the Past Five Years: Chairman and Chief Executive Officer of Rohm and Haas Co. (chemicals); Board Member of the |
Trustee since December 20012 | American Chemistry Council; Director of Tyco International, Ltd. (diversified |
135 Vanguard Funds Overseen | manufacturing and services) (since 2005); Trustee of Drexel University and of the Chemical Heritage Foundation. |
| |
JoAnn Heffernan Heisen | |
Born 1950 | Principal Occupation(s) During the Past Five Years: Corporate Vice President and Chief Global Diversity Officer (since January 2006), Vice President |
Trustee since July 1998 | and Chief Information Officer (1997–2005), and Member of the Executive Committee of Johnson & Johnson (pharmaceuticals/consumer products); |
135 Vanguard Funds Overseen | Director of the University Medical Center at Princeton and Women’s Research and Education Institute. |
André F. Perold | |
Born 1952 | Principal Occupation(s) During the Past Five Years: George Gund Professor of |
Trustee since December 2004 | Finance and Banking, Harvard Business School (since 2000); Senior Associate |
135 Vanguard Funds Overseen | Dean, Director of Faculty Recruiting, and Chair of Finance Faculty, Harvard |
| Business School; Director and Chairman of UNX, Inc. (equities trading firm) |
| (since 2003); Director of registered investment companies advised by Merrill |
| Lynch Investment Managers and affiliates (1985–2004), Genbel Securities |
| Limited (South African financial services firm) (1999–2003), Gensec Bank |
| (1999–2003), Sanlam, Ltd. (South African insurance company) (2001–2003), and Stockback, Inc. (credit card firm) (2000–2002). |
| |
Alfred M. Rankin, Jr. | |
Born 1941 | Principal Occupation(s) During the Past Five Years: Chairman, President, Chief |
Trustee since January 1993 | Executive Officer, and Director of NACCO Industries, Inc. (forklift trucks/housewares/ |
135 Vanguard Funds Overseen | lignite); Director of Goodrich Corporation (industrial products/aircraft systems and |
| services); Director of Standard Products Company (supplier for the automotive |
| industry) until 1998. |
| |
J. Lawrence Wilson | |
Born 1936 | Principal Occupation(s) During the Past Five Years: Retired Chairman and Chief |
Trustee since April 1985 | Executive Officer of Rohm and Haas Co. (chemicals); Director of Cummins Inc. |
135 Vanguard Funds Overseen | (diesel engines), MeadWestvaco Corp. (packaging products), and Amerisource- |
| Bergen Corp. (pharmaceutical distribution); Trustee of Vanderbilt University and |
| of Culver Educational Foundation. |
| |
Executive Officers1 | |
| |
Heidi Stam | |
Born 1956 | Principal Occupation(s) During the Past Five Years: Principal of The Vanguard |
Secretary since July 2005 | Group, Inc., since November 1997; General Counsel of The Vanguard Group |
135 Vanguard Funds Overseen | since July 2005; Secretary of The Vanguard Group and of each of the investment |
| companies served by The Vanguard Group since July 2005. |
| |
Thomas J. Higgins | |
Born 1957 | Principal Occupation(s) During the Past Five Years: Principal of The Vanguard |
Treasurer since July 1998 | Group, Inc.; Treasurer of each of the investment companies served by The Vanguard Group. |
135 Vanguard Funds Overseen | |
| |
Vanguard Senior Management Team |
| |
R. Gregory Barton | |
Mortimer J. Buckley | |
James H. Gately | |
Kathleen C. Gubanich | |
F. William McNabb, III | |
Michael S. Miller | |
Ralph K. Packard | |
George U. Sauter | |
| |
Founder | |
| |
John C. Bogle | |
Chairman and Chief Executive Officer, 1974–1996 |
1 Officers of the funds are “interested persons” as defined in the Investment Company Act of 1940.
2 December 2002 for Vanguard Equity Income Fund, Vanguard Growth Equity Fund, the Vanguard Municipal Bond Funds, and the Vanguard State Tax-Exempt Funds.
More information about the trustees is in the Statement of Additional Information, available from The Vanguard Group.
| | |
|
| | | P.O. Box 2600 Valley Forge, PA 19482-2600 |
| | | |
| | | |
| | | |
| | | |
Connect with Vanguard ™ > www.vanguard.com |
| | | |
| | | |
| | | |
Fund Information > 800-662-7447 | Vanguard, LifeStrategy, Connect with Vanguard, and the |
| | | ship logo are trademarks of The Vanguard Group, Inc. |
Direct Investor Account Services > 800-662-2739 | |
| | | All other marks are the exclusive property of their |
Institutional Investor Services > 800-523-1036 | respective owners. |
| | | |
Text Telephone > 800-952-3335 | |
| | | All comparative mutual fund data are from Lipper Inc. |
| | | or Morningstar, Inc., unless otherwise noted. |
| | | |
| | | |
This material may be used in conjunction | You can obtain a free copy of Vanguard’s proxy voting |
with the offering of shares of any Vanguard | guidelines by visiting our website, www.vanguard.com, |
fund only if preceded or accompanied by | and searching for “proxy voting guidelines,” or by calling |
the fund’s current prospectus. | Vanguard at 800-662-2739. They are also available from |
| the SEC’s website, www.sec.gov. In addition, you may |
| obtain a free report on how your fund voted the proxies for |
| | | securities it owned during the 12 months ended June 30. |
| | | To get the report, visit either www.vanguard.com |
| | | or www.sec.gov. |
| | | |
| | | |
| | | You can review and copy information about your fund |
| | | at the SEC’s Public Reference Room in Washington, D.C. |
| | | To find out more about this public service, call the SEC |
| | | at 202-551-8090. Information about your fund is also |
| | | available on the SEC’s website, and you can receive |
| | | copies of this information, for a fee, by sending a |
| | | request in either of two ways: via e-mail addressed to |
| | | publicinfo@sec.gov or via regular mail addressed to the |
| | | Public Reference Section, Securities and Exchange |
| | | Commission, Washington, DC 20549-0102. |
| | | |
| | | |
| | | |
| | | |
| | | © 2006 The Vanguard Group, Inc. |
| | | All rights reserved. |
| | | Vanguard Marketing Corporation, Distributor. |
| | | |
| | | |
| | | Q882 062006 |
Vanguard® International Stock Index Funds | |
| |
| |
| |
| |
> Semiannual Report | |
| |
| |
| |
April 30, 2006 | |
| |
|
|
| |
| |
| |
| |
| |
| |
Vanguard European Stock Index Fund | |
| |
Vanguard Pacific Stock Index Fund | |
| |
Vanguard Emerging Markets Stock Index Fund | |
| |
Vanguard Total International Stock Index Fund | |
| |
Vanguard Developed Markets Index Fund | |
| |
Vanguard Institutional Developed Markets Index Fund | |
> For the six months ended April 30, 2006, Vanguard’s six international equity index funds provided returns ranging from roughly 22% for the European Stock Index Fund to about 37% for the Emerging Markets Stock Index Fund.
> | The U.S. dollar lost some ground versus both the Japanese yen and the euro during the period. |
> International markets performed very well. Most notably, the Japanese market—which had languished for several years under the weight of a recession—seemed to emerge from its doldrums, and emerging markets continued to turn in stellar results.
Contents | |
| |
Your Fund’s Total Returns | 1 |
Chairman’s Letter | 4 |
European Stock Index Fund | 10 |
Pacific Stock Index Fund | 33 |
Emerging Markets Stock Index Fund | 55 |
Total International Stock Index Fund | 81 |
Developed Markets Index Fund | 89 |
Institutional Developed Markets Index Fund | 97 |
About Your Fund’s Expenses | 105 |
Trustees Renew Advisory Arrangement | 107 |
Glossary | 108 |
| European Stock Index Fund |

| Pacific Stock Index Fund |
Developed Markets Index Fund |
| Institutional Developed Markets Index Fund |
Please note: The opinions expressed in this report are just that—informed opinions. They should not be considered promises or advice. Also, please keep in mind that the information and opinions cover the period through the date on the cover of this report. Of course, the risks of investing in your fund are spelled out in the prospectus.
Your Fund’s Total Returns
Six Months Ended April 30, 2006 | |
| Total |
| Return |
Vanguard European Stock Index Fund | |
Investor Shares | 22.3% |
Admiral™ Shares1 | 22.4 |
Institutional Shares2 | 22.4 |
VIPER® Shares3 | |
Market Price | 21.7 |
Net Asset Value | 22.3 |
MSCI Europe Index | 22.6 |
Average European Region Fund4 | 26.2 |
| |
Vanguard Pacific Stock Index Fund | |
Investor Shares | 22.8% |
Admiral Shares | 22.8 |
Institutional Shares | 22.9 |
VIPER Shares | |
Market Price | 22.6 |
Net Asset Value | 22.8 |
MSCI Pacific Index | 23.6 |
Average Japan/Pacific Region Fund4 | 26.3 |
1 Admiral Shares are a lower-cost class of shares available to many longtime shareholders and to those with significant investments in the fund.
2 Institutional Shares also carry very low expenses and are available for a minimum investment of $5 million.
3 VIPER Shares are traded on the American Stock Exchange and are available only through brokers. The table shows VIPER returns based on both the AMEX market price and the net asset value for a share. U.S. Pat. No. 6,879,964 B2.
4 Derived from data provided by Lipper Inc.
1
Your Fund’s Total Returns
Six Months Ended April 30, 2006 | |
| Total |
| Return |
Vanguard Emerging Markets Stock Index Fund | |
Investor Shares | 36.6% |
Institutional Shares | 36.7 |
VIPER Shares1 | |
Market Price | 35.8 |
Net Asset Value | 36.7 |
Select Emerging Markets Index2 | 37.2 |
Average Emerging Markets Fund3 | 36.3 |
| |
Vanguard Total International Stock Index Fund | 24.2% |
Total International Composite Index4 | 24.7 |
Average International Fund3 | 23.9 |
| |
Vanguard Developed Markets Index Fund | 22.6% |
MSCI EAFE Index | 22.9 |
Average International Fund3 | 23.9 |
| |
Vanguard Institutional Developed Markets Index Fund | 22.5% |
MSCI EAFE Index | 22.9 |
Average International Fund3 | 23.9 |
1 VIPER Shares are traded on the American Stock Exchange and are available only through brokers. The table shows VIPER returns based on both the AMEX market price and the net asset value for a share. U.S. Pat. No. 6,879,964 B2.
2 Consists of stocks in 18 emerging markets of Europe, Asia, Africa, and Latin America. The index is administered exclusively for Vanguard by Morgan Stanley Capital International (MSCI).
3 Derived from data provided by Lipper Inc.
4 Consists of the MSCI Europe Index (57%), the MSCI Pacific Index (28%), and the Select Emerging Markets Index (15%) as of April 30, 2006.
2
Your Fund’s Performance at a Glance
October 31, 2005—April 30, 2006 | | | | |
| | | Distributions Per Share |
| Starting | Ending | Income | Capital |
Index Fund | Share Price | Share Price | Dividends | Gains |
European Stock | | | | |
Investor Shares | $27.00 | $32.21 | $0.700 | $0.000 |
Admiral Shares | 63.44 | 75.68 | 1.680 | 0.000 |
Institutional Shares | 27.05 | 32.25 | 0.738 | 0.000 |
VIPER Shares | 50.80 | 60.55 | 1.380 | 0.000 |
Pacific Stock | | | | |
Investor Shares | $10.39 | $12.58 | $0.160 | $0.000 |
Admiral Shares | 68.05 | 82.36 | 1.107 | 0.000 |
Institutional Shares | 10.41 | 12.60 | 0.176 | 0.000 |
VIPER Shares | 55.09 | 66.62 | 0.930 | 0.000 |
Emerging Markets Stock | | | | |
Investor Shares | $16.91 | $22.72 | $0.315 | $0.000 |
Institutional Shares | 16.95 | 22.77 | 0.342 | 0.000 |
VIPER Shares | 53.61 | 72.00 | 1.077 | 0.000 |
Total International Stock | $13.49 | $16.42 | $0.294 | $0.000 |
Developed Markets | $9.75 | $11.70 | $0.219 | $0.000 |
Institutional Developed Markets | $9.67 | $11.59 | $0.229 | $0.000 |
3
Chairman’s Letter
Dear Shareholder,
International stocks provided outstanding returns in the first half of the 2006 fiscal year. Vanguard’s international equity index funds captured those gains by successfully tracking the performance of their target indexes.
The funds’ returns ranged from 22.3% for the European Stock Index Fund to 36.6% for the Emerging Markets Stock Index Fund (both figures are for Investor Shares) for the six months ended April 30. Over the same period, the broad U.S. market—as measured by the Dow Jones Wilshire 5000 Composite Index—posted an 11.1% return.
International stocks continued to surpass U.S. stocks
During the period, developed markets in Europe and the Pacific produced excellent local-currency returns, and the gains were even better when translated into U.S. dollars. In Europe, the dollar’s weakness relative to the euro enhanced returns for U.S.-based investors. In the Pacific region, a weaker dollar was combined with the resurgence of the dominant Japanese stock market, where the Nikkei 225 Index rebounded to levels last seen nearly six years ago.
As was the case in the United States, corporate earnings were strong and economic growth was solid across most foreign markets. Rising energy prices, however, continued to weigh somewhat on the minds and wallets
4
of consumers. Emerging markets, bolstered by surging development, were the period’s biggest gainers.
The Fed continued its measured pace of raising short-term rates
For the six-month period, bonds provided slim returns as rising interest rates put a lid on bond performance. On March 28, the Federal Reserve Board raised its target for the federal funds rate to 4.75%, continuing its gradual tightening of monetary policy to defuse the threat of inflation. This was the Fed’s 15th consecutive rate increase since June 2004. (Shortly after the close of the fiscal period, the Fed extended its streak of rate increases to 16, raising its target to 5.00%.) Interest rate movements followed a normal pattern during the period, rising across the maturity spectrum. Short-term and municipal securities outperformed long-term bonds.
The funds tracked their targets, ending with double-digit gains
The European Stock Index Fund climbed more than 22% over the six months, thanks largely to the fund’s holdings in the United Kingdom and France—together constituting nearly half its assets, on average. Double-digit returns were the norm across Europe, and some of the smaller constituents in the MSCI Europe Index, notably Sweden, Finland, and Norway, turned in results that were much stronger than the broad index’s result. Stocks from the index’s largest sector,
Market Barometer | | | |
| Total Returns |
| Periods Ended April 30, 2006 |
| Six Months | One Year | Five Years1 |
Stocks | | | |
MSCI All Country World Index ex USA (International) | 25.0% | 38.1% | 11.4% |
Russell 1000 Index (Large-caps) | 9.9 | 16.7 | 3.4 |
Russell 2000 Index (Small-caps) | 18.9 | 33.5 | 10.9 |
Dow Jones Wilshire 5000 Index (Entire market) | 11.1 | 18.9 | 4.5 |
| | | |
Bonds | | | |
Lehman Aggregate Bond Index (Broad taxable market) | 0.6% | 0.7% | 5.2% |
Lehman Municipal Bond Index | 1.6 | 2.2 | 5.4 |
Citigroup 3-Month Treasury Bill Index | 2.0 | 3.6 | 2.1 |
| | | |
CPI | | | |
Consumer Price Index | 1.2% | 3.5% | 2.6% |
| | | |
| | | |
| | | |
| | | |
1 Annualized. | | | |
5
financials, fared well in several countries, as did materials, industrials, and consumer discretionary issues.
The Pacific Stock Index Fund, with Japanese stocks making up just over three-quarters of its assets on average, also posted an excellent return. The region’s smaller markets—Australia, Hong Kong, and Singapore—had strong returns that, combined with the Japanese market’s impressive performance, produced a return of nearly 23%. The consumer discretionary, information technology, and materials sectors were the strongest performers among the industry groups in the MSCI Pacific Index.
Several emerging markets had extraordinary returns, extending their string of strong performances and leading the Emerging Markets Stock Index Fund to a gain of close to 37%. Stocks in Taiwan, Korea, and Brazil—which accounted for nearly half the fund’s assets on average during the period—performed extremely well. Some of the smaller markets in the Select Emerging Markets Index, including India, China, and Turkey,
Annualized Expense Ratios1 | | | |
Your fund compared with its peer group | | | |
| | Average | |
| Fund | Weighted | Peer-Group |
| Expense | Expense | Expense |
Index Fund | Ratio | Ratio2 | Ratio |
European Stock Index Fund | | | |
Investor Shares | 0.27% | — | 1.54% |
Admiral Shares | 0.17 | — | 1.54 |
Institutional Shares | 0.12 | — | 1.54 |
VIPER Shares | 0.18 | — | 1.54 |
Pacific Stock Index Fund | | | |
Investor Shares | 0.27% | — | 1.68% |
Admiral Shares | 0.17 | — | 1.68 |
Institutional Shares | 0.12 | — | 1.68 |
VIPER Shares | 0.18 | — | 1.68 |
Emerging Markets Stock Index Fund | | | |
Investor Shares | 0.43% | — | 1.98% |
Institutional Shares | 0.25 | — | 1.98 |
VIPER Shares | 0.30 | — | 1.98 |
Total International Stock Index Fund | — | 0.29% | 1.65% |
Developed Markets Index Fund | — | 0.27% | 1.65% |
Institutional Developed Markets Index Fund | — | 0.12% | 1.65% |
1 Fund expense ratios reflect the six months ended April 30, 2006. Peer groups are: for the European Stock Index Fund, the Average European Region Fund; for the Pacific Stock Index Fund, the Average Japan/Pacific Region Fund; for the Emerging Markets Stock Index Fund, the Average Emerging Markets Fund; for the other funds, the Average International Fund. Peer-group expense ratios are derived from data provided by Lipper Inc. and capture information through year-end 2005.
2 For the underlying funds; annualized. The Total International Stock Index Fund, the Developed Markets Index Fund, and the Institutional Developed Markets Index Fund do not have expenses of their own, but they bear their share of the expenses of the underlying funds.
6
made outsized contributions. The energy, materials, financials, and industrials sectors all produced exceptional returns.
The Total International Stock Index Fund, a “fund-of-funds” that invests in the European, Pacific, and Emerging Markets Stock Index Funds, returned 24.2% during the period. The Developed Markets Index Fund, which invests only in the European and Pacific funds, returned 22.6%, while the Institutional Developed Markets Index Fund returned 22.5%.
Thanks to low costs and to the indexing expertise of Vanguard’s Quantitative Equity Group, all of the funds produced results very close to those of their target indexes. Keep in mind that, unlike real-world mutual funds, the unmanaged indexes incur no operating or transaction costs—a fact that makes tight tracking a challenge for any index fund, and particularly for those investing in international markets, where costs can be higher than in the United States.
Though the funds provided close tracking with their target indexes, the funds' returns lagged those of their indexes by slightly more than the fund expense ratios. This is because of fair-value pricing, which international funds sometimes use to determine net asset values. The practice, which takes into account real-time market developments that are not reflected in closing market prices overseas, can produce a seeming divergence between the performance of a fund and that of its index. These discrepancies quickly correct themselves, usually the next day.
With respect to competitors, two of the funds—the Emerging Markets and Total International Stock Index Funds—surpassed the average returns of their peer groups for the six months, while the others fell short by varying degrees. The European and Pacific Stock Index Funds lagged the most, trailing their actively managed peers by 3.9 and 3.5 percentage points, respectively, during the six months.
A caveat about the strong performance of international markets
The past few years have provided excellent stock returns in a number of markets around the globe. Many market observers and analysts have been citing this strong record in urging investors to “take part” in the good times abroad. However, I believe a word of caution is prudent.
International funds can add valuable diversification to a mix of U.S. stock, bond, and cash investments. Of course, diversification doesn’t necessarily improve a portfolio’s return, but it can offer a measure of protection from market volatility. These enduring diversification benefits are the right reason to invest abroad. By contrast, an investment decision based solely on recent performance may be counterproductive. Markets move in cycles, and periods of strength are inevitably followed by periods of weakness. Vanguard research has found
7
that allocating roughly 20% of a stock portfolio to international investments can provide meaningful diversification benefits for long-term investors. The key, of course, is to stick with this commitment through the ups and downs—a challenge for investors tempted to chase performance.
Maintaining focus on your long-term goals is a critical element of a successful investing plan. Vanguard’s international index funds, which seek to simply track the performance of their benchmarks, can provide competitive long-term performance, helping you to capture as much of the return of the chosen market as possible.
We appreciate your ongoing confidence in Vanguard.
Sincerely,
John J. Brennan
Chairman and Chief Executive Officer
May 11, 2006
Notice to Shareholders: Share Class Added for Emerging Markets Fund
Vanguard Emerging Markets Fund recently began offering Admiral™ Shares, a share class that is designed to recognize and encourage the cost savings realized from large, long-standing accounts. Admiral Shares, which are available for more than 60 Vanguard funds, have expense ratios that are considerably lower than the already low expenses of Investor Shares. Admiral Shares for the Emerging Markets Fund will have an expense ratio of about 0.30%, as compared with an expense ratio of about 0.43% for Investor Shares. You’re eligible for the Emerging Markets Admiral Shares if you have at least $100,000 invested in the fund, or if you have owned the fund for at least ten years, have a balance in the fund of at least $50,000, and are registered for online access to your Vanguard accounts.
8
Vanguard European Stock Index VIPERs® | | | |
Premium/Discount: October 31, 2005–April 30, 2006 | | |
| | | |
| Market Price Above or Equal to Net Asset Value | | Market Price Below Net Asset Value |
| |
| Number | Percentage | | Number | Percentage |
Basis Point Differential1 | of Days | of Total Days | | of Days | of Total Days |
0–24.9 | 48 | 16.49% | | 7 | 2.41% |
25–49.9 | 64 | 21.99 | | 2 | 0.69 |
50–74.9 | 78 | 26.80 | | 0 | 0.00 |
75–100.0 | 54 | 18.56 | | 0 | 0.00 |
>100.0 | 38 | 13.06 | | 0 | 0.00 |
Total | 282 | 96.90% | | 9 | 3.10% |
Vanguard Pacific Stock Index VIPERs | | |
Premium/Discount: October 31, 2005–April 30, 2006 | | |
| | | |
| Market Price Above or | Market Price Below |
| Equal to Net Asset Value | Net Asset Value |
| Number | Percentage | Number | Percentage |
Basis Point Differential1 | of Days | of Total Days | of Days | of Total Days |
0–24.9 | 24 | 8.25% | 8 | 2.75% |
25–49.9 | 54 | 18.56 | 1 | 0.34 |
50–74.9 | 78 | 26.80 | 0 | 0.00 |
75–100.0 | 65 | 22.34 | 0 | 0.00 |
>100.0 | 61 | 20.96 | 0 | 0.00 |
Total | 282 | 96.91% | 9 | 3.09% |
Vanguard Emerging Markets VIPERs | | |
Premium/Discount: October 31, 2005–April 30, 2006 | | |
| | | | |
| Market Price Above or | Market Price Below |
| Equal to Net Asset Value | | Net Asset Value |
| Number | Percentage | Number | Percentage |
Basis Point Differential1 | of Days | of Total Days | of Days | of Total Days |
0–24.9 | 60 | 20.62% | 26 | 8.93% |
25–49.9 | 68 | 23.37 | 12 | 4.12 |
50–74.9 | 49 | 16.84 | 7 | 2.41 |
75–100.0 | 38 | 13.06 | 4 | 1.37 |
>100.0 | 25 | 8.59 | 2 | 0.69 |
Total | 240 | 82.48% | 51 | 17.52% |
1 One basis point equals 1/100th of 1%.
9
European Stock Index Fund
Fund Profile
As of April 30, 2006
Portfolio Characteristics | | |
| | Target | Broad |
| Fund | Index1 | Index2 |
Number of Stocks | 608 | 589 | 2,045 |
Turnover Rate | 5%3 | — | — |
Expense Ratio | | — | — |
Investor Shares | 0.27%3 | | |
Admiral Shares | 0.17%3 | | |
Institutional Shares | 0.12%3 | | |
VIPER Shares | 0.18%3 | | |
Short-Term Reserves | 0% | — | — |
Sector Diversification (% of portfolio) | |
| | Target | Broad |
| Fund | Index1 | Index2 |
Consumer Discretionary | 10% | 10% | 11% |
Consumer Staples | 9 | 9 | 7 |
Energy | 11 | 11 | 10 |
Financials | 29 | 29 | 28 |
Health Care | 9 | 9 | 7 |
Industrials | 8 | 8 | 10 |
Information Technology | 4 | 4 | 7 |
Materials | 7 | 7 | 9 |
Telecommunication Services | 7 | 7 | 6 |
Utilities | 6 | 6 | 5 |
Volatility Measures | | | |
| | Target | | Broad |
| Fund | Index1 | Fund | Index2 |
R-Squared | 1.00 | 1.00 | 0.83 | 1.00 |
Beta | 1.00 | 1.00 | 0.93 | 1.00 |
Ten Largest Holdings4 (% of total net assets) |
| | |
BP PLC | integrated oil | |
| and gas | 3.0% |
HSBC Holdings PLC | diversified banks | 2.5 |
GlaxoSmithKline PLC | pharmaceuticals | 2.1 |
Total SA | integrated oil | |
| and gas | 1.9 |
Vodafone Group PLC | wireless | |
| telecommunication | |
| services | 1.7 |
Novartis AG (Registered) | pharmaceuticals | 1.7 |
Nestle SA (Registered) | packaged foods | |
| and meats | 1.6 |
Royal Dutch Shell PLC | integrated oil | |
| and gas | 1.5 |
UBS AG (Registered) | diversified capital | |
| markets | 1.5 |
Roche Holdings AG | pharmaceuticals | 1.4 |
Country Diversification (% of portfolio) |
| | Target |
| Fund | Index1 |
United Kingdom | 35% | 35% |
France | 14 | 14 |
Germany | 11 | 11 |
Switzerland | 10 | 10 |
Spain | 6 | 6 |
Italy | 6 | 6 |
Netherlands | 5 | 5 |
Sweden | 4 | 4 |
Finland | 2 | 2 |
Belgium | 2 | 2 |
Norway | 1 | 1 |
Ireland | 1 | 1 |
Denmark | 1 | 1 |
Greece | 1 | 1 |
Austria | 1 | 1 |
1 MSCI Europe Index.
2 MSCI All Country World Index ex USA.
3 Annualized.
4 “Ten Largest Holdings” excludes any temporary cash investments and equity index products. See page 108 for a glossary of investment terms.
10
European Stock Index Fund
Performance Summary
All of the returns in this report represent past performance, which is not a guarantee of future results that may be achieved by the fund. (Current performance may be lower or higher than the performance data cited. For performance data current to the most recent month-end, visit our website at www.vanguard.com.) Note, too, that both investment returns and principal value can fluctuate widely, so an investor’s shares, when sold, could be worth more or less than their original cost. The returns shown do not reflect taxes that a shareholder would pay on fund distributions or on the sale of fund shares.
Fiscal-Year Total Returns (%): October 31, 1995–April 30, 2006
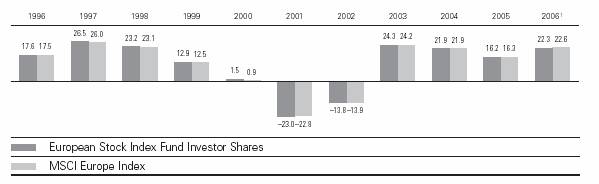
Average Annual Total Returns: Periods Ended March 31, 2006
This table presents average annual total returns through the latest calendar quarter—rather than through the end of the fiscal period. Securities and Exchange Commission rules require that we provide this information.
| Inception Date | One Year | Five Years | Ten Years |
European Stock Index Fund | | | | |
Investor Shares2 | 6/18/1990 | 20.35% | 9.43% | 10.25% |
Admiral Shares2 | 8/13/2001 | 20.41 | 11.003 | — |
Institutional Shares2 | 5/15/2000 | 20.49 | 9.60 | 4.513 |
VIPER Shares | 3/4/2005 | | | |
Market Price | | 20.86 | 15.483 | — |
Net Asset Value | | 20.44 | 14.783 | — |
1 Six months ended April 30, 2006.
2 Total return figures do not reflect the 0.5% transaction fee on purchases through March 31, 2000; the 2% fee assessed on redemptions of shares purchased on or after June 27, 2003, and held for less than two months; or, for Investor Shares, the $10 annual account maintenance fee applied on balances under $10,000.
3 Return since inception.
Note: See Financial Highlights tables on pages 25 through 28 for dividend and capital gains information.
11
European Stock Index Fund
Financial Statements (unaudited)
Statement of Net Assets
As of April 30, 2006
The fund provides a complete list of its holdings four times in each fiscal year, at the quarter-ends. For the second and fourth fiscal quarters, the lists appear in the fund’s semiannual and annual reports to shareholders. For the first and third fiscal quarters, the fund files the lists with the Securities and Exchange Commission on Form N-Q. Shareholders can look up the fund’s Forms N-Q on the SEC’s website at www.sec.gov. Forms N-Q may also be reviewed and copied at the SEC’s Public Reference Room (see the back cover of this report for further information).
| | | Market |
| | | Value• |
| | Shares | ($000) |
Common Stocks (99.3%)1 | | |
Austria (0.7%) | | |
| OMV AG | 398,528 | 27,634 |
| Erste Bank der | | |
| Oesterreichischen | | |
| Sparkassen AG | 446,786 | 27,070 |
| Telekom Austria AG | 848,187 | 20,763 |
| Oesterreichische | | |
| Elektrizitaetswirtschafts | | |
| AG Class A | 18,727 | 8,889 |
* | Immofinanz Immobilien | | |
| Anlagen AG | 807,679 | 8,834 |
| Wienerberger AG | 152,931 | 8,073 |
* | Raiffeisen International | | |
| Bank-Holding AG | 86,725 | 7,545 |
| Voestalpine AG | 47,952 | 6,988 |
* | Meinl European Land Ltd. | 346,664 | 6,836 |
| Boehler-Uddeholm AG | 24,488 | 5,544 |
* | Wiener Staedtische | | |
| Allgemeine Versicherung AG | 75,512 | 4,829 |
| Andritz AG | 21,936 | 3,839 |
| Flughafen Wien AG | 25,931 | 1,975 |
| Mayr-Melnhof Karton AG | 10,231 | 1,886 |
* | RHI AG | 56,791 | 1,863 |
| | | 142,568 |
Belgium (1.7%) | | |
| Fortis Group | 2,833,060 | 106,029 |
| KBC Bank & Verzekerings | | |
| Holding | 443,264 | 51,368 |
| Dexia | 1,328,591 | 35,009 |
| InBev | 439,949 | 22,155 |
| Groupe Bruxelles | | |
| Lambert SA | 178,762 | 20,245 |
| Solvay SA | 153,406 | 17,906 |
| Belgacom SA | 392,941 | 12,836 |
| Delhaize Group | 172,116 | 12,385 |
| UCB SA | 211,938 | 10,886 |
| Umicore | 59,001 | 9,392 |
| Colruyt NV | 38,430 | 5,901 |
| Mobistar SA | 69,371 | 5,561 |
| Agfa Gevaert NV | 231,984 | 4,693 |
| Bekaert NV | 33,511 | 3,847 |
| Omega Pharma SA | 48,149 | 3,355 |
| Barco NV | 27,294 | 2,696 |
| Cofinimmo | 14,076 | 2,373 |
| D’Ieteren SA | 6,641 | 2,073 |
| Compagnie Maritime | | |
| Belge SA | 42,477 | 1,378 |
| Euronav SA | 44,790 | 1,285 |
| | | 331,373 |
| Denmark (1.0%) | | |
| Danske Bank A/S | 1,081,407 | 42,920 |
| Novo Nordisk A/S | | |
| B Shares | 582,976 | 37,594 |
^ | AP Moller-Maersk A/S | 2,923 | 25,043 |
*^ | Vestas Wind Systems A/S | 449,204 | 12,169 |
| Danisco A/S | 119,970 | 10,161 |
| Novozymes A/S | 121,113 | 9,427 |
| DSV, De Sammensluttede | | |
| Vognmaend A/S | 50,725 | 8,284 |
| GN Store Nord A/S | 531,963 | 7,545 |
12
European Stock Index Fund
| | | Market |
| | | Value• |
| | Shares | ($000) |
* | Topdanmark A/S | 44,706 | 5,835 |
| ^Coloplast A/S B Shares | 64,715 | 5,202 |
| Carlsberg A/S B Shares | 76,920 | 5,167 |
* | William Demant A/S | 63,945 | 4,556 |
| FLS Industries A/S | | |
| B Shares | 93,227 | 4,232 |
| Trygvesta AS | 65,857 | 4,049 |
| Bang & Olufsen A/S | | |
| B Shares | 27,075 | 3,394 |
^ | H. Lundbeck A/S | 136,884 | 3,078 |
| NKT Holding A/S | 47,923 | 3,072 |
^ | East Asiatic Co. A/S | 44,175 | 1,880 |
^ | D/S Torm A/S | 34,551 | 1,583 |
| | | 195,191 |
Finland (2.3%) | | |
^ | Nokia Oyj | 10,190,557 | 230,817 |
| UPM-Kymmene Oyj | 1,264,977 | 29,575 |
| Fortum Oyj | 1,057,300 | 26,633 |
| Stora Enso Oyj R Shares | 1,461,203 | 22,827 |
| Sampo Oyj A Shares | 962,593 | 19,832 |
| Neste Oil Oyj | 310,706 | 10,784 |
| Metso Oyj | 257,459 | 10,216 |
| Kone Oyj | 183,434 | 8,546 |
| YIT Oyj | 299,830 | 8,442 |
| Elisa Oyj Class A | 383,321 | 7,859 |
| Rautaruuki Oyj | 202,671 | 7,091 |
| ^Wartsila Oyj B Shares | 144,005 | 6,125 |
| TietoEnator Oyj B Shares | 190,606 | 5,972 |
| Outokumpu Oyj A Shares | 240,572 | 5,786 |
| Kesko Oyj | 155,088 | 5,344 |
| Orion-Yhtyma Oyj B Shares | 188,346 | 4,463 |
| Cargotec Corp. | 91,706 | 4,449 |
| Uponor Oyj | 145,131 | 4,448 |
| Nokian Renkaat Oyj | 245,445 | 4,192 |
| OKO Bank (Osuuspankkien | | |
| Keskuspankki Oyj) | 228,680 | 3,645 |
| ^Amer Group Ltd. | 174,899 | 3,581 |
| KCI Konecranes Oyj | 129,904 | 2,405 |
| | | 433,032 |
France (14.3%) | | |
| Total SA | 1,336,809 | 368,348 |
| Sanofi-Aventis | 2,532,509 | 238,439 |
| BNP Paribas SA | 1,832,237 | 172,778 |
* | AXA | 3,623,754 | 132,480 |
| Societe Generale Class A | 852,826 | 129,967 |
| France Telecom SA | 4,090,150 | 95,151 |
^ | Suez SA | 2,422,122 | 94,429 |
^ | Vivendi SA | 2,517,910 | 91,791 |
*^ | Carrefour SA | 1,364,751 | 78,955 |
| Groupe Danone | 575,353 | 71,644 |
| L’Oreal SA | 717,204 | 66,372 |
^ | LVMH Louis Vuitton Moet | | |
| Hennessy | 592,669 | 62,270 |
| Schneider Electric SA | 547,246 | 61,849 |
| Credit Agricole SA | 1,449,027 | 58,245 |
| L’Air Liquide SA (Registered) | 263,823 | 56,981 |
| Cie. de St. Gobain SA | 751,769 | 56,320 |
| Lafarge SA | 424,783 | 52,070 |
| Renault SA | 448,088 | 51,893 |
| Arcelor | 1,238,278 | 50,856 |
| Veolia Environnement | 836,000 | 49,884 |
*^ | Alcatel SA | 3,005,256 | 43,268 |
| Vinci SA | 411,751 | 40,854 |
| Pernod Ricard SA | 181,491 | 35,146 |
| Accor SA | 475,103 | 29,842 |
| STMicroelectronics NV | 1,536,389 | 28,102 |
| Compagnie Generale des | | |
| Etablissements Michelin SA | 346,232 | 24,934 |
| PSA Peugeot Citroen | 369,178 | 24,219 |
^ | Bouygues SA | 443,333 | 24,144 |
| Lagardere S.C.A. | 292,093 | 24,087 |
* | Alstom | 265,314 | 23,978 |
| Essilor International SA | 235,909 | 23,582 |
| European Aeronautic | | |
| Defence and Space Co. | 590,381 | 23,258 |
| Pinault-Printemps- | | |
| Redoute SA | 160,310 | 20,760 |
^ | Unibail Co. | 110,263 | 19,179 |
| Euronext NV | 204,275 | 18,218 |
*^ | Gaz de France | 476,560 | 17,102 |
*^ | Cap Gemini SA | 302,486 | 16,152 |
* | BNP Paribas New | 175,510 | 15,995 |
| Publicis Groupe SA | 333,038 | 13,820 |
| Hermes International | 52,801 | 13,528 |
13
European Stock Index Fund | | |
| | | |
| | | Market |
| | | Value• |
| | Shares | ($000) |
^ | Technip SA | 210,189 | 13,251 |
| Thomson SA | 626,152 | 12,929 |
* | Atos Origin SA | 162,820 | 12,187 |
| Sodexho Alliance SA | 231,412 | 11,109 |
| Safran SA | 401,331 | 10,285 |
* | Vivendi Universal SA ADR | 272,160 | 9,942 |
| ^Societe Television Francaise | 1 285,037 | 9,447 |
| CNP Assurances | 83,783 | 9,033 |
*^ | PagesJaunes SA | 304,348 | 8,783 |
| Neopost SA | 76,916 | 8,689 |
| Thales SA | 187,329 | 8,035 |
| Dassault Systemes SA | 138,336 | 7,499 |
| Etablissements | | |
| Economiques du Casino | | |
| Guichard-Perrachon SA | 93,516 | 7,433 |
| Valeo SA | 168,967 | 7,227 |
* | Vinci SA-New Shares | 73,112 | 7,137 |
| Air France | 291,170 | 6,767 |
| Imerys SA | 76,889 | 6,597 |
| Klepierre | 55,683 | 6,521 |
| Zodiac SA | 93,151 | 6,016 |
* | Business Objects SA | 158,332 | 5,118 |
| Societe BIC SA | 72,310 | 5,073 |
| SCOR SA | 2,003,588 | 5,069 |
* | Societe des Autoroutes | | |
| Paris-Rhin-Rhone | 57,111 | 4,500 |
| Gecina SA | 22,708 | 2,977 |
| | | 2,712,514 |
Germany (10.6%) | | |
| Siemens AG | 1,939,852 | 183,354 |
*^ | E.On AG | 1,506,780 | 183,051 |
^ | Allianz AG | 933,241 | 155,892 |
| Deutsche Bank AG | 1,193,808 | 146,141 |
*^ | Deutsche Telekom AG | 6,601,330 | 118,965 |
| SAP AG | 535,673 | 116,852 |
*^ | BASF AG | 1,299,199 | 111,231 |
^ | DaimlerChrysler AG | | |
| (Registered) | 1,878,015 | 102,782 |
^ | RWE AG | 1,013,046 | 87,758 |
^ | Bayer AG | 1,590,267 | 73,076 |
^ | Muenchener | | |
| Rueckversicherungs- | | |
| Gesellschaft AG (Registered) | 472,122 | 66,742 |
| Commerzbank AG | 1,430,179 | 59,206 |
| Deutsche Post AG | 1,723,936 | 45,902 |
^ | Schering AG | 399,530 | 42,807 |
^ | Continental AG | 316,891 | 37,667 |
| Deutsche Boerse AG | 243,045 | 35,064 |
*^ | Volkswagen AG | 425,462 | 32,808 |
| ThyssenKrupp AG | 870,359 | 28,668 |
| Adidas-Salomon AG | 122,737 | 25,866 |
| Man AG | 341,068 | 25,812 |
| Hypo Real Estate | | |
| Holding AG | 323,741 | 22,645 |
| Metro AG | 351,839 | 19,916 |
| Porsche AG | 19,000 | 18,934 |
* | Infineon Technologies AG | 1,536,030 | 18,769 |
| Fresenius Medical Care AG | 152,625 | 18,281 |
^ | Linde AG | 201,709 | 18,027 |
^ | DaimlerChrysler AG | 327,337 | 17,968 |
| Henkel KGaA | 143,728 | 17,269 |
| Depfa Bank PLC | 850,856 | 15,953 |
*^ | Volkswagen AG Pfd. | 255,198 | 14,155 |
* | Merck KGaA | 116,992 | 12,390 |
^ | TUI AG | 546,330 | 11,612 |
^ | Puma AG | 28,633 | 11,519 |
^ | Altana AG | 169,119 | 10,837 |
| Deutsche Postbank AG | 138,113 | 10,556 |
| Deutsche Lufthansa AG | 552,778 | 10,178 |
| Hochtief AG | 144,438 | 9,865 |
^ | Celesio AG | 92,992 | 8,744 |
| RWE AG Pfd. | 94,261 | 7,350 |
| Heidelberger | | |
| Druckmaschinen AG | 124,855 | 6,290 |
| Beiersdorf AG | 40,748 | 6,156 |
| ProSieben Sat.1 Media AG | 211,438 | 5,847 |
| Wincor Nixdorf AG | 37,995 | 5,456 |
*^ | Qiagen NV | 342,257 | 5,093 |
| IVG Immobilien AG | 167,259 | 4,795 |
*^ | Karstadt Quelle AG | 151,178 | 4,537 |
| ^Suedzucker AG | 161,736 | 4,428 |
14
European Stock Index Fund
| | | Market |
| | | Value• |
| | Shares | ($000) |
| Douglas Holding AG | 81,286 | 3,914 |
| MLP AG | 143,338 | 3,508 |
*^ | Premier AG | 161,168 | 2,636 |
* | EPCOS AG | 119,315 | 1,601 |
| | | 2,008,873 |
Greece (1.0%) | | |
| National Bank of Greece SA | 609,039 | 30,177 |
| Alpha Credit Bank SA | 669,303 | 25,265 |
| Greek Organization of | | |
| Football Prognostics | 540,248 | 19,843 |
| EFG Eurobank Ergasias | 463,908 | 18,457 |
* | Hellenic Telecommunication | | |
| Organization SA | 709,887 | 15,873 |
* | Bank of Piraeus | 416,510 | 13,120 |
| Coca-Cola Hellenic | | |
| Bottling Co. SA | 259,150 | 8,494 |
| Cosmote Mobile | | |
| Communications SA | 321,756 | 7,873 |
| Titan Cement Co. SA | 137,370 | 6,975 |
| Public Power Corp. | 252,740 | 6,465 |
* | Commercial Bank of | | |
| Greece SA | 190,110 | 6,418 |
| Hellenic Petroleum SA | 259,150 | 3,914 |
| Germanos SA | 133,834 | 2,906 |
| Viohalco, Hellenic Copper | | |
| & Aluminum Industry SA | 262,248 | 2,788 |
| National Bank of Greece | | |
| SA ADR | 238,060 | 2,378 |
| Hellenic Exchanges SA | 107,650 | 1,977 |
| Hellenic Technodomiki | | |
| Tev SA | 163,044 | 1,713 |
| Intracom SA | 209,570 | 1,671 |
| Hyatt Regency Hotels and | | |
| Tourism SA | 102,819 | 1,451 |
| Technical Olympic SA | 181,309 | 1,123 |
| Folli-Follie SA | 38,380 | 1,092 |
* | Hellenic Telecommunications | | |
| Organization SA ADR | 79,428 | 902 |
| Hellenic Duty Free Shops SA | 41,440 | 777 |
| | | 181,652 |
Ireland (1.2%) | | |
| Allied Irish Banks PLC | 2,114,923 | 50,768 |
| CRH PLC | 1,292,755 | 47,441 |
| Bank of Ireland | 2,351,432 | 43,841 |
| Irish Life & Permanent PLC | 654,687 | 16,686 |
* | Elan Corp. PLC | 989,038 | 14,469 |
| Kerry Group PLC A Shares | 317,914 | 7,928 |
* | Grafton Group PLC | 514,333 | 7,119 |
| Eircom Group PLC | 1,952,090 | 5,312 |
| C&C Group PLC | 666,864 | 5,169 |
| DCC PLC | 194,983 | 4,731 |
| Kingspan Group PLC | 286,065 | 4,723 |
| IAWS Group PLC | 258,376 | 4,665 |
| Independent News | | |
| & Media PLC | 1,363,646 | 4,263 |
* | Ryanair Holdings PLC | 366,211 | 3,064 |
| Fyffes PLC | 772,924 | 2,103 |
| Greencore Group PLC | 376,631 | 1,920 |
| Paddy Power PLC | 107,900 | 1,916 |
* | Ryanair Holdings PLC ADR | 14,400 | 678 |
| Elan Corp. PLC ADR | 45,229 | 665 |
| | | 227,461 |
Italy (5.5%) | | |
| ENI SpA | 6,298,775 | 192,455 |
| Unicredito Italiano SpA | 18,814,516 | 141,496 |
| ENEL SpA | 10,423,589 | 90,049 |
| Assicurazioni Generali SpA | 2,315,331 | 86,661 |
| Telecom Italia SpA | 25,875,665 | 72,375 |
| Banca Intesa SpA | 9,409,376 | 55,664 |
| San Paolo-IMI SpA | 2,687,698 | 50,381 |
| Telecom Italia SpA RNC | 14,590,781 | 36,434 |
| Capitalia SpA | 4,071,077 | 35,300 |
| Banco Popolare di Verona | | |
| e Novara Scarl SpA | 899,443 | 25,280 |
| Mediobanca Banca di Credito | |
| Finanziaria SpA | 1,155,685 | 25,010 |
| Mediaset SpA | 1,860,003 | 23,502 |
| Autostrade SpA | 693,031 | 21,240 |
| Banche Popolari Unite | | |
| Scarl SpA | 831,794 | 21,008 |
*^ | Fiat SpA | 1,322,832 | 18,620 |
| Finmeccanica SpA | 715,222 | 17,120 |
| Banca Monte dei Paschi | | |
| di Siena SpA | 2,668,008 | 15,789 |
15
European Stock Index Fund | | |
| | | |
| | | Market |
| | | Value• |
| | Shares | ($000) |
| Banca Intesa SpA Non | | |
| Convertible Risp. | 2,250,848 | 12,476 |
| Alleanza Assicurazioni SpA | 1,023,068 | 12,425 |
| Banca Popolare di | | |
| Milano SpA | 950,459 | 12,001 |
| Snam Rete Gas SpA | 2,370,901 | 10,608 |
| Luxottica Group SpA | 331,051 | 9,843 |
* | Banca Nazionale del | | |
| Lavoro (BNL) SpA | 2,579,868 | 9,489 |
| Terna SpA | 2,910,296 | 7,982 |
| Pirelli & C. Accomandita | | |
| per Azioni SpA | 6,841,213 | 6,660 |
^ | Mediolanum SpA | 612,035 | 4,837 |
* | Seat Pagine Gialle SpA | 9,785,329 | 4,658 |
| Autogrill SpA | 279,359 | 4,546 |
| Bulgari SpA | 361,735 | 4,483 |
| Italcementi SpA | 169,456 | 4,452 |
| Banca Fideuram SpA | 714,645 | 4,303 |
| Lottomatica S.p.A. | 74,663 | 3,436 |
| Mondadori (Arnoldo) | | |
| Editore SpA | 283,698 | 2,857 |
^ | Gruppo Editoriale | | |
| L’Espresso SpA | 425,462 | 2,345 |
| Benetton Group SpA | 151,137 | 2,295 |
*^ | Tiscali SpA | 576,392 | 2,112 |
^ | Telecom Italia Media SpA | 2,831,569 | 1,341 |
* | Parmalat Finanziaria SpA | 569,830 | — |
| | | 1,051,533 |
Netherlands (5.0%) | | |
| ING Groep NV | 4,533,877 | 184,705 |
^ | ABN-AMRO Holding NV | 4,322,138 | 128,306 |
| Koninklijke (Royal) Philips | | |
| Electronics NV | 3,184,054 | 109,650 |
| Unilever NV | 1,382,850 | 99,708 |
^ | Aegon NV | 3,308,869 | 59,875 |
| Koninklijke KPN NV | 4,684,432 | 54,976 |
| Akzo Nobel NV | 658,101 | 37,860 |
| TNT NV | 1,001,492 | 35,988 |
* | Koninklijke Ahold NV | 3,759,234 | 30,821 |
| Reed Elsevier NV | 1,702,047 | 25,144 |
| Heineken NV | 593,420 | 24,012 |
* | ASML Holding NV | 1,132,320 | 23,908 |
| Verenigde Nederlandse | | |
| Uitgeversbedrijven NV | 590,595 | 20,259 |
* | Koninklijke Numico NV | 414,585 | 18,762 |
^ | Wolters Kluwer NV | 698,290 | 18,155 |
| Koninklijke DSM NV | 366,392 | 16,687 |
| Rodamco Europe NV | 108,460 | 11,654 |
| Vedior NV | 410,704 | 9,560 |
| SBM Offshore NV | 83,422 | 8,926 |
| Randstad Holding NV | 111,449 | 7,395 |
*^ | Hagemeyer NV | 1,248,956 | 6,776 |
| Corio NV | 97,403 | 6,153 |
^ | Buhrmann NV | 281,091 | 5,440 |
| Wereldhave NV | 49,881 | 5,197 |
^ | Getronics NV | 296,471 | 3,581 |
| Oce NV | 188,742 | 3,137 |
| Aegon NV (New York) ARS | 172,787 | 3,100 |
* | ASML Holding (New York) | 38,580 | 816 |
| | | 960,551 |
Norway (1.2%) | | |
| Norsk Hydro ASA | 344,582 | 52,647 |
| Statoil ASA | 1,589,241 | 51,961 |
| Orkla ASA | 462,406 | 24,240 |
| DnB NOR ASA | 1,616,826 | 22,348 |
| Telenor ASA | 1,858,553 | 21,484 |
| Yara International ASA | 493,421 | 7,902 |
* | Petroleum Geo-Services ASA | 137,821 | 7,700 |
* | Acergy SA | 463,653 | 7,543 |
* | Storebrand ASA | 558,962 | 6,585 |
| Norske Skogindustrier ASA | 388,552 | 5,966 |
| ProSafe ASA | 82,710 | 4,887 |
* | Tomra Systems ASA | 428,253 | 4,234 |
^ | Frontline Ltd. | 128,269 | 4,117 |
* | Tandberg Television ASA | 191,783 | 3,837 |
| Schibsted ASA | 116,537 | 3,414 |
| Tandberg ASA | 327,155 | 3,313 |
| Stolt-Nielsen SA | 96,005 | 2,704 |
| | | 234,882 |
Portugal (0.5%) | | |
| Portugal Telecom SGPS SA | 1,912,592 | 24,244 |
| Electricidade de Portugal SA | 4,422,024 | 17,384 |
| Banco Comercial | | |
| Portugues SA | 4,705,804 | 14,359 |
16
European Stock Index Fund
| | | Market |
| | | Value• |
| | Shares | ($000) |
| Brisa-Auto Estradas de | | |
| Portugal SA | 797,598 | 8,382 |
| Banco BPI SA | 736,932 | 5,555 |
| Sonae SGPS SA | 2,206,630 | 3,752 |
| Banco Espirito Santo SA | 253,134 | 3,680 |
| Cimpor-Cimento de | | |
| Portugal SA | 487,334 | 3,394 |
| PT Multimedia Servicos de | | |
| Telecomunicacoes e | | |
| Multimedia SGPS SA | 185,765 | 2,265 |
| Jeronimo Martins & Filho, | | |
| SGPS, SA | 90,626 | 1,632 |
* | Sonae Industria-SGPS SA | 152,155 | 1,522 |
| Banco Espirito Santo SA | | |
| Bonus Rights | 253,134 | 613 |
* | Banco Espirito Santo SA | | |
| Rights | 253,134 | 371 |
| | | 87,153 |
Spain (5.6%) | | |
| Banco Santander Central | | |
| Hispano SA | 14,374,851 | 221,556 |
| Banco Bilbao Vizcaya | | |
| Argentaria SA | 8,203,706 | 180,834 |
| Telefonica SA | 10,529,173 | 168,332 |
| Endesa SA | 2,305,356 | 76,192 |
| Repsol YPF SA | 2,215,285 | 66,035 |
| Iberdrola SA | 1,963,058 | 63,833 |
| Banco Popular Espanol SA | 2,056,209 | 31,019 |
| Altadis SA | 650,922 | 30,857 |
| ACS, Actividades de | | |
| Contruccion y Servisios, SA | 597,793 | 24,766 |
| Industria de Diseno Textil SA | 528,237 | 21,468 |
| Abertis Infraestructuras SA | 522,967 | 13,779 |
| Gas Natural SDG SA | 432,891 | 13,185 |
| Union Fenosa SA | 331,838 | 12,810 |
| Grupo Ferrovial, SA | 152,353 | 12,490 |
| Metrovacesa SA | 135,202 | 12,340 |
| Acciona SA | 69,459 | 11,933 |
| Sacyr Vallehermoso SA | 265,087 | 9,166 |
| Gamesa Corporacion | | |
| Tecnologica, SA | 412,177 | 8,944 |
| Fomento de Construc y | | |
| Contra SA | 110,334 | 8,939 |
| Acerinox SA | 440,541 | 7,394 |
| Indra Sistemas, SA | 317,644 | 6,528 |
| Cintra Concesiones de | | |
| Infraestructuras de | | |
| Transporte SA | 474,652 | 6,424 |
| Corporacion Mapfre SA | 259,266 | 5,476 |
| Inmobiliaria Colonial SA | 72,276 | 5,153 |
| Antena 3 Television | 186,681 | 4,909 |
| Telefonica Publicidad e | | |
| Informacion, SA | 396,184 | 4,370 |
* | Telefonica SA ADR | 87,308 | 4,190 |
| Ebro Puleva SA | 206,447 | 4,078 |
| Sociedad General de Aguas | |
| de Barcelona SA | 142,668 | 3,982 |
* | Sogecable SA | 97,353 | 3,681 |
| NH Hoteles SA | 186,003 | 3,347 |
| Promotora de | | |
| Informaciones SA | 182,872 | 3,344 |
| Iberia (Linea Aerea Espana) | 1,153,291 | 3,225 |
| Zeltia SA | 385,905 | 2,937 |
| | | 1,057,516 |
Sweden (3.5%) | | |
| Telefonaktiebolaget LM | | |
| Ericsson AB Class B | 35,863,693 | 126,820 |
| Nordea Bank AB | 5,238,259 | 67,219 |
*^ | Hennes & Mauritz AB | | |
| B Shares | 1,148,902 | 43,480 |
^ | Svenska Handelsbanken | | |
| AB A Shares | 1,259,015 | 36,096 |
^ | Sandvik AB | 487,287 | 31,607 |
| Skandinaviska Enskilda | | |
| Banken AB A Shares | 1,141,067 | 28,688 |
^ | TeliaSonera AB | 4,519,672 | 27,955 |
^ | Volvo AB B Shares | 526,264 | 26,414 |
^ | Atlas Copco AB A Shares | 813,604 | 23,971 |
| Svenska Cellulosa AB | | |
| B Shares | 475,756 | 21,477 |
^ | Electrolux AB Series B | 688,708 | 20,553 |
^ | SKF AB B Shares | 973,806 | 16,674 |
^ | Skanska AB B Shares | 911,463 | 15,731 |
| Securitas AB B Shares | 713,157 | 14,828 |
^ | Atlas Copco AB Class B | | |
| Shares | 504,618 | 13,733 |
^ | Assa Abloy AB | 711,316 | 13,722 |
17
European Stock Index Fund
|
|---|
| | Shares | Market
Value•
($000) |
|---|
| ^ Swedish Match AB | 787,203 | 11,772 |
| Volvo AB A Shares | 229,913 | 11,302 |
| ^ Scania AB Class B | 230,898 | 10,709 |
| ^ Tele2 AB B Shares | 765,426 | 9,661 |
| ^ Alfa Laval AB | 230,376 | 7,474 |
| ^ Getinge AB B Shares | 431,463 | 7,447 |
| ^ Svenskt Stal AB A Shares | 122,255 | 7,181 |
| * Modern Times Group AB | 123,586 | 6,761 |
| ^ Gambro AB A Shares | 422,042 | 6,309 |
| *^ Lundin Petroleum AB | 402,954 | 5,526 |
| Holmen AB | 126,638 | 5,469 |
| Eniro AB | 417,909 | 4,568 |
| ^ Trelleborg AB B Shares | 189,644 | 4,210 |
| Kungsleden AB | 109,495 | 3,886 |
| * Capio AB | 196,261 | 3,859 |
| Castellum AB | 378,304 | 3,675 |
| Fabege AB | 187,952 | 3,619 |
| OMX AB | 185,843 | 3,561 |
| Gambro AB B Shares | 229,614 | 3,435 |
| Elekta AB B Shares | 208,655 | 3,434 |
| ^ Svenskt Stal AB ** (SSAB) | 57,903 | 3,142 |
| Oriflame Cosmetics SA | 72,726 | 2,743 |
| WM-Data AB Class B | 744,212 | 2,528 |
| *^ SAS AB | 182,833 | 2,475 |
| D. Carnegie & Co. AB | 105,710 | 2,343 |
| Billerud Aktiebolag | 126,802 | 2,180 |
| Axfood AB | 70,814 | 2,015 |
| ^ Hoganas AB B Shares | 65,774 | 1,785 |
| *^ Telelogic AB | 588,100 | 1,489 |
| ^ Wihlborgs Fastigheter AB | 35,777 | 1,041 |
Capio AB Rights Exp
5/18/2006 | 196,261 | 143 |
SSAB Svenskt Stal AB
Series A Redemption Rights
Exp. 5/23/06 | 120,455 | 42 |
SSAB Svenskt Stal AB
Series B Redemption Rights
Exp. 5/23/06 | 57,903 | 33 |
| | | 674,785 |
| Switzerland (10.1%) |
| Novartis AG (Registered) | 5,632,995 | 321,932 |
| Nestle SA (Registered) | 976,262 | 296,794 |
| UBS AG (Registered) | 2,465,248 | 288,503 |
| Roche Holdings AG | 1,699,755 | 260,122 |
Credit Suisse Group
(Registered) | 2,936,881 | 183,946 |
| Zurich Financial Services AG | 348,405 | 84,537 |
| * ABB Ltd. | 4,797,477 | 68,183 |
Cie. Financiere
Richemont AG | 1,199,763 | 61,968 |
| Swiss Re (Registered) | 779,175 | 56,738 |
| Holcim Ltd. (Registered) | 445,423 | 37,260 |
| Syngenta AG | 258,985 | 35,887 |
| Adecco SA (Registered) | 316,499 | 19,575 |
| Swisscom AG | 44,723 | 14,878 |
| Swatch Group AG (Bearer) | 79,750 | 14,255 |
| Nobel Biocare Holding AG | 56,071 | 13,765 |
| Synthes, Inc. | 111,335 | 13,730 |
| Givaudan SA | 16,040 | 13,421 |
| * Geberit AG | 9,562 | 11,128 |
SGS Societe Generale de
Surveillance Holding SA
(Registered) | 10,360 | 10,221 |
CIBA Specialty Chemicals
AG (Registered) | 162,505 | 9,941 |
Kuehne & Nagel
International AG | 25,977 | 9,393 |
| Clariant AG | 559,396 | 8,675 |
| Serono SA Class B | 13,136 | 8,597 |
| * Logitech International SA | 196,248 | 8,090 |
| Sulzer AG (Registered) | 8,801 | 7,394 |
Schindler Holding AG
(Ptg. Ctf.) | 124,087 | 6,778 |
| Lonza AG (Registered) | 91,376 | 6,463 |
| Phonak Holding AG | 103,132 | 6,377 |
Swatch Group AG
(Registered) | 130,763 | 4,783 |
| PSP Swiss Property AG | 90,553 | 4,772 |
| Rieter Holding AG | 10,849 | 4,743 |
| Straumann Holding AG | 18,848 | 4,629 |
| * Unaxis Holding AG | 13,787 | 4,582 |
| UBS AG | 35,370 | 4,133 |
Kuoni Reisen Holding
AG (Registered) | 6,876 | 3,677 |
| * SIG Holding AG | 14,744 | 3,199 |
| ^ Kudelski SA | 85,843 | 2,239 |
18
European Stock Index Fund
| | | Market |
| | | Value• |
| | Shares | ($000) |
* | Micronas Semiconductor | | |
| Holding AG | 77,466 | 1,953 |
| Valora Holding AG | 7,955 | 1,898 | |
| | | 1,919,159 | |
United Kingdom (35.1%) | | | |
| BP PLC | 46,663,290 | 568,570 | |
| HSBC Holdings PLC | 27,336,568 | 470,168 | |
| GlaxoSmithKline PLC | 14,095,909 | 403,797 | |
| Vodafone Group PLC | 137,985,910 | 325,306 | |
| Royal Dutch Shell PLC | | | |
| Class A (Amsterdam | | | |
| Shares) | 8,492,604 | 290,128 | |
| Royal Bank of Scotland | | | |
| Group PLC | 7,700,133 | 249,637 | |
| Royal Dutch Shell PLC | | | |
| Class B | 6,675,897 | 237,196 | |
| AstraZeneca Group PLC | 3,833,745 | 210,121 | |
| Barclays PLC | 15,632,226 | 193,618 | |
| HBOS PLC | 9,285,422 | 162,772 | |
| Anglo American PLC | 3,433,330 | 146,379 | |
| Rio Tinto PLC | 2,588,238 | 142,249 | |
| Lloyds TSB Group PLC | 13,549,616 | 130,624 | |
| BHP Billiton PLC | 5,971,348 | 122,409 | |
| Diageo PLC | 6,986,928 | 114,524 | |
| BG Group PLC | 8,581,797 | 113,977 | |
| Tesco PLC | 18,989,577 | 110,193 | |
| British American | | | |
| Tobacco PLC | 3,815,797 | 96,914 | |
| Aviva PLC | 5,787,353 | 83,883 | |
| BT Group PLC | 20,363,178 | 81,315 | |
| Unilever PLC | 6,637,462 | 69,872 | |
| National Grid Transco PLC | 6,560,238 | 68,454 | |
| Prudential PLC | 5,864,026 | 68,204 | |
| BAE Systems PLC | 7,772,149 | 58,785 | |
| Reckitt Benckiser PLC | 1,484,156 | 53,881 | |
| Imperial Tobacco | | | |
| Group PLC | 1,723,303 | 53,246 | |
| Cadbury Schweppes PLC | 5,041,046 | 49,562 | |
| Centrica PLC | 8,776,084 | 47,577 | |
| Old Mutual PLC | 13,208,699 | 45,961 | |
| SABMiller PLC | 2,172,738 | 45,366 | |
| Marks & Spencer | | | |
| Group PLC | 4,018,754 | 42,681 | |
| Scottish & Southern | | | |
| Energy PLC | 2,078,859 | 42,491 | |
| BP PLC ADR | 575,360 | 42,416 | |
| BAA PLC | 2,605,950 | 40,279 |
| ScottishPower PLC | 3,911,231 | 39,742 |
| Legal & General | | |
| Group PLC | 15,746,186 | 39,614 |
| GUS PLC | 2,119,824 | 39,565 |
| Land Securities | | |
| Group PLC | 1,135,309 | 38,154 |
| Royal Dutch Shell | | |
| PLC Class A | 1,062,627 | 36,100 |
| Wolseley PLC | 1,434,117 | 35,692 |
| BOC Group PLC | 1,217,368 | 34,383 |
| Rolls-Royce Group PLC | 3,833,426 | 33,106 |
| Man Group PLC | 713,641 | 32,738 |
| WPP Group PLC | 2,488,978 | 30,520 |
| Reed Elsevier PLC | 3,085,283 | 30,454 |
| British Land Co., PLC | 1,255,633 | 28,566 |
| Vodafone Group PLC ADR | 1,177,400 | 27,904 |
| British Sky Broadcasting | | |
| Group PLC | 2,881,339 | 27,398 |
| Pearson PLC | 1,944,489 | 26,723 |
| United Utilities PLC | 2,109,135 | 25,738 |
| Smiths Group PLC | 1,365,504 | 25,198 |
| Gallaher Group PLC | 1,587,145 | 25,163 |
| Reuters Group PLC | 3,381,313 | 23,748 |
| Kingfisher PLC | 5,685,575 | 23,260 |
| Hanson Building | | |
| Materials PLC | 1,749,556 | 23,095 |
| Compass Group PLC | 5,204,878 | 22,481 |
| 3i Group PLC | 1,331,266 | 21,575 |
| ITV PLC | 9,928,470 | 20,735 |
| Carnival PLC | 412,276 | 20,151 |
| J. Sainsbury PLC | 3,300,423 | 20,013 |
| International Power PLC | 3,555,508 | 19,270 |
| Amvescap PLC | 1,769,520 | 19,178 |
| Imperial Chemical | | |
| Industries PLC | 2,880,256 | 18,736 |
| Smith & Nephew PLC | 2,269,213 | 18,654 |
| InterContinental Hotels | | |
| Group PLC | 1,050,849 | 18,505 |
| Scottish & Newcastle PLC | 1,927,483 | 17,776 |
19
| European Stock Index Fund | | |
| | | |
| | | |
| | | |
| | | Market |
| | | Value• |
| | Shares | ($000) |
| Royal & Sun Alliance | | |
| Insurance Group PLC | 7,080,561 | 17,712 |
| Severn Trent PLC | 840,080 | 17,610 |
| Next PLC | 591,453 | 17,308 |
| Friends Provident PLC | 4,651,725 | 16,519 |
| Corus Group PLC | 10,747,628 | 16,428 |
| Persimmon PLC | 678,056 | 16,150 |
| Yell Group PLC | 1,704,078 | 15,911 |
| Boots Group PLC | 1,170,977 | 14,924 |
| DSG International PLC | 4,462,293 | 14,876 |
| Brambles Industries PLC | 1,758,191 | 14,574 |
| Hammerson PLC | 688,880 | 14,509 |
| Johnson Matthey PLC | 532,319 | 14,204 |
| Enterprise Inns PLC | 834,242 | 14,141 |
| The Sage Group PLC | 3,101,098 | 14,094 |
| London Stock | | |
| Exchange PLC | 614,957 | 13,911 |
| Capita Group PLC | 1,574,933 | 13,359 |
| Rexam PLC | 1,342,232 | 13,274 |
| Whitbread PLC | 624,462 | 12,713 |
| Rentokil Initial PLC | 4,383,864 | 12,684 |
| Kelda Group PLC | 909,507 | 12,617 |
| Liberty International PLC | 582,905 | 12,058 |
| Tate & Lyle PLC | 1,180,416 | 11,885 |
| Tomkins PLC | 1,871,295 | 11,507 |
| Slough Estates PLC | 1,023,654 | 11,352 |
| Hays PLC | 3,664,114 | 11,254 |
| ICAP PLC | 1,173,455 | 11,094 |
| Mitchells & Butlers PLC | 1,209,671 | 10,795 |
| Cable and Wireless PLC | 5,670,659 | 10,776 |
| William Hill PLC | 931,454 | 10,727 |
| Ladbrokes PLC | 1,371,715 | 10,639 |
| Bunzl PLC | 835,597 | 10,538 |
| Barratt Developments PLC | 585,234 | 10,517 |
| Punch Taverns PLC | 631,898 | 10,023 |
| Emap PLC | 621,617 | 9,923 |
| GKN PLC | 1,729,916 | 9,901 |
| EMI Group PLC | 1,914,746 | 9,849 |
| Burberry Group PLC | 1,146,844 | 9,807 |
| Alliance Unichem PLC | 609,388 | 9,793 |
| Associated British Ports | | |
| Holdings PLC | 728,145 | 9,654 |
| Taylor Woodrow PLC | 1,384,546 | 9,628 |
| Group 4 Securicor PLC | 2,763,005 | 9,566 |
| Cobham PLC | 2,723,776 | 9,163 |
| George Wimpey PLC | 961,263 | 9,157 |
| Inchape PLC | 182,695 | 9,017 |
| LogicaCMG PLC | 2,767,249 | 8,976 |
| Daily Mail and General | | |
| Trust PLC | 727,310 | 8,974 |
| United Business Media PLC | 669,720 | 8,716 |
| IMI PLC | 827,869 | 8,446 |
* | British Airways PLC | 1,359,823 | 8,209 |
| ARM Holdings PLC | 3,318,194 | 8,120 |
| Signet Group PLC | 4,175,041 | 7,981 |
| Travis Perkins PLC | 276,747 | 7,937 |
| Pilkington PLC | 2,536,170 | 7,533 |
| Kesa Electricals PLC | 1,286,570 | 7,340 |
| FirstGroup PLC | 958,227 | 7,266 |
| Provident Financial PLC | 619,660 | 7,027 |
| Trinity Mirror PLC | 692,422 | 6,899 |
| Serco Group PLC | 1,113,351 | 6,830 |
| Balfour Beatty PLC | 1,037,627 | 6,756 |
| Meggitt PLC | 1,049,042 | 6,415 |
| ScottishPower PLC ADR | 154,280 | 6,276 |
| Rank Group PLC | 1,502,120 | 6,195 |
| Schroders PLC | 299,600 | 6,154 |
| Close Brothers Group PLC | 316,045 | 6,148 |
| Bellway PLC | 273,771 | 5,953 |
* | Invensys PLC | 13,702,409 | 5,837 |
| Amec PLC | 802,536 | 5,777 |
| Intertek Testing | | |
| Services PLC | 373,258 | 5,589 |
| BBA Group PLC | 1,171,630 | 5,581 |
| Brixton PLC | 623,619 | 5,524 |
* | The Berkeley Group | | |
| Holdings | 263,745 | 5,504 |
| Cattles PLC | 790,497 | 5,427 |
| National Express Group PLC | 328,318 | 5,316 |
| Resolution PLC | 483,046 | 5,297 |
| Electrocomponents PLC | 1,057,439 | 5,108 |
20
European Stock Index Fund
| | | Market |
| | | Value• |
| | Shares | ($000) |
| Arriva PLC | 477,589 | 5,026 |
| Aegis Group PLC | 2,027,394 | 4,981 |
| WPP Group PLC ADR | 78,406 | 4,837 |
| Bovis Homes Group PLC | 290,681 | 4,730 |
* | Cookson Group PLC | 460,981 | 4,430 |
| First Choice Holidays PLC | 1,086,431 | 4,411 |
| Misys PLC | 1,153,823 | 4,357 |
| Stagecoach Group PLC | 2,106,824 | 4,152 |
| De La Rue Group PLC | 407,172 | 4,040 |
| The Davis Service | | |
| Group PLC | 405,617 | 3,465 |
| Aggreko PLC | 614,792 | 3,449 |
| Great Portland Estates PLC | 389,041 | 3,216 |
| Premier Farnell PLC | 868,197 | 3,168 |
| HMV Group PLC | 974,206 | 3,146 |
| FKI PLC | 1,417,818 | 2,994 |
| MFI Furniture Group PLC | 1,460,564 | 2,900 |
| SSL International PLC | 462,339 | 2,552 |
| Telent PLC | 139,963 | 1,282 |
| Isoft Group PLC | 519,209 | 1,115 |
| | | 6,669,993 |
| Total Common Stocks | | |
| (Cost $13,037,546) | | 18,888,236 |
| Temporary Cash Investments (9.0%)1 | |
| Money Market Fund (9.0%) | | |
2 | Vanguard Market Liquidity | | |
| Fund, 4.771% | 56,696,091 | 56,696 |
2 | Vanguard Market Liquidity | | |
| Fund, 4.771%—Note E | 1,650,459,973 | 1,650,460 |
| | | 1,707,156 |
| Face | Market |
| Amount | Value• |
| ($000) | ($000) |
U.S. Agency Obligations (0.0%) | | |
3 Federal National Mortgage Assn. | |
4 4.847%, 7/5/06 | 2,500 | 2,478 |
4 4.937%, 7/19/06 | 2,000 | 1,979 |
| | 4,457 |
Total Temporary Cash Investments | |
(Cost $1,711,613) | | 1,711,613 |
Total Investments (108.3%) | | |
(Cost $14,749,159) | | 20,599,849 |
Other Assets and Liabilities (–8.3%) | |
Other Assets—Note B | | 165,969 |
Security Lending Collateral | | |
Payable to Brokers—Note E | | (1,650,460) |
Other Liabilities | | (85,996) |
| | (1,570,487) |
Net Assets (100%) | | 19,029,362 |
21
European Stock Index Fund | |
| |
| |
| |
At April 30, 2006, net assets consisted of:5 |
| Amount |
| ($000) |
Paid-in Capital | 13,226,179 |
Undistributed Net Investment Income | 167,261 |
Accumulated Net Realized Losses | (220,344) |
Unrealized Appreciation (Depreciation) | |
Investment Securities | 5,850,690 |
Futures Contracts | (209) |
Foreign Currencies and | |
Forward Currency Contracts | 5,785 |
Net Assets | 19,029,362 |
| |
Investor Shares—Net Assets | |
Applicable to 445,903,993 outstanding | |
$.001 par value shares of beneficial | |
interest (unlimited authorization) | 14,363,745 |
Net Asset Value Per Share— | |
Investor Shares | $32.21 |
| |
Admiral Shares—Net Assets | |
Applicable to 24,595,900 outstanding | |
$.001 par value shares of beneficial | |
interest (unlimited authorization) | 1,861,339 |
Net Asset Value Per Share— | |
Admiral Shares | $75.68 |
| Amount |
| ($000) |
Institutional Shares—Net Assets | |
Applicable to 71,192,832 outstanding | |
$.001 par value shares of beneficial | |
interest (unlimited authorization) | 2,295,959 |
Net Asset Value Per Share— | |
Institutional Shares | $32.25 |
| |
| |
VIPER Shares—Net Assets | |
Applicable to 8,394,599 outstanding | |
$.001 par value shares of beneficial | |
interest (unlimited authorization) | 508,319 |
Net Asset Value Per Share— | |
VIPER Shares | $60.55 |
• See Note A in Notes to Financial Statements.
* Non-income-producing security.
^ Part of security position is on loan to broker/dealers. See Note E in Notes to Financial Statements.
1 The fund invests a portion of its cash reserves in equity markets through the use of index futures contracts. After giving effect to futures investments, the fund’s effective common stock and temporary cash investment positions represent 99.9% and 8.4%, respectively, of net assets. See Note C in Notes to Financial Statements.
2 Affiliated money market fund available only to Vanguard funds and certain trusts and accounts managed by Vanguard. Rate shown is the 7-day yield.
3 The issuer operates under a congressional charter; its securities are neither issued nor guaranteed by the U.S. government. If needed, access to additional funding from the U.S. Treasury (beyond the issuer’s line of credit) would require congressional action.
4 Securities with a value of $4,457,000 have been segregated as initial margin for open futures contracts.
5 See Note C in Notes to Financial Statements for the tax-basis components of net assets.
ADR—American Depositary Receipt.
(Ptg. Ctf.)—Participating Certificate.
22
European Stock Index Fund
| |
| |
Statement of Operations | |
| |
| Six Months Ended |
| April 30, 2006 |
| ($000) |
Investment Income | |
Income | |
Dividends1 | 251,187 |
Interest2 | 589 |
Security Lending | 2,176 |
Total Income | 253,952 |
Expenses | |
The Vanguard Group—Note B | |
Investment Advisory Services | 105 |
Management and Administrative—Investor Shares | 13,166 |
Management and Administrative—Admiral Shares | 1,007 |
Management and Administrative—Institutional Shares | 595 |
Management and Administrative—VIPER Shares | 228 |
Marketing and Distribution—Investor Shares | 1,616 |
Marketing and Distribution—Admiral Shares | 141 |
Marketing and Distribution—Institutional Shares | 305 |
Marketing and Distribution—VIPER Shares | 35 |
Custodian Fees | 2,100 |
Shareholders’ Reports—Investor Shares | 34 |
Shareholders’ Reports—Admiral Shares | 2 |
Shareholders’ Reports—Institutional Shares | — |
Shareholders’ Reports—VIPER Shares | — |
Trustees’ Fees and Expenses | 8 |
Total Expenses | 19,342 |
Net Investment Income | 234,610 |
Realized Net Gain (Loss) | |
Investment Securities Sold | 288,136 |
Futures Contracts | 4,016 |
Foreign Currencies and Forward Currency Contracts | (1,197) |
Realized Net Gain (Loss) | 290,955 |
Change in Unrealized Appreciation (Depreciation) | |
Investment Securities | 2,778,761 |
Futures Contracts | 100 |
Foreign Currencies and Forward Currency Contracts | 7,700 |
Change in Unrealized Appreciation (Depreciation) | 2,786,561 |
Net Increase (Decrease) in Net Assets Resulting from Operations | 3,312,126 |
1 Dividends are net of foreign withholding taxes of $19,208,000.
2 Interest income from an affiliated company of the fund was $589,000.
23
European Stock Index Fund | | |
| | |
| | |
| | |
Statement of Changes in Net Assets | | |
| | |
| Six Months Ended | Year Ended |
| Apr. 30, | Oct. 31, |
| 2006 | 2005 |
| ($000) | ($000) |
Increase (Decrease) in Net Assets | | |
Operations | | |
Net Investment Income | 234,610 | 355,918 |
Realized Net Gain (Loss) | 290,955 | 40,699 |
Change in Unrealized Appreciation (Depreciation) | 2,786,561 | 1,255,827 |
Net Increase (Decrease) in Net Assets Resulting from Operations | 3,312,126 | 1,652,444 |
Distributions | | |
Net Investment Income | | |
Investor Shares | (283,561) | (199,504) |
Admiral Shares | (37,265) | (16,305) |
Institutional Shares | (50,291) | (29,505) |
VIPER Shares | (7,061) | — |
Realized Capital Gain | | |
Investor Shares | — | — |
Admiral Shares | — | — |
Institutional Shares | — | — |
VIPER Shares | — | — |
Total Distributions | (378,178) | (245,314) |
Capital Share Transactions—Note F | | |
Investor Shares | 1,379,947 | 1,705,176 |
Admiral Shares | 215,812 | 633,883 |
Institutional Shares | 108,584 | 683,233 |
VIPER Shares | 267,249 | 174,015 |
Net Increase (Decrease) from Capital Share Transactions | 1,971,592 | 3,196,307 |
Total Increase (Decrease) | 4,905,540 | 4,603,437 |
Net Assets | | |
Beginning of Period | 14,123,822 | 9,520,385 |
End of Period1 | 19,029,362 | 14,123,822 |
1 Net Assets—End of Period includes undistributed net investment income of $167,261,000 and $310,363,000.
24
| | | | | European Stock Index Fund |
| | | | | | | |
| | | | | | | |
| | | | | | | |
Financial Highlights | | | | | | |
| | | | | | | |
Investor Shares | | | | | | | |
| | | | | | |
| Six Months | | | | | | |
| Ended | | | | Jan. 1 to | Year Ended |
For a Share Outstanding | Apr. 30, | Year Ended October 31, | Oct. 31, | Dec. 31, |
Throughout Each Period | 2006 | 2005 | 2004 | 2003 | 2002 | 20011 | 2000 |
Net Asset Value, | | | | | | | |
Beginning of Period | $27.00 | $23.77 | $19.93 | $16.44 | $19.50 | $25.99 | $28.82 |
Investment Operations | | | | | | | |
Net Investment Income | .39 | .67 | .54 | .44 | .39 | .37 | .335 |
Net Realized and Unrealized | | | | | | | |
Gain (Loss) on Investments | 5.52 | 3.14 | 3.76 | 3.45 | (3.01) | (6.85) | (2.692) |
Total from Investment | | | | | | | |
Operations | 5.91 | 3.81 | 4.30 | 3.89 | (2.62) | (6.48) | (2.357) |
Distributions | | | | | | | |
Dividends from Net | | | | | | | |
Investment Income | (.70) | (.58) | (.46) | (.40) | (.44) | (.01) | (.423) |
Distributions from | | | | | | | |
Realized Capital Gains | — | — | — | — | — | — | (.050) |
Total Distributions | (.70) | (.58) | (.46) | (.40) | (.44) | (.01) | (.473) |
Net Asset Value, | | | | | | | |
End of Period | $32.21 | $27.00 | $23.77 | $19.93 | $16.44 | $19.50 | $25.99 |
| | | | | | | |
Total Return2 | 22.29% | 16.21% | 21.89% | 24.27% | –13.81% | –24.94% | –8.18% |
| | | | | | | |
| | | | | | | |
Ratios/Supplemental Data | | | | | | | |
Net Assets, | | | | | | | |
End of Period (Millions) | $14,364 | $10,759 | $7,904 | $5,339 | $3,870 | $4,165 | $5,611 |
Ratio of Total Expenses to | | | | | | | |
Average Net Assets | 0.27%3 | 0.27% | 0.27% | 0.32% | 0.33% | 0.30%3 | 0.29% |
Ratio of Net Investment | | | | | | | |
Income to Average | | | | | | | |
Net Assets | 2.87%3 | 2.84% | 2.67% | 2.76% | 2.24% | 2.08%3 | 1.64% |
Portfolio Turnover Rate4 | 5%3 | 5% | 5% | 6% | 15% | 3% | 8% |
1 The fund’s fiscal year-end changed from December 31 to October 31, effective October 31, 2001.
2 Total returns do not reflect the 0.5% transaction fee on purchases through March 31, 2000; the 2% fee assessed on redemptions of shares purchased on or after June 27, 2003, and held for less than two months; or the $10 annual account maintenance fee applied on balances under $10,000.
3 Annualized.
4 Excludes the value of portfolio securities received or delivered as a result of in-kind purchases or redemptions of the fund’s capital shares, including VIPER Creation Units.
25
European Stock Index Fund | | | | | | |
| | | | | | |
Admiral Shares | | | | | | |
| | | | | | |
| Six Months | | | | | |
| Ended | | | Aug. 131 to |
For a Share Outstanding | Apr. 30, | Year Ended October 31, | Oct. 31, |
Throughout Each Period | 2006 | 2005 | 2004 | 2003 | 2002 | 20012 |
Net Asset Value, Beginning of Period | $63.44 | $55.84 | $46.82 | $38.61 | $45.77 | $50.00 |
Investment Operations | | | | | | |
Net Investment Income | .95 | 1.611 | 1.308 | 1.070 | .96 | .12 |
Net Realized and Unrealized | | | | | | |
Gain (Loss) on Investments | 12.97 | 7.396 | 8.830 | 8.115 | (7.08) | (4.35) |
Total from Investment Operations | 13.92 | 9.007 | 10.138 | 9.185 | (6.12) | (4.23) |
Distributions | | | | | | |
Dividends from Net Investment Income | (1.68) | (1.407) | (1.118) | (.975) | (1.04) | — |
Distributions from | | | | | | |
Realized Capital Gains | — | — | — | — | — | — |
Total Distributions | (1.68) | (1.407) | (1.118) | (.975) | (1.04) | — |
Net Asset Value, End of Period | $75.68 | $63.44 | $55.84 | $46.82 | $38.61 | $45.77 |
| | | | | | |
Total Return3 | 22.36% | 16.32% | 21.98% | 24.42% | –13.74% | –8.46% |
| | | | | | |
Ratios/Supplemental Data | | | | | | |
Net Assets, End of Period (Millions) | $1,861 | $1,360 | $628 | $447 | $335 | $261 |
Ratio of Total Expenses to | | | | | | |
Average Net Assets | 0.17%4 | 0.18% | 0.18% | 0.23% | 0.23% | 0.25%4 |
Ratio of Net Investment | | | | | | |
Income to Average Net Assets | 2.97%4 | 2.93% | 2.76% | 2.84% | 2.41% | 0.70%4 |
Portfolio Turnover Rate5 | 5%4 | 5% | 5% | 6% | 15% | 3% |
1 Inception.
2 The fund’s fiscal year-end changed from December 31 to October 31, effective October 31, 2001.
3 Total returns do not reflect the 2% fee assessed on redemptions of shares purchased on or after June 27, 2003, and held for less than two months.
4 Annualized.
5 Excludes the value of portfolio securities received or delivered as a result of in-kind purchases or redemptions of the fund’s capital shares, including VIPER Creation Units.
26
| | | European Stock Index Fund |
| | | | | | | |
Institutional Shares | | | | | | | |
| | | | | | | |
| Six Months | | | | | | |
| Ended | | | | Jan. 1 to | May 152 |
For a Share Outstanding | Apr. 30, | Year Ended October 31, | Oct. 31, | to Dec. 31, |
Throughout Each Period | 2006 | 2005 | 2004 | 2003 | 2002 | 20011 | 2000 |
Net Asset Value, | | | | | | | |
Beginning of Period | $27.05 | $23.80 | $19.96 | $16.46 | $19.52 | $25.99 | $27.22 |
Investment Operations | | | | | | | |
Net Investment Income | .418 | .721 | .57 | .471 | .414 | .390 | .172 |
Net Realized and Unrealized | | | | | | | |
Gain (Loss) on Investments | 5.520 | 3.140 | 3.76 | 3.454 | (3.015) | (6.848) | (.965) |
Total from Investment | | | | | | | |
Operations | 5.938 | 3.861 | 4.33 | 3.925 | (2.601) | (6.458) | (.793) |
Distributions | | | | | | | |
Dividends from Net | | | | | | | |
Investment Income | (.738) | (.611) | (.49) | (.425) | (.459) | (.012) | (.437) |
Distributions from | | | | | | | |
Realized Capital Gains | — | — | — | — | — | — | — |
Total Distributions | (.738) | (.611) | (.49) | (.425) | (.459) | (.012) | (.437) |
Net Asset Value, | | | | | | | |
End of Period | $32.25 | $27.05 | $23.80 | $19.96 | $16.46 | $19.52 | $25.99 |
| | | | | | | |
Total Return3 | 22.38% | 16.42% | 22.03% | 24.49% | –13.71% | –24.85% | –2.89% |
| | | | | | | |
Ratios/Supplemental Data | | | | | | | |
Net Assets, | | | | | | | |
End of Period (Millions) | $2,296 | $1,827 | $988 | $649 | $311 | $248 | $284 |
Ratio of Total Expenses to | | | | | | | |
Average Net Assets | 0.12%4 | 0.12% | 0.12% | 0.17% | 0.18% | 0.20%4 | 0.20%4 |
Ratio of Net Investment | | | | | | | |
Income to Average | | | | | | | |
Net Assets | 3.02%4 | 2.99% | 2.77% | 2.96% | 2.46% | 2.13%4 | 1.19%4 |
Portfolio Turnover Rate5 | 5%4 | 5% | 5% | 6% | 15% | 3% | 8% |
1 The fund’s fiscal year-end changed from December 31 to October 31, effective October 31, 2001.
2 Inception.
3 Total returns do not reflect the 2% fee assessed on redemptions of shares purchased on or after June 27, 2003, and held for less than two months.
4 Annualized.
5 Excludes the value of portfolio securities received or delivered as a result of in-kind purchases or redemptions of the fund’s capital shares, including VIPER Creation Units.
27
European Stock Index Fund | | |
| | |
VIPER Shares | | |
| Six Months | |
| Ended | March 41 |
| Apr. 30, | to Oct. 31, |
For a Share Outstanding Throughout Each Period | 2006 | 2005 |
Net Asset Value, Beginning of Period | $50.80 | $50.96 |
Investment Operations | | |
Net Investment Income | .77 | 1.04 |
Net Realized and Unrealized Gain (Loss) on Investments | 10.36 | (1.20) |
Total from Investment Operations | 11.13 | (.16) |
Distributions | | |
Dividends from Net Investment Income | (1.38) | — |
Distributions from Realized Capital Gains | — | — |
Total Distributions | (1.38) | — |
Net Asset Value, End of Period | $60.55 | $50.80 |
| | |
Total Return | 22.34% | –0.31% |
| | |
Ratios/Supplemental Data | | |
Net Assets, End of Period (Millions) | $508 | $178 |
Ratio of Total Expenses to Average Net Assets | 0.18%2 | 0.18%2 |
Ratio of Net Investment Income to Average Net Assets | 2.96%2 | 2.93%2 |
Portfolio Turnover Rate3 | 5%2 | 5% |
1 Inception.
2 Annualized.
3 Excludes the value of portfolio securities received or delivered as a result of in-kind purchases or redemptions of the fund’s capital shares, including VIPER Creation Units.
See accompanying Notes, which are an integral part of the Financial Statements.
28
European Stock Index Fund
Notes to Financial Statements
Vanguard European Stock Index Fund is registered under the Investment Company Act of 1940 as an open-end investment company, or mutual fund. The fund files reports with the SEC under the company name Vanguard International Equity Index Funds. The fund invests in securities of foreign issuers, which may subject it to investment risks not normally associated with investing in securities of U.S. corporations. The fund offers four classes of shares: Investor Shares, Admiral Shares, Institutional Shares, and VIPER Shares. Investor Shares are available to any investor who meets the fund’s minimum purchase requirements. Admiral Shares are designed for investors who meet certain administrative, servicing, tenure, and account-size criteria. Institutional Shares are designed for investors who meet certain administrative and servicing criteria and invest a minimum of $5 million. VIPER Shares are listed for trading on the American Stock Exchange; they can be purchased and sold through a broker.
A. The following significant accounting policies conform to generally accepted accounting principles for U.S. mutual funds. The fund consistently follows such policies in preparing its financial statements.
1. Security Valuation: Securities are valued as of the close of trading on the New York Stock Exchange (generally 4:00 p.m., Eastern time) on the valuation date. Equity securities are valued at the latest quoted sales prices or official closing prices taken from the primary market in which each security trades; such securities not traded on the valuation date are valued at the mean of the latest quoted bid and asked prices. Securities for which market quotations are not readily available, or whose values have been affected by events occurring before the fund’s pricing time but after the close of the securities’ primary markets, are valued at their fair values calculated according to procedures adopted by the board of trustees. These procedures include obtaining quotations from an independent pricing service, monitoring news to identify significant market- or security-specific events, and evaluating changes in the values of foreign market proxies (for example, ADRs, futures contracts, or exchange-traded funds), between the time the foreign markets close and the fund’s pricing time. When fair-value pricing is employed, the prices of securities used by a fund to calculate its net asset value may differ from quoted or published prices for the same securities. Investments in Vanguard Market Liquidity Fund are valued at that fund’s net asset value. Temporary cash investments acquired over 60 days to maturity are valued using the latest bid prices or using valuations based on a matrix system (which considers such factors as security prices, yields, maturities, and ratings), both as furnished by independent pricing services. Other temporary cash investments are valued at amortized cost, which approximates market value.
2. Foreign Currency: Securities and other assets and liabilities denominated in foreign currencies are translated into U.S. dollars at the exchange rates on the valuation date as employed by Morgan Stanley Capital International (MSCI) in the calculation of its indexes. As part of the funds’ fair-value procedures, exchange rates may be adjusted if they change significantly before the fund’s pricing time but after the time at which the MSCI rates are determined (generally 11:00 a.m., Eastern time).
Realized gains (losses) and unrealized appreciation (depreciation) on investment securities include the effects of changes in exchange rates since the securities were purchased, combined with the effects of changes in security prices. Fluctuations in the value of other assets and liabilities resulting from changes in exchange rates are recorded as unrealized foreign currency gains (losses) until the asset or liability is settled in cash, when they are recorded as realized foreign currency gains (losses).
3. Futures and Forward Currency Contracts: The fund uses index futures contracts to a limited extent, with the objectives of maintaining full exposure to the stock market, enhancing returns, maintaining liquidity, and minimizing transaction costs. The fund may purchase futures contracts to immediately invest incoming cash in the market, or sell futures in response to cash outflows, thereby simulating a fully invested position in the underlying index while maintaining a cash balance for liquidity. The fund may seek to enhance returns by using futures contracts instead of the underlying securities when futures are
29
European Stock Index Fund
believed to be priced more attractively than the underlying securities. The primary risks associated with the use of futures contracts are imperfect correlation between changes in market values of stocks held by the fund and the prices of futures contracts, and the possibility of an illiquid market.
The fund also enters into forward currency contracts to provide the appropriate currency exposure related to any open futures contracts. The fund’s risks in using these contracts include movement in the values of the foreign currencies relative to the U.S. dollar and the ability of the counterparties to fulfill their obligations under the contracts.
Futures and forward currency contracts are valued at their quoted daily settlement prices. The aggregate principal amounts of the contracts are not recorded in the financial statements. Fluctuations in the value of the contracts are recorded in the Statement of Net Assets as an asset (liability) and in the Statement of Operations as unrealized appreciation (depreciation) until the contracts are closed, when they are recorded as realized gains (losses) on futures or forward currency contracts.
4. Federal Income Taxes: The fund intends to continue to qualify as a regulated investment company and distribute all of its taxable income. Accordingly, no provision for federal income taxes is required in the financial statements.
5. Distributions: Distributions to shareholders are recorded on the ex-dividend date.
6. Security Lending: The fund may lend its securities to qualified institutional borrowers to earn additional income. Security loans are required to be secured at all times by collateral at least equal to the market value of securities loaned. The fund invests cash collateral received in Vanguard Market Liquidity Fund, and records a liability for the return of the collateral, during the period the securities are on loan. Security lending income represents the income earned on investing cash collateral, less expenses associated with the loan.
7. Other: Dividend income is recorded on the ex-dividend date. Interest income includes income distributions received from Vanguard Market Liquidity Fund and is accrued daily. Security transactions are accounted for on the date securities are bought or sold. Costs used to determine realized gains (losses) on the sale of investment securities are those of the specific securities sold. Fees assessed on capital share transactions are credited to paid-in capital.
Each class of shares has equal rights as to assets and earnings, except that each class separately bears certain class-specific expenses related to maintenance of shareholder accounts (included in Management and Administrative expenses) and shareholder reporting. Marketing and distribution expenses are allocated to each class of shares based on a method approved by the board of trustees. Income, other non-class-specific expenses, and gains and losses on investments are allocated to each class of shares based on its relative net assets.
B. The Vanguard Group furnishes at cost investment advisory, corporate management, administrative, marketing, and distribution services. The costs of such services are allocated to the fund under methods approved by the board of trustees. The fund has committed to provide up to 0.40% of its net assets in capital contributions to Vanguard. At April 30, 2006, the fund had contributed capital of $1,943,000 to Vanguard (included in Other Assets), representing 0.01% of the fund’s net assets and 1.94% of Vanguard’s capitalization. The fund’s trustees and officers are also directors and officers of Vanguard.
C. Distributions are determined on a tax basis and may differ from net investment income and realized capital gains for financial reporting purposes. Differences may be permanent or temporary. Permanent differences are reclassified among capital accounts in the financial statements to reflect their tax character. Temporary differences arise when certain items of income, expense, gain, or loss are recognized in
30
European Stock Index Fund
different periods for financial statement and tax purposes; these differences will reverse at some time in the future. Differences in classification may also result from the treatment of short-term gains as ordinary income for tax purposes.
During the six months ended April 30, 2006, the fund realized net foreign currency gains of $93,000, which increased distributable net income for tax purposes; accordingly, such gains have been reclassified from accumulated net realized losses to undistributed net investment income.
During the six months ended April 30, 2006, the fund realized $204,989,000 of net capital gains resulting from in-kind redemptions—in which shareholders exchanged fund shares for securities held by the fund rather than for cash. Because such gains are not taxable to the fund, and are not distributed to shareholders, they have been reclassified from accumulated net realized losses to paid-in capital.
Certain of the fund’s investments are in securities considered to be “passive foreign investment companies,” for which any unrealized appreciation and/or realized gains are required to be included in distributable net income for tax purposes. During the six months ended April 30, 2006, the fund realized gains on sales of passive foreign investment companies of $373,000, which have been included in current and prior periods’ taxable income; accordingly, such gains have been reclassified from accumulated net realized losses to undistributed net investment income. Unrealized appreciation through October 31, 2005, on the fund’s passive foreign investment company holdings at April 30, 2006, was $8,569,000, of which $8,850,000 has been distributed and is reflected in the balance of undistributed net investment income.
The fund’s tax-basis capital gains and losses are determined only at the end of each fiscal year. For tax purposes, at October 31, 2005, the fund had available realized losses of $305,896,000 to offset future net capital gains of $11,177,000 through October 31, 2009, $249,897,000 through October 31, 2010, and $44,822,000 through October 31, 2011. The fund will use these capital losses to offset net taxable capital gains, if any, realized during the year ending October 31, 2006; should the fund realize net capital losses for the year, the losses will be added to the loss carryforward balances above.
At April 30, 2006, net unrealized appreciation of investment securities for tax purposes was $5,842,121,000, consisting of unrealized gains of $6,158,647,000 on securities that had risen in value since their purchase and $316,526,000 in unrealized losses on securities that had fallen in value since their purchase.
At April 30, 2006, the aggregate settlement value of open futures contracts expiring in June 2006 and the related unrealized appreciation (depreciation) were:
| | | ($000) |
| | Aggregate | Unrealized |
| Number of | Settlement | Appreciation |
Futures Contracts | Long Contracts | Value | (Depreciation) |
MSCI Pan-Euro Index | 4,268 | 121,197 | (209) |
At April 30, 2006, the fund had open forward currency contracts to receive and deliver currencies as follows:
| | | | | Unrealized |
| | | | | Appreciation |
| | Contract Amount (000) | (Depreciation) |
Contract Settlement Date | | Receive | | | Deliver | ($000) |
6/21/2006 | EUR | 96,300 | | USD | 121,740 | 3,306 |
EUR–Euro. | | | | | | |
USD–U.S. dollar. | | | | | | |
31
European Stock Index Fund
Unrealized appreciation (depreciation) on open forward currency contracts is treated as realized gain (loss) for tax purposes.
The fund had net unrealized foreign currency gains of $2,479,000, resulting from the translation of other assets and liabilities at April 30, 2006.
D. During the six months ended April 30, 2006, the fund purchased $2,416,086,000 of investment securities and sold $660,859,000 of investment securities, other than temporary cash investments.
E. The market value of securities on loan to broker/dealers at April 30, 2006, was $1,557,463,000, for which the fund received cash collateral of $1,650,460,000.
F. Capital share transactions for each class of shares were:
| Six Months Ended | | Year Ended |
| April 30, 2006 | | October 31, 2005 |
| Amount | Shares | | Amount | Shares | |
| ($000) | (000) | | ($000) | (000) | |
Investor Shares | | | | | |
Issued | 1,653,044 | 56,383 | | 2,788,635 | 106,623 |
Issued in Lieu of Cash Distributions | 277,433 | 9,958 | | 193,083 | 7,680 |
Redeemed1 | (550,530) | (18,886) | | (1,276,542) | (48,363) |
Net Increase (Decrease)—Investor Shares | 1,379,947 | 47,455 | | 1,705,176 | 65,940 |
Admiral Shares | | | | | |
Issued | 303,049 | 4,399 | | 765,385 | 12,297 |
Issued in Lieu of Cash Distributions | 31,004 | 474 | | 12,720 | 216 |
Redeemed1 | (118,241) | (1,711) | | (144,222) | (2,328) |
Net Increase (Decrease)—Admiral Shares | 215,812 | 3,162 | | 633,883 | 10,185 |
Institutional Shares | | | | | |
Issued | 530,315 | 17,933 | | 853,531 | 32,519 |
Issued in Lieu of Cash Distributions | 43,746 | 1,569 | | 27,239 | 1,083 |
Redeemed1 | (465,477) | (15,855) | | (197,537) | (7,560) |
Net Increase (Decrease)—Institutional Shares | 108,584 | 3,647 | | 683,233 | 26,042 |
VIPER Shares | | | | | |
Issued | 267,249 | 4,891 | | 174,015 | 3,504 |
Issued in Lieu of Cash Distributions | — | — | | — | — |
Redeemed | — | — | | — | — |
Net Increase (Decrease)—VIPER Shares | 267,249 | 4,891 | | 174,015 | 3,504 |
1 Net of redemption fees of $202,000 and $487,000 (fund totals).
32
Pacific Stock Index Fund
Fund Profile
As of April 30, 2006
Portfolio Characteristics | | |
| | Target | Broad |
| Fund | Index1 | Index2 |
Number of Stocks | 548 | 547 | 2,045 |
Turnover Rate | 0%3 | — | — |
Expense Ratio | | — | — |
Investor Shares | 0.27%3 | | |
Admiral Shares | 0.17%3 | | |
Institutional Shares | 0.12%3 | | |
VIPER Shares | 0.18%3 | | |
Short-Term Reserves | 0% | — | — |
Sector Diversification (% of portfolio) | |
| | Target | Broad |
| Fund | Index1 | Index2 |
Consumer Discretionary | 17% | 17% | 11% |
Consumer Staples | 5 | 5 | 7 |
Energy | 2 | 2 | 10 |
Financials | 28 | 29 | 28 |
Health Care | 4 | 4 | 7 |
Industrials | 16 | 15 | 10 |
Information Technology | 10 | 10 | 7 |
Materials | 11 | 11 | 9 |
Telecommunication Services | 3 | 3 | 6 |
Utilities | 4 | 4 | 5 |
Volatility Measures | | | |
| | Target | | Broad |
| Fund | Index1 | Fund | Index2 |
R-Squared | 0.98 | 1.00 | 0.55 | 1.00 |
Beta | 1.01 | 1.00 | 0.97 | 1.00 |
Ten Largest Holdings4 (% of total net assets) |
| | |
Toyota Motor Corp. | automobile | |
| manufacturers | 4.4% |
Mitsubishi UFJ Financial | | |
Group | diversified banks | 3.4 |
Mizuho Financial | | |
Group, Inc. | diversified banks | 2.1 |
BHP Billiton Ltd. | diversified metals | |
| and mining | 2.1 |
Sumitomo Mitsui | | |
Financial Group, Inc. | diversified banks | 1.7 |
Canon, Inc. | office electronics | 1.5 |
Honda Motor Co., Ltd. | automobile | |
| manufacturers | 1.4 |
Takeda Pharmaceutical | | |
Co. Ltd. | pharmaceuticals | 1.4 |
Matsushita Electric | consumer | |
Industrial Co., Ltd. | electronics | 1.3 |
Sony Corp. | consumer | |
| electronics | 1.3 |
Top Ten | | 20.6% |
Country Diversification (% of portfolio) | |
| | Target |
| Fund | Index1 |
Japan | 76% | 76% |
Australia | 16 | 16 |
Hong Kong | 5 | 5 |
Singapore | 3 | 3 |
1 MSCI Pacific Index.
2 MSCI All Country World Index ex USA.
3 Annualized.
4 “Ten Largest Holdings” excludes any temporary cash investments and equity index products.
See page 108 for a glossary of investment terms.
33
Pacific Stock Index Fund
Performance Summary
All of the returns in this report represent past performance, which is not a guarantee of future results that may be achieved by the fund. (Current performance may be lower or higher than the performance data cited. For performance data current to the most recent month-end, visit our website at www.vanguard.com.) Note, too, that both investment returns and principal value can fluctuate widely, so an investor’s shares, when sold, could be worth more or less than their original cost. The returns shown do not reflect taxes that a shareholder would pay on fund distributions or on the sale of fund shares.
Fiscal-Year Total Returns (%): October 31, 1995–April 30, 2006

Average Annual Total Returns: Periods Ended March 31, 2006
This table presents average annual total returns through the latest calendar quarter—rather than through the end of the fiscal period. Securities and Exchange Commission rules require that we provide this information.
| Inception Date | One Year | Five Years | Ten Years |
Pacific Stock Index Fund | | | | |
Investor Shares2 | 6/18/1990 | 33.00% | 9.55% | 1.40% |
Admiral Shares2 | 8/13/2001 | 33.14 | 11.963 | — |
Institutional Shares2 | 5/15/2000 | 33.26 | 9.73 | 2.923 |
VIPER Shares | 3/4/2005 | | | |
Market Price | | 34.03 | 26.943 | — |
Net Asset Value | | 33.14 | 25.933 | — |
1 Six months ended April 30, 2006.
2 Total return figures do not reflect the 0.5% transaction fee on purchases through March 31, 2000; the 2% fee assessed on redemptions of shares purchased on or after June 27, 2003, and held for less than two months; or, for Investor Shares, the $10 annual account maintenance fee applied on balances under $10,000.
3 Return since inception.
Note: See Financial Highlights tables on pages 47 through 50 for dividend and capital gains information.
34
Pacific Stock Index Fund
Financial Statements (unaudited)
Statement of Net Assets
As of April 30, 2006
The fund provides a complete list of its holdings four times in each fiscal year, at the quarter-ends. For the second and fourth fiscal quarters, the lists appear in the fund’s semiannual and annual reports to shareholders. For the first and third fiscal quarters, the fund files the lists with the Securities and Exchange Commission on Form N-Q. Shareholders can look up the fund’s Forms N-Q on the SEC’s website at www.sec.gov. Forms N-Q may also be reviewed and copied at the SEC’s Public Reference Room (see the back cover of this report for further information).
| | Market |
| | Value• |
| Shares | ($000) |
Common Stocks (99.5%)1 | | |
Australia (16.0%) | | |
BHP Billiton Ltd. | 9,592,277 | 217,712 |
Commonwealth Bank | | |
of Australia | 3,540,259 | 126,342 |
National Australia | | |
Bank Ltd. | 4,387,683 | 125,219 |
Australia & New Zealand | | |
Bank Group Ltd. | 5,016,143 | 106,418 |
Westpac Banking | | |
Corp., Ltd. | 5,030,366 | 95,815 |
Westfield Group | 4,080,175 | 52,468 |
^Rio Tinto Ltd. | 780,421 | 46,709 |
Woodside Petroleum Ltd. | 1,282,152 | 45,444 |
Woolworths Ltd. | 3,197,322 | 45,267 |
Rinker Group Ltd. | 2,534,848 | 40,881 |
QBE Insurance Group Ltd. | 2,135,411 | 36,288 |
AMP Ltd. | 5,137,462 | 35,162 |
Macquarie Bank Ltd. | 634,406 | 34,359 |
Wesfarmers Ltd. | 1,038,644 | 28,524 |
Coles Myer Ltd. | 3,253,498 | 26,448 |
Foster’s Group Ltd. | 5,529,187 | 24,696 |
Suncorp-Metway Ltd. | 1,520,912 | 23,488 |
^Brambles Industries Ltd. | 2,671,064 | 22,674 |
CSL Ltd. | 497,003 | 21,674 |
Stockland | 3,639,158 | 19,013 |
Insurance Australia | | |
Group Ltd. | 4,386,247 | 18,830 |
Australian Gas Light | | |
Co., Ltd. | 1,256,253 | 18,497 |
Macquarie Infrastucture | | |
Group | 6,616,124 | 17,946 |
Alumina Ltd. | 3,200,114 | 17,521 |
^Telstra Corp. Ltd. | 5,803,925 | 17,393 |
Tabcorp Holdings Ltd. | 1,440,071 | 16,718 |
General Property Group | 4,981,475 | 15,882 |
Newcrest Mining Ltd. | 909,879 | 15,872 |
Orica Ltd. | 842,749 | 15,587 |
Santos Ltd. | 1,632,277 | 14,653 |
Macquarie Goodman | | |
Group | 3,397,150 | 13,282 |
Amcor Ltd. | 2,417,498 | 13,243 |
^Patrick Corp. Ltd. | 1,814,686 | 11,744 |
Boral Ltd. | 1,607,332 | 11,649 |
Origin Energy Ltd. | 2,177,208 | 11,640 |
BlueScope Steel Ltd. | 1,961,800 | 11,468 |
AXA Asia Pacific | | |
Holdings Ltd. | 2,398,133 | 11,464 |
Centro Properties Group | 2,213,456 | 10,920 |
Transurban Group | 2,171,317 | 10,877 |
Lend Lease Corp. | 985,382 | 10,683 |
^Aristocrat Leisure Ltd. | 840,364 | 9,412 |
James Hardie | | |
Industries NV | 1,272,669 | 9,142 |
Sonic Healthcare Ltd. | 720,794 | 8,189 |
DB RREEF Trust | 7,198,111 | 8,005 |
Coca-Cola Amatil Ltd. | 1,441,561 | 7,960 |
35
Pacific Stock Index Fund | | |
| | | |
| | | |
| | | |
| | | Market |
| | | Value• |
| | Shares | ($000) |
| CSR Ltd. | 2,505,433 | 7,703 |
| Mirvac Group | 2,355,269 | 7,569 |
| John Fairfax Holdings Ltd. | 2,533,266 | 7,491 |
| ^Toll Holdings Ltd. | 681,755 | 7,247 |
| ^Australian Stock | | |
| Exchange Ltd. | 283,150 | 7,061 |
| Investa Property Group | 4,205,556 | 6,929 |
| Qantas Airways Ltd. | 2,605,777 | 6,838 |
| Computershare Ltd. | 1,065,387 | 6,375 |
| ^Alinta Ltd. | 714,814 | 6,183 |
| Cochlear Ltd. | 150,197 | 6,019 |
| Perpetual Trustees | | |
| Australia Ltd. | 110,949 | 5,891 |
| CFS Gandel Retail Trust | 4,157,383 | 5,839 |
| Babcock & Brown Ltd. | 413,605 | 5,745 |
| Caltex Australia Ltd. | 370,601 | 5,665 |
| Macquarie Office Trust | 5,253,714 | 5,371 |
| Downer EDI Ltd. | 808,478 | 5,334 |
| Publishing & | | |
| Broadcasting Ltd. | 367,691 | 5,187 |
| Lion Nathan Ltd. | 805,911 | 5,090 |
| Leighton Holdings Ltd. | 380,321 | 4,831 |
| OneSteel Ltd. | 1,559,973 | 4,712 |
| SFE Corp. Ltd. | 367,562 | 4,579 |
| Symbion Health Ltd. | 1,760,314 | 4,570 |
| Macquarie Airports Group | 1,774,276 | 4,418 |
| Billabong International Ltd. | 367,186 | 4,297 |
| Commonwealth Property | | |
| Office Fund | 4,234,202 | 4,291 |
| Harvey Norman | | |
| Holdings Ltd. | 1,447,093 | 4,166 |
| Multiplex Group | 1,733,192 | 4,034 |
| *Mayne Pharma Ltd. | 1,739,480 | 3,901 |
| Macquarie Communications | |
| Infrastructure Group | 919,156 | 3,841 |
| Unitab Ltd. | 328,786 | 3,654 |
| Iluka Resources Ltd. | 641,990 | 3,590 |
| ING Industrial Fund | 2,136,938 | 3,538 |
| Ansell Ltd. | 396,890 | 3,446 |
| ^DCA Group Ltd. | 1,176,750 | 3,340 |
| ^Paperlinx Ltd. | 1,223,788 | 3,116 |
| Challenger Financial | | |
| Services Group Ltd. | 1,104,035 | 2,977 |
| ^APN News & Media Ltd. | 784,225 | 2,948 |
| Futuris Corp., Ltd. | 1,457,611 | 2,503 |
| Pacific Brands Ltd. | 1,375,382 | 2,370 |
| | | 1,695,837 |
Hong Kong (4.9%) | | |
| Hutchison Whampoa Ltd. | 5,857,220 | 57,540 |
| Cheung Kong | | |
| Holdings Ltd. | 4,137,092 | 46,653 |
| Sun Hung Kai | | |
| Properties Ltd. | 3,626,924 | 41,456 |
| CLP Holdings Ltd. | 4,966,999 | 28,959 |
| Hang Seng Bank Ltd. | 2,099,366 | 27,178 |
| Swire Pacific Ltd. A Shares | 2,555,000 | 26,138 |
| Hong Kong & China | | |
| Gas Co., Ltd. | 9,839,217 | 23,469 |
| Esprit Holdings Ltd. | 2,638,500 | 21,064 |
| Hong Kong Exchanges & | | |
| Clearing Ltd. | 2,919,000 | 20,981 |
| Boc Hong Kong | | |
| Holdings Ltd. | 10,168,800 | 20,979 |
| Hong Kong Electric | | |
| Holdings Ltd. | 3,815,700 | 18,821 |
| Bank of East Asia Ltd. | 3,936,073 | 16,444 |
| Wharf Holdings Ltd. | 3,361,914 | 13,494 |
| *Link REIT | 5,867,000 | 12,936 |
| New World Development | | |
| Co., Ltd. | 6,921,146 | 12,443 |
| Henderson Land | | |
| Development Co. Ltd. | 1,995,324 | 11,727 |
| Li & Fung Ltd. | 4,846,500 | 11,494 |
| Hang Lung Properties Ltd. | 5,054,300 | 10,162 |
| MTR Corp. | 3,759,200 | 10,024 |
| *Hutchison | | |
| Telecommunications | | |
| International Ltd. | 3,928,673 | 6,916 |
| Sino Land Co. | 4,100,400 | 6,825 |
| PCCW Ltd. | 10,192,769 | 6,760 |
| Shangri-La Asia Ltd. | 3,117,962 | 5,528 |
| Hopewell Holdings Ltd. | 1,734,800 | 5,053 |
| Techtronic Industries | | |
| Co., Ltd. | 3,007,000 | 5,044 |
36
Pacific Stock Index Fund
| | Market |
| | Value• |
| Shares | ($000) |
Hysan Development | | |
Co., Ltd. | 1,729,811 | 4,979 |
Cathay Pacific | | |
Airways Ltd. | 2,784,600 | 4,975 |
Television Broadcasts Ltd. | 781,320 | 4,886 |
Kerry Properties Ltd. | 1,331,727 | 4,703 |
Wing Hang Bank Ltd. | 481,509 | 4,466 |
Cheung Kong Infrastructure | | |
Holdings Ltd. | 1,232,600 | 4,024 |
Kingboard Chemical | | |
Holdings Ltd. | 1,508,000 | 3,982 |
Yue Yuen Industrial | | |
(Holdings) Ltd. | 1,335,900 | 3,917 |
Johnson Electric | | |
Holdings Ltd. | 4,063,600 | 3,430 |
ASM Pacific | | |
Technology Ltd. | 479,000 | 2,788 |
Giordano International Ltd. | 4,081,600 | 2,408 |
Solomon Systech | | |
International Ltd. | 5,213,314 | 2,320 |
Orient Overseas | | |
International Ltd. | 607,724 | 2,287 |
Texwinca Holdings Ltd. | 1,622,000 | 1,191 |
SCMP Group Ltd. | 2,527,346 | 944 |
SmarTone | | |
Telecommunications Ltd. | 797,100 | 894 |
| | 520,282 |
Japan (75.5%) | | |
Toyota Motor Corp. | 7,934,343 | 462,379 |
Mitsubishi UFJ Financial | | |
Group | 23,375 | 364,555 |
Mizuho Financial Group, Inc. | 26,384 | 224,019 |
Sumitomo Mitsui Financial | | |
Group, Inc. | 16,228 | 177,493 |
Canon, Inc. | 2,075,066 | 157,268 |
Honda Motor Co., Ltd. | 2,168,200 | 153,163 |
Takeda Pharmaceutical | | |
Co. Ltd. | 2,443,120 | 149,039 |
Matsushita Electric | | |
Industrial Co., Ltd. | 5,728,975 | 137,832 |
Sony Corp. | 2,749,064 | 134,090 |
Nomura Holdings Inc. | 4,861,100 | 109,531 |
Mitsubishi Corp. | 3,686,300 | 88,804 |
Seven and I Holdings | | |
Co., Ltd. | 2,219,240 | 85,776 |
Nissan Motor Co., Ltd. | 6,210,220 | 81,370 |
Tokyo Electric Power Co. | 3,159,110 | 80,886 |
Millea Holdings, Inc. | 4,032 | 80,344 |
East Japan Railway Co. | 9,341 | 72,712 |
NTT DoCoMo, Inc. | 46,830 | 69,611 |
Orix Corp. | 231,258 | 69,341 |
Mitsubishi Estate Co., Ltd. | 3,034,000 | 66,160 |
Hitachi Ltd. | 8,790,000 | 65,137 |
Mitsui & Co., Ltd. | 4,237,600 | 63,976 |
Nippon Telegraph and | | |
Telephone Corp. | 14,271 | 63,833 |
Astellas Pharma Inc. | 1,498,098 | 62,309 |
Nippon Steel Corp. | 16,832,000 | 61,891 |
Shin-Etsu Chemical | | |
Co., Ltd. | 1,068,500 | 61,486 |
JFE Holdings, Inc. | 1,532,600 | 59,315 |
Denso Corp. | 1,457,500 | 56,882 |
Komatsu Ltd. | 2,470,000 | 52,537 |
^Softbank Corp. | 2,028,218 | 51,953 |
Toshiba Corp. | 7,959,000 | 50,387 |
Japan Tobacco, Inc. | 12,368 | 49,491 |
Kansai Electric Power | | |
Co., Inc. | 2,115,800 | 49,404 |
T & D Holdings, Inc. | 641,250 | 49,086 |
Mitsui Fudosan Co., Ltd. | 2,153,540 | 48,110 |
Daiwa Securities | | |
Group Inc. | 3,475,850 | 47,882 |
Hoya Corp. | 1,173,000 | 47,263 |
Sumitomo Metal | | |
Industries Ltd. | 11,223,000 | 47,125 |
Fanuc Co., Ltd. | 493,500 | 46,531 |
Daiichi Sankyo Co., Ltd. | 1,801,536 | 46,219 |
Mitsubishi Electric Corp. | 5,311,000 | 45,919 |
Fuji Photo Film Co., Ltd. | 1,343,300 | 45,534 |
Sharp Corp. | 2,595,000 | 45,299 |
Mitsui Sumitomo | | |
Insurance Co. | 3,325,552 | 44,628 |
Aeon Co., Ltd. | 1,793,800 | 44,450 |
Bridgestone Corp. | 1,830,859 | 44,401 |
37
Pacific Stock Index Fund | | |
| | Market |
| | Value• |
| Shares | ($000) |
Central Japan Railway Co. | 4,308 | 44,216 |
Sumitomo Corp. | 2,921,000 | 43,560 |
Chubu Electric Power Co. | 1,619,500 | 42,376 |
Resona Holdings Inc. | 12,493 | 42,317 |
Kyocera Corp. | 446,800 | 41,667 |
KDDI Corp. | 6,692 | 41,060 |
Mitsubishi Heavy | | |
Industries Ltd. | 8,341,000 | 41,024 |
Nintendo Co. | 272,500 | 40,413 |
Murata Manufacturing | | |
Co., Ltd. | 557,055 | 40,369 |
Fujitsu Ltd. | 4,834,000 | 40,065 |
Asahi Glass Co., Ltd. | 2,770,000 | 38,984 |
NEC Corp. | 5,576,812 | 38,884 |
Kao Corp. | 1,434,661 | 38,465 |
Nitto Denko Corp. | 453,600 | 37,857 |
Itochu Corp. | 4,138,000 | 37,361 |
Nikko Securities Co., Ltd. | 2,273,753 | 36,569 |
Sumitomo Trust & Banking | | |
Co., Ltd. | 3,446,204 | 36,468 |
Ricoh Co. | 1,842,386 | 36,366 |
Sumitomo Chemical Co. | 4,095,000 | 35,743 |
Toray Industries, Inc. | 3,661,740 | 34,123 |
Sompo Japan | | |
Insurance Inc. | 2,306,000 | 33,324 |
Kubota Corp. | 2,896,000 | 32,542 |
Tokyo Electron Ltd. | 446,830 | 31,986 |
Kirin Brewery Co., Ltd. | 2,165,048 | 31,975 |
Eisai Co., Ltd. | 693,100 | 31,532 |
Secom Co., Ltd. | 577,500 | 31,426 |
Sumitomo Electric | | |
Industries Ltd. | 1,979,700 | 31,320 |
Rohm Co., Ltd. | 294,000 | 31,071 |
Dai-Nippon Printing | | |
Co., Ltd. | 1,727,741 | 30,876 |
Tokyo Gas Co., Ltd. | 6,172,000 | 29,741 |
Sumitomo Realty & | | |
Development Co. | 1,048,000 | 27,663 |
TDK Corp. | 329,100 | 27,440 |
Tohoku Electric Power Co. | 1,173,600 | 26,977 |
Nippon Oil Corp. | 3,422,479 | 26,952 |
Bank of Yokohama Ltd. | 3,284,000 | 25,606 |
Keyence Corp. | 96,658 | 25,260 |
Kobe Steel Ltd. | 7,387,095 | 25,040 |
Asahi Kasei Corp. | 3,367,000 | 24,793 |
Kyushu Electric Power | | |
Co., Inc. | 1,042,100 | 24,278 |
Yahoo Japan Corp. | 41,498 | 24,076 |
Toyoda Automatic | | |
Loom Works Ltd. | 537,200 | 23,840 |
Advantest Corp. | 205,568 | 23,559 |
Yamada Denki Co., Ltd. | 214,416 | 23,265 |
Credit Saison Co., Ltd. | 443,300 | 23,209 |
Daiwa House Industry | | |
Co., Ltd. | 1,362,000 | 23,141 |
Nidec Corp. | 295,500 | 22,736 |
Daikin Industries Ltd. | 652,300 | 22,695 |
Sekisui House Ltd. | 1,460,858 | 22,576 |
SMC Corp. | 148,000 | 22,380 |
Sumitomo Metal | | |
Mining Co. | 1,493,000 | 21,623 |
Marubeni Corp. | 3,697,000 | 21,229 |
Mitsui OSK Lines Ltd. | 2,981,000 | 21,206 |
West Japan Railway Co. | 4,672 | 20,690 |
* Inpex Holdings, Inc. | 2,265 | 20,637 |
Osaka Gas Co., Ltd. | 5,529,000 | 20,630 |
Yamato Holdings Co., Ltd. | 1,033,000 | 20,529 |
Toppan Printing Co., Ltd. | 1,538,000 | 20,524 |
Mitsubishi Chemical | | |
Holdings Corp. | 3,224,500 | 20,304 |
Mitsui Trust Holding Inc. | 1,471,400 | 20,232 |
Ajinomoto Co., Inc. | 1,608,000 | 19,967 |
Aisin Seiki Co., Ltd. | 526,638 | 19,704 |
Takefuji Corp. | 303,790 | 19,656 |
Nippon Mining | | |
Holdings Inc. | 2,099,500 | 19,308 |
Shiseido Co., Ltd. | 992,000 | 19,171 |
Shinsei Bank, Ltd. | 2,615,764 | 18,227 |
Olympus Corp. | 633,984 | 18,091 |
Chiba Bank Ltd. | 1,965,000 | 17,733 |
Nippon Yusen Kabushiki | | |
Kaisha Co. | 2,876,000 | 17,564 |
38
Pacific Stock Index Fund
| | | Market |
| | | Value• |
| | Shares | ($000) |
| Electric Power Development | | |
| Co., Ltd. | 457,040 | 17,546 |
| Dentsu Inc. | 4,975 | 17,234 |
| Tokyu Corp. | 2,438,000 | 17,132 |
| Ibiden Co., Ltd. | 362,100 | 17,108 |
| Shizuoka Bank Ltd. | 1,581,000 | 16,656 |
| Terumo Corp. | 462,900 | 16,557 |
| Marui Co., Ltd. | 859,500 | 16,546 |
| Chugai Pharmaceutical | | |
| Co., Ltd. | 765,000 | 16,518 |
* | Konica Minolta | | |
| Holdings, Inc. | 1,240,500 | 16,289 |
| JS Group Corp. | 731,108 | 16,197 |
| Omron Corp. | 582,900 | 16,196 |
| NTT Data Corp. | 3,465 | 15,986 |
| Kinki Nippon Railway Co. | 4,206,150 | 15,686 |
| Teijin Ltd. | 2,293,000 | 15,650 |
| Sumitomo Heavy | | |
| Industries Ltd. | 1,488,000 | 15,600 |
| Sega Sammy Holdings Inc. | 388,632 | 15,418 |
| JSR Corp. | 491,800 | 15,074 |
| Nikon Corp. | 763,440 | 14,958 |
| Promise Co., Ltd. | 240,700 | 14,800 |
| Shionogi & Co., Ltd. | 868,000 | 14,600 |
| Asahi Breweries Ltd. | 1,016,100 | 14,501 |
| Rakuten, Inc. | 17,814 | 14,314 |
| ^Mitsubishi Materials Corp. | 2,646,000 | 14,203 |
| Mitsubishi Gas | | |
| Chemical Co. | 1,063,000 | 14,037 |
| Yamaha Motor Co., Ltd. | 509,900 | 13,948 |
| Kajima Corp. | 2,468,000 | 13,918 |
| Furukawa Electric Co. | 1,743,000 | 13,825 |
| ^Fast Retailing Co., Ltd. | 145,600 | 13,776 |
| Mitsubishi Rayon Co., Ltd. | 1,486,000 | 13,587 |
| Toyota Tsusho Corp. | 538,748 | 13,443 |
| ^Bank of Fukuoka, Ltd. | 1,544,000 | 13,238 |
| OJI Paper Co., Ltd. | 2,192,740 | 13,038 |
| Ohbayashi Corp. | 1,686,000 | 12,860 |
| Leopalace21 Corp. | 329,100 | 12,750 |
| Mitsui Chemicals, Inc. | 1,742,000 | 12,565 |
| Joyo Bank Ltd. | 1,875,000 | 12,535 |
| Mitsubishi Securities | | |
| Co., Ltd. | 798,000 | 12,495 |
| Showa Denko K.K. | 2,829,000 | 12,456 |
| Kuraray Co., Ltd. | 1,000,000 | 12,294 |
| Hokuhoku Financial | | |
| Group, Inc. | 3,005,000 | 12,199 |
| ^Kawasaki Heavy | | |
| Industries Ltd. | 3,374,000 | 12,160 |
| Hirose Electric Co., Ltd. | 82,600 | 12,058 |
| Office Building Fund of | | |
| Japan Inc. | 1,245 | 11,765 |
| Nippon Electric Glass | | |
| Co., Ltd. | 526,218 | 11,763 |
| *^Sanyo Electric Co., Ltd. | 4,378,000 | 11,553 |
| ^Nippon Express Co., Ltd. | 2,192,000 | 11,532 |
Acom Co., Ltd. | 197,670 | 11,503 |
Taiheiyo Cement Corp. | 2,353,000 | 11,396 |
Hokkaido Electric Power | | |
Co., Ltd. | 503,661 | 11,190 |
Shimizu Corp. | 1,621,000 | 11,189 |
Koyo Seiko Co., Ltd. | 521,923 | 11,188 |
Casio Computer Co. | 595,500 | 11,137 |
^Taisei Corp. | 2,491,000 | 11,098 |
Tobu Railway Co., Ltd. | 2,246,000 | 11,092 |
^Takashimaya Co. | 759,972 | 11,041 |
Nippon Paper Group, Inc. | 2,585 | 11,026 |
Daito Trust Construction | | |
Co., Ltd. | 212,691 | 11,019 |
NGK Spark Plug Co. | 503,682 | 10,977 |
Matsushita Electric | | |
Works, Ltd. | 907,000 | 10,953 |
Mitsui Mining & Smelting | | |
Co., Ltd. | 1,577,000 | 10,902 |
Sekisui Chemical Co. | 1,263,000 | 10,875 |
NSK Ltd. | 1,208,000 | 10,868 |
^Odakyu Electric Railway Co. | 1,716,000 | 10,770 |
Ishikawajima-Harima Heavy | | |
Industries Co. | 3,026,000 | 10,709 |
Softbank Investment Corp. | 21,073 | 10,667 |
Tokuyama Corp. | 646,000 | 10,609 |
NGK Insulators Ltd. | 736,000 | 10,516 |
Keio Electric Railway | | |
Co., Ltd. | 1,500,000 | 10,503 |
39
Pacific Stock Index Fund | | |
| | |
| | |
| | |
| | Market |
| | Value• |
| Shares | ($000) |
Aiful Corp. | 175,350 | 10,431 |
Amada Co., Ltd. | 950,000 | 10,352 |
Fujikura Ltd. | 879,000 | 10,106 |
Trend Micro Inc. | 261,000 | 10,091 |
Isetan Co. | 490,600 | 10,016 |
^Keihin Electric Express | | |
Railway Co., Ltd. | 1,215,000 | 9,918 |
JGC Corp. | 568,000 | 9,892 |
Citizen Watch Co., Ltd. | 988,600 | 9,624 |
Stanley Electric Co. | 413,700 | 9,584 |
Sankyo Co., Ltd. | 134,300 | 9,502 |
^Seiko Epson Corp. | 297,400 | 9,358 |
Tokyu Land Corp. | 1,097,000 | 9,278 |
THK Co., Inc. | 280,000 | 9,101 |
Makita Corp. | 303,900 | 8,995 |
^NTN Corp. | 1,081,000 | 8,900 |
Yamaha Corp. | 482,300 | 8,889 |
Chiyoda Corp. | 395,000 | 8,847 |
^ToneGeneral Sekiyu K.K. | 817,000 | 8,846 |
Kaneka Corp. | 783,982 | 8,808 |
Yokogawa Electric Corp. | 558,900 | 8,784 |
Daido Steel Co., Ltd. | 956,000 | 8,717 |
^Kawasaki Kisen Kaisha Ltd. | 1,384,000 | 8,671 |
NOK Corp. | 286,000 | 8,659 |
Toyo Seikan Kaisha Ltd. | 445,800 | 8,625 |
Daimaru, Inc. | 593,000 | 8,602 |
CSK Corp. | 179,900 | 8,596 |
Dowa Mining Co. Ltd. | 753,000 | 8,552 |
Hitachi Chemical Co., Ltd. | 285,700 | 8,282 |
Alps Electric Co., Ltd. | 472,900 | 8,265 |
Fuji Electric Holdings | | |
Co., Ltd. | 1,433,000 | 8,265 |
Ube Industries Ltd. | 2,484,000 | 8,249 |
Oriental Land Co., Ltd. | 137,500 | 8,238 |
Namco Bandai Holdings Inc. | 573,700 | 8,237 |
Nisshin Steel Co. | 2,322,000 | 8,070 |
Bank of Kyoto Ltd. | 697,000 | 8,042 |
Taisho Pharmaceutical Co. | 395,000 | 8,012 |
^Toto Ltd. | 766,000 | 7,967 |
MEDICEO Holdings | | |
Co., Ltd. | 425,782 | 7,872 |
Uny Co., Ltd. | 441,000 | 7,845 |
Sumco Corp. | 131,083 | 7,791 |
Nissin Food Products | | |
Co., Ltd. | 245,000 | 7,785 |
Japan Real Estate | | |
Investment Corp. | 855 | 7,784 |
Tokyo Tatemono Co., Ltd. | 670,000 | 7,694 |
Nomura Research | | |
Institute, Ltd. | 61,848 | 7,655 |
The Suruga Bank, Ltd. | 547,000 | 7,608 |
Toho Co., Ltd. | 390,700 | 7,546 |
^Yakult Honsha Co., Ltd. | 289,800 | 7,536 |
Gunma Bank Ltd. | 969,000 | 7,447 |
Pioneer Corp. | 422,200 | 7,435 |
Nissan Chemical | | |
Industries, Ltd. | 438,000 | 7,399 |
Tanabe Seiyaku Co., Ltd. | 627,000 | 7,364 |
^Hitachi Construction | | |
Machinery Co. | 270,000 | 7,324 |
Shinko Securities Co., Ltd. | 1,341,000 | 7,078 |
Ushio Inc. | 307,500 | 7,043 |
Dai-Nippon Ink & | | |
Chemicals, Inc. | 1,741,000 | 6,934 |
Daicel Chemical | | |
Industries Ltd. | 801,000 | 6,840 |
Shimano, Inc. | 207,100 | 6,795 |
Shimamura Co., Ltd. | 55,000 | 6,742 |
The Nishi-Nippon City | | |
Bank, Ltd. | 1,331,307 | 6,733 |
^Mitsukoshi, Ltd. | 1,129,000 | 6,536 |
Konami Corp. | 255,749 | 6,526 |
Aeon Credit Service | | |
Co. Ltd. | 237,590 | 6,522 |
All Nippon Airways | | |
Co., Ltd. | 1,752,000 | 6,514 |
Uni-Charm Corp. | 113,400 | 6,480 |
^Nippon Sheet Glass | | |
Co., Ltd. | 1,095,000 | 6,471 |
Tosoh Corp. | 1,326,000 | 6,470 |
Onward Kashiyama | | |
Co., Ltd. | 379,000 | 6,359 |
40
Pacific Stock Index Fund
| | | Market |
| | | Value• |
| | Shares | ($000) |
| Benesse Corp. | 174,700 | 6,314 |
| ZEON Corp. | 466,527 | 6,291 |
| Kurita Water Industries Ltd. | 310,100 | 6,281 |
| Tokyo Steel | | |
| Manufacturing Co. | 297,500 | 6,280 |
| Kansai Paint Co., Ltd. | 638,000 | 6,255 |
| ^Yaskawa Electric Corp. | 512,000 | 6,254 |
| Kyowa Hakko Kogyo Co. | 895,000 | 6,213 |
| 77 Bank Ltd. | 792,000 | 6,209 |
| ^Mitsui Engineering & | | |
| Shipbuilding Co., Ltd. | 1,941,000 | 6,165 |
| Sumitomo Rubber | | |
| Industries Ltd. | 432,000 | 6,155 |
| Dai-Nippon Screen | | |
| Manufacturing Co., Ltd. | 587,000 | 6,095 |
| Hakuhodo DY Holdings Inc. | 64,100 | 6,030 |
| Susuken Co., Ltd. | 167,520 | 6,009 |
| Minebea Co., Ltd. | 930,000 | 5,977 |
| *^Sojitz Holdings Corp. | 939,600 | 5,965 |
| Lawson Inc. | 157,800 | 5,964 |
| ^Ito En, Ltd. | 162,200 | 5,954 |
| Denki Kagaku Kogyo K.K. | 1,283,000 | 5,853 |
| Ryohin Keikaku Co., Ltd. | 65,500 | 5,846 |
| Japan Retail Fund | | |
| Investment Corp. | 705 | 5,829 |
| Showa Shell Sekiyu K.K. | 467,300 | 5,773 |
| JAFCO Co., Ltd. | 86,200 | 5,703 |
| Nippon Sanso Corp. | 721,000 | 5,665 |
| Nisshin Seifun Group Inc. | 526,100 | 5,611 |
| Nippon Meat Packers, Inc. | 470,000 | 5,537 |
| Nitori Co., Ltd. | 101,018 | 5,455 |
| ^E*Trade Securities Co., Ltd. | 2,985 | 5,423 |
| Kamigumi Co., Ltd. | 680,000 | 5,414 |
| Toyobo Ltd. | 1,727,000 | 5,396 |
| Aoyama Trading Co., Ltd. | 157,000 | 5,240 |
| NTT Urban | | |
| Development Corp. | 632 | 5,170 |
| NHK Spring Co. | 438,000 | 5,054 |
| Nisshinbo Industries, Inc. | 428,000 | 5,032 |
| FamilyMart Co., Ltd. | 174,100 | 5,031 |
| Santen Pharmaceutical | | |
| Co. Ltd. | 203,000 | 5,000 |
| USS Co., Ltd. | 67,070 | 4,996 |
| ^Toyoda Gosei Co., Ltd. | 179,300 | 4,915 |
| ^Taiyo Yuden Co., Ltd. | 297,000 | 4,856 |
| Keisei Electric Railway | | |
| Co., Ltd. | 707,000 | 4,833 |
| * Elpida Memory Inc. | 106,100 | 4,829 |
| Kikkoman Corp. | 407,000 | 4,785 |
| *^Japan Airlines System Co. | 1,804,000 | 4,775 |
| Nomura Real Estate Office | | |
| Fund, Inc. | 533 | 4,658 |
| Canon Sales Co. Inc. | 207,000 | 4,653 |
| Seino Transportation | | |
| Co., Ltd. | 430,000 | 4,643 |
| ^Ebara Corp. | 807,000 | 4,594 |
| ^Mitsubishi Logistics Corp. | 299,000 | 4,547 |
| ^Sumitomo Bakelite Co. Ltd. | 488,000 | 4,529 |
| ^Oracle Corp. Japan | 88,600 | 4,502 |
| ^Oki Electric Industry | | |
| Co. Ltd. | 1,426,000 | 4,384 |
| Meiji Seika Kaisha Ltd. | 844,000 | 4,379 |
| ^Mabuchi Motor Co. | 77,800 | 4,371 |
| Sanken Electric Co., Ltd. | 292,000 | 4,367 |
| ^Hino Motors, Ltd. | 710,000 | 4,313 |
| Comsys Holdings Corp. | 320,000 | 4,270 |
| Nippon Shokubai Co., Ltd. | 346,000 | 4,226 |
| Alfresa Holdings Corp. | 68,800 | 4,212 |
| ^Skylark Co., Ltd. | 228,300 | 4,152 |
| Meiji Dairies Corp. | 654,000 | 4,142 |
| ^Sapparo Holdings Ltd. | 781,000 | 4,022 |
| Fuji Television Network, Inc. | 1,620 | 4,017 |
| ^Wacoal Corp. | 295,000 | 3,977 |
| Hikari Tsushin, Inc. | 63,900 | 3,937 |
| Obic Co., Ltd. | 19,150 | 3,910 |
| ^Matsui Securities Co., Ltd. | 294,100 | 3,908 |
| ^Index Corp. | 2,916 | 3,899 |
| Sumitomo Osaka Cement | | |
| Co., Ltd. | 1,052,000 | 3,835 |
| Nippon Kayaku Co., Ltd. | 423,000 | 3,766 |
| *^NEC Electronics Corp. | 101,400 | 3,726 |
41
| Pacific Stock Index Fund | | |
| | | |
| | | Market |
| | | Value• |
| | Shares | ($000) |
| Gunze Ltd. | 535,000 | 3,663 |
| Japan Prime Realty | | |
| Investment Corp. | 1,161 | 3,625 |
| Kokuyo Co., Ltd. | 212,800 | 3,608 |
| Komori Corp. | 153,000 | 3,563 |
| Nippon Light Metal Co. | 1,277,000 | 3,543 |
| SFCG Co., Ltd. | 15,520 | 3,542 |
| Autobacs Seven Co., Ltd. | 72,400 | 3,455 |
| Toyo Suisan Kaisha, Ltd. | 227,000 | 3,453 |
| Kinden Corp. | 367,000 | 3,450 |
| Shimachu Co. | 126,536 | 3,431 |
| Nichirei Corp. | 685,000 | 3,371 |
| Kose Corp. | 91,470 | 3,321 |
| House Foods Industry Corp. | 199,100 | 3,309 |
| Glory Ltd. | 164,100 | 3,302 |
| ^Hankyu Department | | |
| Stores, Inc. | 358,000 | 3,264 |
| Asatsu-DK Inc. | 92,300 | 3,241 |
| Sanwa Shutter Corp. | 472,000 | 3,225 |
| Meitec Corp. | 94,500 | 3,211 |
| Matsumotokiyoshi Co., Ltd. | 109,900 | 3,196 |
| Net One Systems Co., Ltd. | 1,440 | 3,144 |
| Itochu Techno-Science Corp. | 75,800 | 3,086 |
| TIS Inc. | 99,700 | 2,969 |
| ^Takara Holdings Inc. | 481,000 | 2,965 |
| ^The Goodwill Group, Inc. | 3,397 | 2,937 |
| Tokyo Broadcasting | | |
| System, Inc. | 104,500 | 2,897 |
| Aderans Co. Ltd. | 97,700 | 2,889 |
| ^Nishimatsu | | |
| Construction Co. | 692,000 | 2,884 |
| Q.P. Corp. | 278,000 | 2,874 |
| Central Glass Co., Ltd. | 469,000 | 2,845 |
| Coca-Cola West Japan | | |
| Co. Ltd. | 113,200 | 2,783 |
| Okumura Corp. | 501,000 | 2,776 |
| Circle K Sunkus Co., Ltd. | 117,500 | 2,773 |
| Yamazaki Baking Co., Ltd. | 304,000 | 2,712 |
| Amano Corp. | 154,700 | 2,682 |
| Hitachi Capital Corp. | 137,000 | 2,673 |
| Rinnai Corp. | 95,900 | 2,638 |
| Katokichi Co., Ltd. | 340,500 | 2,637 |
| Fuji Soft ABC Inc. | 82,600 | 2,572 |
| Uniden Corp. | 164,000 | 2,567 |
| Mitsumi Electric Co., Ltd. | 180,100 | 2,524 |
| Hitachi Cable Ltd. | 464,000 | 2,520 |
| ^eAccess Ltd. | 3,368 | 2,319 |
| Toda Corp. | 527,000 | 2,304 |
| Tokyo Style Co. | 167,000 | 2,038 |
| ^Kaken Pharmaceutical Co. | 224,000 | 1,805 |
| ^Hitachi Software | | |
| Engineering Co., Ltd. | 89,300 | 1,745 |
| ^Anritsu Corp. | 263,000 | 1,741 |
* | Ishihara Sangyo Kaisha Ltd. | 802,000 | 1,570 |
| ^Ariake Japan Co., Ltd. | 53,944 | 1,550 |
| ^Takuma Co., Ltd. | 180,000 | 1,520 |
| Nichii Gakkan Co. | 60,840 | 1,459 |
| ^Sanden Corp. | 307,000 | 1,399 |
| | | 8,002,844 |
New Zealand (0.5%) | | |
| ^Telecom Corp. of New | | |
| Zealand Ltd. | 5,366,364 | 19,502 |
| Fletcher Building Ltd. | 1,282,256 | 7,425 |
| Contact Energy Ltd. | 793,766 | 4,018 |
| Sky City Entertainment | | |
| Group Ltd. | 1,151,882 | 3,983 |
| Fisher & Paykel Healthcare | | |
| Corp. Ltd. | 1,326,555 | 3,556 |
| Auckland International | | |
| Airport Ltd. | 2,700,697 | 3,502 |
| Sky Network Television Ltd. | 533,185 | 2,093 |
| Fisher & Paykel Appliances | | |
| Holdings Ltd. | 694,158 | 2,044 |
| ^Kiwi Income Property Trust | 1,935,307 | 1,566 |
| Waste Management | | |
| NZ Ltd. | 277,169 | 1,511 |
* | Tower Ltd. | 788,034 | 1,359 |
| Vector Ltd. | 683,694 | 1,207 |
| The Warehouse Group Ltd. | 375,799 | 925 |
| | | 52,691 |
Singapore (2.6%) | | |
| DBS Group Holdings Ltd. | 3,088,161 | 34,747 |
| United Overseas Bank Ltd. | 3,170,567 | 32,688 |
| Singapore | | |
| Telecommunications Ltd. | 18,356,880 | 31,851 |
| Oversea-Chinese Banking | | |
| Corp., Ltd. | 6,848,068 | 29,481 |
42
Pacific Stock Index Fund
| | | Market |
| | | Value• |
| | Shares | ($000) |
| Keppel Corp., Ltd. | 1,507,750 | 14,622 |
| Singapore Airlines Ltd. | 1,509,362 | 13,567 |
| Singapore Press | | |
| Holdings Ltd. | 4,330,833 | 11,737 |
| Capitaland Ltd. | 3,020,895 | 9,373 |
| City Developments Ltd. | 1,343,412 | 8,608 |
| Singapore Technologies | | |
| Engineering Ltd. | 3,610,407 | 7,120 |
| Fraser & Neave Ltd. | 479,900 | 6,716 |
| Venture Corp. Ltd. | 667,000 | 5,700 |
| Singapore Exchange Ltd. | 2,011,000 | 5,473 |
* | Sembcorp Industries Ltd. | 2,398,393 | 5,463 |
| ComfortDelgro Corp Ltd. | 4,839,586 | 4,934 |
| Ascendas REIT | 2,532,000 | 3,659 |
| CapitaMall Trust | 2,260,148 | 3,419 |
* | Chartered Semiconductor | | |
| Manufacturing Ltd. | 2,759,000 | 3,134 |
* | STATS ChipPAC Ltd. | 3,528,716 | 3,048 |
| Keppel Land Ltd. | 980,000 | 2,936 |
| United Overseas Land Ltd. | 1,415,556 | 2,744 |
| SembCorp Marine Ltd. | 1,402,000 | 2,713 |
| Parkway Holdings Ltd. | 1,595,640 | 2,634 |
| Singapore Post Ltd. | 3,649,800 | 2,614 |
| Jardine Cycle N | | |
| Carriage Ltd. | 318,128 | 2,256 |
| Noble Group Ltd. | 2,605,000 | 2,177 |
| Neptune Orient Lines Ltd. | 1,384,000 | 1,995 |
| Cosco Corp. Singapore Ltd. | 2,128,000 | 1,928 |
| Suntec REIT | 2,320,142 | 1,881 |
| Olam International Ltd. | 1,697,000 | 1,743 |
* | Want Want Holdings Ltd. | 1,053,160 | 1,539 |
| Singapore Land Ltd. | 334,000 | 1,459 |
| Wing Tai Holdings Ltd. | 1,279,000 | 1,420 |
* | Allgreen Properties Ltd. | 1,319,000 | 1,252 |
| Singapore Petroleum | | |
| Co. Ltd. | 343,000 | 1,249 |
| SMRT Corp. Ltd. | 1,648,000 | 1,179 |
| Haw Par Brothers | | |
| International Ltd. | 277,193 | 1,088 |
| Creative Technology Ltd. | 146,900 | 957 |
| Overseas Union | | |
| Enterprise Ltd. | 145,000 | 850 |
* Datacraft Asia Ltd. | 645,000 | 761 |
* K-REIT Asia | 192,600 | 181 |
| | 272,896 |
Total Common Stocks | | |
(Cost $7,900,595) | | 10,544,550 |
Temporary Cash Investments (3.1%)1 | |
Money Market Fund (3.1%) | | |
2 Vanguard Market Liquidity | | |
Fund, 4.771% | 10,304,508 | 10,305 |
2 Vanguard Market Liquidity | | |
Fund, 4.771%—Note E | 315,627,973 | 315,628 |
| | 325,933 |
| Face | |
| Amount | |
| ($000) | |
U.S. Agency Obligation (0.0%) | | |
3 Federal National Mortgage Assn. | |
4 4.847%, 7/5/06 | 1,000 | 991 |
Total Temporary Cash Investments | |
(Cost $326,924) | | 326,924 |
Total Investments (102.6%) | | |
(Cost $8,227,519) | | 10,871,474 |
Other Assets and Liabilities (–2.6%) | |
Other Assets—Note B | | 89,646 |
Security Lending Collateral Payable | |
to Brokers—Note E | | (315,628) |
Other Liabilities | | (54,026) |
| | (280,008) |
Net Assets (100%) | | 10,591,466 |
At April 30, 2006, net assets consisted of:5 |
| Amount |
| ($000) |
Paid-in Capital | 8,099,285 |
Undistributed Net Investment Income | 19,740 |
Accumulated Net Realized Losses | (173,508) |
Unrealized Appreciation | |
Investment Securities | 2,643,955 |
Futures Contracts | 1,046 |
Foreign Currencies and | |
Forward Currency Contracts | 948 |
Net Assets | 10,591,466 |
43
Pacific Stock Index Fund | |
| |
| |
| |
| |
| |
| Amount |
| ($000) |
Investor Shares—Net Assets | |
Applicable to 586,010,079 outstanding | |
$.001 par value shares of beneficial | |
interest (unlimited authorization) | 7,371,413 |
Net Asset Value Per Share— | |
Investor Shares | $12.58 |
| |
Admiral Shares—Net Assets | |
Applicable to 13,691,802 outstanding | |
$.001 par value shares of beneficial | |
interest (unlimited authorization) | 1,127,634 |
Net Asset Value Per Share— | |
Admiral Shares | $82.36 |
| |
Institutional Shares—Net Assets | |
Applicable to 122,973,799 outstanding | |
$.001 par value shares of beneficial | |
interest (unlimited authorization) | 1,549,100 |
Net Asset Value Per Share— | |
Institutional Shares | $12.60 |
| |
VIPER Shares—Net Assets | |
Applicable to 8,156,067 outstanding | |
$.001 par value shares of beneficial | |
interest (unlimited authorization) | 543,319 |
Net Asset Value Per Share— | |
VIPER Shares | $66.62 |
• See Note A in Notes to Financial Statements.
* Non-income-producing security.
^ Part of security position is on loan to broker/dealers. See Note E in Notes to Financial Statements.
1 The fund invests a portion of its cash reserves in equity markets through the use of index futures contracts. After giving effect to futures investments, the fund’s effective common stock and temporary cash investment positions represent 99.8% and 2.8%, respectively, of net assets. See Note C in Notes to Financial Statements.
2 Affiliated money market fund available only to Vanguard funds and certain trusts and accounts managed by Vanguard. Rate shown is the 7-day yield.
3 The issuer operates under a congressional charter; its securities are neither issued nor guaranteed by the U.S. government. If needed, access to additional funding from the U.S. Treasury (beyond the issuer’s line of credit) would require congressional action.
4 Securities with a value of $991,000 have been segregated as initial margin for open futures contracts.
5 See Note C in Notes to Financial Statements for the tax-basis components of net assets.
REIT—Real Estate Investment Trust.
44
| Pacific Stock Index Fund |
| |
| |
| |
Statement of Operations | |
| |
| Six Months Ended |
| April 30, 2006 |
| ($000) |
Investment Income | |
Income | |
Dividends1 | 82,600 |
Interest2 | 1,081 |
Security Lending | 1,331 |
Total Income | 85,012 |
Expenses | |
The Vanguard Group—Note B | |
Investment Advisory Services | 65 |
Management and Administrative—Investor Shares | 6,862 |
Management and Administrative—Admiral Shares | 609 |
Management and Administrative—Institutional Shares | 455 |
Management and Administrative—VIPER Shares | 251 |
Marketing and Distribution—Investor Shares | 790 |
Marketing and Distribution—Admiral Shares | 88 |
Marketing and Distribution—Institutional Shares | 203 |
Marketing and Distribution—VIPER Shares | 32 |
Custodian Fees | 1,052 |
Shareholders’ Reports—Investor Shares | 145 |
Shareholders’ Reports—Admiral Shares | 1 |
Shareholders’ Reports—Institutional Shares | — |
Shareholders’ Reports—VIPER Shares | — |
Trustees’ Fees and Expenses | 4 |
Total Expenses | 10,557 |
Net Investment Income | 74,455 |
Realized Net Gain (Loss) | |
Investment Securities Sold | 294,852 |
Futures Contracts | 5,200 |
Foreign Currencies and Forward Currency Contracts | (2,899) |
Realized Net Gain (Loss) | 297,153 |
Change in Unrealized Appreciation (Depreciation) | |
Investment Securities | 1,447,239 |
Futures Contracts | (724) |
Foreign Currencies and Forward Currency Contracts | 2,440 |
Change in Unrealized Appreciation (Depreciation) | 1,448,955 |
Net Increase (Decrease) in Net Assets Resulting from Operations | 1,820,563 |
1 Dividends are net of foreign withholding taxes of $4,459,000.
2 Interest income from an affiliated company of the fund was $1,081,000.
45
Pacific Stock Index Fund | | |
| | |
| | |
| | |
Statement of Changes in Net Assets | | |
| | |
| Six Months Ended | Year Ended |
| Apr. 30, | Oct. 31, |
| 2006 | 2005 |
| ($000) | ($000) |
Increase (Decrease) in Net Assets | | |
Operations | | |
Net Investment Income | 74,455 | 103,943 |
Realized Net Gain (Loss) | 297,153 | 29,015 |
Change in Unrealized Appreciation (Depreciation) | 1,448,955 | 1,048,087 |
Net Increase (Decrease) in Net Assets Resulting from Operations | 1,820,563 | 1,181,045 |
Distributions | | |
Net Investment Income | | |
Investor Shares | (82,959) | (64,623) |
Admiral Shares | (13,155) | (5,924) |
Institutional Shares | (22,834) | (15,898) |
VIPER Shares | (4,454) | — |
Realized Capital Gain | | |
Investor Shares | — | — |
Admiral Shares | — | — |
Institutional Shares | — | — |
VIPER Shares | — | — |
Total Distributions | (123,402) | (86,445) |
Capital Share Transactions—Note F | | |
Investor Shares | 983,920 | 924,751 |
Admiral Shares | 231,867 | 308,400 |
Institutional Shares | (1,095) | 346,732 |
VIPER Shares | 313,796 | 151,932 |
Net Increase (Decrease) from Capital Share Transactions | 1,528,488 | 1,731,815 |
Total Increase (Decrease) | 3,225,649 | 2,826,415 |
Net Assets | | |
Beginning of Period | 7,365,817 | 4,539,402 |
End of Period1 | 10,591,466 | 7,365,817 |
1 | Net Assets—End of Period includes undistributed net investment income of $19,740,000 and $68,664,000. |
46
| | | | | Pacific Stock Index Fund |
| | | | | | | |
| | | | | | | |
| | | | | | | |
Financial Highlights | | | | | | |
| | | | | | | |
Investor Shares | | | | | | | |
| | | | | | | |
| Six Months | | | | | | |
| Ended | | | Jan. 1 to | Year Ended |
For a Share Outstanding | Apr. 30, | Year Ended October 31, | Oct. 31, | Dec. 31, |
Throughout Each Period | 2006 | 2005 | 2004 | 2003 | 2002 | 20011 | 2000 |
Net Asset Value, | | | | | | | |
Beginning of Period | $10.39 | $8.63 | $7.80 | $5.90 | $6.79 | $8.95 | $12.22 |
Investment Operations | | | | | | | |
Net Investment Income | .09 | .156 | .121 | .082 | .065 | .07 | .077 |
Net Realized and Unrealized | | | | | | | |
Gain (Loss) on Investments | 2.26 | 1.761 | .814 | 1.885 | (.923) | (2.23) | (3.222) |
Total from Investment | | | | | | | |
Operations | 2.35 | 1.917 | .935 | 1.967 | (.858) | (2.16) | (3.145) |
Distributions | | | | | | | |
Dividends from Net | | | | | | | |
Investment Income | (.16) | (.157) | (.105) | (.067) | (.032) | — | (.125) |
Distributions from | | | | | | | |
Realized Capital Gains | — | — | — | — | — | — | — |
Total Distributions | (.16) | (.157) | (.105) | (.067) | (.032) | — | (.125) |
Net Asset Value, | | | | | | | |
End of Period | $12.58 | $10.39 | $8.63 | $7.80 | $5.90 | $6.79 | $8.95 |
| | | | | | | |
Total Return2 | 22.78% | 22.48% | 12.15% | 33.75% | –12.67% | –24.13% | –25.74% |
| | | | | | | |
Ratios/Supplemental Data | | | | | | | |
Net Assets, | | | | | | | |
End of Period (Millions) | $7,371 | $5,202 | $3,471 | $2,265 | $1,386 | $1,389 | $1,823 |
Ratio of Total Expenses to | | | | | | | |
Average Net Assets | 0.27%3 | 0.32% | 0.34% | 0.39% | 0.40% | 0.37%3 | 0.38% |
Ratio of Net Investment | | | | | | | |
Income to Average Net Assets | 1.64%3 | 1.76% | 1.57% | 1.49% | 1.04% | 1.06%3 | 0.68% |
Portfolio Turnover Rate4 | 0%3 | 7% | 3% | 3% | 20% | 2% | 6% |
1 The fund’s fiscal year-end changed from December 31 to October 31, effective October 31, 2001.
2 Total returns do not reflect the 0.5% transaction fee on purchases through March 31, 2000; the 2% fee assessed on redemptions of shares purchased on or after June 27, 2003, and held for less than two months; or the $10 annual account maintenance fee applied on balances under $10,000.
3 Annualized.
4 Excludes the value of portfolio securities received or delivered as a result of in-kind purchases or redemptions of the fund’s capital shares, including VIPER Creation Units.
47
Pacific Stock Index Fund | | | | | | |
| | | | | | |
Admiral Shares | | | | | | |
| | | | | | |
| Six Months | | | | | |
| Ended | | | Aug. 131 to |
For a Share Outstanding | Apr. 30, | Year Ended October 31, | Oct. 31, |
Throughout Each Period | 2006 | 2005 | 2004 | 2003 | 2002 | 20012 |
Net Asset Value, Beginning of Period | $68.05 | $56.47 | $51.05 | $38.63 | $44.40 | $50.00 |
Investment Operations | | | | | | |
Net Investment Income | .608 | 1.069 | .835 | .575 | .461 | .20 |
Net Realized and Unrealized Gain | | | | | | |
(Loss) on Investments | 14.809 | 11.583 | 5.318 | 12.318 | (6.016) | (5.80) |
Total from Investment Operations | 15.417 | 12.652 | 6.153 | 12.893 | (5.555) | (5.60) |
Distributions | | | | | | |
Dividends from Net Investment Income | (1.107) | (1.072) | (.733) | (.473) | (.215) | — |
Distributions from | | | | | | |
Realized Capital Gains | — | — | — | — | — | — |
Total Distributions | (1.107) | (1.072) | (.733) | (.473) | (.215) | — |
Net Asset Value, End of Period | $82.36 | $68.05 | $56.47 | $51.05 | $38.63 | $44.40 |
| | | | | | |
Total Return3 | 22.83% | 22.68% | 12.23% | 33.82% | –12.55% | –11.20% |
| | | | | | |
Ratios/Supplemental Data | | | | | | |
Net Assets, End of Period (Millions) | $1,128 | $720 | $314 | $198 | $102 | $80 |
Ratio of Total Expenses to | | | | | | |
Average Net Assets | 0.17%4 | 0.20% | 0.25% | 0.30% | 0.30% | 0.32%4 |
Ratio of Net Investment Income to | | | | | | |
Average Net Assets | 1.74%4 | 1.90% | 1.69% | 1.59% | 1.16% | 2.05%4 |
Portfolio Turnover Rate5 | 0%4 | 7% | 3% | 3% | 20% | 2% |
1 Inception.
2 The fund’s fiscal year-end changed from December 31 to October 31, effective October 31, 2001.
3 Total returns do not reflect the 2% fee assessed on redemptions of shares purchased on or after June 27, 2003, and held for less than two months.
4 Annualized.
5 Excludes the value of portfolio securities received or delivered as a result of in-kind purchases or redemptions of the fund’s capital shares, including VIPER Creation Units.
48
| | | | | | Pacific Stock Index Fund |
| | | | | | | |
| | | | | | | |
Institutional Shares | | | | | | | |
| | | | | | | |
| Six Months | | | | | | |
| Ended | | | Jan. 1 to | May 152 to |
For a Share Outstanding | Apr. 30, | Year Ended October 31, | Oct. 31, | Dec. 31, |
Throughout Each Period | 2006 | 2005 | 2004 | 2003 | 2002 | 20011 | 2000 |
Net Asset Value, | | | | | | | |
Beginning of Period | $10.41 | $8.64 | $7.81 | $5.91 | $6.79 | $8.95 | $11.10 |
Investment Operations | | | | | | | |
Net Investment Income | .106 | .18 | .134 | .090 | .081 | .08 | .052 |
Net Realized and Unrealized | | | | | | | |
Gain (Loss) on Investments | 2.260 | 1.76 | .814 | 1.885 | (.923) | (2.24) | (2.071) |
Total from Investment | | | | | | | |
Operations | 2.366 | 1.94 | .948 | 1.975 | (.842) | (2.16) | (2.019) |
Distributions | | | | | | | |
Dividends from Net | | | | | | | |
Investment Income | (.176) | (.17) | (.118) | (.075) | (.038) | — | (.131) |
Distributions from | | | | | | | |
Realized Capital Gains | — | — | — | — | — | — | — |
Total Distributions | (.176) | (.17) | (.118) | (.075) | (.038) | — | (.131) |
Net Asset Value, | | | | | | | |
End of Period | $12.60 | $10.41 | $8.64 | $7.81 | $5.91 | $6.79 | $8.95 |
| | | | | | | |
Total Return3 | 22.91% | 22.74% | 12.32% | 33.88% | –12.44% | –24.13% | –18.19% |
| | | | | | | |
Ratios/Supplemental Data | | | | | | | |
Net Assets, | | | | | | | |
End of Period (Millions) | $1,549 | $1,280 | $754 | $369 | $131 | $90 | $102 |
Ratio of Total Expenses to | | | | | | | |
Average Net Assets | 0.12%4 | 0.14% | 0.17% | 0.22% | 0.25% | 0.29%4 | 0.29%4 |
Ratio of Net Investment | | | | | | | |
Income to Average Net Assets | 1.79%4 | 1.95% | 1.76% | 1.70% | 1.20% | 1.18%4 | 0.79%4 |
Portfolio Turnover Rate5 | 0%4 | 7% | 3% | 3% | 20% | 2% | 6% |
1 The fund’s fiscal year-end changed from December 31 to October 31, effective October 31, 2001.
2 Inception.
3 Total returns do not reflect the 2% fee assessed on redemptions of shares purchased on or after June 27, 2003, and held for less than two months.
4 Annualized.
5 Excludes the value of portfolio securities received or delivered as a result of in-kind purchases or redemptions of the fund’s capital shares, including VIPER Creation Units.
49
Pacific Stock Index Fund | | |
| | |
VIPER Shares | | |
| Six Months | |
| Ended | March 41 |
| Apr. 30, | to Oct. 31, |
For a Share Outstanding Throughout Each Period | 2006 | 2005 |
Net Asset Value, Beginning of Period | $55.09 | $50.71 |
Investment Operations | | |
Net Investment Income | .49 | .75 |
Net Realized and Unrealized Gain (Loss) | | |
on Investments | 11.97 | 3.63 |
Total from Investment Operations | 12.46 | 4.38 |
Distributions | | |
Dividends from Net Investment Income | (.93) | — |
Distributions from Realized Capital Gains | — | — |
Total Distributions | (.93) | — |
Net Asset Value, End of Period | $66.62 | $55.09 |
| | |
Total Return | 22.82% | 8.64% |
| | |
Ratios/Supplemental Data | | |
Net Assets, End of Period (Millions) | $543 | $164 |
Ratio of Total Expenses to Average Net Assets | 0.18%2 | 0.18%2 |
Ratio of Net Investment Income to Average Net Assets | 1.73%2 | 1.89%2 |
Portfolio Turnover Rate3 | 0%2 | 7% |
1 Inception.
2 Annualized.
3 Excludes the value of portfolio securities received or delivered as a result of in-kind purchases or redemptions of the fund’s capital shares, including VIPER Creation Units.
See accompanying Notes, which are an integral part of the Financial Statements.
50
Pacific Stock Index Fund
Notes to Financial Statements
Vanguard Pacific Stock Index Fund is registered under the Investment Company Act of 1940 as an open-end investment company, or mutual fund. The fund files reports with the SEC under the company name Vanguard International Equity Index Funds. The fund invests in securities of foreign issuers, which may subject it to investment risks not normally associated with investing in securities of U.S. corporations. The fund offers four classes of shares: Investor Shares, Admiral Shares, Institutional Shares, and VIPER Shares. Investor Shares are available to any investor who meets the fund’s minimum purchase requirements. Admiral Shares are designed for investors who meet certain administrative, servicing, tenure, and account-size criteria. Institutional Shares are designed for investors who meet certain administrative and servicing criteria and invest a minimum of $5 million. VIPER Shares are listed for trading on the American Stock Exchange; they can be purchased and sold through a broker.
A. The following significant accounting policies conform to generally accepted accounting principles for U.S. mutual funds. The fund consistently follows such policies in preparing its financial statements.
1. Security Valuation: Securities are valued as of the close of trading on the New York Stock Exchange (generally 4:00 p.m., Eastern time) on the valuation date. Equity securities are valued at the latest quoted sales prices or official closing prices taken from the primary market in which each security trades; such securities not traded on the valuation date are valued at the mean of the latest quoted bid and asked prices. Securities for which market quotations are not readily available, or whose values have been affected by events occurring before the fund’s pricing time but after the close of the securities’ primary markets, are valued at their fair values calculated according to procedures adopted by the board of trustees. These procedures include obtaining quotations from an independent pricing service, monitoring news to identify significant market- or security-specific events, and evaluating changes in the values of foreign market proxies (for example, ADRs, futures contracts, or exchange-traded funds), between the time the foreign markets close and the fund’s pricing time. When fair-value pricing is employed, the prices of securities used by a fund to calculate its net asset value may differ from quoted or published prices for the same securities. Investments in Vanguard Market Liquidity Fund are valued at that fund’s net asset value. Temporary cash investments acquired over 60 days to maturity are valued using the latest bid prices or using valuations based on a matrix system (which considers such factors as security prices, yields, maturities, and ratings), both as furnished by independent pricing services. Other temporary cash investments are valued at amortized cost, which approximates market value.
2. Foreign Currency: Securities and other assets and liabilities denominated in foreign currencies are translated into U.S. dollars at the exchange rates on the valuation date as employed by Morgan Stanley Capital International (MSCI) in the calculation of its indexes. As part of the fund’s fair-value procedures, exchange rates may be adjusted if they change significantly before the fund’s pricing time but after the time at which the MSCI rates are determined (generally 11:00 a.m., Eastern time).
Realized gains (losses) and unrealized appreciation (depreciation) on investment securities include the effects of changes in exchange rates since the securities were purchased, combined with the effects of changes in security prices. Fluctuations in the value of other assets and liabilities resulting from changes in exchange rates are recorded as unrealized foreign currency gains (losses) until the asset or liability is settled in cash, when they are recorded as realized foreign currency gains (losses).
51
Pacific Stock Index Fund
3. Futures and Forward Currency Contracts: The fund uses index futures contracts to a limited extent, with the objectives of maintaining full exposure to the stock market, enhancing returns, maintaining liquidity, and minimizing transaction costs. The fund may purchase futures contracts to immediately invest incoming cash in the market, or sell futures in response to cash outflows, thereby simulating a fully invested position in the underlying index while maintaining a cash balance for liquidity. The fund may seek to enhance returns by using futures contracts instead of the underlying securities when futures are believed to be priced more attractively than the underlying securities. The primary risks associated with the use of futures contracts are imperfect correlation between changes in market values of stocks held by the fund and the prices of futures contracts, and the possibility of an illiquid market.
The fund may also enter into forward currency contracts to provide the appropriate currency exposure related to any open futures contracts. The fund’s risks in using these contracts include movement in the values of the foreign currencies relative to the U.S. dollar and the ability of the counterparties to fulfill their obligations under the contracts.
Futures and forward currency contracts are valued at their quoted daily settlement prices. The aggregate principal amounts of the contracts are not recorded in the financial statements. Fluctuations in the value of the contracts are recorded in the Statement of Net Assets as an asset (liability) and in the Statement of Operations as unrealized appreciation (depreciation) until the contracts are closed, when they are recorded as realized gains (losses) on futures or forward currency contracts.
4. Federal Income Taxes: The fund intends to continue to qualify as a regulated investment company and distribute all of its taxable income. Accordingly, no provision for federal income taxes is required in the financial statements.
5. Distributions: Distributions to shareholders are recorded on the ex-dividend date.
6. Security Lending: The fund may lend its securities to qualified institutional borrowers to earn additional income. Security loans are required to be secured at all times by collateral at least equal to the market value of securities loaned. The fund invests cash collateral received in Vanguard Market Liquidity Fund, and records a liability for the return of the collateral, during the period the securities are on loan. Security lending income represents the income earned on investing cash collateral, less expenses associated with the loan.
7. Other: Dividend income is recorded on the ex-dividend date. Interest income includes income distributions received from Vanguard Market Liquidity Fund and is accrued daily. Security transactions are accounted for on the date securities are bought or sold. Costs used to determine realized gains (losses) on the sale of investment securities are those of the specific securities sold. Fees assessed on capital share transactions are credited to paid-in capital.
Each class of shares has equal rights as to assets and earnings, except that each class separately bears certain class-specific expenses related to maintenance of shareholder accounts (included in Management and Administrative expenses) and shareholder reporting. Marketing and distribution expenses are allocated to each class of shares based on a method approved by the board of trustees. Income, other non-class-specific expenses, and gains and losses on investments are allocated to each class of shares based on its relative net assets.
52
Pacific Stock Index Fund
B. The Vanguard Group furnishes at cost investment advisory, corporate management, administrative, marketing, and distribution services. The costs of such services are allocated to the fund under methods approved by the board of trustees. The fund has committed to provide up to 0.40% of its net assets in capital contributions to Vanguard. At April 30, 2006, the fund had contributed capital of $1,081,000 to Vanguard (included in Other Assets), representing 0.01% of the fund’s net assets and 1.08% of Vanguard’s capitalization. The fund’s trustees and officers are also directors and officers of Vanguard.
C. Distributions are determined on a tax basis and may differ from net investment income and realized capital gains for financial reporting purposes. Differences may be permanent or temporary. Permanent differences are reclassified among capital accounts in the financial statements to reflect their tax character. Temporary differences arise when certain items of income, expense, gain, or loss are recognized in different periods for financial statement and tax purposes; these differences will reverse at some time in the future. Differences in classification may also result from the treatment of short-term gains as ordinary income for tax purposes.
During the six months ended April 30, 2006, the fund realized net foreign currency losses of $1,203,000, which decreased distributable net income for tax purposes; accordingly, such losses have been reclassified from accumulated net realized losses to undistributed net investment income.
During the six months ended April 30, 2006, the fund realized $322,401,000 of net capital gains resulting from in-kind redemptions—in which shareholders exchanged fund shares for securities held by the fund rather than for cash. Because such gains are not taxable to the fund, and are not distributed to shareholders, they have been reclassified from accumulated net realized losses to paid-in capital.
Certain of the fund’s investments are in securities considered to be “passive foreign investment companies,” for which any unrealized appreciation and/or realized gains are required to be included in distributable net income for tax purposes. During the six months ended April 30, 2006, the fund realized gains on the sale of passive foreign investment companies of $1,226,000, which have been included in current and prior periods’ taxable income; accordingly, such gains have been reclassified from accumulated net realized losses to undistributed net investment income. Unrealized appreciation through October 31, 2005, on the fund’s passive foreign investment company holdings at April 30, 2006, was $30,760,000, of which $31,751,000 has been distributed and is reflected in the balance of undistributed net investment income.
The fund’s tax-basis capital gains and losses are determined only at the end of each fiscal year. For tax purposes, at October 31, 2005, the fund had available realized losses of $149,179,000 to offset future net capital gains of $43,066,000 through October 31, 2006, $32,982,000 through October 31, 2009, $68,660,000 through October 31, 2010, and $4,471,000 through October 31, 2011. The fund will use these capital losses to offset net taxable capital gains, if any, realized during the year ending October 31, 2006; should the fund realize net capital losses for the year, the losses will be added to the loss carryforward balances above.
At April 30, 2006, net unrealized appreciation of investment securities for tax purposes was $2,613,195,000, consisting of unrealized gains of $2,770,644,000 on securities that had risen in value since their purchase and $157,449,000 in unrealized losses on securities that had fallen in value since their purchase.
53
Pacific Stock Index Fund
At April 30, 2006, the aggregate settlement value of open futures contracts expiring in June 2006 and the related unrealized appreciation (depreciation) were:
| | | ($000) |
| | Aggregate | Unrealized |
| Number of | Settlement | Appreciation |
Futures Contracts | Long Contracts | Value | (Depreciation) |
Topix Index | 215 | 32,583 | 1,046 |
The fund had net unrealized foreign currency gains of $948,000 resulting from the translation of other assets and liabilities at April 30, 2006.
D. During the six months ended April 30, 2006, the fund purchased $2,071,049,000 of investment securities and sold $590,551,000 of investment securities, other than temporary cash investments.
E. The market value of securities on loan to broker/dealers at April 30, 2006, was $298,829,000, for which the fund received cash collateral of $315,628,000.
F. Capital share transactions for each class of shares were:
| Six Months Ended | | Year Ended | |
| April 30, 2006 | | October 31, 2005 | |
| Amount | Shares | | Amount | Shares |
| ($000) | (000) | | ($000) | (000) |
Investor Shares | | | | | |
Issued | 1,303,315 | 112,962 | | 1,435,956 | 152,938 |
Issued in Lieu of Cash Distributions | 80,759 | 7,090 | | 62,114 | 6,841 |
Redeemed1 | (400,154) | (34,666) | | (573,319) | (61,578) |
Net Increase (Decrease)—Investor Shares | 983,920 | 85,386 | | 924,751 | 98,201 |
Admiral Shares | | | | | |
Issued | 332,938 | 4,443 | | 388,834 | 6,334 |
Issued in Lieu of Cash Distributions | 11,005 | 148 | | 4,887 | 82 |
Redeemed1 | (112,076) | (1,480) | | (85,321) | (1,400) |
Net Increase (Decrease)—Admiral Shares | 231,867 | 3,111 | | 308,400 | 5,016 |
Institutional Shares | | | | | |
Issued | 676,717 | 58,152 | | 599,011 | 63,303 |
Issued in Lieu of Cash Distributions | 20,167 | 1,769 | | 14,257 | 1,568 |
Redeemed1 | (697,979) | (59,844) | | (266,536) | (29,206) |
Net Increase (Decrease)—Institutional Shares | (1,095) | 77 | | 346,732 | 35,665 |
VIPER Shares | | | | | |
Issued | 313,796 | 5,178 | | 151,932 | 2,978 |
Issued in Lieu of Cash Distributions | — | — | | — | — |
Redeemed | — | — | | — | — |
Net Increase (Decrease)—VIPER Shares | 313,796 | 5,178 | | 151,932 | 2,978 |
1 Net of redemption fees of $202,000 and $78,000 (fund totals).
54
Emerging Markets Stock Index Fund
Fund Profile
As of April 30, 2006
Portfolio Characteristics | | |
| | Target | Broad |
| Fund | Index1 | Index2 |
Number of Stocks | 751 | 669 | 2,045 |
Turnover Rate | 4%3 | — | — |
Expense Ratio | | | |
Investor Shares | 0.43%3 | | |
Institutional Shares | 0.25%3 | | |
VIPER Shares | 0.30%3 | | |
Short-Term Reserves | 0% | — | — |
Sector Diversification (% of portfolio) | | |
| | Target | Broad | |
| Fund | Index1 | Index2 | |
Consumer Discretionary | 7% | 7% | 11% | |
Consumer Staples | 6 | 6 | 7 | |
Energy | 11 | 11 | 10 | |
Financials | 21 | 21 | 28 | |
Health Care | 3 | 3 | 7 | |
Industrials | 7 | 7 | 10 | |
Information Technology | 18 | 18 | 7 | |
Materials | 14 | 13 | 9 | |
Telecommunication Services | 10 | 11 | 6 | |
Utilities | 3 | 3 | 5 | |
Volatility Measures | | | |
| | Target | | Broad |
| Fund | Index1 | Fund | Index2 |
R-Squared | 1.00 | 1.00 | 0.81 | 1.00 |
Beta | 0.99 | 1.00 | 1.43 | 1.00 |
Ten Largest Holdings4 (% of total net assets) |
| | |
Samsung | | |
Electronics Co., Ltd. | semiconductors | 4.0% |
Petroleo Brasileiro SA | integrated oil and gas | 3.2 |
Taiwan Semiconductor | | |
Manufacturing Co., Ltd. | semiconductors | 2.1 |
America Movil SA de CV | wireless | |
| telecommunication | |
| services | 1.6 |
China Mobile (Hong | wireless | |
Kong) Ltd. | telecommunication | |
| services | 1.6 |
Teva Pharmaceutical | | |
Industries Ltd. | pharmaceuticals | 1.6 |
Kookmin Bank | diversified banks | 1.5 |
Sasol Ltd. | oil and gas exploration | |
| and production | 1.4 |
Hon Hai Precision | electronic | |
Industry Co., Ltd. | manufacturing services | 1.2 |
Cemex SA CPO | construction | |
| materials | 1.2 |
Top Ten | | 19.4% |
Country Diversification (% of portfolio) | |
| | Target |
| Fund | Index1 |
South Korea | 20% | 20% |
Taiwan | 15 | 16 |
Brazil | 13 | 13 |
South Africa | 11 | 11 |
China | 9 | 9 |
India | 7 | 7 |
Mexico | 7 | 7 |
Israel | 3 | 3 |
Turkey | 2 | 2 |
Poland | 2 | 2 |
Thailand | 2 | 2 |
Indonesia | 2 | 2 |
Chile | 2 | 2 |
Hungary | 1 | 1 |
Czech Republic | 1 | 1 |
Argentina | 1 | 1 |
Peru | 1 | 1 |
Philippines | 1 | 0 |
1 Select Emerging Markets Index.
2 MSCI All Country World Index ex USA.
3 Annualized.
4 “Ten Largest Holdings” excludes any temporary cash investments and equity index products. See page 108 for a glossary of investment terms.
55
Emerging Markets Stock Index Fund
Performance Summary
All of the returns in this report represent past performance, which is not a guarantee of future results that may be achieved by the fund. (Current performance may be lower or higher than the performance data cited. For performance data current to the most recent month-end, visit our website at www.vanguard.com.) Note, too, that both investment returns and principal value can fluctuate widely, so an investor’s shares, when sold, could be worth more or less than their original cost. The returns shown do not reflect taxes that a shareholder would pay on fund distributions or on the sale of fund shares.
Fiscal-Year Total Returns (%): October 31, 1995–April 30, 2006
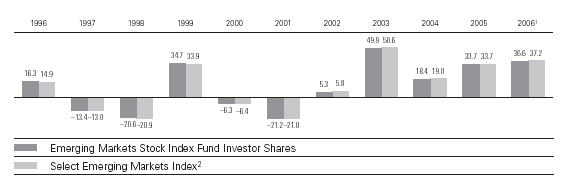
Average Annual Total Returns: Periods Ended March 31, 2006
This table presents average annual total returns through the latest calendar quarter—rather than through the end of the fiscal period. Securities and Exchange Commission rules require that we provide this information.
| Inception Date | One Year | Five Years | Ten Years |
Emerging Markets Stock Index Fund | | | | |
Investor Shares3 | 5/4/1994 | 44.80% | 23.49% | 8.21% |
Fee-Adjusted Returns4 | | 43.37 | 23.26 | 8.11 |
Institutional Shares | 6/22/2000 | 45.01 | 23.69 | 14.165 |
Fee-Adjusted Returns4 | | 43.58 | 23.46 | 13.985 |
VIPER Shares | 3/4/2005 | | | — |
Market Price | | 44.99 | 32.705 | — |
Net Asset Value | | 44.91 | 32.495 | — |
1 Six months ended April 30, 2006.
2 Consists of 18 emerging markets in Europe, Asia, Africa, and Latin America. Through April 30, 2003, this index included a cash component (5%) based on the Lipper Money Market Average. The index is administered exclusively for Vanguard by MSCI.
3 Total return figures do not reflect the $10 annual account maintenance fee applied on balances under $10,000.
4 Performance figures are adjusted for the 0.5% transaction fee on purchases and redemptions.
5 Return since inception.
Note: See Financial Highlights tables on pages 74 through 76 for dividend and capital gains information.
56
Emerging Markets Stock Index Fund
Financial Statements (unaudited)
Statement of Net Assets
As of April 30, 2006
The fund provides a complete list of its holdings four times in each fiscal year, at the quarter-ends. For the second and fourth fiscal quarters, the lists appear in the fund’s semiannual and annual reports to shareholders. For the first and third fiscal quarters, the fund files the lists with the Securities and Exchange Commission on Form N-Q. Shareholders can look up the fund’s Forms N-Q on the SEC’s website at www.sec.gov. Forms N-Q may also be reviewed and copied at the SEC’s Public Reference Room (see the back cover of this report for further information).
| | | Market |
| | | Value• |
| | Shares | ($000) |
Common Stocks (99.6%)1 | | |
Argentina (0.8%) | | |
| Tenaris SA ADR | 604,530 | 27,748 |
| Tenaris SA | 1,081,161 | 24,634 |
| Tenaris SA (Mexico) | 450,275 | 10,364 |
* | Telecom Argentina | | |
| STET-France Telecom SA | 1,507,786 | 3,839 |
* | Petrobras Energia | | |
| Participaciones SA | 3,164,909 | 3,660 |
*^Petrobras Energia | | |
| Participaciones SA ADR | 248,945 | 2,930 |
| Siderar SA Class A | 327,467 | 2,840 |
* | Telecom Argentina SA ADR | 186,940 | 2,421 |
*^ Cresud SA ADR | 95,955 | 1,667 |
* | IRSA Inversiones y | | |
| Representaciones SA GDR | 109,411 | 1,456 |
* | BBVA Banco Frances SA | 424,248 | 1,225 |
* | Transportadora de Gas | | |
| Sur SA | 953,920 | 975 |
*^ BBVA Banco Frances | | |
| SA ADR | 111,400 | 964 |
* | Irsa Inversiones y | | |
| Representaciones SA | 563,918 | 741 |
*^ Transportadora de Gas del | | |
| SA ADR | 120,600 | 609 |
* | Molinos Rio de la Plata SA | 406,396 | 601 |
| Solvay Indupa S.A.I.C. | 471,738 | 564 |
| Cresud SA | 209,663 | 362 |
| | | 87,600 |
Brazil (12.8%) | | | |
| Petroleo Brasileiro SA Pfd. | 8,178,641 | 181,191 |
| Petroleo Brasileiro SA | 5,940,057 | 146,850 |
| Companhia Vale do Rio | | |
| Doce Pfd. Class A | 2,162,782 | 96,284 |
| Banco Bradesco SA | 2,419,144 | 92,185 |
| Companhia Vale do | | |
| Rio Doce | 1,752,671 | 90,305 |
| Banco Itau Holding | | |
| Financeira SA | 2,792,918 | 89,400 |
| Companhia de Bebidas | | |
| das Americas Pfd. | 104,152,242 | 47,911 |
| Unibanco-Uniao de | | |
Bancos Brasileiros SA | 2,799,529 | 44,311 |
Gerdau SA Pfd. | 1,634,472 | 28,293 |
Usiminas-Usinas Siderugicas | |
de Minas Gerais SA Pfd | 662,636 | 25,095 |
Petroleo Brasileiro Series A | | |
ADR | 276,429 | 24,572 |
Tele Norte Leste | | |
Participacoes SA Pfd. | 1,347,995 | 24,559 |
Companhia Siderurgica | | |
Nacional SA | 686,311 | 24,154 |
Companhia Energetica | | |
de Minas Gerais Pfd. | 469,234,661 | 22,326 |
Petroleo Brasileiro ADR | 200,364 | 19,802 |
Centrais Electricas | | |
Brasileiras SA | 666,029,468 | 18,791 |
Empresa Brasileira de | | |
Aeronautica SA Pfd. | 1,860,984 | 17,887 |
Caemi Mineracao e | | |
Metalurgia SA Pfd. | 9,187,643 | 16,827 |
57
Emerging Markets Stock Index Fund |
| | | |
| | | Market |
| | | Value• |
| | Shares | ($000) |
| Centrais Electricas | | |
| Brasileiras SA Pfd. | | |
| B Shares | 528,981,848 | 14,165 |
| Tele Norte Leste | | |
| Participacoes SA | 344,623 | 14,007 |
| Companhia Vale do Rio | | |
| Doce ADR | 292,457 | 13,008 |
| Aracruz Celulose SA Pfd. | | |
| B Shares | 2,338,223 | 12,802 |
| ^Banco Bradesco SA ADR | 329,543 | 12,546 |
| Cia Vale do Rio Doce ADR | 240,421 | 12,386 |
| Tele Celular Sul | | |
| Participacose SA Pfd. | 3,146,220,385 | 12,141 |
* | Vivo Participacoes | | |
| SA Pfd. | 2,925,950 | 11,865 |
| Gol-Linhas Aereas | | |
| Inteligentes SA Pfd. | 301,880 | 11,130 |
| Banco Itau Holding | | |
| Financeira SA ADR | 315,940 | 10,047 |
| Lojas Americanas | | |
| SA Pfd. | 235,277,533 | 9,754 |
| Brasil Telecom | | |
| Participacoes SA Pfd. | 1,163,472,414 | 9,464 |
| Souza Cruz SA | 449,393 | 8,510 |
| Klabin SA | 3,364,356 | 8,478 |
| Natura Cosmeticos SA | 630,125 | 7,997 |
| Votorantim Celulose e | | |
| Papel SA Pfd. | 471,654 | 7,592 |
| Companhia de | | |
| Concessoes Rodoviarias | 831,372 | 7,259 |
| Companhia de Bebidas | | |
| das Americas ADR | 153,795 | 7,121 |
| Companhia de Saneamento | |
| Basico do Estado de | | |
| Sao Pa | 70,859,989 | 6,943 |
| Cyrela Brazil Realty SA | 391,560 | 6,647 |
| Embratel Participacoes | | |
| SA Pfd. | 2,412,316,824 | 6,391 |
| Arcelor Brasil SA | 345,254 | 6,340 |
| Braskem SA | 897,493 | 6,158 |
| Companhia Brasileira de | | |
| Distribuicao Grupo | | |
| Pao de | 146,392,608 | 5,762 |
| Sadia SA Pfd. | 2,098,238 | 5,719 |
| Uniao de Bancos | | |
| Brasileiros SA GDR | 71,932 | 5,708 |
* | Diagnosticos da America | 219,507 | 5,595 |
| Companhia Paranaense | | |
| de Energia-COPEL | 509,069,632 | 5,550 |
| Brasil Telecom | | |
| Participacoes SA | 356,643,808 | 5,321 |
| Weg SA Pfd. | 1,057,674 | 4,299 |
| Banco Nossa Caixa SA | 190,163 | 4,283 |
| Energias do Brasil SA | 293,453 | 4,280 |
| Gerdau SA ADR | 243,510 | 4,213 |
| Duratex SA Pfd. | 195,660 | 4,182 |
| ^Companhia Siderurgica | | |
| Nacional SA ADR | 114,170 | 4,020 |
| Tele Norte Leste | | |
| Participacoes ADR | 189,522 | 3,446 |
| Companhia Energetica | | |
| de Minas Gerais ADR | 68,165 | 3,230 |
* | Electropaulo | | |
| Metropolitana SA | 59,160,209 | 2,943 |
| Embraer-Empresa | | |
| Brasileira de Aeronautica | | |
| SA ADR | 62,650 | 2,433 |
| Telemig Celular | | |
| Participacoes SA Pfd. | 1,021,342,562 | 2,247 |
| Companhia de Tecidos | | |
| Norte de Minas Pfd. | 22,284,668 | 2,184 |
| Companhia de Gas de | | |
| Sao Paulo-Comgas | 13,797,799 | 1,996 |
| Aracruz Celulose SA ADR | 35,962 | 1,981 |
| Tim Participacoes SA ADR | 47,164 | 1,813 |
| Contax Participacoes Pfd. | 1,528,990 | 1,777 |
| Brasil Telecom | | |
| Participacoes ADR | 38,688 | 1,580 |
| Companhia de Saneamento | | |
| Basico do Estado de Sao Pa | 50,945 | 1,241 |
| ^Sadia SA ADR | 39,265 | 1,088 |
* | Companhia Paranaense | | |
| de Energia-COPEL ADR | 98,415 | 1,079 |
* | Embratel Participacoes | | |
| SA ADR | 76,235 | 1,012 |
| Companhia Brasileira de | | |
| Distribuicao Grupo Pao de | 22,986 | 905 |
| ^Telemig Celular | | |
| Participacoes ADR | 13,640 | 595 |
* | Vivo Participacoes SA ADR | 48,057 | 198 |
58
Emerging Markets Stock Index Fund
| Shares | Market
Value•
($000)
|
|---|
|
| Votorantim Celulose e Papel | | |
| SA ADR | 10,110 | 163 |
|
| ^Braskem SA ADR | 10,820 | 154 |
|
| * Companhia de Bebidas das |
| Americas Pfd. Rights | 25,961 | 1 |
|
| | | 1,324,492 |
| Chile (1.7%) |
|
| Empresas Copec SA | 2,688,929 | 25,864 |
|
| Empresa Nacional de |
| Electricidad SA | 16,951,229 | 17,111 |
|
| Empresas CMPC SA | 588,775 | 16,803 |
|
| Enersis SA | 66,944,906 | 16,426 |
|
| S.A.C.I. Falabella, SA | 3,527,724 | 11,641 |
|
| Cencosud SA | 4,350,005 | 11,252 |
|
| Banco Santander |
| Chile SA | 246,713,370 | 10,378 |
|
| Sociedad Quimica y |
| Minera de Chile SA | 592,701 | 6,868 |
|
| CAP SA | 481,392 | 6,775 |
|
| Empresa Nacional de |
| Telecomunicaciones SA | 555,254 | 6,230 |
|
| Compania de |
| Telecomunicaciones |
| de Chile SA | 2,729,800 | 6,094 |
|
| Colburn SA | 30,762,900 | 4,950 |
|
| Lan Airlines SA | 561,592 | 4,262 |
|
| Distribucion y Servicio |
| D&S SA | 13,451,471 | 4,194 |
|
| Compania Cervecerias |
| Unidas SA | 746,070 | 3,680 |
|
| * Inversiones Aguas |
| Metropolitanas SA | 2,657,843 | 3,199 |
|
| * Masisa SA | 16,005,895 | 3,161 |
|
| Vina Concha y Toro SA | 2,091,928 | 2,883 |
|
| Corpbanca | 475,710,795 | 2,587 |
|
| Embotelladora Andina |
| SA Pfd. Class B | 1,011,259 | 2,552 |
|
| Enersis SA ADR | 207,040 | 2,528 |
|
| Empresa Nacional de |
| Electricidad SA ADR | 82,105 | 2,490 |
|
| Embotelladora Andina SA | 884,008 | 2,051 |
|
| * Madeco SA | 16,064,584 | 1,466 |
|
| * Banco Santander Chile |
| SA ADR | 30,408 | 1,328 |
|
| Parque Arauco SA | 1,627,448 | 1,115 |
|
| Sociedad Quimica y Minera |
| de Chile ADR | 8,510 | 989 |
|
| Compania de |
| Telecomunicaciones |
| de Chile SA ADR | 91,120 | 800 |
|
| ^Distribucion y Servicio |
| SA ADR | 34,060 | 633 |
|
| | | 180,310 |
| China (9.2%) |
|
| China Mobile |
| (Hong Kong) Ltd. | 29,172,051 | 168,768 |
|
| PetroChina Co. Ltd. | 112,147,214 | 125,379 |
|
| China Petroleum |
| & Chemical Corp. | 99,103,700 | 63,402 |
|
| * China Construction |
| Bank | 145,967,567 | 63,101 |
|
| CNOOC Ltd. | 73,934,352 | 60,861 |
|
| * China Life Insurance |
| Co., Ltd. | 39,552,240 | 53,262 |
|
| China Telecom Corp. Ltd. | 77,900,312 | 27,238 |
|
| CITIC Pacific Ltd. | 6,484,000 | 23,323 |
|
| China Merchants Holdings |
| International Co. Ltd. | 6,444,000 | 21,998 |
|
| * Bank of Communications |
| Ltd. Class H | 34,117,000 | 20,786 |
|
| Ping An Insurance (Group) |
| Co. of China Ltd. | 6,061,500 | 16,676 |
|
| Cosco Pacific Ltd. | 6,466,504 | 15,401 |
|
| Aluminum Corp. of |
| China Ltd. | 14,571,000 | 14,318 |
|
| * Huaneng Power |
| International, Inc. H Share | 17,988,000 | 13,115 |
|
| China Resources |
| Enterprise Ltd. | 5,877,659 | 12,581 |
|
| China Overseas Land |
| & Investment Ltd. | 18,841,620 | 12,047 |
|
| Denway Motors Ltd. | 28,812,333 | 11,598 |
|
| Yanzhou Coal Mining |
| Co. Ltd. H Shares | 11,540,800 | 9,821 |
|
| Fujian Zijin Mining |
| Industry Co., Ltd. | 17,098,000 | 9,598 |
|
| * Jiangxi Copper Co. Ltd. | 8,209,000 | 8,636 |
|
| Sinopec Shanghai |
| Petrochemical Co. Ltd. | 13,806,000 | 8,103 |
|
59
Emerging Markets Stock Index Fund | |
| | | |
| | | Market |
| | | Value• |
| | Shares | ($000) |
| Lenovo Group Ltd. | 19,900,000 | 7,440 |
| TPV Technology Ltd. | 6,836,000 | 7,409 |
* | Dongfeng Motor Corp. | 14,410,000 | 7,202 |
* | Semiconductor | | |
| Manufacturing | | |
| International Corp. | 43,226,000 | 6,569 |
* | Shanghai Electric Group | | |
| Co., Ltd. Class H | 16,627,584 | 6,424 |
| China Mengniu Dairy | | |
| Co., Ltd. | 5,263,076 | 6,008 |
| Beijing Datang Power | | |
| Generation Co. Ltd. | 8,407,245 | 5,961 |
* | Air China Ltd. | 14,200,353 | 5,904 |
| Guangdong | | |
| Investment Ltd. | 13,982,000 | 5,862 |
| China Shipping | | |
| Development Co. | 7,605,578 | 5,835 |
| Chaoda Modern | | |
| Agriculture Holdings Ltd. | 8,316,382 | 5,789 |
| Shanghai Industrial | | |
| Holding Ltd. | 2,571,231 | 5,537 |
* | Agile Property | | |
| Holdings, Inc. | 7,102,000 | 5,496 |
| PICC Property and | | |
| Casualty Co. Ltd. | 14,268,601 | 5,196 |
| Zhejiang Expressway | | |
| Co., Ltd. | 8,424,000 | 5,110 |
| China Resources Power | | |
| Holdings Co. Ltd. | 6,714,000 | 5,018 |
* | China COSCO Holdings | | |
| Co., Ltd. | 9,268,500 | 4,813 |
* | Angang New Steel | | |
| Co. Ltd. | 5,212,000 | 4,533 |
* | Anhui Conch Cement | | |
| Co. Ltd. | 2,559,050 | 4,408 |
* | Jiangsu Expressway Co. | | |
| Ltd. H Share | 7,275,080 | 4,337 |
| China Resources Land Ltd. | 6,410,000 | 4,333 |
* | China International Marine | | |
| Containers (Group) Co., | 3,169,500 | 4,284 |
| China Travel International | 14,871,578 | 4,171 |
| Global Bio-chem | | |
| Technology Group Co. Ltd. | 7,482,000 | 3,906 |
| Beijing Capital International | | |
| Airport Co., Ltd. | 6,684,000 | 3,875 |
* | China Shipping Container | | |
| Lines Co. Ltd. | 12,145,347 | 3,798 |
| Guangzhou Investment | | |
| Co. Ltd. | 18,996,000 | 3,797 |
| Li Ning Co., Ltd. | 3,352,000 | 3,764 |
| Maanshan Iron and | | |
| Steel Co. Ltd. | 10,350,000 | 3,705 |
* | Weiqiao Textile Co. Ltd. | 2,554,863 | 3,354 |
* | ZTE Corp. | 955,400 | 3,264 |
| The Guangshen Railway | | |
| Co., Ltd. | 8,429,623 | 3,239 |
| Sinotrans Ltd. | 8,996,880 | 3,108 |
| Shanghai Forte Land | | |
| Co., Ltd. | 6,276,000 | 3,053 |
| GOME Electrical Appliances | |
| Holdings Ltd. | 3,450,000 | 2,971 |
| Beijing Enterprises | | |
| Holdings Ltd. | 1,288,000 | 2,827 |
| Brilliance China Automotive | |
| Holdings Ltd. | 14,049,000 | 2,465 |
| Sinopec Yizheng Chemical | | |
| Fibre Co., Ltd. | 8,150,000 | 2,444 |
* | China Everbright Ltd. | 4,110,000 | 2,385 |
| Huadian Power | | |
| International Corp. Ltd. | 8,514,000 | 2,331 |
| Tsingtao Brewery Co., Ltd. | 1,976,000 | 2,280 |
| COFCO International Ltd. | 3,618,332 | 2,228 |
| Travelsky Technology Ltd. | 1,832,000 | 2,173 |
* | Shenzhen Expressway | | |
| Co. Ltd. | 4,344,000 | 2,084 |
| Shenzhen Investment Ltd. | 6,489,000 | 1,923 |
| Guangdong Electric Power | | |
| Development Co., Ltd. | 3,879,157 | 1,855 |
* | BYD Co. Ltd. | 888,576 | 1,795 |
* | China Southern Airlines | | |
| Co. Ltd. | 6,938,208 | 1,781 |
| Weichai Power Co., Ltd. | | |
| Class H | 752,920 | 1,774 |
| Zhejiang Southeast Electric | |
| Power Co., Ltd. | 4,097,991 | 1,676 |
| China Eastern Airlines | | |
| Corp. Ltd. | 9,168,000 | 1,346 |
| TCL International | | |
| Holdings Ltd. | 8,057,000 | 1,192 |
60
Emerging Markets Stock Index Fund
| Shares | Market
Value•
($000) |
|---|
| * China Pharmaceutical | | |
| Group Ltd. | 4,714,000 | 803 |
* AviChina Industry &
Technology Co., Ltd. | 9,086,000 | 750 |
Qingling Motors Co. Ltd.
H Share | 4,083,325 | 658 |
| Digital China Holdings Ltd. | 1,893,100 | 635 |
| | | 966,890 |
| Czech Republic (0.9%) |
Ceske Energeticke
Zavody a.s | 1,224,129 | 41,740 |
| * Cesky Telecom a.s | 663,695 | 14,580 |
| Komercni Banka a.s | 89,661 | 14,208 |
* Central European Media
Enterprises Ltd. | 143,776 | 9,287 |
| Zentiva NV | 135,609 | 7,015 |
| * Unipetrol a.s | 429,932 | 4,953 |
| Philip Morris CR a.s | 4,035 | 2,508 |
| | | 94,291 |
| Hungary (1.4%) |
| OTP Bank Rt | 1,488,250 | 57,555 |
MOL Magyar Olaj-es
Gazipari Rt | 418,065 | 49,646 |
| Richter Gedeon Rt | 82,555 | 17,744 |
| Magyar Tavkozlesi Rt | 2,762,761 | 12,608 |
| BorsodChem Rt | 298,619 | 3,382 |
| Demasz Rt | 8,755 | 688 |
| | | 141,623 |
| India (7.0%) |
| Infosys Technologies Ltd. | 1,199,992 | 83,771 |
| Reliance Industries Ltd. | 3,711,061 | 83,281 |
Housing Development
Finance Corp. Ltd. | 1,030,626 | 29,852 |
| Hindustan Lever Ltd. | 4,551,413 | 29,429 |
| ITC Ltd. | 6,430,381 | 28,780 |
| ICICI Bank Ltd. | 2,232,089 | 28,663 |
* Reliance Communication
Ventures | 3,974,983 | 26,802 |
Oil and Natural Gas
Corp. Ltd. | 926,707 | 26,712 |
| Tata Motors Ltd. | 1,112,285 | 22,968 |
Satyam Computer
Services Ltd. | 1,209,632 | 20,199 |
| ICICI Bank Ltd. ADR | 686,677 | 18,836 |
| Larsen & Toubro Ltd. | 300,828 | 18,073 |
Bharat Heavy
Electricals Ltd. | 345,840 | 18,037 |
| HDFC Bank Ltd. | 968,106 | 17,684 |
Tata Consultancy
Services Ltd. | 374,496 | 16,502 |
| Hindalco Industries Ltd. | 2,871,010 | 13,619 |
| Wipro Ltd. | 1,077,477 | 12,890 |
| Bajaj Auto Ltd. | 179,113 | 11,730 |
| Tata Iron and Steel Co. Ltd. | 784,050 | 11,049 |
| Grasim Industries Ltd. | 211,049 | 11,035 |
| Gail India Ltd. | 1,503,109 | 9,682 |
| Ranbaxy Laboratories Ltd. | 861,914 | 9,059 |
| Hero Honda Motors Ltd. | 473,597 | 8,899 |
| Maruti Udyog Ltd. | 407,882 | 8,348 |
| Mahindra & Mahindra Ltd. | 599,824 | 8,345 |
Dr. Reddy’s
Laboratories Ltd. | 248,830 | 7,986 |
Gujarat Ambuja
Cements Ltd. | 2,946,983 | 7,598 |
| Zee Telefilms Ltd. | 1,196,437 | 7,029 |
| Cipla Ltd. | 1,058,562 | 6,007 |
| I-Flex Solutions Ltd. | 222,795 | 5,875 |
Associated Cement
Cos. Ltd. | 258,540 | 5,480 |
| Bharat Forge Ltd. | 574,773 | 5,448 |
Sun Pharmaceutical
Industries Ltd. | 275,689 | 5,368 |
| UTI Bank Ltd. | 663,198 | 5,087 |
| Indian Hotels Co. Ltd. | 166,728 | 4,979 |
| Reliance Energy Ltd. | 359,049 | 4,869 |
Mahanagar Telephone
Nigam Ltd. | 952,617 | 4,481 |
| State Bank of India | 225,083 | 4,424 |
| ABB (India) Ltd. | 59,720 | 4,113 |
| Nestle India Ltd. | 137,266 | 3,944 |
| Kotak Mahindra Bank | 553,072 | 3,872 |
GlaxoSmithKline
Pharmaceuticals (India) Ltd. | 122,777 | 3,775 |
61
Emerging Markets Stock Index Fund |
| | | |
| | | Market |
| | | Value• |
| | Shares | ($000) |
| Tata Power Co. Ltd. | 291,687 | 3,547 |
| Bharat Petroleum Corp. Ltd. | 354,606 | 3,456 |
| Ultratech Cemco Ltd. | 184,389 | 3,183 |
| Hindustan Petroleum | | |
| Corporation Ltd. | 442,499 | 3,167 |
| Tata Tea Ltd. | 164,546 | 3,060 |
| Jindal Steel & Power Ltd. | 72,677 | 2,986 |
| Bharat Electronics Ltd | 94,555 | 2,799 |
| Matrix Laboratories Ltd. | 434,753 | 2,790 |
| HDFC Bank Ltd. ADR | 46,629 | 2,743 |
| Indian Petrochemicals | | |
| Corp., Ltd. | 456,718 | 2,654 |
| Satyam Computer Services | | |
| Ltd. ADR | 72,393 | 2,605 |
| Videsh Sanchar Nigam Ltd. | 279,174 | 2,583 |
* | Infrastructure Development | | |
| Finance Co., Ltd. | 1,607,859 | 2,572 |
| Asian Paints (India) Ltd. | 172,273 | 2,432 |
| Ashok Leyland Ltd. | 2,095,809 | 2,335 |
| Jet Airways (India) Ltd. | 100,834 | 2,082 |
| Glenmark | | |
| Pharmaceuticals Ltd. | 279,725 | 1,993 |
* | State Bank of India-GDR | 39,000 | 1,987 |
| Colgate-Palmolive (India) Ltd. | 195,686 | 1,895 |
| Bank of Baroda | 382,116 | 1,881 |
| Nicholas Piramal India Ltd. | 301,577 | 1,568 |
| Biocon Ltd. | 137,670 | 1,505 |
| Dr. Reddy’s Laboratories | | |
| Ltd. ADR | 43,393 | 1,406 |
| Arvind Mills Ltd. | 666,971 | 1,350 |
| Britannia Industries Ltd. | 32,609 | 1,252 |
| ^Wipro Ltd. ADR | 86,822 | 1,241 |
| Moser Baer India Ltd. | 222,069 | 1,109 |
| Castrol (India) Ltd. | 177,070 | 899 |
| Mahanagar Telephone | | |
| Nigam Ltd. ADR | 77,191 | 705 |
| Infosys Technologies | | |
| Ltd. ADR | 7,723 | 607 |
| ^Videsh Sanchar Nigam | | |
| Ltd. ADR | 28,398 | 534 |
| | | 729,506 |
Indonesia (1.9%) | | |
| PT Telekomunikasi | | |
| Indonesia Tbk | 59,530,877 | 51,160 |
| PT Astra International | | |
| Tbk | 14,370,540 | 19,500 |
| PT Bank Central | | |
| Asia Tbk | 35,913,260 | 17,881 |
| PT Bank Rakyat | | |
| Indonesia Tbk | 31,371,000 | 16,492 |
| PT Perusahaan Gas | | |
| Negara Tbk | 10,576,967 | 14,906 |
| PT Bumi Resources | | |
| Tbk | 102,947,000 | 10,618 |
| PT Indonesian Satellite | | |
| Corp Tbk | 14,262,263 | 8,781 |
| PT Bank Mandiri Tbk | 35,512,062 | 7,752 |
| PT Bank Danamon Tbk | 9,995,402 | 5,851 |
| PT United Tractors Tbk | 8,475,166 | 5,254 |
| PT Kalbe Farma Tbk | 27,076,696 | 4,679 |
| PT Unilever Indonesia Tbk | 8,971,500 | 4,664 |
| PT Gudang Garam Tbk | 3,367,100 | 4,036 |
| PT Indofood Sukses | | |
| Makmur Tbk | 25,372,952 | 3,257 |
* | PT Indocement Tunggal | | |
| Prakarsa Tbk (Local) | 5,418,000 | 3,085 |
| PT Semen Gresik Tbk | 885,232 | 2,764 |
| PT International Nickel | | |
| Indonesia Tbk | 1,152,000 | 2,619 |
| PT Aneka Tambang Tbk | 3,921,315 | 2,559 |
| PT Bank International | | |
| Indonesia Tbk | 112,387,000 | 2,357 |
| PT Astra Agro Lestari Tbk | 2,371,680 | 1,782 |
* | PT Energi Mega Persada | | |
| Tbk | 17,189,113 | 1,736 |
| PT Bank Indonesia Tbk | 28,195,224 | 1,668 |
| Ramayana Lestari Sentosa | | |
| PT Tbk | 14,355,620 | 1,489 |
| PT Tempo Scan Pacific Tbk | 958,956 | 779 |
| PT Matahari Putra | | |
| Prima Tbk | 6,576,816 | 725 |
| | | 196,394 |
Israel (3.4%) | | |
| Teva Pharmaceutical | | |
| Industries Ltd. | 4,037,017 | 163,187 |
| Bank Hapoalim Ltd. | 5,556,247 | 28,537 |
62
Emerging Markets Stock Index Fund
| | | Market |
| | | Value• |
| | Shares | ($000) |
* | Check Point Software | | |
| Technologies Ltd. | 1,062,079 | 20,551 |
| Bank Leumi Le-Israel | 4,580,468 | 18,302 |
| Israel Chemicals Ltd. | 2,982,546 | 11,804 |
| Makhteshim-Agan | | |
| Industries Ltd. | 1,709,409 | 9,924 |
| Bezeq Israeli | | |
| Telecommunication | | |
| Corp., Ltd. | 6,143,258 | 7,871 |
* | M-Systems Flash Disk | | |
| Pioneers Ltd. | 188,994 | 6,515 |
* | NICE Systems Ltd. | 105,440 | 5,811 |
* | Israel Discount Bank Ltd. | 2,605,410 | 5,492 |
* | United Mizrahi Bank Ltd. | 703,098 | 4,808 |
* | Orbotech Ltd. | 177,584 | 4,512 |
| IDB Development Corp. Ltd. | 133,462 | 4,460 |
| The Israel Corp. Ltd. | 11,176 | 4,163 |
* | Koor Industries Ltd. | 60,893 | 3,904 |
| Partner Communications | | |
| Co. Ltd. | 405,568 | 3,516 |
* | Lipman Electronic | | |
| Engineering Ltd. | 118,098 | 3,401 |
| Elbit Systems Ltd. | 122,573 | 3,142 |
* | ECI Telecom Ltd. | 292,015 | 3,119 |
| Africa-Israel Investments Ltd. | 54,829 | 2,985 |
| Discount Investment | | |
| Corp. Ltd. | 108,555 | 2,740 |
* | Audiocodes Ltd. | 188,836 | 2,572 |
* | Alvarion Ltd. | 291,935 | 2,408 |
* | Retalix Ltd. | 87,764 | 2,179 |
* | Syneron Medical Ltd. | 82,775 | 2,141 |
| Clal Industries and | | |
| Investments Ltd. | 368,460 | 2,037 |
| Clal Insurance Enterprise | | |
| Holdings Ltd. | 92,462 | 2,008 |
| Harel Insurance | | |
| Investments Ltd. | 43,442 | 1,964 |
*^ Given Imaging Ltd. | 81,208 | 1,904 |
* | Super Sol Ltd. | 565,986 | 1,696 |
| Migdal Insurance | | |
| Holdings Ltd. | 1,232,064 | 1,653 |
| Tadiran Communications | | |
| Industries | 46,645 | 1,618 |
* | Aladdin Knowledge Systems | 68,814 | 1,605 |
| Strauss-Elite Ltd. | 157,029 | 1,549 |
| Osem Investment Ltd. | 174,998 | 1,474 |
* | Radware Ltd. | 92,773 | 1,470 |
| Delek Automotive | | |
| Systems Ltd. | 148,236 | 926 |
| Blue Square-Israel Ltd. | 59,620 | 708 |
* | Matav-Cable Systems | | |
| Media Ltd. | 84,675 | 630 |
| | | 349,286 |
Mexico (6.8%) | | |
| America Movil SA de CV | 92,617,953 | 170,834 |
| Cemex SA CPO | 18,725,774 | 126,336 |
| Telefonos de Mexico SA | 54,543,758 | 60,068 |
| Wal-Mart de Mexico SA | 20,881,982 | 59,423 |
| Grupo Televisa SA CPO | 13,787,790 | 58,499 |
| Fomento Economico | | |
| Mexicano UBD | 4,192,481 | 38,764 |
| America Movil SA de | | |
| CV Series A | 16,666,131 | 30,215 |
| Grupo Mexico SA de CV | 6,141,187 | 21,475 |
| Grupo Financerio Banorte | | |
| SA de CV | 7,762,676 | 20,235 |
| Telefonos de Mexico | | |
| SA Series A | 11,110,754 | 12,176 |
| Grupo Modelo SA | 3,065,825 | 11,664 |
| Kimberly Clark de Mexico | | |
| SA de CV Series A | 2,854,489 | 10,056 |
| Grupo Carso SA de CV | | |
| Series A1 | 4,225,313 | 9,981 |
| Alfa SA de CV Series A | 1,879,885 | 9,439 |
* | Corporacion GEO, SA | | |
| de CV | 2,345,875 | 8,779 |
* | Grupo Aeroportuario del | | |
| Pacifico SA ADR | 229,000 | 7,621 |
* | URBI Desarrollos Urbanos | | |
| SA de CV | 787,467 | 6,429 |
| Grupo Aeroportuario del | | |
| Sureste SA de CV | 1,434,219 | 5,539 |
| Grupo Bimbo SA | 1,726,215 | 5,390 |
| Industrias Penoles SA | | |
| Series CP | 592,395 | 5,339 |
| Coca-Cola Femsa SA | | |
| de CV | 1,598,745 | 5,134 |
| Consorcio ARA SA de CV | 966,500 | 5,102 |
| TV Azteca SA CPO | 6,903,616 | 4,259 |
63
Emerging Markets Stock Index Fund |
| | | |
| | | Market |
| | | Value• |
| | Shares | ($000) |
| Controladora Comercial | | |
| Mexicana SA de CV (Units) | 1,911,538 | 3,241 |
* | Carso Infraestructura y | | |
| Construccion, SA | 4,196,064 | 3,047 |
| Cemex SA de CV ADR | 30,000 | 2,026 |
* | Vitro SA | 977,060 | 915 |
* | Grupo Aeroportuario del | | |
| Pacifico SA | 246,063 | 815 |
| | | 702,801 |
Peru (0.6%) | | |
| ^Southern Peru Copper Corp. | |
| (U.S. shares) | 145,985 | 14,460 |
| Compania de Minas | | |
| Buenaventura S.A.u | 467,318 | 13,666 |
| Southern Peru Copper Corp. | 115,075 | 11,369 |
| Credicorp Ltd. | 306,881 | 8,289 |
| Minsur SA | 2,225,097 | 3,019 |
| Compania de Minas | | |
| Buenaventura S.A.u. ADR | 99,155 | 3,013 |
* | Volcan Compania | | |
| Minera SA | 1,939,630 | 2,076 |
| Edegel SA | 4,624,061 | 1,924 |
| Luz del Sur SAA | 579,122 | 688 |
| | | 58,504 |
Phillipines (0.5%) | | |
| Philippine Long Distance | | |
| Telephone Co. | 255,457 | 10,105 |
| Bank of Philippine Islands | 5,253,447 | 6,191 |
| Ayala Land, Inc. | 25,412,716 | 5,759 |
| Ayala Corp. | 608,826 | 4,232 |
| SM Investments Corp. | 787,860 | 3,497 |
| San Miguel Corp. Class B | 2,154,031 | 3,327 |
| SM Prime Holdings, Inc. | 20,768,799 | 3,120 |
| Globe Telecom, Inc. | 158,449 | 2,756 |
* | Equitable PCI Bank, Inc. | 1,692,300 | 2,332 |
| Metropolitan Bank & | | |
| Trust Co. | 2,887,531 | 2,171 |
| Jollibee Foods Corp. | 1,993,400 | 1,365 |
| Banco De Oro | 1,730,491 | 1,187 |
| First Philippine Holdings | | |
| Construction | 1,306,068 | 1,124 |
| Megaworld Corp. | 34,830,400 | 966 |
| Petron Corp. | 10,920,146 | 885 |
* | Manila Electric Co. | 1,895,393 | 678 |
* | Filinvest Land, Inc. | 24,165,647 | 653 |
* | ABS-CBN Broadcasting | | |
| Corp. | 1,445,200 | 384 |
| | | 50,732 |
Poland (2.0%) | | |
| Polski Koncern Naftowy SA | 1,768,228 | 36,753 |
| Bank Polska Kasa Opieki | | |
| Grupa Pekao SA | 491,627 | 32,827 |
| Telekomunikacja Polska SA | 4,134,769 | 30,168 |
| Powszechna Kasa | | |
| Oszczednosci Bank | | |
| Polski SA | 2,362,862 | 29,594 |
| KGHM Polska Miedz SA | 650,272 | 23,786 |
| Bank Przemyslowo | | |
| Handlowy PBK SA | 50,877 | 13,069 |
| Bank Zachodni WBK SA | 129,101 | 7,800 |
* | TVN SA | 151,809 | 4,735 |
* | Bank Rozwoju Eksportu SA | 50,472 | 3,346 |
* | Global Trade Centre SA | 34,879 | 3,018 |
| Prokom Software SA | 61,528 | 2,943 |
| Agora SA | 186,079 | 2,703 |
| Grupa Kety SA | 51,768 | 2,350 |
| Orbis SA | 148,635 | 2,228 |
| Boryszew SA | 162,825 | 1,519 |
| Mondi Packaging Paper | | |
| Swieci SA | 72,123 | 1,421 |
* | Budimex SA | 68,127 | 1,241 |
| Polska Grupa | | |
| Farmaceutyczna | 56,754 | 1,232 |
* | Computerland SA | 34,991 | 1,170 |
* | Softbank SA | 69,082 | 834 |
| Debica SA | 37,149 | 819 |
| | | 203,556 |
South Africa (11.3%) | | |
| Sasol Ltd. | 3,414,489 | 141,236 |
| Standard Bank Group Ltd. | 7,185,105 | 101,747 |
| MTN Group Ltd. | 7,864,123 | 77,922 |
| Impala Platinum | | |
| Holdings Ltd. | 376,287 | 70,952 |
| Gold Fields Ltd. | 2,322,832 | 58,254 |
| FirstRand Ltd. | 16,580,811 | 54,102 |
| AngloGold Ltd. | 782,214 | 42,377 |
| Naspers Ltd. | 1,763,714 | 38,312 |
64
Emerging Markets Stock Index Fund
| | | Market |
| | | Value• |
| | Shares | ($000) |
| Anglo Platinum Ltd. | 386,830 | 37,246 |
| Telkom South Africa Ltd. | 1,448,276 | 34,155 |
| Sanlan Ltd. | 13,229,279 | 33,919 |
* | Harmony Gold Mining | | |
| Co., Ltd. | 1,978,724 | 32,801 |
| Imperial Holdings Ltd. | 1,102,850 | 30,418 |
| Barloworld Ltd. | 1,278,156 | 27,836 |
| Bidvest Group Ltd. | 1,521,808 | 27,656 |
| Tiger Brands Ltd | 952,768 | 26,288 |
| Nedbank Group Ltd. | 1,177,355 | 24,386 |
| Steinhoff International | | |
| Holdings Ltd. | 5,036,376 | 19,814 |
| Edgars Consolidated | | |
| Stores Ltd. | 2,869,685 | 17,997 |
| Sappi Ltd. | 1,207,122 | 17,049 |
| JD Group Ltd. | 987,161 | 15,107 |
| African Bank | | |
| Investments Ltd. | 2,640,679 | 14,604 |
| Mittal Steel South | | |
| Africa Ltd. | 1,182,872 | 13,655 |
| Truworths | | |
| International Ltd. | 2,725,719 | 13,026 |
| Woolworths Holdings Ltd. | 4,655,852 | 12,952 |
| Reunert Ltd. | 1,027,319 | 12,714 |
| Foschini Ltd. | 1,204,323 | 12,114 |
| Network Healthcare | | |
| Holdings Ltd. | 7,060,178 | 11,864 |
| Investec Ltd. | 194,416 | 10,973 |
| Massmart Holdings Ltd. | 1,121,554 | 10,888 |
| Liberty Group Ltd. | 736,345 | 10,087 |
| Shoprite Holdings Ltd. | 2,404,652 | 10,037 |
| Ellerine Holdings Ltd. | 652,746 | 9,964 |
| Nampak Ltd. | 3,065,230 | 9,277 |
| Aveng Ltd. | 2,342,067 | 9,196 |
| Aspen Pharmacare | | |
| Holdings Ltd. | 1,249,099 | 8,759 |
| Murray & Roberts | | |
| Holdings Ltd. | 1,759,463 | 7,881 |
| Metropolitan Holdings Ltd. | 3,355,157 | 7,218 |
| Kumba Resources Ltd. | 362,182 | 6,799 |
| Pick’n Pay Stores Ltd. | 1,293,069 | 6,790 |
| Allan Gray Property Trust | 5,931,638 | 6,319 |
| Spar Group Ltd. | 1,006,604 | 6,238 |
| Pretoria Portland Cement | | |
| Co., Ltd. | 79,522 | 5,506 |
| AVI Ltd. | 1,871,947 | 5,258 |
| Alexander Forbes Ltd. | 1,936,592 | 4,952 |
| Tongaat-Hulett Group Ltd. | 306,855 | 4,940 |
| Consol Ltd. | 1,856,678 | 4,458 |
| Grindrod Ltd. | 1,906,890 | 4,153 |
| Super Group Ltd. | 1,649,634 | 3,241 |
| | | 1,173,437 |
South Korea (19.7%) | | |
* | Samsung Electronics | | |
| Co., Ltd. | 606,108 | 413,652 |
| Kookmin Bank | 1,760,655 | 157,090 |
| POSCO | 311,741 | 88,517 |
| Hyundai Motor Co. Ltd. | 968,391 | 85,283 |
| Samsung Electronics Co., | | |
| Ltd. Pfd. | 128,108 | 69,375 |
2 | Samsung Electronics Co., | | |
| Ltd. GDR | 179,670 | 60,988 |
| Korea Electric Power Corp. | 1,342,571 | 59,634 |
| Shinhan Financial | | |
| Group Ltd. | 1,165,332 | 57,765 |
| SK Corp. | 645,843 | 47,493 |
| SK Telecom Co., Ltd. | 191,933 | 45,282 |
| LG Electronics Inc. | 541,240 | 44,710 |
| Shinsegae Co., Ltd. | 83,541 | 40,952 |
| KT & G Corp. | 671,550 | 37,569 |
| KT Corp. | 732,154 | 32,938 |
| Hana Financial Group Inc. | 670,102 | 32,894 |
| Samsung Fire & Marine | | |
| Insurance Co. | 216,496 | 31,110 |
| Hyundai Mobis | 328,355 | 29,036 |
| POSCO ADR | 400,755 | 28,241 |
* | NHN Corp. | 73,285 | 26,001 |
| Hyundai Heavy Industries | | |
| Co., Inc. | 269,440 | 25,853 |
| Samsung Corp. | 784,630 | 24,453 |
| Samsung Heavy Industries | | |
| Co. Ltd. | 1,023,630 | 24,206 |
* | LG. Philips LCD Co., Ltd. | 528,987 | 22,232 |
| Hyundai Development Co. | 378,950 | 22,005 |
| Lotte Shopping Co., Ltd. | 50,697 | 21,177 |
65
Emerging Markets Stock Index Fund
| Shares | Market
Value•
($000) |
|---|
| Kia Motors | 1,027,030 | 21,136 |
| S-Oil Corp. | 266,422 | 20,635 |
| * Kookmin Bank-Spon ADR | 225,953 | 20,121 |
Samsung Securities
Co. Ltd. | 316,340 | 19,883 |
| Samsung SDI Co. Ltd. | 201,165 | 16,636 |
Daewoo Shipbuilding &
Marine Engineering Co., Ltd. | 566,590 | 16,563 |
LG Engineering &
Construction Co., Ltd. | 210,240 | 15,283 |
| CJ Corp. | 107,060 | 14,634 |
* Hyundai Engineering &
Construction Co., Ltd. | 225,538 | 14,016 |
| Daegu Bank | 740,505 | 13,883 |
Daewoo Engineering &
Construction Co., Ltd. | 799,845 | 13,821 |
* Woori Investment &
Securities Co., Ltd. | 555,839 | 13,620 |
Samsung Electro-
Mechanics Co. | 352,600 | 13,386 |
| Hyundai Motor Co. | 221,671 | 13,119 |
| Kangwon Land Inc. | 630,558 | 12,991 |
| LG Chem Ltd. | 266,182 | 11,744 |
| * Daewoo Securities Co., Ltd. | 617,620 | 11,221 |
| Amorepacific Corp. | 30,561 | 11,216 |
| SK Telecom Co. Ltd. ADR | 415,529 | 11,095 |
| * Hyundai Securities Co. | 659,519 | 11,031 |
| Daelim Industrial Co. | 143,740 | 10,977 |
| Pusan Bank | 693,455 | 10,675 |
| Cheil Industrial, Inc. | 264,930 | 9,625 |
| LG International Corp. | 339,620 | 9,621 |
Korea Investment Holdings
Co., Ltd. | 217,640 | 9,327 |
| Hanjin Shipping Co., Ltd. | 316,930 | 8,748 |
| Hankook Tire Co. Ltd. | 575,030 | 8,677 |
Hyundai Department Store
Co., Ltd. | 86,238 | 8,311 |
Korea Electric Power
Corp. ADR | 342,194 | 7,802 |
| Korean Air Co. Ltd. | 209,068 | 7,609 |
*^ Shinhan Financial Group
Co., Ltd. ADR | 77,382 | 7,494 |
| Hite Brewery Co., Ltd. | 56,912 | 7,479 |
| * Korea Exchange Bank | 573,660 | 7,394 |
Hyundai Mipo Dockyard
Co., Ltd. | 76,818 | 7,206 |
Hanjin Heavy Industries
Co. Ltd. | 230,430 | 7,184 |
| * NCsoft Corp. | 84,085 | 7,032 |
| Yuhan Corp. | 39,996 | 6,566 |
| Doosan Infracore Co., Ltd. | 348,830 | 6,523 |
Kumkang Korea Chemical
Co., Ltd. | 27,762 | 6,293 |
| Honam Petrochemical Corp. | 84,750 | 5,396 |
| Nong Shim Co. Ltd. | 18,848 | 5,268 |
| LG Electronics Inc. | 102,010 | 5,233 |
LG Household & Health
Care Ltd. | 63,932 | 5,108 |
| S1 Corp. | 113,000 | 5,057 |
| * Daishin Securities Co. | 215,887 | 5,046 |
| Dongkuk Steel Mill Co., Ltd. 235,040 | 5,040 |
| LG Cable Ltd. | 113,740 | 4,705 |
| Cheil Communications Inc. | 20,260 | 4,302 |
| KT Corp. ADR | 184,327 | 4,289 |
| Hanwha Chemical Corp. | 323,020 | 3,859 |
* Daum Communications
Corp | 72,822 | 3,642 |
| LG Petrochemical Co., Ltd. | 157,890 | 3,475 |
Samsung Fine Chemicals
Co., Ltd. | 100,130 | 3,080 |
| * Hyosung Corp. | 144,023 | 3,046 |
| Poongsan Corp. | 131,360 | 2,990 |
| Dae Duck Electronics Co. | 216,083 | 2,042 |
| | | 2,050,611 |
| Taiwan (15.3%)1 |
Taiwan Semiconductor
Manufacturing Co., Ltd. | 104,270,633 | 220,452 |
Hon Hai Precision Industry
Co., Ltd. | 19,080,090 | 128,903 |
Cathay Financial
Holding Co. | 30,055,980 | 67,308 |
United Microelectronics
Corp | 88,855,658 | 61,841 |
| MediaTek Inc. | 4,082,491 | 47,709 |
| China Steel Corp. | 46,892,413 | 45,813 |
| Nan Ya Plastic Corp. | 28,413,574 | 41,513 |
66
Emerging Markets Stock Index Fund
| | | Market |
| | | Value• |
| | Shares | ($000) |
| High Tech Computer Corp. | 1,264,600 | 40,434 |
| Chunghwa Telecom | | |
| Co., Ltd. | 20,580,000 | 39,558 |
| Mega Financial Holding | | |
| Co. Ltd. | 50,343,224 | 39,325 |
| Formosa Plastic Corp. | 24,599,990 | 39,276 |
| Asustek Computer Inc. | 13,263,421 | 36,785 |
| AU Optronics Corp. | 21,860,232 | 35,967 |
| Chi Mei Optoelectronics | | |
| Corp. | 19,542,464 | 27,775 |
| Taiwan Semiconductor | | |
| Manufacturing Co. | | |
| Ltd. ADR | 2,511,402 | 26,319 |
| Chinatrust Financial | | |
| Holding | 31,433,023 | 25,802 |
| Acer Inc. | 12,663,599 | 24,603 |
| Delta Electronics Inc. | 7,545,209 | 23,549 |
| Formosa Chemicals & | | |
| Fibre Corp. | 14,272,676 | 23,220 |
* | China Development | | |
| Financial Holding Corp. | 55,935,684 | 22,546 |
| Advanced Semiconductor | | |
| Engineering Inc. | 17,944,670 | 21,203 |
| Fubon Financial Holding | | |
| Co., Ltd. | 21,368,100 | 20,688 |
| First Financial Holding | | |
| Co., Ltd. | 25,727,300 | 20,465 |
| Compal Electronics Inc. | 17,865,460 | 19,690 |
| Quanta Computer Inc. | 10,489,603 | 18,500 |
| Taishin Financial Holdings | 27,303,678 | 17,937 |
| SinoPac Holdings | 31,721,214 | 17,613 |
| Shin Kong Financial | | |
| Holdings Co. | 14,418,628 | 15,385 |
| Hau Nan Financial | | |
| Holdings Co., Ltd. | 19,372,695 | 15,011 |
| Foxconn Technology | | |
| Co., Ltd. | 1,989,600 | 14,942 |
| Chang Hwa Commercial | | |
| Bank | 22,683,094 | 14,686 |
| Taiwan Cellular Corp. | 13,131,360 | 13,240 |
| Lite-On Technology Corp. | 7,784,550 | 12,295 |
| Far Eastern Textile Ltd. | 13,332,975 | 12,272 |
| Uni-President | | |
| Enterprises Co. | 14,977,590 | 11,294 |
| Yuanta Core Pacific | | |
| Securities Co. | 14,039,300 | 10,742 |
| BENQ Corp. | 12,390,692 | 10,365 |
| E.Sun Financial Holding | | |
| Co., Ltd. | 14,257,272 | 10,315 |
| Siliconware Precision | | |
| Industries Co. | 6,687,786 | 9,579 |
| Largan Precision Co., Ltd. | 430,227 | 9,051 |
| ^United Microelectronics | | |
| Corp. ADR | 2,073,680 | 7,818 |
| Quanta Display Inc. | 17,451,254 | 7,548 |
| Taiwan Fertilizer Co., Ltd. | 4,072,000 | 7,510 |
| Pou Chen Corp. | 9,509,329 | 7,502 |
| President Chain Store | | |
| Corp. | 2,977,985 | 7,458 |
| Chunghwa Picture | | |
| Tubes, Ltd. | 23,829,097 | 7,107 |
* | Winbond Electronics | | |
| Corp. | 20,059,000 | 6,822 |
* | HannStar Display Corp. | 31,547,491 | 6,279 |
| Wintek Corp. | 4,547,362 | 6,166 |
* | Tatung Co., Ltd. | 19,874,000 | 6,161 |
| Walsin Lihwa Corp. | 14,583,970 | 6,001 |
| Inventec Co., Ltd. | 7,851,015 | 5,679 |
| Mitac International Corp. | 4,731,961 | 5,489 |
* | Yageo Corp. | 12,662,520 | 5,478 |
* | Via Technologies Inc. | 5,467,379 | 5,466 |
| Asia Cement Corp. | 6,925,642 | 5,422 |
| AU Optronics Corp. ADR | 320,936 | 5,273 |
| Yulon Motor Co., Ltd. | 4,603,923 | 4,929 |
| Ya Hsin Industrial Co., Ltd. | 5,012,817 | 4,843 |
* | CMC Magnetics Corp. | 15,067,700 | 4,823 |
| Synnex Technology | | |
| International Corp. | 3,777,844 | 4,673 |
| Fu Sheng Industrial | | |
| Co., Ltd. | 3,784,776 | 4,649 |
| Fuhwa Financial Holdings | | |
| Co., Ltd. | 11,102,754 | 4,559 |
| Realtek Semiconductor | | |
| Corp. | 3,887,194 | 4,474 |
| Yang Ming Marine | | |
| Transport | 6,698,985 | 4,392 |
| Chunghwa Telecom Co., | | |
| Ltd. ADR | 205,393 | 4,231 |
67
Emerging Markets Stock Index Fund | |
| | | |
| | | Market |
| | | Value• |
| | Shares | ($000) |
* | Macronix International | | |
| Co., Ltd. | 16,498,105 | 4,066 |
| Premier Image | | |
| Technology Corp. | 2,585,815 | 4,009 |
| Advantech Co., Ltd. | 1,449,939 | 3,978 |
* | Ritek Corp. | 12,675,194 | 3,962 |
| Asia Optical Co., Inc. | 800,553 | 3,928 |
| Evergreen Marine Corp. | 5,505,822 | 3,843 |
| Eternal Chemical Co., Ltd. | 2,673,610 | 3,791 |
| Zyxel Communications | | |
| Corp. | 1,909,986 | 3,537 |
| Polaris Securities | | |
| Co., Ltd. | 7,053,377 | 3,514 |
* | Teco Electric & Machinery | | |
| Co., Ltd. | 9,585,000 | 3,459 |
| D-Link Corp. | 3,041,814 | 3,446 |
| China Motor Co., Ltd. | 3,178,974 | 3,383 |
* | Cathay Construction Corp. | 5,324,779 | 3,236 |
| Waterland Financial | | |
| Holdings | 9,387,000 | 3,225 |
| Yuen Foong Yu Paper | | |
| Manufacturing Co., Ltd. | 7,030,478 | 3,175 |
| Wan Hai Lines Ltd. | 4,360,791 | 3,007 |
| China Airlines | 6,257,848 | 2,974 |
| Taiwan Glass | | |
| Industrial Corp. | 3,630,303 | 2,974 |
| Taiwan Cement Corp. | 3,789,789 | 2,969 |
| EVA Airways Corp. | 7,153,879 | 2,929 |
| Optimax Technology Corp. | 2,341,220 | 2,869 |
| U-Ming Marine | | |
| Transport Corp. | 2,508,600 | 2,861 |
* | Compeq Manufacturing | | |
| Co., Ltd. | 5,159,750 | 2,793 |
| Yieh Phui Enterprise | 6,221,923 | 2,778 |
| Cheng Shin Rubber Industry | |
| Co., Ltd. | 3,330,416 | 2,651 |
| Advanced Semiconductor | | |
| Engineering Inc. ADR | 454,497 | 2,650 |
| Kinpo Electronics, Inc. | 6,028,782 | 2,600 |
| Taiwan Secom Corp., Ltd. | 1,563,412 | 2,598 |
| Gigabyte Technology | | |
| Co., Ltd. | 3,187,626 | 2,524 |
| Nien Made Enterprise | | |
| Co., Ltd. | 1,715,118 | 2,360 |
| Giant Manufacturing | | |
| Co., Ltd. | 1,177,270 | 2,268 |
| Phoenixtec Power | | |
| Co., Ltd. | 2,112,430 | 2,222 |
| Formosa Taffeta Co., Ltd. | 3,808,616 | 2,199 |
| Shihlin Electric & | | |
| Engineering Corp. | 2,012,000 | 2,148 |
| Oriental Union | | |
| Chemical Corp. | 2,811,191 | 1,966 |
* | Accton Technology Corp. | 3,253,116 | 1,965 |
| Micro-Star International | | |
| Co., Ltd. | 3,396,394 | 1,904 |
* | Elitegroup Computer | | |
| Systerm Co., Ltd. | 2,501,445 | 1,726 |
| ^Siliconware Precision | | |
| Industries Co. ADR | 241,565 | 1,691 |
| Nien Hsing Textile | | |
| Co. Ltd. | 2,049,000 | 1,318 |
| Taiwan Styrene | | |
| Monomer Corp. | 2,739,288 | 1,299 |
* | Systex Corp. | 4,298,752 | 1,282 |
| | | 1,582,800 |
Thailand (1.9%) | | |
| PTT Public Co., Ltd. | | |
| (Foreign) | 4,940,572 | 33,928 |
| PTT Exploration & | | |
| Production Public Co. Ltd. | | |
| (Foreign) | 7,652,630 | 25,665 |
| Bangkok Bank Public Co. | | |
| Ltd. (Foreign) | 5,537,372 | 17,520 |
| Kasikornbank Public Co. | | |
| Ltd. (Foreign) | 6,851,336 | 12,391 |
| Advanced Info Service | | |
| Public Co. Ltd. (Foreign) | 5,214,740 | 12,284 |
| Siam Cement Public Co. | | |
| Ltd. (Foreign) | 1,767,540 | 11,924 |
| Siam Commercial Bank | | |
| Public Co. Ltd. (Foreign) | 4,747,291 | 8,213 |
| Bangkok Bank Public Co. | | |
| Ltd. (Local) | 1,802,244 | 5,414 |
| Krung Thai Bank Public Co. | | |
| Ltd. (Foreign) | 16,530,834 | 5,412 |
| Siam Cement Public Co. | | |
| Ltd. (Local) | 752,290 | 4,766 |
| Kasikornbank Public Co., | | |
| Ltd. (Local) | 2,668,800 | 4,683 |
68
Emerging Markets Stock Index Fund
| | | Market |
| | | Value• |
| | Shares | ($000) |
| Airports of Thailand Public | | |
| Co. Ltd. (Foreign) | 2,524,100 | 3,930 |
| Thai Airways International | | |
| Public Co. Ltd. | 2,973,200 | 3,759 |
| PTT Chemical PCL | | |
| (Foreign) | 1,587,015 | 3,654 |
| Banpu Public Co. Ltd. | | |
| (Foreign) | 730,411 | 2,955 |
| Land and Houses Public | | |
| Co. Ltd. (Foreign) | 12,268,800 | 2,870 |
| Siam City Cement Public | | |
| Co. Ltd. (Foreign) | 368,706 | 2,650 |
* | True Corp. Public Co. Ltd. | | |
| (Foreign) | 9,964,000 | 2,612 |
| Charoen Pokphand Foods | | |
| Public Co., Ltd. (Foreign) | 17,764,812 | 2,601 |
| Hana Microelectronics | | |
| Public Co. Ltd. (Foreign) | 3,248,900 | 2,486 |
| BEC World Public Co. | | |
| Ltd. (Foreign) | 5,311,930 | 2,008 |
| Land and Houses Public | | |
| Co. Ltd. (Local) | 8,694,200 | 1,953 |
| Ratchaburi Electricity | | |
| Generating Holding | | |
| Public C | 1,739,900 | 1,795 |
| C.P. 7-Eleven Public Co. | | |
| Ltd. (Foreign) | 8,831,000 | 1,786 |
| Thanachart Capital Public | | |
| Co. Ltd. (Foreign) | 3,869,130 | 1,666 |
| Italian-Thai Development | | |
| Public Co. Ltd. (Foreign) | 8,067,018 | 1,546 |
| Bangkok Expressway | | |
| Public Co. Ltd. (Foreign) | 2,016,400 | 1,224 |
| Siam Makro Public Co. | | |
| Ltd. (Foreign) | 544,300 | 1,159 |
| Electricity Generating | | |
| Public Co. Ltd. (Foreign) | 493,848 | 1,097 |
| Delta Electronics (Thailand) | | |
| Public Co. Ltd. (Foreign) | 2,037,250 | 1,090 |
| Kiatnakin Finance Public | | |
| Co. Ltd. (Foreign) | 1,172,900 | 1,077 |
* | Sahaviriya Steel Industries | | |
| Public Co., Ltd. | 29,646,700 | 1,049 |
| The Aromatics (Thailand) | | |
| PLC (Foreign) | 1,386,200 | 1,024 |
| Precious Shipping Public | | |
| Co. Ltd. (Foreign) | 1,290,254 | 1,004 |
| Kim Eng Securities | | |
| Thailand Public Co. | | |
| Ltd. (Foreign) | 1,170,000 | 864 |
* | TISCO Finance Public Co. | | |
| Ltd. (Foreign) | 1,074,013 | 821 |
| Sino Thai Engineering & | | |
| Construction PCL (Foreign) | 3,400,100 | 778 |
| Thai Union Frozen | | |
| Products Public Co., Ltd. | | |
| (Foreign) | 896,150 | 737 |
| Bangkok Bank Public Co. | | |
| Ltd. Non-Voting Depositary | | |
| Receipts | 242,300 | 729 |
| Thai Union Frozen Products | | |
| Public Co. Ltd. (Local) | 863,750 | 695 |
| Electricity Generating | | |
| Public Co. Ltd. (Local) | 270,300 | 600 |
* | ITV Public Co., Ltd. | | |
| (Foreign) | 2,021,500 | 495 |
| PTT Exploration and | | |
| Production Public Co. | | |
| Ltd. (Local) | 142,300 | 477 |
* | Tisco Bank Public Co., | | |
| Ltd. (Local) | 434,500 | 330 |
| GMM Grammy Public Co. | | |
| Ltd. (Foreign) | 1,191,500 | 323 |
| Banpu Public Co. Ltd. | | |
| (Local) | 39,000 | 158 |
| Siam Cement Public Co. | | |
| Ltd. Non-Voting Depositary | | |
| Receipts | 24,200 | 153 |
| Kiatnakin Finance Public | | |
| Co. Ltd. | 117,700 | 110 |
| PTT Public Co., Ltd. (Local) | 15,500 | 106 |
| Hana Microelectronics | | |
| Public Co. Ltd. (Local) | 132,200 | 101 |
| C.P. 7-Eleven Public Co. | | |
| Ltd. (Local) | 486,000 | 98 |
| Electricity Generating Public | | |
| Co. Ltd. Non-Voting | | |
| Depositary Receipts | 30,600 | 68 |
| ^True Corporation Public | | |
| Company Limited Warrants | | |
| Exp. 4/3/10 | 1,020,789 | — |
| | | 196,838 |
69
| Shares | Market
Value•
($000) |
|---|
|
| Turkey (2.4%) | | |
|
| Turkiye Is Bankasi A.S |
| C Shares | 4,069,838 | 34,377 |
|
| Akbank T.A.S | 3,720,688 | 31,049 |
|
| Turkiye Garanti |
| Bankasi A.S | 5,587,710 | 23,091 |
|
| * Turkiye Vakiflar |
| Bankasi T.A.O | 2,258,995 | 14,429 |
|
| Turkcell Iletisim |
| Hizmetleri A.S | 2,184,093 | 13,942 |
|
| Haci Omer Sabanci |
| Holding A.S | 2,663,181 | 12,649 |
|
| * Yapi ve Kredi Bankasi A.S | 5,049,408 | 11,887 |
|
| Anadolu Efes Biracilik ve |
| Malt Sanayii A.S | 334,146 | 11,169 |
|
| Tupras-Turkiye Petrol |
| Rafinerileri A.S | 517,323 | 11,039 |
|
| KOC Holding A.S | 1,349,512 | 7,473 |
|
| * Dogan Sirketler Grubu |
| Holding A.S | 1,520,305 | 7,286 |
|
| Eregli Demir ve Celik |
| Fabrikalari A.S | 1,150,700 | 6,888 |
|
| * Dogan Yayin Holding A.S | 1,260,909 | 6,435 |
|
| Migros Turk A.S | 403,624 | 5,602 |
|
| Arcelik A.S | 592,038 | 5,036 |
|
| Ford Otomotiv Sanayi A.S | 416,859 | 4,153 |
|
| Hurriyet Azteccilik ve |
| Matbaacillik A.S | 1,108,859 | 4,057 |
|
| Turk Sise ve Cam |
| Fabrikalari A.S | 869,228 | 3,856 |
|
| Aksigorta A.S | 724,520 | 3,670 |
|
| Tofas Turk Otomobil |
| Fabrikasi A.S | 720,854 | 2,342 |
|
| * Petkim Petrokimya |
| Holding A.S | 490,426 | 2,281 |
|
| Is Gayrimenkul Yatirim |
| Ortakligi A.S | 859,008 | 2,244 |
|
| Akcansa Cimento A.S | 280,892 | 2,156 |
|
| Trakya Cam Sanayii A.S | 468,489 | 2,100 |
|
| * Cimsa Cemento Sanayi ve |
| Ticaret A.S | 219,057 | 1,929 |
|
| Dogus Otomotiv Servis ve |
| Ticaret A.S | 227,036 | 1,870 |
|
| * Vestel Elektronik Sanayi ve |
| Ticaret A.S | 469,534 | 1,700 |
|
| Ulker Gida Sanayi ve |
| Ticaret A.S | 426,081 | 1,634 |
|
| Adana Cimento Sanayii |
| T.A.S | 178,597 | 1,516 |
|
| Aygaz A.S | 369,172 | 1,495 |
|
| * Turk Hava Yollari Anonim |
| Ortakligi | 250,225 | 1,378 |
|
| Ihlas Holding A.S | 1,779,553 | 1,165 |
|
| * Alarko Holdings A.S | 27,086 | 1,125 |
|
| * Tansas Perakende |
| Magazacilik Ticaret A.S | 531,184 | 1,014 |
|
| Aksa Akrilik Kimya |
| Sanayii A.S | 75,360 | 646 |
|
| * Ak Enerji Elektrik Uretimi |
| Otoproduktor Gruba A.S | 86,023 | 320 |
|
| * Ihlas Holding RUC Rights |
| Exp. 5/3/06 | 1,779,553 | 13 |
|
| | | 245,016 |
|
| Total Common Stocks |
| (Cost $6,645,389) | | 10,334,687 |
|
| Temporary Cash Investments (0.7%)1 |
|
| Money Market Fund (0.7%) |
|
| 3 Vanguard Market Liquidity |
| Fund, 4.771% | 26,699,082 | 26,699 |
|
| 3 Vanguard Market Liquidity |
| Fund, 4.771%—Note F | 47,641,500 | 47,642 |
|
| Total Temporary Cash Investments |
| (Cost $74,341) | | 74,341 |
|
| Total Investments (100.3%) |
| (Cost $6,719,730) | | 10,409,028 |
|
| Other Assets and Liabilities (–0.3%) |
|
| Other Assets—Note B | | 73,540 |
|
| Liabilities—Note F | | (103,561) |
|
| | | (30,021) |
|
| Net Assets (100%) | | 10,379,007 |
|
70
Emerging Markets Stock Index Fund
At April 30, 2006, net assets consisted of:4 |
| Amount |
| ($000) |
Paid-in Capital | 6,773,007 |
Undistributed Net Investment Income | 53,163 |
Accumulated Net Realized Losses | (141,577) |
Unrealized Appreciation | |
Investment Securities | 3,689,298 |
Foreign Currencies | 159 |
Swap Contracts | 4,957 |
Net Assets | 10,379,007 |
| |
Investor Shares—Net Assets | |
Applicable to 372,362,844 outstanding | |
$.001 par value shares of beneficial | |
interest (unlimited authorization) | 8,461,188 |
Net Asset Value Per Share— | |
Investor Shares | $22.72 |
| |
Institutional Shares—Net Assets | |
Applicable to 28,570,689 outstanding | |
$.001par value shares of beneficial | |
interest (unlimited authorization) | 650,511 |
Net Asset Value Per Share— | |
Institutional Shares | $22.77 |
| |
VIPER Shares—Net Assets | |
Applicable to 17,602,090 outstanding | |
$.001 par value shares of beneficial | |
interest (unlimited authorization) | 1,267,308 |
Net Asset Value Per Share— | |
VIPER Shares | $72.00 |
• See Note A in Notes to Financial Statements.
* Non-income-producing security.
^ Part of security position is on loan to broker/dealers. See Note F in Notes to Financial Statements.
1 The fund invests a portion of its cash reserves in equity markets through the use of equity swap contracts. Investments in swap contracts increased the fund’s equity investments in Taiwan to 15.5%. After giving effect to swap investments, the fund’s effective common stock and temporary cash investment positions represent 99.8% and 0.5%, respectively, of net assets. See Note D in Notes to Financial Statements.
2 Security exempt from registration under Rule 144A of the Securities Act of 1933. Such securities may be sold in transactions exempt from registration, normally to qualified institutional buyers. At April 30, 2006, the value of this security represented 0.6% of net assets.
3 Affiliated money market fund available only to Vanguard funds and certain trusts and accounts managed by Vanguard. Rate shown is the 7-day yield.
4 See Note D in Notes to Financial Statements for the tax-basis components of net assets.
ADR—American Depositary Receipt.
GDR—Global Depositary Receipt.
71
Emerging Markets Stock Index Fund | |
| |
Statement of Operations | |
| |
| Six Months Ended |
| April 30, 2006 |
| ($000) |
Investment Income | |
Income | |
Dividends1 | 86,306 |
Interest2 | 1,253 |
Security Lending | 191 |
Total Income | 87,750 |
Expenses | |
The Vanguard Group—Note B | |
Investment Advisory Services | 59 |
Management and Administrative—Investor Shares | 9,655 |
Management and Administrative—Institutional Shares | 285 |
Management and Administrative—VIPER Shares | 706 |
Marketing and Distribution—Investor Shares | 724 |
Marketing and Distribution—Institutional Shares | 74 |
Marketing and Distribution—VIPER Shares | 68 |
Custodian Fees | 4,494 |
Shareholders’ Reports—Investor Shares | 57 |
Shareholders’ Reports—Institutional Shares | — |
Shareholders’ Reports—VIPER Shares | — |
Trustees’ Fees and Expenses | 4 |
Total Expenses | 16,126 |
Expenses Paid Indirectly—Note C | (85) |
Net Expenses | 16,041 |
Net Investment Income | 71,709 |
Realized Net Gain (Loss) | |
Investment Securities Sold | 32,728 |
Foreign Currencies | (1,076) |
Swap Contracts | (918) |
Realized Net Gain (Loss) | 30,734 |
Change in Unrealized Appreciation (Depreciation) | |
Investment Securities | 2,256,711 |
Foreign Currencies | 177 |
Swap Contracts | 7,633 |
Change in Unrealized Appreciation (Depreciation) | 2,264,521 |
Net Increase (Decrease) in Net Assets Resulting from Operations | 2,366,964 |
1 Dividends are net of foreign withholding taxes of $8,464,000.
2 Interest income from an affiliated company of the fund was $599,000.
72
Emerging Markets Stock Index Fund
Statement of Changes in Net Assets
| Six Months Ended | Year Ended |
| Apr. 30, | Oct. 31, |
| 2006 | 2005 |
| ($000) | ($000) |
Increase (Decrease) in Net Assets | | |
Operations | | |
Net Investment Income | 71,709 | 107,594 |
Realized Net Gain (Loss) | 30,734 | 22,918 |
Change in Unrealized Appreciation (Depreciation) | 2,264,521 | 953,968 |
Net Increase (Decrease) in Net Assets Resulting from Operations | 2,366,964 | 1,084,480 |
Distributions | | |
Net Investment Income | | |
Investor Shares | (96,913) | (53,935) |
Institutional Shares | (9,315) | (5,623) |
VIPER Shares | (9,827) | — |
Realized Capital Gain | | |
Investor Shares | — | — |
Institutional Shares | — | — |
VIPER Shares | — | — |
Total Distributions | (116,055) | (59,558) |
Capital Share Transactions—Note G | | |
Investor Shares | 1,638,956 | 1,461,564 |
Institutional Shares | 20,123 | 134,814 |
VIPER Shares | 688,544 | 357,977 |
Net Increase (Decrease) from Capital Share Transactions | 2,347,623 | 1,954,355 |
Total Increase (Decrease) | 4,598,532 | 2,979,277 |
Net Assets | | |
Beginning of Period | 5,780,475 | 2,801,198 |
End of Period1 | 10,379,007 | 5,780,475 |
1 Net Assets—End of Period include undistributed net investment income of $53,163,000 and $98,915,000.
73
Emerging Markets Stock Index Fund | | | | | | |
| | | | | | | |
| | | | | | | |
| | | | | | | |
Financial Highlights | | | | | | |
| | | | | | | |
Investor Shares | | | | | | | |
| | | | | | | |
| Six Months | | | | | |
| Ended | | | Jan. 1 to | Year Ended |
For a Share Outstanding | Apr. 30, | Year Ended October 31, | Oct. 31, | Dec. 31, |
Throughout Each Period | 2006 | 2005 | 2004 | 2003 | 2002 | 20011 | 2000 |
Net Asset Value, | | | | | | | |
Beginning of Period | $16.91 | $12.88 | $11.04 | $7.48 | $7.28 | $8.84 | $12.50 |
Investment Operations | | | | | | | |
Net Investment Income | .143 | .307 | .263 | .170 | .15 | .19 | .141 |
Net Realized and Unrealized | | | | | | | |
Gain (Loss) on Investments | 5.982 | 3.982 | 1.749 | 3.512 | .25 | (1.74) | (3.583) |
Total from Investment | | | | | | | |
Operations | 6.125 | 4.289 | 2.012 | 3.682 | .40 | (1.55) | (3.442) |
Distributions | | | | | | | |
Dividends from Net | | | | | | | |
Investment Income | (.315) | (.259) | (.172) | (.122) | (.20) | (.01) | (.218) |
Distributions from | | | | | | | |
Realized Capital Gains | — | — | — | — | — | — | — |
Total Distributions | (.315) | (.259) | (.172) | (.122) | (.20) | (.01) | (.218) |
Net Asset Value, | | | | | | | |
End of Period | $22.72 | $16.91 | $12.88 | $11.04 | $7.48 | $7.28 | $8.84 |
| | | | | | | |
Total Return2 | 36.58% | 33.66% | 18.43% | 49.88% | 5.27% | –17.55% | –27.56% |
| | | | | | | |
Ratios/Supplemental Data | | | | | | | |
Net Assets, | | | | | | | |
End of Period (Millions) | $8,461 | $4,937 | $2,556 | $1,589 | $841 | $770 | $913 |
Ratio of Total Expenses to | | | | | | | |
Average Net Assets | 0.43%3 | 0.45% | 0.48% | 0.53% | 0.57% | 0.60%3 | 0.59% |
Ratio of Net Investment | | | | | | | |
Income to Average Net Assets | 1.76%3 | 2.48% | 2.44% | 2.26% | 1.67% | 2.69%3 | 1.51% |
Portfolio Turnover Rate4 | 4%3 | 15% | 11% | 16% | 65% | 23% | 40% |
1 The fund’s fiscal year-end changed from December 31 to October 31, effective October 31, 2001.
2 Total returns do not reflect the 0.5% transaction fee on purchases (1.0% prior to April 1, 2000); the 2% fee assessed until March 23, 2005, on redemptions of shares purchased on or after June 27, 2003, and held for less than two months; the 0.5% fee on all other redemptions (1.0% prior to April 1, 2000); or the $10 annual account maintenance fee applied on balances under $10,000.
3 Annualized.
4 Excludes the value of portfolio securities received or delivered as a result of in-kind purchases or redemptions of the fund’s capital shares, including VIPER Creation Units.
74
| | | | Emerging Markets Stock Index Fund |
| | | | | | | |
Institutional Shares | | | | | | | |
| Six Months | | | | | | |
| Ended | | | | | Jan. 1 to | June 222 |
For a Share Outstanding | Apr. 30, | Year Ended October 31, | Oct. 31, to, | Dec. 31 |
Throughout Each Period | 2006 | 2005 | 2004 | 2003 | 2002 | 20011 | 2000 |
Net Asset Value, | | | | | | | |
Beginning of Period | $16.95 | $12.90 | $11.05 | $7.49 | $7.29 | $8.84 | $11.16 |
Investment Operations | | | | | | | |
Net Investment Income | .180 | .344 | .287 | .183 | .165 | .200 | .021 |
Net Realized and Unrealized | | | | | | | |
Gain (Loss) on Investments | 5.982 | 3.982 | 1.749 | 3.512 | .246 | (1.739) | (2.126) |
Total from Investment | | | | | | | |
Operations | 6.162 | 4.326 | 2.036 | 3.695 | .411 | (1.539) | (2.105) |
Distributions | | | | | | | |
Dividends from | | | | | | | |
Net Investment Income | (.342) | (.276) | (.186) | (.135) | (.211) | (.011) | (.215) |
Distributions from | | | | | | | |
Realized Capital Gains | — | — | — | — | — | — | — |
Total Distributions | (.342) | (.276) | (.186) | (.135) | (.211) | (.011) | (.215) |
Net Asset Value, | | | | | | | |
End of Period | $22.77 | $16.95 | $12.90 | $11.05 | $7.49 | $7.29 | $ 8.84 |
| | | | | | | |
Total Return3 | 36.74% | 33.92% | 18.64% | 50.06% | 5.40% | –17.42% | –18.86% |
| | | | | | | |
Ratios/Supplemental Data | | | | | | | |
Net Assets, | | | | | | | |
End of Period (Millions) | $651 | $468 | $245 | $137 | $76 | $65 | $19 |
Ratio of Total Expenses to | | | | | | | |
Average Net Assets | 0.25%4 | 0.25% | 0.33% | 0.38% | 0.41% | 0.45%4 | 0.45%4 |
Ratio of Net Investment | | | | | | | |
Income to Average | | | | | | | |
Net Assets | 1.94%4 | 2.64% | 2.61% | 2.41% | 1.85% | 2.75%4 | 1.34%4 |
Portfolio Turnover Rate5 | 4%4 | 15% | 11% | 16% | 65% | 23% | 40% |
1 The fund’s fiscal year-end changed from December 31 to October 31, effective October 31, 2001.
2 Inception.
3 Total returns do not reflect the 0.5% transaction fee on purchases; the 2% fee assessed until March 23, 2005, on redemptions of shares purchased on or after June 27, 2003, and held for less than two months; or the 0.5% fee on all other redemptions.
4 Annualized.
5 Excludes the value of portfolio securities received or delivered as a result of in-kind purchases or redemptions of the fund’s capital shares, including VIPER Creation Units.
75
Emerging Markets Stock Index Fund | | |
| | |
| | |
VIPER Shares | | |
| Six Months | |
| Ended | March 41 |
| Apr. 30, | to Oct. 31, |
For a Share Outstanding Throughout Each Period | 2006 | 2005 |
Net Asset Value, Beginning of Period | $53.61 | $50.55 |
Investment Operations | | |
Net Investment Income | .494 | .87 |
Net Realized and Unrealized Gain (Loss) on Investments | 18.973 | 2.19 |
Total from Investment Operations | 19.467 | 3.06 |
Distributions | | |
Dividends from Net Investment Income | (1.077) | — |
Distributions from Realized Capital Gains | — | — |
Total Distributions | (1.077) | — |
Net Asset Value, End of Period | $72.00 | $53.61 |
| | |
Total Return | 36.71% | 6.05% |
| | |
Ratios/Supplemental Data | | |
Net Assets, End of Period (Millions) | $1,267 | $375 |
Ratio of Total Expenses to Average Net Assets | 0.30%2 | 0.30%2 |
Ratio of Net Investment Income to Average Net Assets | 1.89%2 | 2.59%2 |
Portfolio Turnover Rate3 | 4%2 | 15% |
1 Inception.
2 Annualized.
3 Excludes the value of portfolio securities received or delivered as a result of in-kind purchases or redemptions of the fund’s capital shares, including VIPER Creation Units.
See accompanying Notes, which are an integral part of the Financial Statements.
76
Emerging Markets Stock Index Fund
Notes to Financial Statements
Vanguard Emerging Markets Stock Index Fund is registered under the Investment Company Act of 1940 as an open-end investment company, or mutual fund. The fund files reports with the SEC under the company name Vanguard International Equity Index Funds. The fund invests in securities of foreign issuers, which may subject it to investment risks not normally associated with investing in securities of U.S. corporations. The fund offers three classes of shares: Investor Shares, Institutional Shares, and VIPER Shares. Investor Shares are available to any investor who meets the fund’s minimum purchase requirements. Institutional Shares are designed for investors who meet certain administrative and servicing criteria and invest a minimum of $5 million. VIPER Shares are listed for trading on the American Stock Exchange; they can be purchased and sold through a broker.
A. The following significant accounting policies conform to generally accepted accounting principles for U.S. mutual funds. The fund consistently follows such policies in preparing its financial statements.
1. Security Valuation: Securities are valued as of the close of trading on the New York Stock Exchange (generally 4:00 p.m., Eastern time) on the valuation date. Equity securities are valued at the latest quoted sales prices or official closing prices taken from the primary market in which each security trades; such securities not traded on the valuation date are valued at the mean of the latest quoted bid and asked prices. Securities for which market quotations are not readily available, or whose values have been affected by events occurring before the fund’s pricing time but after the close of the securities’ primary markets, are valued at their fair values calculated according to procedures adopted by the board of trustees. These procedures include obtaining quotations from an independent pricing service, monitoring news to identify significant market- or security-specific events, and evaluating changes in the values of foreign market proxies (for example, ADRs, futures contracts, or exchange-traded funds), between the time the foreign markets close and the fund’s pricing time. When fair-value pricing is employed, the prices of securities used by a fund to calculate its net asset value may differ from quoted or published prices for the same securities. Investments in Vanguard Market Liquidity Fund are valued at that fund’s net asset value.
2. Foreign Currency: Securities and other assets and liabilities denominated in foreign currencies are translated into U.S. dollars at the exchange rates on the valuation date as employed by Morgan Stanley Capital International (MSCI) in the calculation of its indexes. As part of the fund’s fair-value procedures, exchange rates may be adjusted if they change significantly before the fund’s pricing time but after the time at which the MSCI rates are determined (generally 11:00 a.m., Eastern time).
Realized gains (losses) and unrealized appreciation (depreciation) on investment securities include the effects of changes in exchange rates since the securities were purchased, combined with the effects of changes in security prices. Fluctuations in the value of other assets and liabilities resulting from changes in exchange rates are recorded as unrealized foreign currency gains (losses) until the asset or liability is settled in cash, when they are recorded as realized foreign currency gains (losses).
3. Swap Contracts: The fund has entered into equity swap contracts to earn the total return on selected stocks in the fund’s target index, when investing through a swap provides a return advantage over buying the individual stocks. Under the terms of each swap, the fund receives the total return (either receiving the increase or paying the decrease) on a reference stock, applied to a notional amount that is the value of a designated number of shares of the stock at the beginning of the swap. The fund agrees to pay the counterparty a floating rate that is reset periodically based on short-term interest rates, less a specified interest rate spread, applied to the notional amount. The primary risks associated with the swaps are that a counterparty will default on its obligation to pay net amounts due to the fund, or that the fund will incur fees in the event it terminates a swap prior to the scheduled termination date.
77
Emerging Markets Stock Index Fund
The notional amounts of swap contracts are not recorded in the financial statements. Swaps are valued daily and the change in value is recorded as unrealized appreciation (depreciation) until the termination of the swap, at which time realized gain (loss) is recorded.
4. Federal Income Taxes: The fund intends to continue to qualify as a regulated investment company and distribute all of its taxable income. Accordingly, no provision for federal income taxes is required in the financial statements.
5. Distributions: Distributions to shareholders are recorded on the ex-dividend date.
6. Security Lending: The fund may lend its securities to qualified institutional borrowers to earn additional income. Security loans are required to be secured at all times by collateral at least equal to the market value of securities loaned. The fund invests cash collateral received in Vanguard Market Liquidity Fund, and records a liability for the return of the collateral, during the period the securities are on loan. Security lending income represents the income earned on investing cash collateral, less expenses associated with the loan.
7. Other: Dividend income is recorded on the ex-dividend date. Interest income includes income distributions received from Vanguard Market Liquidity Fund and is accrued daily. Security transactions are accounted for on the date securities are bought or sold. Costs used to determine realized gains (losses) on the sale of investment securities are those of the specific securities sold. Fees assessed on capital share transactions are credited to paid-in capital.
Each class of shares has equal rights as to assets and earnings, except that each class separately bears certain class-specific expenses related to maintenance of shareholder accounts (included in Management and Administrative expenses) and shareholder reporting. Marketing and distribution expenses are allocated to each class of shares based on a method approved by the board of trustees. Income, other non-class-specific expenses, and gains and losses on investments are allocated to each class of shares based on its relative net assets.
B. The Vanguard Group furnishes at cost investment advisory, corporate management, administrative, marketing, and distribution services. The costs of such services are allocated to the fund under methods approved by the board of trustees. The fund has committed to provide up to 0.40% of its net assets in capital contributions to Vanguard. At April 30, 2006, the fund had contributed capital of $1,014,000 to Vanguard (included in Other Assets), representing 0.01% of the fund’s net assets and 1.01% of Vanguard’s capitalization. The fund’s trustees and officers are also directors and officers of Vanguard.
C. The fund’s custodian bank has agreed to reduce its fees when the fund maintains cash on deposit in the non-interest-bearing custody account. For the six months ended April 30, 2006, custodian fee offset arrangements reduced the fund’s expenses by $85,000.
D. Distributions are determined on a tax basis and may differ from net investment income and realized capital gains for financial reporting purposes. Differences may be permanent or temporary. Permanent differences are reclassified among capital accounts in the financial statements to reflect their tax character. Temporary differences arise when certain items of income, expense, gain, or loss are recognized in different periods for financial statement and tax purposes; these differences will reverse at some time in the future. Differences in classification may also result from the treatment of short-term gains as ordinary income for tax purposes.
78
Emerging Markets Stock Index Fund
During the six months ended April 30, 2006, the fund realized $576,000 of net capital losses resulting from in-kind redemptions—in which shareholders exchanged fund shares for securities held by the fund rather than for cash. Because such losses are not taxable to the fund, they have been reclassified from accumulated net realized losses to paid-in capital.
During the six months ended April 30, 2006, the fund realized net foreign currency losses of $1,076,000, which decreased distributable net income for tax purposes; accordingly such losses have been reclassified from accumulated net realized losses to undistributed net investment income.
The fund’s realized gains (losses) for the six months ended April 30, 2006, include realized losses on swaps of $105,000 and taxes paid on realized capital gains on Indian securities of $225,000, which are treated as decreases to taxable income; accordingly these amounts have been reclassified from accumulated net realized losses to undistributed income.
Certain of the fund’s investments are in securities considered to be “passive foreign investment companies,” for which any unrealized appreciation and/or realized gains are required to be included in distributable net income for tax purposes. Unrealized appreciation through October 31, 2005, on the fund’s passive foreign investment company holdings at April 30, 2006, was $1,565,000, which has been distributed and is reflected in the balance of undistributed net investment income.
The fund’s tax-basis capital gains and losses are determined only at the end of each fiscal year. For tax purposes, at October 31, 2005, the fund had available realized losses of $173,689,000 to offset future net capital gains of $73,850,000 through October 31, 2007, $64,992,000 through October 31, 2010, $12,244,000 through October 31, 2011, and $22,603,000 through October 31, 2012. The fund will use these capital losses to offset net taxable capital gains, if any, realized during the year ending October 31, 2006; should the fund realize net capital losses for the year, the losses will be added to the loss carryforward balances above.
At April 30, 2006, net unrealized appreciation of investment securities for tax purposes was $3,687,733,000, consisting of unrealized gains of $3,774,485,000 on securities that had risen in value since their purchase and $86,752,000 in unrealized losses on securities that had fallen in value since their purchase.
At April 30, 2006, the fund had the following open swap contracts with Citigroup Global Markets as counterparty:
| | | Floating | | Unrealized |
| | Notional | Interest Rate | Market | Appreciation |
| Termination | Amount | Received | Value | (Depreciation) |
Country/Reference Entity | Date | ($000) | (Paid)1 | ($000) | ($000) |
Taiwan | | | | | |
Siliconware Precision | | | | | |
Industries Co. | 8/14/06 | 3,040 | (1.41%) | 4,367 | 1,327 |
Chunghwa Picture Tubes, Ltd. | 8/14/06 | 4,009 | (0.91%) | 2,954 | (1,055) |
HannStar Display Corp. | 8/14/06 | 953 | 0.09% | 604 | (349) |
Taiwan Cement Corp. | 11/20/06 | 1,224 | (1.16%) | 1,567 | 343 |
Taiwan Cement Corp. | 11/20/06 | 1,478 | (1.16%) | 1,935 | 457 |
Lite-On Technology Corp. | 11/27/06 | 4,747 | (2.41%) | 7,047 | 2,300 |
AU Optronics Corp. | 11/28/06 | 4,951 | (1.41%) | 6,885 | 1,934 |
| | | | | 4,957 |
1 Based on one-month London InterBank Offered Rate (LIBOR). Each contract provides for the payment of interest based on LIBOR less a fixed interest rate spread. If the spread is greater than LIBOR, the result is net interest received by the fund.
79
Emerging Markets Stock Index Fund
E. During the six months ended April 30, 2006, the fund purchased $2,461,412,000 of investment securities and sold $166,618,000 of investment securities, other than temporary cash investments.
F. The market value of securities on loan to broker/dealers at April 30, 2006, was $46,451,000, for which the fund received cash collateral of $47,642,000.
G. Capital share transactions for each class of shares were:
| Six Months Ended | | Year Ended |
| April 30, 2006 | | October 31, 2005 |
| Amount | Shares | | Amount | Shares |
| ($000) | (000) | | ($000) | (000) |
Investor Shares | | | | | |
Issued | 1,933,085 | 94,442 | | 1,871,867 | 120,102 |
Issued in Lieu of Cash Distributions | 89,932 | 4,718 | | 49,567 | 3,457 |
Redeemed1 | (384,061) | (18,804) | | (459,870) | (30,082) |
Net Increase (Decrease)—Investor Shares | 1,638,956 | 80,356 | | 1,461,564 | 93,477 |
Institutional Shares | | | | | |
Issued | 53,552 | 2,568 | | 183,235 | 11,719 |
Issued in Lieu of Cash Distributions | 7,301 | 382 | | 3,532 | 246 |
Redeemed1 | (40,730) | (2,018) | | (51,953) | (3,311) |
Net Increase (Decrease)—Institutional Shares | 20,123 | 932 | | 134,814 | 8,654 |
VIPER Shares | | | | | |
Issued | 701,803 | 10,811 | | 367,775 | 7,191 |
Issued in Lieu of Cash Distributions | — | — | | — | — |
Redeemed | (13,259) | (200) | | (9,798) | (200) |
Net Increase (Decrease)—VIPER Shares | 688,544 | 10,611 | | 357,977 | 6,991 |
1 Net of redemption fees of $1,931,000 and $1,927,000 (fund totals).
80
Total International Stock Index Fund
Fund Profile
As of April 30, 2006
Portfolio Characteristics | |
| Fund |
Expense Ratio | 0.00% |
Average Weighted Expense Ratio1 | 0.29% |
Sector Diversification (% of portfolio) | |
| | Target | Broad |
| Fund2 | Index3 | Index4 |
Consumer Discretionary | 12% | 11% | 11% |
Consumer Staples | 7 | 8 | 7 |
Energy | 9 | 8 | 10 |
Financials | 27 | 28 | 28 |
Health Care | 7 | 7 | 7 |
Industrials | 10 | 10 | 10 |
Information Technology | 8 | 8 | 7 |
Materials | 9 | 9 | 9 |
Telecommunication Services | 6 | 6 | 6 |
Utilities | 5 | 5 | 5 |
Volatility Measures | | | |
| | Target | | Broad |
| Fund | Index3 | Fund | Index4 |
R-Squared | 0.99 | 1.00 | 0.99 | 1.00 |
Beta | 1.01 | 1.00 | 1.00 | 1.00 |
Allocation to Underlying Vanguard Funds | |
| |
European Stock Index Fund | 57.5% |
Pacific Stock Index Fund | 28.1% |
Emerging Markets Stock Index Fund | 14.4% |
Total | 100.0% |
Country Diversification (% of portfolio) | |
| | Target |
| Fund2 | Index3 |
Europe | | |
United Kingdom | 20% | 20% |
France | 8 | 8 |
Germany | 6 | 6 |
Switzerland | 6 | 6 |
Netherlands | 4 | 3 |
Italy | 3 | 3 |
Spain | 3 | 3 |
Sweden | 2 | 2 |
Belgium | 1 | 1 |
Denmark | 1 | 1 |
Finland | 1 | 1 |
Greece | 1 | 1 |
Ireland | 1 | 1 |
Norway | 1 | 1 |
Subtotal | 58% | 57% |
Pacific | | |
Japan | 21% | 21% |
Australia | 5 | 5 |
Hong Kong | 1 | 1 |
Singapore | 1 | 1 |
Subtotal | 28% | 28% |
Emerging Markets | | |
South Korea | 3% | 3% |
Brazil | 2 | 2 |
South Africa | 2 | 2 |
Taiwan | 2 | 2 |
China | 1 | 2 |
India | 1 | 1 |
Israel | 1 | 1 |
Mexico | 1 | 1 |
Turkey | 1 | 1 |
Subtotal | 14% | 15% |
1 For underlying funds; annualized.
2 Reflects holdings of underlying funds.
3 Total International Composite Index.
4 MSCI All Country World Index ex USA.
See page 108 for a glossary of investment terms.
81
Total International Stock Index Fund
Performance Summary
All of the returns in this report represent past performance, which is not a guarantee of future results that may be achieved by the fund. (Current performance may be lower or higher than the performance data cited. For performance data current to the most recent month-end, visit our website at www.vanguard.com.) Note, too, that both investment returns and principal value can fluctuate widely, so an investor’s shares, when sold, could be worth more or less than their original cost. The returns shown do not reflect taxes that a shareholder would pay on fund distributions or on the sale of fund shares.
Fiscal-Year Total Returns (%): April 29, 1996–April 30, 2006

Average Annual Total Returns: Periods Ended March 31, 2006
This table presents average annual total returns through the latest calendar quarter—rather than through the end of the fiscal period. Securities and Exchange Commission rules require that we provide this information.
| Inception Date | One Year | Five Years | Ten Years |
Total International Stock Index Fund3 | 4/29/1996 | 26.61% | 10.90% | 6.34% |
1 Six months ended April 30, 2006.
2 Consists of the MSCI Europe Index (57%), the MSCI Pacific Index (28%), and the Select Emerging Markets Index (15%).
3 Total return figures do not reflect the 0.5% transaction fee on purchases through March 31, 2000; the 2% fee assessed on redemptions of shares purchased on or after June 27, 2003, and held for less than two months; or the $10 annual account maintenance fee applied on balances under $10,000.
Note: See Financial Highlights table on page 86 for dividend and capital gains information.
82
Total International Stock Index Fund
Financial Statements (unaudited)
Statement of Net Assets
As of April 30, 2006
The fund provides a complete list of its holdings four times in each fiscal year, at the quarter-ends. For the second and fourth fiscal quarters, the lists appear in the fund’s semiannual and annual reports to shareholders. For the first and third fiscal quarters, the fund files the lists with the Securities and Exchange Commission on Form N-Q. Shareholders can look up the fund’s Forms N-Q on the SEC’s website at www.sec.gov. Forms N-Q may also be reviewed and copied at the SEC’s Public Reference Room (see the back cover of this report for further information).
| | Market |
| | Value• |
| Shares | ($000) |
Investment Companies (100%) | | |
International Stock Funds (100%) | | |
Vanguard European Stock Index Fund Investor Shares | 286,337,691 | 9,222,937 |
Vanguard Pacific Stock Index Fund Investor Shares | 358,675,492 | 4,512,138 |
Vanguard Emerging Markets Stock Index Fund Investor Shares | 102,101,523 | 2,319,747 |
| | |
Money Market Fund (0%) | | |
1 Vanguard Market Liquidity Fund, 4.771% | 7,017,596 | 7,018 |
| | |
Total Investment Companies (Cost $11,274,522) | | 16,061,840 |
Other Assets and Liabilities (0%) | | |
Other Assets | | 39,213 |
Liabilities | | (39,199) |
| | 14 |
Net Assets (100%) | | |
Applicable to 977,927,505 outstanding $.001 par value shares of beneficial | | |
interest (unlimited authorization) | | 16,061,854 |
Net Asset Value Per Share | | $16.42 |
| | |
At April 30, 2006, net assets consisted of:2 | | |
| ($000) | Share |
Paid-in Capital | 11,322,233 | $11.57 |
Undistributed Net Investment Income | 2,820 | — |
Accumulated Net Realized Losses | (50,517) | (.05) |
Unrealized Appreciation | 4,787,318 | 4.90 |
Net Assets | 16,061,854 | $16.42 |
• See Note A in Notes to Financial Statements.
1 Affiliated money market fund available only to Vanguard funds and certain trusts and accounts managed by Vanguard. Rate shown is the 7-day yield.
2 See Note C in Notes to Financial Statements for the tax-basis components of net assets.
83
Total International Stock Index Fund | |
| |
| |
| |
Statement of Operations | |
| |
| Six Months Ended |
| April 30, 2006 |
| ($000) |
Investment Income | |
Income | |
Income Distributions Received | 256,657 |
Net Investment Income—Note B | 256,657 |
Realized Net Gain (Loss) | |
Capital Gain Distributions Received | — |
Investment Securities Sold | 1,208 |
Realized Net Gain (Loss) | 1,208 |
Change in Unrealized Appreciation of Investment Securities | 2,679,152 |
Net Increase (Decrease) in Net Assets Resulting from Operations | 2,937,017 |
84
Total International Stock Index Fund |
| | |
| | |
| | |
Statement of Changes in Net Assets | | |
| | |
| Six Months Ended | Year Ended |
| Apr. 30, | Oct. 31, |
| 2006 | 2005 |
| ($000) | ($000) |
Increase (Decrease) in Net Assets | | |
Operations | | |
Net Investment Income | 256,657 | 168,316 |
Realized Net Gain (Loss) | 1,208 | (471) |
Change in Unrealized Appreciation (Depreciation) | 2,679,152 | 1,438,347 |
Net Increase (Decrease) in Net Assets Resulting from Operations | 2,937,017 | 1,606,192 |
Distributions | | |
Net Investment Income | (254,606) | (168,772) |
Realized Capital Gain | — | — |
Total Distributions | (254,606) | (168,772) |
Capital Share Transactions—Note E | | |
Issued | 2,713,116 | 3,624,696 |
Issued in Lieu of Cash Distributions | 232,227 | 154,147 |
Redeemed1 | (896,828) | (1,201,975) |
Net Increase (Decrease) from Capital Share Transactions | 2,048,515 | 2,576,868 |
Total Increase (Decrease) | 4,730,926 | 4,014,288 |
Net Assets | | |
Beginning of Period | 11,330,928 | 7,316,640 |
End of Period2 | 16,061,854 | 11,330,928 |
1 The fund collected redemption fees of $181,000 and $266,000, which were reallocated proportionately to the funds in which it invests.
2 Net Assets—End of Period includes undistributed net investment income of $2,820,000 and $769,000.
85
Total International Stock Index Fund | | | | | | |
| | | | | | | |
| | | | | | | |
| | | | | | | |
Financial Highlights | | | | | | |
| | | | | | | |
| Six Months | | | | | | |
| Ended | | | | | Jan. 1 to | Year Ended |
For a Share Outstanding | Apr. 30, | Year Ended October 31, | Oct. 30, | Dec. 31, |
Throughout Each Period | 2006 | 2005 | 2004 | 2003 | 2002 | 20011 | 2000 |
Net Asset Value, | | | | | | | |
Beginning of Period | $13.49 | $11.48 | $9.84 | $7.79 | $8.99 | $11.83 | $14.31 |
Investment Operations | | | | | | | |
Net Investment Income | .294 | .255 | .19 | .157 | .165 | — | .20 |
Capital Gain Distributions | | | | | | | |
Received | — | — | — | — | — | — | .01 |
Net Realized and Unrealized | | | | | | | |
Gain (Loss) on Investments | 2.930 | 2.010 | 1.64 | 2.050 | (1.200) | (2.84) | (2.44) |
Total from Investment | | | | | | | |
Operations | 3.224 | 2.265 | 1.83 | 2.207 | (1.035) | (2.84) | (2.23) |
Distributions | | | | | | | |
Dividends from Net | | | | | | | |
Investment Income | (.294) | (.255) | (.19) | (.157) | (.165) | — | (.20) |
Distributions from | | | | | | | |
Realized Capital Gains | — | — | — | — | — | — | (.05) |
Total Distributions | (.294) | (.255) | (.19) | (.157) | (.165) | — | (.25) |
Net Asset Value, | | | | | | | |
End of Period | $16.42 | $13.49 | $11.48 | $9.84 | $7.79 | $8.99 | $11.83 |
| | | | | | | |
Total Return2 | 24.21% | 19.91% | 18.80% | 28.94% | –11.80% | –24.01% | –15.61% |
| | | | | | | |
Ratios/Supplemental Data | | | | | | | |
Net Assets, | | | | | | | |
End of Period (Millions) | $16,062 | $11,331 | $7,317 | $4,538 | $2,884 | $2,732 | $2,920 |
Ratio of Total Expenses to | | | | | | | |
Average Net Assets—Note B | 0%3 | 0% | 0% | 0% | 0% | 0% | 0% |
Ratio of Net Investment | | | | | | | |
Income to Average | | | | | | | |
Net Assets | 1.89% | 1.76% | 1.54% | 1.75% | 1.70% | 0.05%4 | 1.68% |
Portfolio Turnover Rate | 1%4 | 3% | 3% | 2% | 5% | 2% | 3% |
1 The fund’s fiscal year-end changed from December 31 to October 31, effective October 31, 2001.
2 Total returns do not reflect the 0.5% transaction fee on purchases through March 31, 2000; the 2% fee assessed on redemptions of shares purchased on or after June 27, 2003, and held for less than two months; or the $10 annual account maintenance fee applied on balances under $10,000.
3 The average weighted annualized expense ratio of the underlying funds was 0.29%.
4 Annualized.
See accompanying Notes, which are an integral part of the Financial Statements.
86
Total International Stock Index Fund
Notes to Financial Statements
Vanguard Total International Stock Index Fund is registered under the Investment Company Act of 1940 as an open-end investment company, or mutual fund. The fund files reports with the SEC under the company name Vanguard STAR® Funds. The fund seeks to match the performance of its target index by investing in the European, Pacific, and Emerging Markets Stock Index Funds. The fund’s indirect investments in foreign securities involve investment risks not normally associated with investing in securities of U.S. corporations.
A. The following significant accounting policies conform to generally accepted accounting principles for U.S. mutual funds. The fund consistently follows such policies in preparing its financial statements.
1. Valuation: Investments are valued at the net asset value of each underlying Vanguard fund determined as of the close of trading on the New York Stock Exchange (generally 4:00 p.m., Eastern time) on the valuation date.
2. Federal Income Taxes: The fund intends to continue to qualify as a regulated investment company and distribute all of its taxable income. Accordingly, no provision for federal income taxes is required in the financial statements.
3. Distributions: Distributions to shareholders are recorded on the ex-dividend date.
4. Other: Income and capital gain distributions received are recorded on the ex-dividend date. Security transactions are accounted for on the date securities are bought or sold. Costs used to determine realized gains (losses) on the sale of investment securities are those of the specific securities sold.
B. Under a service agreement, The Vanguard Group furnishes corporate management, administrative, marketing, and distribution services to the fund. The service agreement provides that Vanguard will reimburse the fund’s expenses to the extent of savings in administrative and marketing costs realized by Vanguard in the operation of the fund. Accordingly, all expenses incurred by the fund during the six months ended April 30, 2006, were reimbursed by Vanguard. The fund’s trustees and officers are also directors and officers of Vanguard.
C. Distributions are determined on a tax basis and may differ from net investment income and realized capital gains for financial reporting purposes. Differences may be permanent or temporary. Permanent differences are reclassified among capital accounts in the financial statements to reflect their tax character. Temporary differences arise when certain items of income, expense, gain, or loss are recognized in different periods for financial statement and tax purposes; these differences will reverse at some time in the future. Differences in classification may also result from the treatment of short-term gains as ordinary income for tax purposes.
The fund’s tax-basis capital gains and losses are determined only at the end of each fiscal year. For tax purposes, at October 31, 2005, the fund had available realized losses of $50,245,000 to offset future net capital gains of $6,375,000 through October 31, 2009, and $43,870,000 through October 31, 2010. The fund will use these capital losses to offset net taxable capital gains, if any, realized during the year ending October 31, 2006; should the fund realize net capital losses for the year, the losses will be added to the loss carryforward balances above.
At April 30, 2006, net unrealized appreciation of investment securities for tax purposes was $4,787,318,000, consisting entirely of unrealized gains on securities that had risen in value since their purchase.
87
Total International Stock Index Fund
D. During the six months ended April 30, 2006, the fund purchased $2,119,953,000 of investment securities and sold $75,929,000 of investment securities, other than temporary cash investments.
E. Capital shares issued and redeemed were:
| Six Months Ended | | Year Ended |
| April 30, 2006 | | October 31, 2005 |
| Shares | | Shares |
| (000) | | (000) |
Issued | 181,466 | | 284,989 |
Issued in Lieu of Cash Distributions | 16,161 | | 12,332 |
Redeemed | (59,856) | | (94,276) |
Net Increase (Decrease) in Shares Outstanding | 137,771 | | 203,045 |
88
Developed Markets Index Fund
Fund Profile
As of April 30, 2006
Portfolio Characteristics | |
| Fund |
Expense Ratio | 0.00% |
Average Weighted Expense Ratio1 | 0.27% |
Sector Diversification (% of portfolio) | |
| | Target | Broad |
| Fund2 | Index3 | Index4 |
Consumer Discretionary | 12% | 12% | 11% |
Consumer Staples | 8 | 8 | 7 |
Energy | 8 | 8 | 10 |
Financials | 29 | 29 | 28 |
Health Care | 8 | 8 | 7 |
Industrials | 11 | 11 | 10 |
Information Technology | 6 | 6 | 7 |
Materials | 8 | 8 | 9 |
Telecommunication Services | 5 | 5 | 6 |
Utilities | 5 | 5 | 5 |
Volatility Measures | | | |
| | Target | | Broad |
| Fund | Index3 | Fund | Index4 |
R-Squared | 0.99 | 1.00 | 0.97 | 1.00 |
Beta | 1.01 | 1.00 | 0.94 | 1.00 |
Allocation to Underlying Vanguard Funds |
| |
European Stock Index Fund | 67.1% |
Pacific Stock Index Fund | 32.9% |
Total | 100.0% |
Country Diversification (% of portfolio) | |
| | Target |
| Fund2 | Index3 |
Japan | 25% | 25% |
United Kingdom | 23 | 24 |
France | 9 | 10 |
Germany | 7 | 7 |
Switzerland | 7 | 7 |
Australia | 5 | 5 |
Netherlands | 5 | 3 |
Spain | 4 | 4 |
Italy | 4 | 4 |
Hong Kong | 2 | 2 |
Sweden | 2 | 2 |
Belgium | 1 | 1 |
Denmark | 1 | 1 |
Finland | 1 | 1 |
Greece | 1 | 1 |
Ireland | 1 | 1 |
Norway | 1 | 1 |
Singapore | 1 | 1 |
1 For underlying funds; annualized.
2 Reflects holdings of underlying funds.
3 MSCI EAFE Index.
4 MSCI All Country World Index ex USA.
See page 108 for a glossary of investment terms.
89
Developed Markets Index Fund
Performance Summary
All of the returns in this report represent past performance, which is not a guarantee of future results that may be achieved by the fund. (Current performance may be lower or higher than the performance data cited. For performance data current to the most recent month-end, visit our website at www.vanguard.com.) Note, too, that both investment returns and principal value can fluctuate widely, so an investor’s shares, when sold, could be worth more or less than their original cost. The returns shown do not reflect taxes that a shareholder would pay on fund distributions or on the sale of fund shares.
Fiscal-Year Total Returns (%): May 8, 2000–April 30, 2006

Average Annual Total Returns: Periods Ended March 31, 2006
This table presents average annual total returns through the latest calendar quarter—rather than through the end of the fiscal period. Securities and Exchange Commission rules require that we provide this information.
| | | | Since |
| Inception Date | One Year | Five Years | Inception |
Developed Markets Index Fund2 | 5/8/2000 | 24.16% | 9.49% | 3.88% |
1 Six months ended April 30, 2006.
2 Total return figures do not reflect the 2% fee assessed on redemptions of shares purchased on or after June 27, 2003, and held for less than two months or the $10 annual account maintenance fee applied on balances under $10,000.
Note: See Financial Highlights table on page 94 for dividend and capital gains information.
90
Developed Markets Index Fund
Financial Statements (unaudited)
Statement of Net Assets
As of April 30, 2006
The fund provides a complete list of its holdings four times in each fiscal year, at the quarter-ends. For the second and fourth fiscal quarters, the lists appear in the fund’s semiannual and annual reports to shareholders. For the first and third fiscal quarters, the fund files the lists with the Securities and Exchange Commission on Form N-Q. Shareholders can look up the fund’s Forms N-Q on the SEC’s website at www.sec.gov. Forms N-Q may also be reviewed and copied at the SEC’s Public Reference Room (see the back cover of this report for further information).
| | Market |
| | Value• |
| Shares | ($000) |
Investment Companies (99.9%) | | |
Vanguard European Stock Index Fund Investor Shares | 45,150,814 | 1,454,307 |
Vanguard Pacific Stock Index Fund Investor Shares | 56,557,772 | 711,497 |
Total Investment Companies (Cost $1,494,529) | | 2,165,804 |
| | |
Other Assets and Liabilities (0.1%) | | |
Other Assets | | 8,669 |
Liabilities | | (7,525) |
| | 1,144 |
Net Assets (100%) | | |
Applicable to 185,287,281 outstanding $.001 par value shares of beneficial interest | |
(unlimited authorization) | | 2,166,948 |
Net Asset Value Per Share | | $11.70 |
| | |
| | |
| | |
At April 30, 2006, net assets consisted of:1 | | |
| Amount | Per |
| ($000) | Share |
Paid-in Capital | 1,495,047 | $8.08 |
Undistributed Net Investment Income | 200 | — |
Accumulated Net Realized Gains | 426 | — |
Unrealized Appreciation | 671,275 | 3.62 |
Net Assets | 2,166,948 | $11.70 |
• See Note A in Notes to Financial Statements.
1 See Note C in Notes to Financial Statements for the tax-basis components of net assets.
91
Developed Markets Index Fund | |
| |
| |
| |
Statement of Operations | |
| |
| Six Months Ended |
| April 30, 2006 |
| ($000) |
Investment Income | |
Income | |
Income Distributions Received | 37,581 |
Net Investment Income—Note B | 37,581 |
Realized Net Gain (Loss) | |
Capital Gain Distributions Received | — |
Investment Securities Sold | 1,030 |
Realized Net Gain (Loss) | 1,030 |
Change in Unrealized Appreciation (Depreciation) of Investment Securities | 339,862 |
Net Increase (Decrease) in Net Assets Resulting from Operations | 378,473 |
92
| Developed Markets Index Fund |
| | |
| | |
| | |
Statement of Changes in Net Assets | | |
| | |
| Six Months Ended | Year Ended |
| Apr. 30, | Oct. 31, |
| 2006 | 2005 |
| ($000) | ($000) |
Increase (Decrease) in Net Assets | | |
Operations | | |
Net Investment Income | 37,581 | 24,039 |
Realized Net Gain (Loss) | 1,030 | (117) |
Change in Unrealized Appreciation (Depreciation) | 339,862 | 186,905 |
Net Increase (Decrease) in Net Assets Resulting from Operations | 378,473 | 210,827 |
Distributions | | |
Net Investment Income | (37,455) | (24,120) |
Realized Capital Gain | — | — |
Total Distributions | (37,455) | (24,120) |
Capital Share Transactions—Note E | | |
Issued | 400,308 | 701,583 |
Issued in Lieu of Cash Distributions | 31,784 | 20,916 |
Redeemed1 | (229,172) | (323,823) |
Net Increase (Decrease) from Capital Share Transactions | 202,920 | 398,676 |
Total Increase (Decrease) | 543,938 | 585,383 |
Net Assets | | |
Beginning of Period | 1,623,010 | 1,037,627 |
End of Period2 | 2,166,948 | 1,623,010 |
1 The fund collected redemption fees of $110,000 and $260,000, which were reallocated proportionately to the funds in which it invests.
2 Net Assets—End of Period includes undistributed net investment income of $200,000 and $74,000.
93
Developed Markets Index Fund | | | | | | |
| | | | | | | |
| | | | | | | |
| | | | | | | |
Financial Highlights | | | | | | |
| | | | | | | |
| | | | | | | |
| Six Months | | | | | Jan. 1 to | May 82 to |
For a Share Outstanding | Apr. 30, | Year Ended October 31, | Oct. 31, | Dec. 31, |
Throughout Each Period | 2006 | 2005 | 2004 | 2003 | 2002 | 20011 | 2000 |
Net Asset Value, | | | | | | | |
Beginning of Period | $9.75 | $8.43 | $7.22 | $5.80 | $6.83 | $9.07 | $10.00 |
Investment Operations | | | | | | | |
Net Investment Income | .219 | .19 | .143 | .116 | .12 | — | .15 |
Capital Gain | | | | | | | |
Distributions Received | — | — | — | — | — | — | — |
Net Realized and Unrealized | | | | | | | |
Gain (Loss) on Investments | 1.950 | 1.32 | 1.210 | 1.420 | (1.03) | (2.24) | (.93) |
Total from Investment | | | | | | | |
Operations | 2.169 | 1.51 | 1.353 | 1.536 | (.91) | (2.24) | (.78) |
Distributions | | | | | | | |
Dividends from Net | | | | | | | |
Investment Income | (.219) | (.19) | (.143) | (.116) | (.12) | — | (.15) |
Distributions from | | | | | | | |
Realized Capital Gains | — | — | — | — | — | — | — |
Total Distributions | (.219) | (.19) | (.143) | (.116) | (.12) | — | (.15) |
Net Asset Value, | | | | | | | |
End of Period | $11.70 | $9.75 | $8.43 | $7.22 | $5.80 | $6.83 | $9.07 |
| | | | | | | |
Total Return3 | 22.55% | 18.07% | 18.94% | 27.06% | –13.61% | –24.70% | –7.78% |
| | | | | | | |
Ratios/Supplemental Data | | | | | | | |
Net Assets, | | | | | | | |
End of Period (Millions) | $2,167 | $1,623 | $1,038 | $597 | $308 | $145 | $99 |
Ratio of Total Expenses to | | | | | | | |
Average Net Assets—Note B | 0%4 | 0% | 0% | 0% | 0% | 0% | 0% |
Ratio of Net Investment | | | | | | | |
Income to Average | | | | | | | |
Net Assets | 2.01% | 1.77% | 1.52% | 1.48% | 1.30% | 0.04%5 | 1.66%5 |
Portfolio Turnover Rate | 10%5 | 10% | 4% | 7% | 5% | 9% | 8% |
1 The fund���s fiscal year-end changed from December 31 to October 31, effective October 31, 2001.
2 Inception.
3 Total returns do not reflect the 2% fee assessed on redemptions of shares purchased on or after June 27, 2003, and held for less than two months, or the $10 annual account maintenance fee applied on balances under $10,000.
4 The average weighted annualized expense ratio of the underlying funds was 0.27%.
5 Annualized.
See accompanying Notes, which are an integral part of the Financial Statements.
94
Developed Markets Index Fund
Notes to Financial Statements
Vanguard Developed Markets Index Fund is registered under the Investment Company Act of 1940 as an open-end investment company, or mutual fund. The fund files reports with the SEC under the company name Vanguard STAR Funds. The fund seeks to match the performance of its target index by investing in the European and Pacific Stock Index Funds. The fund’s indirect investments in foreign securities involve investment risks not normally associated with investing in securities of U.S. corporations.
A. The following significant accounting policies conform to generally accepted accounting principles for U.S. mutual funds. The fund consistently follows such policies in preparing its financial statements.
1. Valuation: Investments are valued at the net asset value of each underlying Vanguard fund determined as of the close of trading on the New York Stock Exchange (generally 4:00 p.m. Eastern time) on the valuation date.
2. Federal Income Taxes: The fund intends to continue to qualify as a regulated investment company and distribute all of its taxable income. Accordingly, no provision for federal income taxes is required in the financial statements.
3. Distributions: Distributions to shareholders are recorded on the ex-dividend date.
4. Other: Income and capital gain distributions received are recorded on the ex-dividend date. Security transactions are accounted for on the date securities are bought or sold. Costs used to determine realized gains (losses) on the sale of investment securities are those of the specific securities sold.
B. Under a service agreement, The Vanguard Group furnishes corporate management, administrative, marketing, and distribution services to the fund. The service agreement provides that Vanguard will reimburse the fund’s expenses to the extent of savings in administrative and marketing costs realized by Vanguard in the operation of the fund. Accordingly, all expenses incurred by the fund during the six months ended April 30, 2006, were reimbursed by Vanguard. The fund’s trustees and officers are also directors and officers of Vanguard.
C. Distributions are determined on a tax basis and may differ from net investment income and realized capital gains for financial reporting purposes. Differences may be permanent or temporary. Permanent differences are reclassified among capital accounts in the financial statements to reflect their tax character. Temporary differences arise when certain items of income, expense, gain, or loss are recognized in different periods for financial statement and tax purposes; these differences will reverse at some time in the future. Differences in classification may also result from the treatment of short-term gains as ordinary income for tax purposes. The fund’s tax-basis capital gains and losses are determined only at the end of each fiscal year.
At April 30, 2006, net unrealized appreciation of investment securities for tax purposes was $671,275,000, consisting entirely of unrealized gains on securities that had risen in value since their purchase.
D. During the six months ended April 30, 2006, the fund purchased $292,490,000 of investment securities and sold $90,029,000 of investment securities, other than temporary cash investments.
95
E. Capital shares issued and redeemed were:
| Six Months Ended | | Year Ended |
| April 30, 2006 | | October 31, 2005 |
| Shares | | Shares |
| (000) | | (000) |
Issued | 37,345 | | 75,689 |
Issued in Lieu of Cash Distributions | 3,089 | | 2,291 |
Redeemed | (21,544) | | (34,735) |
Net Increase (Decrease) in Shares Outstanding | 18,890 | | 43,245 |
96
Institutional Developed Markets Index Fund
Fund Profile
As of April 30, 2006
Portfolio Characteristics | |
| Fund |
Expense Ratio | 0.00% |
Average Weighted Expense Ratio1 | 0.12% |
Sector Diversification (% of portfolio) | |
| | Target | Broad |
| Fund2 | Index3 | Index4 |
Consumer Discretionary | 12% | 12% | 11% |
Consumer Staples | 8 | 8 | 7 |
Energy | 8 | 8 | 10 |
Financials | 29 | 29 | 28 |
Health Care | 8 | 8 | 7 |
Industrials | 11 | 11 | 10 |
Information Technology | 6 | 6 | 7 |
Materials | 8 | 8 | 9 |
Telecommunication Services | 5 | 5 | 6 |
Utilities | 5 | 5 | 5 |
Volatility Measures | | | |
| | Target | | Broad |
| Fund | Index3 | Fund | Index4 |
R-Squared | 0.99 | 1.00 | 0.97 | 1.00 |
Beta | 1.01 | 1.00 | 0.95 | 1.00 |
Allocation to Underlying Vanguard Funds | |
| |
European Stock Index Fund | 67.1% |
Pacific Stock Index Fund | 32.9% |
Total | 100.0% |
Country Diversification (% of portfolio) | |
| | Target |
| Fund2 | Index3 |
Japan | 25% | 25% |
United Kingdom | 23 | 24 |
France | 9 | 10 |
Germany | 7 | 7 |
Switzerland | 7 | 7 |
Australia | 5 | 5 |
Netherlands | 5 | 3 |
Spain | 4 | 4 |
Italy | 4 | 4 |
Hong Kong | 2 | 2 |
Sweden | 2 | 2 |
Belgium | 1 | 1 |
Denmark | 1 | 1 |
Finland | 1 | 1 |
Greece | 1 | 1 |
Ireland | 1 | 1 |
Norway | 1 | 1 |
Singapore | 1 | 1 |
1 For underlying funds; annualized.
2 Reflects holdings of underlying funds.
3 MSCI EAFE Index.
4 MSCI All Country World Index ex USA.
See page 108 for a glossary of investment terms.
97
Institutional Developed Markets Index Fund
Performance Summary
All of the returns in this report represent past performance, which is not a guarantee of future results that may be achieved by the fund. (Current performance may be lower or higher than the performance data cited. For performance data current to the most recent month-end, visit our website at www.vanguard.com.) Note, too, that both investment returns and principal value can fluctuate widely, so an investor’s shares, when sold, could be worth more or less than their original cost. The returns shown do not reflect taxes that a shareholder would pay on fund distributions or on the sale of fund shares.
Fiscal-Year Total Returns (%): June 1, 2000–April 30, 2006

Average Annual Total Returns: Periods Ended March 31, 2006
This table presents average annual total returns through the latest calendar quarter—rather than through the end of the fiscal period. Securities and Exchange Commission rules require that we provide this information.
| | | | Since |
| Inception Date | One Year | Five Years | Inception |
Institutional Developed Markets | | | | |
Index Fund2 | 6/1/2000 | 24.29% | 9.60% | 3.90% |
1 Six months ended April 30, 2006.
2 Total return figures do not reflect the 2% fee assessed on redemptions of shares purchased on or after June 27, 2003, and held for less than two months.
Note: See Financial Highlights table on page 102 for dividend and capital gains information.
98
Institutional Developed Markets Index Fund
Financial Statements (unaudited)
Statement of Net Assets
As of April 30, 2006
The fund provides a complete list of its holdings four times in each fiscal year, at the quarter-ends. For the second and fourth fiscal quarters, the lists appear in the fund’s semiannual and annual reports to shareholders. For the first and third fiscal quarters, the fund files the lists with the Securities and Exchange Commission on Form N-Q. Shareholders can look up the fund’s Forms N-Q on the SEC’s website at www.sec.gov. Forms N-Q may also be reviewed and copied at the SEC’s Public Reference Room (see the back cover of this report for further information).
| | Market |
| | Value• |
| Shares | ($000) |
Investment Companies (100.1%) | | |
International Stock Funds (99.9%) | | |
Vanguard European Stock Index Fund Institutional Shares | 52,914,973 | 1,706,508 |
Vanguard Pacific Stock Index Fund Institutional Shares | 66,266,967 | 834,963 |
| | |
Money Market Fund (0.2%) | | |
1 Vanguard Market Liquidity Fund, 4.771% | 3,730,679 | 3,731 |
| | |
Total Investment Companies (Cost $1,861,247) | | 2,545,202 |
Other Assets and Liabilities (–0.1%) | | |
Other Assets | | 3,402 |
Liabilities | | (5,205) |
| | (1,803) |
Net Assets (100%) | | |
Applicable to 219,395,065 outstanding $.001 par value shares of beneficial interest | |
(unlimited authorization) | | 2,543,399 |
Net Asset Value Per Share | | $11.59 |
| | |
| | |
| | |
At April 30, 2006, net assets consisted of:2 | | |
| Amount | Per |
| ($000) | Share |
Paid-in Capital | 1,867,830 | $8.51 |
Undistributed Net Investment Income | 502 | — |
Accumulated Net Realized Losses | (8,888) | (.04) |
Unrealized Appreciation | 683,955 | 3.12 |
Net Assets | 2,543,399 | $11.59 |
• See Note A in Notes to Financial Statements.
1 Affiliated money market fund available only to Vanguard funds and certain trusts and accounts managed by Vanguard. Rate shown is the 7-day yield.
2 See Note C in Notes to Financial Statements for the tax-basis components of net assets.
99
Institutional Developed Markets Index Fund | |
| |
| |
| |
Statement of Operations | |
| |
| Six Months Ended |
| April 30, 2006 |
| ($000) |
Investment Income | |
Income | |
Income Distributions Received | 42,285 |
Net Investment Income—Note B | 42,285 |
Realized Net Gain (Loss) | |
Capital Gain Distributions Received | — |
Investment Securities Sold | 1,090 |
Realized Net Gain (Loss) | 1,090 |
Change in Unrealized Appreciation (Depreciation) of Investment Securities | 378,026 |
Net Increase (Decrease) in Net Assets Resulting from Operations | 421,401 |
100
Institutional Developed Markets Index Fund |
| | |
| | |
| | |
Statement of Changes in Net Assets | | |
| | |
| Six Months Ended | Year Ended |
| Apr. 30, | Oct. 31, |
| 2006 | 2005 |
| ($000) | ($000) |
Increase (Decrease) in Net Assets | | |
Operations | | |
Net Investment Income | 42,285 | 25,345 |
Realized Net Gain (Loss) | 1,090 | (124) |
Change in Unrealized Appreciation (Depreciation) | 378,026 | 180,422 |
Net Increase (Decrease) in Net Assets Resulting from Operations | 421,401 | 205,643 |
Distributions | | |
Net Investment Income | (41,783) | (25,836) |
Realized Capital Gain | — | — |
Total Distributions | (41,783) | (25,836) |
Capital Share Transactions—Note E | | |
Issued | 594,952 | 760,509 |
Issued in Lieu of Cash Distributions | 29,979 | 19,681 |
Redeemed1 | (209,244) | (122,676) |
Net Increase (Decrease) from Capital Share Transactions | 415,687 | 657,514 |
Total Increase (Decrease) | 795,305 | 837,321 |
Net Assets | | |
Beginning of Period | 1,748,094 | 910,773 |
End of Period2 | 2,543,399 | 1,748,094 |
1 The fund collected redemption fees of $66,000 and $10,000, which were reallocated proportionately to the funds in which it invests.
2 Net Assets—End of Period includes undistributed net investment income of $502,000 and $0.
101
Institutional Developed Markets Index Fund | | | | | |
| | | | | | | |
| | | | | | | |
| | | | | | | |
Financial Highlights | | | | | | |
| | | | | | | |
| Six Months | | | | | | |
| Ended | | | | | Jan. 1 to | June 12 to |
For a Share Outstanding | Apr. 30, | Year Ended October 31, | Oct. 31, | Dec. 31, |
Throughout Each Period | 2006 | 2005 | 2004 | 2003 | 2002 | 20011 | 2000 |
Net Asset Value, | | | | | | | |
Beginning of Period | $9.67 | $8.35 | $7.16 | $5.76 | $6.78 | $9.01 | $10.00 |
Investment Operations | | | | | | | |
Net Investment Income | .229 | .20 | .158 | .126 | .132 | — | .15 |
Capital Gain | | | | | | | |
Distributions Received | — | — | — | — | — | — | — |
Net Realized and Unrealized | | | | | | | |
Gain (Loss) on Investments | 1.920 | 1.32 | 1.190 | 1.400 | (1.020) | (2.23) | (.99) |
Total from Investment | | | | | | | |
Operations | 2.149 | 1.52 | 1.348 | 1.526 | (.888) | (2.23) | (.84) |
Distributions | | | | | | | |
Dividends from Net | | | | | | | |
Investment Income | (.229) | (.20) | (.158) | (.126) | (.132) | — | (.15) |
Distributions from | | | | | | | |
Realized Capital Gains | — | — | — | — | — | — | — |
Total Distributions | (.229) | (.20) | (.158) | (.126) | (.132) | — | (.15) |
Net Asset Value, | | | | | | | |
End of Period | $11.59 | $9.67 | $8.35 | $7.16 | $5.76 | $6.78 | $9.01 |
| | | | | | | |
Total Return3 | 22.55% | 18.37% | 19.05% | 27.13% | –13.41% | –24.75% | –8.38% |
| | | | | | | |
Ratios/Supplemental Data | | | | | | | |
Net Assets, | | | | | | | |
End of Period (Millions) | $2,543 | $1,748 | $911 | $567 | $261 | $206 | $171 |
Ratio of Total Expenses to | | | | | | | |
Average Net Assets—Note B | 0%4 | 0% | 0% | 0% | 0% | 0% | 0% |
Ratio of Net Investment | | | | | | | |
Income to Average | | | | | | | |
Net Assets | 2.05% | 1.86% | 1.81% | 1.80% | 1.75% | 0.05%5 | 1.74%5 |
Portfolio Turnover Rate | 19%5 | 6% | 19% | 11% | 9% | 3% | 3% |
1 The fund’s fiscal year-end changed from December 31 to October 31, effective October 31, 2001.
2 Inception.
3 Total returns do not reflect the 2% fee assessed on redemptions of shares purchased on or after June 27, 2003, and held for less than two months.
4 The average weighted annualized expense ratio of the underlying funds was 0.12%.
5 Annualized.
See accompanying Notes, which are an integral part of the Financial Statements.
102
Institutional Developed Markets Index Fund
Notes to Financial Statements
Vanguard Institutional Developed Markets Index Fund is registered under the Investment Company Act of 1940 as an open-end investment company, or mutual fund. The fund files reports with the SEC under the company name Vanguard STAR Funds. The fund seeks to match the performance of its target index by investing in the European and Pacific Stock Index Funds. The fund’s indirect investments in foreign securities involve investment risks not normally associated with investing in securities of U.S. corporations.
A. The following significant accounting policies conform to generally accepted accounting principles for U.S. mutual funds. The fund consistently follows such policies in preparing its financial statements.
1. Valuation: Investments are valued at the net asset value of each underlying Vanguard fund determined as of the close of trading on the New York Stock Exchange (generally 4:00 p.m., Eastern time) on the valuation date.
2. Federal Income Taxes: The fund intends to continue to qualify as a regulated investment company and distribute all of its taxable income. Accordingly, no provision for federal income taxes is required in the financial statements.
3. Distributions: Distributions to shareholders are recorded on the ex-dividend date.
4. Other: Income and capital gain distributions received are recorded on the ex-dividend date. Security transactions are accounted for on the date securities are bought or sold. Costs used to determine realized gains (losses) on the sale of investment securities are those of the specific securities sold.
B. Under a service agreement, The Vanguard Group furnishes corporate management, administrative, marketing, and distribution services to the fund. The service agreement provides that Vanguard will reimburse the fund’s expenses to the extent of savings in administrative and marketing costs realized by Vanguard in the operation of the fund. Accordingly, all expenses incurred by the fund during the six months ended April 30, 2006, were reimbursed by Vanguard. The fund’s trustees and officers are also directors and officers of Vanguard.
C. Distributions are determined on a tax basis and may differ from net investment income and realized capital gains for financial reporting purposes. Differences may be permanent or temporary. Permanent differences are reclassified among capital accounts in the financial statements to reflect their tax character. Temporary differences arise when certain items of income, expense, gain, or loss are recognized in different periods for financial statement and tax purposes; these differences will reverse at some time in the future. Differences in classification may also result from the treatment of short-term gains as ordinary income for tax purposes.
The fund’s tax-basis capital gains and losses are determined only at the end of each fiscal year. For tax purposes, at October 31, 2005, the fund had available realized losses of $9,854,000 to offset future net capital gains through October 31, 2011. The fund will use these capital losses to offset net taxable capital gains, if any, realized during the year ending October 31, 2006; should the fund realize net capital losses for the year, the losses will be added to the loss carryforward balance above.
At April 30, 2006, net unrealized appreciation of investment securities for tax purposes was $683,955,000, consisting entirely of unrealized gains on securities that had risen in value since their purchase.
103
Institutional Developed Markets Index Fund
D. During the six months ended April 30, 2006, the fund purchased $606,214,000 of investment securities and sold $192,140,000 of investment securities, other than temporary cash investments.
E. Capital shares issued and redeemed were:
| Six Months Ended | | Year Ended |
| April 30, 2006 | | October 31, 2005 |
| Shares | | Shares |
| (000) | | (000) |
Issued | 55,600 | | 82,904 |
Issued in Lieu of Cash Distributions | 2,939 | | 2,175 |
Redeemed | (19,865) | | (13,398) |
Net Increase (Decrease) in Shares Outstanding | 38,674 | | 71,681 |
104
About Your Fund’s Expenses
As a shareholder of the fund, you incur ongoing costs, which include costs for portfolio management, administrative services, and shareholder reports (like this one), among others. Operating expenses, which are deducted from a fund’s gross income, directly reduce the investment return of the fund.
A fund’s expenses are expressed as a percentage of its average net assets. This figure is known as the expense ratio. Vanguard “funds of funds,” such as the Developed Markets Index Fund, Institutional Developed Markets Index Fund, and Total International Stock Index Fund, do not have direct expenses, but each fund bears its proportionate share of the expenses of the underlying funds in which it invests. These indirect expenses make up the fund’s average weighted expense ratio, also expressed as a percentage of average net assets.
The examples in the table on the next page are intended to help you understand the ongoing costs (in dollars) of investing in your fund and to compare these costs with those of other mutual funds. The examples are based on an investment of $1,000 made at the beginning of the period shown and held for the entire period.
The table illustrates your fund’s costs in two ways:
• Based on actual fund return. This section helps you to estimate the actual expenses that you paid over the period. The “Ending Account Value” shown is derived from the fund’s actual return, and the third column shows the dollar amount that would have been paid by an investor who started with $1,000 in the fund. You may use the information here, together with the amount you invested, to estimate the expenses that you paid over the period.
To do so, simply divide your account value by $1,000 (for example, an $8,600 account value divided by $1,000 = 8.6), then multiply the result by the number given for your fund under the heading “Expenses Paid During Period.”
• Based on hypothetical 5% yearly return. This section is intended to help you compare your fund’s costs with those of other mutual funds. It assumes that the fund had a yearly return of 5% before expenses, but that the expense ratio is unchanged. In this case—because the return used is not the fund’s actual return—the results do not apply to your investment. The example is useful in making comparisons because the Securities and Exchange Commission requires all mutual funds to calculate expenses based on a 5% return. You can assess your fund’s costs by comparing this hypothetical example with the hypothetical examples that appear in shareholder reports of other funds.
Please note that the expenses shown in the table are meant to highlight and help you compare ongoing costs only; they do not include low-balance fees, account maintenance fees, or the transaction fees on redemptions. These fees are described fully in the prospectus; they also are noted on the Performance Summary pages in this report. If the fees were applied to your account, your costs would be higher. The funds do not carry “sales loads.”
The calculations assume no shares were bought or sold during the period. Your actual costs may have been higher or lower, depending on the amount of your investment and the timing of any purchases or redemptions.
You can find more information about the funds’ expenses, including annual expense ratios, in the Financial Statements sections of this report. For additional information on operating expenses and other shareholder costs, please refer to the appropriate fund prospectus.
105
Six Months Ended April 30, 2006 | | | |
| Beginning | Ending | Expenses |
| Account Value | Account Value | Paid During |
International Stock Index Fund | 10/31/2005 | 4/30/2006 | Period1 |
Based on Actual Fund Return | | | |
European | | | |
Investor Shares | $1,000.00 | $1,222.94 | $1.49 |
Admiral Shares | 1,000.00 | 1,223.57 | 0.94 |
Institutional Shares | 1,000.00 | 1,223.80 | 0.66 |
VIPER Shares | 1,000.00 | 1,223.39 | 0.99 |
Pacific | | | |
Investor Shares | $1,000.00 | 1,227.79 | $1.49 |
Admiral Shares | 1,000.00 | 1,228.26 | 0.94 |
Institutional Shares | 1,000.00 | 1,229.06 | 0.66 |
VIPER Shares | 1,000.00 | 1,228.16 | 0.99 |
Emerging Markets2 | | | |
Investor Shares | $995.00 | 1,358.96 | $7.51 |
Institutional Shares | 995.00 | 1,360.59 | 6.46 |
VIPER Shares | 1,000.00 | 1,367.08 | 1.76 |
Total International | $1,000.00 | $1,242.10 | $1.61 |
Developed Markets | $1,000.00 | $1,225.54 | $1.49 |
Institutional Developed Markets | $1,000.00 | $1,225.46 | $0.66 |
Based on Hypothetical 5% Yearly Return | | | |
European | | | |
Investor Shares | $1,000.00 | $1,023.46 | $1.35 |
Admiral Shares | 1,000.00 | 1,023.95 | 0.85 |
Institutional Shares | 1,000.00 | 1,024.20 | 0.60 |
VIPER Shares | 1,000.00 | 1,023.90 | 0.90 |
Pacific | | | |
Investor Shares | $1,000.00 | $1,023.46 | $1.35 |
Admiral Shares | 1,000.00 | 1,023.95 | 0.85 |
Institutional Shares | 1,000.00 | 1,024.20 | 0.60 |
VIPER Shares | 1,000.00 | 1,023.90 | 0.90 |
Emerging Markets | | | |
Investor Shares | $995.00 | $1,017.55 | $7.15 |
Institutional Shares | 995.00 | 1,018.44 | 6.25 |
VIPER Shares | 1,000.00 | 1,023.31 | 1.51 |
Total International | $1,000.00 | $1,023.36 | $1.45 |
Developed Markets | $1,000.00 | $1,023.46 | $1.35 |
Institutional Developed Markets | $1,000.00 | $1,024.20 | $0.60 |
1 These calculations are based on expenses incurred in the most recent six-month period, except for the three “funds-of-funds,” for which calculations are based on expenses incurred in the most recent fiscal period of each underlying fund. Annualized six-month expense ratios for the European, Pacific, and Emerging Markets funds are as follows: European Stock Index Fund—0.27% for Investor Shares, 0.17% for Admiral Shares, 0.12% for Institutional Shares, and 0.18% for VIPER Shares; Pacific Stock Index Fund—0.27% for Investor Shares, 0.17% for Admiral Shares, 0.12% for Institutional Shares, and 0.18% for VIPER Shares; Emerging Markets Stock Index Fund—0.43% for Investor Shares, 0.25% for Institutional Shares, and 0.30% for VIPER Shares. The other funds’ annualized average weighted expense ratios as of April 30, 2006, were (in top-to-bottom order as listed above) 0.29%, 0.27%, and 0.12%. The dollar amounts shown as “Expenses Paid” are equal to the annualized expense ratio multiplied by the average account value over the period, multiplied by the number of days in the most recent 6-month period, then divided by the number of days in the most recent 12-month period.
2 Calculations reflect the fund’s 0.5% purchase fee, which is deducted from all purchases (including exchanges from other Vanguard funds) but not from reinvested dividends and capital gains.
106
Trustees Renew Advisory Arrangement
The board of trustees of Vanguard International Stock Index Funds has renewed the funds’ investment advisory arrangement with The Vanguard Group, Inc. Vanguard—through its Quantitative Equity Group—serves as the investment advisor for the European, Pacific, and Emerging Markets Stock Index Funds. The Total International Stock Index Fund, Developed Markets Index Fund, and Institutional Developed Markets Index Fund do not employ an investment advisor but benefit from the investment advisory services provided to the underlying funds in which they invest. The board determined that continuing the funds’ internalized management structure was in the best interests of the funds and their shareholders.
The board based its decision upon its most recent evaluation of the advisor’s investment staff, portfolio management process, and performance. The trustees considered the factors discussed below, among others. However, no single factor determined whether the board approved the arrangement. Rather, it was the totality of the circumstances that drove the board’s decision.
Nature, extent, and quality of services
The board considered the quality of the funds’ investment management over both short- and long-term periods and took into account the organizational depth and stability of the advisor. Vanguard has been managing investments for more than two decades. George U. Sauter, Vanguard managing director and chief investment officer, has been in the investment management business since 1985 and oversees more than $690 billion in assets (stocks and bonds). Vanguard adheres to a sound, disciplined investment management process; the portfolio management team has considerable experience, stability, and depth.
The board concluded that Vanguard’s experience, stability, depth, and performance, among other factors, warranted continuation of the advisory arrangement.
Investment performance
The board considered the short- and long-term performance of the funds, including any periods of outperformance or underperformance of their target benchmarks and peer groups. The board concluded that the funds have performed in line with expectations and that their results have been consistent with their investment strategies. Information about the funds’ performance, including some of the performance data considered by the board, can be found in the Performance Summary pages of this report.
Cost
The board concluded that the advisory expenses and the overall expense ratios for the European, Pacific, and Emerging Markets Stock Index Funds were far below the average advisory fees and expense ratios charged by funds in their respective peer groups. As previously noted, the other funds do not incur advisory expenses directly. Information about the funds’ expense ratios appears in the About Your Fund’s Expenses section of this report as well as in the Financial Statements sections.
The board does not conduct a profitability analysis of Vanguard because of Vanguard’s unique “at-cost” structure. Unlike most other mutual fund management companies, Vanguard is owned by the funds it oversees, and produces “profits” only in the form of reduced expenses for fund shareholders.
The benefit of economies of scale
The board concluded that Vanguard’s low-cost arrangement with the International Stock Index Funds ensures that the funds will realize economies of scale as they grow, with the cost to shareholders declining as fund assets increase.
The board will consider whether to renew the advisory arrangement again after a one-year period.
107
Glossary
Average Weighted Expense Ratio. Funds that invest in other Vanguard funds incur no direct expenses, but do bear proportionate shares of the operating, administrative, and advisory expenses of the underlying funds. The average weighted expense ratio is the average of these expense ratios, weighted in proportion to the amount of the fund invested in each underlying fund.
Beta. A measure of the magnitude of a fund’s past share-price fluctuations in relation to the ups and downs of a given market index. The index is assigned a beta of 1.00. Compared with a given index, a fund with a beta of 1.20 typically would have seen its share price rise or fall by 12% when the index rose or fell by 10%. A fund’s beta should be reviewed in conjunction with its R-squared (see definition below). The lower the R-squared, the less correlation there is between the fund and the index, and the less reliable beta is as an indicator of volatility.
Expense Ratio. The percentage of a fund’s average net assets used to pay its annual administrative and advisory expenses. These expenses directly reduce returns to investors.
R-Squared. A measure of how much of a fund’s past returns can be explained by the returns from the market in general, as measured by a given index. If a fund’s total returns were precisely synchronized with an index’s returns, its R-squared would be 1.00. If the fund’s returns bore no relationship to the index’s returns, its R-squared would be 0.
Short-Term Reserves. The percentage of a fund invested in highly liquid, short-term securities that can be readily converted to cash.
Turnover Rate. An indication of the fund’s trading activity. Funds with high turnover rates incur higher transaction costs and may be more likely to distribute capital gains (which may be taxable to investors). The turnover rate excludes in-kind transactions, which have minimal impact on costs.
108
This page intentionally left blank.
This page intentionally left blank.
This page intentionally left blank.
The People Who Govern Your Fund
The trustees of your mutual fund are there to see that the fund is operated and managed in your best interests since, as a shareholder, you are a part owner of the fund. Your fund trustees also serve on the board of directors of The Vanguard Group, Inc., which is owned by the Vanguard funds and provides services to them on an at-cost basis.
A majority of Vanguard’s board members are independent, meaning that they have no affiliation with Vanguard or the funds they oversee, apart from the sizable personal investments they have made as private individuals.
Our independent board members bring distinguished backgrounds in business, academia, and public service to their task of working with Vanguard officers to establish the policies and oversee the activities of the funds. Among board members’ responsibilities are selecting investment advisors for the funds; monitoring fund operations, performance, and costs; reviewing contracts; nominating and selecting new trustees/directors; and electing Vanguard officers.
Each trustee serves a fund until its termination; or until the trustee’s retirement, resignation, or death; or otherwise as specified in the fund’s organizational documents. Any trustee may be removed at a shareholders’ meeting by a vote representing two-thirds of the net asset value of all shares of the fund together with shares of other Vanguard funds organized within the same trust. The table on these two pages shows information for each trustee and executive officer of the fund. The mailing address of the trustees and officers is P.O. Box 876, Valley Forge, PA 19482.
Chairman of the Board, Chief Executive Officer, and Trustee |
| |
John J. Brennan1 | |
Born 1954 Trustee since May 1987; Chairman of the Board and Chief Executive Officer 135 Vanguard Funds Overseen | Principal Occupation(s) During the Past Five Years: Chairman of the Board, Chief Executive Officer, and Director/Trustee of The Vanguard Group, Inc., and of each of the investment companies served by The Vanguard Group. |
| |
Independent Trustees | |
| |
Charles D. Ellis | |
Born 1937 Trustee since January 2001 135 Vanguard Funds Overseen | Principal Occupation(s) During the Past Five Years: Applecore Partners (pro bono ventures in education); Senior Advisor to Greenwich Associates (international business strategy consulting); Successor Trustee of Yale University; Overseer of the Stern School of Business at New York University; Trustee of the Whitehead Institute for Biomedical Research. |
| |
Rajiv L. Gupta | |
Born 1945 Trustee since December 20012 135 Vanguard Funds Overseen | Principal Occupation(s) During the Past Five Years: Chairman and Chief Executive Officer of Rohm and Haas Co. (chemicals); Board Member of the American Chemistry Council; Director of Tyco International, Ltd. (diversified manufacturing and services) (since 2005); Trustee of Drexel University and of the Chemical Heritage Foundation. |
| |
JoAnn Heffernan Heisen | |
Born 1950 Trustee since July 1998 135 Vanguard Funds Overseen | Principal Occupation(s) During the Past Five Years: Corporate Vice President and Chief Global Diversity Officer (since January 2006), Vice President and Chief Information Officer (1997–2005), and Member of the Executive Committee of Johnson & Johnson (pharmaceuticals/consumer products); Director of the University Medical Center at Princeton and Women’s Research and Education Institute. |
André F. Perold | |
Born 1952 Trustee since December 2004 135 Vanguard Funds Overseen | Principal Occupation(s) During the Past Five Years: George Gund Professor of Finance and Banking, Harvard Business School (since 2000); Senior Associate Dean, Director of Faculty Recruiting, and Chair of Finance Faculty, Harvard Business School; Director and Chairman of UNX, Inc. (equities trading firm) (since 2003); Director of registered investment companies advised by Merrill Lynch Investment Managers and affiliates (1985–2004), Genbel Securities Limited (South African financial services firm) (1999–2003), Gensec Bank (1999–2003), Sanlam, Ltd. (South African insurance company) (2001–2003), and Stockback, Inc. (credit card firm) (2000–2002). |
| |
Alfred M. Rankin, Jr. | |
Born 1941 Trustee since January 1993 135 Vanguard Funds Overseen | Principal Occupation(s) During the Past Five Years: Chairman, President, Chief Executive Officer, and Director of NACCO Industries, Inc. (forklift trucks/housewares/ lignite); Director of Goodrich Corporation (industrial products/aircraft systems and services); Director of Standard Products Company (supplier for the automotive industry) until 1998. |
| |
J. Lawrence Wilson | |
Born 1936 Trustee since April 1985 135 Vanguard Funds Overseen | Principal Occupation(s) During the Past Five Years: Retired Chairman and Chief Executive Officer of Rohm and Haas Co. (chemicals); Director of Cummins Inc. (diesel engines), MeadWestvaco Corp. (packaging products), and AmerisourceBergen Corp. (pharmaceutical distribution); Trustee of Vanderbilt University and of Culver Educational Foundation. |
| |
Executive Officers1 | |
| |
Heidi Stam | |
Born 1956 Secretary since July 2005 135 Vanguard Funds Overseen | Principal Occupation(s) During the Past Five Years: Principal of The Vanguard Group, Inc., since November 1997; General Counsel of The Vanguard Group since July 2005; Secretary of The Vanguard Group and of each of the investment companies served by The Vanguard Group since July 2005. |
| |
Thomas J. Higgins | |
Born 1957 Treasurer since July 1998 135 Vanguard Funds Overseen | Principal Occupation(s) During the Past Five Years: Principal of The Vanguard Group, Inc.; Treasurer of each of the investment companies served by The Vanguard Group. |
| |
Vanguard Senior Management Team |
| |
R. Gregory Barton | |
Mortimer J. Buckley | |
James H. Gately | |
Kathleen C. Gubanich | |
F. William McNabb, III | |
Michael S. Miller | |
Ralph K. Packard | |
George U. Sauter | |
| |
Founder | |
| |
John C. Bogle | |
Chairman and Chief Executive Officer, 1974–1996 |
1 Officers of the funds are “interested persons” as defined in the Investment Company Act of 1940.
2 December 2002 for Vanguard Equity Income Fund, Vanguard Growth Equity Fund, the Vanguard Municipal Bond Funds, and the Vanguard State Tax-Exempt Funds.
More information about the trustees is in the Statement of Additional Information, available from The Vanguard Group.
| |
|
| | P.O. Box 2600 Valley Forge, PA 19482-2600 |
Connect with Vanguard™ > www.vanguard.com |
Fund Information > 800-662-7447 | | Vanguard, Admiral, STAR, Connect with Vanguard, and the ship logo are trademarks of The Vanguard Group, Inc. |
Direct Investor Account Services > 800-662-2739 | | |
Institutional Investor Services > 800-523-1036 | | All other marks are the exclusive property of their respective owners. |
Text Telephone > 800-952-3335 | | |
| | All comparative mutual fund data are from Lipper Inc. or Morningstar, Inc., unless otherwise noted. |
| | |
This material may be used in conjunction with the offering of shares of any Vanguard fund only if preceded or accompanied by the fund’s current prospectus. | | You can obtain a free copy of Vanguard’s proxy voting guidelines by visiting our website, www.vanguard.com, and searching for “proxy voting guidelines,” or by calling Vanguard at 800-662-2739. They are also available from the SEC’s website, www.sec.gov. In addition, you may obtain a free report on how your fund voted the proxies for securities it owned during the 12 months ended June 30. To get the report, visit either www.vanguard.com or www.sec.gov. |
| | |
The funds or securities referred to herein that are offered by The Vanguard Group and track an MSCI index are not sponsored, endorsed, or promoted by MSCI, and MSCI bears no liability with respect to any such funds or securities. For such funds or securities, the prospectus or the Statement of Additional Information contains a more detailed description of the limited relationship MSCI has with The Vanguard Group. | | You can review and copy information about your fund at the SEC’s Public Reference Room in Washington, D.C. To find out more about this public service, call the SEC at 202-551-8090. Information about your fund is also available on the SEC’s website, and you can receive copies of this information, for a fee, by sending a request in either of two ways: via e-mail addressed to publicinfo@sec.gov or via regular mail addressed to the Public Reference Section, Securities and Exchange Commission, Washington, DC 20549-0102. |
| | |
| | |
| | © 2006 The Vanguard Group, Inc. All rights reserved. Vanguard Marketing Corporation, Distributor. |
| | |
| | Q722 062006 |
Item 2: Not Applicable
Item 3: Not Applicable
Item 4: Not Applicable
Item 5: Not applicable.
Item 6: Not applicable.
Item 7: Not applicable.
Item 8: Not applicable.
Item 9: Not applicable.
Item 10: Not applicable.
Item 11: Controls and Procedures
(a) Disclosure Controls and Procedures. The Principal Executive and Financial Officers concluded that the Registrant's Disclosure Controls and Procedures are effective based on their evaluation of the Disclosure Controls and Procedures as of a date within 90 days of the filing date of this report.
(b) Internal Control Over Financial Reporting. There were no significant changes in Registrant‘s Internal Control Over Financial Reporting or in other factors that could significantly affect this control subsequent to the date of the evaluation, including any corrective actions with regard to significant deficiencies and material weaknesses.
Item 12: Exhibits.
Certifications.
Pursuant to the requirements of the Securities Exchange Act of 1934 and the Investment Company Act of 1940, the registrant has duly caused this report to be signed on its behalf by the undersigned, thereunto duly authorized.
| VANGUARD STAR FUNDS
|
| BY: | (signature)
|
| (HEIDI STAM)
JOHN J. BRENNAN*
CHIEF EXECUTIVE OFFICER |
Pursuant to the requirements of the Securities Exchange Act of 1934 and the Investment Company Act of 1940, this report has been signed below by the following persons on behalf of the registrant and in the capacities and on the dates indicated.
| VANGUARD STAR FUNDS
|
| BY: | (signature)
|
| (HEIDI STAM)
JOHN J. BRENNAN*
CHIEF EXECUTIVE OFFICER |
| VANGUARD STAR FUNDS
|
| BY: | (signature)
|
| (HEIDI STAM)
THOMAS J. HIGGINS*
TREASURER |
*By Power of Attorney. See File Number 2-31333, filed on January 23, 2006. Incorporated by Reference.