UNITED STATES
SECURITIES AND EXCHANGE COMMISSION
Washington, D.C. 20549
FORM N-CSR
CERTIFIED SHAREHOLDER REPORT
OF
REGISTERED MANAGEMENT INVESTMENT COMPANIES
Investment Company Act file number: 811-3919
Name of Registrant: Vanguard STAR Funds
Address of Registrant:
P.O. Box 2600
Valley Forge, PA 19482
Name and address of agent for service:
Heidi Stam, Esquire
P.O. Box 876
Valley Forge, PA 19482
Registrant’s telephone number, including area code: (610) 669-1000
Date of fiscal year end: October 31
Date of reporting period: November 1, 2010 – April 30, 2011
Item 1: Reports to Shareholders
 |
| Vanguard STAR® Fund |
| Semiannual Report |
|
| April 30, 2011 |
|
 |
|
|
|
> For the six months ended April 30, 2011, Vanguard STAR Fund returned 10.28%.
> The fund’s return was slightly ahead of that of its composite benchmark index and slightly behind the average return of a composite of peer-group funds.
> Each of STAR’s 11 underlying funds posted positive returns, with stocks outperforming bonds and U.S. stocks outperforming international equities.
| |
| Contents | |
| Your Fund’s Total Returns. | 1 |
| Chairman’s Letter. | 2 |
| Fund Profile. | 6 |
| Performance Summary. | 7 |
| Financial Statements. | 8 |
| About Your Fund’s Expenses. | 15 |
| Trustees Approve Advisory Arrangement. | 17 |
| Glossary. | 18 |
Please note: The opinions expressed in this report are just that—informed opinions. They should not be considered promises or advice. Also, please keep in mind that the information and opinions cover the period through the date on the front of this report. Of course, the risks of investing in your fund are spelled out in the prospectus.
See the Glossary for definitions of investment terms used in this report.
Cover photograph: Jean Maher.
Your Fund’s Total Returns
| |
| Six Months Ended April 30, 2011 | |
| | Total |
| | Returns |
| Vanguard STAR Fund | 10.28% |
| STAR Composite Index | 10.00 |
| STAR Composite Average | 10.77 |
STAR Composite Index: 62.5% Dow Jones U.S. Total Stock Market Index, 25% Barclays Capital U.S. Aggregate Bond Index, and 12.5% Citigroup Three-Month U.S. Treasury Bill Index through December 31, 2002; 50% Dow Jones U.S. Total Stock Market Index, 25% Barclays Capital U.S. Aggregate Bond Index, 12.5% Barclays Capital U.S. 1-5 Year Credit Bond Index, and 12.5% MSCI EAFE Index through April 22, 2005; 50% MSCI US Broad Market Index, 25% Barclays Capital U.S. Aggregate Bond Index, 12.5% Barclays Capital U.S. 1-5 Year Credit Bond Index, and 12.5% MSCI EAFE Index through September 30, 2010; and 43.75% MSCI US Broad Market Index, 25% Barclays Capital U.S. Aggregate Bond Index, 12.5% Barclays Capital U.S. 1-5 Year Credit Bond Index, and 18.75% MSCI All Country World Index ex USA thereafter. MSCI international benchmark returns are adjusted for withholding taxes applicable to Luxembourg holding companies.
STAR Composite Average: 62.5% general equity funds average, 25% fixed income funds average, and 12.5% money market funds average through December 31, 2002; 50% general equity funds average, 25% fixed income funds average, 12.5% 1-5 year investment-grade funds average, and 12.5% international funds average through September 30, 2010; and 43.75% general equity funds average, 25% fixed income funds average, 12.5% 1-5 year investment-grade funds average, and 18.75% international funds average thereafter. Derived from data provided by Lipper Inc.
| | | | |
| Your Fund’s Performance at a Glance | | | | |
| October 31, 2010 , Through April 30, 2011 | | | | |
| | | | Distributions Per Share |
| | Starting | Ending | Income | Capital |
| | Share Price | Share Price | Dividends | Gains |
| Vanguard STAR Fund | $18.76 | $20.35 | $0.268 | $0.048 |
1

Chairman’s Letter
Dear Shareholder,
Vanguard STAR Fund returned 10.28% for the six months ended April 30, 2011. Each of the underlying Vanguard funds that make up the STAR Fund made a positive contribution to STAR’s overall performance. The fund’s return was slightly higher than the 10.00% return of its benchmark index but lagged the 10.77% average return of peer-group funds. (These yardsticks are composites weighted to approximate STAR’s asset allocation.)
As a “fund of funds,” STAR invests in 11 actively managed Vanguard funds that encompass a wide range of investing styles and market capitalizations. The eight underlying funds provide exposure to both growth and value stocks in the domestic and international stock markets, while three fixed income funds provide meaningful exposure to the U.S. bond market.
Strong returns around the globe
The headlines were dominated by political upheaval, natural and nuclear disaster, and economic distress, but global stock markets produced outstanding returns for the six months ended April 30. The broad U.S. stock market returned more than 17%. Although rising food and gasoline prices put pressure on consumer budgets, corporate earnings growth remained strong and the pace of new job creation bounced back from extremely depressed levels.
2
For U.S.-based investors, international stock markets produced a lower but still robust six-month return of 12.44% in U.S. dollars. Almost half of this return reflected exchange-rate gains produced largely by strength in the euro and currencies in emerging economies.
As the economy found its footing, rates edged higher
Rising longer-term interest rates put pressure on bond prices, which led to modest bond market returns for the six-month period. The broad taxable U.S. bond market returned about 0%. The broad municipal market returned –1.68%. The rise in rates reflected both confidence that the economic recovery would prove self-sustaining and thus nudge rates higher, and concern that higher rates would be necessary to provide some protection from inflation. Even so, inflation expectations remained subdued, as measured by the difference between the yields of inflation-protected and nominal U.S. Treasury bonds.
The return on short-term money market instruments such as the 3-month U.S. Treasury bill remained near 0%, consistent with the Federal Reserve Board’s target for short-term rates.
Stock investments powered the STAR Fund’s return
U.S. and international stocks rose substantially during the six months ended April 30, and Vanguard STAR Fund’s equity funds made the most of this propitious climate, posting double-digit gains. The equity funds represented about two-thirds
| | | |
| Market Barometer | | | |
| |
| | | | Total Returns |
| | | Periods Ended April 30, 2011 |
| | Six | One | Five Years |
| | Months | Year | (Annualized) |
| Stocks | | | |
| Russell 1000 Index (Large-caps) | 17.12% | 18.02% | 3.30% |
| Russell 2000 Index (Small-caps) | 23.73 | 22.20 | 3.89 |
| Dow Jones U.S. Total Stock Market Index | 17.28 | 18.40 | 3.65 |
| MSCI All Country World Index ex USA (International) | 12.44 | 19.73 | 3.55 |
| |
| Bonds | | | |
| Barclays Capital U.S. Aggregate Bond Index (Broad | | | |
| taxable market) | 0.02% | 5.36% | 6.33% |
| Barclays Capital Municipal Bond Index (Broad | | | |
| tax-exempt market) | -1.68 | 2.20 | 4.52 |
| Citigroup Three-Month U.S. Treasury Bill Index | 0.06 | 0.15 | 2.02 |
| |
| CPI | | | |
| Consumer Price Index | 2.83% | 3.16% | 2.22% |
3
of STAR’s assets during the period. STAR’s balanced investment approach also includes bonds, both for the income they produce and for their potential to dampen a portfolio’s volatility.
Among STAR’s domestic equity funds, returns ranged from about 15% for Vanguard PRIMECAP Fund, which focuses on large- and mid-capitalization stocks with above-average growth potential, to almost 25% for Vanguard Explorer™ Fund, which was powered by its selections of small-company growth stocks in information technology and health care. The fund advisors’ selections of information technology and financial stocks also played a big role in the returns posted by STAR’s two value-oriented funds, Windsor™ (about 18%) and Windsor II (about 17%).
Approximately 20% of STAR’s assets were invested in two international stock funds, split about evenly between Vanguard International Value Fund and Vanguard International Growth Fund. These funds returned about 10% and about 14%, respectively.
On the fixed income side, STAR saw its bond funds earn positive, if lackluster, returns, reflecting the period’s difficult bond market. Vanguard Short-Term Investment-Grade Bond Fund returned 0.79%, a bit better than the broad bond market’s flat return, while Vanguard Long-Term Investment-Grade Bond Fund returned 1.00%. In between, in terms of average maturity, Vanguard GNMA Fund, which invests in mortgage-backed securities, posted a return of 1.27%.
| | |
| Expense Ratios | | |
| Your Fund Compared With Its Peer Group | | |
| | Acquired Fund Fees | Peer Group |
| | and Expenses | Average |
| STAR Fund | 0.34% | 1.20% |
The acquired fund fees and expenses—drawn from the prospectus dated February 28, 2011—represent an estimate of the weighted average of the expense ratios and any transaction fees charged by the underlying mutual funds (the ”acquired” funds) in which the STAR Fund invests. The STAR Fund does not charge any expenses or fees of its own. For the six months ended April 30, 2011, the annualized acquired fund fees and expenses were 0.35%.
The peer group is the STAR Composite Average, derived by weighting the average expense ratios of the following mutual fund groups: general equity funds (43.75%), fixed income funds (25%), 1–5 year investment-grade funds (12.5%), and international funds (18.75%). Average expense ratios for these groups are derived from data provided by Lipper Inc. and capture information through year-end 2010.
4
Focus on future goals, not the current market
For some time now, the stock market—in the United States and abroad—has been recovering from the turmoil created by the financial crisis. Its performance over the last six months has been impressive. Of course, we can’t be sure what the future holds, but we know that the market will continue to experience ups and downs.
The best way to tune out the distractions caused by these unpredictable but inevitable fluctuations is to focus on the drivers of long-term investment success that are within your control. Maintain an allocation to stock, bond, and money market funds consistent with your goals and tolerance for market gyrations; pay attention to costs; and strive to make contributions to your investment program that are commensurate with your eventual needs.
Vanguard STAR Fund, with its 11 underlying funds managed by time-tested advisors, and its broad diversification both among and between asset classes, can play an important role in a well-balanced portfolio that may help you reach your goals. And the fund’s low expenses will enable you to keep more of the return on your investment.
As always, thank you for entrusting your assets to Vanguard.
Sincerely,

F. William McNabb III
Chairman and Chief Executive Officer
May 11, 2011
| | |
| Underlying Funds: Allocations and Returns | | |
| Six Months Ended April 30, 2011 | | |
| | Percentage of | |
| Vanguard Fund | STAR Fund Assets | Total Returns |
| Vanguard Windsor II Fund Investor Shares | 14.3% | 16.90% |
| Vanguard Long-Term Investment-Grade Fund Investor Shares | 12.4 | 1.00 |
| Vanguard GNMA Fund Investor Shares | 12.3 | 1.27 |
| Vanguard Short-Term Investment-Grade Fund Investor Shares | 12.2 | 0.79 |
| Vanguard International Growth Fund Investor Shares | 9.5 | 13.63 |
| Vanguard International Value Fund | 9.5 | 10.39 |
| Vanguard Windsor Fund Investor Shares | 7.7 | 17.56 |
| Vanguard Morgan Growth Fund Investor Shares | 6.1 | 17.71 |
| Vanguard PRIMECAP Fund Investor Shares | 6.1 | 15.20 |
| Vanguard U.S. Growth Fund Investor Shares | 6.1 | 17.18 |
| Vanguard Explorer Fund Investor Shares | 3.8 | 24.78 |
| Combined | 100.0% | 10.28% |
5
STAR Fund
Fund Profile
As of April 30, 2011
| |
| Total Fund Characteristics | |
| Ticker Symbol | VGSTX |
| 30-Day SEC Yield | 2.18% |
| Acquired Fund Fees and Expenses1 | 0.34% |
| |
| Allocation to Underlying Vanguard Funds | |
| Vanguard Windsor II Fund Investor Shares | 14.3% |
| Vanguard Long-Term Investment-Grade | |
| Fund Investor Shares | 12.4 |
| Vanguard GNMA Fund Investor Shares | 12.3 |
| Vanguard Short-Term Investment-Grade | |
| Fund Investor Shares | 12.2 |
| Vanguard International Growth Fund | |
| Investor Shares | 9.5 |
| Vanguard International Value Fund | 9.5 |
| Vanguard Windsor Fund Investor Shares | 7.7 |
| Vanguard Morgan Growth Fund Investor | |
| Shares | 6.1 |
| Vanguard PRIMECAP Fund Investor | |
| Shares | 6.1 |
| Vanguard U.S. Growth Fund Investor | |
| Shares | 6.1 |
| Vanguard Explorer Fund Investor Shares | 3.8 |
| | |
| Total Fund Volatility Measures | |
| | | DJ |
| | STAR | U.S. Total |
| | Composite | Market |
| | Index | Index |
| R-Squared | 0.99 | 0.96 |
| Beta | 1.03 | 0.68 |
These measures show the degree and timing of the fund’s fluctuations compared with the indexes over 36 months.
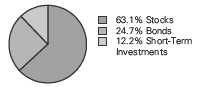
Fund Asset Allocation
1 This figure—drawn from the prospectus dated February 28, 2011—represents an estimate of the weighted average of the expense ratios and any transaction fees charged by the underlying mutual funds (the ”acquired” funds) in which the STAR Fund invests. The STAR Fund does not charge any expenses or fees of its own. For the six months ended April 30, 2011, the annualized acquired fund fees and expenses were 0.35%.
6
STAR Fund
Performance Summary
All of the returns in this report represent past performance, which is not a guarantee of future results that may be achieved by the fund. (Current performance may be lower or higher than the performance data cited. For performance data current to the most recent month-end, visit our website at vanguard.com/performance.) Note, too, that both investment returns and principal value can fluctuate widely, so an investor’s shares, when sold, could be worth more or less than their original cost. The returns shown do not reflect taxes that a shareholder would pay on fund distributions or on the sale of fund shares.
Fiscal-Year Total Returns (%): October 31, 2000, Through April 30, 2011
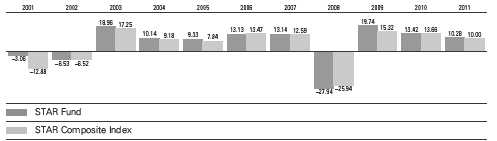
STAR Composite Index: 62.5% Dow Jones U.S. Total Stock Market Index, 25% Barclays Capital U.S. Aggregate Bond Index, and 12.5% Citigroup Three-Month U.S. Treasury Bill Index through December 31, 2002; 50% Dow Jones U.S. Total Stock Market Index, 25% Barclays Capital U.S. Aggregate Bond Index, 12.5% Barclays Capital U.S. 1-5 Year Credit Bond Index, and 12.5% MSCI EAFE Index through April 22, 2005; 50% MSCI US Broad Market Index, 25% Barclays Capital U.S. Aggregate Bond Index, 12.5% Barclays Capital U.S. 1-5 Year Credit Bond Index, and 12.5% MSCI EAFE Index through September 30, 2010; and 43.75% MSCI US Broad Market Index, 25% Barclays Capital U.S. Aggregate Bond Index, 12.5% Barclays Capital U.S. 1-5 Year Credit Bond Index, and 18.75% MSCI All Country World Index ex USA thereafter. MSCI international benchmark returns are adjusted for withholding taxes applicable to Luxembourg holding companies.
Note: For 2011, performance data reflect the six months ended April 30, 2011.
Average Annual Total Returns: Periods Ended March 31, 2011
This table presents returns through the latest calendar quarter—rather than through the end of the fiscal period. Securities and Exchange Commission rules require that we provide this information.
| | | | | | |
| | | | | | | Ten Years |
| | Inception Date | One Year | Five Years | Income | Capital | Total |
| STAR Fund | 3/29/1985 | 11.49% | 4.48% | 2.92% | 2.93% | 5.85% |
See Financial Highlights for dividend and capital gains information.
7
STAR Fund
Financial Statements (unaudited)
Statement of Net Assets
As of April 30, 2011
The fund reports a complete list of its holdings in regulatory filings four times in each fiscal year, at the quarter-ends. For the second and fourth fiscal quarters, the lists appear in the fund’s semiannual and annual reports to shareholders. For the first and third fiscal quarters, the fund files the lists with the Securities and Exchange Commission on Form N-Q. Shareholders can look up the fund’s Forms N-Q on the SEC’s website at sec.gov. Forms N-Q may also be reviewed and copied at the SEC’s Public Reference Room (see the back cover of this report for further information).
| | |
| | | Market |
| | | Value |
| | Shares | ($000) |
| Investment Companies (100.0%) | | |
| U.S. Stock Funds (44.1%) | | |
| Vanguard Windsor II Fund Investor Shares | 75,076,285 | 2,118,653 |
| Vanguard Windsor Fund Investor Shares | 77,938,298 | 1,144,134 |
| Vanguard Morgan Growth Fund Investor Shares | 46,041,521 | 908,860 |
| Vanguard PRIMECAP Fund Investor Shares | 12,686,372 | 908,725 |
| Vanguard U.S. Growth Fund Investor Shares | 45,359,674 | 907,193 |
| Vanguard Explorer Fund Investor Shares | 6,902,134 | 567,839 |
| | | 6,555,404 |
| International Stock Funds (19.0%) | | |
| Vanguard International Growth Fund Investor Shares | 66,948,507 | 1,417,300 |
| Vanguard International Value Fund | 41,055,321 | 1,416,408 |
| | | 2,833,708 |
| Bond Funds (24.7%) | | |
| Vanguard Long-Term Investment-Grade Fund Investor Shares | 195,739,238 | 1,845,821 |
| Vanguard GNMA Fund Investor Shares | 168,499,148 | 1,826,531 |
| | | 3,672,352 |
| Short-Term Bond Fund (12.2%) | | |
| Vanguard Short-Term Investment-Grade Fund Investor Shares | 167,998,725 | 1,811,026 |
| Total Investment Companies (Cost $11,148,750) | | 14,872,490 |
| Other Assets and Liabilities (0.0%) | | |
| Other Assets | | 26,532 |
| Liabilities | | (25,378) |
| | | 1,154 |
| Net Assets (100%) | | |
| Applicable to 730,881,685 outstanding $.001 par value shares of | | |
| beneficial interest (unlimited authorization) | | 14,873,644 |
| Net Asset Value Per Share | | $20.35 |
8
STAR Fund
| |
| At April 30, 2011, net assets consisted of: | |
| | Amount |
| | ($000) |
| Paid-in Capital | 11,457,115 |
| Undistributed Net Investment Income | 69,266 |
| Accumulated Net Realized Losses | (376,477) |
| Unrealized Appreciation (Depreciation) | 3,723,740 |
| Net Assets | 14,873,644 |
See Note A in Notes to Financial Statements.
See accompanying Notes, which are an integral part of the Financial Statements.
9
STAR Fund
| |
| Statement of Operations | |
| |
| | Six Months Ended |
| | April 30, 2011 |
| | ($000) |
| Investment Income | |
| Income | |
| Income Distributions Received | 193,249 |
| Net Investment Income—Note B | 193,249 |
| Realized Net Gain (Loss) | |
| Capital Gain Distributions Received | 52,018 |
| Investment Securities Sold | 27,872 |
| Realized Net Gain (Loss) | 79,890 |
| Change in Unrealized Appreciation (Depreciation) of Investment Securities | 1,110,412 |
| Net Increase (Decrease) in Net Assets Resulting from Operations | 1,383,551 |
See accompanying Notes, which are an integral part of the Financial Statements.
10
STAR Fund
| | |
| Statement of Changes in Net Assets | | |
| |
| | Six Months Ended | Year Ended |
| | April 30, | October 31, |
| | 2011 | 2010 |
| | ($000) | ($000) |
| Increase (Decrease) in Net Assets | | |
| Operations | | |
| Net Investment Income | 193,249 | 308,798 |
| Realized Net Gain (Loss) | 79,890 | (107,695) |
| Change in Unrealized Appreciation (Depreciation) | 1,110,412 | 1,411,009 |
| Net Increase (Decrease) in Net Assets Resulting from Operations | 1,383,551 | 1,612,112 |
| Distributions | | |
| Net Investment Income | (192,491) | (308,874) |
| Realized Capital Gain1 | (34,477) | (7,840) |
| Total Distributions | (226,968) | (316,714) |
| Capital Share Transactions | | |
| Issued | 767,479 | 1,228,007 |
| Issued in Lieu of Cash Distributions | 218,668 | 305,898 |
| Redeemed | (789,697) | (1,384,905) |
| Net Increase (Decrease) from Capital Share Transactions | 196,450 | 149,000 |
| Total Increase (Decrease) | 1,353,033 | 1,444,398 |
| Net Assets | | |
| Beginning of Period | 13,520,611 | 12,076,213 |
| End of Period2 | 14,873,644 | 13,520,611 |
1 Includes fiscal 2011 and 2010 short-term gain distributions totaling $34,477,000 and $7,840,000, respectively. Short-term gain distributions are treated as ordinary income dividends for tax purposes.
2 Net Assets—End of Period includes undistributed net investment income of $69,266,000 and $68,508,000.
See accompanying Notes, which are an integral part of the Financial Statements.
11
STAR Fund
| | | | | | |
| Financial Highlights | | | | | | |
| |
| Six Months | | | | | |
| | Ended | | | | | |
| For a Share Outstanding | April 30, | | | Year Ended October 31, |
| Throughout Each Period | 2011 | 2010 | 2009 | 2008 | 2007 | 2006 |
| Net Asset Value, Beginning of Period | $18.76 | $16.96 | $15.33 | $22.80 | $21.04 | $19.14 |
| Investment Operations | | | | | | |
| Net Investment Income | .268 | .429 | .516 | .600 | .626 | .533 |
| Capital Gain Distributions Received | .072 | .024 | .142 | .967 | .669 | .378 |
| Net Realized and Unrealized Gain (Loss) | | | | | | |
| on Investments | 1.566 | 1.788 | 2.150 | (7.578) | 1.392 | 1.554 |
| Total from Investment Operations | 1.906 | 2.241 | 2.808 | (6.011) | 2.687 | 2.465 |
| Distributions | | | | | | |
| Dividends from Net Investment Income | (.268) | (.430) | (.552) | (.634) | (.600) | (.510) |
| Distributions from Realized Capital Gains | (.048) | (.011) | (.626) | (.825) | (.327) | (.055) |
| Total Distributions | (.316) | (.441) | (1.178) | (1.459) | (.927) | (.565) |
| Net Asset Value, End of Period | $20.35 | $18.76 | $16.96 | $15.33 | $22.80 | $21.04 |
| |
| Total Return1 | 10.28% | 13.42% | 19.74% | -27.94% | 13.14% | 13.13% |
| |
| Ratios/Supplemental Data | | | | | | |
| Net Assets, End of Period (Millions) | $14,874 | $13,521 | $12,076 | $10,428 | $15,210 | $13,522 |
| Ratio of Total Expenses to | | | | | | |
| Average Net Assets | — | — | — | — | — | — |
| Acquired Fund Fees and Expenses | 0.35% | 0.34% | 0.37% | 0.32% | 0.32% | 0.35% |
| Ratio of Net Investment Income to | | | | | | |
| Average Net Assets | 2.10% | 2.40% | 3.35% | 3.00% | 2.85% | 2.64% |
| Portfolio Turnover Rate | 12% | 22% | 21% | 24% | 8% | 9% |
The expense ratio, acquired fund fees and expenses, net income ratio, and turnover rate for the current period have been annualized.
1 Total returns do not include account service fees that may have applied in the periods shown. Fund prospectuses provide information about any applicable account service fees.
See accompanying Notes, which are an integral part of the Financial Statements.
12
STAR Fund
Notes to Financial Statements
Vanguard STAR Fund is registered under the Investment Company Act of 1940 as an open-end investment company, or mutual fund. The fund follows a balanced investment strategy by investing in selected Vanguard funds. The fund invests 60% to 70% of its net assets in stock funds (predominantly large-capitalization U.S. stock funds), 20% to 30% in intermediate- to long-term bond funds, and 10% to 20% in a short-term bond fund.
A. The following significant accounting policies conform to generally accepted accounting principles for U.S. mutual funds. The fund consistently follows such policies in preparing its financial statements.
1. Security Valuation: Investments are valued at the net asset value of each underlying Vanguard fund determined as of the close of the New York Stock Exchange (generally 4 p.m., Eastern time) on the valuation date.
2. Federal Income Taxes: The fund intends to continue to qualify as a regulated investment company and distribute all of its taxable income. Management has analyzed the fund’s tax positions taken for all open federal income tax years (October 31, 2007–2010), and for the period ended April 30, 2011, and has concluded that no provision for federal income tax is required in the fund’s financial statements.
3. Distributions: Distributions to shareholders are recorded on the ex-dividend date.
4. Other: Income and capital gain distributions received are recorded on the ex-dividend date. Security transactions are accounted for on the date securities are bought or sold. Costs used to determine realized gains (losses) on the sale of investment securities are those of the specific securities sold.
B. Under a service agreement, The Vanguard Group furnishes investment advisory, corporate management, administrative, marketing, and distribution services to the fund. The service agreement provides that the fund’s expenses may be reduced or eliminated to the extent of savings realized by the Vanguard funds by the operation of the fund. Accordingly, all incremental expenses for services provided by Vanguard and all other expenses incurred by the fund during the period ended April 30, 2011, were borne by the funds in which the fund invests. The fund’s trustees and officers are also directors and officers of Vanguard and the funds in which the fund invests.
C. Various inputs may be used to determine the value of the fund’s investments. These inputs are summarized in three broad levels for financial statement purposes. The inputs or methodologies used to value securities are not necessarily an indication of the risk associated with investing in those securities.
Level 1—Quoted prices in active markets for identical securities.
Level 2—Other significant observable inputs (including quoted prices for similar securities, interest rates, prepayment speeds, credit risk, etc.).
Level 3—Significant unobservable inputs (including the fund’s own assumptions used to determine the fair value of investments).
At April 30, 2011, 100% of the fund’s investments were valued based on Level 1 inputs.
D. Distributions are determined on a tax basis and may differ from net investment income and realized capital gains for financial reporting purposes. Differences may be permanent or temporary. Permanent differences are reclassified among capital accounts in the financial statements to reflect their tax character. Temporary differences arise when certain items of income, expense, gain, or loss are recognized in different periods for financial statement and tax purposes; these differences will reverse at some time in the future. Differences in classification may also result from the treatment of short-term gains as ordinary income for tax purposes.
13
STAR Fund
The fund’s tax-basis capital gains and losses are determined only at the end of each fiscal year. For tax purposes, at October 31, 2010, the fund had available capital loss carryforwards totaling $426,531,000 to offset future net capital gains of $299,655,000 through October 31, 2017, and $126,876,000 through October 31, 2018. The fund will use these capital losses to offset net taxable capital gains, if any, realized during the year ending October 31, 2011; should the fund realize net capital losses for the year, the losses will be added to the loss carryforward balance above. Short-term capital gain distributions received are treated as ordinary income for tax purposes, and cannot be offset by capital losses. Capital gain distributions paid during the six months ended April 30, 2011, were from short-term gain distributions received from Vanguard GNMA Fund and Vanguard PRIMECAP Fund.
At April 30, 2011, the cost of investment securities for tax purposes was $11,148,750,000. Net unrealized appreciation of investment securities for tax purposes was $3,723,740,000, consisting entirely of unrealized gains on securities that had risen in value since their purchase.
E. During the six months ended April 30, 2011, the fund purchased $1,086,267,000 of investment securities and sold $859,400,000 of investment securities, other than temporary cash investments.
F. Capital shares issued and redeemed were:
| | |
| | Six Months Ended | Year Ended |
| | April 30, 2011 | October 31, 2010 |
| | Shares | Shares |
| | (000) | (000) |
| Issued | 39,622 | 68,807 |
| Issued in Lieu of Cash Distributions | 11,485 | 17,517 |
| Redeemed | (40,751) | (77,866) |
| Net Increase (Decrease) in Shares Outstanding | 10,356 | 8,458 |
G. In preparing the financial statements as of April 30, 2011, management considered the impact of subsequent events for potential recognition or disclosure in these financial statements.
14
About Your Fund’s Expenses
As a shareholder of the fund, you incur ongoing costs, which include costs for portfolio management, administrative services, and shareholder reports (like this one), among others. Operating expenses, which are deducted from a fund’s gross income, directly reduce the investment return of the fund.
A typical fund’s expenses are expressed as a percentage of its average net assets. The STAR Fund has no direct expenses, but bears its proportionate share of the costs for the underlying funds in which it invests. These indirect expenses make up the acquired fund fees and expenses, also expressed as a percentage of average net assets.
The following examples are intended to help you understand the ongoing cost (in dollars) of investing in your fund and to compare these costs with those of other mutual funds. The examples are based on an investment of $1,000 made at the beginning of the period shown and held for the entire period. The costs were calculated using the acquired fund fees and expenses for the STAR Fund.
The accompanying table illustrates your fund’s costs in two ways:
• Based on actual fund return. This section helps you to estimate the actual expenses that you paid over the period. The ”Ending Account Value“ shown is derived from the fund‘s actual return, and the third column shows the dollar amount that would have been paid by an investor who started with $1,000 in the fund. You may use the information here, together with the amount you invested, to estimate the expenses that you paid over the period.
To do so, simply divide your account value by $1,000 (for example, an $8,600 account value divided by $1,000 = 8.6), then multiply the result by the number given for your fund under the heading ”Expenses Paid During Period.“
• Based on hypothetical 5% yearly return. This section is intended to help you compare your fund‘s costs with those of other mutual funds. It assumes that the fund had a yearly return of 5% before expenses, but that the expense ratio is unchanged. In this case—because the return used is not the fund’s actual return—the results do not apply to your investment. The example is useful in making comparisons because the Securities and Exchange Commission requires all mutual funds to calculate expenses based on a 5% return. You can assess your fund’s costs by comparing this hypothetical example with the hypothetical examples that appear in shareholder reports of other funds.
Note that the expenses shown in the table are meant to highlight and help you compare ongoing costs only and do not reflect transaction costs incurred by the fund for buying and selling securities. Further, the expenses do not include any purchase, redemption, or account service fees described in the fund prospectus. If such fees were applied to your account, your costs would be higher. Your fund does not carry a “sales load.”
The calculations assume no shares were bought or sold during the period. Your actual costs may have been higher or lower, depending on the amount of your investment and the timing of any purchases or redemptions.
You can find more information about the fund’s expenses, including annual expense ratios, in the Financial Statements section of this report. For additional information on operating expenses and other shareholder costs, please refer to your fund’s current prospectus.
15
| | | |
| Six Months Ended April 30, 2011 | | | |
| | Beginning | Ending | Expenses |
| | Account Value | Account Value | Paid During |
| STAR Fund | 10/31/2010 | 4/30/2011 | Period |
| Based on Actual Fund Return | $1,000.00 | $1,102.76 | $1.82 |
| Based on Hypothetical 5% Yearly Return | 1,000.00 | 1,023.06 | 1.76 |
The calculations are based on acquired fund fees and expenses charged by the underlying mutual funds in which the STAR Fund invests. The STAR Fund’s annualized expense figure for the period is 0.35%. The dollar amounts shown as ”Expenses Paid” are equal to the annualized average weighted expense ratio for the underlying funds multiplied by the average account value over the period, multiplied by the number of days in the most recent six-month period, then divided by the number of days in the most recent 12-month period.
16
Trustees Approve Advisory Arrangement
The board of trustees of Vanguard STAR Fund has renewed the fund’s investment advisory arrangement with The Vanguard Group, Inc. Vanguard—through its Quantitative Equity Group—serves as the investment advisor for the limited purpose of investing the fund’s cash in futures. The board determined that continuing the fund’s limited-purpose investment management arrangement with Vanguard was in the best interests of the fund and its shareholders.
The board based its decision upon an evaluation of the advisor’s investment staff, portfolio management process, and performance. The trustees considered the factors discussed below, among others. However, no single factor determined whether the board approved the arrangement. Rather, it was the totality of the circumstances that drove the board’s decision.
Nature, extent, and quality of services
The board considered the quality of the limited-purpose investment management services provided to the fund since 2009, and took into account the organizational depth and stability of the advisor. Vanguard has been managing investments for more than three decades. The Quantitative Equity Group adheres to a sound, disciplined investment management process; the team has considerable experience, stability, and depth.
The board concluded that Vanguard’s experience, stability, depth, and performance, among other factors, warranted continuation of the arrangement.
Investment performance
The board considered the fund’s performance since 2009, including its performance compared with that of its relevant benchmark and peer group. The board concluded that Vanguard has performed its cash management duties in line with expectations, and that the results have been consistent with the fund’s investment strategy. Information about the fund’s most recent performance can be found in the Performance Summary section of this report.
Cost
The board concluded that the fund’s acquired fund fees and expenses were well below the average expense ratio charged by funds in its peer group. The fund does not incur advisory expenses directly; however, the board noted that each of the underlying funds in which the fund invests has advisory expenses well below the relevant peer-group average. Information about the fund’s acquired fund fees and expenses appears in the About Your Fund’s Expenses section of this report as well as in the Financial Statements section.
The board does not conduct a profitability analysis of Vanguard because of Vanguard’s unique “at-cost” structure. Unlike most other mutual fund management companies, Vanguard is owned by the funds it oversees, and produces “profits” only in the form of reduced expenses for fund shareholders.
The benefit of economies of scale
The board concluded that Vanguard’s low-cost arrangement with the STAR Fund and its underlying funds ensures that the fund will realize economies of scale as it grows, with the cost to shareholders declining as the fund’s assets increase.
The board will consider whether to renew the advisory arrangement again after a one-year period.
17
Glossary
30-Day SEC Yield. A fund’s 30-day SEC yield is derived using a formula specified by the U.S. Securities and Exchange Commission. Under the formula, data related to the fund’s security holdings in the previous 30 days are used to calculate the fund’s hypothetical net income for that period, which is then annualized and divided by the fund’s estimated average net assets over the calculation period. For the purposes of this calculation, a security’s income is based on its current market yield to maturity (in the case of bonds) or its projected dividend yield (for stocks). Because the SEC yield represents hypothetical annualized income, it will differ—at times significantly—from the fund’s actual experience. As a result, the fund’s income distributions may be higher or lower than implied by the SEC yield.
Acquired Fund Fees and Expenses. Funds that invest in other Vanguard funds incur no direct expenses, but they do bear proportionate shares of the operating, administrative, and advisory expenses of the underlying funds, and they must pay any fees charged by those funds. The figure for acquired fund fees and expenses represents a weighted average of these underlying costs. Acquired is a term that the Securities and Exchange Commission applies to any mutual fund whose shares are owned by another fund.
Beta. A measure of the magnitude of a fund’s past share-price fluctuations in relation to the ups and downs of a given market index. The index is assigned a beta of 1.00. Compared with a given index, a fund with a beta of 1.20 typically would have seen its share price rise or fall by 12% when the index rose or fell by 10%. For this report, beta is based on returns over the past 36 months for both the fund and the index. Note that a fund’s beta should be reviewed in conjunction with its R-squared (see definition). The lower the R-squared, the less correlation there is between the fund and the index, and the less reliable beta is as an indicator of volatility.
Expense Ratio. The percentage of a fund’s average net assets used to pay its annual administrative and advisory expenses. These expenses directly reduce returns to investors.
Inception Date. The date on which the assets of a fund (or one of its share classes) are first invested in accordance with the fund’s investment objective. For funds with a subscription period, the inception date is the day after that period ends. Investment performance is measured from the inception date.
R-Squared. A measure of how much of a fund’s past returns can be explained by the returns from the market in general, as measured by a given index. If a fund’s total returns were precisely synchronized with an index’s returns, its R-squared would be 1.00. If the fund’s returns bore no relationship to the index’s returns, its R-squared would be 0. For this report, R-squared is based on returns over the past 36 months for both the fund and the index.
18
This page intentionally left blank.
The People Who Govern Your Fund
The trustees of your mutual fund are there to see that the fund is operated and managed in your best interests since, as a shareholder, you are a part owner of the fund. Your fund’s trustees also serve on the board of directors of The Vanguard Group, Inc., which is owned by the Vanguard funds and provides services to them on an at-cost basis.
A majority of Vanguard’s board members are independent, meaning that they have no affiliation with Vanguard or the funds they oversee, apart from the sizable personal investments they have made as private individuals. The independent board members have distinguished backgrounds in business, academia, and public service. Each of the trustees and executive officers oversees 179 Vanguard funds.
The following table provides information for each trustee and executive officer of the fund. More information about the trustees is in the Statement of Additional Information, which can be obtained, without charge, by contacting Vanguard at 800-662-7447, or online at vanguard.com.
| |
| Interested Trustee1 | and President (2006–2008) of Rohm and Haas Co. |
| | (chemicals); Director of Tyco International, Ltd. |
| F. William McNabb III | (diversified manufacturing and services) and Hewlett- |
| Born 1957. Trustee Since July 2009. Chairman of the | Packard Co. (electronic computer manufacturing); |
| Board. Principal Occupation(s) During the Past Five | Senior Advisor at New Mountain Capital; Trustee |
| Years: Chairman of the Board of The Vanguard Group, | of The Conference Board; Member of the Board of |
| Inc., and of each of the investment companies served | Managers of Delphi Automotive LLP (automotive |
| by The Vanguard Group, since January 2010; Director | components). |
| of The Vanguard Group since 2008; Chief Executive | |
| Officer and President of The Vanguard Group and of | Amy Gutmann |
| each of the investment companies served by The | Born 1949. Trustee Since June 2006. Principal |
| Vanguard Group since 2008; Director of Vanguard | Occupation(s) During the Past Five Years: President |
| Marketing Corporation; Managing Director of The | of the University of Pennsylvania; Christopher H. |
| Vanguard Group (1995–2008). | Browne Distinguished Professor of Political Science |
| | in the School of Arts and Sciences with secondary |
| | appointments at the Annenberg School for Commu- |
| Independent Trustees | nication and the Graduate School of Education |
| | of the University of Pennsylvania; Director of |
| Emerson U. Fullwood | Carnegie Corporation of New York, Schuylkill River |
| Born 1948. Trustee Since January 2008. Principal | Development Corporation, and Greater Philadelphia |
| Occupation(s) During the Past Five Years: Executive | Chamber of Commerce; Trustee of the National |
| Chief Staff and Marketing Officer for North America | Constitution Center; Chair of the Presidential |
| and Corporate Vice President (retired 2008) of Xerox | Commission for the Study of Bioethical Issues. |
| Corporation (document management products and | |
| services); Executive in Residence and 2010 | JoAnn Heffernan Heisen |
| Distinguished Minett Professor at the Rochester | Born 1950. Trustee Since July 1998. Principal |
| Institute of Technology; Director of SPX Corporation | Occupation(s) During the Past Five Years: Corporate |
| (multi-industry manufacturing), the United Way of | Vice President and Chief Global Diversity Officer |
| Rochester, Amerigroup Corporation (managed health | (retired 2008) and Member of the Executive |
| care), the University of Rochester Medical Center, | Committee (1997–2008) of Johnson & Johnson |
| Monroe Community College Foundation, and North | (pharmaceuticals/consumer products); Director of |
| Carolina A&T University. | Skytop Lodge Corporation (hotels), the University |
| | Medical Center at Princeton, the Robert Wood |
| Rajiv L. Gupta | Johnson Foundation, and the Center for Work Life |
| Born 1945. Trustee Since December 2001.2 | Policy; Member of the Advisory Board of the |
| Principal Occupation(s) During the Past Five Years: | Maxwell School of Citizenship and Public Affairs |
| Chairman and Chief Executive Officer (retired 2009) | at Syracuse University. |
| | |
| F. Joseph Loughrey | Thomas J. Higgins | |
| Born 1949. Trustee Since October 2009. Principal | Born 1957. Chief Financial Officer Since September |
| Occupation(s) During the Past Five Years: President | 2008. Principal Occupation(s) During the Past Five |
| and Chief Operating Officer (retired 2009) and Vice | Years: Principal of The Vanguard Group, Inc.; Chief |
| Chairman of the Board (2008–2009) of Cummins Inc. | Financial Officer of each of the investment companies |
| (industrial machinery); Director of SKF AB (industrial | served by The Vanguard Group since 2008; Treasurer |
| machinery), Hillenbrand, Inc. (specialized consumer | of each of the investment companies served by The |
| services), the Lumina Foundation for Education, and | Vanguard Group (1998–2008). |
| Oxfam America; Chairman of the Advisory Council | | |
| for the College of Arts and Letters and Member | Kathryn J. Hyatt | |
| of the Advisory Board to the Kellogg Institute for | Born 1955. Treasurer Since November 2008. Principal |
| International Studies at the University of Notre Dame. | Occupation(s) During the Past Five Years: Principal |
| | of The Vanguard Group, Inc.; Treasurer of each of |
| André F. Perold | the investment companies served by The Vanguard |
| Born 1952. Trustee Since December 2004. Principal | Group since 2008; Assistant Treasurer of each of the |
| Occupation(s) During the Past Five Years: George | investment companies served by The Vanguard Group |
| Gund Professor of Finance and Banking at the Harvard | (1988–2008). | |
| Business School; Chair of the Investment Committee | | |
| of HighVista Strategies LLC (private investment firm). | Heidi Stam | |
| | Born 1956. Secretary Since July 2005. Principal |
| Alfred M. Rankin, Jr. | Occupation(s) During the Past Five Years: Managing |
| Born 1941. Trustee Since January 1993. Principal | Director of The Vanguard Group, Inc., since 2006; |
| Occupation(s) During the Past Five Years: Chairman, | General Counsel of The Vanguard Group since 2005; |
| President, and Chief Executive Officer of NACCO | Secretary of The Vanguard Group and of each of the |
| Industries, Inc. (forklift trucks/housewares/lignite); | investment companies served by The Vanguard Group |
| Director of Goodrich Corporation (industrial products/ | since 2005; Director and Senior Vice President of |
| aircraft systems and services) and the National | Vanguard Marketing Corporation since 2005; |
| Association of Manufacturers; Chairman of the | Principal of The Vanguard Group (1997–2006). |
| Federal Reserve Bank of Cleveland; Vice Chairman | | |
| of University Hospitals of Cleveland; President of | | |
| the Board of The Cleveland Museum of Art. | Vanguard Senior Management Team |
| |
| Peter F. Volanakis | R. Gregory Barton | Michael S. Miller |
| Born 1955. Trustee Since July 2009. Principal | Mortimer J. Buckley | James M. Norris |
| Occupation(s) During the Past Five Years: President | Kathleen C. Gubanich | Glenn W. Reed |
| and Chief Operating Officer (retired 2010) of Corning | Paul A. Heller | George U. Sauter |
| Incorporated (communications equipment); Director of | Martha G. King | |
| Corning Incorporated (2000–2010) and Dow Corning | | |
| (2001–2010); Overseer of the Amos Tuck School of | | |
| Business Administration at Dartmouth College. | Chairman Emeritus and Senior Advisor |
| |
| | John J. Brennan | |
| Executive Officers | Chairman, 1996–2009 | |
| | Chief Executive Officer and President, 1996–2008 |
| Glenn Booraem | | |
| Born 1967. Controller Since July 2010. Principal | | |
| Occupation(s) During the Past Five Years: Principal | Founder | |
| of The Vanguard Group, Inc.; Controller of each of | | |
| the investment companies served by The Vanguard | John C. Bogle | |
| Group since 2010; Assistant Controller of each of | Chairman and Chief Executive Officer, 1974–1996 |
| the investment companies served by The Vanguard | | |
| Group (2001–2010). | | |
1 Mr. McNabb is considered an “interested person,” as defined in the Investment Company Act of 1940, because he is an officer of the Vanguard funds.
2 December 2002 for Vanguard Equity Income Fund, Vanguard Growth Equity Fund, the Vanguard Municipal Bond Funds, and the Vanguard State Tax-Exempt Funds.
|  |
| P.O. Box 2600 |
| Valley Forge, PA 19482-2600 |
Connect with Vanguard® > vanguard.com
| |
| Fund Information > 800-662-7447 | |
| Direct Investor Account Services > 800-662-2739 | |
| Institutional Investor Services > 800-523-1036 | |
| Text Telephone for People | |
| With Hearing Impairment > 800-749-7273 | |
| |
| This material may be used in conjunction | |
| with the offering of shares of any Vanguard | |
| fund only if preceded or accompanied by | |
| the fund’s current prospectus. | |
| |
| All comparative mutual fund data are from Lipper Inc. or | |
| Morningstar, Inc., unless otherwise noted. | |
| |
| You can obtain a free copy of Vanguard’s proxy voting | |
| guidelines by visiting vanguard.com/proxyreporting or by | |
| calling Vanguard at 800-662-2739. The guidelines are | |
| also available from the SEC’s website, sec.gov. In | |
| addition, you may obtain a free report on how your fund | |
| voted the proxies for securities it owned during the 12 | |
| months ended June 30. To get the report, visit either | |
| vanguard.com/proxyreporting or sec.gov. | |
| |
| You can review and copy information about your fund at | |
| the SEC’s Public Reference Room in Washington, D.C. To | |
| find out more about this public service, call the SEC at | |
| 202-551-8090. Information about your fund is also | |
| available on the SEC’s website, and you can receive | |
| copies of this information, for a fee, by sending a | |
| request in either of two ways: via e-mail addressed to | |
| publicinfo@sec.gov or via regular mail addressed to the | |
| Public Reference Section, Securities and Exchange | |
| Commission, Washington, DC 20549-1520. | |
| | © 2011 The Vanguard Group, Inc. |
| | All rights reserved. |
| | Vanguard Marketing Corporation, Distributor. |
| |
| | Q562 062011 |
 |
| Vanguard LifeStrategy® Funds |
| Semiannual Report |
|
| April 30, 2011 |
| |
 |
| |
| Vanguard LifeStrategy Income Fund |
| Vanguard LifeStrategy Conservative Growth Fund |
| Vanguard LifeStrategy Moderate Growth Fund |
| Vanguard LifeStrategy Growth Fund |
|
|
|
> For the six months ended April 30, 2011, returns for the Vanguard LifeStrategy Funds ranged from almost 4% for the Income Fund to more than 13% for the Growth Fund.
> U.S. equities outperformed their international counterparts for the period, while stocks significantly outpaced bonds.
> Returns for the five underlying Vanguard funds represented in the LifeStrategy portfolios ranged from about 0% for the Total Bond Market II Index Fund to almost 18% for the Total Stock Market Index Fund.
| |
| Contents | |
| Your Fund’s Total Returns. | 1 |
| Chairman’s Letter. | 2 |
| LifeStrategy Income Fund. | 8 |
| LifeStrategy Conservative Growth Fund. | 17 |
| LifeStrategy Moderate Growth Fund. | 26 |
| LifeStrategy Growth Fund. | 34 |
| About Your Fund’s Expenses. | 43 |
| Glossary. | 45 |
Please note: The opinions expressed in this report are just that—informed opinions. They should not be considered promises or advice. Also, please keep in mind that the information and opinions cover the period through the date on the front of this report. Of course, the risks of investing in your fund are spelled out in the prospectus.
See the Glossary for definitions of investment terms used in this report.
Cover photograph: Jean Maher.
Your Fund’s Total Returns
| |
| Six Months Ended April 30, 2011 | |
| | Total |
| | Returns |
| Vanguard LifeStrategy Income Fund | 3.91% |
| Income Composite Index | 3.50 |
| Income Composite Average | 4.46 |
| Vanguard LifeStrategy Conservative Growth Fund | 7.06% |
| Conservative Growth Composite Index | 6.67 |
| Conservative Growth Composite Average | 7.48 |
| Vanguard LifeStrategy Moderate Growth Fund | 10.21% |
| Moderate Growth Composite Index | 9.69 |
| Moderate Growth Composite Average | 10.91 |
| Vanguard LifeStrategy Growth Fund | 13.55% |
| Growth Composite Index | 12.97 |
| Growth Composite Average | 14.06 |
Total returns for the composite indexes are derived by applying the funds’ target allocations to the results of the following benchmarks: for U.S. stocks, the MSCI US Broad Market Index; for international stocks, the MSCI EAFE Index through December 15, 2010, and the MSCI ACWI ex USA IMI Index thereafter; for bonds, the Barclays Capital U.S. Aggregate Float Adjusted Index; and for short-term investments, the Barclays Capital U.S. 1–3 Year Credit Index.
Each average is a blended composite that weights the return of the comparable mutual funds average for each asset class in proportion to the target weighting of the appropriate LifeStrategy Fund. All average returns for funds are derived from data provided by Lipper Inc. The Income Composite Average is weighted 60% fixed income funds average, 20% money market funds average, 14% general equity funds average, and 6% international funds average. The Conservative Growth Composite Average is weighted 40% fixed income funds average, 28% general equity funds average, 20% money market funds average, and 12% international funds average. The Moderate Growth Composite Average is weighted 42% general equity funds average, 40% fixed income funds average, and 18% international funds average. The Growth Composite Average is weighted 56% general equity funds average, 24% international funds average, and 20% fixed income funds average.
1

Chairman’s Letter
Dear Shareholder,
Global stock markets continued to post impressive gains for the six months ended April 30, 2011. U.S. stocks fared better than international stocks, but both posted double-digit returns. The U.S. bond market was essentially flat for the period. In this investment environment, the four Vanguard LifeStrategy Funds performed as we might expect: The funds more heavily invested in stocks outperformed those with a heavier tilt toward bonds.
Despite turbulence in the bond market, the stock market’s strong performance helped all four LifeStrategy Funds post gains, ranging from about 4% for Vanguard LifeStrategy Income Fund to more than 13% for Vanguard LifeStrategy Growth Fund. Vanguard LifeStrategy Moderate Growth Fund and Vanguard LifeStrategy Conservative Growth Fund fell in between, with returns of about 10% and 7%, respectively.
Vanguard Asset Allocation Fund represented about 20% of assets for each of the LifeStrategy Funds. The fund—which may vary its mix of assets in stocks, bonds, and cash—returned more than 12% for the six months, outperforming its benchmark by almost 4 percentage points and boosting results for all four LifeStrategy Funds.
2
The Asset Allocation Fund previously accounted for about 25% of each fund’s assets. At the end of 2010, when we increased the funds’ exposure to international stocks, we reduced their holdings in the U.S.focused Asset Allocation Fund.
On April 30, the yields of the two more incomeoriented LifeStrategy Funds, the Conservative Growth Fund and the Income Fund, were 2.25% and 2.54%, respectively. Both funds had yields of 2.30% six months ago.
Strong returns around the globe
The headlines were dominated by political upheaval, natural and nuclear disaster, and economic distress, but global stock markets produced outstanding returns for the six months ended April 30. The broad U.S. stock market returned more than 17%. Although rising food and gasoline prices put pressure on consumer budgets, corporate earnings growth remained strong and the pace of new job creation bounced back from extremely depressed levels.
For U.S.based investors, international stock markets produced a smaller but still robust sixmonth return of 12.44% in U.S. dollars. Almost half of this return reflected exchangerate gains produced largely by strength in the euro and currencies in emerging economies.
| | | |
| Market Barometer | | | |
| |
| | | Total Returns |
| | | Periods Ended April 30, 2011 |
| | Six | One | Five Years |
| | Months | Year | (Annualized) |
| Stocks | | | |
| Russell 1000 Index (Large-caps) | 17.12% | 18.02% | 3.30% |
| Russell 2000 Index (Small-caps) | 23.73 | 22.20 | 3.89 |
| Dow Jones U.S. Total Stock Market Index | 17.28 | 18.40 | 3.65 |
| MSCI All Country World Index ex USA (International) | 12.44 | 19.73 | 3.55 |
| |
| Bonds | | | |
| Barclays Capital U.S. Aggregate Bond Index (Broad | | | |
| taxable market) | 0.02% | 5.36% | 6.33% |
| Barclays Capital Municipal Bond Index (Broad | | | |
| tax-exempt market) | -1.68 | 2.20 | 4.52 |
| Citigroup Three-Month U.S. Treasury Bill Index | 0.06 | 0.15 | 2.02 |
| |
| CPI | | | |
| Consumer Price Index | 2.83% | 3.16% | 2.22% |
3
As the economy found its footing, rates edged higher
Rising longerterm interest rates put pressure on bond prices, which led to modest bond market returns for the sixmonth period. The broad taxable U.S. bond market returned about 0%. The broad municipal market returned –1.68%. The rise in rates reflected both confidence that the economic recovery would prove selfsustaining and thus nudge rates higher, and anxiety that higher rates would be necessary to provide some protection from inflation. Even so, inflation expectations remained subdued, as measured by the difference between the yields of inflationprotected and nominal U.S. Treasury bonds.
The return on shortterm money market instruments such as the 3month U.S. Treasury bill remained near 0%, consistent with the Federal Reserve Board’s target for shortterm rates.
A strong stock market powered the funds’ returns
The LifeStrategy Funds are a series of broadly diversified, lowcost “funds of funds” that can provide a complete portfolio in a single fund. The four funds have different allocations to domestic and international stocks, bonds, and shortterm reserves and target different levels of risk. Four underlying Vanguard funds are included in each of the four LifeStrategy Fund portfolios: Vanguard Total Stock
| | |
| Expense Ratios | | |
| Your Fund Compared With Its Peer Group | | |
| | Acquired Fund Fees | Peer Group |
| | and Expenses | Average |
| LifeStrategy Income Fund | 0.18% | 0.93% |
| LifeStrategy Conservative Growth Fund | 0.19 | 1.01 |
| LifeStrategy Moderate Growth Fund | 0.19 | 1.20 |
| LifeStrategy Growth Fund | 0.20 | 1.28 |
The fund expense figures shown—drawn from the prospectus dated February 28, 2011—represent an estimate of the weighted average of the expense ratios and any transaction fees charged by the underlying mutual funds (the ”acquired” funds) in which the LifeStrategy Funds invest. The LifeStrategy Funds do not charge any expenses or fees of their own. For the six months ended April 30, 2011, the annualized acquired fund fees and expenses were 0.18% for the LifeStrategy Income Fund, 0.20% for the LifeStrategy Conservative Growth Fund, 0.19% for the LifeStrategy Moderate Growth Fund, and 0.21% for the LifeStrategy Growth Fund.
Peer groups are the composites listed on page 1. Their expense figures are derived by applying the appropriate allocations to average expense ratios of these mutual fund peer groups: fixed income funds, general equity funds, international funds, and money market funds. Average expense ratios for these groups are derived from data provided by Lipper Inc. and capture information through year-end 2010.
4
Market Index Fund, Vanguard Total International Stock Index Fund, Vanguard Total Bond Market II Index Fund, and the Asset Allocation Fund. A fifth underlying fund, Vanguard ShortTerm InvestmentGrade Fund, also makes up part of the LifeStrategy Income and LifeStrategy Conservative Growth Funds.
Given that stocks significantly outperformed bonds during the sixmonth period, it’s no surprise that the Growth Fund and the Moderate Growth Fund—which held about 86% and 66% of their assets, respectively, in stocks at the end of the period—outperformed their more conservative counterparts. The Conservative Growth Fund, whose equity holdings represented about 46% of assets at the end of the period, was the next in line with gains of about 7%. The Income Fund held only about 27% in equities as of the end of the period, but still managed to post a gain of almost 4%.
Of the underlying funds, the Total Stock Market Index Fund was the top performer for the period, returning about 18%, followed by the Asset Allocation Fund at about 13%, the Total International Stock Index Fund at about 12%, the ShortTerm InvestmentGrade Fund at about 1%, and the Total Bond Market II Index Fund at about 0%. (All returns are for Investor Shares.)
For most of the six months, the actively managed Asset Allocation Fund was invested 80% in stocks and 20% in bonds. Toward the end of the period, the advisor shifted to an allocation of 90% stocks and 10% bonds.
The Asset Allocation Fund’s heavier tilt toward stocks helped it to outpace its benchmark, which maintains a consistent allocation of 65% stocks, as represented by the S&P 500 Index, and 35% bonds, as represented by the Barclays Capital U.S. Long Treasury Bond Index. The fund’s performance helped all four LifeStrategy Funds outperform their benchmarks, which are composite indexes that reflect the funds’ target allocations.
Volatility is inevitable, so focus on the future
While the stock market turned in impressive results for the most recent sixmonth period, the bond market’s performance was flat. As investors, we’ve come to expect periods like this—when one asset class does better than another—as well as times when both stocks and bonds perform exceptionally well, quite poorly, or somewhere in between. The financial markets are unpredictable, and we can never be sure what they’ll do next.
5
class does better than another—as well as times when both stocks and bonds perform exceptionally well, quite poorly, or somewhere in between. The financial markets are unpredictable, and we can never be sure what they’ll do next.
At Vanguard, we believe that the best way to deal with the market’s shortterm volatility is to look beyond it and, instead, focus on the long term. We counsel investors to create an investment plan that includes a mix of stock, bond, and money market funds that is appropriate for their goals and risk tolerance—and to stick with that plan regardless of market conditions.
Each of Vanguard’s LifeStrategy Funds, which offer a variety of asset mixes and low expenses, can provide a wellbalanced portfolio on its own. With options ranging from conservative to much more aggressive, you can pick the fund that is best suited to your needs.
As always, thank you for entrusting your assets to Vanguard.
Sincerely,

F. William McNabb III
Chairman and Chief Executive Officer
May 10, 2011
6
| | | | |
| Your Fund’s Performance at a Glance | | | | |
| October 31, 2010 , Through April 30, 2011 | | | | |
| | | | Distributions Per Share |
| | Starting | Ending | Income | Capital |
| | Share Price | Share Price | Dividends | Gains |
| Vanguard LifeStrategy Income Fund | $14.15 | $14.47 | $0.192 | $0.034 |
| Vanguard LifeStrategy Conservative Growth | | | | |
| Fund | $16.20 | $17.10 | $0.210 | $0.024 |
| Vanguard LifeStrategy Moderate Growth Fund | $19.22 | $20.85 | $0.282 | $0.030 |
| Vanguard LifeStrategy Growth Fund | $21.28 | $23.83 | $0.299 | $0.009 |
| | | | | | |
| Target and Actual Asset Allocations | | | | | |
| Percentages as of April 30, 2011 | | | | | | |
| | | Stocks | | Bonds | Short-Term Reserves |
| | Target | Actual | Target | Actual | Target | Actual |
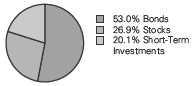
| LifeStrategy Income Fund | 22.5% | 26.9% | 57.5% | 53.0% | 20.0% | 20.1% |
| LifeStrategy Conservative | 42.5% | 46.3% | 37.5% | 33.0% | 20.0% | 20.7% |
| Growth Fund | | | | | | |
| LifeStrategy Moderate Growth | 62.5% | 66.4% | 37.5% | 33.6% | 0.0% | 0.0% |
| Fund | | | | | | |
| LifeStrategy Growth Fund | 82.5% | 86.2% | 17.5% | 13.8% | 0.0% | 0.0% |
Actual international stock positions for the Income, Conservative Growth, Moderate Growth, and Growth Funds equaled 6.7%, 12.5%, 18.5%, and 24.5% of assets, respectively.
7
LifeStrategy Income Fund
Fund Profile
As of April 30, 2011
| |
| Total Fund Characteristics | |
| Ticker Symbol | VASIX |
| 30-Day SEC Yield | 2.54% |
| Acquired Fund Fees and Expenses1 | 0.18% |
| |
| Allocation to Underlying Vanguard Funds | |
| Vanguard Total Bond Market II Index Fund | |
| Investor Shares | 51.0% |
| Vanguard Asset Allocation Fund Investor | |
| Shares | 20.3 |
| Vanguard Short-Term Investment-Grade | |
| Fund Investor Shares | 20.1 |
| Vanguard Total International Stock Index | |
| Fund Investor Shares | 6.7 |
| Vanguard Total Stock Market Index Fund | |
| Investor Shares | 1.9 |
| | |
| Total Fund Volatility Measures | |
| | | Barclays |
| | Income | Aggregate |
| | Composite | Bond |
| | Index | Index |
| R-Squared | 0.98 | 0.37 |
| Beta | 1.18 | 1.07 |
These measures show the degree and timing of the fund’s fluctuations compared with the indexes over 36 months.
Fund Asset Allocation
1 This figure—drawn from the prospectus dated February 28, 2011—represents an estimate of the weighted average of the expense ratios and any transaction fees charged by the underlying mutual funds (the ”acquired” funds) in which the LifeStrategy Income Fund invests. The LifeStrategy Income Fund does not charge any expenses or fees of its own. For the six months ended April 30, 2011, the annualized acquired fund fees and expenses were 0.18%.
8
LifeStrategy Income Fund
Performance Summary
All of the returns in this report represent past performance, which is not a guarantee of future results that may be achieved by the fund. (Current performance may be lower or higher than the performance data cited. For performance data current to the most recent month-end, visit our website at vanguard.com/performance.) Note, too, that both investment returns and principal value can fluctuate widely, so an investor’s shares, when sold, could be worth more or less than their original cost. The returns shown do not reflect taxes that a shareholder would pay on fund distributions or on the sale of fund shares.
Fiscal-Year Total Returns (%): October 31, 2000, Through April 30, 2011

Income Composite Index: Weighted 60% Barclays Capital U.S. Aggregate Bond Index, 20% Dow Jones U.S. Total Stock Market Index, and 20% Citigroup Three-Month Treasury Bill Index through August 31, 2003; 60% Barclays Capital U.S. Aggregate Bond Index, 20% Dow Jones U.S. Total Stock Market Index, and 20% Barclays Capital U.S. 1–3 Year Credit Bond Index through April 22, 2005; 60% Barclays Capital U.S. Aggregate Bond Index through December 31, 2009, and Barclays Capital U.S. Aggregate Float Adjusted Index thereafter, 20% MSCI US Broad Market Index, and 20% Barclays Capital U.S. 1–3 Year Credit Bond Index through December 15, 2010; and 60% Barclays Capital U.S. Aggregate Float Adjusted Index, 20% Barclays Capital U.S. 1–3 Year Credit Bond Index, 14% MSCI US Broad Market Index, and 6% MSCI ACWI ex USA IMI Index thereafter. MSCI international benchmark returns are adjusted for withholding taxes applicable to Luxembourg holding companies.
Note: For 2011, performance data reflect the six months ended April 30, 2011.
Average Annual Total Returns: Periods Ended March 31, 2011
This table presents returns through the latest calendar quarter—rather than through the end of the fiscal period. Securities and Exchange Commission rules require that we provide this information.
| | | | | | |
| | | | | | | Ten Years |
| | Inception Date | One Year | Five Years | Income | Capital | Total |
| LifeStrategy Income Fund | 9/30/1994 | 8.11% | 4.85% | 3.82% | 1.19% | 5.01% |
See Financial Highlights for dividend and capital gains information.
9
LifeStrategy Income Fund
Financial Statements (unaudited)
Statement of Net Assets
As of April 30, 2011
The fund reports a complete list of its holdings in regulatory filings four times in each fiscal year, at the quarter-ends. For the second and fourth fiscal quarters, the lists appear in the fund’s semiannual and annual reports to shareholders. For the first and third fiscal quarters, the fund files the lists with the Securities and Exchange Commission on Form N-Q. Shareholders can look up the fund’s Forms N-Q on the SEC’s website at sec.gov. Forms N-Q may also be reviewed and copied at the SEC’s Public Reference Room (see the back cover of this report for further information).
| | |
| | | Market |
| | | Value |
| | Shares | ($000) |
| Investment Companies (99.9%) | | |
| U.S. Stock Fund (1.9%) | | |
| Vanguard Total Stock Market Index Fund Investor Shares | 1,337,197 | 46,040 |
| |
| International Stock Fund (6.7%) | | |
| Vanguard Total International Stock Index Fund Investor Shares | 9,506,325 | 162,368 |
| Balanced Fund (20.3%) | | |
| Vanguard Asset Allocation Fund Investor Shares | 18,549,370 | 490,445 |
| |
| Bond Fund (50.9%) | | |
| 1 Vanguard Total Bond Market II Index Fund Investor Shares | 116,407,826 | 1,229,267 |
| |
| Short-Term Bond Fund (20.1%) | | |
| Vanguard Short-Term Investment-Grade Fund Investor Shares | 44,996,469 | 485,062 |
| Total Investment Companies (Cost $2,188,402) | | 2,413,182 |
| Temporary Cash Investment (0.1%) | | |
| Money Market Fund (0.1%) | | |
| 1 Vanguard Market Liquidity Fund, 0.179% (Cost $2,056) | 2,056,311 | 2,056 |
| Total Investments (100.0%) (Cost $2,190,458) | | 2,415,238 |
| Other Assets and Liabilities (0.0%) | | |
| Other Assets | | 8,069 |
| Liabilities | | (9,170) |
| | | (1,101) |
| Net Assets (100%) | | |
| Applicable to 166,850,909 outstanding $.001 par value shares of | | |
| beneficial interest (unlimited authorization) | | 2,414,137 |
| Net Asset Value Per Share | | $14.47 |
10
LifeStrategy Income Fund
| |
| At April 30, 2011, net assets consisted of: | |
| | Amount |
| | ($000) |
| Paid-in Capital | 2,183,479 |
| Undistributed Net Investment Income | 4,659 |
| Accumulated Net Realized Gains | 1,219 |
| Unrealized Appreciation (Depreciation) | 224,780 |
| Net Assets | 2,414,137 |
See Note A in Notes to Financial Statements.
1 Affiliated fund available only to Vanguard funds and certain trusts and accounts managed by Vanguard. Rate shown for Vanguard Market Liquidity Fund is the 7-day yield.
See accompanying Notes, which are an integral part of the Financial Statements.
11
LifeStrategy Income Fund
| |
| Statement of Operations | |
| |
| | Six Months Ended |
| | April 30, 2011 |
| | ($000) |
| Investment Income | |
| Income | |
| Income Distributions Received | 30,975 |
| Net Investment Income—Note B | 30,975 |
| Realized Net Gain (Loss) | |
| Capital Gain Distributions Received | 9,482 |
| Investment Securities Sold | 28,449 |
| Realized Net Gain (Loss) | 37,931 |
| Change in Unrealized Appreciation (Depreciation) of Investment Securities | 21,103 |
| Net Increase (Decrease) in Net Assets Resulting from Operations | 90,009 |
See accompanying Notes, which are an integral part of the Financial Statements.
12
LifeStrategy Income Fund
| | |
| Statement of Changes in Net Assets | | |
| |
| | Six Months Ended | Year Ended |
| | April 30, | October 31, |
| | 2011 | 2010 |
| | ($000) | ($000) |
| Increase (Decrease) in Net Assets | | |
| Operations | | |
| Net Investment Income | 30,975 | 57,632 |
| Realized Net Gain (Loss) | 37,931 | 502 |
| Change in Unrealized Appreciation (Depreciation) | 21,103 | 138,741 |
| Net Increase (Decrease) in Net Assets Resulting from Operations | 90,009 | 196,875 |
| Distributions | | |
| Net Investment Income | (31,163) | (57,384) |
| Realized Capital Gain1 | (5,458) | — |
| Total Distributions | (36,621) | (57,384) |
| Capital Share Transactions | | |
| Issued | 327,345 | 634,215 |
| Issued in Lieu of Cash Distributions | 34,464 | 53,652 |
| Redeemed | (252,066) | (360,822) |
| Net Increase (Decrease) from Capital Share Transactions | 109,743 | 327,045 |
| Total Increase (Decrease) | 163,131 | 466,536 |
| Net Assets | | |
| Beginning of Period | 2,251,006 | 1,784,470 |
| End of Period2 | 2,414,137 | 2,251,006 |
1 Includes fiscal 2011 short-term gain distributions totaling $5,458,000. Short-term gain distributions are treated as ordinary income dividends for tax purposes.
2 Net Assets—End of Period includes undistributed net investment income of $4,659,000 and $4,847,000.
See accompanying Notes, which are an integral part of the Financial Statements.
13
LifeStrategy Income Fund
| | | | | | |
| Financial Highlights | | | | | | |
| |
| |
| Six Months | | | | | |
| | Ended | | | | | |
| For a Share Outstanding | April 30, | | | Year Ended October 31, |
| Throughout Each Period | 2011 | 2010 | 2009 | 2008 | 2007 | 2006 |
| Net Asset Value, Beginning of Period | $14.15 | $13.20 | $12.13 | $14.44 | $13.97 | $13.38 |
| Investment Operations | | | | | | |
| Net Investment Income | .190 | .388 | .440 | .555 | .570 | .530 |
| Capital Gain Distributions Received | .057 | — | — | — | — | — |
| Net Realized and Unrealized Gain (Loss) | | | | | | |
| on Investments | .299 | .954 | 1.081 | (2.266) | .538 | .580 |
| Total from Investment Operations | .546 | 1.342 | 1.521 | (1.711) | 1.108 | 1.110 |
| Distributions | | | | | | |
| Dividends from Net Investment Income | (.192) | (.392) | (.451) | (.570) | (.570) | (.520) |
| Distributions from Realized Capital Gains | (.034) | — | — | (.029) | (.068) | — |
| Total Distributions | (.226) | (.392) | (.451) | (.599) | (.638) | (.520) |
| Net Asset Value, End of Period | $14.47 | $14.15 | $13.20 | $12.13 | $14.44 | $13.97 |
| |
| Total Return1 | 3.91% | 10.32% | 12.83% | -12.29% | 8.14% | 8.49% |
| |
| Ratios/Supplemental Data | | | | | | |
| Net Assets, End of Period (Millions) | $2,414 | $2,251 | $1,784 | $1,642 | $1,885 | $1,666 |
| Ratio of Total Expenses to | | | | | | |
| Average Net Assets | — | — | — | — | — | — |
| Acquired Fund Fees and Expenses | 0.18% | 0.18% | 0.23% | 0.22% | 0.24% | 0.25% |
| Ratio of Net Investment Income to | | | | | | |
| Average Net Assets | 2.61% | 2.89% | 3.55% | 4.00% | 4.07% | 3.85% |
| Portfolio Turnover Rate | 15% | 9% | 27%2 | 22% | 8% | 14% |
The expense ratio, acquired fund fees and expenses, net income ratio, and turnover rate for the current period have been annualized.
1 Total returns do not include account service fees that may have applied in the periods shown. Fund prospectuses provide information about any applicable account service fees.
2 Excludes the value of mutual fund shares delivered and received in connection with a change in the fund’s bond investments from Vanguard Total Bond Market Index Fund to Vanguard Total Bond Market II Index Fund because those transactions were effected in kind and did not cause the fund to incur transaction costs.
See accompanying Notes, which are an integral part of the Financial Statements.
14
LifeStrategy Income Fund
Notes to Financial Statements
Vanguard LifeStrategy Income Fund is registered under the Investment Company Act of 1940 as an open-end investment company, or mutual fund. The fund follows a balanced investment strategy by investing in selected Vanguard funds to achieve its targeted allocation of assets to U.S. stocks, international stocks, bonds, and short-term reserves.
A. The following significant accounting policies conform to generally accepted accounting principles for U.S. mutual funds. The fund consistently follows such policies in preparing its financial statements.
1. Security Valuation: Investments are valued at the net asset value of each underlying Vanguard fund determined as of the close of the New York Stock Exchange (generally 4 p.m., Eastern time) on the valuation date.
2. Federal Income Taxes: The fund intends to continue to qualify as a regulated investment company and distribute all of its taxable income. Management has analyzed the fund’s tax positions taken for all open federal income tax years (October 31, 2007–2010), and for the period ended April 30, 2011, and has concluded that no provision for federal income tax is required in the fund’s financial statements.
3. Distributions: Distributions to shareholders are recorded on the ex-dividend date.
4. Other: Income and capital gain distributions received are recorded on the ex-dividend date. Security transactions are accounted for on the date securities are bought or sold. Costs used to determine realized gains (losses) on the sale of investment securities are those of the specific securities sold.
B. Under a service agreement, The Vanguard Group furnishes corporate management, administrative, marketing, and distribution services to the fund. The service agreement provides that the fund’s expenses may be reduced or eliminated to the extent of savings realized by the Vanguard funds by the operation of the fund. Accordingly, all incremental expenses for services provided by Vanguard and all other expenses incurred by the fund during the period ended April 30, 2011, were borne by the funds in which the fund invests. The fund’s trustees and officers are also directors and officers of Vanguard and the funds in which the fund invests.
C. Various inputs may be used to determine the value of the fund’s investments. These inputs are summarized in three broad levels for financial statement purposes. The inputs or methodologies used to value securities are not necessarily an indication of the risk associated with investing in those securities.
Level 1—Quoted prices in active markets for identical securities.
Level 2—Other significant observable inputs (including quoted prices for similar securities, interest rates, prepayment speeds, credit risk, etc.).
Level 3—Significant unobservable inputs (including the fund’s own assumptions used to determine the fair value of investments).
At April 30, 2011, 100% of the fund’s investments were valued based on Level 1 inputs.
D. Distributions are determined on a tax basis and may differ from net investment income and realized capital gains for financial reporting purposes. Differences may be permanent or temporary. Permanent differences are reclassified among capital accounts in the financial statements to reflect their tax character. Temporary differences arise when certain items of income, expense, gain, or loss are recognized in different periods for financial statement and tax purposes; these differences will reverse at some time in the future. Differences in classification may also result from the treatment of short-term gains as ordinary income for tax purposes.
15
LifeStrategy Income Fund
The fund’s tax-basis capital gains and losses are determined only at the end of each fiscal year. For tax purposes, at October 31, 2010, the fund had available capital loss carryforwards totaling $30,136,000 to offset future net capital gains of $7,531,000 through October 31, 2016, and $22,605,000 through October 31, 2017. The fund will use these capital losses to offset net taxable capital gains, if any, realized during the year ending October 31, 2011; should the fund realize net capital losses for the year, the losses will be added to the loss carryforward balance above. Short-term capital gain distributions received are treated as ordinary income for tax purposes, and cannot be offset by capital losses. Capital gain distributions paid during the six months ended April 30, 2011, are from short-term gain distributions received from Vanguard Total Bond Market II Index Fund.
At April 30, 2011, the cost of investment securities for tax purposes was $2,190,458,000. Net unrealized appreciation of investment securities for tax purposes was $224,780,000, consisting entirely of unrealized gains on securities that had risen in value since their purchase.
E. During the six months ended April 30, 2011, the fund purchased $391,454,000 of investment securities and sold $262,738,000 of investment securities, other than temporary cash investments.
F. Capital shares issued and redeemed were:
| | |
| | Six Months Ended | Year Ended |
| | April 30, 2011 | October 31, 2010 |
| | Shares | Shares |
| | (000) | (000) |
| Issued | 23,102 | 46,489 |
| Issued in Lieu of Cash Distributions | 2,448 | 3,943 |
| Redeemed | (17,809) | (26,475) |
| Net Increase (Decrease) in Shares Outstanding | 7,741 | 23,957 |
G. In preparing the financial statements as of April 30, 2011, management considered the impact of subsequent events for potential recognition or disclosure in these financial statements.
16
LifeStrategy Conservative Growth Fund
Fund Profile
As of April 30, 2011
| |
| Total Fund Characteristics | |
| Ticker Symbol | VSCGX |
| 30-Day SEC Yield | 2.25% |
| Acquired Fund Fees and Expenses1 | 0.19% |
| |
| Allocation to Underlying Vanguard Funds | |
| Vanguard Total Bond Market II Index Fund | |
| Investor Shares | 31.0% |
| Vanguard Short-Term Investment-Grade | |
| Fund Investor Shares | 20.7 |
| Vanguard Asset Allocation Fund Investor | |
| Shares | 20.2 |
| Vanguard Total Stock Market Index Fund | |
| Investor Shares | 15.6 |
| Vanguard Total International Stock Index | |
| Fund Investor Shares | 12.5 |
| | |
| Total Fund Volatility Measures | |
| | Conservative | DJ |
| | Growth | U.S. Total |
| | Composite | Market |
| | Index | Index |
| R-Squared | 0.99 | 0.94 |
| Beta | 1.13 | 0.50 |
These measures show the degree and timing of the fund’s fluctuations compared with the indexes over 36 months.
Fund Asset Allocation
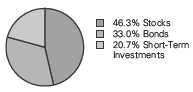
1 This figure—drawn from the prospectus dated February 28, 2011—represents an estimate of the weighted average of the expense ratios and any transaction fees charged by the underlying mutual funds (the ”acquired” funds) in which the LifeStrategy Conservative Growth Fund invests. The LifeStrategy Conservative Growth Fund does not charge any expenses or fees of its own. For the six months ended April 30, 2011, the annualized acquired fund fees and expenses were 0.20%.
17
LifeStrategy Conservative Growth Fund
Performance Summary
All of the returns in this report represent past performance, which is not a guarantee of future results that may be achieved by the fund. (Current performance may be lower or higher than the performance data cited. For performance data current to the most recent month-end, visit our website at vanguard.com/performance.) Note, too, that both investment returns and principal value can fluctuate widely, so an investor’s shares, when sold, could be worth more or less than their original cost. The returns shown do not reflect taxes that a shareholder would pay on fund distributions or on the sale of fund shares.
Fiscal-Year Total Returns (%): October 31, 2000, Through April 30, 2011
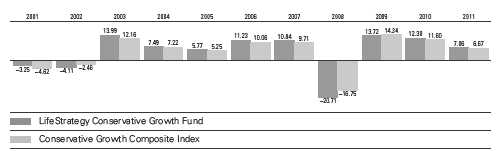
Conservative Growth Composite Index: Weighted 40% Barclays Capital U.S. Aggregate Bond Index, 35% Dow Jones U.S. Total Stock Market Index, 20% Citigroup Three-Month Treasury Bill Index, and 5% MSCI EAFE Index through August 31, 2003; 40% Barclays Capital U.S. Aggregate Bond Index, 35% Dow Jones U.S. Total Stock Market Index, 20% Barclays Capital U.S. 1–3 Year Credit Bond Index, and 5% MSCI EAFE Index through April 22, 2005; 40% Barclays Capital U.S. Aggregate Bond Index through December 31, 2009, and Barclays Capital U.S. Aggregate Float Adjusted Index thereafter, 35% MSCI US Broad Market Index, 20% Barclays Capital U.S. 1–3 Year Credit Bond Index, and 5% MSCI EAFE Index through December 15, 2010; and 40% Barclays Capital U.S. Aggregate Float Adjusted Index, 28% MSCI US Broad Market Index, 20% Barclays Capital U.S. 1–3 Year Credit Bond Index, and 12% MSCI ACWI ex USA IMI Index thereafter. MSCI international benchmark returns are adjusted for withholding taxes applicable to Luxembourg holding companies.
Note: For 2011, performance data reflect the six months ended April 30, 2011.
Average Annual Total Returns: Periods Ended March 31, 2011
This table presents returns through the latest calendar quarter—rather than through the end of the fiscal period. Securities and Exchange Commission rules require that we provide this information.
| | | | | | |
| | | | | | | Ten Years |
| | Inception Date | One Year | Five Years | Income | Capital | Total |
| LifeStrategy Conservative | | | | | | |
| Growth Fund | 9/30/1994 | 10.40% | 4.42% | 3.28% | 1.83% | 5.11% |
See Financial Highlights for dividend and capital gains information.
18
LifeStrategy Conservative Growth Fund
Financial Statements (unaudited)
Statement of Net Assets
As of April 30, 2011
The fund reports a complete list of its holdings in regulatory filings four times in each fiscal year, at the quarter-ends. For the second and fourth fiscal quarters, the lists appear in the fund’s semiannual and annual reports to shareholders. For the first and third fiscal quarters, the fund files the lists with the Securities and Exchange Commission on Form N-Q. Shareholders can look up the fund’s Forms N-Q on the SEC’s website at sec.gov. Forms N-Q may also be reviewed and copied at the SEC’s Public Reference Room (see the back cover of this report for further information).
| | |
| | | Market |
| | | Value |
| | Shares | ($000) |
| Investment Companies (100.0%) | | |
| U.S. Stock Fund (15.6%) | | |
| Vanguard Total Stock Market Index Fund Investor Shares | 31,228,515 | 1,075,198 |
| |
| International Stock Fund (12.5%) | | |
| Vanguard Total International Stock Index Fund Investor Shares | 50,437,728 | 861,476 |
| |
| Balanced Fund (20.2%) | | |
| Vanguard Asset Allocation Fund Investor Shares | 52,496,611 | 1,388,010 |
| |
| Bond Fund (31.0%) | | |
| 1 Vanguard Total Bond Market II Index Fund Investor Shares | 202,141,685 | 2,134,616 |
| |
| Short-Term Bond Fund (20.7%) | | |
| Vanguard Short-Term Investment-Grade Fund Investor Shares | 132,459,875 | 1,427,918 |
| Total Investment Companies (Cost $5,842,481) | | 6,887,218 |
| Other Assets and Liabilities (0.0%) | | |
| Other Assets | | 31,970 |
| Liabilities | | (30,994) |
| | | 976 |
| Net Assets (100%) | | |
| Applicable to 402,815,815 outstanding $.001 par value shares of | | |
| beneficial interest (unlimited authorization) | | 6,888,194 |
| Net Asset Value Per Share | | $17.10 |
19
LifeStrategy Conservative Growth Fund
| |
| At April 30, 2011, net assets consisted of: | |
| | Amount |
| | ($000) |
| Paid-in Capital | 5,938,001 |
| Undistributed Net Investment Income | 9,634 |
| Accumulated Net Realized Losses | (104,178) |
| Unrealized Appreciation (Depreciation) | 1,044,737 |
| Net Assets | 6,888,194 |
See Note A in Notes to Financial Statements.
1 Affiliated fund available only to Vanguard funds and certain trusts and accounts managed by Vanguard.
See accompanying Notes, which are an integral part of the Financial Statements.
20
LifeStrategy Conservative Growth Fund
| |
| Statement of Operations | |
| |
| | Six Months Ended |
| | April 30, 2011 |
| | ($000) |
| Investment Income | |
| Income | |
| Income Distributions Received | 82,729 |
| Net Investment Income—Note B | 82,729 |
| Realized Net Gain (Loss) | |
| Capital Gain Distributions Received | 18,698 |
| Investment Securities Sold | 15,307 |
| Realized Net Gain (Loss) | 34,005 |
| Change in Unrealized Appreciation (Depreciation) of Investment Securities | 334,646 |
| Net Increase (Decrease) in Net Assets Resulting from Operations | 451,380 |
See accompanying Notes, which are an integral part of the Financial Statements.
21
LifeStrategy Conservative Growth Fund
| | |
| Statement of Changes in Net Assets | | |
| |
| | Six Months Ended | Year Ended |
| | April 30, | October 31, |
| | 2011 | 2010 |
| | ($000) | ($000) |
| Increase (Decrease) in Net Assets | | |
| Operations | | |
| Net Investment Income | 82,729 | 154,564 |
| Realized Net Gain (Loss) | 34,005 | 1,136 |
| Change in Unrealized Appreciation (Depreciation) | 334,646 | 523,512 |
| Net Increase (Decrease) in Net Assets Resulting from Operations | 451,380 | 679,212 |
| Distributions | | |
| Net Investment Income | (82,863) | (154,835) |
| Realized Capital Gain1 | (9,424) | — |
| Total Distributions | (92,287) | (154,835) |
| Capital Share Transactions | | |
| Issued | 732,105 | 1,168,235 |
| Issued in Lieu of Cash Distributions | 89,634 | 150,155 |
| Redeemed | (608,472) | (1,013,845) |
| Net Increase (Decrease) from Capital Share Transactions | 213,267 | 304,545 |
| Total Increase (Decrease) | 572,360 | 828,922 |
| Net Assets | | |
| Beginning of Period | 6,315,834 | 5,486,912 |
| End of Period2 | 6,888,194 | 6,315,834 |
1 Includes fiscal 2011 short-term gain distributions totaling $9,424,000. Short-term gain distributions are treated as ordinary income dividends for tax purposes.
2 Net Assets—End of Period includes undistributed net investment income of $9,634,000 and $9,768,000.
See accompanying Notes, which are an integral part of the Financial Statements.
22
LifeStrategy Conservative Growth Fund
| | | | | | |
| Financial Highlights | | | | | | |
| |
| |
| Six Months | | | | | |
| | Ended | | | | | |
| For a Share Outstanding | April 30, | | | Year Ended October 31, |
| Throughout Each Period | 2011 | 2010 | 2009 | 2008 | 2007 | 2006 |
| Net Asset Value, Beginning of Period | $16.20 | $14.81 | $13.46 | $17.61 | $16.43 | $15.24 |
| Investment Operations | | | | | | |
| Net Investment Income | .209 | .406 | .439 | .568 | .580 | .500 |
| Capital Gain Distributions Received | .047 | — | — | — | — | — |
| Net Realized and Unrealized Gain (Loss) | | | | | | |
| on Investments | .878 | 1.392 | 1.359 | (4.116) | 1.170 | 1.180 |
| Total from Investment Operations | 1.134 | 1.798 | 1.798 | (3.548) | 1.750 | 1.680 |
| Distributions | | | | | | |
| Dividends from Net Investment Income | (.210) | (.408) | (.448) | (.592) | (.570) | (.490) |
| Distributions from Realized Capital Gains | (.024) | — | — | (.010) | — | — |
| Total Distributions | (.234) | (.408) | (.448) | (.602) | (.570) | (.490) |
| Net Asset Value, End of Period | $17.10 | $16.20 | $14.81 | $13.46 | $17.61 | $16.43 |
| |
| Total Return1 | 7.06% | 12.30% | 13.72% | -20.71% | 10.84% | 11.23% |
| |
| Ratios/Supplemental Data | | | | | | |
| Net Assets, End of Period (Millions) | $6,888 | $6,316 | $5,487 | $4,843 | $7,044 | $5,326 |
| Ratio of Total Expenses to | | | | | | |
| Average Net Assets | — | — | — | — | — | — |
| Acquired Fund Fees and Expenses | 0.20% | 0.19% | 0.24% | 0.22% | 0.24% | 0.26% |
| Ratio of Net Investment Income to | | | | | | |
| Average Net Assets | 2.35% | 2.63% | 3.23% | 3.52% | 3.40% | 3.21% |
| Portfolio Turnover Rate | 19% | 15% | 29%2 | 22% | 10% | 4% |
The expense ratio, acquired fund fees and expenses, net income ratio, and turnover rate for the current period have been annualized.
1 Total returns do not include account service fees that may have applied in the periods shown. Fund prospectuses provide information about any applicable account service fees.
2 Excludes the value of mutual fund shares delivered and received in connection with a change in the fund’s bond investments from Vanguard Total Bond Market Index Fund to Vanguard Total Bond Market II Index Fund because those transactions were effected in kind and did not cause the fund to incur transaction costs.
See accompanying Notes, which are an integral part of the Financial Statements.
23
LifeStrategy Conservative Growth Fund
Notes to Financial Statements
Vanguard LifeStrategy Conservative Growth Fund is registered under the Investment Company Act of 1940 as an open-end investment company, or mutual fund. The fund follows a balanced investment strategy by investing in selected Vanguard funds to achieve its targeted allocation of assets to U.S. stocks, international stocks, bonds, and short-term reserves.
A. The following significant accounting policies conform to generally accepted accounting principles for U.S. mutual funds. The fund consistently follows such policies in preparing its financial statements.
1. Security Valuation: Investments are valued at the net asset value of each underlying Vanguard fund determined as of the close of the New York Stock Exchange (generally 4 p.m., Eastern time) on the valuation date.
2. Federal Income Taxes: The fund intends to continue to qualify as a regulated investment company and distribute all of its taxable income. Management has analyzed the fund’s tax positions taken for all open federal income tax years (October 31, 2007–2010), and for the period ended April 30, 2011, and has concluded that no provision for federal income tax is required in the fund’s financial statements.
3. Distributions: Distributions to shareholders are recorded on the ex-dividend date.
4. Other: Income and capital gain distributions received are recorded on the ex-dividend date. Security transactions are accounted for on the date securities are bought or sold. Costs used to determine realized gains (losses) on the sale of investment securities are those of the specific securities sold.
B. Under a service agreement, The Vanguard Group furnishes corporate management, administrative, marketing, and distribution services to the fund. The service agreement provides that the fund’s expenses may be reduced or eliminated to the extent of savings realized by the Vanguard funds by the operation of the fund. Accordingly, all incremental expenses for services provided by Vanguard and all other expenses incurred by the fund during the period ended April 30, 2011, were borne by the funds in which the fund invests. The fund’s trustees and officers are also directors and officers of Vanguard and the funds in which the fund invests.
C. Various inputs may be used to determine the value of the fund’s investments. These inputs are summarized in three broad levels for financial statement purposes. The inputs or methodologies used to value securities are not necessarily an indication of the risk associated with investing in those securities.
Level 1—Quoted prices in active markets for identical securities.
Level 2—Other significant observable inputs (including quoted prices for similar securities, interest rates, prepayment speeds, credit risk, etc.).
Level 3—Significant unobservable inputs (including the fund’s own assumptions used to determine the fair value of investments).
At April 30, 2011, 100% of the fund’s investments were valued based on Level 1 inputs.
24
LifeStrategy Conservative Growth Fund
D. Distributions are determined on a tax basis and may differ from net investment income and realized capital gains for financial reporting purposes. Differences may be permanent or temporary. Permanent differences are reclassified among capital accounts in the financial statements to reflect their tax character. Temporary differences arise when certain items of income, expense, gain, or loss are recognized in different periods for financial statement and tax purposes; these differences will reverse at some time in the future. Differences in classification may also result from the treatment of short-term gains as ordinary income for tax purposes.
The fund’s tax-basis capital gains and losses are determined only at the end of each fiscal year. For tax purposes, at October 31, 2010, the fund had available capital loss carryforwards totaling $128,619,000 to offset future net capital gains of $58,575,000 through October 31, 2016, $69,127,000 through October 31, 2017, and $917,000 through October 31, 2018. The fund will use these capital losses to offset net taxable capital gains, if any, realized during the year ending October 31, 2011; should the fund realize net capital losses for the year, the losses will be added to the loss carryforward balance above. Short-term capital gain distributions received are treated as ordinary income for tax purposes, and cannot be offset by capital losses. Capital gain distributions paid during the six months ended April 30, 2011, are from short-term gain distributions received from Vanguard Total Bond Market II Index Fund.
At April 30, 2011, the cost of investment securities for tax purposes was $5,842,481,000. Net unrealized appreciation of investment securities for tax purposes was $1,044,737,000, consisting entirely of unrealized gains on securities that had risen in value since their purchase.
E. During the six months ended April 30, 2011, the fund purchased $1,158,238,000 of investment securities and sold $927,105,000 of investment securities, other than temporary cash investments.
F. Capital shares issued and redeemed were:
| | |
| | Six Months Ended | Year Ended |
| | April 30, 2011 | October 31, 2010 |
| | Shares | Shares |
| | (000) | (000) |
| Issued | 44,223 | 75,603 |
| Issued in Lieu of Cash Distributions | 5,448 | 9,717 |
| Redeemed | (36,829) | (65,788) |
| Net Increase (Decrease) in Shares Outstanding | 12,842 | 19,532 |
G. In preparing the financial statements as of April 30, 2011, management considered the impact of subsequent events for potential recognition or disclosure in these financial statements.
25
LifeStrategy Moderate Growth Fund
Fund Profile
As of April 30, 2011
| |
| Total Fund Characteristics | |
| Ticker Symbol | VSMGX |
| 30-Day SEC Yield | 2.00% |
| Acquired Fund Fees and Expenses1 | 0.19% |
| |
| Allocation to Underlying Vanguard Funds | |
| Vanguard Total Bond Market II Index Fund | |
| Investor Shares | 31.6% |
| Vanguard Total Stock Market Index Fund | |
| Investor Shares | 29.8 |
| Vanguard Asset Allocation Fund Investor | |
| Shares | 20.1 |
| Vanguard Total International Stock Index | |
| Fund Investor Shares | 18.5 |
| | |
| Total Fund Volatility Measures | |
| | Moderate | DJ |
| | Growth | U.S. Total |
| | Composite | Market |
| | Index | Index |
| R-Squared | 1.00 | 0.97 |
| Beta | 1.09 | 0.68 |
These measures show the degree and timing of the fund’s fluctuations compared with the indexes over 36 months.
Fund Asset Allocation
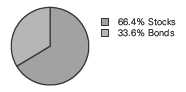
1 This figure—drawn from the prospectus dated February 28, 2011—represents an estimate of the weighted average of the expense ratios and any transaction fees charged by the underlying mutual funds (the ”acquired” funds) in which the LifeStrategy Moderate Growth Fund invests. The LifeStrategy Moderate Growth Fund does not charge any expenses or fees of its own. For the six months ended April 30, 2011, the annualized acquired fund fees and expenses were 0.19%.
26
LifeStrategy Moderate Growth Fund
Performance Summary
All of the returns in this report represent past performance, which is not a guarantee of future results that may be achieved by the fund. (Current performance may be lower or higher than the performance data cited. For performance data current to the most recent month-end, visit our website at vanguard.com/performance.) Note, too, that both investment returns and principal value can fluctuate widely, so an investor’s shares, when sold, could be worth more or less than their original cost. The returns shown do not reflect taxes that a shareholder would pay on fund distributions or on the sale of fund shares.
Fiscal-Year Total Returns (%): October 31, 2000, Through April 30, 2011
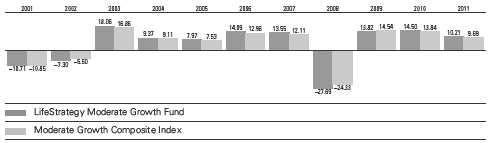
Moderate Growth Composite Index: Weighted 50% Dow Jones U.S. Total Stock Market Index, 40% Barclays Capital U.S. Aggregate Bond Index, and 10% MSCI EAFE Index through April 22, 2005; 50% MSCI US Broad Market Index, 40% Barclays Capital U.S. Aggregate Bond Index through December 31, 2009, and Barclays Capital U.S. Aggregate Float Adjusted Index thereafter, and 10% MSCI EAFE Index through December 15, 2010; and 42% MSCI US Broad Market Index, 40% Barclays Capital U.S. Aggregate Float Adjusted Index, and 18% MSCI ACWI ex USA IMI Index thereafter. MSCI international benchmark returns are adjusted for withholding taxes applicable to Luxembourg holding companies.
Note: For 2011, performance data reflect the six months ended April 30, 2011.
Average Annual Total Returns: Periods Ended March 31, 2011
This table presents returns through the latest calendar quarter—rather than through the end of the fiscal period.
Securities and Exchange Commission rules require that we provide this information.
| | | | | | |
| | | | | | | Ten Years |
| | Inception Date | One Year | Five Years | Income | Capital | Total |
| LifeStrategy Moderate | | | | | | |
| Growth Fund | 9/30/1994 | 13.02% | 4.03% | 2.79% | 2.43% | 5.22% |
See Financial Highlights for dividend and capital gains information.
27
LifeStrategy Moderate Growth Fund
Financial Statements (unaudited)
Statement of Net Assets
As of April 30, 2011
The fund reports a complete list of its holdings in regulatory filings four times in each fiscal year, at the quarter-ends. For the second and fourth fiscal quarters, the lists appear in the fund’s semiannual and annual reports to shareholders. For the first and third fiscal quarters, the fund files the lists with the Securities and Exchange Commission on Form N-Q. Shareholders can look up the fund’s Forms N-Q on the SEC’s website at sec.gov. Forms N-Q may also be reviewed and copied at the SEC’s Public Reference Room (see the back cover of this report for further information).
| | |
| | | Market |
| | | Value |
| | Shares | ($000) |
| Investment Companies (100.0%) | | |
| U.S. Stock Fund (29.8%) | | |
| Vanguard Total Stock Market Index Fund Investor Shares | 77,302,935 | 2,661,540 |
| |
| International Stock Fund (18.5%) | | |
| Vanguard Total International Stock Index Fund Investor Shares | 96,488,893 | 1,648,030 |
| Balanced Fund (20.1%) | | |
| Vanguard Asset Allocation Fund Investor Shares | 67,721,119 | 1,790,546 |
| |
| Bond Fund (31.6%) | | |
| 1 Vanguard Total Bond Market II Index Fund Investor Shares | 266,667,871 | 2,816,013 |
| |
| Total Investment Companies (Cost $6,955,521) | | 8,916,129 |
| Other Assets and Liabilities (0.0%) | | |
| Other Assets | | 36,949 |
| Liabilities | | (34,013) |
| | | 2,936 |
| Net Assets (100%) | | |
| Applicable to 427,807,751 outstanding $.001 par value shares of | | |
| beneficial interest (unlimited authorization) | | 8,919,065 |
| Net Asset Value Per Share | | $20.85 |
| |
| At April 30, 2011, net assets consisted of: | |
| | Amount |
| | ($000) |
| Paid-in Capital | 7,039,301 |
| Undistributed Net Investment Income | 36,990 |
| Accumulated Net Realized Losses | (117,834) |
| Unrealized Appreciation (Depreciation) | 1,960,608 |
| Net Assets | 8,919,065 |
See Note A in Notes to Financial Statements.
1 Affiliated fund available only to Vanguard funds and certain trusts and accounts managed by Vanguard.
See accompanying Notes, which are an integral part of the Financial Statements.
28
LifeStrategy Moderate Growth Fund
| |
| Statement of Operations | |
| |
| | Six Months Ended |
| | April 30, 2011 |
| | ($000) |
| Investment Income | |
| Income | |
| Income Distributions Received | 100,669 |
| Net Investment Income—Note B | 100,669 |
| Realized Net Gain (Loss) | |
| Capital Gain Distributions Received | 17,139 |
| Investment Securities Sold | 82,486 |
| Realized Net Gain (Loss) | 99,625 |
| Change in Unrealized Appreciation (Depreciation) of Investment Securities | 624,768 |
| Net Increase (Decrease) in Net Assets Resulting from Operations | 825,062 |
See accompanying Notes, which are an integral part of the Financial Statements.
29
LifeStrategy Moderate Growth Fund
| | |
| Statement of Changes in Net Assets | | |
| |
| | Six Months Ended | Year Ended |
| | April 30, | October 31, |
| | 2011 | 2010 |
| | ($000) | ($000) |
| Increase (Decrease) in Net Assets | | |
| Operations | | |
| Net Investment Income | 100,669 | 187,165 |
| Realized Net Gain (Loss) | 99,625 | (10,517) |
| Change in Unrealized Appreciation (Depreciation) | 624,768 | 866,656 |
| Net Increase (Decrease) in Net Assets Resulting from Operations | 825,062 | 1,043,304 |
| Distributions | | |
| Net Investment Income | (119,235) | (174,437) |
| Realized Capital Gain1 | (12,685) | — |
| Total Distributions | (131,920) | (174,437) |
| Capital Share Transactions | | |
| Issued | 812,067 | 1,137,142 |
| Issued in Lieu of Cash Distributions | 129,506 | 171,558 |
| Redeemed | (765,061) | (1,754,214) |
| Net Increase (Decrease) from Capital Share Transactions | 176,512 | (445,514) |
| Total Increase (Decrease) | 869,654 | 423,353 |
| Net Assets | | |
| Beginning of Period | 8,049,411 | 7,626,058 |
| End of Period2 | 8,919,065 | 8,049,411 |
1 Includes fiscal 2011 short-term gain distributions totaling $12,685,000. Short-term gain distributions are treated as ordinary income dividends for tax purposes.
2 Net Assets—End of Period includes undistributed net investment income of $36,990,000 and $55,556,000.
See accompanying Notes, which are an integral part of the Financial Statements.
30
LifeStrategy Moderate Growth Fund
| | | | | | |
| Financial Highlights | | | | | | |
| |
| |
| Six Months | | | | | |
| | Ended | | | | | |
| For a Share Outstanding | April 30, | | | Year Ended October 31, |
| Throughout Each Period | 2011 | 2010 | 2009 | 2008 | 2007 | 2006 |
| Net Asset Value, Beginning of Period | $19.22 | $17.16 | $15.56 | $22.21 | $20.09 | $18.09 |
| Investment Operations | | | | | | |
| Net Investment Income | .235 | .431 | .450 | .607 | .580 | .510 |
| Capital Gain Distributions Received | .040 | — | — | — | — | — |
| Net Realized and Unrealized Gain (Loss) | | | | | | |
| on Investments | 1.667 | 2.023 | 1.632 | (6.606) | 2.100 | 1.990 |
| Total from Investment Operations | 1.942 | 2.454 | 2.082 | (5.999) | 2.680 | 2.500 |
| Distributions | | | | | | |
| Dividends from Net Investment Income | (.282) | (.394) | (.482) | (.627) | (.560) | (.500) |
| Distributions from Realized Capital Gains | (.030) | — | — | (.024) | — | — |
| Total Distributions | (.312) | (.394) | (.482) | (.651) | (.560) | (.500) |
| Net Asset Value, End of Period | $20.85 | $19.22 | $17.16 | $15.56 | $22.21 | $20.09 |
| |
| Total Return1 | 10.21% | 14.50% | 13.82% | -27.69% | 13.55% | 14.09% |
| |
| Ratios/Supplemental Data | | | | | | |
| Net Assets, End of Period (Millions) | $8,919 | $8,049 | $7,626 | $7,408 | $11,272 | $9,463 |
| Ratio of Total Expenses to | | | | | | |
| Average Net Assets | — | — | — | — | — | — |
| Acquired Fund Fees and Expenses | 0.19% | 0.19% | 0.23% | 0.22% | 0.23% | 0.26% |
| Ratio of Net Investment Income to | | | | | | |
| Average Net Assets | 2.11% | 2.37% | 2.89% | 2.98% | 2.81% | 2.70% |
| Portfolio Turnover Rate | 20% | 17% | 25%2 | 18% | 7% | 8% |
The expense ratio, acquired fund fees and expenses, net income ratio, and turnover rate for the current period have been annualized.
1 Total returns do not include account service fees that may have applied in the periods shown. Fund prospectuses provide information about any applicable account service fees.
2 Excludes the value of mutual fund shares delivered and received in connection with a change in the fund’s bond investments from Vanguard Total Bond Market Index Fund to Vanguard Total Bond Market II Index Fund because those transactions were effected in kind and did not cause the fund to incur transaction costs.
See accompanying Notes, which are an integral part of the Financial Statements.
31
LifeStrategy Moderate Growth Fund
Notes to Financial Statements
Vanguard LifeStrategy Moderate Growth Fund is registered under the Investment Company Act of 1940 as an open-end investment company, or mutual fund. The fund follows a balanced investment strategy by investing in selected Vanguard funds to achieve its targeted allocation of assets to U.S. stocks, international stocks, bonds, and short-term reserves.
A. The following significant accounting policies conform to generally accepted accounting principles for U.S. mutual funds. The fund consistently follows such policies in preparing its financial statements.
1. Security Valuation: Investments are valued at the net asset value of each underlying Vanguard fund determined as of the close of the New York Stock Exchange (generally 4 p.m., Eastern time) on the valuation date.
2. Federal Income Taxes: The fund intends to continue to qualify as a regulated investment company and distribute all of its taxable income. Management has analyzed the fund’s tax positions taken for all open federal income tax years (October 31, 2007–2010), and for the period ended April 30, 2011, and has concluded that no provision for federal income tax is required in the fund’s financial statements.
3. Distributions: Distributions to shareholders are recorded on the ex-dividend date.
4. Other: Income and capital gain distributions received are recorded on the ex-dividend date. Security transactions are accounted for on the date securities are bought or sold. Costs used to determine realized gains (losses) on the sale of investment securities are those of the specific securities sold.
B. Under a service agreement, The Vanguard Group furnishes corporate management, administrative, marketing, and distribution services to the fund. The service agreement provides that the fund’s expenses may be reduced or eliminated to the extent of savings realized by the Vanguard funds by the operation of the fund. Accordingly, all incremental expenses for services provided by Vanguard and all other expenses incurred by the fund during the period ended April 30, 2011, were borne by the funds in which the fund invests. The fund’s trustees and officers are also directors and officers of Vanguard and the funds in which the fund invests.
C. Various inputs may be used to determine the value of the fund’s investments. These inputs are summarized in three broad levels for financial statement purposes. The inputs or methodologies used to value securities are not necessarily an indication of the risk associated with investing in those securities.
Level 1—Quoted prices in active markets for identical securities.
Level 2—Other significant observable inputs (including quoted prices for similar securities, interest rates, prepayment speeds, credit risk, etc.).
Level 3—Significant unobservable inputs (including the fund’s own assumptions used to determine the fair value of investments).
At April 30, 2011, 100% of the fund’s investments were valued based on Level 1 inputs.
32
LifeStrategy Moderate Growth Fund
D. Distributions are determined on a tax basis and may differ from net investment income and realized capital gains for financial reporting purposes. Differences may be permanent or temporary. Permanent differences are reclassified among capital accounts in the financial statements to reflect their tax character. Temporary differences arise when certain items of income, expense, gain, or loss are recognized in different periods for financial statement and tax purposes; these differences will reverse at some time in the future. Differences in classification may also result from the treatment of short-term gains as ordinary income for tax purposes.
The fund’s tax-basis capital gains and losses are determined only at the end of each fiscal year. For tax purposes, at October 31, 2010, the fund had available capital loss carryforwards totaling $204,585,000 to offset future net capital gains of $45,187,000 through October 31, 2016, $146,638,000 through October 31, 2017, and $12,760,000 through October 31, 2018. The fund will use these capital losses to offset net taxable capital gains, if any, realized during the year ending October 31, 2011; should the fund realize net capital losses for the year, the losses will be added to the loss carryforward balance above. Short-term capital gain distributions received are treated as ordinary income for tax purposes, and cannot be offset by capital losses. Capital gain distributions paid during the six months ended April 30, 2011, are from short-term gain distributions received from Vanguard Total Bond Market II Index Fund.
At April 30, 2011, the cost of investment securities for tax purposes was $6,955,521,000. Net unrealized appreciation of investment securities for tax purposes was $1,960,608,000, consisting entirely of unrealized gains on securities that had risen in value since their purchase.
E. During the six months ended April 30, 2011, the fund purchased $1,439,018,000 of investment securities and sold $1,272,470,000 of investment securities, other than temporary cash investments.
F. Capital shares issued and redeemed were:
| | |
| | Six Months Ended | Year Ended |
| | April 30, 2011 | October 31, 2010 |
| | Shares | Shares |
| | (000) | (000) |
| Issued | 40,846 | 62,942 |
| Issued in Lieu of Cash Distributions | 6,631 | 9,670 |
| Redeemed | (38,564) | (98,056) |
| Net Increase (Decrease) in Shares Outstanding | 8,913 | (25,444) |
G. In preparing the financial statements as of April 30, 2011, management considered the impact of subsequent events for potential recognition or disclosure in these financial statements.
33
LifeStrategy Growth Fund
Fund Profile
As of April 30, 2011
| |
| Total Fund Characteristics | |
| Ticker Symbol | VASGX |
| 30-Day SEC Yield | 1.71% |
| Acquired Fund Fees and Expenses1 | 0.20% |
| |
| Allocation to Underlying Vanguard Funds | |
| Vanguard Total Stock Market Index Fund | |
| Investor Shares | 43.7% |
| Vanguard Total International Stock Index | |
| Fund Investor Shares | 24.5 |
| Vanguard Asset Allocation Fund Investor | |
| Shares | 19.9 |
| Vanguard Total Bond Market II Index Fund | |
| Investor Shares | 11.9 |
| | |
| Total Fund Volatility Measures | |
| | | DJ |
| | Growth | U.S. Total |
| | Composite | Market |
| | Index | Index |
| R-Squared | 1.00 | 0.99 |
| Beta | 1.08 | 0.89 |
These measures show the degree and timing of the fund’s fluctuations compared with the indexes over 36 months.
Fund Asset Allocation
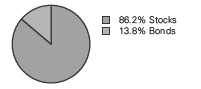
1 This figure—drawn from the prospectus dated February 28, 2011—represents an estimate of the weighted average of the expense ratios and any transaction fees charged by the underlying mutual funds (the ”acquired” funds) in which the LifeStrategy Growth Fund invests. The LifeStrategy Growth Fund does not charge any expenses or fees of its own. For the six months ended April 30, 2011, the annualized acquired fund fees and expenses were 0.21%.
34
LifeStrategy Growth Fund
Performance Summary
All of the returns in this report represent past performance, which is not a guarantee of future results that may be achieved by the fund. (Current performance may be lower or higher than the performance data cited. For performance data current to the most recent month-end, visit our website at vanguard.com/performance.) Note, too, that both investment returns and principal value can fluctuate widely, so an investor’s shares, when sold, could be worth more or less than their original cost. The returns shown do not reflect taxes that a shareholder would pay on fund distributions or on the sale of fund shares.
Fiscal-Year Total Returns (%): October 31, 2000, Through April 30, 2011

Growth Composite Index: Weighted 65% Dow Jones U.S. Total Stock Market Index, 20% Barclays Capital U.S. Aggregate Bond Index, and 15% MSCI EAFE Index through April 22, 2005; 65% MSCI US Broad Market Index, 20% Barclays Capital U.S. Aggregate Bond Index through December 31, 2009, and Barclays Capital U.S. Aggregate Float Adjusted Index thereafter, and 15% MSCI EAFE Index through December 15, 2010; and 56% MSCI US Broad Market Index, 24% MSCI ACWI ex USA IMI Index, and 20% Barclays Capital U.S. Aggregate Float Adjusted Index thereafter. MSCI international benchmark returns are adjusted for withholding taxes applicable to Luxembourg holding companies.
Note: For 2011, performance data reflect the six months ended April 30, 2011.
Average Annual Total Returns: Periods Ended March 31, 2011
This table presents returns through the latest calendar quarter—rather than through the end of the fiscal period. Securities and Exchange Commission rules require that we provide this information.
| | | | | | |
| | | | | | | Ten Years |
| | Inception Date | One Year | Five Years | Income | Capital | Total |
| LifeStrategy Growth Fund | 9/30/1994 | 15.10% | 3.22% | 2.20% | 2.77% | 4.97% |
See Financial Highlights for dividend and capital gains information.
35
LifeStrategy Growth Fund
Financial Statements (unaudited)
Statement of Net Assets
As of April 30, 2011
The fund reports a complete list of its holdings in regulatory filings four times in each fiscal year, at the quarter-ends. For the second and fourth fiscal quarters, the lists appear in the fund’s semiannual and annual reports to shareholders. For the first and third fiscal quarters, the fund files the lists with the Securities and Exchange Commission on Form N-Q. Shareholders can look up the fund’s Forms N-Q on the SEC’s website at sec.gov. Forms N-Q may also be reviewed and copied at the SEC’s Public Reference Room (see the back cover of this report for further information).
| | |
| | | Market |
| | | Value |
| | Shares | ($000) |
| Investment Companies (100.0%) | | |
| U.S. Stock Fund (43.7%) | | |
| Vanguard Total Stock Market Index Fund Investor Shares | 108,544,800 | 3,737,197 |
| |
| International Stock Fund (24.5%) | | |
| Vanguard Total International Stock Index Fund Investor Shares | 122,506,844 | 2,092,417 |
| Balanced Fund (19.9%) | | |
| Vanguard Asset Allocation Fund Investor Shares | 64,362,228 | 1,701,737 |
| |
| Bond Fund (11.9%) | | |
| 1 Vanguard Total Bond Market II Index Fund Investor Shares | 95,842,479 | 1,012,097 |
| |
| Total Investment Companies (Cost $6,549,048) | | 8,543,448 |
| Temporary Cash Investment (0.0%) | | |
| Money Market Fund (0.0%) | | |
| 1 Vanguard Market Liquidity Fund, 0.179% (Cost $897) | 896,947 | 897 |
| Total Investments (100.0%) (Cost $6,549,945) | | 8,544,345 |
| Other Assets and Liabilities (0.0%) | | |
| Other Assets | | 16,644 |
| Liabilities | | (15,373) |
| | | 1,271 |
| Net Assets (100%) | | |
| Applicable to 358,630,806 outstanding $.001 par value shares of | | |
| beneficial interest (unlimited authorization) | | 8,545,616 |
| Net Asset Value Per Share | | $23.83 |
36
LifeStrategy Growth Fund
| |
| At April 30, 2011, net assets consisted of: | |
| | Amount |
| | ($000) |
| Paid-in Capital | 6,596,071 |
| Undistributed Net Investment Income | 23,343 |
| Accumulated Net Realized Losses | (68,198) |
| Unrealized Appreciation (Depreciation) | 1,994,400 |
| Net Assets | 8,545,616 |
See Note A in Notes to Financial Statements.
1 Affiliated fund available only to Vanguard funds and certain trusts and accounts managed by Vanguard. Rate shown for Vanguard Market Liquidity Fund is the 7-day yield.
See accompanying Notes, which are an integral part of the Financial Statements.
37
LifeStrategy Growth Fund
| |
| Statement of Operations | |
| |
| | Six Months Ended |
| | April 30, 2011 |
| | ($000) |
| Investment Income | |
| Income | |
| Income Distributions Received | 88,169 |
| Net Investment Income—Note B | 88,169 |
| Realized Net Gain (Loss) | |
| Capital Gain Distributions Received | 6,052 |
| Investment Securities Sold | (536) |
| Realized Net Gain (Loss) | 5,516 |
| Change in Unrealized Appreciation (Depreciation) of Investment Securities | 919,796 |
| Net Increase (Decrease) in Net Assets Resulting from Operations | 1,013,481 |
See accompanying Notes, which are an integral part of the Financial Statements.
38
LifeStrategy Growth Fund
| | |
| Statement of Changes in Net Assets | | |
| |
| | Six Months Ended | Year Ended |
| | April 30, | October 31, |
| | 2011 | 2010 |
| | ($000) | ($000) |
| Increase (Decrease) in Net Assets | | |
| Operations | | |
| Net Investment Income | 88,169 | 147,564 |
| Realized Net Gain (Loss) | 5,516 | 107,354 |
| Change in Unrealized Appreciation (Depreciation) | 919,796 | 790,461 |
| Net Increase (Decrease) in Net Assets Resulting from Operations | 1,013,481 | 1,045,379 |
| Distributions | | |
| Net Investment Income | (105,119) | (131,354) |
| Realized Capital Gain1 | (3,164) | — |
| Total Distributions | (108,283) | (131,354) |
| Capital Share Transactions | | |
| Issued | 694,140 | 944,850 |
| Issued in Lieu of Cash Distributions | 106,747 | 129,656 |
| Redeemed | (591,085) | (1,178,832) |
| Net Increase (Decrease) from Capital Share Transactions | 209,802 | (104,326) |
| Total Increase (Decrease) | 1,115,000 | 809,699 |
| Net Assets | | |
| Beginning of Period | 7,430,616 | 6,620,917 |
| End of Period2 | 8,545,616 | 7,430,616 |
1 Includes fiscal 2011 short-term gain distributions totaling $3,164,000. Short-term gain distributions are treated as ordinary income dividends for tax purposes.
2 Net Assets—End of Period includes undistributed net investment income of $23,343,000 and $40,293,000.
See accompanying Notes, which are an integral part of the Financial Statements.
39
LifeStrategy Growth Fund
| | | | | | |
| Financial Highlights | | | | | | |
| |
| |
| Six Months | | | | | |
| | Ended | | | | | |
| For a Share Outstanding | April 30, | | | Year Ended October 31, |
| Throughout Each Period | 2011 | 2010 | 2009 | 2008 | 2007 | 2006 |
| Net Asset Value, Beginning of Period | $21.28 | $18.66 | $16.86 | $26.56 | $23.32 | $20.37 |
| Investment Operations | | | | | | |
| Net Investment Income | .249 | .417 | .423 | .571 | .540 | .450 |
| Capital Gain Distributions Received | .017 | — | — | — | — | — |
| Net Realized and Unrealized Gain (Loss) | | | | | | |
| on Investments | 2.592 | 2.573 | 1.818 | (9.690) | 3.220 | 2.950 |
| Total from Investment Operations | 2.858 | 2.990 | 2.241 | (9.119) | 3.760 | 3.400 |
| Distributions | | | | | | |
| Dividends from Net Investment Income | (.299) | (.370) | (.441) | (.581) | (.520) | (.450) |
| Distributions from Realized Capital Gains | (.009) | — | — | — | — | — |
| Total Distributions | (.308) | (.370) | (.441) | (.581) | (.520) | (.450) |
| Net Asset Value, End of Period | $23.83 | $21.28 | $18.66 | $16.86 | $26.56 | $23.32 |
| |
| Total Return1 | 13.55% | 16.21% | 13.74% | -34.98% | 16.32% | 16.94% |
| |
| Ratios/Supplemental Data | | | | | | |
| Net Assets, End of Period (Millions) | $8,546 | $7,431 | $6,621 | $6,267 | $10,372 | $8,422 |
| Ratio of Total Expenses to | | | | | | |
| Average Net Assets | — | — | — | — | — | — |
| Acquired Fund Fees and Expenses | 0.21% | 0.20% | 0.23% | 0.21% | 0.23% | 0.27% |
| Ratio of Net Investment Income to | | | | | | |
| Average Net Assets | 1.84% | 2.09% | 2.57% | 2.47% | 2.15% | 2.07% |
| Portfolio Turnover Rate | 16% | 11% | 12%2 | 10% | 4% | 3% |
The expense ratio, acquired fund fees and expenses, net income ratio, and turnover rate for the current period have been annualized.
1 Total returns do not include account service fees that may have applied in the periods shown. Fund prospectuses provide information about any applicable account service fees.
2 Excludes the value of mutual fund shares delivered and received in connection with a change in the fund’s bond investments from Vanguard Total Bond Market Index Fund to Vanguard Total Bond Market II Index Fund because those transactions were effected in kind and did not cause the fund to incur transaction costs.
See accompanying Notes, which are an integral part of the Financial Statements.
40
LifeStrategy Growth Fund
Notes to Financial Statements
Vanguard LifeStrategy Growth Fund is registered under the Investment Company Act of 1940 as an open-end investment company, or mutual fund. The fund follows a balanced investment strategy by investing in selected Vanguard funds to achieve its targeted allocation of assets to U.S. stocks, international stocks, bonds, and short-term reserves.
A. The following significant accounting policies conform to generally accepted accounting principles for U.S. mutual funds. The fund consistently follows such policies in preparing its financial statements.
1. Security Valuation: Investments are valued at the net asset value of each underlying Vanguard fund determined as of the close of the New York Stock Exchange (generally 4 p.m., Eastern time) on the valuation date.
2. Federal Income Taxes: The fund intends to continue to qualify as a regulated investment company and distribute all of its taxable income. Management has analyzed the fund’s tax positions taken for all open federal income tax years (October 31, 2007–2010), and for the period ended April 30, 2011, and has concluded that no provision for federal income tax is required in the fund’s financial statements.
3. Distributions: Distributions to shareholders are recorded on the ex-dividend date.
4. Other: Income and capital gain distributions received are recorded on the ex-dividend date. Security transactions are accounted for on the date securities are bought or sold. Costs used to determine realized gains (losses) on the sale of investment securities are those of the specific securities sold.
B. Under a service agreement, The Vanguard Group furnishes corporate management, administrative, marketing, and distribution services to the fund. The service agreement provides that the fund’s expenses may be reduced or eliminated to the extent of savings realized by the Vanguard funds by the operation of the fund. Accordingly, all incremental expenses for services provided by Vanguard and all other expenses incurred by the fund during the period ended April 30, 2011, were borne by the funds in which the fund invests. The fund’s trustees and officers are also directors and officers of Vanguard and the funds in which the fund invests.
C. Various inputs may be used to determine the value of the fund’s investments. These inputs are summarized in three broad levels for financial statement purposes. The inputs or methodologies used to value securities are not necessarily an indication of the risk associated with investing in those securities.
Level 1—Quoted prices in active markets for identical securities.
Level 2—Other significant observable inputs (including quoted prices for similar securities, interest rates, prepayment speeds, credit risk, etc.).
Level 3—Significant unobservable inputs (including the fund’s own assumptions used to determine the fair value of investments).
At April 30, 2011, 100% of the fund’s investments were valued based on Level 1 inputs.
D. Distributions are determined on a tax basis and may differ from net investment income and realized capital gains for financial reporting purposes. Differences may be permanent or temporary. Permanent differences are reclassified among capital accounts in the financial statements to reflect their tax character. Temporary differences arise when certain items of income, expense, gain, or loss are recognized in different periods for financial statement and tax purposes; these differences will reverse at some time in the future. Differences in classification may also result from the treatment of short-term gains as ordinary income for tax purposes.
41
LifeStrategy Growth Fund
The fund’s tax-basis capital gains and losses are determined only at the end of each fiscal year. For tax purposes, at October 31, 2010, the fund had available capital loss carryforwards totaling $69,340,000 to offset future net capital gains through October, 17, 2017. The fund will use these capital losses to offset net taxable capital gains, if any, realized during the year ending October 31, 2011; should the fund realize net capital losses for the year, the losses will be added to the loss carryforward balance above. Short-term capital gain distributions received are treated as ordinary income for tax purposes, and cannot be offset by capital losses. Capital gain distributions paid during the six months ended April 30, 2011, are from short-term gain distributions received from Vanguard Total Bond Market II Index Fund.
At April 30, 2011, the cost of investment securities for tax purposes was $6,549,945,000. Net unrealized appreciation of investment securities for tax purposes was $1,994,400,000, consisting entirely of unrealized gains on securities that had risen in value since their purchase.
E. During the six months ended April 30, 2011, the fund purchased $1,278,813,000 of investment securities and sold $1,063,172,000 of investment securities, other than temporary cash investments.
F. Capital shares issued and redeemed were:
| | |
| | Six Months Ended | Year Ended |
| | April 30, 2011 | October 31, 2010 |
| | Shares | Shares |
| | (000) | (000) |
| Issued | 30,880 | 47,488 |
| Issued in Lieu of Cash Distributions | 4,848 | 6,633 |
| Redeemed | (26,338) | (59,624) |
| Net Increase (Decrease) in Shares Outstanding | 9,390 | (5,503) |
G. In preparing the financial statements as of April 30, 2011, management considered the impact of subsequent events for potential recognition or disclosure in these financial statements.
42
About Your Fund’s Expenses
As a shareholder of the fund, you incur ongoing costs, which include costs for portfolio management, administrative services, and shareholder reports (like this one), among others. Operating expenses, which are deducted from a fund’s gross income, directly reduce the investment return of the fund.
A typical fund’s expenses are expressed as a percentage of its average net assets. The LifeStrategy Funds have no direct expenses, but each fund bears its proportionate share of the costs for the underlying funds in which it invests. These indirect expenses make up the acquired fund fees and expenses, also expressed as a percentage of average net assets.
The following examples are intended to help you understand the ongoing cost (in dollars) of investing in your fund and to compare these costs with those of other mutual funds. The examples are based on an investment of $1,000 made at the beginning of the period shown and held for the entire period. The costs were calculated using the acquired fund fees and expenses for each LifeStrategy Fund.
The accompanying table illustrates your fund’s costs in two ways:
• Based on actual fund return. This section helps you to estimate the actual expenses that you paid over the period. The ”Ending Account Value“ shown is derived from the fund‘s actual return, and the third column shows the dollar amount that would have been paid by an investor who started with $1,000 in the fund. You may use the information here, together with the amount you invested, to estimate the expenses that you paid over the period.
To do so, simply divide your account value by $1,000 (for example, an $8,600 account value divided by $1,000 = 8.6), then multiply the result by the number given for your fund under the heading ”Expenses Paid During Period.“
• Based on hypothetical 5% yearly return. This section is intended to help you compare your fund‘s costs with those of other mutual funds. It assumes that the fund had a yearly return of 5% before expenses, but that the expense ratio is unchanged. In this case—because the return used is not the fund’s actual return—the results do not apply to your investment. The example is useful in making comparisons because the Securities and Exchange Commission requires all mutual funds to calculate expenses based on a 5% return. You can assess your fund’s costs by comparing this hypothetical example with the hypothetical examples that appear in shareholder reports of other funds.
Note that the expenses shown in the table are meant to highlight and help you compare ongoing costs only and do not reflect transaction costs incurred by the fund for buying and selling securities. Further, the expenses do not include any purchase, redemption, or account service fees described in the fund prospectus. If such fees were applied to your account, your costs would be higher. Your fund does not carry a “sales load.”
The calculations assume no shares were bought or sold during the period. Your actual costs may have been higher or lower, depending on the amount of your investment and the timing of any purchases or redemptions.
You can find more information about the fund’s expenses, including annual expense ratios, in the Financial Statements section of this report. For additional information on operating expenses and other shareholder costs, please refer to your fund’s current prospectus.
43
| | | |
| Six Months Ended April 30, 2011 | | | |
| | Beginning | Ending | Expenses |
| | Account Value | Account Value | Paid During |
| | 10/31/2010 | 4/30/2011 | Period |
| Based on Actual Fund Return | | | |
| LifeStrategy Income Fund | $1,000.00 | $1,039.09 | $0.91 |
| LifeStrategy Conservative Growth Fund | $1,000.00 | $1,070.61 | $1.03 |
| LifeStrategy Moderate Growth Fund | $1,000.00 | $1,102.14 | $0.99 |
| LifeStrategy Growth Fund | $1,000.00 | $1,135.49 | $1.11 |
| Based on Hypothetical 5% Yearly Return | | | |
| LifeStrategy Income Fund | $1,000.00 | $1,023.90 | $0.90 |
| LifeStrategy Conservative Growth Fund | $1,000.00 | $1,023.80 | $1.00 |
| LifeStrategy Moderate Growth Fund | $1,000.00 | $1,023.85 | $0.95 |
| LifeStrategy Growth Fund | $1,000.00 | $1,023.75 | $1.05 |
The calculations are based on acquired fund fees and expenses charged by the underlying mutual funds in which the LifeStrategy Funds invest. The LifeStrategy Funds’ annualized expense figures for the period are (in order as listed from top to bottom above) 0.18%, 0.20%, 0.19%, and 0.21%. The dollar amounts shown as ”Expenses Paid” are equal to the annualized average weighted expense ratio for the underlying funds multiplied by the average account value over the period, multiplied by the number of days in the most recent six-month period, then divided by the number of days in the most recent 12-month period.
44
Glossary
30-Day SEC Yield. A fund’s 30-day SEC yield is derived using a formula specified by the U.S. Securities and Exchange Commission. Under the formula, data related to the fund’s security holdings in the previous 30 days are used to calculate the fund’s hypothetical net income for that period, which is then annualized and divided by the fund’s estimated average net assets over the calculation period. For the purposes of this calculation, a security’s income is based on its current market yield to maturity (in the case of bonds) or its projected dividend yield (for stocks). Because the SEC yield represents hypothetical annualized income, it will differ—at times significantly—from the fund’s actual experience. As a result, the fund’s income distributions may be higher or lower than implied by the SEC yield.
Acquired Fund Fees and Expenses. Funds that invest in other Vanguard funds incur no direct expenses, but they do bear proportionate shares of the operating, administrative, and advisory expenses of the underlying funds, and they must pay any fees charged by those funds. The figure for acquired fund fees and expenses represents a weighted average of these underlying costs. Acquired is a term that the Securities and Exchange Commission applies to any mutual fund whose shares are owned by another fund.
Beta. A measure of the magnitude of a fund’s past share-price fluctuations in relation to the ups and downs of a given market index. The index is assigned a beta of 1.00. Compared with a given index, a fund with a beta of 1.20 typically would have seen its share price rise or fall by 12% when the index rose or fell by 10%. For this report, beta is based on returns over the past 36 months for both the fund and the index. Note that a fund’s beta should be reviewed in conjunction with its R-squared (see definition). The lower the R-squared, the less correlation there is between the fund and the index, and the less reliable beta is as an indicator of volatility.
Expense Ratio. The percentage of a fund’s average net assets used to pay its annual administrative and advisory expenses. These expenses directly reduce returns to investors.
Inception Date. The date on which the assets of a fund (or one of its share classes) are first invested in accordance with the fund’s investment objective. For funds with a subscription period, the inception date is the day after that period ends. Investment performance is measured from the inception date.
R-Squared. A measure of how much of a fund’s past returns can be explained by the returns from the market in general, as measured by a given index. If a fund’s total returns were precisely synchronized with an index’s returns, its R-squared would be 1.00. If the fund’s returns bore no relationship to the index’s returns, its R-squared would be 0. For this report, R-squared is based on returns over the past 36 months for both the fund and the index.
45
This page intentionally left blank.
This page intentionally left blank.
The People Who Govern Your Fund
The trustees of your mutual fund are there to see that the fund is operated and managed in your best interests since, as a shareholder, you are a part owner of the fund. Your fund’s trustees also serve on the board of directors of The Vanguard Group, Inc., which is owned by the Vanguard funds and provides services to them on an at-cost basis.
A majority of Vanguard’s board members are independent, meaning that they have no affiliation with Vanguard or the funds they oversee, apart from the sizable personal investments they have made as private individuals. The independent board members have distinguished backgrounds in business, academia, and public service. Each of the trustees and executive officers oversees 179 Vanguard funds.
The following table provides information for each trustee and executive officer of the fund. More information about the trustees is in the Statement of Additional Information, which can be obtained, without charge, by contacting Vanguard at 800-662-7447, or online at vanguard.com.
| |
| Interested Trustee1 | and President (2006–2008) of Rohm and Haas Co. |
| | (chemicals); Director of Tyco International, Ltd. |
| F. William McNabb III | (diversified manufacturing and services) and Hewlett- |
| Born 1957. Trustee Since July 2009. Chairman of the | Packard Co. (electronic computer manufacturing); |
| Board. Principal Occupation(s) During the Past Five | Senior Advisor at New Mountain Capital; Trustee |
| Years: Chairman of the Board of The Vanguard Group, | of The Conference Board; Member of the Board of |
| Inc., and of each of the investment companies served | Managers of Delphi Automotive LLP (automotive |
| by The Vanguard Group, since January 2010; Director | components). |
| of The Vanguard Group since 2008; Chief Executive | |
| Officer and President of The Vanguard Group and of | Amy Gutmann |
| each of the investment companies served by The | Born 1949. Trustee Since June 2006. Principal |
| Vanguard Group since 2008; Director of Vanguard | Occupation(s) During the Past Five Years: President |
| Marketing Corporation; Managing Director of The | of the University of Pennsylvania; Christopher H. |
| Vanguard Group (1995–2008). | Browne Distinguished Professor of Political Science |
| | in the School of Arts and Sciences with secondary |
| | appointments at the Annenberg School for Commu- |
| Independent Trustees | nication and the Graduate School of Education |
| | of the University of Pennsylvania; Director of |
| Emerson U. Fullwood | Carnegie Corporation of New York, Schuylkill River |
| Born 1948. Trustee Since January 2008. Principal | Development Corporation, and Greater Philadelphia |
| Occupation(s) During the Past Five Years: Executive | Chamber of Commerce; Trustee of the National |
| Chief Staff and Marketing Officer for North America | Constitution Center; Chair of the Presidential |
| and Corporate Vice President (retired 2008) of Xerox | Commission for the Study of Bioethical Issues. |
| Corporation (document management products and | |
| services); Executive in Residence and 2010 | JoAnn Heffernan Heisen |
| Distinguished Minett Professor at the Rochester | Born 1950. Trustee Since July 1998. Principal |
| Institute of Technology; Director of SPX Corporation | Occupation(s) During the Past Five Years: Corporate |
| (multi-industry manufacturing), the United Way of | Vice President and Chief Global Diversity Officer |
| Rochester, Amerigroup Corporation (managed health | (retired 2008) and Member of the Executive |
| care), the University of Rochester Medical Center, | Committee (1997–2008) of Johnson & Johnson |
| Monroe Community College Foundation, and North | (pharmaceuticals/consumer products); Director of |
| Carolina A&T University. | Skytop Lodge Corporation (hotels), the University |
| | Medical Center at Princeton, the Robert Wood |
| Rajiv L. Gupta | Johnson Foundation, and the Center for Work Life |
| Born 1945. Trustee Since December 2001.2 | Policy; Member of the Advisory Board of the |
| Principal Occupation(s) During the Past Five Years: | Maxwell School of Citizenship and Public Affairs |
| Chairman and Chief Executive Officer (retired 2009) | at Syracuse University. |
| | |
| F. Joseph Loughrey | Thomas J. Higgins | |
| Born 1949. Trustee Since October 2009. Principal | Born 1957. Chief Financial Officer Since September |
| Occupation(s) During the Past Five Years: President | 2008. Principal Occupation(s) During the Past Five |
| and Chief Operating Officer (retired 2009) and Vice | Years: Principal of The Vanguard Group, Inc.; Chief |
| Chairman of the Board (2008–2009) of Cummins Inc. | Financial Officer of each of the investment companies |
| (industrial machinery); Director of SKF AB (industrial | served by The Vanguard Group since 2008; Treasurer |
| machinery), Hillenbrand, Inc. (specialized consumer | of each of the investment companies served by The |
| services), the Lumina Foundation for Education, and | Vanguard Group (1998–2008). |
| Oxfam America; Chairman of the Advisory Council | | |
| for the College of Arts and Letters and Member | Kathryn J. Hyatt | |
| of the Advisory Board to the Kellogg Institute for | Born 1955. Treasurer Since November 2008. Principal |
| International Studies at the University of Notre Dame. | Occupation(s) During the Past Five Years: Principal |
| | of The Vanguard Group, Inc.; Treasurer of each of |
| André F. Perold | the investment companies served by The Vanguard |
| Born 1952. Trustee Since December 2004. Principal | Group since 2008; Assistant Treasurer of each of the |
| Occupation(s) During the Past Five Years: George | investment companies served by The Vanguard Group |
| Gund Professor of Finance and Banking at the Harvard | (1988–2008). | |
| Business School; Chair of the Investment Committee | | |
| of HighVista Strategies LLC (private investment firm). | Heidi Stam | |
| | Born 1956. Secretary Since July 2005. Principal |
| Alfred M. Rankin, Jr. | Occupation(s) During the Past Five Years: Managing |
| Born 1941. Trustee Since January 1993. Principal | Director of The Vanguard Group, Inc., since 2006; |
| Occupation(s) During the Past Five Years: Chairman, | General Counsel of The Vanguard Group since 2005; |
| President, and Chief Executive Officer of NACCO | Secretary of The Vanguard Group and of each of the |
| Industries, Inc. (forklift trucks/housewares/lignite); | investment companies served by The Vanguard Group |
| Director of Goodrich Corporation (industrial products/ | since 2005; Director and Senior Vice President of |
| aircraft systems and services) and the National | Vanguard Marketing Corporation since 2005; |
| Association of Manufacturers; Chairman of the | Principal of The Vanguard Group (1997–2006). |
| Federal Reserve Bank of Cleveland; Vice Chairman | | |
| of University Hospitals of Cleveland; President of | | |
| the Board of The Cleveland Museum of Art. | Vanguard Senior Management Team |
| |
| Peter F. Volanakis | R. Gregory Barton | Michael S. Miller |
| Born 1955. Trustee Since July 2009. Principal | Mortimer J. Buckley | James M. Norris |
| Occupation(s) During the Past Five Years: President | Kathleen C. Gubanich | Glenn W. Reed |
| and Chief Operating Officer (retired 2010) of Corning | Paul A. Heller | George U. Sauter |
| Incorporated (communications equipment); Director of | Martha G. King | |
| Corning Incorporated (2000–2010) and Dow Corning | | |
| (2001–2010); Overseer of the Amos Tuck School of | | |
| Business Administration at Dartmouth College. | Chairman Emeritus and Senior Advisor |
| |
| | John J. Brennan | |
| Executive Officers | Chairman, 1996–2009 | |
| | Chief Executive Officer and President, 1996–2008 |
| Glenn Booraem | | |
| Born 1967. Controller Since July 2010. Principal | | |
| Occupation(s) During the Past Five Years: Principal | Founder | |
| of The Vanguard Group, Inc.; Controller of each of | | |
| the investment companies served by The Vanguard | John C. Bogle | |
| Group since 2010; Assistant Controller of each of | Chairman and Chief Executive Officer, 1974–1996 |
| the investment companies served by The Vanguard | | |
| Group (2001–2010). | | |
1 Mr. McNabb is considered an “interested person,” as defined in the Investment Company Act of 1940, because he is an officer of the Vanguard funds.
2 December 2002 for Vanguard Equity Income Fund, Vanguard Growth Equity Fund, the Vanguard Municipal Bond Funds, and the Vanguard State Tax-Exempt Funds.
|  |
| P.O. Box 2600 |
| Valley Forge, PA 19482-2600 |
Connect with Vanguard® > vanguard.com
| |
| Fund Information > 800-662-7447 | |
| Direct Investor Account Services > 800-662-2739 | |
| Institutional Investor Services > 800-523-1036 | |
| Text Telephone for People | |
| With Hearing Impairment > 800-749-7273 | |
| |
| This material may be used in conjunction | |
| with the offering of shares of any Vanguard | |
| fund only if preceded or accompanied by | |
| the fund’s current prospectus. | |
| |
| All comparative mutual fund data are from Lipper Inc. or | |
| Morningstar, Inc., unless otherwise noted. | |
| |
| You can obtain a free copy of Vanguard’s proxy voting | |
| guidelines by visiting vanguard.com/proxyreporting or by | |
| calling Vanguard at 800-662-2739. The guidelines are | |
| also available from the SEC’s website, sec.gov. In | |
| addition, you may obtain a free report on how your fund | |
| voted the proxies for securities it owned during the 12 | |
| months ended June 30. To get the report, visit either | |
| vanguard.com/proxyreporting or sec.gov. | |
| |
| You can review and copy information about your fund at | |
| the SEC’s Public Reference Room in Washington, D.C. To | |
| find out more about this public service, call the SEC at | |
| 202-551-8090. Information about your fund is also | |
| available on the SEC’s website, and you can receive | |
| copies of this information, for a fee, by sending a | |
| request in either of two ways: via e-mail addressed to | |
| publicinfo@sec.gov or via regular mail addressed to the | |
| Public Reference Section, Securities and Exchange | |
| Commission, Washington, DC 20549-1520. | |
| | © 2011 The Vanguard Group, Inc. |
| | All rights reserved. |
| | Vanguard Marketing Corporation, Distributor. |
| |
| | Q882 062011 |
 |
| Vanguard Total International Stock |
| Index Fund Semiannual Report |
|
| April 30, 2011 |
|
 |
|
|
> Vanguard Total International Stock Index Fund Investor Shares returned 12.10% for the six months ended April 30, 2011.
> The fund’s return was in line with that of its benchmark index, but slightly behind the average return of its peer funds.
> Developed European markets outperformed emerging and Pacific Rim markets. The materials, energy, and industrial sectors were among the fund’s best performers.
| |
| Contents | |
| Your Fund’s Total Returns. | 1 |
| Chairman’s Letter. | 2 |
| Fund Profile. | 7 |
| Performance Summary. | 9 |
| Financial Statements. | 10 |
| About Your Fund’s Expenses. | 31 |
| Trustees Approve Advisory Arrangement. | 33 |
| Glossary. | 34 |

Total International Stock Index Fund
Please note: The opinions expressed in this report are just that—informed opinions. They should not be considered promises or advice. Also, please keep in mind that the information and opinions cover the period through the date on the front of this report. Of course, the risks of investing in your fund are spelled out in the prospectus.
See the Glossary for definitions of investment terms used in this report.
Cover photograph: Jean Maher.
Your Fund’s Total Returns
| |
| Six Months Ended April 30, 2011 | |
| | Total |
| | Returns |
| Vanguard Total International Stock Index Fund | |
| Investor Shares | 12.10% |
| Admiral™ Shares (Inception: 11/29/2010) | 16.11 |
| Signal® Shares (Inception: 11/30/2010) | 17.43 |
| Institutional Shares (Inception: 11/29/2010) | 16.15 |
| Institutional Plus Shares (Inception: 11/30/2010) | 17.45 |
| ETF Shares (Inception: 1/26/2011) | |
| Market Price | 7.18 |
| Net Asset Value | 6.40 |
| Spliced Total International Stock Index | 12.04 |
| International Funds Average | 12.64 |
Spliced Total International Stock Index: Consists of the Total International Composite Index through August 31, 2006; the MSCI EAFE +
Emerging Markets Index through December 15, 2010; and the MSCI ACWI ex USA IMI Index thereafter. Returns for the MSCI indexes are
adjusted for withholding taxes applicable to Luxembourg holding companies.
International Funds Average: Derived from data provided by Lipper Inc.
For the ETF Shares, the market price is determined by the midpoint of the bid-offer spread as of the closing time of the New York Stock
Exchange (generally 4 p.m., Eastern time). The net asset value is also determined as of the NYSE closing time. For more information about
how the ETF Shares' market prices have compared with their net asset value, visit vanguard.com, select your ETF, and then select the Price
and Performance tab. The ETF premium/discount analysis there shows the percentages of days on which the ETF Shares' market price was
above or below the NAV.
| | | | |
| Your Fund’s Performance at a Glance | | | | |
| October 31, 2010 , Through April 30, 2011 | | | | |
| | | | Distributions Per Share |
| | Starting | Ending | Income | Capital |
| | Share Price | Share Price | Dividends | Gains |
| Vanguard Total International Stock Index Fund | | | | |
| Investor Shares | $15.48 | $17.08 | $0.249 | $0.000 |
| Admiral Shares (Inception: 11/29/2010) | 25.00 | 28.57 | 0.417 | 0.000 |
| Signal Shares (Inception: 11/30/2010) | 29.66 | 34.29 | 0.501 | 0.000 |
| Institutional Shares (Inception: 11/29/2010) | 100.00 | 114.31 | 1.673 | 0.000 |
| Institutional Plus Shares | | | | |
| (Inception: 11/30/2010) | 98.88 | 114.32 | 1.674 | 0.000 |
| ETF Shares (Inception: 1/26/2011) | 50.00 | 53.20 | 0.000 | 0.000 |
1

Chairman’s Letter
Dear Shareholder,
International markets advanced even as news headlines focused on political upheaval in North Africa and the Middle East, natural and nuclear disasters in Japan, and debt problems in Europe. For the six months ended April 30, 2011, Vanguard Total International Stock Index Fund Investor Shares returned 12.10%. This return was in line with that of the fund’s benchmark index, but slightly behind the average return of its peer international funds.
While developed markets in Europe outperformed emerging and Pacific markets, international markets as a whole trailed the broad U.S. market.
Since my letter to you six months ago, we’ve launched five additional share classes of the fund, all of which offer a lower expense ratio than the fund’s Investor Shares. This letter focuses primarily on the performance of the Investor Shares, which were in operation for the full six-month period. Also, the fund completed its previously announced transition to tracking a new benchmark, the MSCI All Country World ex USA Investable Market Index—which, unlike the former benchmark, includes small-capitalization stocks and Canada.
Strong returns around the globe
In general, global stock markets produced outstanding returns for the six months ended April 30. For U.S.-based investors, international stock markets produced a
2
return of more than 12% in U.S. dollars. Almost half of this return reflected exchange rate gains produced largely by strength in the euro and currencies in emerging economies.
The broad U.S. stock market returned more than 17%. Although rising food and gasoline prices put pressure on consumer budgets, corporate earnings growth remained strong and the pace of new job creation bounced back from extremely depressed levels.
As the economy found its footing, rates edged higher
Rising longer-term interest rates put pressure on bond prices, which led to modest bond market returns for the six-month period. The broad taxable U.S. bond market returned about 0%. The broad municipal market returned –1.68%. The rise in rates reflected both confidence that the economic recovery would prove self-sustaining and thus nudge rates higher, and anxiety that higher rates would be necessary to provide some protection from inflation. Even so, inflation expectations remained subdued, as measured by the difference between the yields of inflation-protected and nominal U.S. Treasury bonds.
The return on short-term money market instruments such as the 3-month U.S. Treasury bill remained near 0%, consistent with the Federal Reserve Board’s target for short-term rates.
| | | |
| Market Barometer | | | |
| |
| | | | Total Returns |
| | | Periods Ended April 30, 2011 |
| | Six | One | Five Years |
| | Months | Year | (Annualized) |
| Stocks | | | |
| Russell 1000 Index (Large-caps) | 17.12% | 18.02% | 3.30% |
| Russell 2000 Index (Small-caps) | 23.73 | 22.20 | 3.89 |
| Dow Jones U.S. Total Stock Market Index | 17.28 | 18.40 | 3.65 |
| MSCI All Country World Index ex USA (International) | 12.44 | 19.73 | 3.55 |
| |
| Bonds | | | |
| Barclays Capital U.S. Aggregate Bond Index (Broad | | | |
| taxable market) | 0.02% | 5.36% | 6.33% |
| Barclays Capital Municipal Bond Index (Broad | | | |
| tax-exempt market) | -1.68 | 2.20 | 4.52 |
| Citigroup Three-Month U.S. Treasury Bill Index | 0.06 | 0.15 | 2.02 |
| |
| CPI | | | |
| Consumer Price Index | 2.83% | 3.16% | 2.22% |
3
Emerging markets lagged developed countries in Europe
Developed markets in Europe outshone emerging markets. A combination of factors, including fears of rising inflation and uncertainty about crude oil prices, restrained the returns of China and other fast-growing countries in the developing world. Despite the devastating events in Japan, the Pacific region posted a respectable 9% return, one percentage point shy of that of emerging markets. For U.S.-based investors, the dollar’s six-month decline against most major currencies enhanced returns from abroad. (For more on currencies, see the box on page 5.)
Developed European markets, which represent almost half of the fund’s holdings, contributed more than half of its return for the period, with larger economies, including the United Kingdom, Germany, and France, accounting for about a third of the fund’s overall return. Industrial, materials, and energy companies in Europe performed best, boosted by a sharp rise in crude oil and commodity prices and growth opportunities in emerging markets.
Several of Europe’s most troubled economies—Greece, Ireland, Spain, and Portugal—grabbed headlines throughout the period; however, the strength of the euro led to gains in three of these four countries. Of the four, only Greece failed to post a positive return for the period.
| | | | | | | |
| Expense Ratios | | | | | | | |
| Your Fund Compared With Its Peer Group | | | | | | |
| | | | | | | | Peer |
| | Investor | Admiral | Signal | Institutional | Institutional | ETF | Group |
| | Shares | Shares | Shares | Shares | Plus Shares | Shares | Average |
| Total International Stock Index | | | | | | | |
| Fund | 0.26% | 0.20% | 0.20% | 0.15% | 0.12% | 0.20% | 1.42% |
The fund expense ratios shown are from the prospectus dated February 28, 2011, and represent estimated costs for the current fiscal year. For the six months ended April 30, 2011, the fund’s annualized expense ratio was 0.25% for Investor Shares. For the periods from inception through April 30, 2011, the annualized expense ratios were 0.19% for Admiral Shares; 0.19% for Signal Shares; 0.14% for Institutional Shares; 0.11% for Institutional Plus Shares; and 0.18% for ETF Shares. The peer-group expense ratio is derived from data provided by Lipper Inc. and captures information through year-end 2010.
Peer group: International Funds.
4
Emerging markets, which represented, on average, just under a quarter of the fund’s assets, delivered more muted results. Investors’ concerns about inflation took a bite out of the returns of several
countries, including China and India, both of which have tightened their monetary policy to cope with rising food and energy prices. China (+1%), the fund’s largest holding in emerging markets, barely made
|
| Investment insight |
| A note on foreign currency translation effects |
| When you buy stocks of companies based outside of your home country, you gain |
| exposure to a wider array of economic and market forces, including the dynamics |
| of the foreign exchange markets. |
| |
| The exchange rate of the U.S. dollar versus another currency is the price at which |
| the dollar can be converted into that currency. For example, if the exchange rate |
| of the U.S. dollar versus Britain’s pound sterling is $1.50, it takes 1.5 dollars to |
| purchase 1 pound. If the U.S. dollar weakens—say, to a rate of $2.00—then you’ll |
| need 2 dollars to buy 1 pound. Conversely, if the dollar strengthens to $1.25, it will |
| take fewer dollars to buy a pound. |
| |
| The price of one currency relative to another is determined by supply and demand |
| factors—including interest rates, the strength of the two economies, and geopolitical |
| risks. In the long run, the portfolio effects of exchange rate movements tend to |
| balance out. But a rise or fall in the dollar’s value versus other currencies can influence |
| short-term returns. Exchange rate changes also affect the purchasing power of each |
| new dollar you invest in foreign stocks, just as they affect the prices of foreign goods. |
| And they can have a less immediately visible impact on a company’s profits, ultimately |
| driving its stock price. |
| |
| Performance during the period |
| From October 31, 2010, through April 30, 2011, most major currencies rose in value |
| against the U.S. dollar. In part, this reflected the Federal Reserve’s policy of holding |
| short-term interest rates near zero while some foreign central banks raised rates. |
| For U.S.-based investors, the shrinking dollar boosted returns earned in local markets. |
| For example: The MSCI Europe Index returned more than 15% when translated into |
| U.S. dollars, and the MSCI Emerging Markets Index returned nearly 10% in dollars— |
| both nearly double the indexes’ local-currency returns. In contrast, the dollar rose |
| modestly against earthquake-devastated Japan’s yen, trimming U.S.-based investors’ |
| return from Japan. |
5
a dent in the fund’s performance for the period. And India (–6%), another large holding, suffered widespread declines in several sectors, particularly financials. Still, weakness in some emerging markets was countered by outstanding results in others. The energy, materials, and information technology sectors were winners in emerging markets. Russia (+34%) was a star performer, thanks largely to strong results from its oil and natural gas companies.
The Pacific region, which represents about a quarter of the fund’s holdings, on average, contributed about two percentage points (roughly the same contribution as emerging markets) to the fund’s results. The region’s performance was led by Australia, which benefited from continued strength in its materials and financial sectors. Japan is the fund’s largest country exposure in this region, but performance in this market did not significantly hurt results. Although there was an initial sell-off of Japanese stocks just after the March earthquake and tsunami, only the country’s utilities sector posted a negative return for the half-year.
Focus on the long term, tune out the noise
International stocks sustained some body blows during the past six months, but they quickly recovered. The market’s strong finish in April is encouraging and a reminder that it’s impossible to know how the market will react to unforeseen events.
There will always be unexpected news—good or bad—that can drive stock markets around the world higher or lower. As tempting as it may be to do so, we should not let such news affect the way we invest. We are better served by remaining focused on our long-term investment goals.
No matter what the market’s direction, it’s prudent to build a well-balanced, diversified portfolio that includes a mix of stocks, bonds, and short-term investments appropriate for your time horizon, financial objectives, and risk tolerance.
Vanguard Total International Index Fund, which provides wide exposure to companies outside of the United States, can play an important role in such a diversified portfolio.
Thank you for entrusting your assets to Vanguard.
Sincerely,

F. William McNabb III
Chairman and Chief Executive Officer
May 12, 2011
6
Total International Stock Index Fund
Fund Profile
As of April 30, 2011
| | | | | | |
| Share-Class Characteristics | | | | | | |
| | Investor | Admiral | Signal | Institutional | Institutional | ETF |
| | Shares | Shares | Shares | Shares | Plus Shares | Shares |
| Ticker Symbol | VGTSX | VTIAX | VTSGX | VTSNX | VTPSX | VXUS |
| Expense Ratio1 | 0.26% | 0.20% | 0.20% | 0.15% | 0.12% | 0.20% |
| | | |
| Portfolio Characteristics | | |
| | | | MSCI AC |
| | | MSCI ACWI | World |
| | | ex USA IMI | Index |
| | Fund | Index | ex USA |
| Number of Stocks | 6,501 | 6,378 | 1,869 |
| Median Market Cap | $25.0B | $24.9B | $33.8B |
| Price/Earnings Ratio | 14.2x | 14.1x | 13.8x |
| Price/Book Ratio | 1.7x | 1.7x | 1.7x |
| Return on Equity | 17.2% | 17.1% | 17.8% |
| Earnings Growth Rate | 2.8% | 2.8% | 2.8% |
| Dividend Yield | 2.8% | 2.8% | 2.9% |
| Turnover Rate | | | |
| (Annualized) | 3% | — | — |
| Short-Term Reserves | -0.1% | — | — |
| | | |
| Sector Diversification (% of equity exposure) |
| | | MSCI | MSCI AC |
| | | ACWI | World |
| | | ex USA IMI | Index |
| | Fund | Index | ex USA |
| Consumer | | | |
| Discretionary | 9.8% | 9.8% | 9.0% |
| Consumer Staples | 8.2 | 8.2 | 8.5 |
| Energy | 11.0 | 11.0 | 11.6 |
| Financials | 23.8 | 23.9 | 24.8 |
| Health Care | 5.7 | 5.8 | 5.9 |
| Industrials | 12.2 | 12.2 | 11.0 |
| Information | | | |
| Technology | 6.8 | 6.7 | 6.3 |
| Materials | 13.3 | 13.3 | 13.0 |
| Telecommunication | | | |
| Services | 5.2 | 5.1 | 5.7 |
| Utilities | 4.0 | 4.0 | 4.2 |
| | |
| Volatility Measures | | |
| | Spliced | |
| | Total | MSCI AC |
| | International | World Index |
| | Stock Index | ex USA |
| R-Squared | 0.99 | 0.99 |
| Beta | 1.03 | 1.03 |
These measures show the degree and timing of the fund’s fluctuations compared with the indexes over 36 months.
| | |
| Ten Largest Holdings (% of total net assets) |
| BHP Billiton Ltd. | Diversified Metals | |
| | & Mining | 1.3% |
| Royal Dutch Shell plc | Integrated Oil & | |
| | Gas | 1.2 |
| Nestle SA | Packaged Foods & | |
| | Meats | 1.1 |
| HSBC Holdings plc | Diversified Banks | 1.0 |
| Vodafone Group plc | Wireless | |
| | Telecommunication | |
| | Services | 0.7 |
| Rio Tinto | Diversified Metals | |
| | & Mining | 0.7 |
| BP plc | Integrated Oil & | |
| | Gas | 0.7 |
| Total SA | Integrated Oil & | |
| | Gas | 0.7 |
| Novartis AG | Pharmaceuticals | 0.6 |
| Petroleo Brasileiro SA | Integrated Oil & | |
| | Gas | 0.6 |
| Top Ten | | 8.6% |
The holdings listed exclude any temporary cash investments and equity index products.
1 The expense ratios shown are from the prospectus dated February 28, 2011, and represent estimated costs for the current fiscal year. For the six months ended April 30, 2011, the fund’s annualized expense ratio was 0.25% for Investor Shares. For the periods from inception through April 30, 2011, the annualized expense ratios were 0.19% for Admiral Shares; 0.19% for Signal Shares; 0.14% for Institutional Shares; 0.11% for Institutional Plus Shares; and 0.18% for ETF Shares.
7
Total International Stock Index Fund
| | | |
| Market Diversification (% of equity exposure) |
| | | MSCI | |
| | | ACWI | MSCI AC |
| | | ex USA | World |
| | | IMI | Index |
| | Fund | Index | ex USA |
| Europe | | | |
| United Kingdom | 14.8% | 14.6% | 14.7% |
| France | 6.7 | 6.7 | 7.1 |
| Germany | 6.0 | 6.0 | 6.2 |
| Switzerland | 5.2 | 5.2 | 5.5 |
| Spain | 2.4 | 2.4 | 2.5 |
| Sweden | 2.3 | 2.3 | 2.3 |
| Italy | 2.1 | 2.1 | 2.0 |
| Netherlands | 1.7 | 1.7 | 1.8 |
| Other | 4.0 | 4.0 | 3.5 |
| Subtotal | 45.2% | 45.0% | 45.6% |
| Pacific | | | |
| Japan | 13.5% | 13.4% | 13.2% |
| Australia | 6.1 | 6.1 | 6.0 |
| Hong Kong | 1.9 | 1.9 | 1.8 |
| Singapore | 1.2 | 1.2 | 1.2 |
| Other | 0.1 | 0.1 | 0.1 |
| Subtotal | 22.8% | 22.7% | 22.3% |
| Emerging Markets | | | |
| China | 4.0% | 4.0% | 4.0% |
| South Korea | 3.5 | 3.5 | 3.5 |
| Brazil | 3.3 | 3.3 | 3.6 |
| Taiwan | 2.9 | 2.9 | 2.7 |
| South Africa | 1.8 | 1.8 | 1.8 |
| India | 1.7 | 1.7 | 1.7 |
| Russia | 1.5 | 1.5 | 1.7 |
| Mexico | 1.0 | 1.0 | 1.0 |
| Other | 3.4 | 3.6 | 3.5 |
| Subtotal | 23.1% | 23.3% | 23.5% |
| Middle East | 0.5% | 0.5% | 0.5% |
| North America | | | |
| Canada | 8.4% | 8.5% | 8.1% |
Allocation by Region ( % of portfolio)

8
Total International Stock Index Fund
Performance Summary
All of the returns in this report represent past performance, which is not a guarantee of future results that may be achieved by the fund. (Current performance may be lower or higher than the performance data cited. For performance data current to the most recent month-end, visit our website at vanguard.com/performance.) Note, too, that both investment returns and principal value can fluctuate widely, so an investor’s shares, when sold, could be worth more or less than their original cost. The returns shown do not reflect taxes that a shareholder would pay on fund distributions or on the sale of fund shares.
Fiscal-Year Total Returns (%): October 31, 2000, Through April 30, 2011
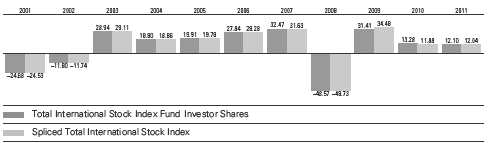
Spliced Total International Stock Index: Consists of the Total International Composite Index through August 31, 2006; the MSCI EAFE + Emerging Markets Index through December 15, 2010; and the MSCI ACWI ex USA IMI Index thereafter. Returns for the MSCI indexes are adjusted for withholding taxes applicable to Luxembourg holding companies.
Note: For 2011, performance data reflect the six months ended April 30, 2011.
Average Annual Total Returns: Periods Ended March 31, 2011
This table presents returns through the latest calendar quarter—rather than through the end of the fiscal period.
Securities and Exchange Commission rules require that we provide this information.
| | | | |
| | Inception | One | Five | Ten |
| | Date | Year | Years | Years |
| Investor Shares | 4/29/1996 | 12.71% | 3.17% | 6.96% |
| Admiral Shares | 11/29/2010 | — | — | 10.341 |
| Signal Shares | 11/30/2010 | — | — | 11.541 |
| Institutional Shares | 11/29/2010 | — | — | 10.351 |
| Institutional Plus Shares | 11/30/2010 | — | — | 11.591 |
| ETF Shares | 1/26/2011 | | | |
| Market Price | | — | — | 1.751 |
| Net Asset Value | | — | — | 1.081 |
| 1 Return since inception. | | | | |
Vanguard fund returns do not reflect the 2% fee on redemptions of shares held for less than two months.
See Financial Highlights for dividend and capital gains information.
9
Total International Stock Index Fund
Financial Statements (unaudited)
Statement of Net Assets—Investments Summary
As of April 30, 2011
This Statement summarizes the fund’s holdings by asset type. Details are reported for each of the fund’s 50 largest individual holdings and for investments that, in total for any issuer, represent more than 1% of the fund’s net assets. The total value of smaller holdings is reported as a single amount within each category.
The fund reports a complete list of its holdings in regulatory filings four times in each fiscal year, at the quarter-ends. For the second and fourth fiscal quarters, the complete listing of the fund’s holdings is available electronically on vanguard.com and on the Securities and Exchange Commission’s website (sec.gov), or you can have it mailed to you without charge by calling 800-662-7447. For the first and third fiscal quarters, the fund files the lists with the SEC on Form N-Q. Shareholders can look up the fund’s Forms N-Q on the SEC’s website. Forms N-Q may also be reviewed and copied at the SEC’s Public Reference Room (see the back cover of this report for further information).
| | | |
| | | Market | Percentage |
| | | Value | of Net |
| | Shares | ($000) | Assets |
| Common Stocks | | | |
| Argentina † | | — | 0.0% |
| |
| Australia | | | |
| BHP Billiton Ltd. | 9,623,985 | 487,262 | 0.8% |
| Commonwealth Bank of Australia | 4,659,725 | 275,078 | 0.5% |
| Westpac Banking Corp. | 8,994,463 | 245,552 | 0.4% |
| Australia & New Zealand Banking Group Ltd. | 7,705,704 | 205,260 | 0.3% |
| National Australia Bank Ltd. | 6,430,971 | 191,469 | 0.3% |
| 1 Australia—Other † | | 2,252,091 | 3.7% |
| | | 3,656,712 | 6.0% |
| |
| Austria † | | 179,812 | 0.3% |
| |
| Belgium † | | 432,472 | 0.7% |
| |
| Brazil † | | 2,021,662 | 3.3% |
| |
| Canada | | | |
| ^ Royal Bank of Canada | 4,286,800 | 270,035 | 0.4% |
| Toronto-Dominion Bank | 2,633,650 | 228,028 | 0.4% |
| Suncor Energy Inc. | 4,702,890 | 216,766 | 0.4% |
| Bank of Nova Scotia | 3,236,841 | 197,361 | 0.3% |
| Canada—Other † | | 4,194,766 | 7.0% |
| | | 5,106,956 | 8.5% |
| |
| Chile † | | 224,256 | 0.4% |
| |
| China | | | |
| China Mobile Ltd. | 18,109,000 | 166,575 | 0.3% |
| China—Other † | | 2,243,147 | 3.7% |
| | | 2,409,722 | 4.0% |
10
Total International Stock Index Fund
| | | | |
| | | | Market | Percentage |
| | | | Value | of Net |
| | | Shares | ($000) | Assets |
| Colombia † | | 35,680 | 0.1% |
| |
| Czech Republic † | | 56,031 | 0.1% |
| |
| Denmark † | | 488,371 | 0.8% |
| |
| Egypt † | | 23,804 | 0.0% |
| |
| Finland † | | 482,130 | 0.8% |
| |
| France | | | |
| | Total SA | 6,358,589 | 407,213 | 0.7% |
| | Sanofi-Aventis SA | 3,155,105 | 249,623 | 0.4% |
| | BNP Paribas | 2,883,662 | 227,967 | 0.4% |
| | France—Other † | | 3,136,270 | 5.1% |
| | | | 4,021,073 | 6.6% |
| Germany | | | |
| | Siemens AG | 2,475,297 | 360,054 | 0.6% |
| *,^ | BASF SE | 2,763,192 | 283,736 | 0.5% |
| ^ | Bayer AG | 2,487,826 | 218,418 | 0.4% |
| ^ | Allianz SE | 1,365,533 | 214,541 | 0.3% |
| | Daimler AG | 2,673,337 | 206,613 | 0.3% |
| ^ | E.ON AG | 5,417,907 | 185,180 | 0.3% |
| | Deutsche Bank AG | 2,796,348 | 182,124 | 0.3% |
| | SAP AG | 2,583,246 | 166,414 | 0.3% |
| | Germany—Other † | | 1,777,163 | 2.9% |
| | | | 3,594,243 | 5.9% |
| |
| Greece † | | 132,880 | 0.2% |
| |
| Hong Kong † | | 1,129,359 | 1.9% |
| |
| Hungary † | | 58,562 | 0.1% |
| |
| India † | | 1,058,916 | 1.8% |
| |
| Indonesia † | | 349,716 | 0.6% |
| |
| Ireland † | | 137,720 | 0.2% |
| |
| Israel † | | 296,983 | 0.5% |
| |
| Italy | | | |
| | ENI SPA | 7,832,434 | 209,703 | 0.3% |
| | Italy—Other † | | 1,030,531 | 1.7% |
| | | | 1,240,234 | 2.0% |
| Japan | | | |
| | Toyota Motor Corp. | 8,287,600 | 330,602 | 0.6% |
| | Honda Motor Co. Ltd. | 4,898,187 | 188,306 | 0.3% |
| | Mitsubishi UFJ Financial Group Inc. | 38,265,499 | 183,659 | 0.3% |
| | Japan—Other † | | 7,426,996 | 12.2% |
| | | | 8,129,563 | 13.4% |
11
Total International Stock Index Fund
| | | |
| | | Market | Percentage |
| | | Value | of Net |
| | Shares | ($000) | Assets |
| Malaysia † | | 420,937 | 0.7% |
| |
| Mexico | | | |
| America Movil SAB de CV | 59,207,970 | 169,677 | 0.3% |
| Mexico—Other † | | 408,889 | 0.7% |
| | | 578,566 | 1.0% |
| |
| Morocco † | | 3,732 | 0.0% |
| |
| Netherlands † | | 1,050,836 | 1.7% |
| |
| New Zealand † | | 65,259 | 0.1% |
| |
| Norway † | | 459,665 | 0.8% |
| |
| Peru † | | 69,131 | 0.1% |
| |
| Philippines † | | 82,131 | 0.1% |
| |
| Poland † | | 249,823 | 0.4% |
| |
| Portugal † | | 115,071 | 0.2% |
| |
| Russia | | | |
| Gazprom OAO ADR | 13,222,678 | 224,042 | 0.4% |
| Russia—Other † | | 691,449 | 1.1% |
| | | 915,491 | 1.5% |
| |
| 1Singapore † | | 740,856 | 1.2% |
| |
| South Africa † | | 1,085,231 | 1.8% |
| |
| South Korea | | | |
| Samsung Electronics Co. Ltd. | 261,755 | 218,639 | 0.4% |
| 1 South Korea—Other † | | 1,892,208 | 3.1% |
| | | 2,110,847 | 3.5% |
| Spain | | | |
| Telefonica SA | 12,357,476 | 331,986 | 0.5% |
| Banco Santander SA | 25,057,699 | 319,999 | 0.5% |
| Banco Bilbao Vizcaya Argentaria SA | 12,837,873 | 164,447 | 0.3% |
| Spain—Other † | | 602,336 | 1.0% |
| | | 1,418,768 | 2.3% |
| |
| Sweden † | | 1,386,117 | 2.3% |
| |
| Switzerland | | | |
| Nestle SA | 10,424,259 | 647,017 | 1.1% |
| Novartis AG | 6,348,113 | 376,444 | 0.6% |
| Roche Holding AG | 2,113,621 | 343,083 | 0.6% |
| * UBS AG | 10,948,514 | 219,108 | 0.3% |
| ABB Ltd. | 6,592,456 | 182,053 | 0.3% |
| 1 Switzerland—Other † | | 1,405,897 | 2.3% |
| | | 3,173,602 | 5.2% |
12
Total International Stock Index Fund
| | | | |
| | | | Market | Percentage |
| | | | Value | of Net |
| | | Shares | ($000) | Assets |
| Taiwan † | | | 1,738,453 | 2.9% |
| |
| Thailand † | | | 266,463 | 0.4% |
| |
| Turkey † | | | 237,988 | 0.4% |
| |
| United Kingdom | | | | |
| HSBC Holdings plc | | 53,137,113 | 579,621 | 1.0% |
| Vodafone Group plc | | 156,843,203 | 453,408 | 0.7% |
| BP plc | | 56,462,841 | 434,051 | 0.7% |
| GlaxoSmithKline plc | | 15,608,643 | 340,975 | 0.6% |
| Rio Tinto plc | | 4,356,275 | 317,861 | 0.5% |
| Royal Dutch Shell plc Class B | | 8,099,535 | 315,114 | 0.5% |
| Royal Dutch Shell plc Class A | | 7,291,289 | 284,011 | 0.5% |
| BHP Billiton plc | | 6,615,068 | 279,689 | 0.5% |
| British American Tobacco plc | | 5,999,299 | 262,155 | 0.4% |
| BG Group plc | | 10,172,110 | 261,951 | 0.4% |
| AstraZeneca plc | | 4,248,882 | 210,823 | 0.4% |
| Anglo American plc | | 3,965,588 | 207,875 | 0.3% |
| Standard Chartered plc | | 7,045,762 | 195,817 | 0.3% |
| Barclays plc | | 34,770,341 | 165,301 | 0.3% |
| Royal Dutch Shell plc Class A (Amsterdam Shares) | 3,361,631 | 129,858 | 0.2% |
| United Kingdom—Other † | | | 4,382,389 | 7.2% |
| | | | 8,820,899 | 14.5% |
| Total Common Stocks (Cost $50,397,593) | | 60,256,723 | 99.3%2 |
| |
| | Coupon | | | |
| Temporary Cash Investments | | | | |
| Money Market Fund | | | | |
| 3,4 Vanguard Market Liquidity Fund | 0.179% | 4,447,515,635 | 4,447,516 | 7.3% |
| |
| 5U.S. Government and Agency Obligations † | | 23,997 | 0.1% |
| Total Temporary Cash Investments (Cost $4,471,511) | | 4,471,513 | 7.4%2 |
| Total Investments (Cost $54,869,104) | | 64,728,236 | 106.7% |
| Other Assets and Liabilities | | | | |
| Other Assets | | | 445,469 | 0.7% |
| Liabilities4 | | | (4,482,983) | (7.4%) |
| | | | (4,037,514) | (6.7%) |
| Net Assets | | | 60,690,722 | 100.0% |
13
Total International Stock Index Fund
| |
| At April 30, 2011, net assets consisted of: | |
| | Amount |
| | ($000) |
| Paid-in Capital | 52,328,243 |
| Undistributed Net Investment Income | 381,451 |
| Accumulated Net Realized Losses | (1,906,080) |
| Unrealized Appreciation (Depreciation) | |
| Investment Securities | 9,859,132 |
| Futures Contracts | 5,564 |
| Forward Currency Contracts | 13,825 |
| Foreign Currencies | 8,587 |
| Net Assets | 60,690,722 |
| |
| Investor Shares—Net Assets | |
| Applicable to 2,094,901,990 outstanding $.001 par value shares of | |
| beneficial interest (unlimited authorization) | 35,783,022 |
| Net Asset Value Per Share—Investor Shares | $17.08 |
| |
| Admiral Shares—Net Assets | |
| Applicable to 535,941,506 outstanding $.001 par value shares of | |
| beneficial interest (unlimited authorization) | 15,313,195 |
| Net Asset Value Per Share—Admiral Shares | $28.57 |
| |
| Signal Shares—Net Assets | |
| Applicable to 44,663,940 outstanding $.001 par value shares of | |
| beneficial interest (unlimited authorization) | 1,531,364 |
| Net Asset Value Per Share—Signal Shares | $34.29 |
| |
| Institutional Shares—Net Assets | |
| Applicable to 53,121,451 outstanding $.001 par value shares of | |
| beneficial interest (unlimited authorization) | 6,072,224 |
| Net Asset Value Per Share—Institutional Shares | $114.31 |
| |
| Institutional Plus Shares—Net Assets | |
| Applicable to 16,294,872 outstanding $.001 par value shares of | |
| beneficial interest (unlimited authorization) | 1,862,811 |
| Net Asset Value Per Share—Institutional Plus Shares | $114.32 |
14
Total International Stock Index Fund
| |
| At April 30, 2011, net assets consisted of: | |
| | Amount |
| | ($000) |
| ETF Shares—Net Assets | |
| Applicable to 2,408,115 outstanding $.001 par value shares of | |
| beneficial interest (unlimited authorization) | 128,106 |
| Net Asset Value Per Share—ETF Shares | $53.20 |
See Note A in Notes to Financial Statements.
* Non-income-producing security.
^ Part of security position is on loan to broker-dealers. The total value of securities on loan is $3,994,428,000.
† Represents the aggregate value, by category, of securities that are not among the 50 largest holdings and, in total for any issuer, represent 1% or less of net assets.
1 Certain of the fund’s securities are exempt from registration under Rule 144A of the Securities Act of 1933. Such securities may be sold in transactions exempt from registration, normally to qualified institutional buyers. At April 30, 2011, the aggregate value of these securities was $95,987,000, representing 0.2% of net assets.
2 The fund invests a portion of its cash reserves in equity markets through the use of index futures contracts. After giving effect to futures investments, the fund’s effective common stock and temporary cash investment positions represent 99.9% and 6.8%, respectively, of net assets.
3 Affiliated money market fund available only to Vanguard funds and certain trusts and accounts managed by Vanguard. Rate shown is the 7-day yield.
4 Includes $4,201,205,000 of collateral received for securities on loan.
5 Securities with a value of $23,997,000 have been segregated as initial margin for open futures contracts.
ADR—American Depositary Receipt.
See accompanying Notes, which are an integral part of the Financial Statements.
15
Total International Stock Index Fund
| |
| Statement of Operations | |
| |
| |
| | Six Months Ended |
| | April 30, 2011 |
| | ($000) |
| Investment Income | |
| Income | |
| Dividends1 | 686,990 |
| Interest2 | 324 |
| Security Lending | 9,486 |
| Total Income | 696,800 |
| Expenses | |
| The Vanguard Group—Note B | |
| Investment Advisory Services | 991 |
| Management and Administrative—Investor Shares | 36,836 |
| Management and Administrative—Admiral Shares | 4,927 |
| Management and Administrative—Signal Shares | 392 |
| Management and Administrative—Institutional Shares | 1,798 |
| Management and Administrative—Institutional Plus Shares | 367 |
| Management and Administrative—ETF Shares | 31 |
| Marketing and Distribution—Investor Shares | 4,938 |
| Marketing and Distribution—Admiral Shares | 120 |
| Marketing and Distribution—Signal Shares | 16 |
| Marketing and Distribution—Institutional Shares | 209 |
| Marketing and Distribution—Institutional Plus Shares | 31 |
| Marketing and Distribution—ETF Shares | 1 |
| Custodian Fees | 9,013 |
| Shareholders’ Reports—Investor Shares | 117 |
| Shareholders’ Reports—Admiral Shares | 22 |
| Shareholders’ Reports—Signal Shares | — |
| Shareholders’ Reports—Institutional Shares | — |
| Shareholders’ Reports—Institutional Plus Shares | — |
| Shareholders’ Reports—ETF Shares | — |
| Trustees’ Fees and Expenses | 28 |
| Total Expenses | 59,837 |
| Net Investment Income | 636,963 |
| Realized Net Gain (Loss) | |
| Investment Securities Sold | 120,163 |
| Futures Contracts | 12,918 |
| Foreign Currencies and Forward Currency Contracts | 5,099 |
| Realized Net Gain (Loss) | 138,180 |
| Change in Unrealized Appreciation (Depreciation) | |
| Investment Securities | 5,416,569 |
| Futures Contracts | 4,481 |
| Foreign Currencies and Forward Currency Contracts | 12,220 |
| Change in Unrealized Appreciation (Depreciation) | 5,433,270 |
| Net Increase (Decrease) in Net Assets Resulting from Operations | 6,208,413 |
1 Dividends are net of foreign withholding taxes of $59,913,000.
2 Interest income from an affiliated company of the fund was $324,000.
See accompanying Notes, which are an integral part of the Financial Statements.
16
Total International Stock Index Fund
| | |
| Statement of Changes in Net Assets | | |
| |
| | Six Months Ended | Year Ended |
| | April 30, | October 31, |
| | 2011 | 2010 |
| | ($000) | ($000) |
| Increase (Decrease) in Net Assets | | |
| Operations | | |
| Net Investment Income | 636,963 | 673,967 |
| Realized Net Gain (Loss) | 138,180 | 343,662 |
| Change in Unrealized Appreciation (Depreciation) | 5,433,270 | 2,337,712 |
| Net Increase (Decrease) in Net Assets Resulting from Operations | 6,208,413 | 3,355,341 |
| Distributions | | |
| Net Investment Income | | |
| Investor Shares | (692,934) | (608,038) |
| Admiral Shares | (30,368) | — |
| Signal Shares | (2,547) | — |
| Institutional Shares | (54,998) | — |
| Institutional Plus Shares | (3,919) | — |
| ETF Shares | — | — |
| Realized Capital Gain | | |
| Investor Shares | — | — |
| Admiral Shares | — | — |
| Signal Shares | — | — |
| Institutional Shares | — | — |
| Institutional Plus Shares | — | — |
| ETF Shares | — | — |
| Total Distributions | (784,766) | (608,038) |
| Capital Share Transactions | | |
| Investor Shares | (7,399,065) | 12,365,863 |
| Admiral Shares | 14,392,465 | — |
| Signal Shares | 1,446,340 | — |
| Institutional Shares | 5,530,936 | — |
| Institutional Plus Shares | 1,732,167 | — |
| ETF Shares | 121,587 | — |
| Net Increase (Decrease) from Capital Share Transactions | 15,824,430 | 12,365,863 |
| Total Increase (Decrease) | 21,248,077 | 15,113,166 |
| Net Assets | | |
| Beginning of Period | 39,442,645 | 24,329,479 |
| End of Period1 | 60,690,722 | 39,442,645 |
| 1 Net Assets—End of Period includes undistributed net investment income of $381,451,000 and $532,928,000. | |
See accompanying Notes, which are an integral part of the Financial Statements.
17
Total International Stock Index Fund
Financial Highlights
| | | | | | |
| Investor Shares | | | | | | |
| Six Months | | | | | |
| | Ended | | | | | |
| For a Share Outstanding | April 30, | | | Year Ended October 31, |
| Throughout Each Period | 2011 | 2010 | 2009 | 2008 | 2007 | 2006 |
| Net Asset Value, Beginning of Period | $15.48 | $13.99 | $10.97 | $21.89 | $16.90 | $13.49 |
| Investment Operations | | | | | | |
| Net Investment Income | .141 | .3561 | .5442 | .5401 | .412 | .294 |
| Net Realized and Unrealized Gain (Loss) | | | | | | |
| on Investments | 1.708 | 1.478 | 2.801 | (10.938) | 4.980 | 3.410 |
| Total from Investment Operations | 1.849 | 1.834 | 3.345 | (10.398) | 5.392 | 3.704 |
| Distributions | | | | | | |
| Dividends from Net Investment Income | (.249) | (.344) | (.325) | (.522) | (.402) | (.294) |
| Distributions from Realized Capital Gains | — | — | — | — | — | — |
| Total Distributions | (.249) | (.344) | (.325) | (.522) | (.402) | (.294) |
| Net Asset Value, End of Period | $17.08 | $15.48 | $13.99 | $10.97 | $21.89 | $16.90 |
| |
| Total Return3 | 12.10% | 13.28% | 31.41% | -48.57% | 32.47% | 27.84% |
| |
| Ratios/Supplemental Data | | | | | | |
| Net Assets, End of Period (Millions) | $35,783 | $39,443 | $24,329 | $17,152 | $29,725 | $18,200 |
| Ratio of Total Expenses to | | | | | | |
| Average Net Assets | 0.25% | 0.26% | 0.27% | 0.03% | — | — |
| Acquired Fund Fees and Expenses | — | — | 0.05% | 0.25% | 0.27% | 0.32% |
| Ratio of Net Investment Income to | | | | | | |
| Average Net Assets | 2.47% | 2.52% | 4.73%2 | 3.07% | 1.93% | 1.71% |
| Portfolio Turnover Rate | 3% | 6% | 12%4 | 15%4 | 2% | 2% |
The expense ratio, net income ratio, and turnover rate for the current period have been annualized.
1 Calculated based on average shares outstanding.
2 Net investment income per share and the ratio of net investment income to average net assets include $0.249 and 2.06%, respectively, of annual dividends received from Vanguard mutual funds in December 2008. From August 2008 through February 2009, the fund invested in a combination of Vanguard mutual funds and common stocks. Effective in March 2009, the fund’s equity investments are solely in common stocks.
3 Total returns do not include transaction or account service fees that may have applied in the periods shown. Fund prospectuses provide information about any applicable transaction and account service fees.
4 Excludes the value of securities received and mutual fund shares delivered in connection with a change in the fund’s investment policy to invest directly in individual stocks and reduce the fund’s investments in Vanguard mutual funds.
See accompanying Notes, which are an integral part of the Financial Statements.
18
Total International Stock Index Fund
Financial Highlights
| |
| Admiral Shares | |
| | November 29, 20101 to |
| For a Share Outstanding Throughout the Period | April 30, 2011 |
| Net Asset Value, Beginning of Period | $25.00 |
| Investment Operations | |
| Net Investment Income | .236 |
| Net Realized and Unrealized Gain (Loss) on Investments | 3.751 |
| Total from Investment Operations | 3.987 |
| Distributions | |
| Dividends from Net Investment Income | (.417) |
| Distributions from Realized Capital Gains | — |
| Total Distributions | (.417) |
| Net Asset Value, End of Period | $28.57 |
| |
| Total Return | 16.11% |
| |
| Ratios/Supplemental Data | |
| Net Assets, End of Period (Millions) | $15,313 |
| Ratio of Total Expenses to Average Net Assets | 0.19% |
| Ratio of Net Investment Income to Average Net Assets | 2.53% |
| Portfolio Turnover Rate | 3% |
| The expense ratio, net income ratio, and turnover rate for the current period have been annualized. | |
| 1 Inception. | |
See accompanying Notes, which are an integral part of the Financial Statements.
19
Total International Stock Index Fund
Financial Highlights
| |
| Signal Shares | |
| | November 30, 20101 to |
| For a Share Outstanding Throughout the Period | April 30, 2011 |
| Net Asset Value, Beginning of Period | $29.66 |
| Investment Operations | |
| Net Investment Income | .290 |
| Net Realized and Unrealized Gain (Loss) on Investments | 4.841 |
| Total from Investment Operations | 5.131 |
| Distributions | |
| Dividends from Net Investment Income | (.501) |
| Distributions from Realized Capital Gains | — |
| Total Distributions | (.501) |
| Net Asset Value, End of Period | $34.29 |
| |
| Total Return | 17.43% |
| |
| Ratios/Supplemental Data | |
| Net Assets, End of Period (Millions) | $1,531 |
| Ratio of Total Expenses to Average Net Assets | 0.19% |
| Ratio of Net Investment Income to Average Net Assets | 2.53% |
| Portfolio Turnover Rate | 3% |
| The expense ratio, net income ratio, and turnover rate for the current period have been annualized. | |
| 1 Inception. | |
See accompanying Notes, which are an integral part of the Financial Statements.
20
Total International Stock Index Fund
Financial Highlights
| |
| Institutional Shares | |
| | November 29, 20101 to |
| For a Share Outstanding Throughout the Period | April 30, 2011 |
| Net Asset Value, Beginning of Period | $100.00 |
| Investment Operations | |
| Net Investment Income | .952 |
| Net Realized and Unrealized Gain (Loss) on Investments | 15.031 |
| Total from Investment Operations | 15.983 |
| Distributions | |
| Dividends from Net Investment Income | (1.673) |
| Distributions from Realized Capital Gains | — |
| Total Distributions | (1.673) |
| Net Asset Value, End of Period | $114.31 |
| |
| Total Return | 16.15% |
| |
| Ratios/Supplemental Data | |
| Net Assets, End of Period (Millions) | $6,072 |
| Ratio of Total Expenses to Average Net Assets | 0.14% |
| Ratio of Net Investment Income to Average Net Assets | 2.58% |
| Portfolio Turnover Rate | 3% |
| The expense ratio, net income ratio, and turnover rate for the current period have been annualized. | |
| 1 Inception. | |
See accompanying Notes, which are an integral part of the Financial Statements.
21
Total International Stock Index Fund
Financial Highlights
| |
| Institutional Plus Shares | |
| | November 30, 20101 to |
| For a Share Outstanding Throughout the Period | April 30, 2011 |
| Net Asset Value, Beginning of Period | $98.88 |
| Investment Operations | |
| Net Investment Income | .980 |
| Net Realized and Unrealized Gain (Loss) on Investments | 16.134 |
| Total from Investment Operations | 17.114 |
| Distributions | |
| Dividends from Net Investment Income | (1.674) |
| Distributions from Realized Capital Gains | — |
| Total Distributions | (1.674) |
| Net Asset Value, End of Period | $114.32 |
| |
| Total Return | 17.45% |
| |
| Ratios/Supplemental Data | |
| Net Assets, End of Period (Millions) | $1,863 |
| Ratio of Total Expenses to Average Net Assets | 0.11% |
| Ratio of Net Investment Income to Average Net Assets | 2.61% |
| Portfolio Turnover Rate | 3% |
| The expense ratio, net income ratio, and turnover rate for the current period have been annualized. | |
| 1 Inception. | |
See accompanying Notes, which are an integral part of the Financial Statements.
22
Total International Stock Index Fund
Financial Highlights
| |
| ETF Shares | |
| | January 26, 20111 to |
| For a Share Outstanding Throughout the Period | April 30, 2011 |
| Net Asset Value, Beginning of Period | $50.00 |
| Investment Operations | |
| Net Investment Income | .443 |
| Net Realized and Unrealized Gain (Loss) on Investments | 2.757 |
| Total from Investment Operations | 3.200 |
| Distributions | |
| Dividends from Net Investment Income | — |
| Distributions from Realized Capital Gains | — |
| Total Distributions | — |
| Net Asset Value, End of Period | $53.20 |
| |
| Total Return | 6.40% |
| |
| Ratios/Supplemental Data | |
| Net Assets, End of Period (Millions) | $128 |
| Ratio of Total Expenses to Average Net Assets | 0.18% |
| Ratio of Net Investment Income to Average Net Assets | 2.54% |
| Portfolio Turnover Rate | 3% |
| The expense ratio, net income ratio, and turnover rate for the current period have been annualized. | |
| 1 Inception. | |
See accompanying Notes, which are an integral part of the Financial Statements.
23
Total International Stock Index Fund
Notes to Financial Statements
Vanguard Total International Stock Index Fund is registered under the Investment Company Act of 1940 as an open-end investment company, or mutual fund. The fund invests in securities of foreign issuers, which may subject it to investment risks not normally associated with investing in securities of U.S. corporations. The fund offers six classes of shares: Investor Shares, Admiral Shares, Signal Shares, Institutional Shares, Institutional Plus Shares, and ETF Shares. Investor Shares are available to any investor who meets the fund’s minimum purchase requirements. Admiral Shares, Signal Shares, Institutional Shares, and Institutional Plus Shares are designed for investors who meet certain administrative, service, and account-size criteria. Admiral Shares and Institutional Shares were first issued on November 29, 2010. Signal Shares and Institutional Plus Shares were first issued on November 30, 2010. ETF Shares were first issued on January 26, 2011, and first offered to the public on January 28, 2011. ETF Shares are listed for trading on the NYSE Arca, Inc.; they can be purchased and sold through a broker.
A. The following significant accounting policies conform to generally accepted accounting principles for U.S. mutual funds. The fund consistently follows such policies in preparing its financial statements.
1. Security Valuation: Securities are valued as of the close of trading on the New York Stock Exchange (generally 4 p.m., Eastern time) on the valuation date. Equity securities are valued at the latest quoted sales prices or official closing prices taken from the primary market in which each security trades; such securities not traded on the valuation date are valued at the mean of the latest quoted bid and asked prices. Securities for which market quotations are not readily available, or whose values have been affected by events occurring before the fund’s pricing time but after the close of the securities’ primary markets, are valued at their fair values calculated according to procedures adopted by the board of trustees. These procedures include obtaining quotations from an independent pricing service, monitoring news to identify significant market- or security-specific events, and evaluating changes in the values of foreign market proxies (for example, ADRs, futures contracts, or exchange-traded funds), between the time the foreign markets close and the fund’s pricing time. When fair-value pricing is employed, the prices of securities used by a fund to calculate its net asset value may differ from quoted or published prices for the same securities. Investments in Vanguard Market Liquidity Fund are valued at that fund’s net asset value. Temporary cash investments acquired over 60 days to maturity are valued using the latest bid prices or using valuations based on a matrix system (which considers such factors as security prices, yields, maturities, and ratings), both as furnished by independent pricing services. Other temporary cash investments are valued at amortized cost, which approximates market value.
2. Foreign Currency: Securities and other assets and liabilities denominated in foreign currencies are translated into U.S. dollars using exchange rates obtained from an independent third party as of the fund’s pricing time on the valuation date. Realized gains (losses) and unrealized appreciation (depreciation) on investment securities include the effects of changes in exchange rates since the securities were purchased, combined with the effects of changes in security prices. Fluctuations in the value of other assets and liabilities resulting from changes in exchange rates are recorded as unrealized foreign currency gains (losses) until the assets or liabilities are settled in cash, at which time they are recorded as realized foreign currency gains (losses).
3. Futures and Forward Currency Contracts: The fund uses index futures contracts to a limited extent, with the objectives of maintaining full exposure to the stock market, enhancing returns, maintaining liquidity, and minimizing transaction costs. The fund may purchase futures contracts to immediately
24
Total International Stock Index Fund
invest incoming cash in the market, or sell futures in response to cash outflows, thereby simulating a fully invested position in the underlying index while maintaining a cash balance for liquidity. The fund may seek to enhance returns by using futures contracts instead of the underlying securities when futures are believed to be priced more attractively than the underlying securities. The primary risks associated with the use of futures contracts are imperfect correlation between changes in market values of stocks held by the fund and the prices of futures contracts, and the possibility of an illiquid market.
The fund also enters into forward currency contracts to provide the appropriate currency exposure related to any open futures contracts. The fund’s risks in using these contracts include movement in the values of the foreign currencies relative to the U.S. dollar and the ability of the counterparties to fulfill their obligations under the contracts. Counterparty risk is mitigated by entering into forward currency contracts only with highly rated counterparties, by a master netting arrangement between the fund and the counterparty, and by the posting of collateral by the counterparty. The forward currency contracts contain provisions whereby a counterparty may terminate open contracts if the fund’s net assets decline below a certain level, triggering a payment by the fund if the fund is in a net liability position at the time of the termination. The payment amount would be reduced by any collateral the fund has posted. Any securities posted as collateral for open contracts are noted in the Statement of Net Assets.
Futures contracts are valued at their quoted daily settlement prices. Forward currency contracts are valued at their quoted daily prices obtained from an independent third party, adjusted for currency risk based on the expiration date of each contract. The aggregate principal amounts of the contracts are not recorded in the Statement of Net Assets. Fluctuations in the value of the contracts are recorded in the Statement of Net Assets as an asset (liability) and in the Statement of Operations as unrealized appreciation (depreciation) until the contracts are closed, when they are recorded as realized gains (losses) on futures or forward currency contracts.
4. Federal Income Taxes: The fund intends to continue to qualify as a regulated investment company and distribute all of its taxable income. Management has analyzed the fund’s tax positions taken for all open federal income tax years (October 31, 2007–2010), and for the period ended April 30, 2011, and has concluded that no provision for federal income tax is required in the fund’s financial statements.
5. Distributions: Distributions to shareholders are recorded on the ex-dividend date.
6. Security Lending: The fund may lend its securities to qualified institutional borrowers to earn additional income. Security loans are required to be secured at all times by collateral at least equal to the market value of securities loaned. The fund invests cash collateral received in Vanguard Market Liquidity Fund, and records a liability for the return of the collateral, during the period the securities are on loan. Security lending income represents fees charged to borrowers plus income earned on investing cash collateral, less expenses associated with the loan.
7. Other: Dividend income is recorded on the ex-dividend date. Interest income includes income distributions received from Vanguard Market Liquidity Fund and is accrued daily. Security transactions are accounted for on the date securities are bought or sold. Costs used to determine realized gains (losses) on the sale of investment securities are those of the specific securities sold. Fees assessed on redemptions of capital shares are credited to paid-in capital.
25
Total International Stock Index Fund
Each class of shares has equal rights as to assets and earnings, except that each class separately bears certain class-specific expenses related to maintenance of shareholder accounts (included in Management and Administrative expenses) and shareholder reporting. Marketing and distribution expenses are allocated to each class of shares based on a method approved by the board of trustees. Income, other non-class-specific expenses, and gains and losses on investments are allocated to each class of shares based on its relative net assets.
B. The Vanguard Group furnishes at cost investment advisory, corporate management, administrative, marketing, and distribution services. The costs of such services are allocated to the fund under methods approved by the board of trustees. The fund has committed to provide up to 0.40% of its net assets in capital contributions to Vanguard. At April 30, 2011, the fund had contributed capital of $9,230,000 to Vanguard (included in Other Assets), representing 0.02% of the fund’s net assets and 3.69% of Vanguard’s capitalization. The fund’s trustees and officers are also directors and officers of Vanguard.
C. Various inputs may be used to determine the value of the fund’s investments. These inputs are summarized in three broad levels for financial statement purposes. The inputs or methodologies used to value securities are not necessarily an indication of the risk associated with investing in those securities.
Level 1—Quoted prices in active markets for identical securities.
Level 2—Other significant observable inputs (including quoted prices for similar securities, interest rates, prepayment speeds, credit risk, etc.).
Level 3—Significant unobservable inputs (including the fund’s own assumptions used to determine the fair value of investments).
The following table summarizes the fund’s investments as of April 30, 2011, based on the inputs used to value them:
| | | |
| | Level 1 | Level 2 | Level 3 |
| Investments | ($000) | ($000) | ($000) |
| Common Stocks—North America and South America | 8,033,288 | 2,964 | — |
| Common Stocks—Other | 285,986 | 51,934,485 | — |
| Temporary Cash Investments | 4,447,516 | 23,997 | — |
| Futures Contracts—Assets1 | 104 | — | — |
| Forward Currency Contracts—Assets | — | 13,825 | — |
| Total | 12,766,894 | 51,975,271 | — |
| 1 Represents variation margin on the last day of the reporting period. | | | |
The following table summarizes changes in investments valued based on Level 3 inputs during the six months ended April 30, 2011:
| |
| | Investments in |
| | Common Stocks |
| Amount Valued Based on Level 3 Inputs | ($000) |
| Balance as of October 31, 2010 | 211 |
| Change in Unrealized Appreciation (Depreciation) | (211) |
| Balance as of April 30, 2011 | — |
26
Total International Stock Index Fund
D. At April 30, 2011, the fair values of derivatives were reflected in the Statement of Net Assets as follows:
| | | |
| | | Foreign | |
| | Equity | Exchange | |
| | Contracts1 | Contracts | Total |
| Statement of Net Assets Caption | ($000) | ($000) | ($000) |
| Other Assets | 104 | 13,825 | 13,929 |
| Liabilities | — | — | — |
| 1 Represents variation margin on the last day of the reporting period. | | | |
Realized net gain (loss) and the change in unrealized appreciation (depreciation) on derivatives for the six months ended April 30, 2011, were:
| | | |
| | | Foreign | |
| | Equity | Exchange | |
| | Contracts | Contracts | Total |
| Realized Net Gain (Loss) on Derivatives | ($000) | ($000) | ($000) |
| Futures Contracts | 12,918 | — | 12,918 |
| Forward Currency Contracts | — | 8,773 | 8,773 |
| Realized Net Gain (Loss) on Derivatives | 12,918 | 8,773 | 21,691 |
| |
| Change in Unrealized Appreciation (Depreciation) on Derivatives | | | |
| Futures Contracts | 4,481 | — | 4,481 |
| Forward Currency Contracts | — | 7,008 | 7,008 |
| Change in Unrealized Appreciation (Depreciation) on Derivatives | 4,481 | 7,008 | 11,489 |
At April 30, 2011, the aggregate settlement value of open futures contracts and the related unrealized appreciation (depreciation) were:
| | | | |
| | | | | ($000) |
| | | | Aggregate | |
| | | Number of | Settlement | Unrealized |
| | | Long (Short) | Value | Appreciation |
| Futures Contracts | Expiration | Contracts | Long (Short) | (Depreciation) |
| Dow Jones EURO STOXX 50 Index | June 2011 | 3,333 | 145,724 | 6,503 |
| FTSE 100 Index | June 2011 | 1,123 | 113,005 | 4,156 |
| Topix Index | June 2011 | 784 | 82,468 | (5,179) |
| S&P ASX 200 Index | June 2011 | 105 | 13,812 | 84 |
Unrealized appreciation (depreciation) on open FTSE 100 Index futures contracts is required to be treated as realized gain (loss) for tax purposes.
27
Total International Stock Index Fund
At April 30, 2011, the fund had open forward currency contracts to receive and deliver currencies as follows. Unrealized appreciation (depreciation) on open forward currency contracts is treated as realized gain (loss) for tax purposes.
| | | | | | |
| | | | | | | Unrealized |
| | Contract | | | | | Appreciation |
| | Settlement | | | Contract Amount (000) | (Depreciation) |
| Counterparty | Date | | Receive | | Deliver | ($000) |
| Brown Brothers Harriman & Co. | 6/22/11 | EUR | 93,840 | USD | 139,014 | 7,780 |
| Brown Brothers Harriman & Co. | 6/22/11 | GBP | 65,259 | USD | 108,771 | 3,626 |
| Brown Brothers Harriman & Co. | 6/15/11 | JPY | 7,111,668 | USD | 87,666 | 1,507 |
| Brown Brothers Harriman & Co. | 6/22/11 | AUD | 12,545 | USD | 13,632 | 912 |
| AUD—Australian dollar. | | | | | | |
| EUR—Euro. | | | | | | |
| GBP—British pound. | | | | | | |
| JPY—Japanese yen. | | | | | | |
| USD—U.S. dollar. | | | | | | |
At April 30, 2011, the counterparty had deposited in a segregated account cash with a value sufficient to cover substantially all amounts due to the fund in connection with open forward currency contracts.
E. Distributions are determined on a tax basis and may differ from net investment income and realized capital gains for financial reporting purposes. Differences may be permanent or temporary. Permanent differences are reclassified among capital accounts in the financial statements to reflect their tax character. Temporary differences arise when certain items of income, expense, gain, or loss are recognized in different periods for financial statement and tax purposes; these differences will reverse at some time in the future. Differences in classification may also result from the treatment of short-term gains as ordinary income for tax purposes.
During the six months ended April 30, 2011, the fund realized net foreign currency losses of $3,674,000, which decreased distributable net income for tax purposes; accordingly, such losses have been reclassified from accumulated net realized losses to undistributed net investment income. Certain of the fund’s investments are in securities considered to be “passive foreign investment companies,” for which any unrealized appreciation and/or realized gains are required to be included in distributable net income for tax purposes. Unrealized appreciation through the most recent mark-to-market date for tax purposes on passive foreign investment company holdings at April 30, 2011, was $83,030,000, all of which has been distributed and is reflected in the balance of undistributed net investment income.
The fund’s tax-basis capital gains and losses are determined only at the end of each fiscal year. For tax purposes, at October 31, 2010, the fund had available capital loss carryforwards totaling $2,039,911,000 to offset future net capital gains of $324,558,000 through October 31, 2016, and $1,715,353,000 through October 31, 2017. The fund will use these capital losses to offset net taxable capital gains, if any, realized during the year ending October 31, 2011; should the fund realize net capital losses for the year, the losses will be added to the loss carryforward balance above.
28
Total International Stock Index Fund
At April 30, 2011, the cost of investment securities for tax purposes was $54,952,134,000. Net unrealized appreciation of investment securities for tax purposes was $9,776,102,000, consisting of unrealized gains of $11,382,425,000 on securities that had risen in value since their purchase and $1,606,323,000 in unrealized losses on securities that had fallen in value since their purchase.
F. During the six months ended April 30, 2011, the fund purchased $16,126,307,000 of investment securities and sold $635,879,000 of investment securities, other than temporary cash investments.
G. Capital share transactions for each class of shares were:
| | | | |
| | Six Months Ended | | Year Ended |
| | | April 30, 2011 | October 31, 2010 |
| | Amount | Shares | Amount | Shares |
| | ($000) | (000) | ($000) | (000) |
| Investor Shares | | | | |
| Issued | 14,147,343 | 897,390 | 15,952,930 | 1,065,936 |
| Issued in Lieu of Cash Distributions | 662,039 | 42,602 | 557,477 | 38,553 |
| Redeemed1 | (22,208,447) | (1,393,376) | (4,144,544) | (294,682) |
| Net Increase (Decrease)—Investor Shares | (7,399,065) | (453,384) | 12,365,863 | 809,807 |
| Admiral Shares2 | | | | |
| Issued | 14,748,397 | 549,057 | — | — |
| Issued in Lieu of Cash Distributions | 26,728 | 1,028 | — | — |
| Redeemed1 | (382,660) | (14,143) | — | — |
| Net Increase (Decrease)—Admiral Shares | 14,392,465 | 535,942 | — | — |
| Signal Shares2 | | | | |
| Issued | 1,528,298 | 47,212 | — | — |
| Issued in Lieu of Cash Distributions | 1,855 | 59 | — | — |
| Redeemed1 | (83,813) | (2,607) | — | — |
| Net Increase (Decrease)—Signal Shares | 1,446,340 | 44,664 | — | — |
| Institutional Shares2 | | | | |
| Issued | 5,581,794 | 53,551 | — | — |
| Issued in Lieu of Cash Distributions | 54,225 | 521 | — | — |
| Redeemed1 | (105,083) | (951) | — | — |
| Net Increase (Decrease)—Institutional Shares | 5,530,936 | 53,121 | — | — |
| Institutional Plus Shares2 | | | | |
| Issued | 1,776,646 | 16,700 | — | — |
| Issued in Lieu of Cash Distributions | — | — | — | — |
| Redeemed1 | (44,479) | (405) | — | — |
| Net Increase (Decrease)—Institutional Plus Shares | 1,732,167 | 16,295 | — | — |
29
Total International Stock Index Fund
| | | | |
| | Six Months Ended | | Year Ended |
| | | April 30, 2011 | October 31, 2010 |
| | Amount | Shares | Amount | Shares |
| | ($000) | (000) | ($000) | (000) |
| ETF Shares2 | | | | |
| Issued | 121,587 | 2,408 | — | — |
| Issued in Lieu of Cash Distributions | — | — | — | — |
| Redeemed1 | — | — | — | — |
| Net Increase (Decrease)—ETF Shares | 121,587 | 2,408 | — | — |
1 Net of redemption fees for fiscal 2011 and 2010 of $245,000 and $745,000, respectively (fund totals).
2 Inception was November 29, 2010, for Admiral Shares, November 30, 2010, for Signal Shares, November 29, 2010, for Institutional Shares,
November 30, 2010, for Institutional Plus Shares, and January 26, 2011, for ETF Shares.
H. In preparing the financial statements as of April 30, 2011, management considered the impact of subsequent events for potential recognition or disclosure in these financial statements.
30
About Your Fund’s Expenses
As a shareholder of the fund, you incur ongoing costs, which include costs for portfolio management, administrative services, and shareholder reports (like this one), among others. Operating expenses, which are deducted from a fund’s gross income, directly reduce the investment return of the fund.
A fund’s expenses are expressed as a percentage of its average net assets. This figure is known as the expense ratio. The following examples are intended to help you understand the ongoing costs (in dollars) of investing in your fund and to compare these costs with those of other mutual funds. The examples are based on an investment of $1,000 made at the beginning of the period shown and held for the entire period.
The accompanying table illustrates your fund’s costs in two ways:
• Based on actual fund return. This section helps you to estimate the actual expenses that you paid over the period. The ”Ending Account Value“ shown is derived from the fund‘s actual return, and the third column shows the dollar amount that would have been paid by an investor who started with $1,000 in the fund. You may use the information here, together with the amount you invested, to estimate the expenses that you paid over the period.
To do so, simply divide your account value by $1,000 (for example, an $8,600 account value divided by $1,000 = 8.6), then multiply the result by the number given for your fund under the heading ”Expenses Paid During Period.“
• Based on hypothetical 5% yearly return. This section is intended to help you compare your fund‘s costs with those of other mutual funds. It assumes that the fund had a yearly return of 5% before expenses, but that the expense ratio is unchanged. In this case—because the return used is not the fund’s actual return—the results do not apply to your investment. The example is useful in making comparisons because the Securities and Exchange Commission requires all mutual funds to calculate expenses based on a 5% return. You can assess your fund’s costs by comparing this hypothetical example with the hypothetical examples that appear in shareholder reports of other funds.
Note that the expenses shown in the table are meant to highlight and help you compare ongoing costs only and do not reflect transaction costs incurred by the fund for buying and selling securities. Further, the expenses do not include any purchase, redemption, or account service fees described in the fund prospectus. If such fees were applied to your account, your costs would be higher. Your fund does not carry a “sales load.”
The calculations assume no shares were bought or sold during the period. Your actual costs may have been higher or lower, depending on the amount of your investment and the timing of any purchases or redemptions.
You can find more information about the fund’s expenses, including annual expense ratios, in the Financial Statements section of this report. For additional information on operating expenses and other shareholder costs, please refer to your fund’s current prospectus.
31
| | | |
| Six Months Ended April 30, 2011 | | | |
| | Beginning | Ending | Expenses |
| | Account Value | Account Value | Paid During |
| Total International Stock Index Fund | 10/31/2010 | 4/30/2011 | Period |
| Based on Actual Fund Return | | | |
| Investor Shares | $1,000.00 | $1,121.04 | $1.31 |
| Based on Hypothetical 5% Yearly Return | | | |
| Investor Shares | $1,000.00 | $1,023.55 | $1.25 |
The calculations are based on expenses incurred in the most recent six-month period. The fund’s annualized six-month expense ratio for that period is 0.25% for Investor Shares. Share classes with less than six months history are not included. The dollar amounts shown as “Expenses Paid” are equal to the annualized expense ratio multiplied by the average account value over the period, multiplied by the number of days in the most recent six-month period, then divided by the number of days in the most recent 12-month period.
32
Trustees Approve Advisory Arrangement
The board of trustees of Vanguard Total International Stock Index Fund has renewed the fund’s investment advisory arrangement with The Vanguard Group, Inc. Vanguard—through its Quantitative Equity Group—serves as the investment advisor for the fund. The board determined that continuing the fund’s internalized management structure was in the best interests of the fund and its shareholders.
The board based its decision upon an evaluation of the advisor’s investment staff, portfolio management process, and performance. The trustees considered the factors discussed below, among others. However, no single factor determined whether the board approved the arrangement. Rather, it was the totality of the circumstances that drove the board’s decision.
Nature, extent, and quality of services
The board considered the quality of the fund’s investment management since the fund began investing directly in stocks in 2008, and took into account the organizational depth and stability of the advisor. Vanguard has been managing investments for more than three decades. The Quantitative Equity Group adheres to a sound, disciplined investment management process; the team has considerable experience, stability, and depth.
The board concluded that Vanguard’s experience, stability, depth, and performance, among other factors, warranted continuation of the advisory arrangement.
Investment performance
The board considered the fund’s performance since 2008, including any periods of outperformance or underperformance of its target index and peer group. The board concluded that the fund has performed in line with expectations, and that the results have been consistent with the fund’s investment strategy. Information about the fund’s most recent performance can be found in the Performance Summary section of this report.
Cost
The board concluded that the fund’s expense ratio was well below the average expense ratio charged by funds in its peer group and that the fund’s advisory expense fee rate was also well below its peer-group average. Information about the fund’s expenses appears in the About Your Fund’s Expenses section of this report as well as in the Financial Statements section.
The board does not conduct a profitability analysis of Vanguard because of Vanguard’s unique “at-cost” structure. Unlike most other mutual fund management companies, Vanguard is owned by the funds it oversees, and produces “profits” only in the form of reduced expenses for fund shareholders.
The benefit of economies of scale
The board concluded that the fund’s low-cost arrangement with Vanguard ensures that the fund will realize economies of scale as it grows, with the cost to shareholders declining as the fund’s assets increase.
The board will consider whether to renew the advisory arrangement again after a one-year period.
33
Glossary
Beta. A measure of the magnitude of a fund’s past share-price fluctuations in relation to the ups and downs of a given market index. The index is assigned a beta of 1.00. Compared with a given index, a fund with a beta of 1.20 typically would have seen its share price rise or fall by 12% when the index rose or fell by 10%. For this report, beta is based on returns over the past 36 months for both the fund and the index. Note that a fund’s beta should be reviewed in conjunction with its R-squared (see definition). The lower the R-squared, the less correlation there is between the fund and the index, and the less reliable beta is as an indicator of volatility.
Dividend Yield. Dividend income earned by stocks, expressed as a percentage of the aggregate market value (or of net asset value, for a fund). The yield is determined by dividing the amount of the annual dividends by the aggregate value (or net asset value) at the end of the period. For a fund, the dividend yield is based solely on stock holdings and does not include any income produced by other investments.
Earnings Growth Rate. The average annual rate of growth in earnings over the past five years for the stocks now in a fund.
Equity Exposure. A measure that reflects a fund’s investments in stocks and stock futures. Any holdings in short-term reserves are excluded.
Expense Ratio. The percentage of a fund’s average net assets used to pay its annual administrative and advisory expenses. These expenses directly reduce returns to investors.
Inception Date. The date on which the assets of a fund (or one of its share classes) are first invested in accordance with the fund’s investment objective. For funds with a subscription period, the inception date is the day after that period ends. Investment performance is measured from the inception date.
Median Market Cap. An indicator of the size of companies in which a fund invests; the midpoint of market capitalization (market price x shares outstanding) of a fund’s stocks, weighted by the proportion of the fund’s assets invested in each stock. Stocks representing half of the fund’s assets have market capitalizations above the median, and the rest are below it.
Price/Book Ratio. The share price of a stock divided by its net worth, or book value, per share. For a fund, the weighted average price/book ratio of the stocks it holds.
Price/Earnings Ratio. The ratio of a stock’s current price to its per-share earnings over the past year. For a fund, the weighted average P/E of the stocks it holds. P/E is an indicator of market expectations about corporate prospects; the higher the P/E, the greater the expectations for a company’s future growth.
R-Squared. A measure of how much of a fund’s past returns can be explained by the returns from the market in general, as measured by a given index. If a fund’s total returns were precisely synchronized with an index’s returns, its R-squared would be 1.00. If the fund’s returns bore no relationship to the index’s returns, its R-squared would be 0. For this report, R-squared is based on returns over the past 36 months for both the fund and the index.
Return on Equity. The annual average rate of return generated by a company during the past five years for each dollar of shareholder’s equity (net income divided by shareholder’s equity). For a fund, the weighted average return on equity for the companies whose stocks it holds.
34
Short-Term Reserves. The percentage of a fund invested in highly liquid, short-term securities that can be readily converted to cash.
Turnover Rate. An indication of the fund’s trading activity. Funds with high turnover rates incur higher transaction costs and may be more likely to distribute capital gains (which may be taxable to investors). The turnover rate excludes in-kind transactions, which have minimal impact on costs.
35
The People Who Govern Your Fund
The trustees of your mutual fund are there to see that the fund is operated and managed in your best interests since, as a shareholder, you are a part owner of the fund. Your fund’s trustees also serve on the board of directors of The Vanguard Group, Inc., which is owned by the Vanguard funds and provides services to them on an at-cost basis.
A majority of Vanguard’s board members are independent, meaning that they have no affiliation with Vanguard or the funds they oversee, apart from the sizable personal investments they have made as private individuals. The independent board members have distinguished backgrounds in business, academia, and public service. Each of the trustees and executive officers oversees 179 Vanguard funds.
The following table provides information for each trustee and executive officer of the fund. More information about the trustees is in the Statement of Additional Information, which can be obtained, without charge, by contacting Vanguard at 800-662-7447, or online at vanguard.com.
| |
| Interested Trustee1 | and President (2006–2008) of Rohm and Haas Co. |
| | (chemicals); Director of Tyco International, Ltd. |
| F. William McNabb III | (diversified manufacturing and services) and Hewlett- |
| Born 1957. Trustee Since July 2009. Chairman of the | Packard Co. (electronic computer manufacturing); |
| Board. Principal Occupation(s) During the Past Five | Senior Advisor at New Mountain Capital; Trustee |
| Years: Chairman of the Board of The Vanguard Group, | of The Conference Board; Member of the Board of |
| Inc., and of each of the investment companies served | Managers of Delphi Automotive LLP (automotive |
| by The Vanguard Group, since January 2010; Director | components). |
| of The Vanguard Group since 2008; Chief Executive | |
| Officer and President of The Vanguard Group and of | Amy Gutmann |
| each of the investment companies served by The | Born 1949. Trustee Since June 2006. Principal |
| Vanguard Group since 2008; Director of Vanguard | Occupation(s) During the Past Five Years: President |
| Marketing Corporation; Managing Director of The | of the University of Pennsylvania; Christopher H. |
| Vanguard Group (1995–2008). | Browne Distinguished Professor of Political Science |
| | in the School of Arts and Sciences with secondary |
| | appointments at the Annenberg School for Commu- |
| Independent Trustees | nication and the Graduate School of Education |
| | of the University of Pennsylvania; Director of |
| Emerson U. Fullwood | Carnegie Corporation of New York, Schuylkill River |
| Born 1948. Trustee Since January 2008. Principal | Development Corporation, and Greater Philadelphia |
| Occupation(s) During the Past Five Years: Executive | Chamber of Commerce; Trustee of the National |
| Chief Staff and Marketing Officer for North America | Constitution Center; Chair of the Presidential |
| and Corporate Vice President (retired 2008) of Xerox | Commission for the Study of Bioethical Issues. |
| Corporation (document management products and | |
| services); Executive in Residence and 2010 | JoAnn Heffernan Heisen |
| Distinguished Minett Professor at the Rochester | Born 1950. Trustee Since July 1998. Principal |
| Institute of Technology; Director of SPX Corporation | Occupation(s) During the Past Five Years: Corporate |
| (multi-industry manufacturing), the United Way of | Vice President and Chief Global Diversity Officer |
| Rochester, Amerigroup Corporation (managed health | (retired 2008) and Member of the Executive |
| care), the University of Rochester Medical Center, | Committee (1997–2008) of Johnson & Johnson |
| Monroe Community College Foundation, and North | (pharmaceuticals/consumer products); Director of |
| Carolina A&T University. | Skytop Lodge Corporation (hotels), the University |
| | Medical Center at Princeton, the Robert Wood |
| Rajiv L. Gupta | Johnson Foundation, and the Center for Work Life |
| Born 1945. Trustee Since December 2001. 2 | Policy; Member of the Advisory Board of the |
| Principal Occupation(s) During the Past Five Years: | Maxwell School of Citizenship and Public Affairs |
| Chairman and Chief Executive Officer (retired 2009) | at Syracuse University. |
| | |
| F. Joseph Loughrey | Thomas J. Higgins | |
| Born 1949. Trustee Since October 2009. Principal | Born 1957. Chief Financial Officer Since September |
| Occupation(s) During the Past Five Years: President | 2008. Principal Occupation(s) During the Past Five |
| and Chief Operating Officer (retired 2009) and Vice | Years: Principal of The Vanguard Group, Inc.; Chief |
| Chairman of the Board (2008–2009) of Cummins Inc. | Financial Officer of each of the investment companies |
| (industrial machinery); Director of SKF AB (industrial | served by The Vanguard Group since 2008; Treasurer |
| machinery), Hillenbrand, Inc. (specialized consumer | of each of the investment companies served by The |
| services), the Lumina Foundation for Education, and | Vanguard Group (1998–2008). |
| Oxfam America; Chairman of the Advisory Council | | |
| for the College of Arts and Letters and Member | Kathryn J. Hyatt | |
| of the Advisory Board to the Kellogg Institute for | Born 1955. Treasurer Since November 2008. Principal |
| International Studies at the University of Notre Dame. | Occupation(s) During the Past Five Years: Principal |
| | of The Vanguard Group, Inc.; Treasurer of each of |
| André F. Perold | the investment companies served by The Vanguard |
| Born 1952. Trustee Since December 2004. Principal | Group since 2008; Assistant Treasurer of each of the |
| Occupation(s) During the Past Five Years: George | investment companies served by The Vanguard Group |
| Gund Professor of Finance and Banking at the Harvard | (1988–2008). | |
| Business School; Chair of the Investment Committee | | |
| of HighVista Strategies LLC (private investment firm). | Heidi Stam | |
| | Born 1956. Secretary Since July 2005. Principal |
| Alfred M. Rankin, Jr. | Occupation(s) During the Past Five Years: Managing |
| Born 1941. Trustee Since January 1993. Principal | Director of The Vanguard Group, Inc., since 2006; |
| Occupation(s) During the Past Five Years: Chairman, | General Counsel of The Vanguard Group since 2005; |
| President, and Chief Executive Officer of NACCO | Secretary of The Vanguard Group and of each of the |
| Industries, Inc. (forklift trucks/housewares/lignite); | investment companies served by The Vanguard Group |
| Director of Goodrich Corporation (industrial products/ | since 2005; Director and Senior Vice President of |
| aircraft systems and services) and the National | Vanguard Marketing Corporation since 2005; |
| Association of Manufacturers; Chairman of the | Principal of The Vanguard Group (1997–2006). |
| Federal Reserve Bank of Cleveland; Vice Chairman | | |
| of University Hospitals of Cleveland; President of | | |
| the Board of The Cleveland Museum of Art. | Vanguard Senior Management Team |
| |
| Peter F. Volanakis | R. Gregory Barton | Michael S. Miller |
| Born 1955. Trustee Since July 2009. Principal | Mortimer J. Buckley | James M. Norris |
| Occupation(s) During the Past Five Years: President | Kathleen C. Gubanich | Glenn W. Reed |
| and Chief Operating Officer (retired 2010) of Corning | Paul A. Heller | George U. Sauter |
| Incorporated (communications equipment); Director of | Martha G. King | |
| Corning Incorporated (2000–2010) and Dow Corning | | |
| (2001–2010); Overseer of the Amos Tuck School of | | |
| Business Administration at Dartmouth College. | Chairman Emeritus and Senior Advisor |
| |
| | John J. Brennan | |
| Executive Officers | Chairman, 1996–2009 | |
| | Chief Executive Officer and President, 1996–2008 |
| Glenn Booraem | | |
| Born 1967. Controller Since July 2010. Principal | | |
| Occupation(s) During the Past Five Years: Principal | Founder | |
| of The Vanguard Group, Inc.; Controller of each of | | |
| the investment companies served by The Vanguard | John C. Bogle | |
| Group since 2010; Assistant Controller of each of | Chairman and Chief Executive Officer, 1974–1996 |
| the investment companies served by The Vanguard | | |
| Group (2001–2010). | | |
1 Mr. McNabb is considered an “interested person,” as defined in the Investment Company Act of 1940, because he is an officer of the Vanguard funds.
2 December 2002 for Vanguard Equity Income Fund, Vanguard Growth Equity Fund, the Vanguard Municipal Bond Funds, and the Vanguard State Tax-Exempt Funds.
|  |
| P.O. Box 2600 |
| Valley Forge, PA 19482-2600 |
| |
| Connect with Vanguard® > vanguard.com | |
| |
| The funds or securities referred to herein are not |
| Fund Information > 800-662-7447 | sponsored, endorsed, or promoted by MSCI, and MSCI |
| Direct Investor Account Services > 800-662-2739 | bears no liability with respect to any such funds or |
| Institutional Investor Services > 800-523-1036 | securities. For any such funds or securities, the |
| Text Telephone for People | prospectus or the Statement of Additional Information |
| With Hearing Impairment > 800-749-7273 | contains a more detailed description of the limited |
| | relationship MSCI has with The Vanguard Group and |
| This material may be used in conjunction | any related funds. |
| with the offering of shares of any Vanguard | |
| fund only if preceded or accompanied by | |
| the fund’s current prospectus. | |
| |
| All comparative mutual fund data are from Lipper Inc. or | |
| Morningstar, Inc., unless otherwise noted. | |
| |
| You can obtain a free copy of Vanguard’s proxy voting | |
| guidelines by visiting vanguard.com/proxyreporting or by | |
| calling Vanguard at 800-662-2739. The guidelines are | |
| also available from the SEC’s website, sec.gov. In | |
| addition, you may obtain a free report on how your fund | |
| voted the proxies for securities it owned during the 12 | |
| months ended June 30. To get the report, visit either | |
| vanguard.com/proxyreporting or sec.gov. | |
| |
| You can review and copy information about your fund at | |
| the SEC’s Public Reference Room in Washington, D.C. To | |
| find out more about this public service, call the SEC at | |
| 202-551-8090. Information about your fund is also | |
| available on the SEC’s website, and you can receive | |
| copies of this information, for a fee, by sending a | |
| request in either of two ways: via e-mail addressed to | |
| publicinfo@sec.gov or via regular mail addressed to the | |
| Public Reference Section, Securities and Exchange | |
| Commission, Washington, DC 20549-1520. | |
| | © 2011 The Vanguard Group, Inc. |
| | All rights reserved. |
| | Vanguard Marketing Corporation, Distributor. |
| |
| | Q1132 062011 |
| | | |
| Vanguard® Total International Stock Index Fund | | |
| Schedule of Investments | | |
| April 30, 2011 | | |
| |
| | | | Market |
| | | | Value |
| | | Shares | ($000) |
| Common Stocks (99.3%)1 | | |
| Argentina (0.0%) | | |
| | Siderar SAIC Class A | 30 | — |
| |
| Australia (6.0%) | | |
| | BHP Billiton Ltd. | 9,623,985 | 487,262 |
| | Commonwealth Bank of Australia | 4,659,725 | 275,078 |
| | Westpac Banking Corp. | 8,994,463 | 245,552 |
| | Australia & New Zealand Banking Group Ltd. | 7,705,704 | 205,260 |
| | National Australia Bank Ltd. | 6,430,971 | 191,469 |
| | Rio Tinto Ltd. | 1,310,019 | 118,591 |
| | Wesfarmers Ltd. | 3,022,247 | 110,716 |
| | Woolworths Ltd. | 3,647,660 | 106,152 |
| | Newcrest Mining Ltd. | 2,166,739 | 98,684 |
| | Woodside Petroleum Ltd. | 1,878,449 | 96,595 |
| | Westfield Group | 6,600,081 | 65,406 |
| | QBE Insurance Group Ltd. | 3,159,001 | 64,900 |
| | CSL Ltd. | 1,645,578 | 62,097 |
| | Origin Energy Ltd. | 3,190,139 | 57,229 |
| | AMP Ltd. | 8,852,841 | 53,253 |
| | Telstra Corp. Ltd. | 13,113,773 | 41,887 |
| | Santos Ltd. | 2,505,957 | 41,645 |
| | Macquarie Group Ltd. | 1,041,790 | 40,277 |
| | Foster's Group Ltd. | 5,795,585 | 35,770 |
| | Suncorp Group Ltd. | 3,845,662 | 35,190 |
| | Brambles Ltd. | 4,322,218 | 32,012 |
| | Orica Ltd. | 1,091,934 | 31,900 |
| | Stockland | 7,151,397 | 29,690 |
| | Amcor Ltd. | 3,670,134 | 28,211 |
| | Westfield Retail Trust | 9,660,620 | 28,061 |
| | Fortescue Metals Group Ltd. | 3,747,764 | 25,402 |
| | Insurance Australia Group Ltd. | 6,223,768 | 24,402 |
| | Transurban Group | 3,888,023 | 22,627 |
| | Coca-Cola Amatil Ltd. | 1,698,272 | 22,261 |
| | AGL Energy Ltd. | 1,378,528 | 22,000 |
| | Incitec Pivot Ltd. | 4,881,963 | 20,205 |
| * | QR National Ltd. | 5,150,017 | 19,406 |
| | WorleyParsons Ltd. | 575,686 | 19,224 |
| | ASX Ltd. | 527,689 | 18,609 |
| | GPT Group | 5,310,570 | 18,448 |
| | Alumina Ltd. | 7,361,280 | 18,437 |
| | TABCORP Holdings Ltd. | 2,059,532 | 17,265 |
| | Iluka Resources Ltd. | 1,253,081 | 17,242 |
| | Wesfarmers Ltd. Price Protected Shares | 454,565 | 16,807 |
| | Asciano Ltd. | 8,821,184 | 16,015 |
| | Lend Lease Group | 1,623,209 | 15,523 |
| | OZ Minerals Ltd. | 9,702,263 | 15,400 |
| | Sonic Healthcare Ltd. | 1,106,812 | 15,224 |
| | Cochlear Ltd. | 169,647 | 14,999 |
| | Goodman Group | 19,061,888 | 14,870 |
| | Mirvac Group | 10,210,531 | 14,247 |
| | Computershare Ltd. | 1,334,177 | 14,198 |
| | Dexus Property Group | 14,513,486 | 14,035 |
| | Crown Ltd. | 1,358,280 | 12,599 |
| | Toll Holdings Ltd. | 2,015,708 | 12,480 |
| | CFS Retail Property Trust | 6,336,647 | 12,441 |
| ^ | Leighton Holdings Ltd. | 450,929 | 12,013 |
| | Boral Ltd. | 2,159,024 | 11,661 |
| * | Lynas Corp. Ltd. | 4,997,531 | 11,518 |
| | Bendigo and Adelaide Bank Ltd. | 1,103,339 | 11,323 |
| | BlueScope Steel Ltd. | 5,576,808 | 10,622 |
| | Metcash Ltd. | 2,293,462 | 10,217 |
| | Tatts Group Ltd. | 3,876,562 | 9,874 |
| | Campbell Brothers Ltd. | 192,459 | 9,568 |
1
| | | |
| Vanguard® Total International Stock Index Fund | | |
| Schedule of Investments | | |
| April 30, 2011 | | |
| |
| | | | Market |
| | | | Value |
| | | Shares | ($000) |
| | OneSteel Ltd. | 4,023,430 | 9,432 |
| ^ | Fairfax Media Ltd. | 6,301,647 | 9,141 |
| | Sims Metal Management Ltd. | 451,276 | 8,661 |
| * | James Hardie Industries SE | 1,320,873 | 8,588 |
| | UGL Ltd. | 496,971 | 8,240 |
| | David Jones Ltd. | 1,527,025 | 7,821 |
| | Ramsay Health Care Ltd. | 390,578 | 7,750 |
| * | Qantas Airways Ltd. | 3,299,706 | 7,648 |
| * | Atlas Iron Ltd. | 1,980,084 | 7,647 |
| *,^ | Paladin Energy Ltd. | 2,080,327 | 7,519 |
| | Aquarius Platinum Ltd. | 1,380,236 | 7,497 |
| | Challenger Ltd. | 1,369,815 | 7,265 |
| | Commonwealth Property Office Fund | 7,124,656 | 7,164 |
| | Boart Longyear Ltd. | 1,390,587 | 7,004 |
| | Seek Ltd. | 912,907 | 6,984 |
| | MacArthur Coal Ltd. | 542,056 | 6,920 |
| ^ | JB Hi-Fi Ltd. | 328,425 | 6,828 |
| | APA Group | 1,415,611 | 6,609 |
| | Bank of Queensland Ltd. | 586,164 | 6,343 |
| | Caltex Australia Ltd. | 406,253 | 6,331 |
| | Newcrest Mining Ltd. ADR | 135,358 | 6,199 |
| | ConnectEast Group | 11,893,562 | 6,135 |
| * | PanAust Ltd. | 7,141,676 | 6,079 |
| | Myer Holdings Ltd. | 1,741,649 | 6,049 |
| | Ansell Ltd. | 393,294 | 6,017 |
| | Charter Hall Office REIT | 1,490,588 | 5,752 |
| | Investa Office Fund | 8,276,124 | 5,730 |
| | Transfield Services Ltd. | 1,390,888 | 5,435 |
| | Adelaide Brighton Ltd. | 1,539,354 | 5,342 |
| | Primary Health Care Ltd. | 1,399,008 | 5,336 |
| | Downer EDI Ltd. | 1,300,042 | 5,292 |
| | CSR Ltd. | 1,531,452 | 5,049 |
| | Goodman Fielder Ltd. | 4,179,766 | 4,933 |
| 2 | Spark Infrastructure Group | 3,710,540 | 4,831 |
| | DUET Group | 2,558,507 | 4,775 |
| | Monadelphous Group Ltd. | 223,868 | 4,728 |
| ^ | Harvey Norman Holdings Ltd. | 1,594,881 | 4,699 |
| | GrainCorp Ltd. | 537,651 | 4,621 |
| | Billabong International Ltd. | 610,023 | 4,536 |
| | IOOF Holdings Ltd. | 528,152 | 4,157 |
| *,^ | Perseus Mining Ltd. | 1,279,868 | 4,130 |
| * | Mount Gibson Iron Ltd. | 1,965,398 | 4,078 |
| | SP AusNet | 4,175,062 | 4,013 |
| ^ | Flight Centre Ltd. | 152,651 | 3,951 |
| | Perpetual Ltd. | 124,315 | 3,941 |
| | Australian Infrastructure Fund | 1,884,686 | 3,920 |
| * | Aquila Resources Ltd. | 381,886 | 3,820 |
| | Bradken Ltd. | 427,936 | 3,745 |
| * | Karoon Gas Australia Ltd. | 511,469 | 3,719 |
| | MAp Group | 1,128,656 | 3,658 |
| | Mineral Resources Ltd. | 282,666 | 3,621 |
| | Whitehaven Coal Ltd. | 512,429 | 3,615 |
| | DuluxGroup Ltd. | 1,121,392 | 3,414 |
| | Beach Energy Ltd. | 3,200,812 | 3,377 |
| | Aristocrat Leisure Ltd. | 1,166,073 | 3,359 |
| | Ten Network Holdings Ltd. | 2,233,901 | 3,317 |
| | Iress Market Technology Ltd. | 328,234 | 3,296 |
| | Medusa Mining Ltd. | 364,693 | 3,227 |
| | SAI Global Ltd. | 574,133 | 3,156 |
| | Charter Hall Retail REIT | 893,976 | 3,145 |
| | Seven Group Holdings Ltd. | 312,675 | 3,135 |
| | West Australian Newspapers Holdings Ltd. | 563,535 | 3,096 |
| * | Sundance Resources Ltd. | 7,042,532 | 3,093 |
| ^ | Platinum Asset Management Ltd. | 599,916 | 3,044 |
2
| | | |
| Vanguard® Total International Stock Index Fund | | |
| Schedule of Investments | | |
| April 30, 2011 | | |
| |
| | | | Market |
| | | | Value |
| | | Shares | ($000) |
| * | Transpacific Industries Group Ltd. | 2,387,482 | 2,916 |
| * | Mirabela Nickel Ltd. | 1,293,635 | 2,814 |
| * | Macquarie Atlas Roads Group | 1,385,113 | 2,809 |
| | Kingsgate Consolidated Ltd. | 329,257 | 2,808 |
| * | Nufarm Ltd. | 525,122 | 2,790 |
| ^ | Hastings Diversified Utilities Fund | 1,500,865 | 2,753 |
| * | Regis Resources Ltd. | 1,034,899 | 2,728 |
| ^ | Western Areas NL | 367,767 | 2,718 |
| ^ | Independence Group NL | 364,677 | 2,692 |
| | Australand Property Group | 802,450 | 2,673 |
| | Ausdrill Ltd. | 719,468 | 2,660 |
| * | Intrepid Mines Ltd. | 1,302,274 | 2,619 |
| * | AWE Ltd. | 1,515,674 | 2,594 |
| | Navitas Ltd. | 570,797 | 2,554 |
| * | Mesoblast Ltd. | 283,138 | 2,533 |
| | GWA Group Ltd. | 699,541 | 2,457 |
| * | Austar United Communications Ltd. | 1,763,388 | 2,405 |
| | Invocare Ltd. | 318,036 | 2,397 |
| | BWP Trust | 1,228,078 | 2,394 |
| | Linc Energy Ltd. | 788,461 | 2,365 |
| | Pacific Brands Ltd. | 2,893,807 | 2,324 |
| * | Pharmaxis Ltd. | 704,223 | 2,312 |
| | APN News & Media Ltd. | 1,314,930 | 2,271 |
| * | St. Barbara Ltd. | 906,307 | 2,216 |
| | GUD Holdings Ltd. | 213,791 | 2,203 |
| | NRW Holdings Ltd. | 739,604 | 2,200 |
| | Cabcharge Australia Ltd. | 357,350 | 2,150 |
| *,^ | Aston Resources Ltd. | 203,907 | 2,127 |
| | Emeco Holdings Ltd. | 1,762,935 | 2,124 |
| | REA Group Ltd. | 140,661 | 2,124 |
| * | Sandfire Resources NL | 263,832 | 2,076 |
| ^ | Mermaid Marine Australia Ltd. | 580,812 | 1,980 |
| * | Mantra Resources Ltd. | 264,720 | 1,963 |
| | Abacus Property Group | 791,302 | 1,953 |
| *,^ | Coalspur Mines Ltd. | 983,916 | 1,898 |
| | Wotif.com Holdings Ltd. | 298,567 | 1,872 |
| | Consolidated Media Holdings Ltd. | 594,947 | 1,821 |
| ^ | carsales.com.au Ltd. | 321,332 | 1,812 |
| *,^ | Gindalbie Metals Ltd. | 1,630,131 | 1,803 |
| | Fleetwood Corp. Ltd. | 145,278 | 1,776 |
| | Envestra Ltd. | 2,463,560 | 1,729 |
| | Super Retail Group Ltd. | 218,367 | 1,723 |
| * | Extract Resources Ltd. | 228,318 | 1,670 |
| | Charter Hall Group | 610,823 | 1,662 |
| | Southern Cross Media Group Ltd. | 919,030 | 1,657 |
| * | Eastern Star Gas Ltd. | 1,976,527 | 1,651 |
| | Cromwell Property Group | 2,054,724 | 1,623 |
| * | Coal of Africa Ltd. | 1,202,073 | 1,615 |
| *,^ | Resolute Mining Ltd. | 1,249,009 | 1,611 |
| | ARB Corp. Ltd. | 175,492 | 1,589 |
| | TPG Telecom Ltd. | 855,916 | 1,580 |
| | FKP Property Group | 1,826,776 | 1,565 |
| | Sigma Pharmaceuticals Ltd. | 3,782,211 | 1,536 |
| | Cardno Ltd. | 241,384 | 1,533 |
| ^ | Acrux Ltd. | 395,258 | 1,517 |
| *,^ | White Energy Co. Ltd. | 500,064 | 1,475 |
| * | Silex Systems Ltd. | 328,330 | 1,461 |
| | Premier Investments Ltd. | 220,799 | 1,454 |
| *,^ | Cudeco Ltd. | 382,500 | 1,443 |
| | Spotless Group Ltd. | 664,773 | 1,436 |
| * | Brockman Resources Ltd. | 241,986 | 1,358 |
| | Ardent Leisure Group | 890,245 | 1,357 |
| * | Gunns Ltd. | 2,307,391 | 1,334 |
| * | Centro Retail Group | 3,256,372 | 1,310 |
3
| | | |
| Vanguard® Total International Stock Index Fund | | |
| Schedule of Investments | | |
| April 30, 2011 | | |
| |
| | | | Market |
| | | | Value |
| | | Shares | ($000) |
| | McMillan Shakespeare Ltd. | 125,306 | 1,308 |
| * | Nexus Energy Ltd. | 2,726,252 | 1,289 |
| | Sims Metal Management Ltd. ADR | 66,577 | 1,271 |
| | Industrea Ltd. | 774,846 | 1,270 |
| * | Integra Mining Ltd. | 2,401,613 | 1,257 |
| | Panoramic Resources Ltd. | 552,303 | 1,253 |
| | Alesco Corp. Ltd. | 349,829 | 1,253 |
| | Multiplex SITES Trust | 13,176 | 1,232 |
| | SMS Management & Technology Ltd. | 176,256 | 1,223 |
| * | Horizon Oil Ltd. | 2,750,583 | 1,195 |
| * | Dart Energy Ltd. | 1,399,666 | 1,162 |
| ^ | Energy Resources of Australia Ltd. | 193,312 | 1,154 |
| * | Northern Iron Ltd. | 577,991 | 1,118 |
| * | Energy World Corp. Ltd. | 2,001,123 | 1,089 |
| * | Mineral Deposits Ltd. | 146,832 | 1,080 |
| | Automotive Holdings Group | 355,934 | 1,060 |
| | FlexiGroup Ltd. | 427,376 | 1,042 |
| *,^ | Arafura Resources Ltd. | 787,559 | 1,017 |
| | Austal Ltd. | 296,791 | 1,010 |
| ^ | Salmat Ltd. | 251,125 | 1,007 |
| | Hills Holdings Ltd. | 583,220 | 1,007 |
| * | Silver Lake Resources Ltd. | 434,150 | 999 |
| | STW Communications Group Ltd. | 772,254 | 983 |
| | Challenger Diversified Property Group | 1,638,930 | 980 |
| | Infigen Energy | 1,997,239 | 979 |
| *,^ | Murchison Metals Ltd. | 842,362 | 976 |
| | Macmahon Holdings Ltd. | 1,671,966 | 965 |
| * | Roc Oil Co. Ltd. | 2,031,401 | 960 |
| *,^ | Cockatoo Coal Ltd. | 1,736,594 | 945 |
| *,^ | Ampella Mining Ltd. | 395,247 | 936 |
| | OM Holdings Ltd. | 689,027 | 896 |
| | Peet Ltd. | 471,066 | 894 |
| * | Aditya Birla Minerals Ltd. | 433,441 | 861 |
| | Minara Resources Ltd. | 1,001,013 | 849 |
| * | Ivanhoe Australia Ltd. | 235,551 | 829 |
| | Reject Shop Ltd. | 66,947 | 815 |
| | Matrix Composites & Engineering Ltd. | 89,681 | 805 |
| * | Australian Agricultural Co. Ltd. | 454,946 | 792 |
| * | Kagara Ltd. | 1,209,671 | 787 |
| * | Ausenco Ltd. | 236,911 | 752 |
| * | Bow Energy Ltd. | 758,571 | 743 |
| | Aspen Group | 1,414,497 | 730 |
| * | Skilled Group Ltd. | 316,268 | 729 |
| | Clough Ltd. | 834,621 | 723 |
| * | Elders Ltd. | 1,283,063 | 720 |
| | Challenger Infrastructure Fund Class A | 589,804 | 719 |
| | Mincor Resources NL | 542,857 | 718 |
| | PMP Ltd. | 884,991 | 713 |
| ^ | Astro Japan Property Group | 205,611 | 703 |
| | iiNET Ltd. | 235,559 | 699 |
| | Transfield Services Infrastructure Fund | 804,670 | 692 |
| * | Molopo Energy Ltd. | 696,347 | 685 |
| * | Indophil Resources NL | 876,467 | 674 |
| | Programmed Maintenance Services Ltd. | 310,287 | 647 |
| * | Biota Holdings Ltd. | 488,757 | 644 |
| * | Tassal Group Ltd. | 330,993 | 588 |
| * | Platinum Australia Ltd. | 1,030,631 | 579 |
| | Sedgman Ltd. | 272,236 | 567 |
| * | PaperlinX Ltd. | 1,724,613 | 552 |
| * | BT Investment Management Ltd. | 168,882 | 501 |
| | Count Financial Ltd. | 395,653 | 499 |
| * | Perilya Ltd. | 727,136 | 497 |
| * | Carnarvon Petroleum Ltd. | 1,767,818 | 485 |
| | Redflex Holdings Ltd. | 174,822 | 471 |
4
| | | |
| Vanguard® Total International Stock Index Fund | | |
| Schedule of Investments | | |
| April 30, 2011 | | |
| |
| | | | Market |
| | | | Value |
| | | Shares | ($000) |
| | Customers Ltd. | 307,317 | 463 |
| * | Grange Resources Ltd. | 637,217 | 461 |
| ^ | CSG Ltd. | 386,287 | 458 |
| * | Carbon Energy Ltd. | 1,190,653 | 414 |
| *,^ | Metals X Ltd. | 1,132,161 | 363 |
| * | Deep Yellow Ltd. | 1,661,126 | 343 |
| | Gunns Ltd. | 3,440 | 290 |
| * | Sunland Group Ltd. | 333,731 | 253 |
| * | Nkwe Platinum Ltd. | 532,924 | 202 |
| * | Geodynamics Ltd. | 566,266 | 177 |
| | Hastie Group Ltd. | 629,519 | 131 |
| | | | 3,656,712 |
| Austria (0.3%) | | |
| | Erste Group Bank AG | 566,190 | 28,585 |
| | OMV AG | 451,267 | 20,574 |
| | Voestalpine AG | 330,144 | 16,242 |
| | Telekom Austria AG | 1,000,001 | 15,458 |
| * | IMMOFINANZ AG | 2,955,511 | 14,047 |
| | Andritz AG | 109,474 | 11,306 |
| | Verbund AG | 216,393 | 9,782 |
| | Raiffeisen Bank International AG | 154,659 | 8,524 |
| * | Wienerberger AG | 350,362 | 7,492 |
| | Vienna Insurance Group AG Wiener Versicherung Gruppe | 114,245 | 6,815 |
| * | CA Immobilien Anlagen AG | 223,698 | 4,404 |
| | Atrium European Real Estate Ltd. | 616,138 | 4,214 |
| * | Conwert Immobilien Invest SE | 228,730 | 4,020 |
| | Oesterreichische Post AG | 101,269 | 3,664 |
| | Schoeller-Bleckmann Oilfield Equipment AG | 32,385 | 3,278 |
| | Zumtobel AG | 83,308 | 3,022 |
| | Strabag SE | 85,644 | 2,876 |
| * | RHI AG | 77,783 | 2,777 |
| | Mayr Melnhof Karton AG | 20,428 | 2,482 |
| | Flughafen Wien AG | 29,583 | 1,862 |
| | Semperit AG Holding | 29,438 | 1,722 |
| | Palfinger AG | 35,687 | 1,479 |
| | Kapsch TrafficCom AG | 12,220 | 1,158 |
| * | Intercell AG | 109,016 | 986 |
| * | Sparkassen Immobilien AG | 124,757 | 951 |
| | Austria Technologie & Systemtechnik AG | 40,257 | 885 |
| | BWT AG | 22,734 | 686 |
| | Rosenbauer International AG | 8,568 | 521 |
| | | | 179,812 |
| Belgium (0.7%) | | |
| ^ | Anheuser-Busch InBev NV | 2,172,588 | 138,650 |
| | Delhaize Group SA | 305,761 | 26,455 |
| | Solvay SA Class A | 177,855 | 25,643 |
| ^ | Groupe Bruxelles Lambert SA | 243,694 | 24,149 |
| ^ | Ageas | 6,724,646 | 20,385 |
| ^ | Umicore SA | 345,023 | 19,776 |
| *,^ | KBC Groep NV | 484,695 | 19,731 |
| ^ | Belgacom SA | 457,256 | 17,979 |
| ^ | UCB SA | 303,020 | 14,640 |
| | Bekaert SA | 116,999 | 14,637 |
| | Colruyt SA | 226,569 | 13,070 |
| | Telenet Group Holding NV | 170,349 | 8,468 |
| | Ackermans & van Haaren NV | 70,453 | 7,370 |
| * | Dexia SA | 1,661,643 | 6,618 |
| | Nyrstar | 463,364 | 6,399 |
| | Mobistar SA | 82,173 | 6,097 |
| ^ | Cofinimmo | 38,968 | 5,997 |
| *,^ | Cie Nationale a Portefeuille | 80,809 | 5,840 |
| | D'ieteren SA/NV | 66,030 | 4,796 |
| | Befimmo SCA Sicafi | 46,610 | 4,324 |
5
| | | |
| Vanguard® Total International Stock Index Fund | | |
| Schedule of Investments | | |
| April 30, 2011 | | |
| |
| | | | Market |
| | | | Value |
| | | Shares | ($000) |
| | Gimv NV | 52,204 | 3,460 |
| * | Barco NV | 33,010 | 2,884 |
| * | ThromboGenics NV | 85,936 | 2,676 |
| | Tessenderlo Chemie NV | 63,743 | 2,536 |
| | Omega Pharma | 49,404 | 2,533 |
| * | AGFA-Gevaert NV | 511,547 | 2,280 |
| | EVS Broadcast Equipment SA | 32,487 | 2,226 |
| | Sipef SA | 19,697 | 2,073 |
| | Cie d'Entreprises CFE | 22,501 | 1,949 |
| * | KBC Ancora | 96,642 | 1,881 |
| | Warehouses De Pauw SCA | 29,461 | 1,797 |
| * | RHJ International | 215,144 | 1,788 |
| | Cie Maritime Belge SA | 39,879 | 1,249 |
| | Melexis NV | 61,587 | 1,178 |
| * | Kinepolis Group NV | 12,832 | 1,099 |
| * | Arseus NV | 57,995 | 1,063 |
| | Euronav NV | 58,963 | 990 |
| * | Galapagos NV | 59,893 | 886 |
| * | Econocom Group | 29,958 | 707 |
| | Intervest Offices | 19,889 | 677 |
| * | Ablynx NV | 56,065 | 662 |
| * | Exmar NV | 64,149 | 642 |
| * | Deceuninck NV | 200,118 | 599 |
| * | Ion Beam Applications | 49,968 | 590 |
| | Wereldhave Belgium NV | 5,319 | 556 |
| * | Recticel SA | 48,931 | 544 |
| *,^ | Devgen | 44,839 | 460 |
| * | Roularta Media Group NV | 11,273 | 413 |
| | Atenor Group | 7,531 | 387 |
| * | Leasinvest Real Estate SCA | 3,846 | 383 |
| * | Hamon & CIE SA | 6,533 | 280 |
| | | | 432,472 |
| Brazil (3.3%) | | |
| | Petroleo Brasileiro SA Prior Pfd. | 7,039,869 | 114,378 |
| | Petroleo Brasileiro SA | 5,366,789 | 98,145 |
| | Vale SA Prior Pfd. | 3,210,200 | 94,090 |
| | Petroleo Brasileiro SA ADR Type A | 2,800,107 | 93,440 |
| | Itau Unibanco Holding SA ADR | 3,657,868 | 86,874 |
| | Vale SA Class B Pfd. ADR | 2,816,165 | 84,203 |
| | Itau Unibanco Holding SA Prior Pfd. | 3,206,367 | 74,901 |
| | Vale SA | 2,169,000 | 71,156 |
| | Petroleo Brasileiro SA ADR | 1,794,662 | 66,995 |
| | Banco Bradesco SA Prior Pfd. | 3,290,188 | 65,210 |
| | Vale SA Class B ADR | 1,752,721 | 58,541 |
| | Itausa - Investimentos Itau SA Prior Pfd. | 6,884,281 | 52,774 |
| | Banco Bradesco SA ADR | 2,465,817 | 49,883 |
| | BM&FBovespa SA | 5,843,578 | 43,868 |
| | Cia de Bebidas das Americas Prior Pfd. | 1,297,715 | 41,343 |
| * | OGX Petroleo e Gas Participacoes SA | 3,892,200 | 41,119 |
| | Banco do Brasil SA | 1,719,321 | 31,584 |
| | Cia de Bebidas das Americas ADR | 957,245 | 31,187 |
| | BRF - Brasil Foods SA | 1,334,300 | 27,056 |
| | Banco Santander Brasil SA ADR | 1,803,759 | 20,942 |
| | CCR SA | 666,153 | 20,685 |
| | Gerdau SA Prior Pfd. | 1,617,800 | 19,282 |
| | PDG Realty SA Empreendimentos e Participacoes | 3,161,272 | 18,607 |
| | Cia Siderurgica Nacional SA | 1,174,900 | 18,342 |
| | Bradespar SA Prior Pfd. | 681,400 | 17,650 |
| | Cielo SA | 1,837,858 | 17,185 |
| | Cia Siderurgica Nacional SA ADR | 1,054,689 | 16,801 |
| | Ultrapar Participacoes SA Prior Pfd. | 890,076 | 15,559 |
| | Natura Cosmeticos SA | 521,200 | 14,627 |
| | Redecard SA | 1,006,510 | 14,625 |
| | Usinas Siderurgicas de Minas Gerais SA Prior Pfd. | 1,375,200 | 14,074 |
6
| | | |
| Vanguard® Total International Stock Index Fund | | |
| Schedule of Investments | | |
| April 30, 2011 | | |
| |
| | | | Market |
| | | | Value |
| | | Shares | ($000) |
| | Lojas Renner SA | 366,298 | 13,574 |
| | Cia Energetica de Minas Gerais Prior Pfd. | 653,437 | 13,300 |
| | Souza Cruz SA | 1,149,900 | 13,084 |
| | BRF - Brasil Foods SA ADR | 630,908 | 13,066 |
| | Vivo Participacoes SA Prior Pfd. | 319,525 | 12,964 |
| * | HRT Participacoes em Petroleo SA | 11,861 | 12,138 |
| | Metalurgica Gerdau SA Prior Pfd. Class A | 822,900 | 11,848 |
| | Gerdau SA ADR | 966,678 | 11,677 |
| | Cia Brasileira de Distribuicao Grupo Pao de Acucar ADR | 253,224 | 11,512 |
| | Hypermarcas SA | 852,880 | 11,433 |
| | All America Latina Logistica SA | 1,346,073 | 11,089 |
| | Centrais Eletricas Brasileiras SA Prior Pfd. | 574,600 | 10,523 |
| | Cia Energetica de Minas Gerais ADR | 502,558 | 10,488 |
| | BR Malls Participacoes SA | 923,796 | 9,759 |
| | Cyrela Brazil Realty SA Empreendimentos e Participacoes | 885,435 | 9,382 |
| | Cia Energetica de Sao Paulo Prior Pfd. | 478,625 | 9,224 |
| | Diagnosticos da America SA | 687,100 | 9,224 |
| | CETIP SA - Balcao Organizado de Ativos e Derivativos | 561,118 | 9,224 |
| | Usinas Siderurgicas de Minas Gerais SA | 535,100 | 8,690 |
| | Cia Hering | 388,553 | 8,410 |
| | Lojas Americanas SA Prior Pfd. | 924,200 | 8,224 |
| | Embraer SA ADR | 250,418 | 8,134 |
| | Anhanguera Educacional Participacoes SA | 363,345 | 8,114 |
| | Duratex SA | 749,401 | 7,884 |
| | Centrais Eletricas Brasileiras SA | 518,300 | 7,564 |
| | MRV Engenharia e Participacoes SA | 864,484 | 7,545 |
| | CPFL Energia SA | 258,700 | 7,499 |
| | Tele Norte Leste Participacoes SA Prior Pfd. | 440,600 | 7,363 |
| | Eletropaulo Metropolitana Eletricidade de Sao Paulo SA Prior Pfd. | 288,800 | 7,047 |
| | Tractebel Energia SA | 392,300 | 6,945 |
| | Vivo Participacoes SA ADR | 157,441 | 6,583 |
| | Banco do Estado do Rio Grande do Sul Prior Pfd. | 536,589 | 6,378 |
| * | Braskem SA Prior Pfd. | 438,400 | 6,340 |
| | Totvs SA | 329,000 | 6,297 |
| | Gafisa SA | 1,000,310 | 6,079 |
| | Localiza Rent a Car SA | 336,102 | 5,779 |
| | Porto Seguro SA | 345,300 | 5,737 |
| | Cosan SA Industria e Comercio | 370,400 | 5,665 |
| | Suzano Papel e Celulose SA Prior Pfd. | 540,350 | 5,317 |
| | Embraer SA | 671,100 | 5,311 |
| | JBS SA | 1,568,222 | 5,303 |
| | Klabin SA Prior Pfd. | 1,368,000 | 5,296 |
| | Tele Norte Leste Participacoes SA ADR | 304,949 | 5,199 |
| | Cia de Saneamento Basico do Estado de Sao Paulo | 177,400 | 5,167 |
| | AES Tiete SA Prior Pfd. | 308,200 | 5,084 |
| | Cia de Saneamento Basico do Estado de Sao Paulo ADR | 85,915 | 5,028 |
| | Cia Paranaense de Energia ADR | 182,356 | 5,028 |
| | Rossi Residencial SA | 528,176 | 4,912 |
| | Tim Participacoes SA Prior Pfd. | 996,800 | 4,524 |
| | EcoRodovias Infraestrutura e Logistica SA | 512,931 | 4,522 |
| | Brasil Telecom SA Prior Pfd. | 483,220 | 4,466 |
| | Marfrig Alimentos SA | 425,752 | 4,362 |
| | Centrais Eletricas Brasileiras SA ADR | 293,034 | 4,343 |
| | Odontoprev SA | 270,448 | 4,322 |
| | Fibria Celulose SA | 275,175 | 4,312 |
| | Multiplan Empreendimentos Imobiliarios SA | 203,528 | 4,254 |
| | Sul America SA | 325,600 | 4,234 |
| | EDP - Energias do Brasil SA | 168,500 | 4,189 |
| | TAM SA Prior Pfd. | 201,183 | 4,093 |
| * | MMX Mineracao e Metalicos SA | 640,591 | 4,072 |
| | Amil Participacoes SA | 330,600 | 4,014 |
| | BR Properties SA | 339,000 | 4,008 |
| | Telemar Norte Leste SA Prior Pfd. | 112,900 | 3,921 |
| | Brookfield Incorporacoes SA | 673,700 | 3,794 |
7
| | | |
| Vanguard® Total International Stock Index Fund | | |
| Schedule of Investments | | |
| April 30, 2011 | | |
| |
| | | | Market |
| | | | Value |
| | | Shares | ($000) |
| | Tele Norte Leste Participacoes SA | 167,300 | 3,582 |
| | Fibria Celulose SA ADR | 217,562 | 3,514 |
| * | Gol Linhas Aereas Inteligentes SA Prior Pfd. | 252,600 | 3,510 |
| | Cia Paranaense de Energia Prior Pfd. | 128,600 | 3,488 |
| | Brasil Telecom SA ADR | 122,073 | 3,442 |
| | Marcopolo SA Prior Pfd. | 769,934 | 3,416 |
| | Tim Participacoes SA ADR | 71,271 | 3,363 |
| | Cia de Saneamento de Minas Gerais-COPASA | 177,822 | 3,163 |
| | Vale Fertilizantes SA Prior Pfd. | 300,349 | 3,120 |
| | Randon Participacoes SA Prior Pfd. | 398,905 | 2,987 |
| | Cia de Transmissao de Energia Electrica Paulista Prior Pfd. | 92,500 | 2,985 |
| | B2W Cia Global Do Varejo | 211,943 | 2,960 |
| | Even Construtora e Incorporadora SA | 497,000 | 2,764 |
| | Estacio Participacoes SA | 175,129 | 2,556 |
| | Santos Brasil Participacoes SA | 133,961 | 2,555 |
| | Mills Estruturas e Servicos de Engenharia SA | 189,500 | 2,520 |
| | LLX Logistica SA | 857,733 | 2,475 |
| | Tecnisa SA | 311,049 | 2,404 |
| | Iguatemi Empresa de Shopping Centers SA | 92,600 | 2,400 |
| | Cia Brasileira de Distribuicao Grupo Pao de Acucar Prior Pfd. | 53,973 | 2,395 |
| * | Centrais Eletricas Brasileiras SA ADR | 108,458 | 2,032 |
| | Aliansce Shopping Centers SA | 225,388 | 1,999 |
| | Sao Martinho SA | 129,150 | 1,987 |
| | LPS Brasil Consultoria de Imoveis SA | 72,400 | 1,973 |
| | Brasil Brokers Participacoes SA | 355,200 | 1,924 |
| | Iochpe-Maxion SA | 135,515 | 1,895 |
| | SLC Agricola SA | 145,064 | 1,824 |
| | Confab Industrial SA Prior Pfd. | 649,584 | 1,800 |
| | Drogasil SA | 241,400 | 1,734 |
| | Fleury SA | 115,918 | 1,699 |
| | Banco Santander Brasil SA | 143,700 | 1,662 |
| | Contax Participacoes SA Prior Pfd. | 106,969 | 1,584 |
| | Grendene SA | 267,723 | 1,579 |
| * | Cia Energetica do Ceara Prior Pfd. | 72,847 | 1,579 |
| | Valid Solucoes e Servicos de Seguranca em Meios de Pagamento e Identificacao S.A | 115,599 | 1,572 |
| | Eternit SA | 225,420 | 1,535 |
| | Saraiva SA Livreiros Editores Prior Pfd. | 61,343 | 1,525 |
| | Centrais Eletricas de Santa Catarina SA Prior Pfd. | 52,750 | 1,418 |
| | Ez Tec Empreendimentos e Participacoes SA | 125,779 | 1,286 |
| | Helbor Empreendimentos SA | 93,107 | 1,230 |
| | Banco Daycoval SA Prior Pfd. | 153,245 | 1,188 |
| * | JSL SA | 164,868 | 1,168 |
| | Equatorial Energia SA | 134,936 | 1,149 |
| | Banco ABC Brasil SA Prior Pfd. | 131,200 | 1,122 |
| | Gafisa SA ADR | 86,950 | 1,075 |
| | Tegma Gestao Logistica | 63,800 | 1,062 |
| | CPFL Energia SA ADR | 11,083 | 980 |
| * | Kroton Educacional SA | 74,446 | 965 |
| | Cia Ferro Ligas da Bahia - Ferbasa Prior Pfd. | 121,943 | 953 |
| | Eucatex SA Industria e Comercio Prior Pfd. | 152,592 | 854 |
| | Cremer SA | 83,530 | 792 |
| | TPI - Triunfo Participacoes e Investimentos SA | 136,849 | 787 |
| * | Inpar SA | 408,973 | 769 |
| * | Brasil Ecodiesel Industria e Comercio de Biocombustiveis e Oleos Vegetais SA | 1,403,700 | 714 |
| * | Log-in Logistica Intermodal SA | 135,828 | 711 |
| | JHSF Participacoes SA | 244,665 | 666 |
| * | Banco Panamericano SA Prior Pfd. | 186,600 | 664 |
| * | Gol Linhas Aereas Inteligentes SA ADR | 43,200 | 616 |
| | Forjas Taurus SA Prior Pfd. | 236,263 | 614 |
| | Redentor Energia SA | 139,296 | 606 |
| | TAM SA ADR | 28,640 | 598 |
| | Industrias Romi SA | 92,894 | 596 |
| | Rodobens Negocios Imobiliarios SA | 69,645 | 590 |
| | Jereissati Participacoes SA Prior Pfd. | 559,167 | 565 |
8
| | | |
| Vanguard® Total International Stock Index Fund | | |
| Schedule of Investments | | |
| April 30, 2011 | | |
| |
| | | | Market |
| | | | Value |
| | | Shares | ($000) |
| * | Tempo Participacoes SA | 210,351 | 548 |
| * | Fertilizantes Heringer SA | 77,564 | 524 |
| * | General Shopping Brasil SA | 65,162 | 515 |
| * | Kepler Weber SA | 2,890,300 | 514 |
| | Camargo Correa Desenvolvimento Imobiliario SA | 113,485 | 470 |
| | Banco Pine SA Prior Pfd. | 55,207 | 467 |
| | Universo Online SA Prior Pfd. | 41,459 | 464 |
| | Bematech SA | 92,598 | 460 |
| * | Lupatech SA | 59,300 | 443 |
| | Cia de Tecidos do Norte de Minas - Coteminas Prior Pfd. | 141,667 | 422 |
| | Minerva SA | 97,440 | 415 |
| | Profarma Distribuidora de Produtos Farmaceuticos SA | 41,300 | 411 |
| * | Braskem SA ADR | 13,300 | 397 |
| | Cia Providencia Industria e Comercio SA | 94,684 | 385 |
| * | IdeiasNet SA | 173,757 | 383 |
| * | Unipar Participacoes SA Prior Pfd. | 1,247,800 | 357 |
| | Parana Banco SA Prior Pfd. | 44,800 | 342 |
| | Positivo Informatica SA | 72,700 | 332 |
| * | Plascar Participacoes Industriais SA | 206,986 | 321 |
| | Trisul SA | 90,383 | 244 |
| * | HRT Participacoes em Petroleo SA Rights Exp. 05/20/2011 | 3,360 | 21 |
| | Cia de Transmissao de Energia Electrica Paulista Prior Pfd. Rights Exp. 5/26/11 | 919 | — |
| * | Tim Participacoes SA Rights Exp. 05/12/2011 | 833 | — |
| | | | 2,021,662 |
| Canada (8.5%) | | |
| ^ | Royal Bank of Canada | 4,286,800 | 270,035 |
| | Toronto-Dominion Bank | 2,633,650 | 228,028 |
| | Suncor Energy Inc. | 4,702,890 | 216,766 |
| | Bank of Nova Scotia | 3,236,841 | 197,361 |
| | Canadian Natural Resources Ltd. | 3,274,896 | 154,062 |
| | Potash Corp. of Saskatchewan Inc. | 2,687,454 | 151,820 |
| | Barrick Gold Corp. | 2,967,120 | 151,531 |
| | Goldcorp Inc. | 2,381,100 | 133,104 |
| | Bank of Montreal | 1,703,100 | 111,854 |
| | Canadian National Railway Co. | 1,391,053 | 107,900 |
| | Canadian Imperial Bank of Commerce/Canada | 1,182,295 | 102,354 |
| | Manulife Financial Corp. | 5,336,769 | 95,832 |
| | Teck Resources Ltd. Class B | 1,747,657 | 94,998 |
| | TransCanada Corp. | 2,093,178 | 90,063 |
| | Cenovus Energy Inc. | 2,262,374 | 86,990 |
| | Encana Corp. | 2,210,000 | 74,255 |
| | Talisman Energy Inc. | 3,066,090 | 74,048 |
| | Enbridge Inc. | 1,092,752 | 71,029 |
| * | Research In Motion Ltd. | 1,413,418 | 68,852 |
| | Brookfield Asset Management Inc. Class A | 1,678,900 | 56,534 |
| | Sun Life Financial Inc. | 1,720,668 | 56,322 |
| | Kinross Gold Corp. | 3,405,600 | 53,991 |
| | Canadian Oil Sands Ltd. | 1,459,540 | 50,351 |
| | Rogers Communications Inc. Class B | 1,294,200 | 48,983 |
| | Imperial Oil Ltd. | 893,700 | 47,228 |
| | Thomson Reuters Corp. | 1,125,367 | 45,626 |
| | Valeant Pharmaceuticals International Inc. | 855,809 | 45,135 |
| | Agrium Inc. | 474,500 | 43,009 |
| | Nexen Inc. | 1,581,780 | 41,845 |
| | National Bank of Canada | 488,300 | 40,431 |
| | Silver Wheaton Corp. | 989,232 | 40,253 |
| | First Quantum Minerals Ltd. | 259,100 | 36,923 |
| | Penn West Petroleum Ltd. | 1,375,200 | 35,290 |
| | Agnico-Eagle Mines Ltd. | 505,699 | 35,233 |
| | Cameco Corp. | 1,186,472 | 35,024 |
| | Canadian Pacific Railway Ltd. | 507,852 | 33,681 |
| | Magna International Inc. | 655,312 | 33,675 |
| | Crescent Point Energy Corp. | 718,600 | 32,628 |
| | Bombardier Inc. Class B | 4,335,200 | 32,303 |
9
| | | |
| Vanguard® Total International Stock Index Fund | | |
| Schedule of Investments | | |
| April 30, 2011 | | |
| |
| | | | Market |
| | | | Value |
| | | Shares | ($000) |
| | Power Corp. of Canada | 1,048,000 | 31,535 |
| | Eldorado Gold Corp. | 1,651,400 | 30,736 |
| | Shoppers Drug Mart Corp. | 655,200 | 28,531 |
| | Yamana Gold Inc. | 2,235,400 | 28,493 |
| | BCE Inc. | 749,421 | 28,087 |
| | SNC-Lavalin Group Inc. | 456,000 | 27,587 |
| | Tim Hortons Inc. | 520,967 | 25,345 |
| | Power Financial Corp. | 745,800 | 24,806 |
| | Great-West Lifeco Inc. | 857,600 | 24,700 |
| | Fairfax Financial Holdings Ltd. | 60,100 | 24,271 |
| * | Ivanhoe Mines Ltd. | 922,578 | 24,192 |
| | Husky Energy Inc. | 770,200 | 24,095 |
| | Pacific Rubiales Energy Corp. | 760,700 | 23,115 |
| | ARC Resources Ltd. | 853,000 | 23,026 |
| | Shaw Communications Inc. Class B | 1,054,500 | 22,268 |
| | TELUS Corp. Class A | 441,039 | 22,193 |
| | IAMGOLD Corp. | 1,066,862 | 22,180 |
| | Baytex Energy Corp. | 339,917 | 20,992 |
| | Saputo Inc. | 432,900 | 20,608 |
| * | Equinox Minerals Ltd. | 2,225,811 | 19,055 |
| * | Sino-Forest Corp. | 735,400 | 18,273 |
| | IGM Financial Inc. | 354,800 | 18,251 |
| | Fortis Inc. | 525,500 | 18,045 |
| | Enerplus Corp. | 537,695 | 17,407 |
| | Intact Financial Corp. | 341,700 | 17,335 |
| * | CGI Group Inc. Class A | 716,493 | 15,676 |
| | Metro Inc. Class A | 315,100 | 15,419 |
| | Franco-Nevada Corp. | 381,100 | 15,113 |
| | Finning International Inc. | 513,500 | 15,061 |
| * | Osisko Mining Corp. | 1,027,400 | 15,039 |
| | Canadian Tire Corp. Ltd. Class A | 234,800 | 14,964 |
| | Brookfield Properties Corp. | 753,400 | 14,906 |
| | TransAlta Corp. | 660,800 | 14,722 |
| | Canadian Utilities Ltd. Class A | 259,600 | 14,715 |
| | Loblaw Cos. Ltd. | 336,500 | 14,183 |
| | Pengrowth Energy Corp. | 986,300 | 13,927 |
| | Vermilion Energy Inc. | 255,700 | 13,729 |
| | Viterra Inc. | 1,117,400 | 13,428 |
| | Gildan Activewear Inc. | 348,400 | 12,976 |
| * | Lundin Mining Corp. | 1,308,800 | 12,809 |
| * | Precision Drilling Corp. | 828,920 | 12,554 |
| * | New Gold Inc. | 1,116,800 | 12,547 |
| | Pembina Pipeline Corp. | 493,600 | 12,025 |
| | Niko Resources Ltd. | 139,400 | 11,779 |
| | CI Financial Corp. | 479,200 | 11,730 |
| | Petrominerales Ltd. | 298,457 | 11,422 |
| | George Weston Ltd. | 155,100 | 11,113 |
| | Pan American Silver Corp. | 306,600 | 11,060 |
| | Industrial Alliance Insurance & Financial Services Inc. | 251,700 | 10,817 |
| | Trican Well Service Ltd. | 432,700 | 10,665 |
| | Inmet Mining Corp. | 151,900 | 10,660 |
| | Onex Corp. | 282,300 | 10,592 |
| * | Open Text Corp. | 171,414 | 10,501 |
| | CAE Inc. | 773,572 | 10,424 |
| * | Consolidated Thompson Iron Mines Ltd. | 562,100 | 10,171 |
| ^ | RioCan Real Estate Investment Trust | 374,500 | 10,034 |
| | Alimentation Couche Tard Inc. Class B | 377,100 | 9,904 |
| * | Athabasca Oil Sands Corp. | 598,600 | 9,749 |
| * | SXC Health Solutions Corp. | 174,424 | 9,640 |
| | TMX Group Inc. | 222,400 | 9,534 |
| * | Quadra FNX Mining Ltd. | 574,300 | 9,426 |
| | Centerra Gold Inc. | 498,200 | 9,267 |
| | TELUS Corp. | 175,300 | 9,238 |
| ^ | Ritchie Bros Auctioneers Inc. | 283,889 | 8,899 |
| | Methanex Corp. | 275,000 | 8,891 |
10
| | | |
| Vanguard® Total International Stock Index Fund | | |
| Schedule of Investments | | |
| April 30, 2011 | | |
| |
| | | | Market |
| | | | Value |
| | | Shares | ($000) |
| | Keyera Corp. | 204,637 | 8,487 |
| * | Silver Standard Resources Inc. | 236,500 | 8,226 |
| | Peyto Exploration & Development Corp. | 381,865 | 8,128 |
| | HudBay Minerals Inc. | 505,300 | 8,064 |
| | Toromont Industries Ltd. | 229,500 | 7,997 |
| * | Detour Gold Corp. | 235,500 | 7,960 |
| | Groupe Aeroplan Inc. | 568,400 | 7,792 |
| ^ | Yellow Media Inc. | 1,524,600 | 7,670 |
| | Progress Energy Resources Corp. | 559,400 | 7,651 |
| | Atco Ltd. | 123,000 | 7,573 |
| | IESI-BFC Ltd. | 297,650 | 7,553 |
| ^ | Provident Energy Ltd. | 801,150 | 7,545 |
| | Ensign Energy Services Inc. | 390,700 | 7,544 |
| * | MEG Energy Corp. | 142,500 | 7,524 |
| | Sherritt International Corp. | 878,900 | 7,431 |
| | MacDonald Dettwiler & Associates Ltd. | 122,900 | 7,405 |
| | Daylight Energy Ltd. | 616,500 | 7,076 |
| * | SEMAFO Inc. | 808,100 | 6,867 |
| * | Celestica Inc. | 615,100 | 6,807 |
| | Silvercorp Metals Inc. | 496,500 | 6,759 |
| | AltaGas Ltd. | 245,700 | 6,591 |
| * | BlackPearl Resources Inc. | 779,000 | 6,562 |
| ^ | Bonavista Energy Corp. | 215,800 | 6,484 |
| | Petrobank Energy & Resources Ltd. | 304,900 | 6,452 |
| | Just Energy Group Inc. | 404,400 | 6,403 |
| | ShawCor Ltd. Class A | 172,200 | 6,163 |
| | Canadian Western Bank | 191,700 | 6,141 |
| * | Tahoe Resources Inc. | 269,400 | 6,127 |
| * | First Majestic Silver Corp. | 289,600 | 6,073 |
| ^ | Uranium One Inc. | 1,441,600 | 6,003 |
| | Alamos Gold Inc. | 348,300 | 5,846 |
| * | Bankers Petroleum Ltd. | 665,600 | 5,839 |
| | West Fraser Timber Co. Ltd. | 102,100 | 5,806 |
| | NAL Energy Corp. | 439,700 | 5,795 |
| * | Thompson Creek Metals Co. Inc. | 471,000 | 5,789 |
| | Astral Media Inc. Class A | 147,100 | 5,723 |
| | Home Capital Group Inc. Class B | 94,600 | 5,699 |
| *,^ | Novagold Resources Inc. | 441,000 | 5,677 |
| * | Dollarama Inc. | 179,500 | 5,625 |
| * | Gammon Gold Inc. | 509,523 | 5,574 |
| | Bonavista Energy Corp. | 184,400 | 5,541 |
| | RONA Inc. | 375,900 | 5,495 |
| | Mullen Group Ltd. | 239,200 | 5,365 |
| * | Legacy Oil & Gas Inc. | 366,800 | 5,226 |
| * | Gabriel Resources Ltd. | 667,000 | 5,090 |
| * | European Goldfields Ltd. | 361,700 | 5,031 |
| | Corus Entertainment Inc. Class B | 239,000 | 5,024 |
| * | Dundee Corp. Class A | 194,000 | 5,024 |
| * | Celtic Exploration Ltd. | 244,200 | 5,007 |
| | Russel Metals Inc. | 182,000 | 5,001 |
| | Empire Co. Ltd. Class A | 87,000 | 4,938 |
| | Quebecor Inc. Class B | 133,400 | 4,739 |
| * | Lake Shore Gold Corp. | 1,097,100 | 4,708 |
| | Cineplex Inc. | 174,121 | 4,536 |
| * | Crew Energy Inc. | 259,500 | 4,484 |
| ^ | PetroBakken Energy Ltd. Class A | 230,900 | 4,383 |
| * | Advantage Oil & Gas Ltd. | 500,822 | 4,256 |
| * | Stantec Inc. | 134,600 | 4,242 |
| * | Minefinders Corp. | 247,200 | 4,157 |
| | Trinidad Drilling Ltd. | 356,000 | 4,079 |
| * | Canfor Corp. | 305,500 | 4,023 |
| * | Alacer Gold Corp. | 383,700 | 4,003 |
| | AGF Management Ltd. Class B | 190,000 | 3,976 |
| | Trilogy Energy Corp. | 163,800 | 3,945 |
11
| | | |
| Vanguard® Total International Stock Index Fund | | |
| Schedule of Investments | | |
| April 30, 2011 | | |
| |
| | | | Market |
| | | | Value |
| | | Shares | ($000) |
| | Laurentian Bank of Canada | 72,600 | 3,857 |
| * | Nevsun Resources Ltd. | 588,133 | 3,829 |
| * | Birchcliff Energy Ltd. | 276,500 | 3,822 |
| | Brookfield Renewable Power Fund | 156,800 | 3,817 |
| ^ | Calloway Real Estate Investment Trust | 144,200 | 3,815 |
| | Jean Coutu Group PJC Inc. Class A | 343,500 | 3,812 |
| | Genworth MI Canada Inc. | 138,600 | 3,797 |
| | Boardwalk Real Estate Investment Trust | 72,900 | 3,714 |
| | Superior Plus Corp. | 317,500 | 3,695 |
| *,^ | Great Basin Gold Ltd. | 1,372,700 | 3,642 |
| | Canadian Real Estate Investment Trust | 102,200 | 3,619 |
| | Northland Power Inc. | 211,379 | 3,572 |
| | GMP Capital Inc. | 222,400 | 3,554 |
| | Maple Leaf Foods Inc. | 281,300 | 3,502 |
| | Major Drilling Group International | 209,700 | 3,493 |
| | Canaccord Financial Inc. | 230,600 | 3,485 |
| * | Paramount Resources Ltd. Class A | 112,000 | 3,480 |
| | First Capital Realty Inc. | 198,400 | 3,452 |
| * | Rubicon Minerals Corp. | 656,274 | 3,406 |
| * | Sabina Gold & Silver Corp. | 438,700 | 3,394 |
| * | Aurizon Mines Ltd. | 496,104 | 3,382 |
| * | Harry Winston Diamond Corp. | 198,692 | 3,381 |
| | Linamar Corp. | 149,500 | 3,355 |
| | TransForce Inc. | 224,100 | 3,337 |
| | Davis & Henderson Income Corp. | 163,500 | 3,306 |
| * | FirstService Corp. | 84,600 | 3,244 |
| | Freehold Royalties Ltd. | 136,200 | 3,225 |
| | Pason Systems Inc. | 194,600 | 3,188 |
| | Capital Power Corp. | 117,700 | 3,171 |
| * | Seabridge Gold Inc. | 93,252 | 3,162 |
| | Calfrac Well Services Ltd. | 89,300 | 3,159 |
| | Atlantic Power Corp. | 206,565 | 3,133 |
| * | Eastern Platinum Ltd. | 2,570,000 | 3,124 |
| | North West Co. Inc. | 149,000 | 3,115 |
| * | Neo Material Technologies Inc. | 290,700 | 3,008 |
| * | Westport Innovations Inc. | 118,568 | 2,999 |
| | CML HealthCare Inc. | 276,877 | 2,988 |
| | Transcontinental Inc. Class A | 192,500 | 2,966 |
| * | Alacer Gold Corp. | 274,494 | 2,964 |
| * | Taseko Mines Ltd. | 548,200 | 2,897 |
| * | Dundee Precious Metals Inc. | 294,500 | 2,851 |
| | Dorel Industries Inc. Class B | 84,500 | 2,810 |
| * | Northgate Minerals Corp. | 909,400 | 2,720 |
| | Bonterra Energy Corp. | 45,200 | 2,699 |
| * | Savanna Energy Services Corp. | 247,200 | 2,694 |
| * | Kirkland Lake Gold Inc. | 179,400 | 2,670 |
| | Cogeco Cable Inc. | 55,200 | 2,649 |
| * | Colossus Minerals Inc. | 290,100 | 2,631 |
| | NuVista Energy Ltd. | 260,000 | 2,627 |
| | Reitmans Canada Ltd. Class A | 141,300 | 2,606 |
| | CCL Industries Inc. Class B | 77,400 | 2,589 |
| * | Cott Corp. | 290,500 | 2,588 |
| | Torstar Corp. Class B | 172,900 | 2,555 |
| | Genivar Inc. | 76,915 | 2,473 |
| * | B2Gold Corp. | 723,000 | 2,461 |
| * | Golden Star Resources Ltd. | 759,300 | 2,456 |
| * | Grande Cache Coal Corp. | 287,000 | 2,448 |
| | Nordion Inc. | 205,858 | 2,415 |
| | Wi-Lan Inc. | 380,900 | 2,403 |
| * | Capstone Mining Corp. | 589,300 | 2,354 |
| *,^ | China Gold International Resources Corp. Ltd. | 462,600 | 2,313 |
| * | Guyana Goldfields Inc. | 232,200 | 2,295 |
| ^ | Dundee Real Estate Investment Trust | 64,300 | 2,246 |
| * | Northern Dynasty Minerals Ltd. | 165,321 | 2,244 |
12
| | | |
| Vanguard® Total International Stock Index Fund | | |
| Schedule of Investments | | |
| April 30, 2011 | | |
| |
| | | | Market |
| | | | Value |
| | | Shares | ($000) |
| * | Denison Mines Corp. | 959,696 | 2,232 |
| * | Ivanhoe Energy Inc. | 791,100 | 2,224 |
| * | Uranium Participation Corp. | 319,300 | 2,224 |
| * | North American Palladium Ltd. | 344,450 | 2,210 |
| ^ | Cominar Real Estate Investment Trust | 90,000 | 2,163 |
| ^ | Primaris Retail Real Estate Investment Trust | 98,300 | 2,161 |
| * | Extorre Gold Mines Ltd. | 220,000 | 2,148 |
| | Manitoba Telecom Services Inc. | 67,400 | 2,148 |
| *,^ | Mercator Minerals Ltd. | 577,500 | 2,142 |
| * | Martinrea International Inc. | 235,000 | 2,116 |
| * | OceanaGold Corp. | 720,600 | 2,110 |
| | Wajax Corp. | 48,614 | 2,094 |
| * | Torex Gold Resources Inc. | 1,080,400 | 2,078 |
| * | International Tower Hill Mines Ltd. | 212,950 | 2,059 |
| | Zargon Oil & Gas Ltd. | 86,000 | 2,048 |
| | AG Growth International Inc. | 39,600 | 2,042 |
| | Parkland Fuel Corp. | 158,700 | 2,041 |
| * | Anvil Mining Ltd. | 301,500 | 2,036 |
| * | Premier Gold Mines Ltd. | 265,700 | 2,036 |
| * | Southern Pacific Resource Corp. | 1,033,400 | 2,032 |
| ^ | Canadian Apartment Properties REIT | 97,000 | 1,953 |
| | Newalta Corp. | 139,600 | 1,937 |
| * | Angle Energy Inc. | 191,400 | 1,920 |
| * | Connacher Oil and Gas Ltd. | 1,353,500 | 1,917 |
| *,^ | Tanzanian Royalty Exploration Corp. | 249,965 | 1,815 |
| | Chorus Aviation Inc. | 321,505 | 1,791 |
| * | Flint Energy Services Ltd. | 114,600 | 1,743 |
| | Forzani Group Ltd. Class A | 83,700 | 1,653 |
| | Artis Real Estate Investment Trust | 113,200 | 1,639 |
| * | MAG Silver Corp. | 134,900 | 1,634 |
| * | ATS Automation Tooling Systems Inc. | 224,600 | 1,626 |
| | Allied Properties Real Estate Investment Trust | 66,400 | 1,625 |
| | Aecon Group Inc. | 164,000 | 1,622 |
| * | Minera Andes Inc. | 537,500 | 1,591 |
| | Algonquin Power & Utilities Corp. | 276,000 | 1,566 |
| | Innergex Renewable Energy Inc. | 144,100 | 1,515 |
| | Bird Construction Inc. | 115,800 | 1,509 |
| * | Great Canadian Gaming Corp. | 180,500 | 1,494 |
| ^ | Morneau Shepell Inc. | 137,200 | 1,494 |
| * | Paladin Labs Inc. | 34,900 | 1,475 |
| ^ | Perpetual Energy Inc. | 335,800 | 1,469 |
| * | Imperial Metals Corp. | 63,000 | 1,461 |
| | Cascades Inc. | 196,100 | 1,430 |
| * | Queenston Mining Inc. | 172,200 | 1,420 |
| * | C&C Energia Ltd. | 100,100 | 1,418 |
| | Killam Properties Inc. | 122,500 | 1,411 |
| * | Continental Gold Ltd. | 157,438 | 1,406 |
| | Capstone Infrastructure Corp. | 161,300 | 1,374 |
| *,^ | Jaguar Mining Inc. | 243,600 | 1,359 |
| * | Sprott Resource Corp. | 259,800 | 1,348 |
| | Northern Property Real Estate Investment Trust | 42,200 | 1,324 |
| * | Teranga Gold Corp. | 523,947 | 1,301 |
| *,^ | Pinetree Capital Ltd. | 392,600 | 1,299 |
| | Morguard Real Estate Investment Trust | 80,100 | 1,278 |
| * | Pace Oil and Gas Ltd. | 136,800 | 1,272 |
| * | Smart Technologies Inc. Class A | 127,699 | 1,259 |
| | EnerCare Inc. | 171,600 | 1,259 |
| * | Churchill Corp. Class A | 57,700 | 1,258 |
| * | Aura Minerals Inc. | 384,200 | 1,234 |
| | Sprott Inc. | 126,300 | 1,232 |
| *,^ | Corridor Resources Inc. | 250,400 | 1,231 |
| * | Fairborne Energy Ltd. | 240,600 | 1,218 |
| * | Exeter Resource Corp. | 230,900 | 1,206 |
| * | Atrium Innovations Inc. | 70,400 | 1,199 |
13
| | | |
| Vanguard® Total International Stock Index Fund | | |
| Schedule of Investments | | |
| April 30, 2011 | | |
| |
| | | | Market |
| | | | Value |
| | | Shares | ($000) |
| * | Chinook Energy Inc. | 551,913 | 1,178 |
| * | Augusta Resource Corp. | 247,200 | 1,157 |
| | Armtec Infrastructure Inc. | 66,800 | 1,128 |
| | Enbridge Income Fund Holdings Inc. | 56,400 | 1,099 |
| *,^ | Tethys Petroleum Ltd. | 725,100 | 1,096 |
| *,^ | BioExx Specialty Proteins Ltd. | 506,200 | 1,075 |
| * | Sierra Wireless Inc. | 90,360 | 1,072 |
| | Liquor Stores N.A. Ltd. | 65,700 | 1,047 |
| * | Yukon-Nevada Gold Corp. | 1,765,500 | 1,026 |
| | Alliance Grain Traders Inc. | 40,300 | 978 |
| * | Cardiome Pharma Corp. | 177,835 | 968 |
| * | ACE Aviation Holdings Inc. Class A | 73,300 | 920 |
| | Stella-Jones Inc. | 22,400 | 911 |
| * | High River Gold Mines Ltd. | 704,800 | 909 |
| | Gluskin Sheff & Associates Inc. | 40,700 | 905 |
| * | Norbord Inc. | 63,300 | 887 |
| * | Galleon Energy Inc. Class A | 238,100 | 881 |
| * | Sandvine Corp. | 333,600 | 843 |
| * | 5N Plus Inc. | 83,200 | 816 |
| *,^ | Theratechnologies Inc. | 169,200 | 787 |
| * | Sprott Resource Lending Corp. | 419,642 | 767 |
| | Aastra Technologies Ltd. | 34,800 | 767 |
| * | Greystar Resources Ltd. | 200,700 | 734 |
| * | Calvalley Petroleums Inc. Class A | 220,100 | 707 |
| *,^ | ECU Silver Mining Inc. | 859,200 | 699 |
| * | Migao Corp. | 94,800 | 689 |
| * | EXFO Inc. | 65,707 | 613 |
| *,^ | Questerre Energy Corp. Class A | 525,100 | 605 |
| * | Hanfeng Evergreen Inc. | 103,800 | 565 |
| * | St. Andrew Goldfields Ltd. | 496,100 | 561 |
| * | Boralex Inc. Class A | 58,200 | 535 |
| *,^ | Magma Energy Corp. | 526,700 | 523 |
| * | Air Canada Class A | 183,500 | 448 |
| *,^ | OPTI Canada Inc. | 790,100 | 200 |
| * | Cangene Corp. | 78,800 | 187 |
| * | Western Coal Corp. | | — |
| | | | 5,106,956 |
| Chile (0.4%) | | |
| | Empresas COPEC SA | 1,369,619 | 26,565 |
| | Cencosud SA | 2,721,042 | 21,489 |
| | Empresas CMPC SA | 329,242 | 18,272 |
| | CAP SA | 224,365 | 12,059 |
| | Empresa Nacional de Electricidad SA | 6,238,343 | 11,813 |
| | Lan Airlines SA | 408,887 | 11,511 |
| | Enersis SA | 25,280,594 | 10,812 |
| | Sociedad Quimica y Minera de Chile SA Prior Pfd. Class B | 157,724 | 9,523 |
| | SACI Falabella | 855,613 | 9,337 |
| | Banco Santander Chile ADR | 88,440 | 8,100 |
| | Sociedad Quimica y Minera de Chile SA ADR | 113,246 | 6,911 |
| | Empresa Nacional de Electricidad SA ADR | 121,405 | 6,845 |
| | ENTEL Chile SA | 323,024 | 6,527 |
| | Banco de Credito e Inversiones | 93,665 | 6,347 |
| | Colbun SA | 20,955,496 | 6,314 |
| | Enersis SA ADR | 276,395 | 5,904 |
| | AES Gener SA | 7,392,449 | 4,526 |
| | Cia Cervecerias Unidas SA | 365,763 | 4,415 |
| | Banco Santander Chile | 49,903,293 | 4,409 |
| | Vina Concha y Toro SA | 1,493,811 | 3,745 |
| | Empresas La Polar SA | 640,264 | 3,592 |
| | Corpbanca | 202,545,751 | 3,217 |
| | Administradora de Fondos de Pensiones Provida SA | 516,074 | 2,785 |
| | Parque Arauco SA | 1,143,550 | 2,632 |
| | Cia Sud Americana de Vapores SA | 3,010,153 | 2,399 |
| * | Sonda SA | 790,599 | 2,274 |
14
| | | |
| Vanguard® Total International Stock Index Fund | | |
| Schedule of Investments | | |
| April 30, 2011 | | |
| |
| | | | Market |
| | | | Value |
| | | Shares | ($000) |
| | Inversiones Aguas Metropolitanas SA | 1,309,614 | 2,145 |
| | Salfacorp SA | 449,905 | 1,739 |
| | Besalco SA | 759,263 | 1,585 |
| | Norte Grande SA | 48,405,405 | 906 |
| | Socovesa SA | 1,184,354 | 898 |
| * | Masisa SA | 5,423,124 | 889 |
| | Forus SA | 214,405 | 810 |
| * | Empresas Iansa SA | 6,249,440 | 761 |
| | Madeco SA | 8,604,180 | 504 |
| | Multiexport Foods SA | 974,924 | 472 |
| | Empresas Hites SA | 292,551 | 469 |
| * | Enjoy SA | 1,478,589 | 420 |
| | Empresa Electrica Pilmaiquen | 79,021 | 335 |
| | | | 224,256 |
| China (4.0%) | | |
| | China Mobile Ltd. | 18,109,000 | 166,575 |
| | Industrial & Commercial Bank of China | 182,813,760 | 155,065 |
| | China Construction Bank Corp. | 144,656,340 | 136,978 |
| | CNOOC Ltd. | 53,781,000 | 133,677 |
| | Bank of China Ltd. | 188,615,306 | 104,395 |
| | PetroChina Co. Ltd. | 63,528,000 | 92,217 |
| | Tencent Holdings Ltd. | 3,038,149 | 86,752 |
| | China Life Insurance Co. Ltd. | 22,384,000 | 80,010 |
| | Ping An Insurance Group Co. | 5,162,200 | 56,283 |
| | China Petroleum & Chemical Corp. | 48,034,000 | 48,417 |
| | China Shenhua Energy Co. Ltd. | 10,214,000 | 47,706 |
| | China Unicom Hong Kong Ltd. | 17,709,694 | 36,221 |
| | China Merchants Bank Co. Ltd. | 11,782,552 | 30,437 |
| | Agricultural Bank of China Ltd. | 51,023,870 | 30,214 |
| | Belle International Holdings Ltd. | 12,728,000 | 24,912 |
| | China Telecom Corp. Ltd. | 41,774,000 | 24,306 |
| | China Overseas Land & Investment Ltd. | 12,333,680 | 23,798 |
| | Yanzhou Coal Mining Co. Ltd. | 5,896,000 | 23,192 |
| | Bank of Communications Co. Ltd. | 19,912,500 | 21,141 |
| | China National Building Material Co. Ltd. | 8,700,000 | 18,411 |
| | China Pacific Insurance Group Co. Ltd. | 4,169,538 | 18,048 |
| | Anhui Conch Cement Co. Ltd. | 3,732,000 | 17,694 |
| | Hengan International Group Co. Ltd. | 2,223,500 | 17,379 |
| | Want Want China Holdings Ltd. | 17,995,500 | 16,176 |
| | China Merchants Holdings International Co. Ltd. | 3,334,000 | 15,373 |
| | China Yurun Food Group Ltd. | 4,087,413 | 15,018 |
| * | GCL-Poly Energy Holdings Ltd. | 20,913,000 | 14,983 |
| | China Coal Energy Co. Ltd. | 10,445,000 | 14,628 |
| | China Resources Enterprise Ltd. | 3,598,000 | 14,529 |
| | Jiangxi Copper Co. Ltd. | 4,174,000 | 14,221 |
| | China Citic Bank Corp. Ltd. | 18,672,539 | 13,400 |
| | Tingyi Cayman Islands Holding Corp. | 5,042,000 | 13,382 |
| | Kunlun Energy Co. Ltd. | 7,494,000 | 13,300 |
| | Dongfeng Motor Group Co. Ltd. | 8,172,000 | 12,789 |
| | Inner Mongolia Yitai Coal Co. Class B | 1,799,300 | 12,578 |
| | China Communications Construction Co. Ltd. | 12,712,000 | 11,774 |
| ^ | China Minsheng Banking Corp. Ltd. | 11,855,800 | 11,387 |
| ^ | Evergrande Real Estate Group Ltd. | 15,902,883 | 11,372 |
| ^ | Aluminum Corp. of China Ltd. | 11,936,000 | 11,234 |
| * | GOME Electrical Appliances Holding Ltd. | 30,576,980 | 10,996 |
| | Lenovo Group Ltd. | 18,106,000 | 10,566 |
| | China Mengniu Dairy Co. Ltd. | 3,421,000 | 10,522 |
| | China Resources Land Ltd. | 5,848,000 | 10,108 |
| | COSCO Pacific Ltd. | 4,866,000 | 10,101 |
| | Kingboard Chemical Holdings Ltd. | 1,808,000 | 9,922 |
| | Citic Pacific Ltd. | 3,288,000 | 9,851 |
| | Zijin Mining Group Co. Ltd. | 12,198,000 | 9,616 |
| * | PICC Property & Casualty Co. Ltd. | 7,262,000 | 9,342 |
| | China Resources Power Holdings Co. Ltd. | 5,009,600 | 9,237 |
15
| | | |
| Vanguard® Total International Stock Index Fund | | |
| Schedule of Investments | | |
| April 30, 2011 | | |
| |
| | | | Market |
| | | | Value |
| | | Shares | ($000) |
| | China Oilfield Services Ltd. | 4,598,000 | 9,124 |
| | Weichai Power Co. Ltd. | 1,212,800 | 8,311 |
| | Beijing Enterprises Holdings Ltd. | 1,552,000 | 8,266 |
| * | Changsha Zoomlion Heavy Industry Science and Technology Development Co. Ltd. | 3,014,600 | 7,996 |
| | ENN Energy Holdings Ltd. | 2,224,000 | 7,656 |
| | Guangzhou Automobile Group Co. Ltd. | 6,651,883 | 7,526 |
| *,^ | China COSCO Holdings Co. Ltd. | 7,698,000 | 7,415 |
| | Huabao International Holdings Ltd. | 4,745,000 | 7,047 |
| | Air China Ltd. | 6,858,000 | 6,969 |
| ^ | Agile Property Holdings Ltd. | 4,224,000 | 6,890 |
| ^ | Alibaba.com Ltd. | 3,792,000 | 6,741 |
| *,^ | Brilliance China Automotive Holdings Ltd. | 6,812,000 | 6,653 |
| | Shimao Property Holdings Ltd. | 4,787,000 | 6,522 |
| | CSR Corp. Ltd. | 5,853,000 | 6,468 |
| | China Railway Group Ltd. | 12,021,000 | 6,458 |
| | Shanghai Industrial Holdings Ltd. | 1,629,000 | 6,443 |
| | ZTE Corp. | 1,779,982 | 6,426 |
| * | China Taiping Insurance Holdings Co. Ltd. | 2,286,600 | 6,291 |
| | Fushan International Energy Group Ltd. | 8,922,000 | 6,263 |
| | Longfor Properties Co. Ltd. | 3,874,500 | 6,180 |
| | Sinopharm Group Co. | 1,776,800 | 6,167 |
| ^ | Zhaojin Mining Industry Co. Ltd. | 1,327,000 | 6,156 |
| | Shandong Weigao Group Medical Polymer Co. Ltd. | 2,184,000 | 5,996 |
| | China Resources Cement Holdings Ltd. | 5,829,845 | 5,947 |
| | Parkson Retail Group Ltd. | 3,837,000 | 5,903 |
| ^ | China Longyuan Power Group Corp. | 5,720,000 | 5,894 |
| | China Everbright Ltd. | 2,614,000 | 5,785 |
| | China Shanshui Cement Group Ltd. | 5,144,000 | 5,769 |
| | China Agri-Industries Holdings Ltd. | 4,965,000 | 5,682 |
| | Nine Dragons Paper Holdings Ltd. | 4,891,669 | 5,602 |
| ^ | Byd Co. Ltd. | 1,533,500 | 5,567 |
| | Zhuzhou CSR Times Electric Co. Ltd. | 1,393,000 | 5,525 |
| | Chaoda Modern Agriculture Holdings Ltd. | 8,685,825 | 5,423 |
| | Soho China Ltd. | 6,255,000 | 5,417 |
| | China Vanke Co. Ltd. Class B | 3,817,200 | 5,406 |
| | Golden Eagle Retail Group Ltd. | 2,051,000 | 5,390 |
| | Huaneng Power International Inc. | 9,678,000 | 5,345 |
| ^ | Sino-Ocean Land Holdings Ltd. | 9,355,500 | 5,321 |
| * | Semiconductor Manufacturing International Corp. | 58,289,000 | 5,227 |
| | Country Garden Holdings Co. | 12,743,000 | 5,175 |
| ^ | Great Wall Motor Co. Ltd. | 2,769,500 | 4,977 |
| | China Railway Construction Corp. Ltd. | 5,584,300 | 4,951 |
| ^ | Poly Hong Kong Investments Ltd. | 5,975,000 | 4,786 |
| | Tsingtao Brewery Co. Ltd. | 894,000 | 4,761 |
| | China High Speed Transmission Equipment Group Co. Ltd. | 3,549,000 | 4,710 |
| | China International Marine Containers Group Co. Ltd. Class B | 2,182,153 | 4,672 |
| ^ | Geely Automobile Holdings Ltd. | 11,270,000 | 4,534 |
| ^ | China Rongsheng Heavy Industry Group Co. Ltd. | 5,350,304 | 4,524 |
| | BBMG Corp. | 2,694,500 | 4,447 |
| | Lonking Holdings Ltd. | 5,917,000 | 4,374 |
| ^ | Anta Sports Products Ltd. | 2,683,000 | 4,350 |
| ^ | Angang Steel Co. Ltd. | 3,348,000 | 4,313 |
| | China BlueChemical Ltd. | 5,158,000 | 4,203 |
| | Shanghai Electric Group Co. Ltd. | 8,376,000 | 4,162 |
| * | China Shipping Container Lines Co. Ltd. | 10,379,000 | 4,155 |
| | China Shipping Development Co. Ltd. | 3,914,000 | 4,133 |
| ^ | Renhe Commercial Holdings Co. Ltd. | 23,759,635 | 4,077 |
| ^ | Hengdeli Holdings Ltd. | 6,740,000 | 4,048 |
| ^ | Guangzhou R&F Properties Co. Ltd. | 2,958,400 | 4,044 |
| | Fosun International Ltd. | 4,853,500 | 3,837 |
| | Guangdong Investment Ltd. | 7,394,000 | 3,837 |
| | Wumart Stores Inc. | 1,664,000 | 3,822 |
| | Shui On Land Ltd. | 8,602,199 | 3,813 |
| ^ | Li Ning Co. Ltd. | 2,118,500 | 3,636 |
16
| | | |
| Vanguard® Total International Stock Index Fund | | |
| Schedule of Investments | | |
| April 30, 2011 | | |
| |
| | | | Market |
| | | | Value |
| | | Shares | ($000) |
| | Jiangsu Expressway Co. Ltd. | 3,422,000 | 3,630 |
| | Zhejiang Expressway Co. Ltd. | 4,344,000 | 3,592 |
| ^ | Lee & Man Paper Manufacturing Ltd. | 4,974,000 | 3,582 |
| | Franshion Properties China Ltd. | 11,384,000 | 3,552 |
| | Digital China Holdings Ltd. | 1,802,000 | 3,511 |
| ^ | Datang International Power Generation Co. Ltd. | 9,284,000 | 3,509 |
| ^ | Kingdee International Software Group Co. Ltd. | 5,457,600 | 3,504 |
| | Dongfang Electric Corp. Ltd. | 1,056,800 | 3,471 |
| | Sinopec Shanghai Petrochemical Co. Ltd. | 6,964,000 | 3,381 |
| | Hidili Industry International Development Ltd. | 3,209,000 | 3,250 |
| | China Communications Services Corp. Ltd. | 5,276,000 | 3,225 |
| | China National Materials Co. Ltd. | 3,261,000 | 3,220 |
| *,^ | Metallurgical Corp. of China Ltd. | 7,505,000 | 3,188 |
| | Ports Design Ltd. | 1,152,500 | 3,180 |
| ^ | China Gas Holdings Ltd. | 8,158,000 | 3,162 |
| ^ | China Lumena New Materials Corp. | 6,020,000 | 3,134 |
| ^ | Skyworth Digital Holdings Ltd. | 4,769,000 | 3,052 |
| ^ | West China Cement Ltd. | 7,160,000 | 2,959 |
| | Dongyue Group | 2,787,000 | 2,946 |
| | China Dongxiang Group Co. | 8,328,000 | 2,915 |
| *,^ | China Southern Airlines Co. Ltd. | 5,496,000 | 2,883 |
| * | Haier Electronics Group Co. Ltd. | 2,292,000 | 2,846 |
| | Xingda International Holdings Ltd. | 2,458,000 | 2,839 |
| | KWG Property Holding Ltd. | 3,862,500 | 2,796 |
| ^ | China Shineway Pharmaceutical Group Ltd. | 1,145,000 | 2,777 |
| ^ | Maanshan Iron & Steel | 5,180,000 | 2,739 |
| | Beijing Capital International Airport Co. Ltd. | 5,546,000 | 2,738 |
| ^ | China Zhongwang Holdings Ltd. | 5,084,400 | 2,618 |
| | Haitian International Holdings Ltd. | 1,764,000 | 2,616 |
| *,^ | Yingde Gases | 2,860,000 | 2,613 |
| *,^ | Yuexiu Property Co. Ltd. | 12,290,000 | 2,587 |
| * | Sinofert Holdings Ltd. | 6,156,000 | 2,578 |
| | Comba Telecom Systems Holdings Ltd. | 2,057,000 | 2,576 |
| * | Beijing Enterprises Water Group Ltd. | 8,042,000 | 2,536 |
| ^ | Sino Biopharmaceutical | 6,636,000 | 2,422 |
| | Minth Group Ltd. | 1,566,000 | 2,410 |
| ^ | China Everbright International Ltd. | 5,339,000 | 2,400 |
| | Bosideng International Holdings Ltd. | 7,334,000 | 2,328 |
| | NVC Lighting Holdings Ltd. | 4,357,000 | 2,322 |
| | Shenzhen International Holdings Ltd. | 24,937,500 | 2,317 |
| | Asian Citrus Holdings Ltd. | 1,984,000 | 2,263 |
| *,^ | Hunan Non-Ferrous Metal Corp. Ltd. | 5,168,000 | 2,254 |
| | Ajisen China Holdings Ltd. | 1,120,000 | 2,238 |
| ^ | REXLot Holdings Ltd. | 20,850,000 | 2,122 |
| | Daphne International Holdings Ltd. | 2,640,000 | 2,117 |
| ^ | China Metal Recycling Holdings Ltd. | 1,520,400 | 2,113 |
| ^ | Peak Sport Products Co. Ltd. | 2,686,000 | 2,052 |
| | Shanghai Lujiazui Finance & Trade Zone Development Co. Ltd. Class B | 1,441,900 | 2,052 |
| | Greentown China Holdings Ltd. | 2,027,500 | 2,035 |
| | Travelsky Technology Ltd. | 1,988,000 | 2,014 |
| | Shenzhen Investment Ltd. | 6,230,000 | 1,953 |
| | Harbin Power Equipment Co. Ltd. | 2,004,000 | 1,933 |
| ^ | Real Gold Mining Ltd. | 1,345,000 | 1,915 |
| | TCC International Holdings Ltd. | 3,138,000 | 1,899 |
| ^ | Fufeng Group Ltd. | 2,475,000 | 1,826 |
| ^ | VODone Ltd. | 5,992,000 | 1,803 |
| | China Lilang Ltd. | 1,263,000 | 1,799 |
| *,^ | Hopson Development Holdings Ltd. | 1,810,000 | 1,789 |
| | First Tractor Co. Ltd. | 1,288,000 | 1,779 |
| ^ | 361 Degrees International Ltd. | 2,643,000 | 1,758 |
| ^ | Sinotruk Hong Kong Ltd. | 2,065,500 | 1,716 |
| * | Citic Resources Holdings Ltd. | 6,802,000 | 1,686 |
| * | China Travel International Inv HK | 8,206,000 | 1,684 |
| | PCD Stores Group Ltd. | 6,110,000 | 1,642 |
17
| | | |
| Vanguard® Total International Stock Index Fund | | |
| Schedule of Investments | | |
| April 30, 2011 | | |
| |
| | | | Market |
| | | | Value |
| | | Shares | ($000) |
| | China Wireless Technologies Ltd. | 4,220,000 | 1,637 |
| | TPV Technology Ltd. | 2,796,000 | 1,609 |
| | C C Land Holdings Ltd. | 4,130,000 | 1,594 |
| *,^ | Minmetals Resources Ltd. | 2,420,000 | 1,593 |
| ^ | CP Pokphand Co. | 11,858,000 | 1,591 |
| * | Phoenix Satellite Television Holdings Ltd. | 2,926,000 | 1,580 |
| * | TCL Communication Technology Holdings Ltd. | 1,625,000 | 1,573 |
| ^ | Silver Grant International | 4,258,000 | 1,568 |
| | International Mining Machinery Holdings Ltd. | 1,498,500 | 1,546 |
| | Shenzhen Expressway Co. Ltd. | 2,312,000 | 1,544 |
| ^ | China Pharmaceutical Group Ltd. | 2,488,000 | 1,487 |
| * | Interchina Holdings Co. | 7,790,000 | 1,485 |
| | China Automation Group Ltd. | 1,670,000 | 1,464 |
| * | Shougang Concord International Enterprises Co. Ltd. | 10,932,000 | 1,455 |
| ^ | New World Department Store China Ltd. | 1,660,000 | 1,453 |
| *,^ | Hi Sun Technology China Ltd. | 4,590,000 | 1,447 |
| * | United Energy Group Ltd. | 9,494,000 | 1,444 |
| | Sinotrans Shipping Ltd. | 4,577,000 | 1,429 |
| | China Water Affairs Group Ltd. | 3,762,000 | 1,427 |
| *,^ | China Rare Earth Holdings Ltd. | 3,256,000 | 1,410 |
| | Anhui Expressway Co. | 1,624,000 | 1,361 |
| * | China Precious Metal Resources Holdings Co. Ltd. | 6,330,000 | 1,346 |
| ^ | Vinda International Holdings Ltd. | 1,243,000 | 1,319 |
| | Shenzhou International Group Holdings Ltd. | 1,133,000 | 1,319 |
| *,^ | Tianjin Development Hldgs Ltd. | 1,748,000 | 1,316 |
| | Xinjiang Xinxin Mining Industry Co. Ltd. | 2,152,000 | 1,303 |
| ^ | China Green Holdings Ltd. | 1,473,000 | 1,260 |
| *,^ | Global Bio-Chem Technology Group Co. Ltd. | 5,110,000 | 1,248 |
| | Cosco International Holdings Ltd. | 1,926,000 | 1,243 |
| | China High Precision Automation Group Ltd. | 1,526,000 | 1,241 |
| ^ | Kingsoft Corp. Ltd. | 1,872,000 | 1,222 |
| | Jiangsu Future Land Co. Ltd. Class B | 1,313,800 | 1,221 |
| | Tianjin Port Development Holdings Ltd. | 5,254,000 | 1,220 |
| | Lao Feng Xiang Co. Ltd. Class B | 403,150 | 1,213 |
| | Zhejiang Southeast Electric Power Co. Class B | 1,988,500 | 1,207 |
| | BYD Electronic International Co. Ltd. | 2,246,000 | 1,205 |
| | Huaxin Cement Co. Ltd. Class B | 246,844 | 1,201 |
| *,^ | GZI Transport Ltd. | 2,142,000 | 1,185 |
| ^ | China Power International Development Ltd. | 5,092,000 | 1,175 |
| | China Forestry Holdings Co. Ltd. | 3,050,000 | 1,159 |
| * | China Oil and Gas Group Ltd. | 10,580,000 | 1,145 |
| ^ | XTEP International Holdings | 1,648,000 | 1,137 |
| ^ | Chigo Holding Ltd. | 11,668,000 | 1,127 |
| | Sinotrans Ltd. | 4,582,000 | 1,120 |
| *,^ | China Power New Energy Development Co. Ltd. | 14,180,000 | 1,117 |
| | Shanghai Friendship Group Inc. Ltd. Class B | 542,600 | 1,107 |
| ^ | Ruinian International Ltd. | 1,612,000 | 1,103 |
| ^ | Heng Tai Consumables Group Ltd. | 8,689,250 | 1,088 |
| ^ | Powerlong Real Estate Holdings Ltd. | 3,449,000 | 1,077 |
| | Asia Cement China Holdings Corp. | 1,319,000 | 1,075 |
| | Dazhong Transportation Group Co. Ltd. Class B | 1,613,400 | 1,071 |
| | Weiqiao Textile Co. | 1,178,000 | 1,063 |
| * | Anxin-China Holdings Ltd. | 4,168,000 | 1,054 |
| | Hangzhou Steam Turbine Co. Class B | 496,600 | 1,052 |
| ^ | GZI Real Estate Investment Trust | 1,980,000 | 1,051 |
| ^ | China Vanadium Titano - Magnetite Mining Co. Ltd. | 2,078,000 | 979 |
| ^ | Tianneng Power International Ltd. | 1,848,000 | 979 |
| *,^ | Shanghai Industrial Urban Development Group Ltd. | 2,600,000 | 916 |
| | Towngas China Co. Ltd. | 1,730,000 | 914 |
| * | Sino Union Energy Investment Group Ltd. | 10,730,000 | 914 |
| *,^ | Sino Oil And Gas Holdings Ltd. | 16,790,000 | 890 |
| | Tong Ren Tang Technologies Co. Ltd. | 747,000 | 885 |
| *,^ | China Grand Forestry Green Resources Group Ltd. | 28,858,000 | 883 |
| * | China ITS Holdings Co. Ltd. | 1,788,000 | 881 |
18
| | | |
| Vanguard® Total International Stock Index Fund | | |
| Schedule of Investments | | |
| April 30, 2011 | | |
| |
| | | | Market |
| | | | Value |
| | | Shares | ($000) |
| | Luthai Textile Co. Ltd. Class B | 917,600 | 880 |
| | Shanghai Forte Land Co. | 1,954,000 | 878 |
| | Shenzhen Accord Pharmaceutical Co. Ltd. Class B | 315,600 | 876 |
| ^ | Comtec Solar Systems Group Ltd. | 1,456,000 | 872 |
| | AMVIG Holdings Ltd. | 1,174,000 | 849 |
| | Beijing Capital Land Ltd. | 2,472,000 | 849 |
| | Shenzhen Chiwan Wharf Holdings Ltd. Class B | 514,700 | 847 |
| ^ | Chongqing Machinery & Electric Co. Ltd. | 2,358,000 | 847 |
| | Yip's Chemical Holdings Ltd. | 700,000 | 840 |
| * | Citic 21CN Co. Ltd. | 6,354,000 | 837 |
| * | Shanghai Haixin Group Co. Class B | 1,360,494 | 836 |
| | Guangzhou Shipyard International Co. Ltd. | 446,000 | 831 |
| ^ | China South City Holdings Ltd. | 5,110,000 | 830 |
| ^ | China Huiyuan Juice Group Ltd. | 1,255,000 | 824 |
| | Lijun International Pharmaceutical Holding Ltd. | 3,300,000 | 821 |
| ^ | Fantasia Holdings Group Co. Ltd. | 4,881,000 | 818 |
| * | Sino Prosper State Gold Resources Holdings Ltd. | 14,440,000 | 802 |
| | Shanghai Mechanical and Electrical Industry Co. Ltd. Class B | 666,120 | 802 |
| ^ | Sparkle Roll Group Ltd. | 4,160,000 | 784 |
| | Ju Teng International Holdings Ltd. | 2,352,000 | 776 |
| ^ | China SCE Property Holdings Ltd. | 2,858,000 | 766 |
| | Little Sheep Group Ltd. | 1,178,000 | 758 |
| | Qingling Motors Co. Ltd. | 2,116,000 | 752 |
| ^ | China Tontine Wines Group Ltd. | 3,560,000 | 744 |
| ^ | Shanghai Jin Jiang International Hotels Group Co. Ltd. | 3,538,000 | 744 |
| ^ | Hua Han Bio-Pharmaceutical Holdings Ltd. | 2,388,000 | 740 |
| | Shanghai Jinjiang International Hotels Development Co. Ltd. Class B | 431,300 | 722 |
| | Texhong Textile Group Ltd. | 750,000 | 719 |
| ^ | Guangzhou Pharmaceutical Co. Ltd. | 630,000 | 712 |
| | Truly International Holdings | 3,596,000 | 711 |
| * | Kai Yuan Holdings Ltd. | 17,700,000 | 708 |
| | China Singyes Solar Technologies Holdings Ltd. | 740,000 | 707 |
| * | China Merchants China Direct Investments Ltd. | 318,000 | 698 |
| | Welling Holding Ltd. | 14,046,000 | 698 |
| * | Vitar International Holdings Ltd. | 3,290,000 | 697 |
| | Lingbao Gold Co. Ltd. | 850,000 | 696 |
| ^ | Beijing Jingkelong Co. Ltd. | 537,000 | 692 |
| ^ | China Aerospace International Holdings Ltd. | 5,730,000 | 688 |
| ^ | Wasion Group Holdings Ltd. | 1,312,000 | 685 |
| * | Shanghai Chlor-Alkali Chemical Co. Ltd. Class B | 1,123,800 | 683 |
| *,^ | Golden Meditech Holdings Ltd. | 3,856,000 | 677 |
| ^ | BaWang International Group Holding Ltd. | 2,410,000 | 674 |
| | China All Access Holdings Ltd. | 2,062,000 | 665 |
| * | Pou Sheng International Holdings Ltd. | 4,297,000 | 665 |
| ^ | Road King Infrastructure Ltd. | 738,000 | 664 |
| | Xinhua Winshare Publishing and Media Co. Ltd. | 1,196,000 | 660 |
| * | Wuxi Little Swan Co. Ltd. Class B | 320,890 | 659 |
| * | North Mining Shares Co. Ltd. | 17,890,000 | 657 |
| | Great Wall Technology Co. Ltd. | 1,292,000 | 644 |
| ^ | Mingyuan Medicare Development Co. Ltd. | 7,170,000 | 638 |
| * | Huangshan Tourism Development Co. Ltd. Class B | 431,100 | 633 |
| | Shanghai Jinqiao Export Processing Zone Development Co. Ltd. Class B | 752,300 | 631 |
| | Minmetals Land Ltd. | 3,484,000 | 630 |
| * | Shandong Airlines Co. Ltd. | 378,300 | 629 |
| | TCL Multimedia Technology Holdings Ltd. | 1,538,000 | 622 |
| | Tomson Group Ltd. | 1,632,000 | 620 |
| | Regent Manner International Ltd. | 1,716,000 | 619 |
| | Livzon Pharmaceutical Inc. Class B | 206,200 | 611 |
| * | Hisense Kelon Electrical Holdings Co. Ltd. Class A | 1,047,000 | 608 |
| | China Haidian Holdings Ltd. | 4,660,000 | 607 |
| ^ | SRE Group Ltd. | 6,694,000 | 605 |
| | Baoye Group Co. Ltd. | 894,000 | 605 |
| *,^ | O-Net Communications Group Ltd. | 1,062,000 | 602 |
| | Sinolink Worldwide Holdings Ltd. | 5,564,000 | 588 |
19
| | | |
| Vanguard® Total International Stock Index Fund | | |
| Schedule of Investments | | |
| April 30, 2011 | | |
| |
| | | | Market |
| | | | Value |
| | | Shares | ($000) |
| | Pacific Online Ltd. | 972,000 | 582 |
| *,^ | Youyuan International Holdings Ltd. | 996,000 | 578 |
| ^ | Shandong Luoxin Pharmacy Stock Co. Ltd. | 468,000 | 577 |
| | Xiamen International Port Co. Ltd. | 2,678,000 | 570 |
| *,^ | Yuzhou Properties Co. | 1,717,000 | 569 |
| ^ | Loudong General Nice Resources China Holdings Ltd. | 3,921,000 | 566 |
| | Shanghai Diesel Engine Co. Ltd. Class B | 599,600 | 566 |
| | Shengli Oil&Gas Pipe Holdings Ltd. | 2,836,500 | 562 |
| | Tiangong International Co. Ltd. | 599,000 | 542 |
| * | PetroAsian Energy Holdings Ltd. | 10,280,000 | 536 |
| | Chiho-Tiande Group Ltd. | 690,000 | 531 |
| ^ | Chu Kong Petroleum & Natural Gas Steel Pipe Holdings Ltd. | 1,008,000 | 526 |
| * | Global Energy Resources International Group Ltd. | 14,496,000 | 525 |
| * | Asia Energy Logistics Group Ltd. | 22,050,000 | 520 |
| * | Danhua Chemical Technology Co. Ltd. | 535,600 | 518 |
| * | China Qinfa Group Ltd. | 882,000 | 518 |
| | Inspur International Ltd. | 7,000,000 | 515 |
| | Solargiga Energy Holdings Ltd. | 1,549,000 | 513 |
| ^ | Good Friend International Holdings Inc. | 468,000 | 513 |
| * | AVIC International Holding HK Ltd. | 9,592,000 | 507 |
| * | Double Coin Holdings Ltd. Class B | 638,200 | 507 |
| ^ | China Corn Oil Co. Ltd. | 752,000 | 506 |
| * | Shanghai Waigaoqiao Free Trade Zone Development Co. Ltd. Class B | 554,400 | 502 |
| | Shanghai Baosight Software Co. Ltd. Class B | 243,300 | 497 |
| ^ | Beijing North Star Co. Ltd. | 2,022,000 | 496 |
| * | Shanghai Highly Group Co. Ltd. Class B | 785,300 | 493 |
| * | Nan Hai Corp. Ltd. | 79,700,000 | 483 |
| * | Zhong An Real Estate Ltd. | 2,261,000 | 478 |
| | China Starch Holdings Ltd. | 6,605,000 | 477 |
| | Anton Oilfield Services Group | 2,328,000 | 477 |
| * | Kingway Brewery Holdings Ltd. | 1,678,000 | 470 |
| * | Jingwei Textile Machinery | 470,000 | 469 |
| ^ | Huscoke Resources Holdings Ltd. | 9,306,000 | 468 |
| | Sinopec Kantons Holdings Ltd. | 880,000 | 466 |
| | Guangdong Provincial Expressway Development Co. Ltd. Class B | 952,700 | 465 |
| | International Taifeng Holdings Ltd. | 854,000 | 464 |
| * | China LotSynergy Holdings Ltd. | 16,368,000 | 454 |
| | MIN XIN Holdings Ltd. | 776,000 | 452 |
| * | Eastern Communications Co. Ltd. Class B | 829,300 | 450 |
| * | Huadian Energy Co. Ltd. Class B | 1,193,500 | 450 |
| * | United Gene High-Tech Group Ltd. | 15,090,000 | 448 |
| | Shanghai Jinjiang International Industrial Investment Co. Ltd. Class B | 445,200 | 447 |
| ^ | China Aoyuan Property Group Ltd. | 2,613,000 | 445 |
| | Shanghai Prime Machinery Co. Ltd. | 2,032,000 | 443 |
| | Qunxing Paper Holdings Co. Ltd. | 1,573,000 | 442 |
| | MOBI Development Co. Ltd. | 1,402,000 | 439 |
| | China Resources Microelectronics Ltd. | 8,790,000 | 437 |
| | CPMC Holdings Ltd. | 711,000 | 435 |
| | Hainan Meilan International Airport Co. Ltd. | 372,000 | 429 |
| | NetDragon Websoft Inc. | 668,508 | 428 |
| * | SVA Electron Co. Ltd. Class B | 811,130 | 428 |
| * | Shanghai Yaohua Pilkington Glass Co. Ltd. Class B | 518,000 | 427 |
| | Goldlion Holdings Ltd. | 979,000 | 423 |
| * | LK Technology Holdings Ltd. | 1,170,000 | 421 |
| * | Honghua Group Ltd. | 3,227,000 | 420 |
| | Huiyin Household Appliances Holdings Co. Ltd. | 1,792,000 | 419 |
| ^ | Global Sweeteners Holdings Ltd. | 1,690,000 | 418 |
| * | SGSB Group Co. Ltd. Class B | 640,296 | 417 |
| ^ | Shandong Molong Petroleum Machinery Co. Ltd. | 355,200 | 415 |
| | Le Saunda Holdings Ltd. | 820,000 | 410 |
| ^ | Xiwang Sugar Holdings Co. Ltd. | 1,380,000 | 408 |
| | Shanghai Zendai Property Ltd. | 11,280,000 | 407 |
| *,^ | Chongqing Iron & Steel Co. Ltd. | 1,532,000 | 405 |
| | Lai Fung Holdings Ltd. | 9,212,000 | 403 |
20
| | | |
| Vanguard® Total International Stock Index Fund | | |
| Schedule of Investments | | |
| April 30, 2011 | | |
| |
| | | | Market |
| | | | Value |
| | | Shares | ($000) |
| ^ | Chaowei Power Holdings Ltd. | 971,000 | 403 |
| *,^ | HKC Holdings Ltd. | 7,900,000 | 403 |
| | SPG Land Holdings Ltd. | 893,000 | 399 |
| | Central China Real Estate Ltd. | 1,424,000 | 395 |
| * | Shanghai Dajiang Group Class B | 910,501 | 392 |
| | Overseas Chinese Town Asia Holdings Ltd. | 682,000 | 388 |
| * | China Glass Holdings Ltd. | 660,000 | 382 |
| * | China Fangda Group Co. Ltd. Class B | 863,790 | 381 |
| ^ | Ausnutria Dairy Corp. Ltd. | 1,045,000 | 377 |
| *,^ | Extrawell Pharmaceutical Holdings Ltd. | 4,420,000 | 376 |
| | Dawnrays Pharmaceutical Holdings Ltd. | 1,008,000 | 375 |
| | Trauson Holdings Co. Ltd. | 882,000 | 375 |
| * | Beijing Properties Holdings Ltd. | 4,088,000 | 374 |
| ^ | Dynasty Fine Wines Group Ltd. | 1,056,000 | 366 |
| * | Luoyang Glass Co. Ltd. | 716,000 | 360 |
| | China Sunshine Paper Holdings Co. Ltd. | 1,178,000 | 356 |
| | Tianyi Fruit Holdings Ltd. | 1,052,000 | 353 |
| *,^ | SIM Technology Group Ltd. | 1,792,000 | 343 |
| * | Jinzhou Port Co. Ltd. Class B | 615,400 | 336 |
| * | Chinasoft International Ltd. | 1,330,000 | 328 |
| | Tianjin Capital Environmental Protection Group Co. Ltd. | 968,000 | 322 |
| * | China Communication Telecom Services Co. Ltd. | 1,433,000 | 314 |
| * | Binhai Investment Co. Ltd. | 4,956,000 | 313 |
| * | China Energine International Holdings Ltd. | 3,956,000 | 311 |
| ^ | Sijia Group Co. | 687,000 | 310 |
| | China Nickel Resources Holding Co. Ltd. | 1,950,000 | 310 |
| * | Hubei Sanonda Co. Ltd. Class B | 657,800 | 309 |
| *,^ | SMI Corp. Ltd. | 6,260,000 | 303 |
| | Anhui Tianda Oil Pipe Co. Ltd. | 773,000 | 298 |
| * | Konka Group Co. Ltd. Class B | 811,400 | 292 |
| * | Tsann Kuen China Enterprise Co. Ltd. Class B | 1,244,900 | 287 |
| * | Shanghai Jinjiang International Travel Co. Ltd. Class B | 182,300 | 286 |
| * | Henderson Investment Ltd. | 2,951,000 | 286 |
| * | Jinshan Development & Construction Co. Ltd. Class B | 474,400 | 281 |
| * | Zhengzhou Gas Co. Ltd. | 150,000 | 280 |
| * | Jinan Qingqi Motorcycle Co. Class B | 636,000 | 277 |
| | DaChan Food Asia Ltd. | 1,162,000 | 273 |
| | Meike International Holdings Ltd. | 1,480,000 | 271 |
| *,^ | Hong Kong Resources Holdings Co. Ltd. | 2,688,000 | 270 |
| * | Shanghai Erfangji Co. Ltd. Class B | 644,000 | 257 |
| | Yantai North Andre Juice Co. | 4,955,000 | 256 |
| * | China Mining Resources Group Ltd. | 13,152,000 | 253 |
| *,^ | Richly Field China Development Ltd. | 10,150,000 | 252 |
| * | Shenzhen SEG Co. Ltd. Class B | 644,000 | 251 |
| | SinoMedia Holding Ltd. | 648,000 | 251 |
| * | China Chengtong Development Group Ltd. | 3,802,000 | 250 |
| * | Tianjin Marine Shipping Co. Ltd. Class B | 497,100 | 233 |
| * | Hefei Meiling Co. Ltd. Class B | 280,600 | 233 |
| | Shenji Group Kunming Machine Tool Co. Ltd. | 382,000 | 233 |
| * | Enerchina Holdings Ltd. | 13,365,000 | 231 |
| | Embry Holdings Ltd. | 346,000 | 231 |
| | Qin Jia Yuan Media Services Co. Ltd. | 1,260,000 | 229 |
| * | Changchai Co. Ltd. Class B | 387,400 | 229 |
| * | Nanjing Panda Electronics Co. Ltd. | 774,000 | 229 |
| * | CIMC Enric Holdings Ltd. | 586,000 | 227 |
| | A8 Digital Music Holdings Ltd. | 724,000 | 227 |
| * | Shanghai Dingli Technology Development Group Co. Ltd. Class B | 333,300 | 221 |
| * | Wafangdian Bearing Co. Ltd. Class B | 225,900 | 209 |
| * | Shanghai Potevio Co. Ltd. Class B | 345,100 | 207 |
| * | Shanghai Automation Instrumentation Co. Ltd. Class B | 296,100 | 202 |
| | Shanghai Material Trading Co. Ltd. Class B | 275,700 | 201 |
| * | CNNC International Ltd. | 356,000 | 199 |
| * | Centron Telecom International Holdings Ltd. | 826,000 | 197 |
| * | Beijing Development HK Ltd. | 1,069,000 | 189 |
21
| | | |
| Vanguard® Total International Stock Index Fund | | |
| Schedule of Investments | | |
| April 30, 2011 | | |
| |
| | | | Market |
| | | | Value |
| | | Shares | ($000) |
| * | Coastal Greenland Ltd. | 3,192,000 | 187 |
| * | Dalian Refrigeration Co. Ltd. Class B | 212,500 | 185 |
| * | Shandong Xinhua Pharmaceutical Co. Ltd. | 462,000 | 176 |
| * | Shenzhen Chiwan Petroleum Class B | 149,100 | 173 |
| * | Tak Sing Alliance Holdings Ltd. | 1,398,000 | 173 |
| * | China Public Healthcare Holding Ltd. | 20,260,000 | 172 |
| * | Zhonglu Co. Ltd. Class B | 209,800 | 171 |
| | Shougang Concord Century Holdings Ltd. | 1,608,000 | 160 |
| | Coslight Technology International Group Ltd. | 310,000 | 153 |
| * | Media China Corp. Ltd. | 45,100,000 | 140 |
| | Goldbond Group Holdings Ltd. | 2,410,000 | 137 |
| * | Northeast Electric Development Co. Ltd. | 554,000 | 116 |
| * | China Seven Star Shopping Ltd. | 11,130,000 | 112 |
| * | Shenzhen Special Economic Zone Real Estate & Properties Group Co. Ltd. Class B | 246,900 | 96 |
| | | | 2,409,722 |
| Colombia (0.1%) | | |
| | BanColombia SA ADR | 422,134 | 27,966 |
| | Ecopetrol SA | 1,690,947 | 3,633 |
| | Grupo de Inversiones Suramericana SA | 48,366 | 1,004 |
| | Cementos Argos SA | 135,002 | 817 |
| | Almacenes Exito SA | 45,263 | 696 |
| | Corp Financiera Colombiana SA | 30,910 | 596 |
| | Inversiones Argos SA | 50,291 | 525 |
| | Interconexion Electrica SA ESP | 62,441 | 443 |
| | | | 35,680 |
| Czech Republic (0.1%) | | |
| | CEZ AS | 481,595 | 27,627 |
| | Komercni Banka AS | 46,047 | 12,139 |
| | Telefonica O2 Czech Republic AS | 341,172 | 8,758 |
| * | Unipetrol AS | 232,041 | 2,760 |
| *,^ | Central European Media Enterprises Ltd. Class A | 116,000 | 2,659 |
| | Philip Morris CR AS | 2,052 | 1,165 |
| | Pegas Nonwovens SA | 33,413 | 923 |
| | | | 56,031 |
| Denmark (0.8%) | | |
| | Novo Nordisk A/S Class B | 1,259,544 | 159,450 |
| * | Danske Bank A/S | 1,823,408 | 43,788 |
| ^ | AP Moller - Maersk A/S Class B | 3,977 | 40,307 |
| | Carlsberg A/S Class B | 322,586 | 38,276 |
| | Novozymes A/S | 138,535 | 23,957 |
| * | Vestas Wind Systems A/S | 610,026 | 21,616 |
| | Danisco A/S | 143,137 | 18,977 |
| | DSV A/S | 625,181 | 16,348 |
| | AP Moller - Maersk A/S | 1,642 | 16,148 |
| * | FLSmidth & Co. A/S | 159,859 | 14,419 |
| | Coloplast A/S Class B | 68,739 | 10,111 |
| * | Jyske Bank A/S | 186,795 | 9,284 |
| * | Topdanmark A/S | 43,570 | 8,005 |
| ^ | Pandora A/S | 176,798 | 7,972 |
| *,^ | William Demant Holding A/S | 70,398 | 6,563 |
| | GN Store Nord A/S | 632,551 | 6,273 |
| | Christian Hansen Holding A/S | 268,575 | 6,125 |
| | Sydbank A/S | 202,919 | 5,880 |
| | Tryg A/S | 78,521 | 5,019 |
| ^ | NKT Holding A/S | 72,713 | 4,478 |
| ^ | Rockwool International A/S Class B | 24,972 | 3,299 |
| | SimCorp A/S | 13,683 | 2,486 |
| ^ | D/S Norden | 69,153 | 2,478 |
| | Royal UNIBREW A/S | 28,887 | 2,132 |
| *,^ | Bang & Olufsen A/S | 107,159 | 1,679 |
| | Schouw & Co. | 49,318 | 1,462 |
| | Solar A/S Class B | 15,060 | 1,319 |
22
| | | |
| Vanguard® Total International Stock Index Fund | | |
| Schedule of Investments | | |
| April 30, 2011 | | |
| |
| | | | Market |
| | | | Value |
| | | Shares | ($000) |
| | East Asiatic Co. Ltd. A/S | 37,113 | 1,234 |
| * | Genmab A/S | 109,066 | 1,178 |
| | ALK-Abello A/S | 18,416 | 1,119 |
| | IC Companys A/S | 23,858 | 1,076 |
| | Auriga Industries Class B | 41,317 | 788 |
| | Dfds A/S | 8,502 | 732 |
| *,^ | Bavarian Nordic A/S | 31,384 | 722 |
| *,^ | NeuroSearch A/S | 66,650 | 701 |
| | Thrane & Thrane AS | 12,186 | 607 |
| *,^ | Torm A/S | 83,479 | 543 |
| * | Alm Brand A/S | 224,934 | 504 |
| *,^ | Greentech Energy Systems | 128,938 | 481 |
| * | TK Development | 100,882 | 467 |
| * | Amagerbanken A/S | 537,565 | 368 |
| | | | 488,371 |
| Egypt (0.0%) | | |
| | Orascom Construction Industries GDR | 271,267 | 11,128 |
| * | Orascom Telecom Holding SAE GDR | 1,591,123 | 5,506 |
| | Egyptian Financial Group-Hermes Holding | 479,039 | 1,409 |
| | Telecom Egypt | 431,535 | 1,186 |
| | Commercial International Bank Egypt SAE | 253,786 | 1,170 |
| * | Talaat Moustafa Group | 1,819,263 | 1,104 |
| * | Ezz Steel | 512,305 | 691 |
| | National Societe Generale Bank SAE | 85,000 | 529 |
| | Egyptian Kuwaiti Holding Co. | 367,852 | 468 |
| | Egyptian Co. for Mobile Services | 13,261 | 319 |
| * | ElSwedy Electric Co. | 41,444 | 294 |
| | | | 23,804 |
| Finland (0.8%) | | |
| ^ | Nokia Oyj | 11,273,407 | 103,855 |
| | Fortum Oyj | 1,336,213 | 46,004 |
| ^ | Sampo Oyj | 1,263,390 | 42,534 |
| | UPM-Kymmene Oyj | 1,563,852 | 32,077 |
| | Kone Oyj Class B | 467,670 | 29,293 |
| | Metso Oyj | 386,244 | 23,721 |
| ^ | Stora Enso Oyj | 1,743,672 | 21,022 |
| | Wartsila Oyj | 473,224 | 18,602 |
| | Nokian Renkaat Oyj | 324,364 | 16,810 |
| | Kesko Oyj Class B | 199,488 | 10,353 |
| | YIT Oyj | 328,228 | 9,847 |
| ^ | Elisa Oyj | 402,519 | 9,690 |
| | Outotec Oyj | 130,865 | 8,299 |
| ^ | Konecranes Oyj | 166,882 | 8,028 |
| | Neste Oil Oyj | 386,618 | 7,317 |
| | Orion Oyj Class B | 278,850 | 6,933 |
| | Rautaruukki Oyj | 254,546 | 6,605 |
| ^ | Outokumpu Oyj | 384,371 | 6,403 |
| | Pohjola Bank plc | 412,458 | 6,121 |
| | Cargotec Oyj Class B | 108,300 | 6,081 |
| | Kemira Oyj | 327,995 | 5,997 |
| | Amer Sports Oyj Class A | 355,218 | 5,824 |
| | Sanoma Oyj | 241,816 | 5,026 |
| | Sponda Oyj | 681,720 | 4,021 |
| ^ | Tieto Oyj | 210,622 | 3,885 |
| ^ | Huhtamaki Oyj | 245,569 | 3,434 |
| | Ramirent Oyj | 191,869 | 3,270 |
| | Uponor Oyj | 161,709 | 3,153 |
| ^ | Stockmann OYJ Abp Class B | 92,818 | 2,843 |
| * | M-real Oyj Class B | 585,044 | 2,766 |
| | Citycon Oyj | 471,929 | 2,237 |
| ^ | Cramo Oyj | 81,453 | 2,159 |
| | Lassila & Tikanoja Oyj | 101,497 | 1,937 |
| | Tikkurila Oyj | 79,572 | 1,896 |
| | Vacon plc | 27,077 | 1,874 |
23
| | | |
| Vanguard® Total International Stock Index Fund | | |
| Schedule of Investments | | |
| April 30, 2011 | | |
| |
| | | | Market |
| | | | Value |
| | | Shares | ($000) |
| | Poyry Oyj | 105,810 | 1,802 |
| | Alma Media Oyj | 141,990 | 1,655 |
| ^ | Raisio plc | 349,480 | 1,335 |
| | Oriola-KD Oyj | 296,356 | 1,290 |
| ^ | Lemminkainen Oyj | 30,397 | 1,198 |
| | PKC Group Oyj | 44,012 | 1,053 |
| | F-Secure Oyj | 247,497 | 949 |
| ^ | HKScan Oyj | 90,311 | 901 |
| | Technopolis plc | 154,588 | 826 |
| | SRV Group plc | 41,374 | 425 |
| | Ponsse Oy | 24,902 | 408 |
| *,^ | Atria plc Class A | 31,235 | 371 |
| | | | 482,130 |
| France (6.6%) | | |
| | Total SA | 6,358,589 | 407,213 |
| | Sanofi-Aventis SA | 3,155,105 | 249,623 |
| | BNP Paribas | 2,883,662 | 227,967 |
| ^ | GDF Suez | 3,724,153 | 152,278 |
| | LVMH Moet Hennessy Louis Vuitton SA | 737,165 | 132,349 |
| | France Telecom SA | 5,577,947 | 130,716 |
| ^ | Schneider Electric SA | 731,485 | 129,234 |
| ^ | Danone | 1,754,792 | 128,480 |
| | Societe Generale | 1,908,773 | 127,559 |
| | Air Liquide SA | 851,329 | 125,788 |
| | Vivendi SA | 3,717,696 | 116,568 |
| ^ | AXA SA | 5,170,663 | 115,916 |
| | ArcelorMittal | 2,580,225 | 95,355 |
| ^ | L'Oreal SA | 720,951 | 91,391 |
| | Vinci SA | 1,329,037 | 88,715 |
| | Carrefour SA | 1,803,410 | 85,449 |
| | Cie de St-Gobain | 1,198,998 | 82,730 |
| ^ | Unibail-Rodamco SE | 275,508 | 64,457 |
| | Pernod-Ricard SA | 595,902 | 59,856 |
| | Cie Generale des Etablissements Michelin Class B | 530,337 | 53,158 |
| | Cie Generale d'Optique Essilor International SA | 607,665 | 50,881 |
| | Credit Agricole SA | 2,884,436 | 47,980 |
| * | Alcatel-Lucent | 6,978,264 | 45,219 |
| | Lafarge SA | 603,711 | 42,744 |
| | Vallourec SA | 333,767 | 41,640 |
| | Alstom SA | 620,539 | 41,258 |
| | PPR | 229,018 | 40,945 |
| * | European Aeronautic Defence and Space Co. NV | 1,224,807 | 37,897 |
| * | Renault SA | 578,234 | 35,209 |
| | Veolia Environnement SA | 1,046,534 | 34,954 |
| ^ | Bouygues SA | 695,388 | 34,606 |
| ^ | Technip SA | 296,501 | 33,454 |
| | EDF SA | 777,541 | 32,706 |
| | Christian Dior SA | 191,985 | 30,798 |
| | Cap Gemini SA | 446,641 | 27,053 |
| | SES SA | 903,904 | 23,737 |
| | STMicroelectronics NV | 1,920,095 | 22,722 |
| | Sodexo | 284,728 | 22,181 |
| | Legrand SA | 475,512 | 21,711 |
| | Publicis Groupe SA | 375,560 | 21,276 |
| * | Peugeot SA | 459,158 | 20,838 |
| | Accor SA | 439,568 | 19,534 |
| ^ | Safran SA | 503,443 | 19,531 |
| | Suez Environnement Co. | 812,612 | 18,723 |
| | Casino Guichard Perrachon SA | 166,816 | 17,553 |
| ^ | Groupe Eurotunnel SA | 1,605,658 | 17,457 |
| | Arkema SA | 165,853 | 17,274 |
| | Lagardere SCA | 356,968 | 15,673 |
| | SCOR SE | 505,776 | 15,440 |
| * | Cie Generale de Geophysique - Veritas | 435,798 | 15,352 |
24
| | | |
| Vanguard® Total International Stock Index Fund | | |
| Schedule of Investments | | |
| April 30, 2011 | | |
| |
| | | | Market |
| | | | Value |
| | | Shares | ($000) |
| * | Natixis | 2,619,602 | 15,058 |
| | Edenred | 475,085 | 14,731 |
| | Dassault Systemes SA | 177,466 | 14,432 |
| * | Valeo SA | 223,409 | 14,231 |
| ^ | Rhodia SA | 300,633 | 13,992 |
| | Eutelsat Communications SA | 297,180 | 12,822 |
| | Bureau Veritas SA | 148,348 | 12,795 |
| | Wendel SA | 99,267 | 12,425 |
| | Gemalto NV | 238,803 | 12,232 |
| | Thales SA | 270,249 | 11,937 |
| ^ | Klepierre | 284,936 | 11,709 |
| ^ | CNP Assurances | 442,998 | 10,166 |
| | Zodiac Aerospace | 118,629 | 9,310 |
| ^ | Fonciere Des Regions | 81,421 | 9,240 |
| | Neopost SA | 95,331 | 9,099 |
| ^ | ICADE | 70,735 | 9,068 |
| ^ | Imerys SA | 114,583 | 8,875 |
| | Aeroports de Paris | 90,307 | 8,655 |
| ^ | Eiffage SA | 121,050 | 8,368 |
| * | Atos Origin SA | 135,280 | 8,335 |
| | Gecina SA | 56,120 | 8,089 |
| | Societe BIC SA | 80,440 | 7,821 |
| | Nexans SA | 72,934 | 7,730 |
| ^ | Eurazeo | 87,714 | 7,299 |
| * | Air France-KLM | 406,755 | 7,179 |
| * | JCDecaux SA | 199,978 | 6,984 |
| | SEB SA | 60,686 | 6,671 |
| ^ | Societe Television Francaise 1 | 352,986 | 6,627 |
| ^ | Iliad SA | 49,505 | 6,365 |
| ^ | Eramet | 16,041 | 6,314 |
| * | Faurecia | 149,645 | 6,171 |
| | Teleperformance | 154,760 | 5,904 |
| ^ | Bourbon SA | 120,839 | 5,727 |
| | APERAM | 130,652 | 5,501 |
| | Remy Cointreau SA | 66,430 | 5,472 |
| ^ | Metropole Television SA | 196,358 | 5,210 |
| | Havas SA | 913,171 | 5,204 |
| | Etablissements Maurel et Prom | 240,983 | 5,133 |
| | Ingenico | 101,043 | 5,014 |
| | Societe Immobiliere de Location pour l'Industrie et le Commerce | 31,782 | 4,764 |
| | CFAO SA | 112,803 | 4,536 |
| | Rubis | 36,649 | 4,500 |
| * | Euler Hermes SA | 41,511 | 4,425 |
| ^ | SA des Ciments Vicat | 48,327 | 4,412 |
| | Nexity SA | 79,193 | 4,307 |
| ^ | PagesJaunes Groupe | 385,625 | 4,019 |
| | BioMerieux | 36,552 | 3,974 |
| *,^ | SOITEC | 231,876 | 3,765 |
| ^ | Mercialys SA | 81,247 | 3,513 |
| | EDF Energies Nouvelles SA | 57,470 | 3,407 |
| ^ | Saft Groupe SA | 74,144 | 3,405 |
| | Ipsen SA | 86,871 | 3,401 |
| | IPSOS | 64,842 | 3,370 |
| | Orpea | 62,993 | 3,149 |
| | Mersen | 47,600 | 2,895 |
| | Rallye SA | 53,723 | 2,825 |
| ^ | Eurofins Scientific | 24,640 | 2,654 |
| | Virbac SA | 13,936 | 2,571 |
| * | UBISOFT Entertainment | 250,828 | 2,518 |
| ^ | Groupe Steria SCA | 74,634 | 2,475 |
| | Alten Ltd. | 59,203 | 2,429 |
| * | Derichebourg SA | 254,637 | 2,413 |
| | Plastic Omnium SA | 25,063 | 2,399 |
| | Vilmorin & Cie | 18,916 | 2,396 |
25
| | | |
| Vanguard® Total International Stock Index Fund | | |
| Schedule of Investments | | |
| April 30, 2011 | | |
| |
| | | | Market |
| | | | Value |
| | | Shares | ($000) |
| ^ | Ciments Francais SA | 22,436 | 2,370 |
| | Beneteau SA | 109,070 | 2,339 |
| * | Altran Technologies SA | 271,843 | 2,146 |
| | Faiveley Transport | 20,443 | 2,083 |
| * | Technicolor | 242,845 | 1,856 |
| * | Club Mediterranee | 69,051 | 1,609 |
| * | Bull | 241,587 | 1,608 |
| | Societe de la Tour Eiffel | 15,389 | 1,543 |
| | Societe Fonciere Financiere et de Participations FFP | 17,972 | 1,489 |
| | Canal & | 180,997 | 1,479 |
| | Sechilienne-Sidec | 48,768 | 1,428 |
| | Sopra Group SA | 11,804 | 1,389 |
| *,^ | GameLoft SA | 181,662 | 1,323 |
| ^ | April Group | 40,877 | 1,316 |
| * | Medica SA | 61,656 | 1,272 |
| | Pierre & Vacances | 13,860 | 1,237 |
| * | Manitou BF SA | 32,250 | 1,092 |
| * | Altamir Amboise | 83,585 | 1,028 |
| | Esso SA Francaise | 7,206 | 1,013 |
| ^ | Laurent-Perrier | 7,656 | 977 |
| | Trigano SA | 27,233 | 974 |
| ^ | Sequana | 56,683 | 972 |
| | Seche Environnement SA | 9,879 | 944 |
| | Fimalac | 20,662 | 932 |
| | Bonduelle S.C.A. | 9,153 | 927 |
| * | IMS-Intl Metal Service | 34,379 | 898 |
| | LISI | 9,148 | 888 |
| *,^ | Transgene SA | 45,301 | 832 |
| | Assystem | 31,542 | 827 |
| * | Boursorama | 61,147 | 808 |
| | Cie des Alpes | 23,589 | 802 |
| * | Euro Disney SCA | 61,509 | 779 |
| | GL Events | 20,089 | 774 |
| * | ABC Arbitrage | 69,861 | 770 |
| * | Parrot SA | 20,386 | 767 |
| * | Haulotte Group SA | 31,303 | 695 |
| | Boiron SA | 15,396 | 685 |
| | Sword Group | 20,864 | 683 |
| * | GFI Informatique | 116,837 | 666 |
| | Meetic | 29,366 | 662 |
| * | Devoteam SA | 22,524 | 623 |
| | Sartorius Stedim Biotech | 9,957 | 623 |
| *,^ | Hi-Media SA | 101,595 | 622 |
| | NRJ Group | 47,637 | 565 |
| | Societe Internationale de Plantations d'Heveas SA | 3,615 | 545 |
| *,^ | NicOx SA | 196,939 | 520 |
| | Union Financiere de France BQE SA | 10,871 | 517 |
| * | Inter Parfums SA | 12,911 | 512 |
| * | Cegid Group | 14,557 | 500 |
| * | Recylex SA | 48,076 | 496 |
| * | Maisons France Confort | 9,040 | 477 |
| | Stallergenes SA | 5,380 | 463 |
| *,^ | Theolia SA | 208,250 | 422 |
| | Entrepose Contracting | 2,964 | 409 |
| * | Affine SA | 12,000 | 397 |
| * | Spir Communication | 6,326 | 387 |
| * | Etam Developpement SA | 8,068 | 386 |
| * | Audika SA | 12,357 | 370 |
| *,^ | LVL Medical Groupe SA | 12,687 | 332 |
| * | Vranken - Pommery Monopole | 5,904 | 307 |
| * | Groupe Crit | 8,459 | 293 |
| *,^ | ExonHit Therapeutics SA | 88,798 | 288 |
| *,^ | METabolic EXplorer SA | 30,585 | 288 |
26
| | | |
| Vanguard® Total International Stock Index Fund | | |
| Schedule of Investments | | |
| April 30, 2011 | | |
| |
| | | | Market |
| | | | Value |
| | | Shares | ($000) |
| * | Acanthe Developpement SA | 115,333 | 284 |
| | | | 4,021,073 |
| Germany (5.9%) | | |
| | Siemens AG | 2,475,297 | 360,054 |
| *,^ | BASF SE | 2,763,192 | 283,736 |
| ^ | Bayer AG | 2,487,826 | 218,418 |
| ^ | Allianz SE | 1,365,533 | 214,541 |
| | Daimler AG | 2,673,337 | 206,613 |
| ^ | E.ON AG | 5,417,907 | 185,180 |
| | Deutsche Bank AG | 2,796,348 | 182,124 |
| | SAP AG | 2,583,246 | 166,414 |
| | Deutsche Telekom AG | 8,532,731 | 141,014 |
| *,^ | Volkswagen AG Prior Pfd. | 511,883 | 100,748 |
| ^ | Bayerische Motoren Werke AG | 995,681 | 93,742 |
| ^ | Muenchener Rueckversicherungs AG | 566,497 | 93,446 |
| ^ | Linde AG | 508,349 | 91,486 |
| ^ | RWE AG | 1,260,335 | 82,222 |
| * | Deutsche Post AG | 2,542,523 | 50,250 |
| ^ | Deutsche Boerse AG | 586,176 | 48,664 |
| ^ | Adidas AG | 630,595 | 46,994 |
| | ThyssenKrupp AG | 1,008,074 | 46,347 |
| ^ | Fresenius Medical Care AG & Co. KGaA | 582,530 | 45,814 |
| * | MAN SE | 318,147 | 44,322 |
| | Infineon Technologies AG | 3,264,625 | 37,013 |
| | Henkel AG & Co. KGaA Prior Pfd. | 537,492 | 36,643 |
| ^ | K&S AG | 431,751 | 34,871 |
| ^ | Fresenius SE & Co. KGaA | 328,151 | 34,464 |
| | Porsche Automobil Holding SE Prior Pfd. | 461,726 | 33,375 |
| ^ | HeidelbergCement AG | 424,365 | 32,450 |
| ^ | Metro AG | 391,146 | 28,707 |
| | Lanxess AG | 249,835 | 22,859 |
| | Henkel AG & Co. KGaA | 389,986 | 22,149 |
| | Merck KGaA | 194,964 | 20,646 |
| ^ | Beiersdorf AG | 302,695 | 19,715 |
| | GEA Group AG | 500,110 | 18,266 |
| * | Commerzbank AG | 2,539,532 | 16,160 |
| *,^ | Volkswagen AG | 88,738 | 15,802 |
| * | Commerzbank AG | 2,512,173 | 15,665 |
| *,^ | Deutsche Lufthansa AG | 686,024 | 15,564 |
| * | Continental AG | 150,503 | 15,090 |
| * | QIAGEN NV | 704,767 | 15,069 |
| * | Bilfinger Berger SE | 132,396 | 12,746 |
| | Brenntag AG | 101,572 | 12,478 |
| ^ | Aixtron SE NA | 290,797 | 12,350 |
| ^ | Hochtief AG | 128,050 | 12,133 |
| | Wacker Chemie AG | 46,865 | 11,603 |
| ^ | Software AG | 60,839 | 11,515 |
| *,^ | MTU Aero Engines Holding AG | 149,572 | 11,450 |
| | Symrise AG | 340,263 | 11,200 |
| ^ | Hannover Rueckversicherung AG | 182,026 | 10,997 |
| ^ | Rheinmetall AG | 118,680 | 10,639 |
| * | Kabel Deutschland Holding AG | 164,056 | 10,248 |
| ^ | Bayerische Motoren Werke AG Prior Pfd. | 158,624 | 9,889 |
| | Salzgitter AG | 125,406 | 9,833 |
| ^ | Tognum AG | 255,373 | 9,788 |
| | Fraport AG Frankfurt Airport Services Worldwide | 109,403 | 8,737 |
| | Rhoen Klinikum AG | 374,047 | 8,556 |
| | Wincor Nixdorf AG | 98,381 | 8,131 |
| *,^ | SGL Carbon SE | 148,121 | 7,881 |
| | Stada Arzneimittel AG | 176,546 | 7,806 |
| | Axel Springer AG | 44,556 | 7,303 |
| * | Kloeckner & Co. SE | 200,644 | 7,204 |
| ^ | RWE AG Prior Pfd. | 117,401 | 7,141 |
| | United Internet AG | 364,860 | 7,138 |
27
| | | |
| Vanguard® Total International Stock Index Fund | | |
| Schedule of Investments | | |
| April 30, 2011 | | |
| |
| | | | Market |
| | | | Value |
| | | Shares | ($000) |
| | ProSiebenSat.1 Media AG Prior Pfd. | 231,389 | 6,631 |
| | Aurubis AG | 108,884 | 6,435 |
| | Suedzucker AG | 201,585 | 6,215 |
| ^ | Fuchs Petrolub AG Prior Pfd. | 36,212 | 5,930 |
| | Celesio AG | 234,360 | 5,693 |
| ^ | Wirecard AG | 294,863 | 5,629 |
| *,^ | TUI AG | 416,559 | 5,318 |
| | Puma AG Rudolf Dassler Sport | 15,917 | 5,305 |
| | Deutsche Euroshop AG | 126,409 | 5,107 |
| *,^ | Leoni AG | 87,101 | 4,796 |
| *,^ | Sky Deutschland AG | 1,088,838 | 4,784 |
| ^ | Hugo Boss AG Prior Pfd. | 46,585 | 4,620 |
| ^ | Solarworld AG | 263,529 | 4,217 |
| * | Aareal Bank AG | 138,906 | 4,211 |
| | Freenet AG | 325,400 | 4,138 |
| | ElringKlinger AG | 117,839 | 4,130 |
| * | Deutsche Wohnen AG | 252,475 | 3,974 |
| * | Dialog Semiconductor plc | 189,886 | 3,955 |
| | Fielmann AG | 36,989 | 3,934 |
| | Douglas Holding AG | 66,944 | 3,923 |
| | Pfeiffer Vacuum Technology AG | 28,203 | 3,917 |
| ^ | Gildemeister AG | 153,537 | 3,892 |
| | Gerresheimer AG | 78,362 | 3,788 |
| | Vossloh AG | 26,058 | 3,747 |
| ^ | Hamburger Hafen und Logistik AG | 75,856 | 3,681 |
| * | Krones AG | 42,014 | 3,399 |
| | Demag Cranes AG | 62,330 | 3,349 |
| | Daimler AG | 41,496 | 3,191 |
| * | Rational AG | 10,630 | 2,937 |
| | GFK SE | 50,609 | 2,878 |
| ^ | CTS Eventim AG | 37,100 | 2,781 |
| | Alstria Office REIT-AG | 171,162 | 2,719 |
| * | Heidelberger Druckmaschinen AG | 598,864 | 2,672 |
| ^ | Fuchs Petrolub AG | 18,422 | 2,667 |
| * | IVG Immobilien AG | 295,770 | 2,496 |
| | GAGFAH SA | 265,866 | 2,416 |
| | Jungheinrich AG Prior Pfd. | 50,844 | 2,333 |
| | Carl Zeiss Meditec AG | 101,636 | 2,212 |
| ^ | BayWa AG | 46,365 | 2,188 |
| | Praktiker Bau- und Heimwerkermaerkte Holding AG | 182,902 | 2,165 |
| ^ | Draegerwerk AG & Co. KGaA Prior Pfd. | 20,256 | 2,126 |
| * | KUKA AG | 75,814 | 2,066 |
| | Kontron AG | 159,703 | 1,966 |
| * | Morphosys AG | 65,651 | 1,931 |
| * | Stroer Out-of-Home Media AG | 56,422 | 1,840 |
| * | TAG Immobilien AG | 165,668 | 1,764 |
| * | Indus Holding AG | 51,803 | 1,712 |
| ^ | Delticom AG | 15,176 | 1,649 |
| *,^ | Nordex SE | 164,293 | 1,648 |
| *,^ | Centrotherm Photovoltaics AG | 27,210 | 1,646 |
| * | Deutz AG | 172,669 | 1,578 |
| *,^ | Balda AG | 117,948 | 1,572 |
| | KWS Saat AG | 6,580 | 1,502 |
| | Gerry Weber International AG | 22,954 | 1,494 |
| ^ | Grenkeleasing AG | 24,728 | 1,477 |
| *,^ | Drillisch AG | 128,781 | 1,456 |
| | MLP AG | 146,241 | 1,451 |
| *,^ | Asian Bamboo AG | 28,559 | 1,439 |
| *,^ | Q-Cells SE | 338,177 | 1,438 |
| | Bauer AG | 26,661 | 1,435 |
| *,^ | Roth & Rau AG | 41,739 | 1,431 |
| | Bechtle AG | 30,002 | 1,427 |
| *,^ | Wacker Neuson SE | 70,144 | 1,345 |
| ^ | Sartorius AG Prior Pfd. | 25,445 | 1,311 |
28
| | | |
| Vanguard® Total International Stock Index Fund | | |
| Schedule of Investments | | |
| April 30, 2011 | | |
| |
| | | | Market |
| | | | Value |
| | | Shares | ($000) |
| * | Evotec AG | 279,864 | 1,264 |
| *,^ | Comdirect Bank AG | 101,027 | 1,253 |
| * | Sto AG Prior Pfd. | 7,282 | 1,219 |
| | H&R WASAG AG | 38,539 | 1,207 |
| | Sixt AG | 21,211 | 1,069 |
| | Deutsche Beteiligungs AG | 35,205 | 1,033 |
| * | Sixt AG Prior Pfd. | 25,010 | 1,011 |
| * | Jenoptik AG | 122,660 | 1,007 |
| *,^ | Biotest AG Prior Pfd. | 14,667 | 986 |
| ^ | Takkt AG | 56,426 | 971 |
| | DIC Asset AG | 65,381 | 880 |
| *,^ | Solar Millennium AG | 28,667 | 878 |
| | Stratec Biomedical Systems AG | 19,237 | 867 |
| *,^ | Duerr AG | 22,245 | 867 |
| ^ | PSI AG Gesellschaft Fuer Produkte und Systeme der Informationstechnologie | 28,861 | 857 |
| | Bertrandt AG | 11,610 | 850 |
| * | Grammer AG | 30,087 | 841 |
| * | CENTROTEC Sustainable AG | 23,923 | 838 |
| * | ADVA AG Optical Networking | 107,102 | 832 |
| * | QSC AG | 217,870 | 829 |
| *,^ | Singulus Technologies AG | 111,428 | 784 |
| | Medion AG | 54,074 | 779 |
| * | VTG AG | 30,355 | 775 |
| ^ | Draegerwerk AG & Co. KGaA | 8,718 | 747 |
| | Gesco AG | 8,057 | 685 |
| *,^ | Biotest AG | 9,337 | 660 |
| ^ | Phoenix Solar AG | 20,079 | 648 |
| * | Homag Group AG | 26,658 | 645 |
| * | XING AG | 9,038 | 642 |
| * | Nemetschek AG | 13,411 | 632 |
| * | Cewe Color Holding AG | 12,665 | 615 |
| * | Patrizia Immobilien AG | 74,721 | 558 |
| * | Tipp24 SE | 11,445 | 550 |
| | CAT Oil AG | 41,536 | 511 |
| * | Air Berlin plc | 109,583 | 490 |
| | CropEnergies AG | 59,855 | 483 |
| | KSB AG | 508 | 453 |
| * | Manz Automation AG | 6,427 | 450 |
| * | Constantin Medien AG | 146,557 | 449 |
| * | DAB Bank AG | 54,063 | 347 |
| * | Verbio AG | 54,229 | 340 |
| *,^ | Colonia Real Estate AG | 40,511 | 311 |
| * | R Stahl AG | 6,560 | 301 |
| ^ | OHB Technology AG | 15,036 | 285 |
| *,^ | Conergy AG | 399,659 | 231 |
| * | Zhongde Waste Technology AG | 16,785 | 224 |
| *,^ | Loewe AG | 22,670 | 211 |
| * | Envitec Biogas AG | 10,278 | 158 |
| * | Daldrup & Soehne AG | 4,676 | 141 |
| *,^ | Pfleiderer AG | 95,260 | 99 |
| | | | 3,594,243 |
| Greece (0.2%) | | |
| | National Bank of Greece SA | 2,734,164 | 21,142 |
| | Coca Cola Hellenic Bottling Co. SA | 548,725 | 15,174 |
| | OPAP SA | 677,971 | 14,355 |
| | Bank of Cyprus plc | 2,588,449 | 9,439 |
| * | Alpha Bank AE | 1,530,243 | 8,921 |
| | Hellenic Telecommunications Organization SA | 523,594 | 6,210 |
| | Public Power Corp. SA | 349,846 | 5,789 |
| * | Piraeus Bank SA | 3,431,982 | 5,587 |
| * | EFG Eurobank Ergasias SA | 976,286 | 5,495 |
| | Titan Cement Co. SA | 166,879 | 4,450 |
| | Marfin Popular Bank PCL | 3,188,176 | 3,871 |
| | Hellenic Petroleum SA | 270,665 | 2,884 |
29
| | | |
| Vanguard® Total International Stock Index Fund | | |
| Schedule of Investments | | |
| April 30, 2011 | | |
| |
| | | | Market |
| | | | Value |
| | | Shares | ($000) |
| | Hellenic Telecommunications Organization SA ADR | 420,742 | 2,461 |
| | JUMBO SA | 270,998 | 2,184 |
| * | TT Hellenic Postbank SA | 464,713 | 1,997 |
| | Marfin Investment Group SA | 1,829,316 | 1,923 |
| | Motor Oil Hellas Corinth Refineries SA | 141,611 | 1,878 |
| * | Folli Follie Group | 97,511 | 1,841 |
| * | Mytilineos Holdings SA | 228,137 | 1,817 |
| | Ellaktor SA | 393,917 | 1,785 |
| * | Viohalco | 289,512 | 1,716 |
| | Hellenic Exchanges SA | 181,039 | 1,447 |
| | Frigoglass SA | 68,919 | 1,169 |
| | Intralot SA-Integrated Lottery Systems & Services | 315,162 | 1,125 |
| | National Bank of Greece SA ADR | 677,582 | 1,077 |
| | Metka SA | 74,219 | 994 |
| | Fourlis Holdings SA | 108,853 | 896 |
| | Athens Water Supply & Sewage Co. SA | 91,291 | 714 |
| | GEK Terna Holding Real Estate Construction SA | 184,045 | 668 |
| * | Geniki Bank | 262,913 | 489 |
| * | Piraeus Port Authority | 21,830 | 475 |
| | Eurobank Properties Real Estate Investment Co. | 50,776 | 451 |
| * | Agricultural Bank of Greece | 644,783 | 439 |
| | Terna Energy SA | 94,502 | 434 |
| * | Sidenor Steel Products Manufacturing Co. SA | 91,272 | 368 |
| * | Attica Bank | 225,789 | 291 |
| | Diagnostic & Therapeutic Center of Athens Hygeia SA | 305,499 | 196 |
| | Aegean Airlines SA | 61,218 | 178 |
| | Thessaloniki Water Supply & Sewage Co. SA | 23,335 | 162 |
| * | Forthnet SA | 194,032 | 132 |
| | Alapis Holding Industrial and Commercial SA | 490,328 | 131 |
| * | J&P-Avax SA | 77,324 | 125 |
| | | | 132,880 |
| Hong Kong (1.9%) | | |
| * | AIA Group Ltd. | 23,525,917 | 79,341 |
| | Hutchison Whampoa Ltd. | 6,409,000 | 73,297 |
| | Hong Kong Exchanges and Clearing Ltd. | 3,080,000 | 70,434 |
| | Sun Hung Kai Properties Ltd. | 4,249,000 | 66,550 |
| | Cheung Kong Holdings Ltd. | 4,178,000 | 65,939 |
| | CLP Holdings Ltd. | 5,802,500 | 47,727 |
| | Li & Fung Ltd. | 8,452,000 | 43,256 |
| | Hang Seng Bank Ltd. | 2,303,700 | 36,007 |
| | Swire Pacific Ltd. Class A | 2,315,000 | 35,432 |
| | BOC Hong Kong Holdings Ltd. | 11,104,500 | 34,907 |
| | Wharf Holdings Ltd. | 4,563,700 | 33,490 |
| | Hang Lung Properties Ltd. | 7,394,000 | 32,971 |
| | Hong Kong & China Gas Co. Ltd. | 12,948,800 | 32,160 |
| | Power Assets Holdings Ltd. | 4,163,000 | 29,152 |
| | Henderson Land Development Co. Ltd. | 3,285,000 | 22,547 |
| | Link REIT | 6,654,500 | 20,973 |
| * | Sands China Ltd. | 7,271,000 | 20,431 |
| | Bank of East Asia Ltd. | 4,591,420 | 19,010 |
| | Wynn Macau Ltd. | 4,680,000 | 16,702 |
| | Hang Lung Group Ltd. | 2,443,000 | 16,462 |
| | MTR Corp. | 4,360,000 | 15,920 |
| | Esprit Holdings Ltd. | 3,471,969 | 14,490 |
| | Sino Land Co. Ltd. | 7,840,000 | 13,826 |
| | New World Development Ltd. | 7,662,000 | 13,484 |
| | Shangri-La Asia Ltd. | 4,259,500 | 11,892 |
| | Kerry Properties Ltd. | 2,179,500 | 11,654 |
| | Wheelock & Co. Ltd. | 2,766,000 | 11,422 |
| | SJM Holdings Ltd. | 4,860,000 | 10,501 |
| | Cathay Pacific Airways Ltd. | 3,587,000 | 8,963 |
| | Hysan Development Co. Ltd. | 1,899,000 | 8,879 |
| | ASM Pacific Technology Ltd. | 592,100 | 7,976 |
| | Yue Yuen Industrial Holdings Ltd. | 2,212,000 | 7,642 |
30
| | | |
| Vanguard® Total International Stock Index Fund | | |
| Schedule of Investments | | |
| April 30, 2011 | | |
| |
| | | | Market |
| | | | Value |
| | | Shares | ($000) |
| | Cheung Kong Infrastructure Holdings Ltd. | 1,350,000 | 6,586 |
| | First Pacific Co. Ltd. | 6,532,000 | 6,153 |
| | Wing Hang Bank Ltd. | 529,000 | 5,897 |
| | NWS Holdings Ltd. | 3,963,886 | 5,846 |
| | Xinyi Glass Holdings Ltd. | 4,786,000 | 5,780 |
| | AAC Acoustic Technologies Holdings Inc. | 2,050,000 | 5,369 |
| | Hopewell Holdings Ltd. | 1,735,000 | 5,246 |
| ^ | VTech Holdings Ltd. | 456,800 | 5,217 |
| | Lifestyle International Holdings Ltd. | 1,790,500 | 5,130 |
| | Television Broadcasts Ltd. | 867,000 | 5,097 |
| | Orient Overseas International Ltd. | 655,000 | 5,027 |
| | PCCW Ltd. | 12,083,000 | 4,798 |
| ^ | Techtronic Industries Co. | 3,382,000 | 4,625 |
| ^ | Champion REIT | 7,572,000 | 4,390 |
| *,^ | Foxconn International Holdings Ltd. | 6,549,000 | 3,871 |
| | Hongkong & Shanghai Hotels | 2,016,000 | 3,556 |
| | Luk Fook Holdings International Ltd. | 878,000 | 3,256 |
| | Pacific Basin Shipping Ltd. | 5,186,000 | 3,225 |
| | Giordano International Ltd. | 4,390,000 | 3,171 |
| | Johnson Electric Holdings Ltd. | 5,140,000 | 3,158 |
| | Trinity Ltd. | 2,880,000 | 3,117 |
| | Great Eagle Holdings Ltd. | 822,000 | 2,927 |
| * | G-Resources Group Ltd. | 37,404,000 | 2,894 |
| | Dah Chong Hong Holdings Ltd. | 2,478,000 | 2,837 |
| | Brightoil Petroleum Holdings Ltd. | 5,971,000 | 2,634 |
| * | Mongolia Energy Corp. Ltd. | 10,666,000 | 2,514 |
| | Dah Sing Financial Holdings Ltd. | 390,000 | 2,445 |
| | Chow Sang Sang Holdings International Ltd. | 851,000 | 2,337 |
| | Cafe de Coral Holdings Ltd. | 966,000 | 2,248 |
| *,^ | United Laboratories International Holdings Ltd. | 1,198,000 | 2,023 |
| | Vitasoy International Holdings Ltd. | 2,308,000 | 1,984 |
| ^ | Melco International Development Ltd. | 2,319,000 | 1,973 |
| | Texwinca Holdings Ltd. | 1,708,000 | 1,927 |
| | Hong Kong Aircraft Engineering Co. Ltd. | 125,600 | 1,860 |
| ^ | SmarTone Telecommunications Holding Ltd. | 1,198,000 | 1,856 |
| | Stella International Holdings Ltd. | 814,000 | 1,849 |
| | Shun Tak Holdings Ltd. | 2,958,000 | 1,848 |
| * | Singamas Container Holdings Ltd. | 3,950,000 | 1,811 |
| ^ | SA SA International Holdings Ltd. | 2,944,000 | 1,766 |
| | Dah Sing Banking Group Ltd. | 1,086,400 | 1,758 |
| | Value Partners Group Ltd. | 1,943,000 | 1,752 |
| | Hutchison Telecommunications Hong Kong Holdings Ltd. | 4,820,000 | 1,523 |
| | EVA Precision Industrial Holdings Ltd. | 1,680,000 | 1,443 |
| * | Golden Resorts Group Ltd. | 9,298,000 | 1,427 |
| | Shui On Construction and Materials Ltd. | 1,038,000 | 1,396 |
| | Man Wah Holdings Ltd. | 1,110,000 | 1,376 |
| | Midland Holdings Ltd. | 1,726,000 | 1,337 |
| ^ | K Wah International Holdings Ltd. | 3,269,000 | 1,300 |
| | Kowloon Development Co. Ltd. | 983,000 | 1,293 |
| | Sunlight Real Estate Investment Trust | 3,524,000 | 1,144 |
| ^ | Emperor Watch & Jewellery Ltd. | 7,380,000 | 1,068 |
| * | Apollo Solar Energy Technology Holdings Ltd. | 14,204,000 | 1,010 |
| * | China WindPower Group Ltd. | 9,360,000 | 977 |
| | Silver base Group Holdings Ltd. | 1,151,000 | 950 |
| * | Regal Real Estate Investment Trust | 2,773,000 | 947 |
| * | China Daye Non-Ferrous Metals Mining Ltd. | 11,944,000 | 941 |
| | IT Ltd. | 1,150,000 | 928 |
| | Pacific Textile Holdings Ltd. | 1,429,000 | 927 |
| | HKR International Ltd. | 1,538,400 | 899 |
| *,^ | King Stone Energy Group Ltd. | 37,100,000 | 893 |
| | TAI Cheung Holdings | 1,143,000 | 862 |
| ^ | Mingfa Group International Co. Ltd. | 2,549,000 | 850 |
| * | Titan Petrochemicals Group Ltd. | 10,180,000 | 840 |
| | Prosperity REIT | 3,458,000 | 833 |
31
| | | |
| Vanguard® Total International Stock Index Fund | | |
| Schedule of Investments | | |
| April 30, 2011 | | |
| |
| | | | Market |
| | | | Value |
| | | Shares | ($000) |
| * | eSun Holdings Ltd. | 2,308,000 | 828 |
| | Far East Consortium | 3,320,000 | 818 |
| | Get Nice Holdings Ltd. | 10,764,000 | 806 |
| | Lee & Man Holding Ltd. | 650,000 | 793 |
| | Chong Hing Bank Ltd. | 310,000 | 793 |
| ^ | Regal Hotels International Holdings Ltd. | 1,734,000 | 780 |
| ^ | Citic Telecom International Holdings Ltd. | 2,728,000 | 778 |
| | Emperor International Holdings | 3,431,333 | 748 |
| * | Thunder Sky Battery Ltd. | 8,960,000 | 741 |
| ^ | City Telecom HK Ltd. | 981,000 | 738 |
| *,^ | Fook Woo Group Holdings Ltd. | 2,310,000 | 719 |
| | Glorious Sun Enterprises Ltd. | 1,496,000 | 613 |
| | Public Financial Holdings Ltd. | 938,000 | 586 |
| | Liu Chong Hing Investment | 416,000 | 586 |
| | Pearl Oriental Innovation Ltd. | 3,535,000 | 574 |
| | Pacific Andes International Holdings Ltd. | 3,504,000 | 574 |
| | Hutchison Harbour Ring Ltd. | 4,950,000 | 568 |
| * | CK Life Sciences International Holdings Inc. | 8,230,000 | 562 |
| | Fubon Bank Hong Kong Ltd. | 838,000 | 554 |
| | Dickson Concepts International Ltd. | 698,000 | 552 |
| * | Lai Sun Development | 15,636,000 | 535 |
| ^ | Guotai Junan International Holdings Ltd. | 1,168,000 | 535 |
| ^ | Victory City International Holdings Ltd. | 2,376,000 | 531 |
| * | Tom Group Ltd. | 4,450,000 | 527 |
| | Newocean Energy Holdings Ltd. | 2,610,000 | 512 |
| * | China Properties Group Ltd. | 1,537,000 | 486 |
| | Pico Far East Holdings Ltd. | 2,464,000 | 483 |
| * | Polytec Asset Holdings Ltd. | 3,175,000 | 479 |
| * | Burwill Holdings Ltd. | 8,150,000 | 478 |
| * | Neo Telemedia Ltd. | 34,000,000 | 461 |
| | Pacific Century Premium Developments Ltd. | 2,411,000 | 460 |
| * | Natural Beauty Bio-Technology Ltd. | 1,860,000 | 460 |
| | Costin New Materials Group Ltd. | 663,000 | 432 |
| ^ | Bonjour Holdings Ltd. | 2,440,000 | 425 |
| *,^ | China Energy Development Holdings Ltd. | 11,430,000 | 420 |
| | Chen Hsong Holdings | 720,000 | 406 |
| * | Apac Resources Ltd. | 6,960,000 | 404 |
| * | Paliburg Holdings Ltd. | 1,022,000 | 402 |
| | Haitong International Securities Group Ltd. | 608,000 | 400 |
| * | VST Holdings Ltd. | 1,390,000 | 397 |
| | SUNeVision Holdings Ltd. | 3,231,000 | 387 |
| | Regent Pacific Group Ltd. | 9,190,000 | 384 |
| *,^ | Sino-Tech International Holdings Ltd. | 17,290,000 | 381 |
| *,^ | Theme International Holdings Ltd. | 4,200,000 | 378 |
| *,^ | Richfield Group Holdings Ltd. | 3,680,000 | 366 |
| * | Zhuguang Holdings Group Co. Ltd. | 1,616,000 | 364 |
| * | First Shanghai Investments Ltd. | 2,632,000 | 363 |
| * | Shenyin Wanguo HK Ltd. | 790,000 | 347 |
| ^ | Neo-Neon Holdings Ltd. | 856,000 | 314 |
| | Sing Tao News Corp. Ltd. | 1,026,000 | 309 |
| * | Rising Development Holdings Ltd. | 1,392,000 | 290 |
| * | China Ting Group Holdings Ltd. | 1,962,000 | 281 |
| * | Next Media Ltd. | 2,036,000 | 252 |
| * | Century City International Holdings Ltd. | 3,248,000 | 251 |
| | iOne Holdings Ltd. | 7,600,000 | 232 |
| * | Oriental Press Group | 1,474,000 | 198 |
| * | Win Hanverky Holdings Ltd. | 1,394,000 | 185 |
| * | Wai Chun Mining Industry Group Co. Ltd. | 8,990,000 | 179 |
| * | Artel Solutions Group Holdings Ltd. | 3,620,000 | 140 |
| * | Hannstar Board International Holdings Ltd. | 1,132,000 | 124 |
| | Luks Group Vietnam Holdings Co. Ltd. | 382,000 | 123 |
| * | Kingboard Chemical Holdings Ltd. Warrants Exp. 10/31/2012 | 117,650 | 98 |
| *,^ | RCG Holdings Ltd. | 361,000 | 98 |
32
| | | |
| Vanguard® Total International Stock Index Fund | | |
| Schedule of Investments | | |
| April 30, 2011 | | |
| |
| | | | Market |
| | | | Value |
| | | Shares | ($000) |
| * | Henderson Land Development Co. Ltd. Warrants Exp. 06/01/2011 | 428,800 | 12 |
| | | | 1,129,359 |
| Hungary (0.1%) | | |
| * | OTP Bank plc | 717,800 | 25,484 |
| * | MOL Hungarian Oil and Gas plc | 126,339 | 17,657 |
| | Richter Gedeon Nyrt | 42,049 | 8,799 |
| | Magyar Telekom Telecommunications plc | 1,439,813 | 4,913 |
| * | Egis Gyogyszergyar Nyrt | 10,621 | 1,165 |
| *,^ | FHB Mortgage Bank plc | 63,849 | 371 |
| * | Fotex Holding SE | 78,093 | 173 |
| | | | 58,562 |
| India (1.8%) | | |
| | Infosys Technologies Ltd. | 1,383,408 | 90,947 |
| | Reliance Industries Ltd. | 3,944,163 | 87,708 |
| | Housing Development Finance Corp. | 3,255,468 | 52,079 |
| | ICICI Bank Ltd. | 1,876,880 | 47,431 |
| | Tata Consultancy Services Ltd. | 1,413,854 | 37,284 |
| | HDFC Bank Ltd. | 600,593 | 31,183 |
| | ITC Ltd. | 6,725,681 | 29,315 |
| | Larsen & Toubro Ltd. | 621,090 | 22,442 |
| | Tata Motors Ltd. | 785,917 | 22,004 |
| | Axis Bank Ltd. | 620,359 | 18,067 |
| | Hindustan Unilever Ltd. | 2,633,686 | 16,998 |
| | Jindal Steel & Power Ltd. | 1,129,280 | 16,756 |
| | Sterlite Industries India Ltd. | 4,035,329 | 16,629 |
| | Hindalco Industries Ltd. | 3,362,780 | 16,462 |
| | Bharat Heavy Electricals Ltd. | 356,325 | 16,141 |
| | Oil & Natural Gas Corp. Ltd. | 2,310,959 | 16,111 |
| | Mahindra & Mahindra Ltd. | 810,256 | 13,879 |
| | ICICI Bank Ltd. ADR | 271,355 | 13,676 |
| | HDFC Bank Ltd. ADR | 79,203 | 13,631 |
| | Coal India Ltd. | 1,531,220 | 13,197 |
| | Tata Steel Ltd. | 925,747 | 12,937 |
| | GAIL India Ltd. | 1,145,620 | 12,331 |
| | NTPC Ltd. | 2,734,946 | 11,281 |
| | Wipro Ltd. | 1,108,259 | 11,277 |
| | State Bank of India | 157,294 | 9,995 |
| | Adani Enterprises Ltd. | 702,728 | 9,953 |
| | Sun Pharmaceutical Industries Ltd. | 941,889 | 9,933 |
| | Infrastructure Development Finance Co. Ltd. | 2,882,184 | 9,493 |
| | Hero Honda Motors Ltd. | 243,610 | 9,425 |
| * | Cairn India Ltd. | 1,132,231 | 8,946 |
| | Bajaj Auto Ltd. | 264,518 | 8,835 |
| | Tata Power Co. Ltd. | 293,232 | 8,658 |
| | Power Grid Corp. of India Ltd. | 3,390,645 | 8,023 |
| | Kotak Mahindra Bank Ltd. | 819,921 | 7,984 |
| | Sesa Goa Ltd. | 1,034,772 | 7,364 |
| | Cipla Ltd. | 991,360 | 6,949 |
| | Dr Reddy's Laboratories Ltd. | 182,401 | 6,903 |
| | Ambuja Cements Ltd. | 1,862,443 | 6,674 |
| | Maruti Suzuki India Ltd. | 209,094 | 6,242 |
| | DLF Ltd. | 1,221,303 | 6,161 |
| | Jaiprakash Associates Ltd. | 2,913,775 | 6,117 |
| | HCL Technologies Ltd. | 492,590 | 5,816 |
| | United Spirits Ltd. | 245,458 | 5,758 |
| | JSW Steel Ltd. | 265,877 | 5,709 |
| | Ultratech Cement Ltd. | 209,857 | 5,176 |
| * | Reliance Power Ltd. | 1,716,933 | 5,078 |
| | Reliance Infrastructure Ltd. | 338,241 | 5,057 |
| | Steel Authority of India Ltd. | 1,390,813 | 5,024 |
| ^ | Wipro Ltd. ADR | 364,693 | 5,022 |
| | Rural Electrification Corp. Ltd. | 908,655 | 4,910 |
| | Dr Reddy's Laboratories Ltd. ADR | 124,619 | 4,890 |
| | Lupin Ltd. | 455,420 | 4,546 |
33
| | | |
| Vanguard® Total International Stock Index Fund | | |
| Schedule of Investments | | |
| April 30, 2011 | | |
| |
| | | | Market |
| | | | Value |
| | | Shares | ($000) |
| | LIC Housing Finance Ltd. | 868,368 | 4,317 |
| | Zee Entertainment Enterprises Ltd. | 1,386,185 | 4,229 |
| | ACC Ltd. | 162,480 | 4,093 |
| | Siemens India Ltd. | 204,091 | 4,002 |
| | Bharat Petroleum Corp. Ltd. | 269,025 | 3,834 |
| | Canara Bank | 266,399 | 3,812 |
| | Reliance Capital Ltd. | 292,004 | 3,725 |
| | Reliance Communications Ltd. | 1,609,310 | 3,645 |
| | Federal Bank Ltd. | 364,089 | 3,462 |
| | Ranbaxy Laboratories Ltd. | 324,022 | 3,358 |
| | Unitech Ltd. | 3,725,675 | 3,120 |
| * | Satyam Computer Services Ltd. | 1,749,201 | 2,983 |
| | IndusInd Bank Ltd. | 494,148 | 2,909 |
| * | Indiabulls Real Estate Ltd. | 1,006,385 | 2,847 |
| | Indiabulls Financial Services Ltd. | 643,059 | 2,596 |
| * | GMR Infrastructure Ltd. | 3,013,224 | 2,582 |
| * | Suzlon Energy Ltd. | 2,085,045 | 2,507 |
| | Piramal Healthcare Ltd. | 237,784 | 2,471 |
| | United Phosphorus Ltd. | 693,465 | 2,375 |
| | Bharat Forge Ltd. | 296,222 | 2,333 |
| | State Bank of India GDR | 16,639 | 2,283 |
| | Aditya Birla Nuvo Ltd. | 111,130 | 2,183 |
| | Tata Global Beverages Ltd. | 948,146 | 2,163 |
| | Sintex Industries Ltd. | 529,863 | 2,083 |
| | Patni Computer Systems Ltd. | 208,625 | 2,020 |
| * | Housing Development & Infrastructure Ltd. | 541,783 | 1,975 |
| | Apollo Hospitals Enterprise Ltd. | 173,030 | 1,859 |
| | Mahindra & Mahindra Financial Services Ltd. | 108,366 | 1,797 |
| | Indian Hotels Co. Ltd. | 939,062 | 1,756 |
| | Aurobindo Pharma Ltd. | 381,733 | 1,682 |
| | Bajaj Holdings and Investment Ltd. | 92,396 | 1,642 |
| | Motherson Sumi Systems Ltd. | 307,075 | 1,603 |
| | Bajaj Finserv Ltd. | 133,199 | 1,595 |
| | Shree Renuka Sugars Ltd. | 989,952 | 1,580 |
| | IFCI Ltd. | 1,338,186 | 1,574 |
| | Educomp Solutions Ltd. | 144,249 | 1,560 |
| | Opto Circuits India Ltd. | 224,300 | 1,532 |
| * | Dish TV India Ltd. | 973,630 | 1,500 |
| | Jindal Saw Ltd. | 320,750 | 1,457 |
| * | ING Vysya Bank Ltd. | 180,494 | 1,414 |
| | Marico Ltd. | 438,576 | 1,394 |
| | NCC Ltd. | 593,283 | 1,375 |
| * | MAX India Ltd. | 350,204 | 1,329 |
| | India Cements Ltd. | 574,827 | 1,294 |
| | Bombay Rayon Fashions Ltd. | 196,114 | 1,293 |
| * | GVK Power & Infrastructure Ltd. | 2,354,823 | 1,291 |
| | Pidilite Industries Ltd. | 360,224 | 1,283 |
| | IVRCL Ltd. | 712,193 | 1,278 |
| | Indian Overseas Bank | 366,656 | 1,266 |
| | Financial Technologies India Ltd. | 63,975 | 1,250 |
| | Areva T&D India Ltd. | 194,127 | 1,227 |
| | CESC Ltd. | 170,012 | 1,187 |
| | Biocon Ltd. | 139,271 | 1,164 |
| | Jammu & Kashmir Bank Ltd. | 63,298 | 1,157 |
| | Amtek Auto Ltd. | 308,243 | 1,140 |
| | PTC India Ltd. | 544,741 | 1,101 |
| | Gujarat NRE Coke Ltd. | 944,054 | 1,076 |
| | Voltas Ltd. | 285,043 | 1,067 |
| | IRB Infrastructure Developers Ltd. | 267,440 | 1,066 |
| | Welspun Corp. Ltd. | 240,462 | 1,044 |
| | Great Eastern Shipping Co. Ltd. | 155,946 | 1,005 |
| | Syndicate Bank | 370,120 | 979 |
| | McLeod Russel India Ltd. | 156,798 | 937 |
| * | Videocon Industries Ltd. | 205,484 | 921 |
34
| | | |
| Vanguard® Total International Stock Index Fund | | |
| Schedule of Investments | | |
| April 30, 2011 | | |
| |
| | | | Market |
| | | | Value |
| | | Shares | ($000) |
| | Shree Cement Ltd. | 20,062 | 913 |
| | Strides Arcolab Ltd. | 100,710 | 881 |
| | Andhra Bank | 276,302 | 869 |
| | Gujarat State Petronet Ltd. | 381,452 | 851 |
| * | Manappuram General Finance & Leasing Ltd. | 282,493 | 850 |
| * | Ispat Industries Ltd. | 1,641,573 | 843 |
| | Hexaware Technologies Ltd. | 536,966 | 840 |
| | Emami Ltd. | 89,406 | 839 |
| | UCO Bank | 347,285 | 822 |
| | EID Parry India Ltd. | 152,587 | 817 |
| * | Fortis Healthcare India Ltd. | 231,052 | 812 |
| | South Indian Bank Ltd. | 1,577,289 | 812 |
| | Monnet Ispat & Energy Ltd. | 67,882 | 806 |
| | Rolta India Ltd. | 252,626 | 789 |
| | Hindustan Construction Co. | 985,122 | 788 |
| | GTL Ltd. | 83,258 | 787 |
| | Punj Lloyd Ltd. | 516,076 | 779 |
| | HCL Infosystems Ltd. | 306,285 | 770 |
| | Gujarat Gas Co. Ltd. | 90,963 | 757 |
| | Havells India Ltd. | 83,783 | 753 |
| | Cox & Kings Ltd. | 79,214 | 749 |
| * | Pipavav Shipyard Ltd. | 379,302 | 744 |
| | EIH Ltd. | 367,137 | 717 |
| * | Jubilant Foodworks Ltd. | 42,698 | 714 |
| | Indraprastha Gas Ltd. | 95,709 | 697 |
| | Redington India Ltd. | 346,194 | 691 |
| | India Infoline Ltd. | 413,149 | 674 |
| | Phoenix Mills Ltd. | 145,069 | 673 |
| | Karnataka Bank Ltd. | 261,954 | 672 |
| | Dewan Housing Finance Corp. Ltd. | 118,634 | 672 |
| | Gujarat Mineral Development Corp. Ltd. | 210,887 | 668 |
| | Karur Vysya Bank Ltd. | 71,867 | 668 |
| | Alok Industries Ltd. | 1,099,570 | 664 |
| | Pfizer Ltd. | 20,625 | 638 |
| | Alstom Projects India Ltd. | 45,450 | 634 |
| | Ruchi Soya Industries Ltd. | 271,175 | 634 |
| | Sobha Developers Ltd. | 97,766 | 632 |
| | Nirma Ltd. | 108,795 | 629 |
| | Jagran Prakashan Ltd. | 221,784 | 626 |
| * | Balrampur Chini Mills Ltd. | 369,329 | 623 |
| | Core Projects & Technologies Ltd. | 85,505 | 593 |
| | Ipca Laboratories Ltd. | 85,489 | 586 |
| | Bayer CropScience Ltd. | 27,200 | 586 |
| | Anant Raj Industries Ltd. | 294,201 | 585 |
| | Tube Investments Of India | 181,597 | 578 |
| | AIA Engineering Ltd. | 69,415 | 573 |
| | Maharashtra Seamless Ltd. | 69,574 | 567 |
| * | Raymond Ltd. | 70,153 | 560 |
| * | Shopper's Stop Ltd. | 69,205 | 551 |
| * | KSK Energy Ventures Ltd. | 212,285 | 545 |
| | Eicher Motors Ltd. | 19,222 | 544 |
| | Chambal Fertilizers & Chemicals Ltd. | 276,147 | 534 |
| * | S Kumars Nationwide Ltd. | 340,267 | 526 |
| | Gujarat Fluorochemicals | 62,775 | 526 |
| | SKF India Ltd. | 36,543 | 526 |
| * | SKS Microfinance Ltd. | 51,013 | 524 |
| | Century Textile & Industries Ltd. | 64,293 | 524 |
| * | UTV Software Communications Ltd. | 35,737 | 523 |
| * | Jet Airways India Ltd. | 47,718 | 517 |
| | Blue Star Ltd. | 61,674 | 514 |
| * | Infotech Enterprises Ltd. | 141,024 | 511 |
| | State Bank of Bikaner & Jaipur | 40,983 | 510 |
| | Berger Paints India Ltd. | 237,323 | 504 |
| * | Uttam Galva Steels Ltd. | 186,236 | 498 |
35
| | | |
| Vanguard® Total International Stock Index Fund | | |
| Schedule of Investments | | |
| April 30, 2011 | | |
| |
| | | | Market |
| | | | Value |
| | | Shares | ($000) |
| | Orissa Minerals Development Co. Ltd. | 397 | 498 |
| * | Arvind Ltd. | 298,274 | 497 |
| | Bajaj Finance Ltd. | 31,096 | 493 |
| | Gitanjali Gems Ltd. | 81,509 | 493 |
| | Usha Martin Ltd. | 332,841 | 491 |
| * | Mahanagar Telephone Nigam | 448,634 | 490 |
| * | Sujana Towers Ltd. | 561,895 | 487 |
| | Dena Bank | 205,970 | 486 |
| | Lakshmi Machine Works Ltd. | 8,644 | 480 |
| | State Bank of Travancore | 27,083 | 476 |
| | Nava Bharat Ventures Ltd. | 85,032 | 472 |
| | MRF Ltd. | 2,915 | 470 |
| * | BF Utilities Ltd. | 24,986 | 470 |
| | Orchid Chemicals & Pharmaceuticals Ltd. | 68,152 | 467 |
| * | Wockhardt Ltd. | 60,362 | 467 |
| | CMC Ltd. | 10,023 | 462 |
| | Gujarat State Fertilisers & Chemicals Ltd. | 54,479 | 460 |
| * | GTL Infrastructure Ltd. | 559,641 | 459 |
| * | Whirlpool of India Ltd. | 71,869 | 457 |
| | Vijaya Bank | 239,735 | 451 |
| | BEML Ltd. | 28,429 | 447 |
| * | Rallis India Ltd. | 13,219 | 446 |
| * | Tata Teleservices Maharashtra Ltd. | 1,063,364 | 446 |
| | Tulip Telecom Ltd. | 124,890 | 442 |
| | Jubilant Life Sciences Ltd. | 108,394 | 442 |
| | Ballarpur Industries Ltd. | 563,279 | 440 |
| | Gammon India Ltd. | 169,161 | 440 |
| | Sundaram Finance Ltd. | 36,443 | 437 |
| | Escorts Ltd. | 139,878 | 435 |
| | Unichem Laboratories Ltd. | 98,237 | 426 |
| | Bajaj Electricals Ltd. | 68,698 | 420 |
| | SREI Infrastructure Finance Ltd. | 358,410 | 419 |
| | Triveni Engineering & Industries Ltd. | 177,416 | 418 |
| | TVS Motor Co. Ltd. | 325,793 | 416 |
| | Aban Offshore Ltd. | 28,848 | 413 |
| | Bata India Ltd. | 42,658 | 413 |
| | Hindustan Oil Exploration Co. Ltd. | 86,584 | 413 |
| | REI Agro Ltd. | 684,313 | 410 |
| | Kwality Dairy India Ltd. | 120,290 | 405 |
| | TTK Prestige Ltd. | 7,507 | 403 |
| | Jai Corp. Ltd. | 101,667 | 401 |
| * | Hathway Cables and Datacom Ltd. | 143,463 | 401 |
| * | Birla Corp. Ltd. | 48,851 | 393 |
| * | Himachal Futuristic Communications | 876,717 | 390 |
| | Novartis India Ltd. | 23,220 | 389 |
| * | Development Credit Bank Ltd. | 288,897 | 388 |
| | Gateway Distriparks Ltd. | 139,428 | 384 |
| | KS Oils Ltd. | 504,548 | 380 |
| | Edelweiss Capital Ltd. | 447,774 | 375 |
| | Sterling Biotech Ltd. | 178,169 | 373 |
| | Bajaj Hindusthan Ltd. | 218,706 | 372 |
| * | Dhanlaxmi Bank Ltd. | 129,936 | 369 |
| * | IBN18 Broadcast Ltd. | 169,933 | 365 |
| | Prism Cement Ltd. | 286,759 | 364 |
| | Tata Investment Corp. Ltd. | 30,275 | 363 |
| | Greaves Cotton Ltd. | 169,824 | 360 |
| | Everonn Education Ltd. | 24,457 | 356 |
| | Sterlite Technologies Ltd. | 249,505 | 347 |
| | Madras Cements Ltd. | 154,316 | 346 |
| | Geodesic Ltd. | 183,928 | 345 |
| | Mercator Lines Ltd. | 370,865 | 344 |
| | Peninsula Land Ltd. | 260,472 | 339 |
| * | KPIT Cummins Infosystems Ltd. | 89,406 | 332 |
| * | BASF India Ltd. | 23,396 | 330 |
36
| | | |
| Vanguard® Total International Stock Index Fund | | |
| Schedule of Investments | | |
| April 30, 2011 | | |
| |
| | | | Market |
| | | | Value |
| | | Shares | ($000) |
| * | Sun Pharma Advanced Research Co. Ltd. | 167,399 | 329 |
| | KEC International Ltd. | 170,144 | 327 |
| * | Polaris Software Lab Ltd. | 72,774 | 325 |
| | Clariant Chemicals India Ltd. | 19,759 | 325 |
| | SRF Ltd. | 42,666 | 323 |
| | Amtek India Ltd. | 156,085 | 323 |
| | Abbott India Ltd. | 9,074 | 323 |
| | Great Offshore Ltd. | 51,967 | 322 |
| | NIIT Technologies Ltd. | 75,464 | 322 |
| * | Kirloskar Oil Engines Ltd. | 94,001 | 321 |
| | eClerx Services Ltd. | 20,045 | 318 |
| * | Deccan Chronicle Holdings Ltd. | 175,067 | 317 |
| | Rajesh Exports Ltd. | 162,006 | 315 |
| | Kalpataru Power Transmission Ltd. | 107,694 | 312 |
| | Trent Ltd. | 13,500 | 306 |
| | FDC Ltd. | 129,761 | 304 |
| | SE Investments Ltd. | 760,350 | 302 |
| * | Parsvnath Developers Ltd. | 304,956 | 301 |
| | Supreme Industries Ltd. | 85,132 | 300 |
| | Zydus Wellness Ltd. | 22,259 | 299 |
| * | Zuari Industries Ltd. | 19,189 | 298 |
| | Kemrock Industries & Exports Ltd. | 25,655 | 296 |
| | Radico Khaitan Ltd. | 90,354 | 295 |
| | NIIT Ltd. | 231,147 | 293 |
| * | Network 18 Media & Investments Ltd. | 79,862 | 291 |
| | VIP Industries Ltd. | 18,734 | 289 |
| | Uflex Ltd. | 62,820 | 288 |
| | City Union Bank Ltd. | 290,759 | 287 |
| | Mahindra Lifespace Developers Ltd. | 33,479 | 284 |
| * | Vardhman Textiles Ltd. | 43,714 | 279 |
| | Bombay Dyeing & Manufacturing Co. Ltd. | 31,098 | 277 |
| | Sunteck Realty Ltd. | 35,871 | 274 |
| * | Motilal Oswal Financial Services Ltd. | 81,485 | 273 |
| * | Television Eighteen India Ltd. | 146,884 | 270 |
| | Simplex Infrastructures Ltd. | 35,961 | 267 |
| | Gujarat Narmada Valley Fertilizers Co. Ltd. | 109,481 | 267 |
| | Amara Raja Batteries Ltd. | 58,387 | 254 |
| | Deepak Fertilizers & Petrochemicals Corp. Ltd. | 65,290 | 252 |
| | Graphite India Ltd. | 117,261 | 251 |
| * | Asahi India Glass Ltd. | 105,677 | 249 |
| | Navneet Publications India Ltd. | 177,002 | 247 |
| * | OnMobile Global Ltd. | 38,907 | 246 |
| | Bilcare Ltd. | 25,282 | 246 |
| * | SpiceJet Ltd. | 264,169 | 246 |
| | Jindal Poly Films Ltd. | 25,478 | 245 |
| | ABG Shipyard Ltd. | 28,182 | 240 |
| | Jyothy Laboratories Ltd. | 50,569 | 237 |
| * | JSL Stainless Ltd. | 116,043 | 235 |
| | Cholamandalam Investment and Finance Co. Ltd. | 62,644 | 231 |
| | Karuturi Global Ltd. | 763,632 | 230 |
| | Prraneta Industries Ltd. | 159,208 | 227 |
| | Hotel Leela Venture Ltd. | 238,890 | 225 |
| * | Praj Industries Ltd. | 122,701 | 225 |
| * | Elgi Equipments Ltd. | 112,520 | 220 |
| | Monsanto India Ltd. | 5,224 | 213 |
| | Kesoram Industries Ltd. | 47,614 | 210 |
| * | MindTree Ltd. | 25,295 | 210 |
| | Finolex Industries Ltd. | 89,811 | 209 |
| | Glodyne Technoserve Ltd. | 22,090 | 207 |
| | Noida Toll Bridge Co. Ltd. | 329,465 | 205 |
| * | HeidelbergCement India Ltd. | 181,561 | 205 |
| | Nagarjuna Fertilizers & Chemicals | 283,754 | 204 |
| * | Gruh Finance Ltd. | 20,918 | 199 |
| | Jyoti Structures Ltd. | 102,467 | 198 |
37
| | | |
| Vanguard® Total International Stock Index Fund | | |
| Schedule of Investments | | |
| April 30, 2011 | | |
| |
| | | | Market |
| | | | Value |
| | | Shares | ($000) |
| | Panacea Biotec Ltd. | 46,035 | 197 |
| | Ansal Properties & Infrastructure Ltd. | 194,615 | 197 |
| | Orient Paper & Industries Ltd. | 146,364 | 195 |
| * | Bajaj Corp. Ltd. | 15,198 | 193 |
| * | Jindal South West Holdings Ltd. | 7,362 | 190 |
| * | Indian Metals & Ferro Alloys Ltd. | 15,215 | 189 |
| * | Ingersoll-Rand India Ltd. | 16,369 | 186 |
| * | Prakash Industries Ltd. | 96,277 | 186 |
| | Shiv-Vani Oil & Gas Exploration Services Ltd. | 27,023 | 185 |
| | Ess Dee Aluminium Ltd. | 17,585 | 184 |
| * | Gammon Infrastructure Projects Ltd. | 424,627 | 183 |
| | Grindwell Norton Ltd. | 34,946 | 182 |
| | Gujarat Industries Power Co. Ltd. | 92,501 | 182 |
| * | Patel Engineering Ltd. | 48,150 | 176 |
| * | Kingfisher Airlines Ltd. | 176,394 | 175 |
| | JBF Industries Ltd. | 41,998 | 171 |
| * | Dalmia Bharat Enterprises Ltd. | 42,605 | 171 |
| | Rain Commodities Ltd. | 41,774 | 168 |
| | Sundram Fasteners Ltd. | 123,635 | 168 |
| | Shree Ashtavinyak Cine Vision Ltd. | 1,139,830 | 164 |
| * | Finolex Cables Ltd. | 137,776 | 164 |
| * | IL & FS Investment Managers Ltd. | 197,191 | 163 |
| | Elder Pharmaceuticals Ltd. Class A | 18,882 | 159 |
| | Jai Balaji Industries Ltd. | 35,828 | 158 |
| | Madhucon Projects Ltd. | 65,001 | 158 |
| | Merck Ltd. | 10,931 | 157 |
| | ICSA India Ltd. | 58,009 | 152 |
| * | Entertainment Network India Ltd. | 27,858 | 152 |
| * | Texmaco Rail & Engineering Ltd. | 90,519 | 152 |
| | Adhunik Metaliks Ltd. | 74,216 | 152 |
| * | DEN Networks Ltd. | 66,965 | 151 |
| | Indiabulls Securities Ltd. | 405,268 | 150 |
| * | Brigade Enterprises Ltd. | 71,168 | 149 |
| | Time Technoplast Ltd. | 122,258 | 149 |
| | ICRA Ltd. | 5,952 | 149 |
| | Moser Baer India Ltd. | 144,862 | 145 |
| | Reliance Industrial Infrastructure Ltd. | 10,015 | 144 |
| | Electrosteel Castings Ltd. | 202,033 | 144 |
| | Gokul Refoils & Solvent Ltd. | 64,322 | 139 |
| | Lakshmi Vilas Bank Ltd. | 55,693 | 138 |
| | Everest Kanto Cylinder Ltd. | 71,177 | 135 |
| | JK Cement Ltd. | 46,320 | 133 |
| | Aptech Ltd. | 54,360 | 131 |
| * | Hindustan Media Ventures Ltd. | 40,780 | 131 |
| | HEG Ltd. | 25,567 | 129 |
| * | 3i Infotech Ltd. | 115,120 | 129 |
| | Balmer Lawrie & Co. Ltd. | 9,004 | 121 |
| | Orbit Corp. Ltd. | 107,982 | 117 |
| | Provogue India Ltd. | 117,030 | 114 |
| | Gulf Oil Corp. Ltd. | 58,766 | 113 |
| * | Firstsource Solutions Ltd. | 257,771 | 113 |
| * | Reliance MediaWorks Ltd. | 31,869 | 113 |
| * | Consolidated Construction Consortium Ltd. | 104,438 | 112 |
| | Dishman Pharmaceuticals & Chemicals Ltd. | 47,150 | 103 |
| | Advanta India Ltd. | 16,819 | 100 |
| | Ganesh Housing Corp. Ltd. | 30,791 | 99 |
| | TRF Ltd. | 7,313 | 98 |
| | Lakshmi Energy & Foods Ltd. | 78,753 | 85 |
| | Mastek Ltd. | 30,475 | 81 |
| | Sanghvi Movers Ltd. | 28,857 | 79 |
| | Allied Digital Services Ltd. | 27,509 | 57 |
| | Texmaco Ltd. | 76,379 | 56 |
| | United Breweries Holdings Ltd. | 8,075 | 34 |
38
| | | |
| Vanguard® Total International Stock Index Fund | | |
| Schedule of Investments | | |
| April 30, 2011 | | |
| |
| | | | Market |
| | | | Value |
| | | Shares | ($000) |
| * | Vardhman Textiles Ltd. | 8,742 | 4 |
| | | | 1,058,916 |
| Indonesia (0.6%) | | |
| | Astra International Tbk PT | 6,018,000 | 39,552 |
| | Bank Central Asia Tbk PT | 36,722,500 | 31,806 |
| | Telekomunikasi Indonesia Tbk PT | 30,047,000 | 27,083 |
| | Bank Rakyat Indonesia Persero Tbk PT | 33,011,500 | 24,925 |
| | Bank Mandiri Tbk PT | 27,973,624 | 23,396 |
| | Bumi Resources Tbk PT | 55,946,500 | 22,481 |
| | Perusahaan Gas Negara PT | 32,788,500 | 15,356 |
| | United Tractors Tbk PT | 4,467,500 | 12,152 |
| | Bank Negara Indonesia Persero Tbk PT | 22,122,495 | 10,481 |
| | Semen Gresik Persero Tbk PT | 8,881,000 | 9,867 |
| | Indocement Tunggal Prakarsa Tbk PT | 4,430,500 | 8,812 |
| | Indofood Sukses Makmur Tbk PT | 13,231,000 | 8,587 |
| | Unilever Indonesia Tbk PT | 4,617,500 | 8,263 |
| | Gudang Garam Tbk PT | 1,724,500 | 8,192 |
| | Adaro Energy Tbk PT | 28,791,000 | 7,431 |
| | Indo Tambangraya Megah PT | 1,195,800 | 6,552 |
| | Bank Danamon Indonesia Tbk PT | 8,877,401 | 6,445 |
| | Tambang Batubara Bukit Asam Tbk PT | 2,454,000 | 6,404 |
| | Kalbe Farma Tbk PT | 13,956,102 | 5,839 |
| | Charoen Pokphand Indonesia Tbk PT | 22,690,865 | 5,121 |
| | International Nickel Indonesia Tbk PT | 7,301,500 | 4,259 |
| | Lippo Karawaci Tbk PT | 43,562,000 | 3,970 |
| | Astra Agro Lestari Tbk PT | 1,208,000 | 3,277 |
| | Aneka Tambang Tbk PT | 9,732,000 | 2,595 |
| | Indosat Tbk PT | 4,044,500 | 2,537 |
| | Bumi Serpong Damai PT | 23,146,500 | 2,493 |
| * | Bakrie Telecom Tbk PT | 50,936,000 | 2,295 |
| | Summarecon Agung Tbk PT | 15,501,500 | 2,285 |
| | Perusahaan Perkebunan London Sumatra Indonesia Tbk PT | 7,536,500 | 2,162 |
| | Bank Pembangunan Daerah Jawa Barat Dan Banten Tbk PT | 14,062,500 | 2,088 |
| * | Delta Dunia Makmur Tbk PT | 13,173,000 | 2,007 |
| | Timah Tbk PT | 5,947,000 | 2,007 |
| * | Bakrie and Brothers Tbk PT | 225,746,000 | 1,771 |
| | Bank Tabungan Negara Tbk PT | 8,626,000 | 1,726 |
| | Bakrieland Development Tbk PT | 97,513,000 | 1,645 |
| | Indika Energy Tbk PT | 3,429,000 | 1,627 |
| * | Indah Kiat Pulp & Paper Corp. Tbk PT | 8,554,000 | 1,611 |
| | Bakrie Sumatera Plantations Tbk PT | 35,163,000 | 1,609 |
| * | Ciputra Development Tbk PT | 35,121,500 | 1,604 |
| | Medco Energi Internasional Tbk PT | 4,438,000 | 1,430 |
| | Media Nusantara Citra Tbk PT | 11,681,000 | 1,204 |
| * | Barito Pacific Tbk PT | 9,552,500 | 1,184 |
| * | Energi Mega Persada Tbk PT | 63,988,500 | 1,178 |
| | Gajah Tunggal Tbk PT | 3,987,000 | 1,087 |
| * | Bisi International PT | 5,460,000 | 1,067 |
| | Global Mediacom Tbk PT | 11,632,500 | 1,021 |
| * | Berlian Laju Tanker Tbk PT | 19,210,500 | 877 |
| | AKR Corporindo Tbk PT | 4,258,500 | 851 |
| | Bank Bukopin Tbk PT | 9,431,166 | 793 |
| | Sampoerna Agro PT | 1,890,000 | 747 |
| * | Panin Financial Tbk PT | 31,731,500 | 717 |
| | Ciputra Property TBK PT | 12,657,500 | 615 |
| | BW Plantation Tbk PT | 4,246,000 | 597 |
| | Wijaya Karya PT | 7,214,000 | 566 |
| | Alam Sutera Realty Tbk PT | 14,789,000 | 511 |
| | Pembangunan Perumahan Persero PT Tbk | 5,998,000 | 491 |
| | Hexindo Adiperkasa Tbk PT | 596,500 | 394 |
| * | Benakat Petroleum Energy PT | 23,424,500 | 379 |
| * | Intiland Development Tbk PT | 8,597,000 | 366 |
| * | Sentul City Tbk PT | 26,754,500 | 332 |
| | Sorini Agro Asia Corporindo Tbk PT | 757,000 | 309 |
39
| | | |
| Vanguard® Total International Stock Index Fund | | |
| Schedule of Investments | | |
| April 30, 2011 | | |
| |
| | | | Market |
| | | | Value |
| | | Shares | ($000) |
| * | Darma Henwa Tbk PT | 25,995,000 | 262 |
| * | Dian Swastatika Sentosa Tbk PT | 80,000 | 251 |
| | Elnusa Tbk PT | 5,038,000 | 174 |
| | | | 349,716 |
| Ireland (0.2%) | | |
| | CRH plc | 2,136,686 | 53,040 |
| | Kerry Group plc Class A | 423,143 | 17,526 |
| * | Elan Corp. plc | 1,502,480 | 12,078 |
| | DCC plc | 251,633 | 8,387 |
| | Paddy Power plc | 128,447 | 6,276 |
| | C&C Group plc | 1,000,577 | 5,127 |
| * | Smurfit Kappa Group plc | 359,435 | 4,893 |
| * | Governor & Co. of the Bank of Ireland | 10,101,208 | 4,113 |
| | Kingspan Group plc | 378,810 | 3,698 |
| | Ryanair Holdings plc | 695,870 | 3,581 |
| | Grafton Group plc | 636,608 | 3,347 |
| | Ryanair Holdings plc ADR | 85,169 | 2,596 |
| | Glanbia plc | 393,668 | 2,537 |
| | United Drug plc | 715,037 | 2,466 |
| * | Irish Continental Group plc | 47,921 | 1,226 |
| | WPP plc ADR | 17,140 | 1,119 |
| * | Allied Irish Banks plc | 3,126,711 | 1,070 |
| | Greencore Group plc | 600,178 | 978 |
| * | Independent News & Media plc | 1,114,069 | 965 |
| * | Aer Lingus | 597,539 | 730 |
| | FBD Holdings plc | 66,350 | 712 |
| | Total Produce plc | 997,393 | 620 |
| | Fyffes plc | 750,215 | 456 |
| * | Irish Life & Permanent Group Holdings plc | 806,548 | 179 |
| * | Anglo Irish Bank Corp. Ltd. | 698,992 | — |
| | | | 137,720 |
| Israel (0.5%) | | |
| | Teva Pharmaceutical Industries Ltd. | 2,786,848 | 128,045 |
| | Israel Chemicals Ltd. | 1,337,218 | 23,734 |
| | Bank Leumi Le-Israel BM | 3,525,009 | 18,340 |
| * | Bank Hapoalim BM | 2,982,707 | 15,685 |
| | Bezeq The Israeli Telecommunication Corp. Ltd. | 5,215,822 | 15,495 |
| | Israel Corp. Ltd. | 6,927 | 8,635 |
| * | NICE Systems Ltd. | 187,453 | 7,152 |
| * | Israel Discount Bank Ltd. Class A | 2,341,313 | 4,956 |
| | Partner Communications Co. Ltd. | 256,312 | 4,861 |
| | Mizrahi Tefahot Bank Ltd. | 379,206 | 4,209 |
| * | Makhteshim-Agan Industries Ltd. | 745,975 | 4,026 |
| | Elbit Systems Ltd. | 70,796 | 4,018 |
| | Delek Group Ltd. | 12,188 | 3,244 |
| | Cellcom Israel Ltd. | 96,644 | 3,102 |
| * | Mellanox Technologies Ltd. | 97,717 | 2,733 |
| * | Oil Refineries Ltd. | 2,744,055 | 2,055 |
| | Osem Investments Ltd. | 106,751 | 1,867 |
| | Paz Oil Co. Ltd. | 9,791 | 1,815 |
| | Clal Insurance Enterprises Holdings Ltd. | 62,685 | 1,776 |
| | Cellcom Israel Ltd. (Registered) | 54,664 | 1,758 |
| | Shufersal Ltd. | 280,848 | 1,756 |
| | Shikun & Binui Ltd. | 584,535 | 1,702 |
| | Strauss Group Ltd. | 91,520 | 1,529 |
| | Harel Insurance Investments & Financial Services Ltd. | 24,252 | 1,448 |
| | Clal Industries and Investments Ltd. | 180,167 | 1,445 |
| * | Africa Israel Investments Ltd. | 166,141 | 1,424 |
| | Teva Pharmaceutical Industries Ltd. ADR | 27,434 | 1,255 |
| | Ormat Industries | 170,058 | 1,226 |
| | Frutarom Industries Ltd. | 100,904 | 1,109 |
| * | Given Imaging Ltd. | 50,829 | 1,079 |
| | First International Bank Of Israel Ltd. | 69,365 | 1,068 |
| | Delek Automotive Systems Ltd. | 79,394 | 1,024 |
40
| | | |
| Vanguard® Total International Stock Index Fund | | |
| Schedule of Investments | | |
| April 30, 2011 | | |
| |
| | | | Market |
| | | | Value |
| | | Shares | ($000) |
| | Alony Hetz Properties & Investments Ltd. | 173,020 | 998 |
| * | Ceragon Networks Ltd. | 77,946 | 990 |
| * | B Communications Ltd. | 27,881 | 920 |
| * | Koor Industries Ltd. | 36,868 | 897 |
| * | Tower Semiconductor Ltd. | 653,623 | 892 |
| * | Menorah Mivtachim Holdings Ltd. | 61,201 | 819 |
| * | Nitsba Holdings 1995 Ltd. | 74,442 | 797 |
| | Jerusalem Economy Ltd. | 60,060 | 763 |
| * | Hot Telecommunication System Ltd. | 42,066 | 759 |
| | Ituran Location and Control Ltd. | 42,368 | 684 |
| | Rami Levi Chain Stores Hashikma Marketing 2006 Ltd. | 14,538 | 584 |
| * | Retalix Ltd. | 39,986 | 578 |
| * | Phoenix Holdings Ltd. | 154,140 | 561 |
| | Amot Investments Ltd. | 180,414 | 558 |
| * | AudioCodes Ltd. | 89,553 | 555 |
| | Alon Holdings Blue Square Israel Ltd. | 51,605 | 519 |
| | Matrix IT Ltd. | 82,285 | 514 |
| | Melisron Ltd. | 18,800 | 476 |
| * | Jerusalem Oil Exploration | 21,623 | 472 |
| * | Elbit Imaging Ltd. | 38,729 | 464 |
| * | Internet Gold-Golden Lines Ltd. | 16,161 | 459 |
| * | Hadera Paper Ltd. | 5,620 | 455 |
| | British Israel Investments Ltd. | 114,602 | 452 |
| * | AL-ROV Israel Ltd. | 11,287 | 438 |
| | Bayside Land Corp. | 1,658 | 417 |
| | Electra Ltd. | 3,419 | 416 |
| * | Clal Biotechnology Industries Ltd. | 65,858 | 413 |
| * | FIBI Holdings Ltd. | 18,154 | 404 |
| * | Africa Israel Properties Ltd. | 27,546 | 385 |
| | Gazit Inc. | 14,090 | 382 |
| | Scailex Corp. Ltd. | 19,276 | 380 |
| * | Gilat Satellite Networks Ltd. | 78,202 | 379 |
| | NetVision Ltd. | 26,041 | 359 |
| * | Naphtha Israel Petroleum Corp. Ltd. | 75,354 | 316 |
| * | Airport City Ltd. | 60,732 | 316 |
| | Union Bank of Israel | 60,987 | 312 |
| | Elco Holdings Ltd. | 21,943 | 312 |
| | Property & Building Corp. | 3,273 | 299 |
| * | Alvarion Ltd. | 160,312 | 280 |
| * | Suny Electronic Inc. Ltd. | 22,219 | 274 |
| | FMS Enterprises Migun Ltd. | 8,902 | 265 |
| | Otzar Hityashvuth Hayehudim | 95 | 264 |
| | Delek The Israeli Fuel Corp. Ltd. | 7,830 | 254 |
| * | Elron Electronic Industries Ltd. | 40,952 | 246 |
| | Plasson Industries Ltd. | 9,238 | 228 |
| | Granite Hacarmel Investments Ltd. | 101,768 | 214 |
| * | Electra Real Estate Ltd. | 29,015 | 213 |
| | Golf & Co. Ltd. | 37,859 | 200 |
| | Israel Land Development Co. Ltd. | 19,397 | 190 |
| * | Delek Real Estate Ltd. | 481,716 | 90 |
| | | | 296,983 |
| Italy (2.0%) | | |
| | ENI SPA | 7,832,434 | 209,703 |
| | Enel SPA | 19,794,509 | 141,162 |
| | UniCredit SPA | 40,590,591 | 104,534 |
| | Assicurazioni Generali SPA | 3,516,666 | 84,275 |
| | Intesa Sanpaolo SPA (Registered) | 23,202,022 | 77,065 |
| | Saipem SPA | 798,120 | 45,333 |
| | Telecom Italia SPA (Registered) | 28,244,501 | 42,469 |
| * | Fiat Industrial SPA | 2,298,115 | 34,141 |
| | Tenaris SA | 1,138,038 | 28,739 |
| | Snam Rete Gas SPA | 4,303,187 | 26,766 |
| ^ | Fiat SPA | 2,298,524 | 24,545 |
| | Telecom Italia SPA (Bearer) | 18,109,375 | 23,352 |
41
| | | |
| Vanguard® Total International Stock Index Fund | | |
| Schedule of Investments | | |
| April 30, 2011 | | |
| |
| | | | Market |
| | | | Value |
| | | Shares | ($000) |
| | Atlantia SPA | 904,073 | 22,251 |
| * | Parmalat SPA | 5,215,517 | 19,748 |
| | Terna Rete Elettrica Nazionale SPA | 3,925,713 | 19,654 |
| | Finmeccanica SPA | 1,213,148 | 16,391 |
| ^ | Unione di Banche Italiane SCPA | 1,824,800 | 16,357 |
| | Mediobanca SPA | 1,421,499 | 16,190 |
| | Enel Green Power SPA | 5,296,821 | 15,705 |
| | Prysmian SPA | 613,191 | 14,475 |
| | Mediaset SPA | 2,125,593 | 14,162 |
| | Banco Popolare SC | 4,663,594 | 13,833 |
| | Luxottica Group SPA | 349,766 | 11,563 |
| | Banca Popolare dell'Emilia Romagna Scrl | 758,446 | 9,273 |
| *,^ | Banca Monte dei Paschi di Siena SPA | 6,763,527 | 9,165 |
| ^ | Bulgari SPA | 452,285 | 8,238 |
| | Intesa Sanpaolo SPA (Bearer) | 2,804,080 | 8,041 |
| | Pirelli & C SPA | 717,992 | 7,475 |
| | Tenaris SA ADR | 139,938 | 7,107 |
| | Exor SPA | 194,937 | 7,034 |
| | Davide Campari-Milano SPA | 881,897 | 6,350 |
| | A2A SPA | 3,337,208 | 6,027 |
| * | Autogrill SPA | 339,703 | 4,870 |
| ^ | Banca Popolare di Milano Scarl | 1,264,006 | 4,326 |
| ^ | Banca Carige SPA | 1,752,703 | 4,248 |
| | Azimut Holding SPA | 331,095 | 4,234 |
| | Tod's SPA | 28,279 | 3,840 |
| | Mediolanum SPA | 650,212 | 3,823 |
| | Societa Cattolica di Assicurazioni SCRL | 130,171 | 3,662 |
| ^ | Buzzi Unicem SPA | 225,078 | 3,481 |
| | Hera SPA | 1,374,094 | 3,476 |
| | Ansaldo STS SPA | 221,581 | 3,425 |
| | DiaSorin SPA | 69,469 | 3,355 |
| ^ | Piccolo Credito Valtellinese Scarl | 696,560 | 3,320 |
| * | CIR-Compagnie Industriali Riunite SPA | 1,174,283 | 3,080 |
| ^ | Lottomatica SPA | 134,075 | 2,994 |
| | Iren SPA | 1,392,637 | 2,876 |
| * | Impregilo SPA | 829,699 | 2,846 |
| * | ACEA SPA | 219,420 | 2,832 |
| ^ | ERG SPA | 178,569 | 2,640 |
| | Recordati SPA | 247,314 | 2,617 |
| | Unipol Gruppo Finanziario SPA | 3,002,393 | 2,429 |
| ^ | Italcementi SPA | 220,586 | 2,418 |
| | Unipol Gruppo Finanziario SPA Prior Pfd. | 3,863,334 | 2,393 |
| * | Beni Stabili SPA | 2,103,326 | 2,381 |
| | Societa Iniziative Autostradali e Servizi SPA | 180,578 | 2,326 |
| * | Sorin SPA | 773,671 | 2,224 |
| * | Saras SPA | 852,404 | 2,140 |
| * | Yoox SPA | 115,992 | 2,109 |
| | Autostrada Torino-Milano SPA | 124,686 | 2,098 |
| | Danieli & C Officine Meccaniche SPA | 114,443 | 2,051 |
| | Banca Generali SPA | 117,682 | 1,976 |
| ^ | Fondiaria-Sai SPA | 198,599 | 1,846 |
| | Italcementi SPA RSP | 324,538 | 1,837 |
| * | Safilo Group SPA | 94,508 | 1,805 |
| | Geox SPA | 251,696 | 1,780 |
| | Amplifon SPA | 284,079 | 1,745 |
| * | Arnoldo Mondadori Editore SPA | 408,382 | 1,730 |
| * | Interpump Group SPA | 190,961 | 1,726 |
| | Credito Emiliano SPA | 249,086 | 1,717 |
| | Piaggio & C SPA | 423,990 | 1,658 |
| | Maire Tecnimont SPA | 365,417 | 1,532 |
| | De'Longhi SPA | 106,792 | 1,367 |
| | Trevi Finanziaria SPA | 82,036 | 1,333 |
| *,^ | Prelios SPA | 1,682,438 | 1,320 |
| * | Gemina SPA | 1,255,490 | 1,301 |
42
| | | |
| Vanguard® Total International Stock Index Fund | | |
| Schedule of Investments | | |
| April 30, 2011 | | |
| |
| | | | Market |
| | | | Value |
| | | Shares | ($000) |
| | Danieli & C Officine Meccaniche SPA | 40,755 | 1,298 |
| | Indesit Co. SPA | 97,429 | 1,284 |
| | Italmobiliare SPA | 46,744 | 1,281 |
| | Benetton Group SPA | 156,591 | 1,272 |
| | Astaldi SPA | 140,180 | 1,222 |
| | Brembo SPA | 85,871 | 1,173 |
| * | Cofide SPA | 970,366 | 1,128 |
| * | Gruppo Editoriale L'Espresso SPA | 351,147 | 1,091 |
| | MARR SPA | 81,542 | 1,071 |
| * | Gruppo Coin SPA | 102,211 | 1,039 |
| | Buzzi Unicem SPA | 115,967 | 1,021 |
| | Immobiliare Grande Distribuzione | 391,942 | 946 |
| *,^ | Milano Assicurazioni SPA | 635,136 | 937 |
| * | Banca Popolare dell'Etruria e del Lazio | 214,929 | 906 |
| | Italmobiliare SPA | 19,015 | 832 |
| *,^ | RCS MediaGroup SPA | 419,110 | 824 |
| | Fondiaria-Sai SPA RSP | 121,234 | 682 |
| | Zignago Vetro SPA | 80,123 | 659 |
| * | IMMSI SPA | 490,313 | 637 |
| * | Digital Multimedia Technologies SPA | 19,409 | 614 |
| * | DeA Capital SPA | 263,691 | 609 |
| * | Snai SPA | 166,386 | 600 |
| | Esprinet SPA | 67,252 | 580 |
| | Sogefi SPA | 133,219 | 559 |
| | Banco di Desio e della Brianza SPA | 97,905 | 552 |
| * | Aeroporto di Venezia Marco Polo SpA - SAVE | 45,677 | 547 |
| *,^ | Tiscali SPA | 4,527,729 | 531 |
| | Cementir Holding SPA | 159,129 | 511 |
| * | Buongiorno SPA | 228,163 | 481 |
| *,^ | Premafin Finanziaria SPA | 527,784 | 477 |
| ^ | Landi Renzo SPA | 128,769 | 472 |
| * | Sabaf SPA | 14,112 | 467 |
| | Alerion Cleanpower SPA | 558,778 | 463 |
| * | Engineering Ingegneria Informatica SPA | 12,542 | 449 |
| *,^ | Telecom Italia Media SPA | 1,429,503 | 420 |
| | Industria Macchine Automatiche SPA | 19,371 | 417 |
| * | Banca Profilo SPA | 731,088 | 415 |
| * | Vittoria Assicurazioni SPA | 68,809 | 411 |
| | BasicNet SPA | 102,532 | 408 |
| * | Cam Finanziaria SPA | 672,470 | 402 |
| * | Cairo Communication SPA | 82,741 | 397 |
| * | Biesse SPA | 35,274 | 392 |
| * | Ascopiave SPA | 154,426 | 386 |
| * | Banca IFIS SPA | 46,980 | 367 |
| * | Reply SPA | 11,876 | 357 |
| * | Aedes SPA | 1,359,575 | 349 |
| * | KME Group SPA | 648,791 | 347 |
| *,^ | Seat Pagine Gialle SPA | 2,808,925 | 337 |
| * | Caltagirone Editore SPA | 127,482 | 323 |
| * | Carraro SPA | 49,088 | 302 |
| * | Poltrona Frau SPA | 142,727 | 271 |
| * | Societa per la Bonifica dei Terreni Ferraresi e Imprese Agricole SPA | 6,466 | 267 |
| * | Juventus Football Club SPA | 216,011 | 266 |
| * | d'Amico International Shipping SA | 181,319 | 249 |
| | Banco di Sardegna SPA | 16,314 | 225 |
| * | Fiera Milano SPA | 34,872 | 224 |
| *,^ | Acotel Group SPA | 3,805 | 214 |
| * | Brioschi Sviluppo Immobiliare SPA | 942,992 | 210 |
| * | Banca Finnat Euramerica SPA | 264,570 | 185 |
| * | Falck Renewables SPA | 70,973 | 163 |
| * | Gruppo Beghelli SPA | 147,399 | 147 |
| *,^ | AS Roma SPA | 112,607 | 138 |
| * | Milano Assicurazioni SPA | 74,022 | 120 |
| | | | 1,240,234 |
43
| | |
| Vanguard® Total International Stock Index Fund | | |
| Schedule of Investments | | |
| April 30, 2011 | | |
| |
| | | Market |
| | | Value |
| | Shares | ($000) |
| Japan (13.4%) | | |
| Toyota Motor Corp. | 8,287,600 | 330,602 |
| Honda Motor Co. Ltd. | 4,898,187 | 188,306 |
| Mitsubishi UFJ Financial Group Inc. | 38,265,499 | 183,659 |
| Canon Inc. | 3,407,855 | 160,485 |
| Sumitomo Mitsui Financial Group Inc. | 4,055,911 | 125,984 |
| Mitsubishi Corp. | 4,080,536 | 110,695 |
| Takeda Pharmaceutical Co. Ltd. | 2,256,000 | 109,332 |
| Softbank Corp. | 2,438,900 | 102,914 |
| Komatsu Ltd. | 2,851,200 | 100,532 |
| Mizuho Financial Group Inc. | 61,471,929 | 97,393 |
| FANUC Corp. | 575,200 | 96,288 |
| Mitsui & Co. Ltd. | 5,224,200 | 92,965 |
| NTT DoCoMo Inc. | 46,020 | 85,384 |
| Sony Corp. | 3,019,200 | 85,249 |
| Panasonic Corp. | 6,627,800 | 81,498 |
| Hitachi Ltd. | 13,596,161 | 73,796 |
| Nissan Motor Co. Ltd. | 7,462,000 | 71,796 |
| Nintendo Co. Ltd. | 297,700 | 70,440 |
| Nippon Telegraph & Telephone Corp. | 1,438,700 | 67,040 |
| Mitsubishi Electric Corp. | 5,804,000 | 64,618 |
| Toshiba Corp. | 12,100,000 | 64,431 |
| Shin-Etsu Chemical Co. Ltd. | 1,232,400 | 64,114 |
| Mitsubishi Estate Co. Ltd. | 3,558,000 | 62,264 |
| Tokio Marine Holdings Inc. | 2,174,500 | 60,830 |
| KDDI Corp. | 8,773 | 58,569 |
| Seven & I Holdings Co. Ltd. | 2,264,600 | 56,991 |
| East Japan Railway Co. | 1,022,100 | 56,809 |
| Nomura Holdings Inc. | 10,624,690 | 54,277 |
| Kyocera Corp. | 488,700 | 53,921 |
| Japan Tobacco Inc. | 13,506 | 52,488 |
| Astellas Pharma Inc. | 1,338,500 | 51,122 |
| Inpex Corp. | 6,601 | 50,747 |
| Denso Corp. | 1,459,500 | 48,844 |
| Nippon Steel Corp. | 15,319,000 | 47,918 |
| Kansai Electric Power Co. Inc. | 2,261,500 | 47,633 |
| JX Holdings Inc. | 6,759,170 | 47,603 |
| ITOCHU Corp. | 4,527,800 | 47,167 |
| Sumitomo Corp. | 3,379,800 | 46,624 |
| Murata Manufacturing Co. Ltd. | 608,600 | 43,956 |
| Mitsui Fudosan Co. Ltd. | 2,514,000 | 43,631 |
| Mitsubishi Heavy Industries Ltd. | 9,121,000 | 43,583 |
| FUJIFILM Holdings Corp. | 1,394,748 | 43,360 |
| Bridgestone Corp. | 1,952,900 | 43,133 |
| Chubu Electric Power Co. Inc. | 1,948,300 | 42,692 |
| Kao Corp. | 1,626,600 | 40,718 |
| Dai-ichi Life Insurance Co. Ltd. | 24,066 | 39,751 |
| Daiichi Sankyo Co. Ltd. | 2,022,300 | 39,737 |
| Asahi Glass Co. Ltd. | 3,028,000 | 38,444 |
| MS&AD Insurance Group Holdings | 1,618,984 | 37,913 |
| JFE Holdings Inc. | 1,382,900 | 37,853 |
| Marubeni Corp. | 4,959,000 | 36,229 |
| Kirin Holdings Co. Ltd. | 2,534,000 | 35,657 |
| Tokyo Gas Co. Ltd. | 7,666,000 | 34,202 |
| Central Japan Railway Co. | 4,522 | 34,189 |
| Kubota Corp. | 3,469,000 | 33,261 |
| Keyence Corp. | 124,610 | 32,929 |
| Toray Industries Inc. | 4,418,000 | 32,771 |
| Sumitomo Mitsui Trust Holdings Inc. | 9,370,480 | 32,260 |
| Fujitsu Ltd. | 5,604,000 | 32,109 |
| Sumitomo Electric Industries Ltd. | 2,274,900 | 31,674 |
| Secom Co. Ltd. | 633,200 | 31,409 |
| ORIX Corp. | 315,111 | 30,958 |
| Tokyo Electron Ltd. | 514,300 | 29,775 |
44
| | | |
| Vanguard® Total International Stock Index Fund | | |
| Schedule of Investments | | |
| April 30, 2011 | | |
| |
| | | | Market |
| | | | Value |
| | | Shares | ($000) |
| | SMC Corp. | 161,600 | 29,520 |
| | Nidec Corp. | 327,800 | 28,653 |
| | Terumo Corp. | 506,400 | 28,242 |
| | Hoya Corp. | 1,305,600 | 28,119 |
| | Sumitomo Metal Mining Co. Ltd. | 1,569,000 | 28,015 |
| | Sharp Corp. | 3,016,000 | 27,749 |
| ^ | Eisai Co. Ltd. | 756,000 | 27,490 |
| | NKSJ Holdings Inc. | 4,244,400 | 27,356 |
| | Nitto Denko Corp. | 495,700 | 26,548 |
| | Asahi Kasei Corp. | 3,783,000 | 26,149 |
| | Resona Holdings Inc. | 5,511,453 | 26,130 |
| | Mitsubishi Chemical Holdings Corp. | 3,848,000 | 26,056 |
| | Sumitomo Chemical Co. Ltd. | 4,740,000 | 25,207 |
| | Fast Retailing Co. Ltd. | 159,800 | 25,197 |
| | Suzuki Motor Corp. | 1,014,300 | 24,147 |
| | Tokyo Electric Power Co. Inc. | 4,345,800 | 23,306 |
| | Daikin Industries Ltd. | 702,000 | 22,361 |
| | Ajinomoto Co. Inc. | 2,007,000 | 22,320 |
| | Ricoh Co. Ltd. | 2,018,000 | 22,270 |
| | Sumitomo Realty & Development Co. Ltd. | 1,071,000 | 22,169 |
| | Asahi Breweries Ltd. | 1,163,900 | 21,865 |
| | Aeon Co. Ltd. | 1,799,000 | 21,675 |
| | Daiwa Securities Group Inc. | 5,007,000 | 21,610 |
| | Sumitomo Metal Industries Ltd. | 10,156,000 | 21,485 |
| | Osaka Gas Co. Ltd. | 5,821,000 | 21,481 |
| | Kyushu Electric Power Co. Inc. | 1,140,300 | 21,082 |
| | Aisin Seiki Co. Ltd. | 577,300 | 20,362 |
| | Dai Nippon Printing Co. Ltd. | 1,694,000 | 20,321 |
| | Otsuka Holdings Co. Ltd. | 757,560 | 20,285 |
| | Rakuten Inc. | 21,837 | 20,277 |
| | Nikon Corp. | 966,000 | 20,245 |
| | T&D Holdings Inc. | 818,100 | 20,202 |
| | Mitsui OSK Lines Ltd. | 3,437,000 | 19,170 |
| | Yamato Holdings Co. Ltd. | 1,196,600 | 19,104 |
| | TDK Corp. | 369,700 | 19,075 |
| | Tohoku Electric Power Co. Inc. | 1,290,100 | 18,947 |
| | West Japan Railway Co. | 5,137 | 18,733 |
| | Kobe Steel Ltd. | 7,513,000 | 18,643 |
| | Olympus Corp. | 653,900 | 18,507 |
| | Bank of Yokohama Ltd. | 3,696,000 | 18,310 |
| | JS Group Corp. | 755,400 | 18,206 |
| | Daito Trust Construction Co. Ltd. | 224,000 | 17,920 |
| | Kawasaki Heavy Industries Ltd. | 4,288,000 | 17,722 |
| | Rohm Co. Ltd. | 293,800 | 17,694 |
| | Daiwa House Industry Co. Ltd. | 1,448,000 | 17,544 |
| | Yamada Denki Co. Ltd. | 248,220 | 17,439 |
| | Nippon Yusen KK | 4,610,000 | 17,042 |
| | Shiseido Co. Ltd. | 1,023,700 | 17,028 |
| | Omron Corp. | 615,000 | 16,915 |
| | Sekisui House Ltd. | 1,724,000 | 16,712 |
| | Nippon Building Fund Inc. | 1,650 | 16,607 |
| | NEC Corp. | 7,843,000 | 16,543 |
| | Shizuoka Bank Ltd. | 1,813,000 | 16,519 |
| | Toyota Industries Corp. | 541,200 | 16,405 |
| | Yahoo Japan Corp. | 43,862 | 16,134 |
| | Nippon Electric Glass Co. Ltd. | 1,052,000 | 15,928 |
| | Chugoku Electric Power Co. Inc. | 894,200 | 15,882 |
| | JGC Corp. | 621,000 | 15,548 |
| | Makita Corp. | 337,700 | 15,528 |
| | Hankyu Hanshin Holdings Inc. | 3,458,000 | 15,319 |
| | Odakyu Electric Railway Co. Ltd. | 1,894,000 | 15,305 |
| | Isuzu Motors Ltd. | 3,567,000 | 15,298 |
| * | Yamaha Motor Co. Ltd. | 792,300 | 15,230 |
| | Kuraray Co. Ltd. | 1,031,900 | 15,032 |
45
| | | |
| Vanguard® Total International Stock Index Fund | | |
| Schedule of Investments | | |
| April 30, 2011 | | |
| |
| | | | Market |
| | | | Value |
| | | Shares | ($000) |
| | Unicharm Corp. | 373,900 | 14,810 |
| ^ | Kintetsu Corp. | 4,857,000 | 14,544 |
| | Japan Real Estate Investment Corp. | 1,465 | 14,502 |
| | Shionogi & Co. Ltd. | 892,400 | 14,467 |
| * | Mitsubishi Motors Corp. | 11,618,000 | 14,254 |
| | Tokyu Corp. | 3,407,000 | 14,094 |
| | Teijin Ltd. | 2,816,000 | 13,496 |
| | Chiba Bank Ltd. | 2,278,000 | 13,487 |
| | Dentsu Inc. | 506,000 | 13,457 |
| | Shikoku Electric Power Co. Inc. | 529,000 | 13,426 |
| | Toppan Printing Co. Ltd. | 1,686,000 | 13,253 |
| | NGK Insulators Ltd. | 760,000 | 13,187 |
| | Fuji Heavy Industries Ltd. | 1,767,000 | 13,152 |
| | Ibiden Co. Ltd. | 387,700 | 13,090 |
| | Ono Pharmaceutical Co. Ltd. | 253,800 | 12,884 |
| | Oriental Land Co. Ltd. | 149,700 | 12,711 |
| | Konica Minolta Holdings Inc. | 1,440,000 | 12,681 |
| | NTT Data Corp. | 3,803 | 12,602 |
| | Tobu Railway Co. Ltd. | 3,012,000 | 11,761 |
| | NSK Ltd. | 1,321,000 | 11,723 |
| | Mitsubishi Materials Corp. | 3,371,000 | 11,703 |
| | OJI Paper Co. Ltd. | 2,583,000 | 11,598 |
| | JSR Corp. | 543,600 | 11,436 |
| | Mitsubishi Tanabe Pharma Corp. | 681,000 | 11,297 |
| | Chugai Pharmaceutical Co. Ltd. | 674,900 | 11,191 |
| | Sumitomo Heavy Industries Ltd. | 1,671,000 | 11,019 |
| | Sekisui Chemical Co. Ltd. | 1,308,000 | 10,974 |
| | Isetan Mitsukoshi Holdings Ltd. | 1,134,600 | 10,953 |
| | Brother Industries Ltd. | 713,300 | 10,923 |
| | Hokuriku Electric Power Co. | 527,900 | 10,707 |
| | Toyota Tsusho Corp. | 641,200 | 10,691 |
| | Shimano Inc. | 198,400 | 10,648 |
| | TonenGeneral Sekiyu KK | 844,000 | 10,471 |
| | Mazda Motor Corp. | 4,518,000 | 10,375 |
| | Sega Sammy Holdings Inc. | 591,200 | 10,356 |
| | Nippon Express Co. Ltd. | 2,559,000 | 10,196 |
| | IHI Corp. | 3,995,000 | 10,165 |
| | Hirose Electric Co. Ltd. | 97,000 | 10,110 |
| | Keikyu Corp. | 1,425,000 | 9,948 |
| | Hokkaido Electric Power Co. Inc. | 548,600 | 9,947 |
| | Kurita Water Industries Ltd. | 338,300 | 9,908 |
| | Sony Financial Holdings Inc. | 528,200 | 9,817 |
| | Keio Corp. | 1,738,000 | 9,762 |
| | Nitori Holdings Co. Ltd. | 112,550 | 9,732 |
| | Taisho Pharmaceutical Co. Ltd. | 410,000 | 9,669 |
| | Mitsui Chemicals Inc. | 2,627,000 | 9,625 |
| | Fukuoka Financial Group Inc. | 2,306,000 | 9,582 |
| | Advantest Corp. | 479,400 | 9,527 |
| | Dena Co. Ltd. | 252,400 | 9,475 |
| | Daihatsu Motor Co. Ltd. | 584,000 | 9,434 |
| | THK Co. Ltd. | 360,600 | 9,269 |
| | Electric Power Development Co. Ltd. | 352,800 | 9,256 |
| | Ube Industries Ltd. | 2,865,000 | 9,164 |
| | Mitsubishi Gas Chemical Co. Inc. | 1,162,000 | 9,104 |
| | Bank of Kyoto Ltd. | 963,000 | 8,924 |
| | MEIJI Holdings Co. Ltd. | 208,241 | 8,894 |
| | Lawson Inc. | 180,300 | 8,846 |
| | JTEKT Corp. | 676,700 | 8,791 |
| | Benesse Holdings Inc. | 210,400 | 8,751 |
| | Santen Pharmaceutical Co. Ltd. | 225,000 | 8,703 |
| | Amada Co. Ltd. | 1,066,000 | 8,561 |
| | Showa Denko KK | 4,262,000 | 8,506 |
| | Sankyo Co. Ltd. | 163,400 | 8,498 |
| | Trend Micro Inc. | 296,300 | 8,459 |
46
| | | |
| Vanguard® Total International Stock Index Fund | | |
| Schedule of Investments | | |
| April 30, 2011 | | |
| |
| | | | Market |
| | | | Value |
| | | Shares | ($000) |
| | Hisamitsu Pharmaceutical Co. Inc. | 200,900 | 8,384 |
| | Obayashi Corp. | 1,978,000 | 8,344 |
| *,^ | Elpida Memory Inc. | 552,204 | 8,274 |
| | Nippon Sheet Glass Co. Ltd. | 2,739,272 | 8,066 |
| | Yakult Honsha Co. Ltd. | 288,000 | 7,999 |
| | Hamamatsu Photonics KK | 203,200 | 7,996 |
| | Joyo Bank Ltd. | 1,980,000 | 7,991 |
| | Yaskawa Electric Corp. | 677,000 | 7,926 |
| | Japan Retail Fund Investment Corp. Class A | 4,898 | 7,919 |
| | Jupiter Telecommunications Co. Ltd. | 7,346 | 7,896 |
| | Idemitsu Kosan Co. Ltd. | 66,300 | 7,841 |
| | Toyo Seikan Kaisha Ltd. | 455,300 | 7,740 |
| | Hachijuni Bank Ltd. | 1,294,000 | 7,725 |
| | Japan Steel Works Ltd. | 954,000 | 7,705 |
| | Kyowa Hakko Kirin Co. Ltd. | 772,000 | 7,703 |
| | Nippon Meat Packers Inc. | 553,000 | 7,661 |
| ^ | GS Yuasa Corp. | 1,110,000 | 7,595 |
| | Furukawa Electric Co. Ltd. | 1,895,000 | 7,530 |
| | Denki Kagaku Kogyo KK | 1,460,000 | 7,499 |
| | Shimizu Corp. | 1,763,000 | 7,449 |
| | Credit Saison Co. Ltd. | 443,900 | 7,443 |
| | Nabtesco Corp. | 288,000 | 7,373 |
| | Stanley Electric Co. Ltd. | 436,700 | 7,340 |
| ^ | All Nippon Airways Co. Ltd. | 2,494,978 | 7,333 |
| | Kajima Corp. | 2,555,000 | 7,326 |
| | Sojitz Corp. | 3,784,300 | 7,303 |
| | Hokuhoku Financial Group Inc. | 3,819,000 | 7,288 |
| | Taisei Corp. | 3,074,000 | 7,201 |
| | Nisshin Seifun Group Inc. | 571,000 | 7,148 |
| | Hitachi Construction Machinery Co. Ltd. | 291,400 | 7,104 |
| | Sysmex Corp. | 202,200 | 7,082 |
| | Rinnai Corp. | 106,200 | 7,049 |
| | FamilyMart Co. Ltd. | 191,300 | 6,944 |
| | Mitsubishi UFJ Lease & Finance Co. Ltd. | 173,600 | 6,940 |
| | Kawasaki Kisen Kaisha Ltd. | 2,057,000 | 6,898 |
| | NTN Corp. | 1,428,000 | 6,857 |
| | Seiko Epson Corp. | 393,200 | 6,842 |
| | Nissin Foods Holdings Co. Ltd. | 192,100 | 6,809 |
| | Ebara Corp. | 1,206,000 | 6,804 |
| * | Sumco Corp. | 352,300 | 6,796 |
| | NGK Spark Plug Co. Ltd. | 480,000 | 6,682 |
| | Shimadzu Corp. | 762,000 | 6,620 |
| | Hitachi Metals Ltd. | 499,000 | 6,573 |
| | Hiroshima Bank Ltd. | 1,503,000 | 6,569 |
| | TOTO Ltd. | 835,000 | 6,556 |
| | Asics Corp. | 451,000 | 6,522 |
| | Toyo Suisan Kaisha Ltd. | 283,000 | 6,517 |
| | Kaneka Corp. | 892,000 | 6,511 |
| | Nomura Research Institute Ltd. | 301,300 | 6,477 |
| | SBI Holdings Inc. | 60,024 | 6,471 |
| | Ushio Inc. | 317,400 | 6,463 |
| | Gunma Bank Ltd. | 1,188,000 | 6,431 |
| | Hitachi Chemical Co. Ltd. | 311,000 | 6,410 |
| | Kamigumi Co. Ltd. | 748,000 | 6,406 |
| | Taiyo Nippon Sanso Corp. | 793,000 | 6,405 |
| | Shimamura Co. Ltd. | 67,100 | 6,319 |
| | Miraca Holdings Inc. | 165,000 | 6,282 |
| | J Front Retailing Co. Ltd. | 1,443,000 | 6,271 |
| | Namco Bandai Holdings Inc. | 566,800 | 6,259 |
| | Mitsui Mining & Smelting Co. Ltd. | 1,747,000 | 6,254 |
| | Advance Residence Investment Corp. Class A | 2,970 | 6,220 |
| | Showa Shell Sekiyu KK | 567,900 | 6,196 |
| | MISUMI Group Inc. | 244,000 | 6,153 |
| | Chugoku Bank Ltd. | 527,000 | 6,142 |
47
| | | |
| Vanguard® Total International Stock Index Fund | | |
| Schedule of Investments | | |
| April 30, 2011 | | |
| |
| | | | Market |
| | | | Value |
| | | Shares | ($000) |
| | Dainippon Screen Manufacturing Co. Ltd. | 653,000 | 6,064 |
| | Iyo Bank Ltd. | 724,000 | 6,055 |
| | Tosoh Corp. | 1,563,000 | 6,046 |
| | Nomura Real Estate Office Fund Inc. Class A | 833 | 6,031 |
| | Yamaha Corp. | 479,500 | 5,997 |
| | Nippon Paper Group Inc. | 298,000 | 5,988 |
| | Kansai Paint Co. Ltd. | 663,000 | 5,980 |
| | Toho Gas Co. Ltd. | 1,257,000 | 5,887 |
| | Sumitomo Rubber Industries Ltd. | 519,500 | 5,887 |
| | Tokyu Land Corp. | 1,360,000 | 5,875 |
| | Cosmo Oil Co. Ltd. | 1,779,000 | 5,872 |
| | Japan Prime Realty Investment Corp. | 2,064 | 5,869 |
| | Aeon Mall Co. Ltd. | 243,600 | 5,859 |
| | Yamaguchi Financial Group Inc. | 640,000 | 5,781 |
| | Nishi-Nippon City Bank Ltd. | 2,029,000 | 5,747 |
| | Casio Computer Co. Ltd. | 720,500 | 5,729 |
| | Tsumura & Co. | 183,800 | 5,717 |
| * | Gree Inc. | 277,000 | 5,704 |
| | Konami Corp. | 286,100 | 5,702 |
| | Minebea Co. Ltd. | 1,032,000 | 5,585 |
| | Takashimaya Co. Ltd. | 805,000 | 5,504 |
| | Nippon Shokubai Co. Ltd. | 413,000 | 5,421 |
| | Fujikura Ltd. | 1,045,000 | 5,416 |
| | NOK Corp. | 315,700 | 5,396 |
| | Daicel Chemical Industries Ltd. | 836,000 | 5,392 |
| | United Urban Investment Corp. Class A | 4,233 | 5,372 |
| | DIC Corp. | 2,237,000 | 5,363 |
| | Fuji Electric Co. Ltd. | 1,702,000 | 5,362 |
| | Air Water Inc. | 442,124 | 5,345 |
| *,^ | CyberAgent Inc. | 1,481 | 5,334 |
| | Alps Electric Co. Ltd. | 526,100 | 5,261 |
| | Mitsui Engineering & Shipbuilding Co. Ltd. | 2,112,000 | 5,244 |
| | Mori Trust Sogo Reit Inc. | 515 | 5,231 |
| | Yokogawa Electric Corp. | 645,300 | 5,228 |
| | Suruga Bank Ltd. | 626,000 | 5,225 |
| | USS Co. Ltd. | 66,620 | 5,120 |
| | McDonald's Holdings Co. Japan Ltd. | 197,000 | 5,049 |
| | Oracle Corp. Japan | 116,100 | 5,031 |
| | UNY Co. Ltd. | 573,900 | 5,029 |
| | Shinsei Bank Ltd. | 4,174,974 | 5,021 |
| | Suzuken Co. Ltd. | 200,200 | 5,005 |
| | Tokuyama Corp. | 960,000 | 4,991 |
| | Dowa Holdings Co. Ltd. | 757,000 | 4,965 |
| | Daido Steel Co. Ltd. | 868,000 | 4,961 |
| | Frontier Real Estate Investment Corp. | 534 | 4,951 |
| | Don Quijote Co. Ltd. | 129,200 | 4,839 |
| | Keisei Electric Railway Co. Ltd. | 833,000 | 4,833 |
| | 77 Bank Ltd. | 1,034,000 | 4,776 |
| | Chiyoda Corp. | 478,191 | 4,760 |
| | Yamatake Corp. | 184,800 | 4,735 |
| | Toho Co. Ltd. | 312,400 | 4,730 |
| | Kikkoman Corp. | 474,000 | 4,705 |
| | Marui Group Co. Ltd. | 680,300 | 4,700 |
| | Dainippon Sumitomo Pharma Co. Ltd. | 486,700 | 4,680 |
| | Zeon Corp. | 518,000 | 4,680 |
| | Yamazaki Baking Co. Ltd. | 361,000 | 4,655 |
| | Koito Manufacturing Co. Ltd. | 295,888 | 4,653 |
| | Disco Corp. | 67,500 | 4,632 |
| | Nippon Kayaku Co. Ltd. | 477,000 | 4,608 |
| | Sanrio Co. Ltd. | 136,100 | 4,529 |
| | Nomura Real Estate Holdings Inc. | 290,697 | 4,490 |
| | Citizen Holdings Co. Ltd. | 737,800 | 4,467 |
| | Hitachi High-Technologies Corp. | 211,400 | 4,449 |
| | K's Holdings Corp. | 141,500 | 4,410 |
48
| | | |
| Vanguard® Total International Stock Index Fund | | |
| Schedule of Investments | | |
| April 30, 2011 | | |
| |
| | | | Market |
| | | | Value |
| | | Shares | ($000) |
| | Nissan Chemical Industries Ltd. | 424,600 | 4,406 |
| | Nishi-Nippon Railroad Co. Ltd. | 1,003,000 | 4,335 |
| | Nagase & Co. Ltd. | 342,000 | 4,332 |
| | Japan Petroleum Exploration Co. | 88,100 | 4,319 |
| | Nippon Paint Co. Ltd. | 615,000 | 4,315 |
| | Wacoal Holdings Corp. | 331,000 | 4,309 |
| | Mizuho Securities Co. Ltd. | 1,684,000 | 4,286 |
| | Toyoda Gosei Co. Ltd. | 196,100 | 4,285 |
| ^ | Taiheiyo Cement Corp. | 2,494,400 | 4,277 |
| | Sapporo Hokuyo Holdings Inc. | 961,200 | 4,264 |
| | NHK Spring Co. Ltd. | 448,000 | 4,260 |
| | Yamato Kogyo Co. Ltd. | 128,500 | 4,241 |
| ^ | Orix JREIT Inc. Class A | 775 | 4,231 |
| | Nisshin Steel Co. Ltd. | 2,118,000 | 4,228 |
| | Alfresa Holdings Corp. | 119,300 | 4,213 |
| | OSAKA Titanium Technologies Co. | 54,200 | 4,210 |
| | Lintec Corp. | 142,100 | 4,205 |
| | Taiyo Yuden Co. Ltd. | 298,000 | 4,196 |
| | Tokyo Tatemono Co. Ltd. | 1,158,000 | 4,187 |
| | Nippon Accommodations Fund Inc. Class A | 564 | 4,140 |
| | Rengo Co. Ltd. | 671,000 | 4,017 |
| | Obic Co. Ltd. | 21,440 | 3,976 |
| | Mizuho Trust & Banking Co. Ltd. | 4,659,000 | 3,940 |
| | Japan Logistics Fund Inc. | 459 | 3,937 |
| | Toyobo Co. Ltd. | 2,491,000 | 3,936 |
| | Osaka Securities Exchange Co. Ltd. | 765 | 3,876 |
| | Mabuchi Motor Co. Ltd. | 77,900 | 3,865 |
| | Awa Bank Ltd. | 618,000 | 3,861 |
| | Nisshinbo Holdings Inc. | 385,000 | 3,811 |
| | OKUMA Corp. | 404,000 | 3,806 |
| | Mitsubishi Logistics Corp. | 344,000 | 3,805 |
| | Hino Motors Ltd. | 798,000 | 3,782 |
| | Glory Ltd. | 171,600 | 3,769 |
| | Hakuhodo DY Holdings Inc. | 71,450 | 3,741 |
| | MediPal Holdings Corp. | 442,700 | 3,682 |
| | Kewpie Corp. | 305,900 | 3,664 |
| | Mori Seiki Co. Ltd. | 283,600 | 3,652 |
| | Kobayashi Pharmaceutical Co. Ltd. | 77,500 | 3,643 |
| | Sankyu Inc. | 792,000 | 3,640 |
| | Shiga Bank Ltd. | 674,000 | 3,616 |
| | Seven Bank Ltd. | 1,894 | 3,589 |
| | Sumitomo Bakelite Co. Ltd. | 558,000 | 3,579 |
| | Kagome Co. Ltd. | 205,300 | 3,575 |
| | Keiyo Bank Ltd. | 721,000 | 3,547 |
| | Sumitomo Forestry Co. Ltd. | 404,300 | 3,543 |
| | Nifco Inc. | 138,900 | 3,512 |
| | Kinden Corp. | 410,000 | 3,495 |
| | Nichirei Corp. | 791,000 | 3,475 |
| | Yokohama Rubber Co. Ltd. | 676,000 | 3,457 |
| | San-In Godo Bank Ltd. | 466,000 | 3,456 |
| | Maruichi Steel Tube Ltd. | 138,000 | 3,434 |
| | COMSYS Holdings Corp. | 328,100 | 3,433 |
| | Sawai Pharmaceutical Co. Ltd. | 38,100 | 3,419 |
| | Lion Corp. | 651,000 | 3,415 |
| | Kayaba Industry Co. Ltd. | 407,000 | 3,386 |
| | Coca-Cola West Co. Ltd. | 163,200 | 3,380 |
| | House Foods Corp. | 202,900 | 3,321 |
| | Nanto Bank Ltd. | 674,000 | 3,297 |
| | Tokyo Steel Manufacturing Co. Ltd. | 302,500 | 3,278 |
| | Seino Holdings Corp. | 436,000 | 3,275 |
| ^ | Aozora Bank Ltd. | 1,503,000 | 3,256 |
| | Hitachi Zosen Corp. | 2,229,000 | 3,255 |
| | Tokyu REIT Inc. | 467 | 3,246 |
| * | Pioneer Corp. | 767,200 | 3,245 |
49
| | | |
| Vanguard® Total International Stock Index Fund | | |
| Schedule of Investments | | |
| April 30, 2011 | | |
| |
| | | | Market |
| | | | Value |
| | | Shares | ($000) |
| | Square Enix Holdings Co. Ltd. | 194,500 | 3,241 |
| | Sumitomo Osaka Cement Co. Ltd. | 1,179,000 | 3,206 |
| | Asahi Diamond Industrial Co. Ltd. | 154,000 | 3,203 |
| | Ryohin Keikaku Co. Ltd. | 68,700 | 3,189 |
| | Sotetsu Holdings Inc. | 1,153,000 | 3,164 |
| | Toagosei Co. Ltd. | 581,000 | 3,147 |
| | Autobacs Seven Co. Ltd. | 85,600 | 3,146 |
| | Shimachu Co. Ltd. | 134,600 | 3,142 |
| | Horiba Ltd. | 104,200 | 3,135 |
| | Takata Corp. | 102,800 | 3,123 |
| | Aeon Credit Service Co. Ltd. | 229,900 | 3,117 |
| | Kaken Pharmaceutical Co. Ltd. | 240,000 | 3,114 |
| | Nippon Light Metal Co. Ltd. | 1,523,000 | 3,112 |
| | Otsuka Corp. | 49,300 | 3,096 |
| | Juroku Bank Ltd. | 994,000 | 3,082 |
| | Duskin Co. Ltd. | 152,700 | 3,081 |
| | Tokai Carbon Co. Ltd. | 584,000 | 3,080 |
| | Kagoshima Bank Ltd. | 457,000 | 3,073 |
| | Mitsumi Electric Co. Ltd. | 238,800 | 3,062 |
| | Kenedix Realty Investment Corp. Class A | 720 | 3,060 |
| | Pacific Metals Co. Ltd. | 403,000 | 3,053 |
| | Park24 Co. Ltd. | 291,900 | 3,050 |
| | Kakaku.com Inc. | 529 | 3,049 |
| | Sapporo Holdings Ltd. | 755,000 | 3,034 |
| | Higo Bank Ltd. | 525,000 | 3,027 |
| | Itochu Techno-Solutions Corp. | 84,900 | 3,010 |
| | Hyakugo Bank Ltd. | 688,000 | 2,999 |
| | Toyota Boshoku Corp. | 192,400 | 2,998 |
| | Makino Milling Machine Co. Ltd. | 317,000 | 2,980 |
| | Sundrug Co. Ltd. | 105,000 | 2,970 |
| | OSG Corp. | 218,100 | 2,924 |
| | Aoyama Trading Co. Ltd. | 177,100 | 2,917 |
| | Daishi Bank Ltd. | 924,000 | 2,915 |
| | ABC-Mart Inc. | 77,400 | 2,900 |
| | Exedy Corp. | 90,600 | 2,894 |
| | Hokkoku Bank Ltd. | 855,000 | 2,890 |
| | Nachi-Fujikoshi Corp. | 517,000 | 2,889 |
| | Senshu Ikeda Holdings Inc. | 1,933,700 | 2,887 |
| | Japan Excellent Inc. | 521 | 2,871 |
| ^ | Daiwa Office Investment Corp. Class A | 800 | 2,867 |
| | Nipro Corp. | 140,500 | 2,865 |
| | Ito En Ltd. | 160,900 | 2,856 |
| | Ogaki Kyoritsu Bank Ltd. | 885,000 | 2,840 |
| | Kiyo Holdings Inc. | 1,969,000 | 2,802 |
| | NTT Urban Development Corp. | 3,374 | 2,800 |
| | Toyo Ink SC Holdings Co. Ltd. | 549,000 | 2,780 |
| | Musashino Bank Ltd. | 85,900 | 2,720 |
| | Kyowa Exeo Corp. | 257,100 | 2,705 |
| | Toho Titanium Co. Ltd. | 94,700 | 2,667 |
| * | Haseko Corp. | 3,979,000 | 2,667 |
| | Fuji Oil Co. Ltd. | 191,600 | 2,660 |
| | Tokai Rika Co. Ltd. | 151,700 | 2,658 |
| | KYORIN Holdings Inc. | 148,000 | 2,642 |
| | Onward Holdings Co. Ltd. | 351,000 | 2,615 |
| | Rohto Pharmaceutical Co. Ltd. | 257,000 | 2,613 |
| | Ulvac Inc. | 116,700 | 2,612 |
| | Universal Entertainment Corp. | 71,200 | 2,606 |
| | Capcom Co. Ltd. | 139,800 | 2,598 |
| | Century Tokyo Leasing Corp. | 150,000 | 2,574 |
| | Ezaki Glico Co. Ltd. | 215,000 | 2,571 |
| | Hyakujushi Bank Ltd. | 686,000 | 2,561 |
| | Nichicon Corp. | 166,500 | 2,559 |
| | Top REIT Inc. | 412 | 2,502 |
| | Takara Holdings Inc. | 513,000 | 2,497 |
50
| | | |
| Vanguard® Total International Stock Index Fund | | |
| Schedule of Investments | | |
| April 30, 2011 | | |
| |
| | | | Market |
| | | | Value |
| | | Shares | ($000) |
| | Tokyo Ohka Kogyo Co. Ltd. | 117,100 | 2,476 |
| | Hanwa Co. Ltd. | 577,000 | 2,466 |
| | Start Today Co. Ltd. | 140,100 | 2,449 |
| | ADEKA Corp. | 245,200 | 2,429 |
| | Global One Real Estate Investment Corp. | 273 | 2,427 |
| | IT Holdings Corp. | 246,300 | 2,422 |
| ^ | Anritsu Corp. | 302,000 | 2,410 |
| | Komeri Co. Ltd. | 88,000 | 2,396 |
| | Toda Corp. | 641,000 | 2,381 |
| | Jafco Co. Ltd. | 92,400 | 2,367 |
| | Fuji Machine Manufacturing Co. Ltd. | 101,200 | 2,363 |
| | TS Tech Co. Ltd. | 133,600 | 2,351 |
| | Asatsu-DK Inc. | 89,400 | 2,346 |
| | Nihon Kohden Corp. | 109,800 | 2,332 |
| | Kose Corp. | 88,900 | 2,317 |
| ^ | Meidensha Corp. | 535,000 | 2,292 |
| | Miura Co. Ltd. | 80,300 | 2,282 |
| | Morinaga Milk Industry Co. Ltd. | 561,000 | 2,265 |
| | Daiseki Co. Ltd. | 106,600 | 2,263 |
| | Keihin Corp. | 117,300 | 2,246 |
| | Sugi Holdings Co. Ltd. | 93,700 | 2,244 |
| | Tsubakimoto Chain Co. | 421,000 | 2,240 |
| | Daiichikosho Co. Ltd. | 127,700 | 2,237 |
| | NET One Systems Co. Ltd. | 1,233 | 2,233 |
| | H2O Retailing Corp. | 306,000 | 2,224 |
| | Mochida Pharmaceutical Co. Ltd. | 200,000 | 2,224 |
| | Sanwa Holdings Corp. | 682,000 | 2,219 |
| | FP Corp. | 38,400 | 2,216 |
| | BLife Investment Corp. | 300 | 2,210 |
| | FCC Co. Ltd. | 93,600 | 2,204 |
| ^ | Promise Co. Ltd. | 257,550 | 2,199 |
| | Ryosan Co. Ltd. | 94,600 | 2,195 |
| | SKY Perfect JSAT Holdings Inc. | 5,472 | 2,187 |
| | Aica Kogyo Co. Ltd. | 163,800 | 2,168 |
| | Bank of Okinawa Ltd. | 54,000 | 2,166 |
| | Tokyo Seimitsu Co. Ltd. | 110,200 | 2,156 |
| | M3 Inc. | 330 | 2,145 |
| | Toyota Auto Body Co. Ltd. | 121,100 | 2,143 |
| | Takara Standard Co. Ltd. | 283,000 | 2,138 |
| | Nippon Chemi-Con Corp. | 408,000 | 2,135 |
| | Point Inc. | 46,500 | 2,128 |
| | Toho Zinc Co. Ltd. | 390,000 | 2,127 |
| | Canon Marketing Japan Inc. | 191,600 | 2,122 |
| | Megmilk Snow Brand Co. Ltd. | 135,600 | 2,107 |
| ^ | Zensho Co. Ltd. | 198,700 | 2,096 |
| | Fukui Bank Ltd. | 691,000 | 2,091 |
| | Hitachi Capital Corp. | 146,500 | 2,090 |
| | Hoshizaki Electric Co. Ltd. | 107,300 | 2,086 |
| ^ | Nichi-iko Pharmaceutical Co. Ltd. | 80,600 | 2,083 |
| | Izumi Co. Ltd. | 145,400 | 2,081 |
| | Hokuetsu Kishu Paper Co. Ltd. | 372,000 | 2,080 |
| | Nomura Real Estate Residential Fund Inc. | 335 | 2,058 |
| | Yamagata Bank Ltd. | 421,000 | 2,054 |
| | NOF Corp. | 465,000 | 2,041 |
| | Matsumotokiyoshi Holdings Co. Ltd. | 95,300 | 2,025 |
| | Fukuoka REIT Co. Class A | 271 | 2,012 |
| | Shima Seiki Manufacturing Ltd. | 75,700 | 2,008 |
| | Shinko Electric Industries Co. Ltd. | 195,500 | 2,008 |
| | Central Glass Co. Ltd. | 507,000 | 2,004 |
| | Tsuruha Holdings Inc. | 42,300 | 2,001 |
| | Nihon Parkerizing Co. Ltd. | 143,000 | 1,989 |
| | Accordia Golf Co. Ltd. | 3,082 | 1,988 |
| | Fukuyama Transporting Co. Ltd. | 411,000 | 1,986 |
| | Okumura Corp. | 507,000 | 1,983 |
51
| | | |
| Vanguard® Total International Stock Index Fund | | |
| Schedule of Investments | | |
| April 30, 2011 | | |
| |
| | | | Market |
| | | | Value |
| | | Shares | ($000) |
| | Calsonic Kansei Corp. | 482,000 | 1,964 |
| | Circle K Sunkus Co. Ltd. | 127,000 | 1,961 |
| ^ | Penta-Ocean Construction Co. Ltd. | 877,500 | 1,937 |
| | Aichi Steel Corp. | 319,000 | 1,934 |
| | Nissin Kogyo Co. Ltd. | 114,100 | 1,919 |
| | Sohgo Security Services Co. Ltd. | 167,000 | 1,917 |
| | Toshiba TEC Corp. | 415,000 | 1,917 |
| ^ | Nissha Printing Co. Ltd. | 93,632 | 1,912 |
| | Matsui Securities Co. Ltd. | 387,500 | 1,910 |
| | Nippon Shinyaku Co. Ltd. | 146,000 | 1,904 |
| | Okasan Securities Group Inc. | 527,000 | 1,891 |
| | Nissan Shatai Co. Ltd. | 250,000 | 1,873 |
| | Nippon Konpo Unyu Soko Co. Ltd. | 174,000 | 1,868 |
| | Tokai Tokyo Financial Holdings Inc. | 623,000 | 1,867 |
| | Maeda Road Construction Co. Ltd. | 195,000 | 1,851 |
| ^ | Toyo Tanso Co. Ltd. | 33,300 | 1,850 |
| | Hitachi Transport System Ltd. | 132,700 | 1,844 |
| | Iwatani Corp. | 558,000 | 1,841 |
| | Meitec Corp. | 94,900 | 1,839 |
| | Heiwa Corp. | 118,700 | 1,836 |
| | Nippon Suisan Kaisha Ltd. | 656,300 | 1,835 |
| * | JVC Kenwood Holdings Inc. | 355,900 | 1,834 |
| | Yamanashi Chuo Bank Ltd. | 411,000 | 1,833 |
| | Sanken Electric Co. Ltd. | 342,000 | 1,833 |
| | Mirait Holdings Corp. | 242,100 | 1,830 |
| | Fuji Media Holdings Inc. | 1,369 | 1,830 |
| | Nichias Corp. | 299,000 | 1,819 |
| * | Oki Electric Industry Co. Ltd. | 2,219,000 | 1,819 |
| | Okinawa Electric Power Co. Inc. | 41,700 | 1,819 |
| | Premier Investment Corp. Class A | 390 | 1,819 |
| | SHO-BOND Holdings Co. Ltd. | 69,300 | 1,814 |
| | Nippon Flour Mills Co. Ltd. | 364,000 | 1,805 |
| | Sangetsu Co. Ltd. | 78,300 | 1,801 |
| ^ | Yoshinoya Holdings Co. Ltd. | 1,481 | 1,799 |
| | Mori Hills REIT Investment Corp. | 519 | 1,797 |
| | Maruha Nichiro Holdings Inc. | 1,205,000 | 1,795 |
| | Japan Wool Textile Co. Ltd. | 201,000 | 1,784 |
| | Futaba Corp. | 95,100 | 1,773 |
| | Pigeon Corp. | 51,400 | 1,770 |
| | Shochiku Co. Ltd. | 245,000 | 1,768 |
| | Kureha Corp. | 352,000 | 1,764 |
| | EDION Corp. | 204,100 | 1,761 |
| | Tadano Ltd. | 329,000 | 1,760 |
| | Gunze Ltd. | 482,000 | 1,746 |
| | Sumitomo Warehouse Co. Ltd. | 379,000 | 1,745 |
| | Kissei Pharmaceutical Co. Ltd. | 92,000 | 1,737 |
| | Daio Paper Corp. | 240,000 | 1,736 |
| | Hosiden Corp. | 173,000 | 1,734 |
| | Nippon Soda Co. Ltd. | 390,000 | 1,712 |
| | Kokuyo Co. Ltd. | 230,500 | 1,705 |
| | Taikisha Ltd. | 88,500 | 1,699 |
| *,^ | Digital Garage Inc. | 309 | 1,699 |
| | Dr Ci:Labo Co. Ltd. | 401 | 1,699 |
| ^ | Funai Electric Co. Ltd. | 55,900 | 1,695 |
| | Nisshin Oillio Group Ltd. | 359,000 | 1,681 |
| ^ | Acom Co. Ltd. | 114,500 | 1,678 |
| | Amano Corp. | 180,200 | 1,673 |
| | MID Reit Inc. | 535 | 1,666 |
| | Sanyo Special Steel Co. Ltd. | 298,000 | 1,664 |
| | Aomori Bank Ltd. | 545,000 | 1,664 |
| | Toshiba Machine Co. Ltd. | 311,000 | 1,663 |
| | Daifuku Co. Ltd. | 244,500 | 1,659 |
| | Sanden Corp. | 350,000 | 1,657 |
| | Unipres Corp. | 77,200 | 1,654 |
52
| | | |
| Vanguard® Total International Stock Index Fund | | |
| Schedule of Investments | | |
| April 30, 2011 | | |
| |
| | | | Market |
| | | | Value |
| | | Shares | ($000) |
| | Taiyo Holdings Co. Ltd. | 53,100 | 1,641 |
| | Komori Corp. | 172,200 | 1,639 |
| | Alpine Electronics Inc. | 129,700 | 1,629 |
| | Bank of Iwate Ltd. | 42,600 | 1,615 |
| | Yodogawa Steel Works Ltd. | 382,000 | 1,612 |
| | Towa Pharmaceutical Co. Ltd. | 30,900 | 1,611 |
| | Japan Airport Terminal Co. Ltd. | 124,100 | 1,605 |
| | HIS Co. Ltd. | 67,000 | 1,605 |
| | Musashi Seimitsu Industry Co. Ltd. | 66,400 | 1,603 |
| | Saizeriya Co. Ltd. | 93,600 | 1,596 |
| ^ | Nippon Thompson Co. Ltd. | 212,000 | 1,578 |
| | Nippon Denko Co. Ltd. | 238,000 | 1,557 |
| | Akita Bank Ltd. | 527,000 | 1,556 |
| | Fuyo General Lease Co. Ltd. | 49,400 | 1,548 |
| | Itoham Foods Inc. | 388,000 | 1,540 |
| | PanaHome Corp. | 228,000 | 1,524 |
| | CKD Corp. | 167,900 | 1,523 |
| ^ | Kandenko Co. Ltd. | 293,000 | 1,517 |
| | Kansai Urban Banking Corp. | 845,000 | 1,513 |
| | Nakanishi Inc. | 14,300 | 1,500 |
| | Shikoku Bank Ltd. | 500,000 | 1,500 |
| | Toho Bank Ltd. | 608,000 | 1,498 |
| | Oiles Corp. | 77,300 | 1,491 |
| | Japan Securities Finance Co. Ltd. | 236,400 | 1,482 |
| ^ | Ferrotec Corp. | 64,400 | 1,473 |
| | Aichi Bank Ltd. | 24,600 | 1,471 |
| | DCM Holdings Co. Ltd. | 227,100 | 1,445 |
| | Tokyo Rope Manufacturing Co. Ltd. | 366,000 | 1,443 |
| | Chofu Seisakusho Co. Ltd. | 59,200 | 1,443 |
| | Hulic Co. Ltd. | 171,100 | 1,431 |
| | Hogy Medical Co. Ltd. | 34,200 | 1,413 |
| | Oita Bank Ltd. | 442,000 | 1,407 |
| | Bank of Nagoya Ltd. | 438,000 | 1,391 |
| | Toyo Engineering Corp. | 344,000 | 1,390 |
| | Foster Electric Co. Ltd. | 59,300 | 1,388 |
| | TOMONY Holdings Inc. | 393,600 | 1,388 |
| | Kintetsu World Express Inc. | 41,000 | 1,385 |
| | Hokuto Corp. | 61,800 | 1,382 |
| | Nitto Boseki Co. Ltd. | 564,000 | 1,370 |
| | Sanyo Chemical Industries Ltd. | 167,000 | 1,365 |
| | Topy Industries Ltd. | 514,000 | 1,358 |
| | Takasago Thermal Engineering Co. Ltd. | 158,800 | 1,356 |
| ^ | Sekisui House SI Investment Co. Class A | 295 | 1,348 |
| | Nishimatsuya Chain Co. Ltd. | 158,600 | 1,342 |
| * | Daikyo Inc. | 831,000 | 1,341 |
| | Kitz Corp. | 255,700 | 1,332 |
| | Nikkiso Co. Ltd. | 160,000 | 1,329 |
| | JFE Shoji Holdings Inc. | 301,000 | 1,328 |
| | Chugoku Marine Paints Ltd. | 157,000 | 1,328 |
| | Inaba Denki Sangyo Co. Ltd. | 50,000 | 1,319 |
| | Ryobi Ltd. | 339,000 | 1,314 |
| | Hikari Tsushin Inc. | 66,500 | 1,309 |
| | Wacom Co. Ltd. | 1,021 | 1,305 |
| | Tomy Co. Ltd. | 150,900 | 1,301 |
| | Canon Electronics Inc. | 54,100 | 1,298 |
| | Asahi Holdings Inc. | 62,000 | 1,285 |
| | Hitachi Koki Co. Ltd. | 140,200 | 1,284 |
| | Fancl Corp. | 92,800 | 1,275 |
| | Toho Holdings Co. Ltd. | 123,300 | 1,272 |
| | Xebio Co. Ltd. | 68,200 | 1,265 |
| | Mandom Corp. | 48,100 | 1,265 |
| | MOS Food Services Inc. | 68,400 | 1,257 |
| | Toshiba Plant Systems & Services Corp. | 110,000 | 1,256 |
| | Nippon Gas Co. Ltd. | 90,100 | 1,255 |
53
| | | |
| Vanguard® Total International Stock Index Fund | | |
| Schedule of Investments | | |
| April 30, 2011 | | |
| |
| | | | Market |
| | | | Value |
| | | Shares | ($000) |
| | Tokai Rubber Industries Ltd. | 102,900 | 1,253 |
| | Bank of the Ryukyus Ltd. | 105,800 | 1,250 |
| | Max Co. Ltd. | 101,000 | 1,249 |
| | Press Kogyo Co. Ltd. | 273,000 | 1,249 |
| | Yachiyo Bank Ltd. | 40,900 | 1,249 |
| | Earth Chemical Co. Ltd. | 37,400 | 1,247 |
| | Sakai Chemical Industry Co. Ltd. | 238,000 | 1,245 |
| | Nippon Coke & Engineering Co. Ltd. | 649,000 | 1,242 |
| | Star Micronics Co. Ltd. | 109,500 | 1,236 |
| *,^ | Iseki & Co. Ltd. | 545,000 | 1,235 |
| | Nippo Corp. | 153,000 | 1,232 |
| * | Kenedix Inc. | 6,734 | 1,230 |
| | Toyo Tire & Rubber Co. Ltd. | 503,000 | 1,230 |
| | So-net Entertainment Corp. | 326 | 1,227 |
| | Morinaga & Co. Ltd. | 543,000 | 1,222 |
| | Paramount Bed Co. Ltd. | 44,800 | 1,215 |
| ^ | Mitsui Sugar Co. Ltd. | 242,000 | 1,209 |
| | Sintokogio Ltd. | 120,800 | 1,209 |
| | Nippon Seiki Co. Ltd. | 104,000 | 1,206 |
| | Mitsubishi Steel Manufacturing Co. Ltd. | 357,000 | 1,205 |
| | Hitachi Cable Ltd. | 501,000 | 1,200 |
| | Eighteenth Bank Ltd. | 440,000 | 1,194 |
| | Mizuho Investors Securities Co. Ltd. | 1,234,000 | 1,180 |
| | Internet Initiative Japan Inc. | 346 | 1,180 |
| | Fuji Seal International Inc. | 55,900 | 1,180 |
| | Hitachi Kokusai Electric Inc. | 141,000 | 1,176 |
| | Tokyo Style Co. Ltd. | 174,000 | 1,176 |
| | Shinko Plantech Co. Ltd. | 104,900 | 1,175 |
| | Sakata Seed Corp. | 82,700 | 1,173 |
| | Ain Pharmaciez Inc. | 29,800 | 1,160 |
| ^ | Hankyu Reit Inc. Class A | 205 | 1,159 |
| | Hokuetsu Bank Ltd. | 538,000 | 1,158 |
| | IBJ Leasing Co. Ltd. | 46,900 | 1,157 |
| | Nishimatsu Construction Co. Ltd. | 756,000 | 1,153 |
| | Ehime Bank Ltd. | 408,000 | 1,152 |
| | Tamron Co. Ltd. | 52,200 | 1,150 |
| | Tokyo Tomin Bank Ltd. | 85,600 | 1,144 |
| | Industrial & Infrastructure Fund Investment Corp. | 218 | 1,144 |
| | Avex Group Holdings Inc. | 92,000 | 1,144 |
| | Round One Corp. | 188,000 | 1,143 |
| ^ | Dai-ichi Seiko Co. Ltd. | 22,000 | 1,134 |
| ^ | Akebono Brake Industry Co. Ltd. | 213,100 | 1,120 |
| ^ | Kadokawa Group Holdings Inc. | 42,700 | 1,115 |
| | Heiwa Real Estate Co. Ltd. | 496,500 | 1,114 |
| | Joshin Denki Co. Ltd. | 115,000 | 1,114 |
| | Daiwabo Holdings Co. Ltd. | 542,000 | 1,112 |
| | Parco Co. Ltd. | 129,700 | 1,107 |
| | Arcs Co. Ltd. | 71,400 | 1,106 |
| *,^ | Ishihara Sangyo Kaisha Ltd. | 920,000 | 1,106 |
| ^ | Kohnan Shoji Co. Ltd. | 66,500 | 1,097 |
| | Noritake Co. Ltd. | 271,000 | 1,085 |
| | Daihen Corp. | 270,000 | 1,083 |
| | Moshi Moshi Hotline Inc. | 59,050 | 1,083 |
| * | Kanematsu Corp. | 1,088,000 | 1,081 |
| | Nitta Corp. | 59,900 | 1,074 |
| | Seikagaku Corp. | 92,400 | 1,071 |
| | Message Co. Ltd. | 373 | 1,071 |
| | Melco Holdings Inc. | 33,400 | 1,069 |
| | Mizuno Corp. | 247,000 | 1,066 |
| * | Tokyo Dome Corp. | 491,000 | 1,063 |
| | Iino Kaiun Kaisha Ltd. | 222,400 | 1,058 |
| | Daibiru Corp. | 133,100 | 1,056 |
| ^ | Tsugami Corp. | 155,000 | 1,053 |
| | Geo Corp. | 909 | 1,053 |
54
| | | |
| Vanguard® Total International Stock Index Fund | | |
| Schedule of Investments | | |
| April 30, 2011 | | |
| |
| | | | Market |
| | | | Value |
| | | Shares | ($000) |
| | Heiwado Co. Ltd. | 82,900 | 1,051 |
| | Tochigi Bank Ltd. | 258,000 | 1,048 |
| | Takasago International Corp. | 201,000 | 1,046 |
| ^ | Fuji Co. Ltd. | 50,500 | 1,045 |
| | Sumitomo Real Estate Sales Co. Ltd. | 25,660 | 1,044 |
| | Japan Aviation Electronics Industry Ltd. | 143,000 | 1,043 |
| | Maeda Corp. | 343,000 | 1,042 |
| | Nippon Signal Co. Ltd. | 133,400 | 1,042 |
| | Toppan Forms Co. Ltd. | 130,000 | 1,040 |
| | Aeon Delight Co. Ltd. | 54,200 | 1,039 |
| | Arnest One Corp. | 111,400 | 1,036 |
| | Doutor Nichires Holdings Co. Ltd. | 86,500 | 1,030 |
| ^ | WATAMI Co. Ltd. | 58,900 | 1,026 |
| | Monex Group Inc. | 5,122 | 1,020 |
| | Shinmaywa Industries Ltd. | 239,000 | 1,020 |
| * | Cosmos Pharmaceutical Corp. | 22,900 | 1,015 |
| | Nissin Electric Co. Ltd. | 123,000 | 1,011 |
| | NS Solutions Corp. | 52,800 | 1,010 |
| | Tachi-S Co. Ltd. | 59,900 | 1,007 |
| | Dydo Drinco Inc. | 25,800 | 1,007 |
| | FIDEA Holdings Co. Ltd. | 390,700 | 1,004 |
| | Ship Healthcare Holdings Inc. | 76,700 | 996 |
| | Okamura Corp. | 175,000 | 994 |
| | Ricoh Leasing Co. Ltd. | 44,200 | 990 |
| | Resorttrust Inc. | 81,000 | 988 |
| | Minato Bank Ltd. | 530,000 | 988 |
| * | Sumitomo Light Metal Industries Ltd. | 861,000 | 987 |
| | Nichii Gakkan Co. | 124,800 | 982 |
| | Nippon Densetsu Kogyo Co. Ltd. | 102,000 | 981 |
| | Miyazaki Bank Ltd. | 429,000 | 972 |
| | Jaccs Co. Ltd. | 350,000 | 971 |
| | Bando Chemical Industries Ltd. | 230,000 | 969 |
| * | Furukawa Co. Ltd. | 866,000 | 969 |
| | Valor Co. Ltd. | 90,600 | 966 |
| | Nihon Unisys Ltd. | 156,200 | 966 |
| | Koa Corp. | 86,500 | 965 |
| | Dainichiseika Color & Chemicals Manufacturing Co. Ltd. | 172,000 | 965 |
| | Riso Kagaku Corp. | 51,000 | 960 |
| | Fujitec Co. Ltd. | 187,000 | 958 |
| | Kurabo Industries Ltd. | 530,000 | 956 |
| | Kisoji Co. Ltd. | 48,000 | 954 |
| | Coca-Cola Central Japan Co. Ltd. | 69,800 | 950 |
| | Bank of Saga Ltd. | 370,000 | 943 |
| | Japan Rental Housing Investments Inc. Class A | 2,073 | 941 |
| * | Sankyo-Tateyama Holdings Inc. | 650,000 | 941 |
| | Kanto Denka Kogyo Co. Ltd. | 123,000 | 937 |
| *,^ | Orient Corp. | 762,000 | 937 |
| *,^ | Unitika Ltd. | 1,220,000 | 934 |
| | Eizo Nanao Corp. | 41,700 | 933 |
| | Cocokara fine Inc. | 43,500 | 933 |
| | Yusen Logistics Co. Ltd. | 53,100 | 929 |
| | T Hasegawa Co. Ltd. | 60,800 | 929 |
| | Seiren Co. Ltd. | 138,100 | 928 |
| | Heiwa Real Estate REIT Inc. Class A | 1,388 | 923 |
| | Mitsui-Soko Co. Ltd. | 248,000 | 920 |
| | Kato Sangyo Co. Ltd. | 54,300 | 917 |
| | Mitsubishi Pencil Co. Ltd. | 51,100 | 911 |
| | Token Corp. | 21,200 | 904 |
| ^ | Topcon Corp. | 158,400 | 903 |
| | Riken Corp. | 227,000 | 894 |
| | TKC | 41,900 | 894 |
| | Chudenko Corp. | 72,400 | 893 |
| | Stella Chemifa Corp. | 24,500 | 893 |
| | Nippon Synthetic Chemical Industry Co. Ltd. | 140,000 | 888 |
55
| | | |
| Vanguard® Total International Stock Index Fund | | |
| Schedule of Investments | | |
| April 30, 2011 | | |
| |
| | | | Market |
| | | | Value |
| | | Shares | ($000) |
| | Godo Steel Ltd. | 343,000 | 888 |
| | T-Gaia Corp. | 511 | 887 |
| | OBIC Business Consultants Ltd. | 14,650 | 886 |
| | San-A Co. Ltd. | 22,800 | 886 |
| | Shimizu Bank Ltd. | 22,000 | 883 |
| | TOC Co. Ltd. | 215,400 | 882 |
| ^ | Cosel Co. Ltd. | 55,800 | 880 |
| | Shizuoka Gas Co. Ltd. | 149,000 | 880 |
| | Sanyo Denki Co. Ltd. | 102,000 | 878 |
| | Seiko Holdings Corp. | 267,000 | 877 |
| | NSD Co. Ltd. | 94,700 | 877 |
| | Nippon Ceramic Co. Ltd. | 41,400 | 876 |
| | Trusco Nakayama Corp. | 51,700 | 875 |
| | Ariake Japan Co. Ltd. | 51,600 | 872 |
| | Plenus Co. Ltd. | 56,900 | 868 |
| | Toa Corp. | 481,000 | 866 |
| | Chiyoda Co. Ltd. | 65,200 | 864 |
| | Noritz Corp. | 49,100 | 856 |
| | Fuji Soft Inc. | 56,000 | 856 |
| | TV Asahi Corp. | 556 | 854 |
| | Futaba Industrial Co. Ltd. | 148,700 | 852 |
| ^ | Juki Corp. | 339,000 | 852 |
| * | Showa Corp. | 129,900 | 845 |
| | Kyoei Steel Ltd. | 48,000 | 843 |
| | Yamazen Corp. | 147,600 | 843 |
| | Sekisui Jushi Corp. | 81,000 | 842 |
| | Towa Bank Ltd. | 696,000 | 841 |
| | Colowide Co. Ltd. | 151,000 | 838 |
| | Marudai Food Co. Ltd. | 263,000 | 835 |
| | NEC Networks & System Integration Corp. | 63,800 | 834 |
| ^ | Modec Inc. | 44,800 | 829 |
| | Megachips Corp. | 48,300 | 825 |
| | Topre Corp. | 100,000 | 824 |
| | Sanki Engineering Co. Ltd. | 138,000 | 824 |
| | EPS Co. Ltd. | 358 | 821 |
| | Japan Pulp & Paper Co. Ltd. | 227,000 | 821 |
| | Nippon Sharyo Ltd. | 187,000 | 820 |
| * | TOKAI Holdings Corp. | 163,000 | 820 |
| | Torishima Pump Manufacturing Co. Ltd. | 51,100 | 817 |
| | Shindengen Electric Manufacturing Co. Ltd. | 188,000 | 816 |
| | Denki Kogyo Co. Ltd. | 171,000 | 816 |
| | Itochu Enex Co. Ltd. | 150,400 | 816 |
| | Chugai Ro Co. Ltd. | 191,000 | 816 |
| | Fujitsu General Ltd. | 151,000 | 814 |
| | Fuji Kyuko Co. Ltd. | 157,000 | 812 |
| | United Arrows Ltd. | 48,800 | 811 |
| | Vital KSK Holdings Inc. | 95,900 | 806 |
| ^ | Takaoka Electric Manufacturing Co. Ltd. | 207,000 | 806 |
| | BML Inc. | 28,300 | 806 |
| ^ | Toyo Construction Co. Ltd. | 720,000 | 805 |
| | Goldcrest Co. Ltd. | 48,230 | 804 |
| | Cawachi Ltd. | 42,000 | 803 |
| ^ | V Technology Co. Ltd. | 98 | 801 |
| | JSP Corp. | 44,900 | 800 |
| | Mitsuboshi Belting Co. Ltd. | 169,000 | 797 |
| | Sinfonia Technology Co. Ltd. | 256,000 | 797 |
| * | Daiei Inc. | 228,050 | 797 |
| | Okinawa Cellular Telephone Co. | 352 | 794 |
| | Mitsubishi Paper Mills Ltd. | 776,000 | 788 |
| * | SWCC Showa Holdings Co. Ltd. | 624,000 | 788 |
| | Paris Miki Holdings Inc. | 80,400 | 785 |
| | Idec Corp. | 76,600 | 785 |
| | Ohsho Food Service Corp. | 33,300 | 782 |
| | Paltac Corp. | 46,300 | 780 |
56
| | | |
| Vanguard® Total International Stock Index Fund | | |
| Schedule of Investments | | |
| April 30, 2011 | | |
| |
| | | | Market |
| | | | Value |
| | | Shares | ($000) |
| | Kuroda Electric Co. Ltd. | 69,800 | 778 |
| | Milbon Co. Ltd. | 27,660 | 777 |
| | KEY Coffee Inc. | 44,800 | 776 |
| | Asahi Co. Ltd. | 37,500 | 774 |
| | Skymark Airlines Inc. | 57,900 | 774 |
| | St. Marc Holdings Co. Ltd. | 21,000 | 773 |
| | Nitto Kogyo Corp. | 74,600 | 772 |
| ^ | Sumisho Computer Systems Corp. | 54,100 | 770 |
| | Taihei Dengyo Kaisha Ltd. | 85,000 | 769 |
| | Kyosan Electric Manufacturing Co. Ltd. | 135,000 | 768 |
| | Marusan Securities Co. Ltd. | 183,100 | 768 |
| | Osaka Steel Co. Ltd. | 42,300 | 763 |
| | San-Ai Oil Co. Ltd. | 141,000 | 761 |
| | Alpen Co. Ltd. | 46,300 | 760 |
| | Nitto Kohki Co. Ltd. | 31,100 | 759 |
| | Shoei Co. Ltd. | 82,400 | 758 |
| | kabu.com Securities Co. Ltd. | 238,200 | 758 |
| | Toyo Corp. | 74,500 | 757 |
| | Sanyo Shokai Ltd. | 252,000 | 755 |
| | C Uyemura & Co. Ltd. | 16,900 | 755 |
| | AOKI Holdings Inc. | 49,000 | 755 |
| ^ | Shin-Kobe Electric Machinery Co. Ltd. | 49,000 | 754 |
| | PGM Holdings K K | 1,354 | 754 |
| | Icom Inc. | 25,400 | 753 |
| | ASKUL Corp. | 54,400 | 751 |
| | Higashi-Nippon Bank Ltd. | 370,000 | 751 |
| ^ | Toda Kogyo Corp. | 80,000 | 749 |
| | Mitsuba Corp. | 97,000 | 747 |
| | Daiken Corp. | 208,000 | 746 |
| | Izumiya Co. Ltd. | 171,000 | 745 |
| | Pilot Corp. | 402 | 743 |
| | Nittetsu Mining Co. Ltd. | 155,000 | 738 |
| ^ | Dwango Co. Ltd. | 273 | 738 |
| | SMK Corp. | 167,000 | 730 |
| | Nagaileben Co. Ltd. | 27,200 | 728 |
| | Union Tool Co. | 33,000 | 728 |
| | Nidec Sankyo Corp. | 109,000 | 727 |
| | Royal Holdings Co. Ltd. | 70,100 | 723 |
| | Sato Corp. | 54,900 | 719 |
| | As One Corp. | 35,500 | 716 |
| | Toyo Kanetsu KK | 298,000 | 713 |
| | Senko Co. Ltd. | 239,000 | 711 |
| | Yokohama Reito Co. Ltd. | 104,900 | 711 |
| | Sumitomo Seika Chemicals Co. Ltd. | 120,000 | 708 |
| | Ryoyo Electro Corp. | 68,800 | 708 |
| | Okamoto Industries Inc. | 184,000 | 706 |
| | Mie Bank Ltd. | 270,000 | 704 |
| * | OncoTherapy Science Inc. | 370 | 704 |
| ^ | GCA Savvian Group Corp. | 404 | 703 |
| | Showa Sangyo Co. Ltd. | 258,000 | 700 |
| | Inabata & Co. Ltd. | 120,600 | 693 |
| | Mikuni Coca-Cola Bottling Co. Ltd. | 76,600 | 691 |
| * | Nippon Yakin Kogyo Co. Ltd. | 291,000 | 691 |
| * | Takuma Co. Ltd. | 188,000 | 691 |
| | NEC Mobiling Ltd. | 20,700 | 690 |
| | Nippon Beet Sugar Manufacturing Co. Ltd. | 307,000 | 689 |
| | Toyo Kohan Co. Ltd. | 130,000 | 688 |
| ^ | Temp Holdings Co. Ltd. | 74,300 | 686 |
| *,^ | Japan Wind Development Co. Ltd. | 311 | 685 |
| | Nippon Carbon Co. Ltd. | 294,000 | 685 |
| | Maruetsu Inc. | 184,000 | 685 |
| | Harmonic Drive Systems Inc. | 27,000 | 685 |
| | Tocalo Co. Ltd. | 36,200 | 682 |
| | Bic Camera Inc. | 1,480 | 677 |
57
| | | |
| Vanguard® Total International Stock Index Fund | | |
| Schedule of Investments | | |
| April 30, 2011 | | |
| |
| | | | Market |
| | | | Value |
| | | Shares | ($000) |
| | Nihon Dempa Kogyo Co. Ltd. | 44,300 | 675 |
| | Kappa Create Co. Ltd. | 36,700 | 675 |
| | J-Oil Mills Inc. | 240,000 | 674 |
| | AOC Holdings Inc. | 100,700 | 673 |
| | TECMO KOEI HOLDINGS CO Ltd. | 90,100 | 672 |
| | Torii Pharmaceutical Co. Ltd. | 32,700 | 671 |
| | Aisan Industry Co. Ltd. | 71,200 | 670 |
| *,^ | CSK Corp. | 208,500 | 667 |
| | Eagle Industry Co. Ltd. | 64,000 | 667 |
| ^ | ZERIA Pharmaceutical Co. Ltd. | 55,000 | 666 |
| ^ | Mixi Inc. | 171 | 665 |
| | Nippon Valqua Industries Ltd. | 227,000 | 662 |
| | Nihon Yamamura Glass Co. Ltd. | 239,000 | 662 |
| | Organo Corp. | 91,000 | 660 |
| | Fujimi Inc. | 48,100 | 656 |
| | Transcosmos Inc. | 69,900 | 655 |
| ^ | Gulliver International Co. Ltd. | 16,250 | 653 |
| | Kaga Electronics Co. Ltd. | 57,200 | 652 |
| | Osaki Electric Co. Ltd. | 72,000 | 651 |
| | Asahi Organic Chemicals Industry Co. Ltd. | 233,000 | 647 |
| | Ryoshoku Ltd. | 30,300 | 646 |
| | Aida Engineering Ltd. | 147,200 | 645 |
| | Doshisha Co. Ltd. | 29,400 | 644 |
| | Daidoh Ltd. | 64,700 | 643 |
| | Sumitomo Precision Products Co. Ltd. | 80,000 | 640 |
| *,^ | Daiichi Chuo KK | 327,000 | 639 |
| | Takamatsu Construction Group Co. Ltd. | 45,600 | 636 |
| | Shin-Etsu Polymer Co. Ltd. | 117,700 | 633 |
| | Aiphone Co. Ltd. | 38,500 | 633 |
| | Hisaka Works Ltd. | 56,000 | 633 |
| | Ichiyoshi Securities Co. Ltd. | 101,200 | 632 |
| | Kyudenko Corp. | 106,000 | 631 |
| *,^ | NPC Inc. | 31,900 | 630 |
| | Furukawa-Sky Aluminum Corp. | 219,000 | 628 |
| | Macromill Inc. | 54,900 | 625 |
| | T RAD Co. Ltd. | 149,000 | 625 |
| | Roland Corp. | 54,100 | 623 |
| | Yuasa Trading Co. Ltd. | 432,000 | 621 |
| | Fields Corp. | 397 | 621 |
| | Sasebo Heavy Industries Co. Ltd. | 323,000 | 618 |
| | Japan Digital Laboratory Co. Ltd. | 53,400 | 617 |
| * | Takara Bio Inc. | 96,800 | 617 |
| *,^ | Access Co. Ltd. | 650 | 617 |
| * | Tsukuba Bank Ltd. | 211,300 | 613 |
| | Pack Corp. | 38,000 | 613 |
| | Macnica Inc. | 25,800 | 613 |
| | Ministop Co. Ltd. | 37,800 | 612 |
| | Yurtec Corp. | 105,000 | 611 |
| | Neturen Co. Ltd. | 76,800 | 609 |
| ^ | NS United Kaiun Kaisha Ltd. | 305,000 | 609 |
| | Taihei Kogyo Co. Ltd. | 133,000 | 604 |
| | Nagatanien Co. Ltd. | 60,000 | 604 |
| | Achilles Corp. | 421,000 | 603 |
| | Yaoko Co. Ltd. | 20,100 | 601 |
| | Sumikin Bussan Corp. | 259,000 | 600 |
| ^ | Yorozu Corp. | 29,500 | 598 |
| | Okuwa Co. Ltd. | 58,000 | 598 |
| | Fujicco Co. Ltd. | 50,000 | 597 |
| | Hibiya Engineering Ltd. | 63,400 | 594 |
| | Nissen Holdings Co. Ltd. | 91,000 | 593 |
| | Mani Inc. | 16,900 | 591 |
| | Zenrin Co. Ltd. | 60,100 | 590 |
| | Senshukai Co. Ltd. | 95,700 | 588 |
| *,^ | Leopalace21 Corp. | 410,900 | 583 |
58
| | | |
| Vanguard® Total International Stock Index Fund | | |
| Schedule of Investments | | |
| April 30, 2011 | | |
| |
| | | | Market |
| | | | Value |
| | | Shares | ($000) |
| | Kanto Auto Works Ltd. | 89,500 | 582 |
| | Yokogawa Bridge Holdings Corp. | 85,000 | 580 |
| | Sanshin Electronics Co. Ltd. | 69,300 | 579 |
| | Toei Co. Ltd. | 127,000 | 579 |
| * | CREATE SD HOLDINGS Co. Ltd. | 24,600 | 579 |
| | Daiso Co. Ltd. | 176,000 | 575 |
| | Matsuda Sangyo Co. Ltd. | 37,100 | 572 |
| | Nice Holdings Inc. | 237,000 | 568 |
| | Shikoku Chemicals Corp. | 93,000 | 561 |
| | Ringer Hut Co. Ltd. | 44,200 | 559 |
| | Toenec Corp. | 97,000 | 553 |
| * | Unihair Co. Ltd. | 57,300 | 552 |
| | Tsutsumi Jewelry Co. Ltd. | 22,100 | 551 |
| * | Chiba Kogyo Bank Ltd. | 101,800 | 551 |
| *,^ | Aiful Corp. | 473,450 | 551 |
| * | Ichibanya Co. Ltd. | 18,300 | 548 |
| | Teikoku Piston Ring Co. Ltd. | 60,200 | 546 |
| | DTS Corp. | 57,500 | 545 |
| | Kasumi Co. Ltd. | 102,500 | 544 |
| | GMO internet Inc. | 124,300 | 544 |
| | Ines Corp. | 82,400 | 543 |
| * | Mimasu Semiconductor Industry Co. Ltd. | 45,700 | 543 |
| * | Uniden Corp. | 148,000 | 543 |
| | Katakura Industries Co. Ltd. | 54,400 | 542 |
| | Tsukishima Kikai Co. Ltd. | 59,000 | 541 |
| | Tokyu Construction Co. Ltd. | 198,940 | 541 |
| *,^ | Clarion Co. Ltd. | 312,000 | 535 |
| | Nippon Road Co. Ltd. | 182,000 | 534 |
| | Hitachi Medical Corp. | 40,000 | 533 |
| | Tokyotokeiba Co. Ltd. | 412,000 | 530 |
| | Nichiden Corp. | 17,700 | 525 |
| | Nidec Copal Corp. | 45,000 | 525 |
| | Atsugi Co. Ltd. | 445,000 | 524 |
| | NEC Fielding Ltd. | 46,800 | 524 |
| | Yushin Precision Equipment Co. Ltd. | 28,100 | 521 |
| | Nihon Nohyaku Co. Ltd. | 116,000 | 520 |
| | Nafco Co. Ltd. | 29,800 | 515 |
| | Fujita Kanko Inc. | 140,000 | 510 |
| | Nichiha Corp. | 58,700 | 509 |
| | Tenma Corp. | 46,900 | 508 |
| | ASKA Pharmaceutical Co. Ltd. | 61,000 | 506 |
| | Proto Corp. | 13,500 | 505 |
| | Jeol Ltd. | 182,000 | 500 |
| | Sinanen Co. Ltd. | 119,000 | 499 |
| *,^ | Toko Inc. | 202,000 | 499 |
| | Megane TOP Co. Ltd. | 50,300 | 498 |
| | Fuso Pharmaceutical Industries Ltd. | 176,000 | 498 |
| | Arc Land Sakamoto Co. Ltd. | 35,600 | 494 |
| | Nissin Corp. | 189,000 | 490 |
| | Takiron Co. Ltd. | 124,000 | 485 |
| | Oyo Corp. | 47,100 | 485 |
| | Kanto Natural Gas Development Ltd. | 79,000 | 480 |
| | Tamura Corp. | 156,000 | 474 |
| * | Furuya Metal Co. Ltd. | 7,200 | 473 |
| | Descente Ltd. | 112,000 | 473 |
| *,^ | Fujiya Co. Ltd. | 285,000 | 473 |
| | Prima Meat Packers Ltd. | 353,000 | 473 |
| | Kyodo Printing Co. Ltd. | 228,000 | 469 |
| | Pal Co. Ltd. | 14,900 | 466 |
| * | Daikokutenbussan Co. Ltd. | 14,400 | 466 |
| ^ | Krosaki Harima Corp. | 113,000 | 464 |
| | Tokyu Livable Inc. | 54,700 | 464 |
| * | Chiyoda Integre Co. Ltd. | 34,400 | 463 |
| | HAJIME CONSTRUCTION Co. Ltd. | 19,700 | 461 |
59
| | | |
| Vanguard® Total International Stock Index Fund | | |
| Schedule of Investments | | |
| April 30, 2011 | | |
| |
| | | | Market |
| | | | Value |
| | | Shares | ($000) |
| | Hioki EE Corp. | 23,200 | 460 |
| | Toyo Denki Seizo - Toyo Electric Manufacturing Co. Ltd. | 96,000 | 458 |
| | Namura Shipbuilding Co. Ltd. | 90,200 | 458 |
| | JCR Pharmaceuticals Co. Ltd. | 42,000 | 456 |
| | Nippon Steel Trading Co. Ltd. | 159,000 | 456 |
| | Seika Corp. | 165,000 | 456 |
| | Sanoh Industrial Co. Ltd. | 58,400 | 454 |
| | Shinko Shoji Co. Ltd. | 53,300 | 453 |
| | Belluna Co. Ltd. | 64,950 | 451 |
| | Roland DG Corp. | 28,000 | 451 |
| | Aichi Machine Industry Co. Ltd. | 125,000 | 446 |
| | Sankei Building Co. Ltd. | 78,200 | 446 |
| | CMK Corp. | 108,300 | 445 |
| | Noevir Holdings Co. Ltd. | 40,200 | 444 |
| ^ | Honeys Co. Ltd. | 42,420 | 444 |
| | Tokyo Energy & Systems Inc. | 67,000 | 442 |
| | CMIC Co. Ltd. | 25,600 | 439 |
| | Itochu-Shokuhin Co. Ltd. | 13,100 | 438 |
| | Starbucks Coffee Japan Ltd. | 819 | 437 |
| | en-japan Inc. | 297 | 436 |
| | Dai Nippon Toryo Co. Ltd. | 319,000 | 432 |
| | Daiichi Jitsugyo Co. Ltd. | 107,000 | 432 |
| *,^ | Micronics Japan Co. Ltd. | 38,700 | 430 |
| ^ | Kura Corp. | 29,600 | 429 |
| | Maruzen Showa Unyu Co. Ltd. | 135,000 | 429 |
| | Mitsuuroko Co. Ltd. | 63,600 | 427 |
| | Tokyu Community Corp. | 14,400 | 426 |
| * | Uchida Yoko Co. Ltd. | 131,000 | 422 |
| | Arisawa Manufacturing Co. Ltd. | 84,700 | 421 |
| ^ | Gourmet Navigator Inc. | 35,900 | 420 |
| * | MTI Ltd. | 222 | 420 |
| | Gun-Ei Chemical Industry Co. Ltd. | 158,000 | 419 |
| * | Pasona Group Inc. | 463 | 418 |
| | Obara Corp. | 35,800 | 415 |
| | Koatsu Gas Kogyo Co. Ltd. | 72,000 | 414 |
| | Daiwa Industries Ltd. | 82,000 | 412 |
| | Shinkawa Ltd. | 43,000 | 411 |
| * | Meiko Electronics Co. | 30,400 | 408 |
| | Matsuya Foods Co. Ltd. | 21,900 | 404 |
| | Sekisui Plastics Co. Ltd. | 110,000 | 403 |
| ^ | Japan Drilling Co. Ltd. | 9,900 | 400 |
| | Enplas Corp. | 28,900 | 400 |
| ^ | Axell Corp. | 20,800 | 399 |
| | Hakuto Co. Ltd. | 38,100 | 397 |
| | GROWELL HOLDINGS Co. Ltd. | 15,300 | 397 |
| *,^ | Matsuya Co. Ltd. | 76,200 | 397 |
| | Yahagi Construction Co. Ltd. | 72,400 | 396 |
| | Kinki Sharyo Co. Ltd. | 95,000 | 392 |
| | Shimojima Co. Ltd. | 33,500 | 389 |
| ^ | Keiyo Co. Ltd. | 76,800 | 389 |
| | Simplex Holdings Inc. | 815 | 387 |
| | France Bed Holdings Co. Ltd. | 314,000 | 385 |
| | Aichi Corp. | 79,800 | 383 |
| | Mitsui Home Co. Ltd. | 76,000 | 382 |
| | GLOBERIDE Inc. | 346,000 | 382 |
| | Touei Housing Corp. | 33,400 | 381 |
| | Yonekyu Corp. | 49,500 | 381 |
| | Chuetsu Pulp & Paper Co. Ltd. | 217,000 | 380 |
| ^ | Mitsubishi Kakoki Kaisha Ltd. | 159,000 | 379 |
| | Cleanup Corp. | 53,700 | 379 |
| *,^ | Nippon Metal Industry Co. Ltd. | 330,000 | 375 |
| | Kyoritsu Maintenance Co. Ltd. | 26,000 | 374 |
| *,^ | FDK Corp. | 210,000 | 373 |
| | Japan Cash Machine Co. Ltd. | 44,700 | 371 |
60
| | | |
| Vanguard® Total International Stock Index Fund | | |
| Schedule of Investments | | |
| April 30, 2011 | | |
| |
| | | | Market |
| | | | Value |
| | | Shares | ($000) |
| | Bunka Shutter Co. Ltd. | 135,000 | 368 |
| | Zappallas Inc. | 268 | 366 |
| | NEC Capital Solutions Ltd. | 24,600 | 365 |
| | Nohmi Bosai Ltd. | 61,000 | 364 |
| | Shibusawa Warehouse Co. Ltd. | 113,000 | 364 |
| | SRI Sports Ltd. | 333 | 363 |
| | Iida Home Max | 41,400 | 357 |
| *,^ | Atom Corp. | 120,800 | 354 |
| | Mars Engineering Corp. | 21,500 | 353 |
| | Shikibo Ltd. | 301,000 | 352 |
| | ST Corp. | 33,900 | 350 |
| | Nidec Copal Electronics Corp. | 50,800 | 345 |
| | Japan Radio Co. Ltd. | 138,000 | 343 |
| | Furuno Electric Co. Ltd. | 59,500 | 342 |
| * | Nakayama Steel Works Ltd. | 245,000 | 340 |
| | Yomiuri Land Co. Ltd. | 105,000 | 339 |
| | Takihyo Co. Ltd. | 71,000 | 338 |
| | Mitsui High-Tec Inc. | 67,000 | 334 |
| | Shinsho Corp. | 127,000 | 333 |
| | Mitsubishi Research Institute Inc. | 16,400 | 331 |
| | Toho Real Estate Co. Ltd. | 59,100 | 331 |
| | Corona Corp. | 33,700 | 326 |
| | Pronexus Inc. | 66,000 | 326 |
| | Japan Vilene Co. Ltd. | 69,000 | 325 |
| | Inui Steamship Co. Ltd. | 58,900 | 323 |
| ^ | Kojima Co. Ltd. | 53,800 | 323 |
| | Nippon Koshuha Steel Co. Ltd. | 211,000 | 319 |
| ^ | Furukawa Battery Co. Ltd. | 38,000 | 311 |
| | Onoken Co. Ltd. | 33,500 | 310 |
| | Hosokawa Micron Corp. | 74,000 | 309 |
| * | Sparx Group Co. Ltd. | 2,674 | 304 |
| * | Best Denki Co. Ltd. | 112,000 | 304 |
| ^ | Kumiai Chemical Industry Co. Ltd. | 108,000 | 297 |
| * | Nishio Rent All Co. Ltd. | 35,400 | 296 |
| ^ | COOKPAD Inc. | 13,900 | 294 |
| | Meito Sangyo Co. Ltd. | 21,700 | 276 |
| | Nippon Kanzai Co. Ltd. | 16,500 | 276 |
| *,^ | Usen Corp. | 394,890 | 276 |
| *,^ | Ubiquitous Corp. | 118 | 274 |
| ^ | Tanaka Chemical Corp. | 24,400 | 273 |
| * | Noritsu Koki Co. Ltd. | 46,700 | 269 |
| | Information Services International-Dentsu Ltd. | 38,700 | 268 |
| | SEC Carbon Ltd. | 48,000 | 267 |
| | Toyo Securities Co. Ltd. | 177,000 | 267 |
| | S Foods Inc. | 32,500 | 262 |
| | Gakken Holdings Co. Ltd. | 152,000 | 257 |
| | Shibaura Mechatronics Corp. | 86,000 | 252 |
| | Otsuka Kagu Ltd. | 28,700 | 251 |
| | Toridoll.corp | 216 | 251 |
| | Tv Tokyo Holdings Corp. | 19,400 | 249 |
| | Taiko Pharmaceutical Co. Ltd. | 21,200 | 248 |
| | Airport Facilities Co. Ltd. | 63,000 | 244 |
| | Nidec-Tosok Corp. | 27,600 | 244 |
| | Alpha Systems Inc. | 16,000 | 241 |
| | Future Architect Inc. | 547 | 241 |
| | Ohara Inc. | 21,000 | 226 |
| | Daikoku Denki Co. Ltd. | 19,100 | 222 |
| | Iwai Cosmo Holdings Inc. | 42,700 | 216 |
| | Tohokushinsha Film Corp. | 41,700 | 213 |
| | VERISIGN JAPAN KK | 501 | 211 |
| | Mito Securities Co. Ltd. | 133,000 | 195 |
| | Daisyo Corp. | 16,900 | 187 |
| | Thine Electronics Inc. | 153 | 164 |
| * | Jipangu Holdings Inc. | 3,686 | 59 |
61
| | | |
| Vanguard® Total International Stock Index Fund | | |
| Schedule of Investments | | |
| April 30, 2011 | | |
| |
| | | | Market |
| | | | Value |
| | | Shares | ($000) |
| * | Cedyna Financial Corp. | | — |
| | | | 8,129,563 |
| Malaysia (0.7%) | | |
| | CIMB Group Holdings Bhd. | 12,279,400 | 33,994 |
| | Malayan Banking Bhd. | 9,594,290 | 28,371 |
| | Genting Bhd. | 6,706,700 | 26,301 |
| | Sime Darby Bhd. | 8,135,700 | 24,786 |
| | IOI Corp. Bhd. | 10,032,486 | 17,936 |
| | Tenaga Nasional Bhd. | 7,396,800 | 15,022 |
| * | Petronas Chemicals Group Bhd. | 6,007,628 | 14,664 |
| | Public Bank Bhd. (Foreign) | 3,165,094 | 14,005 |
| * | Axiata Group Bhd. | 7,614,300 | 12,613 |
| | Maxis Bhd. | 6,742,050 | 12,233 |
| | AMMB Holdings Bhd. | 5,428,000 | 11,705 |
| | Genting Malaysia Bhd. | 8,950,000 | 11,138 |
| | DiGi.Com Bhd. | 1,064,000 | 10,462 |
| | Kuala Lumpur Kepong Bhd. | 1,447,386 | 10,331 |
| | MISC Bhd. | 3,335,180 | 8,793 |
| | PPB Group Bhd. | 1,248,800 | 7,164 |
| | PLUS Expressways Bhd. | 4,523,900 | 6,869 |
| | IJM Corp. Bhd. | 3,237,960 | 6,781 |
| | British American Tobacco Malaysia Bhd. | 388,100 | 6,294 |
| | Gamuda Bhd. | 4,878,000 | 6,163 |
| | YTL Corp. Bhd. | 10,082,300 | 5,656 |
| | Petronas Gas Bhd. | 1,476,000 | 5,614 |
| | Hong Leong Bank Bhd. | 1,432,400 | 5,029 |
| | YTL Power International Bhd. | 6,576,558 | 5,019 |
| | SP Setia Bhd. | 3,407,250 | 4,806 |
| | Telekom Malaysia Bhd. | 3,231,800 | 4,357 |
| | UMW Holdings Bhd. | 1,761,300 | 4,179 |
| | RHB Capital Bhd. | 1,337,700 | 4,007 |
| | Petronas Dagangan Bhd. | 746,900 | 3,906 |
| * | AirAsia Bhd. | 3,890,000 | 3,777 |
| | Dialog Group Bhd. | 3,680,000 | 3,097 |
| | Malaysian Resources Corp. Bhd. | 4,281,000 | 3,085 |
| | Berjaya Sports Toto Bhd. | 2,100,128 | 2,995 |
| | Alliance Financial Group Bhd. | 2,803,200 | 2,946 |
| | Kencana Petroleum Bhd. | 3,144,600 | 2,796 |
| | Bursa Malaysia Bhd. | 997,600 | 2,706 |
| | Parkson Holdings Bhd. | 1,319,839 | 2,554 |
| | Lafarge Malayan Cement Bhd. | 995,100 | 2,435 |
| | Boustead Holdings Bhd. | 1,183,800 | 2,315 |
| | MMC Corp. Bhd. | 2,428,900 | 2,202 |
| | Multi-Purpose Holdings Bhd. | 2,054,100 | 2,180 |
| | Hong Leong Financial Group Bhd. | 625,200 | 2,168 |
| | Media Prima Bhd. | 2,274,300 | 2,019 |
| | KNM Group Bhd. | 2,231,000 | 1,983 |
| | Berjaya Corp. Bhd. | 5,016,000 | 1,934 |
| | Sunway Real Estate Investment Trust | 5,176,000 | 1,921 |
| | Top Glove Corp. Bhd. | 1,091,100 | 1,913 |
| | IGB Corp. Bhd. | 2,640,448 | 1,900 |
| | Genting Plantations Bhd. | 673,500 | 1,820 |
| | SapuraCrest Petroleum Bhd. | 1,431,000 | 1,800 |
| | DRB-Hicom Bhd. | 2,020,000 | 1,509 |
| * | Malaysian Airline System Bhd. | 2,417,700 | 1,489 |
| | WCT Bhd. | 1,442,400 | 1,483 |
| | KLCC Property Holdings Bhd. | 1,296,700 | 1,441 |
| | Kulim Malaysia Bhd. | 1,326,000 | 1,433 |
| | TAN Chong Motor Holdings Bhd. | 829,700 | 1,313 |
| | Affin Holdings Bhd. | 1,064,300 | 1,259 |
| | Carlsberg Brewery-Malay Bhd. | 459,800 | 1,227 |
| | Sunway City Bhd. | 674,200 | 1,102 |
| | CapitaMalls Malaysia Trust | 2,787,300 | 1,091 |
| | IJM Land Bhd. | 1,108,000 | 1,054 |
62
| | | |
| Vanguard® Total International Stock Index Fund | | |
| Schedule of Investments | | |
| April 30, 2011 | | |
| |
| | | | Market |
| | | | Value |
| | | Shares | ($000) |
| | QL Resources Bhd. | 945,780 | 1,032 |
| | Lingkaran Trans Kota Holdings Bhd. | 647,000 | 846 |
| * | Time dotCom Bhd. | 2,744,600 | 841 |
| | Mah Sing Group Bhd. | 935,400 | 818 |
| | IJM Plantations Bhd. | 798,900 | 802 |
| * | Mulpha International Bhd. | 4,462,300 | 800 |
| | OSK Holdings Bhd. | 1,301,900 | 765 |
| | Malaysian Bulk Carriers Bhd. | 857,200 | 753 |
| | KPJ Healthcare Bhd. | 542,800 | 752 |
| | Proton Holdings Bhd. | 607,300 | 708 |
| | Bandar Raya Developments Bhd. | 962,900 | 699 |
| | HAP Seng Consolidated Bhd. | 356,200 | 698 |
| | Wah Seong Corp. Bhd. | 914,500 | 689 |
| | TA Enterprise Bhd. | 2,690,300 | 687 |
| | Lion Industries Corp. Bhd. | 1,131,100 | 647 |
| | Eastern & Oriental Bhd. | 1,248,900 | 600 |
| | Kian JOO CAN Factory Bhd. | 755,900 | 594 |
| | WTK Holdings Bhd. | 893,500 | 593 |
| | Malaysia Building Society | 685,700 | 591 |
| | Masterskill Education Group Bhd. | 720,600 | 553 |
| | Unisem M Bhd. | 838,700 | 528 |
| | YNH Property Bhd. | 742,900 | 502 |
| | Supermax Corp. Bhd. | 328,300 | 459 |
| | Hartalega Holdings Bhd. | 230,800 | 444 |
| | QSR Brands Bhd. | 233,900 | 441 |
| | Hap Seng Plantations Holdings Bhd. | 442,300 | 426 |
| | JT International Bhd. | 168,300 | 419 |
| * | Sunway Holdings Bhd. | 500,300 | 415 |
| | JCY International Bhd. | 1,671,100 | 404 |
| | Evergreen Fibreboard Bhd. | 900,800 | 396 |
| | TA Global Bhd. | 2,933,300 | 386 |
| | United Malacca Bhd. | 159,700 | 379 |
| | Ann Joo Resources Bhd. | 374,900 | 367 |
| | Kossan Rubber Industries | 330,000 | 360 |
| | Muhibbah Engineering M Bhd. | 659,900 | 358 |
| | Mudajaya Group Bhd. | 208,800 | 326 |
| | Esso Malaysia Bhd. | 224,000 | 319 |
| | Kinsteel Bhd. | 1,091,000 | 317 |
| | Landmarks Bhd. | 597,800 | 309 |
| | Faber Group Bhd. | 390,400 | 293 |
| | Padiberas Nasional Bhd. | 307,000 | 288 |
| * | YTL Land & Development Bhd. | 443,800 | 278 |
| | Starhill Real Estate Investment Trust | 916,000 | 271 |
| | Shin Yang Shipping Corp. Bhd. | 1,032,900 | 261 |
| | Naim Holdings Bhd. | 266,600 | 252 |
| | YTL E-Solutions Bhd. | 696,600 | 252 |
| * | Scomi Group Bhd. | 2,279,200 | 239 |
| * | Latexx Partners Bhd. | 255,300 | 237 |
| | TH Plantations Bhd. | 336,700 | 236 |
| * | Malaysian Pacific Industries Bhd. | 120,400 | 215 |
| | Puncak Niaga Holding Bhd. | 297,200 | 210 |
| | Lingui Development Bhd. | 330,100 | 206 |
| | Uchi Technologies Bhd. | 434,900 | 206 |
| | Hai-O Enterprise Bhd. | 267,800 | 204 |
| | Hock Seng LEE Bhd. | 348,300 | 204 |
| | Alam Maritim Resources Bhd. | 528,100 | 201 |
| * | Tradewinds Corp. Bhd. | 586,300 | 190 |
| | CSC Steel Holdings Bhd. | 302,200 | 178 |
| | Cahya Mata Sarawak Bhd. | 232,300 | 177 |
| | Petra Perdana Bhd. | 498,000 | 170 |
| | Kim Loong Resources Bhd. | 217,700 | 163 |
| * | Zelan Bhd. | 933,900 | 158 |
| | Ranhill Bhd. | 606,200 | 152 |
| | Pelikan International Corp. Bhd. | 352,300 | 135 |
63
| | | |
| Vanguard® Total International Stock Index Fund | | |
| Schedule of Investments | | |
| April 30, 2011 | | |
| |
| | | | Market |
| | | | Value |
| | | Shares | ($000) |
| | Lion Diversified Holdings Bhd. | 744,700 | 112 |
| | Kumpulan Perangsang Selangor Bhd. | 273,700 | 111 |
| * | WCT Bhd. Warrants Expire 02/24/2016 | 288,480 | 73 |
| * | Kulim Malaysia Bhd. Warrants | 165,750 | 47 |
| | Public Bank Bhd. (Local) | 8,900 | 39 |
| * | QL Resources Bhd. Warrants | 34,224 | 11 |
| | | | 420,937 |
| Mexico (1.0%) | | |
| | America Movil SAB de CV | 59,207,970 | 169,677 |
| | Wal-Mart de Mexico SAB de CV | 18,792,100 | 58,866 |
| | Fomento Economico Mexicano SAB de CV | 6,506,000 | 40,946 |
| | Grupo Mexico SAB de CV Class B | 11,488,717 | 39,780 |
| * | Grupo Televisa SA | 7,046,200 | 33,365 |
| * | Cemex SAB de CV | 29,058,651 | 25,192 |
| | Grupo Financiero Banorte SAB de CV | 4,883,900 | 24,594 |
| | Telefonos de Mexico SAB de CV | 16,421,700 | 15,421 |
| | Grupo Financiero Inbursa SA | 2,513,914 | 13,406 |
| | Alfa SAB de CV Class A | 882,400 | 13,215 |
| | Grupo Modelo SAB de CV | 1,899,100 | 11,875 |
| | Industrias Penoles SAB de CV | 301,235 | 11,730 |
| | Grupo Elektra SA de CV | 220,520 | 10,042 |
| | Kimberly-Clark de Mexico SAB de CV Class A | 1,595,500 | 9,872 |
| | Grupo Bimbo SAB de CV Class A | 4,284,000 | 9,452 |
| | Mexichem SAB de CV | 2,416,363 | 9,183 |
| | Embotelladoras Arca SAB de CV | 1,219,816 | 7,408 |
| * | Minera Frisco SAB de CV | 1,715,324 | 7,395 |
| | Grupo Carso SAB de CV | 1,730,700 | 6,731 |
| | Coca-Cola Femsa SAB de CV | 812,500 | 6,474 |
| | Banco Compartamos SA de CV | 729,500 | 5,070 |
| * | Empresas ICA SAB de CV | 1,764,936 | 4,357 |
| * | Corp GEO SAB de CV | 1,434,657 | 4,235 |
| | Grupo Aeroportuario del Pacifico SAB de CV Class B | 941,100 | 3,914 |
| | Grupo Aeroportuario del Sureste SAB de CV Class B | 629,891 | 3,725 |
| * | Urbi Desarrollos Urbanos SAB de CV | 1,436,600 | 3,442 |
| * | Desarrolladora Homex SAB de CV | 643,000 | 3,027 |
| * | Genomma Lab Internacional SAB de CV Class B | 952,200 | 2,380 |
| * | Controladora Comercial Mexicana SAB de CV | 1,226,956 | 2,139 |
| * | Industrias CH SAB de CV Class B | 514,344 | 2,048 |
| | Grupo Aeroportuario del Pacifico SAB de CV ADR | 48,526 | 2,024 |
| | TV Azteca SAB de CV | 2,739,635 | 1,956 |
| * | Inmuebles Carso SAB de CV | 1,668,300 | 1,884 |
| * | Carso Infraestructura y Construccion SAB de CV | 2,646,394 | 1,793 |
| | Bolsa Mexicana de Valores SAB de CV | 757,252 | 1,630 |
| | Consorcio ARA SAB de CV | 2,547,366 | 1,514 |
| * | Axtel SAB de CV | 2,392,458 | 1,417 |
| | Grupo Aeroportuario del Centro Norte Sab de CV | 566,742 | 1,189 |
| * | Grupo Famsa SAB de CV Class A | 566,871 | 1,142 |
| * | Gruma SAB de CV Class B | 467,400 | 936 |
| * | Vitro SAB de CV | 749,008 | 917 |
| * | Grupo Simec SAB de CV Class B | 275,110 | 785 |
| | Alsea SAB de CV | 614,493 | 698 |
| * | Cia Minera Autlan SAB de CV Class B | 187,000 | 521 |
| | Financiera Independencia SAB de CV | 420,134 | 423 |
| | Compartamos SAB de CV | 210,400 | 392 |
| * | Bio Pappel SAB de CV | 240,600 | 231 |
| * | Maxcom Telecomunicaciones SAB de CV | 333,800 | 153 |
| | | | 578,566 |
| Morocco (0.0%) | | |
| | Douja Promotion Groupe Addoha SA | 84,813 | 1,043 |
| | Maroc Telecom | 49,896 | 988 |
| * | Alliances Developpement Immobilier SA | 10,987 | 981 |
| | Attijariwafa Bank | 15,081 | 720 |
| | | | 3,732 |
64
| | | |
| Vanguard® Total International Stock Index Fund | | |
| Schedule of Investments | | |
| April 30, 2011 | | |
| |
| | | | Market |
| | | | Value |
| | | Shares | ($000) |
| Netherlands (1.7%) | | |
| | Unilever NV | 4,900,893 | 161,341 |
| * | ING Groep NV | 11,516,514 | 151,722 |
| | Koninklijke Philips Electronics NV | 2,966,563 | 87,864 |
| | Koninklijke KPN NV | 4,733,298 | 75,101 |
| | Akzo Nobel NV | 697,772 | 54,104 |
| | ASML Holding NV | 1,289,824 | 53,763 |
| | Koninklijke Ahold NV | 3,577,163 | 50,236 |
| ^ | Heineken NV | 780,260 | 46,686 |
| * | Aegon NV | 5,173,238 | 41,119 |
| | Koninklijke DSM NV | 464,958 | 32,048 |
| | TNT NV | 1,128,735 | 27,777 |
| | Reed Elsevier NV | 2,073,646 | 27,055 |
| | Wolters Kluwer NV | 895,237 | 20,858 |
| | Fugro NV | 205,237 | 18,812 |
| | Randstad Holding NV | 332,640 | 18,715 |
| | Heineken Holding NV | 348,164 | 18,371 |
| * | SBM Offshore NV | 501,723 | 14,673 |
| ^ | Corio NV | 178,255 | 12,622 |
| | Koninklijke Boskalis Westminster NV | 213,543 | 11,349 |
| | Koninklijke Vopak NV | 211,566 | 10,136 |
| | Imtech NV | 233,091 | 8,852 |
| | Nutreco NV | 104,711 | 8,149 |
| | CSM | 198,119 | 7,590 |
| ^ | Aalberts Industries NV | 289,944 | 7,333 |
| | Wereldhave NV | 64,538 | 6,746 |
| ^ | Delta Lloyd NV | 227,271 | 5,980 |
| * | ASM International NV | 131,759 | 5,715 |
| | Eurocommercial Properties NV | 110,056 | 5,656 |
| | Koninklijke BAM Groep NV | 668,684 | 5,339 |
| | Vastned Retail NV | 56,314 | 4,315 |
| | Arcadis NV | 166,450 | 4,296 |
| * | USG People NV | 196,127 | 3,883 |
| *,^ | TomTom NV | 410,491 | 3,713 |
| ^ | Koninklijke Ten Cate NV | 74,872 | 3,465 |
| | Mediq NV | 156,941 | 3,383 |
| | Unit 4 NV | 80,584 | 3,023 |
| | TKH Group NV | 93,194 | 2,913 |
| | Sligro Food Group NV | 75,668 | 2,811 |
| * | SNS REAAL NV | 446,187 | 2,741 |
| * | Wavin NV | 142,122 | 2,542 |
| ^ | Nieuwe Steen Investments NV | 114,777 | 2,540 |
| | BinckBank NV | 139,178 | 2,517 |
| | Beter Bed Holding NV | 53,011 | 1,679 |
| *,^ | AMG Advanced Metallurgical Group NV | 65,303 | 1,464 |
| | Brunel International NV | 26,521 | 1,345 |
| * | Accell Group | 19,551 | 1,164 |
| | Exact Holding NV | 35,006 | 1,133 |
| * | Hunter Douglas NV | 19,609 | 1,050 |
| | Vastned Offices/Industrial NV | 51,561 | 1,030 |
| *,^ | Kardan NV | 159,996 | 949 |
| ^ | Koninklijke Wessanen NV | 204,784 | 911 |
| * | Ordina NV | 128,626 | 760 |
| ^ | Amsterdam Commodities NV | 38,380 | 626 |
| | KAS Bank NV | 31,205 | 552 |
| | ASML Holding NV ADR | 7,466 | 312 |
| * | Aegon NV | 922 | 7 |
| | | | 1,050,836 |
| New Zealand (0.1%) | | |
| | Fletcher Building Ltd. | 1,816,463 | 13,541 |
| | Telecom Corp. of New Zealand Ltd. | 5,823,835 | 10,213 |
| | Auckland International Airport Ltd. | 2,831,896 | 5,096 |
| | Sky City Entertainment Group Ltd. | 1,735,526 | 5,007 |
| | Contact Energy Ltd. | 944,394 | 4,556 |
65
| | | |
| Vanguard® Total International Stock Index Fund | | |
| Schedule of Investments | | |
| April 30, 2011 | | |
| |
| | | | Market |
| | | | Value |
| | | Shares | ($000) |
| | Fisher & Paykel Healthcare Corp. Ltd. | 1,583,155 | 3,967 |
| | Sky Network Television Ltd. | 551,965 | 2,606 |
| | Infratil Ltd. | 1,265,620 | 1,947 |
| * | Fletcher Building Ltd. | 240,759 | 1,781 |
| | Mainfreight Ltd. | 229,154 | 1,723 |
| | Vector Ltd. | 804,415 | 1,670 |
| | Nuplex Industries Ltd. | 626,337 | 1,658 |
| | Kiwi Income Property Trust | 1,954,305 | 1,630 |
| | AMP NZ Office Ltd. | 2,270,378 | 1,508 |
| | Ryman Healthcare Ltd. | 711,115 | 1,464 |
| | Goodman Property Trust | 1,975,235 | 1,456 |
| | Freightways Ltd. | 413,272 | 1,153 |
| | Warehouse Group Ltd. | 310,251 | 919 |
| | New Zealand Oil & Gas Ltd. | 1,059,646 | 833 |
| | Tower Ltd. | 482,562 | 734 |
| * | Fisher & Paykel Appliances Holdings Ltd. | 1,501,849 | 731 |
| | Air New Zealand Ltd. | 766,771 | 691 |
| * | PGG Wrightson Ltd. | 943,205 | 375 |
| | | | 65,259 |
| Norway (0.8%) | | |
| | Statoil ASA | 3,360,724 | 98,449 |
| ^ | DnB NOR ASA | 2,936,067 | 47,742 |
| | Telenor ASA | 2,497,945 | 43,154 |
| | Yara International ASA | 569,258 | 33,328 |
| | Seadrill Ltd. | 835,828 | 29,653 |
| ^ | Norsk Hydro ASA | 2,679,024 | 23,762 |
| ^ | Orkla ASA | 2,331,821 | 23,599 |
| | Subsea 7 SA | 843,712 | 22,223 |
| *,^ | Aker Solutions ASA | 494,761 | 11,925 |
| ^ | Storebrand ASA | 1,026,249 | 10,659 |
| | Marine Harvest ASA | 7,503,153 | 9,913 |
| * | Petroleum Geo-Services ASA | 621,321 | 9,829 |
| | TGS Nopec Geophysical Co. ASA | 296,113 | 7,796 |
| | Schibsted ASA | 226,272 | 6,808 |
| | ProSafe SE | 666,667 | 5,412 |
| *,^ | Renewable Energy Corp. ASA | 1,517,571 | 5,359 |
| | Fred Olsen Energy ASA | 102,511 | 4,722 |
| ^ | Tomra Systems ASA | 457,831 | 3,929 |
| ^ | Frontline Ltd. | 168,665 | 3,726 |
| * | DNO International ASA | 2,481,536 | 3,724 |
| | Cermaq ASA | 150,625 | 3,103 |
| * | Norwegian Property ASA | 1,384,957 | 2,798 |
| *,^ | Algeta ASA | 93,777 | 2,714 |
| * | BW Offshore Ltd. | 1,042,815 | 2,704 |
| ^ | Veidekke ASA | 255,302 | 2,578 |
| * | Songa Offshore SE | 420,190 | 2,567 |
| ^ | SpareBank 1 SMN | 237,465 | 2,386 |
| ^ | Atea ASA | 208,598 | 2,308 |
| | Aker ASA | 75,227 | 2,296 |
| | Stolt-Nielsen Ltd. | 93,333 | 2,260 |
| | Austevoll Seafood ASA | 270,518 | 2,078 |
| | Leroey Seafood Group ASA | 57,778 | 1,877 |
| * | Norwegian Energy Co. AS | 664,012 | 1,818 |
| ^ | Nordic Semiconductor ASA | 444,337 | 1,662 |
| * | DOF ASA | 132,362 | 1,461 |
| *,^ | Norske Skogindustrier ASA | 498,273 | 1,416 |
| * | Dockwise Ltd. | 43,122 | 1,250 |
| ^ | Opera Software ASA | 221,394 | 1,242 |
| ^ | Wilh Wilhelmsen Holding ASA | 39,187 | 1,186 |
| *,^ | Kongsberg Automotive Holding ASA | 1,163,422 | 1,159 |
| *,^ | Norwegian Air Shuttle AS | 58,467 | 1,148 |
| ^ | Golden Ocean Group Ltd. | 907,507 | 1,111 |
| * | Sevan Marine ASA | 1,498,496 | 1,058 |
| * | Polarcus Ltd. | 750,321 | 974 |
66
| | | |
| Vanguard® Total International Stock Index Fund | | |
| Schedule of Investments | | |
| April 30, 2011 | | |
| |
| | | | Market |
| | | | Value |
| | | Shares | ($000) |
| * | Northern Offshore Ltd. | 350,863 | 923 |
| * | Morpol ASA | 237,351 | 920 |
| * | Det Norske Oljeselskap ASA | 142,865 | 899 |
| * | Eltek ASA | 696,552 | 887 |
| | Bakkafrost P/F | 75,747 | 808 |
| * | BWG Homes ASA | 168,483 | 788 |
| * | Pronova BioPharma AS | 415,551 | 679 |
| | Copeinca ASA | 67,081 | 645 |
| *,^ | Hurtigruten ASA | 661,425 | 613 |
| * | Deep Sea Supply plc | 224,326 | 604 |
| * | EDB ErgoGroup ASA | 178,407 | 493 |
| | Grieg Seafood ASA | 96,116 | 365 |
| *,^ | Norse Energy Corp. ASA | 1,046,077 | 174 |
| * | Norse Energy Corp. ASA Rights | 73,539 | 1 |
| | | | 459,665 |
| Peru (0.1%) | | |
| | Southern Copper Corp. | 426,385 | 15,972 |
| | Credicorp Ltd. | 141,272 | 13,653 |
| | Cia de Minas Buenaventura SA | 289,871 | 11,896 |
| | Cia de Minas Buenaventura SA ADR | 281,696 | 11,738 |
| | Southern Copper Corp. | 213,252 | 8,040 |
| | Credicorp Ltd. | 63,767 | 6,155 |
| | Casa Grande SAA | 123,236 | 549 |
| * | Cia Minera Atacocha SA Class B | 1,122,107 | 361 |
| | Corp Aceros Arequipa SA | 330,090 | 278 |
| | Refineria La Pampilla SA Relapasa | 498,544 | 272 |
| * | Empresa Siderurgica del Peru SAA | 464,300 | 217 |
| | | | 69,131 |
| Philippines (0.1%) | | |
| | Philippine Long Distance Telephone Co. | 141,175 | 8,206 |
| | SM Investments Corp. | 551,840 | 7,469 |
| | Ayala Land Inc. | 15,724,300 | 6,048 |
| | Bank of the Philippine Islands | 4,194,401 | 5,769 |
| | Aboitiz Equity Ventures Inc. | 5,807,000 | 5,383 |
| | Manila Electric Co. | 920,683 | 5,275 |
| | Ayala Corp. | 526,740 | 4,818 |
| | Aboitiz Power Corp. | 5,601,723 | 4,139 |
| * | Metropolitan Bank & Trust | 2,561,642 | 4,111 |
| | SM Prime Holdings Inc. | 14,299,600 | 4,014 |
| | Energy Development Corp. | 22,586,700 | 3,568 |
| | Alliance Global Group Inc. | 11,939,541 | 3,313 |
| | Banco de Oro Unibank Inc. | 2,341,790 | 2,974 |
| | Jollibee Foods Corp. | 1,264,420 | 2,794 |
| | Globe Telecom Inc. | 96,250 | 2,025 |
| | Megaworld Corp. | 31,586,000 | 1,724 |
| | Robinsons Land Corp. | 5,180,535 | 1,614 |
| | Security Bank Corp. | 495,800 | 1,152 |
| | First Philippine Holdings Corp. | 682,600 | 1,056 |
| | Manila Water Co. Inc. | 2,412,900 | 1,016 |
| * | First Gen Corp. | 2,788,600 | 953 |
| | Filinvest Land Inc. | 31,519,000 | 937 |
| * | Lopez Holdings Corp. | 5,767,770 | 865 |
| * | Philippine National Bank | 548,940 | 821 |
| | Rizal Commercial Banking Corp. | 1,106,840 | 725 |
| | Vista Land & Lifescapes Inc. | 7,363,250 | 544 |
| * | Atlas Consolidated Mining & Development | 1,106,700 | 414 |
| | Philweb Corp. | 1,043,700 | 404 |
| | | | 82,131 |
| Poland (0.4%) | | |
| | Powszechna Kasa Oszczednosci Bank Polski SA | 1,883,661 | 32,415 |
| ^ | KGHM Polska Miedz SA | 420,101 | 30,903 |
| | Bank Pekao SA | 354,128 | 23,211 |
| | Powszechny Zaklad Ubezpieczen SA | 143,589 | 20,178 |
67
| | | |
| Vanguard® Total International Stock Index Fund | | |
| Schedule of Investments | | |
| April 30, 2011 | | |
| |
| | | | Market |
| | | | Value |
| | | Shares | ($000) |
| * | Polski Koncern Naftowy Orlen SA | 967,174 | 20,159 |
| | PGE SA | 1,972,198 | 17,799 |
| | Telekomunikacja Polska SA | 2,196,771 | 14,523 |
| | Polskie Gornictwo Naftowe i Gazownictwo SA | 5,265,816 | 7,712 |
| | Tauron Polska Energia SA | 3,004,004 | 7,017 |
| * | BRE Bank SA | 44,814 | 5,839 |
| * | Getin Holding SA | 1,005,398 | 5,650 |
| * | Lubelski Wegiel Bogdanka SA | 93,010 | 4,411 |
| * | Kernel Holding SA | 152,026 | 4,128 |
| * | Globe Trade Centre SA | 506,017 | 3,946 |
| | Asseco Poland SA | 190,777 | 3,817 |
| | Bank Handlowy w Warszawie SA | 96,094 | 3,619 |
| * | Grupa Lotos SA | 199,520 | 3,569 |
| * | ING Bank Slaski SA | 10,022 | 3,308 |
| | TVN SA | 474,547 | 3,145 |
| * | Synthos SA | 1,843,326 | 3,129 |
| * | Bank Millennium SA | 1,307,638 | 2,680 |
| | Eurocash SA | 206,996 | 2,534 |
| | Enea SA | 339,635 | 2,495 |
| ^ | Polimex-Mostostal SA | 1,650,214 | 2,171 |
| | PBG SA | 29,120 | 1,800 |
| | Cyfrowy Polsat SA | 278,757 | 1,704 |
| | Budimex SA | 37,303 | 1,514 |
| * | Cersanit SA | 284,354 | 1,316 |
| * | Netia SA | 646,756 | 1,287 |
| | Agora SA | 130,003 | 1,250 |
| *,^ | AmRest Holdings SE | 37,827 | 1,160 |
| *,^ | Ciech SA | 98,713 | 983 |
| ^ | Zaklady Azotowe Pulawy SA | 18,492 | 851 |
| * | Boryszew SA | 1,936,193 | 788 |
| * | NFI Empik Media & Fashion SA | 115,008 | 787 |
| * | Kopex SA | 82,205 | 628 |
| *,^ | Bioton SA | 9,495,238 | 606 |
| * | Zaklady Azotowe w Tarnowie-Moscicach SA | 37,828 | 541 |
| * | Boryszew SA Rights | 1,403,797 | 518 |
| | Rafako SA | 105,768 | 482 |
| *,^ | Zaklady Chemiczne Police SA | 72,667 | 414 |
| * | Dom Maklerski IDMSA | 391,874 | 403 |
| | Polnord SA | 30,669 | 374 |
| * | LC Corp. SA | 618,902 | 368 |
| *,^ | Petrolinvest SA | 90,192 | 348 |
| * | Impexmetal SA | 177,113 | 336 |
| * | ComArch SA | 8,705 | 302 |
| *,^ | MCI Management SA | 93,316 | 301 |
| * | Trakcja Polska SA | 221,194 | 291 |
| * | Polski Koncern Miesny Duda SA | 426,732 | 244 |
| * | Gant Development SA | 42,771 | 225 |
| * | Barlinek SA | 140,286 | 217 |
| *,^ | Jutrzenka Holding SA | 158,697 | 216 |
| * | Mostalzab | 205,904 | 213 |
| *,^ | Hydrobudowa Polska SA | 232,872 | 200 |
| * | JW Construction Holding SA | 29,893 | 174 |
| | Erbud SA | 12,157 | 172 |
| | Arctic Paper SA | 38,240 | 170 |
| * | Stalexport Autostrady SA | 307,209 | 146 |
| * | Pol-Aqua SA | 19,039 | 136 |
| | | | 249,823 |
| Portugal (0.2%) | | |
| | EDP - Energias de Portugal SA | 5,754,832 | 23,511 |
| | Portugal Telecom SGPS SA | 1,747,839 | 21,390 |
| | Galp Energia SGPS SA Class B | 699,065 | 15,635 |
| | Jeronimo Martins SGPS SA | 663,450 | 10,882 |
| *,^ | Banco Comercial Portugues SA | 8,790,475 | 7,013 |
| ^ | Banco Espirito Santo SA | 1,564,283 | 6,589 |
68
| | | |
| Vanguard® Total International Stock Index Fund | | |
| Schedule of Investments | | |
| April 30, 2011 | | |
| |
| | | | Market |
| | | | Value |
| | | Shares | ($000) |
| * | EDP Renovaveis SA | 659,285 | 5,078 |
| | Cimpor Cimentos de Portugal SGPS SA | 680,525 | 4,702 |
| * | Brisa Auto-Estradas de Portugal SA | 548,886 | 3,672 |
| ^ | Zon Multimedia Servicos de Telecomunicacoes e Multimedia SGPS SA | 528,898 | 2,996 |
| | Sonae | 2,434,685 | 2,923 |
| | Semapa-Sociedade de Investimento e Gestao | 176,765 | 2,224 |
| | Portucel Empresa Produtora de Pasta e Papel SA | 567,809 | 2,126 |
| * | REN - Redes Energeticas Nacionais SA | 411,203 | 1,566 |
| ^ | Banco BPI SA | 774,268 | 1,392 |
| *,^ | Altri SGPS SA | 368,686 | 891 |
| * | Sonaecom - SGPS SA | 313,117 | 721 |
| *,^ | Mota-Engil SGPS SA | 181,566 | 482 |
| *,^ | Sonae Industria SGPS SA | 185,571 | 409 |
| * | BANIF SGPS SA | 321,469 | 333 |
| | Novabase SGPS SA | 34,520 | 159 |
| * | Impresa SGPS SA | 109,291 | 155 |
| | Martifer SGPS SA | 56,104 | 119 |
| * | Sonae Capital SGPS SA | 193,104 | 103 |
| | | | 115,071 |
| Russia (1.5%) | | |
| | Gazprom OAO ADR | 13,222,678 | 224,042 |
| | Sberbank of Russia | 25,979,947 | 94,977 |
| | Lukoil OAO ADR | 1,333,432 | 92,676 |
| | MMC Norilsk Nickel OJSC | 198,813 | 56,590 |
| | Gazprom OAO | 5,603,843 | 48,250 |
| | NovaTek OAO GDR | 273,088 | 38,511 |
| | Rosneft Oil Co. GDR | 3,701,055 | 33,147 |
| | Mobile Telesystems OJSC ADR | 1,552,192 | 32,829 |
| | Tatneft ADR | 658,254 | 29,735 |
| | VTB Bank OJSC GDR | 3,862,885 | 25,078 |
| | Surgutneftegas OJSC ADR | 2,047,389 | 21,894 |
| | Magnit OJSC GDR | 667,634 | 18,770 |
| | Uralkali | 2,223,104 | 18,547 |
| * | Federal Hydrogenerating Co. JSC | 348,107,072 | 17,659 |
| | Mechel ADR | 434,275 | 12,407 |
| | Surgutneftegas OJSC Prior Pfd. | 20,970,004 | 12,253 |
| * | Federal Grid Co. Unified Energy System JSC | 919,229,832 | 12,143 |
| | Novolipetsk Steel OJSC GDR | 268,464 | 10,284 |
| | Severstal OAO GDR | 551,261 | 9,972 |
| | Rosneft Oil Co. | 1,076,640 | 9,572 |
| | Polyus Gold OJSC ADR | 260,626 | 9,396 |
| | Sistema JSFC GDR | 286,685 | 8,118 |
| | Sberbank of Russia Prior Pfd. | 3,014,164 | 7,387 |
| | AK Transneft OAO Prior Pfd. | 4,683 | 6,912 |
| | Wimm-Bill-Dann Foods OJSC ADR | 186,720 | 6,589 |
| * | Polymetal JSC | 297,083 | 5,844 |
| | Lukoil OAO | 74,254 | 5,136 |
| * | OGK-4 OJSC | 46,238,595 | 4,118 |
| * | TMK OAO GDR | 179,489 | 3,690 |
| * | Inter Rao Ues OAO | 2,515,615,427 | 3,245 |
| * | Raspadskaya | 474,038 | 3,154 |
| | Uralsvyazinform | 48,250,300 | 2,906 |
| * | OGK-2 OAO | 45,368,842 | 2,559 |
| | VolgaTelecom | 350,319 | 2,087 |
| | Tatneft | 310,195 | 2,026 |
| | Sibirtelecom OJSC | 17,107,088 | 1,960 |
| | North-West Telecom | 1,258,707 | 1,624 |
| * | OGK-6 OAO | 35,612,540 | 1,620 |
| | Severstal OAO | 82,238 | 1,511 |
| | Akron JSC | 27,167 | 1,279 |
| | Uralsvyazinform Prior Pfd. | 22,657,521 | 1,072 |
| | Surgutneftegas OJSC | 995,716 | 1,043 |
| | Sibirtelecom OJSC Prior Pfd. | 11,167,539 | 995 |
| * | AvtoVAZ | 959,393 | 956 |
69
| | | |
| Vanguard® Total International Stock Index Fund | | |
| Schedule of Investments | | |
| April 30, 2011 | | |
| |
| | | | Market |
| | | | Value |
| | | Shares | ($000) |
| * | Sollers OJSC | 43,650 | 886 |
| | VolgaTelecom Prior Pfd. | 188,963 | 882 |
| * | Inter-Regional Distribution Network Co. Center and Privolzhya OJSC | 97,007,800 | 844 |
| | Polyus Gold OJSC | 11,737 | 837 |
| * | Pharmacy Chain 36.6 OAO | 240,134 | 798 |
| | North-West Telecom Prior Pfd. | 723,939 | 729 |
| | Dalsvyaz OJSC | 123,020 | 700 |
| * | TGK-9 OAO | 5,621,810,330 | 675 |
| * | Razgulay Group | 249,486 | 574 |
| | MMC Norilsk Nickel OJSC ADR | 18,940 | 524 |
| | VTB Bank OJSC | 147,466,163 | 476 |
| * | RAO Energy System of East OAO | 41,216,100 | 443 |
| * | TGK-6 JSC | 1,078,169,787 | 442 |
| | Mosenergosbyt JSC | 21,540,740 | 428 |
| * | TGK-5 | 828,028,359 | 414 |
| * | Belon OJSC | 587,845 | 409 |
| * | TGC-2 | 1,268,144,984 | 317 |
| * | RBC Information Systems | 174,200 | 246 |
| * | FEEC | 7,031,632 | 224 |
| * | RusHydro JSC | 1,571,883 | 80 |
| | | | 915,491 |
| Singapore (1.2%) | | |
| | DBS Group Holdings Ltd. | 5,212,999 | 63,870 |
| | Singapore Telecommunications Ltd. | 23,944,000 | 61,120 |
| | United Overseas Bank Ltd. | 3,717,000 | 59,639 |
| | Oversea-Chinese Banking Corp. Ltd. | 7,533,000 | 58,827 |
| | Keppel Corp. Ltd. | 4,232,800 | 41,219 |
| * | Genting Singapore plc | 18,376,720 | 32,639 |
| | Wilmar International Ltd. | 5,772,000 | 24,876 |
| | CapitaLand Ltd. | 7,689,500 | 21,387 |
| | Noble Group Ltd. | 11,443,590 | 20,908 |
| | Singapore Airlines Ltd. | 1,624,000 | 18,707 |
| | Singapore Exchange Ltd. | 2,588,000 | 16,512 |
| | City Developments Ltd. | 1,632,000 | 15,808 |
| | Fraser and Neave Ltd. | 2,948,000 | 15,113 |
| | Singapore Press Holdings Ltd. | 4,604,000 | 14,982 |
| * | Hutchison Port Holdings Trust | 15,695,401 | 14,440 |
| | SembCorp Industries Ltd. | 2,975,000 | 13,144 |
| | Singapore Technologies Engineering Ltd. | 5,036,000 | 12,978 |
| | SembCorp Marine Ltd. | 2,493,000 | 11,568 |
| | Golden Agri-Resources Ltd. | 20,258,791 | 11,034 |
| | CapitaMall Trust | 6,755,300 | 10,449 |
| | Jardine Cycle & Carriage Ltd. | 325,000 | 9,809 |
| | Olam International Ltd. | 3,820,000 | 8,974 |
| | Ascendas Real Estate Investment Trust | 5,266,666 | 8,747 |
| | Yangzijiang Shipbuilding Holdings Ltd. | 5,828,000 | 8,632 |
| * | Global Logistic Properties Ltd. | 4,707,000 | 7,426 |
| | Keppel Land Ltd. | 2,175,000 | 7,423 |
| | Suntec Real Estate Investment Trust | 5,877,000 | 7,306 |
| | ComfortDelGro Corp. Ltd. | 5,626,000 | 7,045 |
| | CapitaCommercial Trust | 5,910,000 | 6,962 |
| | Venture Corp. Ltd. | 786,000 | 6,202 |
| | CapitaMalls Asia Ltd. | 4,121,000 | 5,970 |
| ^ | Cosco Corp. Singapore Ltd. | 3,080,000 | 5,606 |
| | UOL Group Ltd. | 1,410,000 | 5,583 |
| | Straits Asia Resources Ltd. | 1,846,000 | 4,465 |
| | SATS Ltd. | 2,039,000 | 4,303 |
| ^ | Neptune Orient Lines Ltd. | 2,767,750 | 4,263 |
| | StarHub Ltd. | 1,771,000 | 4,158 |
| | Singapore Post Ltd. | 4,172,000 | 3,958 |
| | SMRT Corp. Ltd. | 2,344,000 | 3,642 |
| | CDL Hospitality Trusts | 1,921,000 | 3,173 |
| | Mapletree Logistics Trust | 3,917,000 | 2,898 |
| * | Biosensors International Group Ltd. | 2,399,000 | 2,648 |
70
| | | |
| Vanguard® Total International Stock Index Fund | | |
| Schedule of Investments | | |
| April 30, 2011 | | |
| |
| | | | Market |
| | | | Value |
| | | Shares | ($000) |
| ^ | Hyflux Ltd. | 1,504,000 | 2,645 |
| | Yanlord Land Group Ltd. | 2,137,000 | 2,535 |
| | Starhill Global REIT | 4,331,000 | 2,248 |
| | M1 Ltd. | 1,139,000 | 2,223 |
| | Allgreen Properties Ltd. | 2,280,000 | 2,201 |
| | GuocoLand Ltd. | 1,057,000 | 2,157 |
| ^ | Fortune Real Estate Investment Trust | 4,210,000 | 2,097 |
| ^ | Ezra Holdings Ltd. | 1,539,000 | 2,081 |
| | Wing Tai Holdings Ltd. | 1,519,000 | 1,962 |
| | Singapore Land Ltd. | 330,000 | 1,931 |
| | Ascott Residence Trust | 1,953,000 | 1,899 |
| | Frasers Centrepoint Trust | 1,477,000 | 1,788 |
| | Midas Holdings Ltd. | 2,838,000 | 1,696 |
| | Parkway Life Real Estate Investment Trust | 1,105,000 | 1,563 |
| | Goodpack Ltd. | 943,000 | 1,527 |
| *,^ | Indofood Agri Resources Ltd. | 861,000 | 1,467 |
| *,2 | ARA Asset Management Ltd. | 995,000 | 1,432 |
| *,^ | China Minzhong Food Corp. Ltd. | 933,000 | 1,381 |
| | Wheelock Properties Singapore Ltd. | 890,000 | 1,354 |
| ^ | Cache Logistics Trust | 1,623,000 | 1,266 |
| | Cambridge Industrial Trust | 3,060,000 | 1,251 |
| | CSE Global Ltd. | 1,300,000 | 1,233 |
| | OSIM International Ltd. | 839,000 | 1,168 |
| * | Raffles Medical Group Ltd. | 600,000 | 1,115 |
| * | UOB-Kay Hian Holdings Ltd. | 725,000 | 1,114 |
| | CapitaRetail China Trust | 1,067,000 | 1,099 |
| * | Jaya Holdings Ltd. | 2,254,000 | 1,080 |
| | United Engineers Ltd. | 515,000 | 1,070 |
| | K-REIT Asia | 959,000 | 1,027 |
| *,^ | Tiger Airways Holdings Ltd. | 815,000 | 1,000 |
| | Hotel Properties Ltd. | 504,000 | 989 |
| | Lippo-Mapletree Indonesia Retail Trust | 2,153,000 | 985 |
| ^ | First Resources Ltd. | 849,000 | 959 |
| ^ | GMG Global Ltd. | 4,155,000 | 952 |
| | Frasers Commercial Trust | 1,412,600 | 924 |
| | Sound Global Ltd. | 1,474,000 | 905 |
| * | Ho Bee Investment Ltd. | 735,000 | 891 |
| *,^ | Raffles Education Corp. Ltd. | 1,618,999 | 880 |
| | GuocoLeisure Ltd. | 1,368,000 | 824 |
| | AIMS AMP Capital Industrial REIT | 4,797,000 | 804 |
| | Metro Holdings Ltd. | 1,121,000 | 797 |
| *,^ | Ying Li International Real Estate Ltd. | 2,464,000 | 797 |
| * | China Aviation Oil Singapore Corp. Ltd. | 683,000 | 755 |
| *,^ | SC Global Developments Ltd. | 622,000 | 718 |
| * | Banyan Tree Holdings Ltd. | 926,000 | 715 |
| | Hong Leong Asia Ltd. | 319,000 | 702 |
| *,^ | Oceanus Group Ltd. | 3,065,000 | 689 |
| | Stamford Land Corp. Ltd. | 1,358,000 | 688 |
| * | Hi-P International Ltd. | 634,000 | 632 |
| | CWT Ltd. | 590,000 | 628 |
| *,^ | Ezion Holdings Ltd. | 987,000 | 558 |
| | Boustead Singapore Ltd. | 666,000 | 555 |
| *,^ | Swiber Holdings Ltd. | 842,000 | 548 |
| | Tat Hong Holdings Ltd. | 798,000 | 545 |
| *,^ | Super Group Ltd. | 449,000 | 507 |
| | Rotary Engineering Ltd. | 650,000 | 495 |
| * | KS Energy Services Ltd. | 601,000 | 487 |
| *,^ | Gallant Venture Ltd. | 1,334,000 | 475 |
| * | Hong Fok Corp. Ltd. | 856,000 | 417 |
| | China XLX Fertiliser Ltd. | 1,139,000 | 401 |
| * | Chemoil Energy Ltd. | 1,071,000 | 381 |
| ^ | Otto Marine Ltd. | 1,893,000 | 356 |
| * | Pacific Century Regional Developments Ltd. | 2,265,000 | 351 |
| | Creative Technology Ltd. | 120,300 | 342 |
71
| | | |
| Vanguard® Total International Stock Index Fund | | |
| Schedule of Investments | | |
| April 30, 2011 | | |
| |
| | | | Market |
| | | | Value |
| | | Shares | ($000) |
| | Keppel Telecommunications & Transportation Ltd. | 316,000 | 333 |
| | CH Offshore Ltd. | 807,000 | 294 |
| | K1 Ventures Ltd. | 2,094,000 | 257 |
| *,^ | Li Heng Chemical Fibre Technologies Ltd. | 1,408,000 | 202 |
| * | Golden Agri-Resources Ltd. Warrants Exp. 07/23/2012 | 724,972 | 95 |
| | | | 740,856 |
| South Africa (1.8%) | | |
| | MTN Group Ltd. | 5,098,618 | 113,405 |
| | Sasol Ltd. | 1,736,507 | 100,346 |
| | Naspers Ltd. | 1,161,613 | 69,955 |
| | AngloGold Ashanti Ltd. | 1,150,745 | 58,602 |
| | Standard Bank Group Ltd. | 3,588,307 | 56,356 |
| | Impala Platinum Holdings Ltd. | 1,527,162 | 47,759 |
| | Gold Fields Ltd. | 2,178,202 | 38,960 |
| | FirstRand Ltd. | 8,565,364 | 26,974 |
| | Sanlam Ltd. | 5,695,162 | 24,429 |
| | Remgro Ltd. | 1,302,354 | 22,584 |
| | Bidvest Group Ltd. | 896,580 | 20,671 |
| | ABSA Group Ltd. | 974,013 | 20,188 |
| | Anglo Platinum Ltd. | 197,627 | 20,112 |
| | Shoprite Holdings Ltd. | 1,231,490 | 19,437 |
| | Harmony Gold Mining Co. Ltd. | 1,159,071 | 17,794 |
| | Kumba Iron Ore Ltd. | 242,699 | 17,759 |
| | Truworths International Ltd. | 1,302,635 | 15,068 |
| | Tiger Brands Ltd. | 486,108 | 14,270 |
| | Steinhoff International Holdings Ltd. | 3,698,951 | 14,264 |
| | Vodacom Group Ltd. | 1,119,955 | 13,717 |
| | Growthpoint Properties Ltd. | 4,751,860 | 13,192 |
| | African Bank Investments Ltd. | 2,185,519 | 12,759 |
| | Massmart Holdings Ltd. | 577,545 | 12,645 |
| | Nedbank Group Ltd. | 541,136 | 12,057 |
| | African Rainbow Minerals Ltd. | 320,200 | 10,429 |
| | Woolworths Holdings Ltd. | 2,233,922 | 10,196 |
| | Exxaro Resources Ltd. | 374,526 | 10,137 |
| | RMB Holdings Ltd. | 2,239,380 | 9,675 |
| | Aspen Pharmacare Holdings Ltd. | 773,805 | 9,553 |
| | Redefine Properties Ltd. | 7,615,317 | 9,085 |
| | Imperial Holdings Ltd. | 501,634 | 9,026 |
| * | Sappi Ltd. | 1,602,184 | 8,740 |
| | Foschini Group Ltd. | 612,438 | 8,453 |
| | MMI Holdings Ltd. | 3,164,992 | 8,210 |
| | Barloworld Ltd. | 686,013 | 7,777 |
| | Spar Group Ltd. | 512,356 | 7,601 |
| | ArcelorMittal South Africa Ltd. | 530,490 | 7,265 |
| | Mr Price Group Ltd. | 708,565 | 7,259 |
| | Netcare Ltd. | 3,249,343 | 7,016 |
| | Pretoria Portland Cement Co. Ltd. | 1,587,575 | 6,051 |
| | Aveng Ltd. | 1,117,946 | 5,940 |
| | Clicks Group Ltd. | 863,613 | 5,779 |
| | Investec Ltd. | 703,249 | 5,691 |
| | Nampak Ltd. | 1,604,050 | 5,482 |
| | Reunert Ltd. | 543,461 | 5,158 |
| | Capital Property Fund | 4,076,566 | 5,087 |
| | Adcock Ingram Holdings Ltd. | 530,439 | 4,926 |
| | Discovery Holdings Ltd. | 817,199 | 4,714 |
| | Aeci Ltd. | 358,309 | 4,691 |
| | Telkom SA Ltd. | 790,971 | 4,609 |
| | Sun International Ltd. | 323,843 | 4,522 |
| | Mondi Ltd. | 449,111 | 4,322 |
| | Northam Platinum Ltd. | 627,775 | 4,148 |
| | Pick n Pay Stores Ltd. | 635,599 | 4,113 |
| | RMI Holdings | 2,266,141 | 4,094 |
| | Hyprop Investments Ltd. | 476,619 | 3,845 |
| | AVI Ltd. | 797,548 | 3,740 |
72
| | | |
| Vanguard® Total International Stock Index Fund | | |
| Schedule of Investments | | |
| April 30, 2011 | | |
| |
| | | | Market |
| | | | Value |
| | | Shares | ($000) |
| | Murray & Roberts Holdings Ltd. | 967,042 | 3,712 |
| | Tongaat Hulett Ltd. | 238,656 | 3,487 |
| | JD Group Ltd. | 473,122 | 3,458 |
| | Fountainhead Property Trust | 3,405,185 | 3,426 |
| | Liberty Holdings Ltd. | 293,307 | 3,216 |
| | Resilient Property Income Fund Ltd. | 672,272 | 3,190 |
| | Lewis Group Ltd. | 257,927 | 3,102 |
| | Illovo Sugar Ltd. | 708,472 | 3,071 |
| | SA Corporate Real Estate Fund Nominees Pty Ltd. | 5,788,635 | 2,908 |
| * | Metorex Ltd. | 2,527,832 | 2,828 |
| | Allied Electronics Corp. Ltd. Prior Pfd. | 675,401 | 2,827 |
| | DataTec Ltd. | 485,012 | 2,703 |
| | Acucap Properties Ltd. | 468,472 | 2,604 |
| | Wilson Bayly Holmes-Ovcon Ltd. | 144,490 | 2,509 |
| | Astral Foods Ltd. | 118,697 | 2,428 |
| | Santam Ltd. | 122,252 | 2,421 |
| | JSE Ltd. | 235,896 | 2,358 |
| | Grindrod Ltd. | 1,045,754 | 2,328 |
| | Pick'n Pay Holdings Ltd. | 777,908 | 2,135 |
| | Coronation Fund Managers Ltd. | 607,173 | 1,754 |
| * | Omnia Holdings Ltd. | 153,876 | 1,751 |
| | Emira Property Fund | 864,399 | 1,740 |
| | Allied Technologies Ltd. | 140,882 | 1,375 |
| | Group Five Ltd. | 310,934 | 1,374 |
| | Vukile Property Fund Ltd. | 591,305 | 1,281 |
| | Hudaco Industries Ltd. | 87,903 | 1,150 |
| | African Oxygen Ltd. | 393,908 | 1,110 |
| | Sycom Property Fund | 335,248 | 1,085 |
| * | Eqstra Holdings Ltd. | 1,001,523 | 1,024 |
| * | Super Group Ltd. | 8,077,091 | 974 |
| | City Lodge Hotels Ltd. | 91,773 | 965 |
| | Palabora Mining Co. Ltd. | 41,571 | 929 |
| | Afgri Ltd. | 838,028 | 891 |
| | Avusa Ltd. | 233,607 | 869 |
| | Cipla Medpro South Africa Ltd. | 823,346 | 861 |
| | Raubex Group Ltd. | 285,706 | 861 |
| | Brait SA | 299,724 | 854 |
| | Famous Brands Ltd. | 129,262 | 828 |
| | Merafe Resources Ltd. | 3,515,209 | 798 |
| | Cashbuild Ltd. | 53,727 | 760 |
| | DRDGOLD Ltd. | 1,054,628 | 640 |
| | Adcorp Holdings Ltd. | 153,859 | 628 |
| | Zeder Investments Ltd. | 1,662,111 | 618 |
| | Allied Electronics Corp. Ltd. | 131,424 | 577 |
| | Stefanutti Stocks Holdings Ltd. | 307,111 | 556 |
| | Basil Read Holdings Ltd. | 262,694 | 515 |
| * | Sentula Mining Ltd. | 1,093,944 | 483 |
| | Iliad Africa Ltd. | 312,330 | 348 |
| * | Evraz Highveld Steel and Vanadium Ltd. | 40,392 | 344 |
| * | Distribution and Warehousing Network Ltd. | 318,222 | 341 |
| * | Mvelaphanda Group Ltd. | 650,531 | 317 |
| * | Mvelaserve Ltd. | 173,109 | 307 |
| * | Wesizwe | 861,799 | 297 |
| * | Simmer & Jack Mines Ltd. | 2,168,007 | 264 |
| | Argent Industrial Ltd. | 173,313 | 224 |
| * | Hulamin Ltd. | 178,227 | 190 |
| | | | 1,085,231 |
| South Korea (3.5%) | | |
| | Samsung Electronics Co. Ltd. | 261,755 | 218,639 |
| | Hyundai Motor Co. | 463,901 | 106,998 |
| | LG Chem Ltd. | 139,664 | 69,388 |
| | Hyundai Mobis | 205,098 | 68,792 |
| 2 | Samsung Electronics Co. Ltd. GDR | 141,203 | 58,947 |
| | Hyundai Heavy Industries Co. Ltd. | 114,252 | 57,142 |
73
| | | |
| Vanguard® Total International Stock Index Fund | | |
| Schedule of Investments | | |
| April 30, 2011 | | |
| |
| | | | Market |
| | | | Value |
| | | Shares | ($000) |
| | POSCO | 119,308 | 52,357 |
| | Kia Motors Corp. | 716,440 | 51,540 |
| | Hynix Semiconductor Inc. | 1,510,290 | 47,755 |
| | Shinhan Financial Group Co. Ltd. | 896,600 | 43,986 |
| | KB Financial Group Inc. | 740,093 | 39,673 |
| | SK Innovation Co. Ltd. | 180,562 | 39,279 |
| | Samsung Electronics Co. Ltd. Prior Pfd. | 61,951 | 36,471 |
| | POSCO ADR | 310,397 | 34,237 |
| | Hana Financial Group Inc. | 658,400 | 27,935 |
| | Samsung C&T Corp. | 376,614 | 27,283 |
| | LG Electronics Inc. | 282,248 | 27,172 |
| | OCI Co. Ltd. | 45,239 | 27,061 |
| | LG Corp. | 286,890 | 26,413 |
| | LG Display Co. Ltd. | 700,510 | 25,128 |
| * | NHN Corp. | 123,553 | 24,511 |
| | Samsung Fire & Marine Insurance Co. Ltd. | 107,167 | 23,021 |
| | Samsung Heavy Industries Co. Ltd. | 487,060 | 22,081 |
| | Shinsegae Co. Ltd. | 84,878 | 21,385 |
| | Hyundai Steel Co. | 167,687 | 21,362 |
| | S-Oil Corp. | 136,016 | 20,336 |
| | Samsung Engineering Co. Ltd. | 90,666 | 20,164 |
| | KT&G Corp. | 331,551 | 19,623 |
| | Samsung SDI Co. Ltd. | 102,359 | 18,342 |
| | Samsung Electro-Mechanics Co. Ltd. | 179,610 | 17,386 |
| | Hyundai Engineering & Construction Co. Ltd. | 200,227 | 16,820 |
| | Shinhan Financial Group Co. Ltd. ADR | 157,813 | 15,311 |
| | Honam Petrochemical Corp. | 42,923 | 15,198 |
| | Cheil Industries Inc. | 136,214 | 15,018 |
| | SK Holdings Co. Ltd. | 78,134 | 14,042 |
| | Lotte Shopping Co. Ltd. | 30,594 | 13,953 |
| | Samsung Life Insurance Co. Ltd. | 149,725 | 13,593 |
| | KB Financial Group Inc. ADR | 246,496 | 13,136 |
| | GS Engineering & Construction Corp. | 108,021 | 13,019 |
| | GS Holdings | 153,749 | 12,890 |
| | Samsung Securities Co. Ltd. | 151,683 | 12,683 |
| | Daewoo Shipbuilding & Marine Engineering Co. Ltd. | 289,900 | 12,425 |
| | Woori Finance Holdings Co. Ltd. | 851,997 | 11,643 |
| * | Korea Electric Power Corp. | 477,100 | 11,431 |
| | Hanwha Chem Corp. | 254,780 | 11,371 |
| | NCSoft Corp. | 42,858 | 11,366 |
| | LG Household & Health Care Ltd. | 25,759 | 10,361 |
| | Korea Zinc Co. Ltd. | 25,482 | 10,064 |
| | SK Telecom Co. Ltd. | 66,036 | 10,005 |
| | Amorepacific Corp. | 9,608 | 9,685 |
| | Industrial Bank of Korea | 499,080 | 9,591 |
| | Daelim Industrial Co. Ltd. | 84,700 | 9,580 |
| | Samsung Techwin Co. Ltd. | 111,837 | 9,218 |
| | Hankook Tire Co. Ltd. | 228,770 | 9,188 |
| | Hyundai Motor Co. 2nd Pfd. | 113,857 | 9,164 |
| | SK Telecom Co. Ltd. ADR | 479,003 | 9,091 |
| | KT Corp. | 244,959 | 8,795 |
| | Daewoo Securities Co. Ltd. | 372,610 | 7,862 |
| | Doosan Heavy Industries and Construction Co. Ltd. | 129,262 | 7,218 |
| | Korea Electric Power Corp. ADR | 595,602 | 7,207 |
| * | Doosan Infracore Co. Ltd. | 251,900 | 6,984 |
| | Korean Air Lines Co. Ltd. | 107,744 | 6,587 |
| | Kangwon Land Inc. | 289,020 | 6,571 |
| | Korea Exchange Bank | 770,550 | 6,567 |
| | Hyundai Department Store Co. Ltd. | 44,631 | 6,548 |
| * | BS Financial Group Inc. | 444,130 | 6,465 |
| | Samsung Card Co. | 128,612 | 6,390 |
| | Daegu Bank Ltd. | 378,030 | 6,322 |
| | Hanwha Corp. | 136,530 | 6,286 |
| | Dongbu Insurance Co. Ltd. | 127,990 | 6,103 |
74
| | | |
| Vanguard® Total International Stock Index Fund | | |
| Schedule of Investments | | |
| April 30, 2011 | | |
| |
| | | | Market |
| | | | Value |
| | | Shares | ($000) |
| | LS Corp. | 53,654 | 5,947 |
| | Hyundai Mipo Dockyard | 33,344 | 5,922 |
| | CJ CheilJedang Corp. | 24,762 | 5,748 |
| | Hyosung Corp. | 68,633 | 5,633 |
| | KT Corp. ADR | 269,972 | 5,480 |
| | Celltrion Inc. | 157,023 | 5,387 |
| | Hyundai Motor Co. Prior Pfd. | 69,652 | 5,244 |
| | Woori Investment & Securities Co. Ltd. | 260,980 | 5,239 |
| | Woongjin Coway Co. Ltd. | 151,710 | 5,070 |
| | KCC Corp. | 14,615 | 4,956 |
| | Mando Corp. | 27,957 | 4,917 |
| | Hyundai Glovis Co. Ltd. | 34,383 | 4,914 |
| | Hyundai Development Co. | 172,270 | 4,718 |
| | SK C&C Co. Ltd. | 45,452 | 4,674 |
| | Korea Investment Holdings Co. Ltd. | 118,060 | 4,636 |
| | Dongkuk Steel Mill Co. Ltd. | 114,440 | 4,563 |
| | Hyundai Securities Co. | 354,160 | 4,492 |
| | Korea Kumho Petrochemical | 23,457 | 4,471 |
| | LG Uplus Corp. | 713,150 | 4,333 |
| | Hyundai Marine & Fire Insurance Co. Ltd. | 164,510 | 4,329 |
| | STX Offshore & Shipbuilding Co. Ltd. | 146,600 | 4,328 |
| | Orion Corp. | 11,017 | 4,276 |
| | Daewoo International Corp. | 109,597 | 4,263 |
| | Kolon Industries Inc. | 50,924 | 4,131 |
| | Hyundai Hysco | 100,040 | 4,082 |
| | LG Chem Ltd. Prior Pfd. | 23,660 | 4,077 |
| | Hanjin Shipping Co. Ltd. | 156,190 | 4,065 |
| | Hyundai Merchant Marine Co. Ltd. | 130,170 | 3,975 |
| | Samsung Fine Chemicals Co. Ltd. | 51,956 | 3,852 |
| | Korea Life Insurance Co. Ltd. | 540,460 | 3,732 |
| | Doosan Corp. | 29,586 | 3,635 |
| | Cheil Worldwide Inc. | 280,420 | 3,619 |
| * | Hanjin Heavy Industries & Construction Co. Ltd. | 97,722 | 3,560 |
| * | Daewoo Engineering & Construction Co. Ltd. | 326,490 | 3,479 |
| | Yuhan Corp. | 25,931 | 3,472 |
| | LS Industrial Systems Co. Ltd. | 46,628 | 3,464 |
| | Daum Communications Corp. | 33,504 | 3,435 |
| | SKC Co. Ltd. | 59,360 | 3,414 |
| | LG International Corp. | 85,820 | 3,402 |
| | Lotte Confectionery Co. Ltd. | 2,216 | 3,280 |
| | CJ Corp. | 42,827 | 3,234 |
| | LG Innotek Co. Ltd. | 31,172 | 3,149 |
| | SK Chemicals Co. Ltd. | 43,482 | 3,072 |
| | Seoul Semiconductor Co. Ltd. | 97,687 | 2,932 |
| | Mirae Asset Securities Co. Ltd. | 71,847 | 2,911 |
| | KP Chemical Corp. | 116,856 | 2,884 |
| | SK Networks Co. Ltd. | 257,480 | 2,853 |
| * | CJ E&M Corp. | 66,470 | 2,778 |
| | LIG Insurance Co. Ltd. | 107,200 | 2,647 |
| | S1 Corp. | 50,736 | 2,478 |
| * | Kumho Industrial Co. Ltd. | 222,480 | 2,459 |
| | STX Pan Ocean Co. Ltd. | 302,660 | 2,456 |
| | Halla Climate Control Corp. | 119,790 | 2,455 |
| | Hotel Shilla Co. Ltd. | 99,160 | 2,438 |
| | Korean Reinsurance Co. | 207,460 | 2,383 |
| * | Asiana Airlines | 261,130 | 2,318 |
| | Dong-A Pharmaceutical Co. Ltd. | 23,152 | 2,268 |
| | NongShim Co. Ltd. | 9,704 | 2,258 |
| | STX Corp. Co. Ltd. | 87,240 | 2,177 |
| * | Korea Express Co. Ltd. | 21,932 | 2,160 |
| | Korea Gas Corp. | 67,403 | 2,150 |
| | KIWOOM Securities Co. Ltd. | 35,780 | 2,140 |
| | Lotte Chilsung Beverage Co. Ltd. | 1,999 | 2,139 |
| | Capro Corp. | 70,650 | 2,138 |
75
| | | |
| Vanguard® Total International Stock Index Fund | | |
| Schedule of Investments | | |
| April 30, 2011 | | |
| |
| | | | Market |
| | | | Value |
| | | Shares | ($000) |
| | OCI Materials Co. Ltd. | 16,833 | 2,096 |
| | Poongsan Corp. | 54,210 | 2,065 |
| | CJ O Shopping Co. Ltd. | 9,628 | 2,065 |
| | Meritz Fire & Marine Insurance Co. Ltd. | 169,759 | 1,950 |
| | Hite Brewery Co. Ltd. | 16,985 | 1,864 |
| | Lock & Lock Co. Ltd. | 48,830 | 1,788 |
| | AMOREPACIFIC Group | 9,019 | 1,777 |
| | Tong Yang Securities Inc. | 239,660 | 1,765 |
| | LG Fashion Corp. | 56,780 | 1,761 |
| | STX Engine Co. Ltd. | 64,850 | 1,757 |
| | MegaStudy Co. Ltd. | 12,363 | 1,756 |
| * | Neowiz Games Corp. | 37,454 | 1,749 |
| * | SK Broadband Co. Ltd. | 432,206 | 1,736 |
| | LG Electronics Inc. Prior Pfd. | 51,160 | 1,722 |
| | Hyundai Greenfood Co. Ltd. | 145,740 | 1,715 |
| | Huchems Fine Chemical Corp. | 72,700 | 1,685 |
| | Seah Besteel Corp. | 32,380 | 1,664 |
| | Daishin Securities Co. Ltd. | 123,020 | 1,663 |
| | SFA Engineering Corp. | 28,633 | 1,641 |
| * | LG Life Sciences Ltd. | 38,021 | 1,626 |
| | Green Cross Corp. | 12,220 | 1,587 |
| | Nexen Tire Corp. | 94,930 | 1,579 |
| | Taekwang Industrial Co. Ltd. | 1,085 | 1,539 |
| * | GemVax & Kael Co. Ltd. | 59,127 | 1,429 |
| | Melfas Inc. | 34,040 | 1,401 |
| | Sungwoo Hitech Co. Ltd. | 67,544 | 1,369 |
| | SK Securities Co. Ltd. | 670,760 | 1,330 |
| | LG Hausys Ltd. | 17,881 | 1,330 |
| | GS Home Shopping Inc. | 9,160 | 1,317 |
| * | Jusung Engineering Co. Ltd. | 79,895 | 1,283 |
| * | Taihan Electric Wire Co. Ltd. | 260,670 | 1,262 |
| | Jinro Ltd. | 35,030 | 1,187 |
| * | Wonik IPS Co. Ltd. | 136,910 | 1,115 |
| | Samyang Corp. | 14,309 | 1,110 |
| | Tong Yang Life Insurance | 91,910 | 1,099 |
| | Namyang Dairy Products Co. Ltd. | 1,440 | 1,084 |
| | Dongyang Mechatronics Corp. | 63,430 | 1,067 |
| | China Ocean Resources Co. Ltd. | 115,261 | 1,060 |
| | Hwa Shin Co. Ltd. | 59,240 | 1,033 |
| * | Foosung Co. Ltd. | 132,783 | 1,029 |
| * | Ssangyong Motor Co. | 110,870 | 1,025 |
| | Dongsuh Co. Inc. | 29,710 | 1,018 |
| | CJ CGV Co. Ltd. | 38,640 | 1,008 |
| * | HMC Investment Securities Co. Ltd. | 45,470 | 1,007 |
| | Hana Tour Service Inc. | 24,893 | 1,002 |
| * | Hanmi Pharm Co. Ltd. | 13,909 | 992 |
| | Hanwha Securities Co. | 142,460 | 965 |
| * | Taewoong Co. Ltd. | 21,389 | 947 |
| | Technosemichem Co. Ltd. | 20,983 | 946 |
| | S&T Dynamics Co. Ltd. | 60,130 | 932 |
| | Hanil E-Wha Co. Ltd. | 74,620 | 918 |
| * | Chabio & Diostech Co. Ltd. | 100,141 | 910 |
| | Daeduck Electronics Co. | 83,740 | 896 |
| | Handsome Co. Ltd. | 42,230 | 887 |
| | POSCO Chemtech Co. Ltd. | 5,907 | 881 |
| * | Dongbu HiTek Co. Ltd. | 61,490 | 877 |
| | iMarketKorea Inc. | 41,120 | 875 |
| * | Woongjin Chemical Co. Ltd. | 678,520 | 866 |
| | Namhae Chemical Corp. | 65,020 | 858 |
| * | Posco ICT Co. Ltd. | 117,465 | 854 |
| * | Eugene Investment & Securities Co. Ltd. | 1,437,950 | 852 |
| | Silicon Works Co. Ltd. | 25,560 | 852 |
| | Binggrae Co. Ltd. | 14,030 | 839 |
| * | TK Corp. | 37,061 | 836 |
76
| | | |
| Vanguard® Total International Stock Index Fund | | |
| Schedule of Investments | | |
| April 30, 2011 | | |
| |
| | | | Market |
| | | | Value |
| | | Shares | ($000) |
| | Youngone Holdings Co. Ltd. | 23,820 | 815 |
| | Halla Engineering & Construction corp | 37,150 | 787 |
| * | Komipharm International Co. Ltd. | 15,731 | 778 |
| | Hansol Technics Co. Ltd. | 17,770 | 776 |
| | Hansol Paper Co. | 99,870 | 769 |
| | Woongjin Thinkbig Co. Ltd. | 46,990 | 757 |
| | Sung Kwang Bend Co. Ltd. | 44,945 | 742 |
| | Grand Korea Leisure Co. Ltd. | 54,040 | 739 |
| | Kukdo Chemical Co. Ltd. | 11,096 | 737 |
| | SL Corp. | 27,900 | 736 |
| | Youngone Corp. | 69,970 | 735 |
| | Samchully Co. Ltd. | 7,508 | 715 |
| | Chong Kun Dang Pharm Corp. | 26,130 | 696 |
| | NEPES Corp. | 43,333 | 691 |
| * | Ace Digitech Co. Ltd. | 46,461 | 691 |
| | Eo Technics Co. Ltd. | 20,946 | 688 |
| | Global & Yuasa Battery Co. Ltd. | 16,020 | 682 |
| * | CrucialTec Co. Ltd. | 31,495 | 674 |
| * | Duksan Hi-Metal Co. Ltd. | 31,625 | 673 |
| | Hyundai Elevator Co. Ltd. | 6,951 | 672 |
| | Lotte Midopa Co. Ltd. | 45,000 | 658 |
| * | Woongjin Energy Co. Ltd. | 42,800 | 656 |
| * | Hanall Biopharma Co. Ltd. | 76,640 | 646 |
| | Korea Petrochemical Ind Co. Ltd. | 5,388 | 645 |
| * | Sung Jin Geotec Co. Ltd. | 38,420 | 642 |
| | Dongwon Industries Co. Ltd. | 3,363 | 635 |
| | Paradise Co. Ltd. | 108,190 | 633 |
| | Partron Co. Ltd. | 37,137 | 632 |
| * | Lumens Co. Ltd. | 74,509 | 630 |
| | KISWIRE Ltd. | 16,720 | 629 |
| | Taeyoung Engineering & Construction | 120,060 | 628 |
| | Jeonbuk Bank | 111,000 | 609 |
| | Shinsung Solar Energy Co. Ltd. | 67,400 | 607 |
| | Simm Tech Co. Ltd. | 41,342 | 605 |
| | ELK Corp. | 25,691 | 605 |
| | Daou Technology Inc. | 70,510 | 603 |
| | Lotte Samkang Co. Ltd. | 1,981 | 601 |
| | NH Investment & Securities Co. Ltd. | 73,458 | 591 |
| | Pyeong Hwa Automotive Co. Ltd. | 30,575 | 587 |
| * | Hyundai BNG Steel Co. Ltd. | 29,250 | 585 |
| | Humax Co. Ltd. | 46,378 | 575 |
| | Unid Co. Ltd. | 8,467 | 575 |
| | Korea District Heating Corp. | 8,245 | 574 |
| | Modetour Network Inc. | 17,945 | 573 |
| * | RNL BIO Co. Ltd. | 190,200 | 570 |
| * | GameHi Co. Ltd. | 242,400 | 564 |
| * | Hyunjin Materials Co. Ltd. | 33,881 | 548 |
| | Hanjin Transportation Co. Ltd. | 22,240 | 546 |
| | AtlasBX Co. Ltd. | 18,328 | 546 |
| * | KTB Investement & Securities Co. Ltd. | 141,600 | 543 |
| | Interflex Co. Ltd. | 21,260 | 531 |
| | MNTech Co. Ltd. | 62,841 | 530 |
| | ISU Chemical Co. Ltd. | 23,850 | 526 |
| * | Hanwha General Insurance Co. Ltd. | 62,670 | 523 |
| | Dongbu Steel Co. Ltd. | 59,350 | 523 |
| | Hanil Cement Co. Ltd. | 10,790 | 521 |
| | SeAH Steel Corp. | 6,007 | 513 |
| | Hyundai Corp. | 18,500 | 511 |
| | Ilyang Pharmaceutical Co. Ltd. | 31,096 | 508 |
| | Daesang Corp. | 60,820 | 506 |
| | Uju Electronics Co. Ltd. | 18,910 | 504 |
| | Daishin Securities Co. Ltd. Prior Pfd. | 59,430 | 498 |
| | Sindoh Co. Ltd. | 10,081 | 497 |
| * | Curexo Inc. | 39,826 | 489 |
77
| | | |
| Vanguard® Total International Stock Index Fund | | |
| Schedule of Investments | | |
| April 30, 2011 | | |
| |
| | | | Market |
| | | | Value |
| | | Shares | ($000) |
| | AUK Corp. | 116,010 | 489 |
| * | SM Entertainment Co. | 27,098 | 488 |
| | KH Vatec Co. Ltd. | 28,742 | 488 |
| | S&T Daewoo Co. Ltd. | 16,650 | 485 |
| | Basic House Co. Ltd. | 21,660 | 482 |
| | Daewoong Pharmaceutical Co. Ltd. | 12,604 | 478 |
| * | Kumho Tire Co. Inc. | 26,800 | 476 |
| | Meritz Securities Co. Ltd. | 529,520 | 465 |
| | Bukwang Pharmaceutical Co. Ltd. | 38,680 | 452 |
| | Daekyo Co. Ltd. | 84,710 | 451 |
| * | Medipost Co. Ltd. | 14,374 | 451 |
| * | DuzonBIzon Co. Ltd. | 45,100 | 447 |
| | L&F Co. Ltd. | 22,802 | 444 |
| | Dae Han Flour Mills Co. Ltd. | 2,900 | 439 |
| | Daeduck GDS Co. Ltd. | 51,370 | 436 |
| | Shinyoung Securities Co. Ltd. | 12,900 | 434 |
| | Iljin Electric Co. Ltd. | 54,490 | 432 |
| | Woori Financial Co. Ltd. | 25,960 | 429 |
| | Dongjin Semichem Co. Ltd. | 69,766 | 429 |
| | Ottogi Corp. | 3,444 | 426 |
| | Sejong Industrial Co. Ltd. | 22,100 | 421 |
| | SK Gas Co. Ltd. | 8,820 | 419 |
| | SamkwangGlass Co. Ltd. | 6,242 | 417 |
| | Sebang Co. Ltd. | 26,400 | 407 |
| | Hanjin Shipping Holdings Co. Ltd. | 31,310 | 407 |
| * | Digitech Systems Co. Ltd. | 28,417 | 403 |
| | Hanjin Heavy Industries & Construction Holdings Co. Ltd. | 32,600 | 396 |
| | Shinsegae Food Co. Ltd. | 4,735 | 389 |
| | GS Global Corp. | 22,815 | 386 |
| | Eugene Technology Co. Ltd. | 21,142 | 385 |
| | KC Tech Co. Ltd. | 49,234 | 382 |
| | Asia Cement Co. Ltd. | 8,700 | 379 |
| | WeMade Entertainment Co. Ltd. | 11,545 | 374 |
| * | SK Communications Co. Ltd. | 34,781 | 374 |
| | Doosan Engineering & Construction Co. Ltd. | 77,960 | 374 |
| | Songwon Industrial Co. Ltd. | 26,500 | 371 |
| * | Tera Resource Co. Ltd. | 422,921 | 363 |
| | Korea Kolmar Co. Ltd. | 50,540 | 363 |
| | EG Corp. | 11,413 | 362 |
| | Hankook Shell Oil Co. Ltd. | 1,849 | 362 |
| | Kyobo Securities Co. | 51,430 | 360 |
| | Hanssem Co. Ltd. | 27,800 | 357 |
| | Kwang Dong Pharmaceutical Co. Ltd. | 120,870 | 354 |
| | Poongsan Holdings Corp. | 10,420 | 348 |
| | INTOPS Co. Ltd. | 20,021 | 347 |
| * | Iljin Display Co. Ltd. | 35,500 | 345 |
| * | Seobu T&D | 23,832 | 344 |
| | GwangjuShinsegae Co. Ltd. | 2,016 | 343 |
| | HNK Machine Tool Co. Ltd. | 10,456 | 341 |
| * | Ssangyong Cement Industrial Co. Ltd. | 53,410 | 340 |
| * | Osstem Implant Co. Ltd. | 29,449 | 336 |
| | Intelligent Digital Integrated Security Co. Ltd. | 20,768 | 334 |
| | Dongbu Securities Co. Ltd. | 54,580 | 328 |
| | E1 Corp. | 6,931 | 327 |
| | KISCO Corp. | 10,530 | 325 |
| | Korea Electric Terminal Co. Ltd. | 15,110 | 322 |
| | Nong Shim Holdings Co. Ltd. | 5,491 | 321 |
| | Han Kuk Carbon Co. Ltd. | 47,560 | 319 |
| | Fursys Inc. | 12,585 | 318 |
| | SeAH Holdings Corp. | 2,412 | 318 |
| | JW Pharmaceutical Corp. | 21,722 | 316 |
| | DONGKUK STRUCTURES & CONSTRUCTION Co. Ltd. | 60,571 | 314 |
| * | Keangnam Enterprises Ltd. | 29,080 | 313 |
| * | Interpark Corp. | 72,360 | 301 |
78
| | | |
| Vanguard® Total International Stock Index Fund | | |
| Schedule of Investments | | |
| April 30, 2011 | | |
| |
| | | | Market |
| | | | Value |
| | | Shares | ($000) |
| | Moorim P&P Co. Ltd. | 20,160 | 294 |
| | Young Poong Precision Corp. | 26,019 | 292 |
| | KPX Chemical Co. Ltd. | 5,319 | 289 |
| * | Eugene Corp. | 67,253 | 288 |
| | Dong Yang Gang Chul Co. Ltd. | 71,800 | 287 |
| | Hite Holdings Co. Ltd. | 19,170 | 285 |
| | Dae Won Kang Up Co. Ltd. | 51,298 | 283 |
| * | Danal Co. Ltd. | 33,956 | 282 |
| * | SBS Media Holdings Co. Ltd. | 105,930 | 281 |
| * | Daea TI Co. Ltd. | 146,137 | 281 |
| | Jinsung T.E.C. | 19,945 | 279 |
| | Pusan City Gas Co. Ltd. | 15,470 | 279 |
| | Wooree ETI Co. Ltd. | 62,003 | 279 |
| * | Meritz Finance Holdings Co. Ltd. | 71,060 | 278 |
| | Kumho Electric Co. Ltd. | 9,550 | 278 |
| * | Fawoo Technology Co. Ltd. | 78,934 | 277 |
| * | Gamevil Inc. | 9,041 | 275 |
| * | Korea Digital Communications Corp. | 181,365 | 274 |
| | Dongkuk Industries Co. Ltd. | 70,893 | 273 |
| | Daehan Steel Co. Ltd. | 30,910 | 272 |
| * | Harim & Co. Ltd. | 62,363 | 271 |
| | Samjin Pharmaceutical Co. Ltd. | 29,863 | 270 |
| | Harim Holdings Co. Ltd. | 73,047 | 269 |
| | Kook Soon Dang Brewery Co. Ltd. | 21,655 | 268 |
| | Youlchon Chemical Co. Ltd. | 32,420 | 268 |
| | Sajo Industries Co. Ltd. | 4,590 | 266 |
| * | Chin Hung International Inc. | 1,337,660 | 265 |
| | Lotte Non-Life Insurance Co. Ltd. | 40,700 | 262 |
| * | DMS Co. Ltd. | 35,713 | 261 |
| | Silla Co. Ltd. | 17,230 | 259 |
| | Sam Young Electronics Co. Ltd. | 23,120 | 258 |
| | SDN Co. Ltd. | 29,710 | 258 |
| | Daishin Securities Co. Ltd. Prior Pfd. | 33,010 | 258 |
| | Kolon Corp. | 9,600 | 258 |
| | Hy-Lok Corp. | 17,553 | 257 |
| * | JVM Co. Ltd. | 7,466 | 255 |
| * | Hanjin P&C Co. Ltd. | 32,912 | 252 |
| | NICE Holdings Co. Ltd. | 4,368 | 246 |
| | Samyang Genex Co. Ltd. | 4,129 | 243 |
| | China King-highway Holdings Ltd. | 84,411 | 241 |
| | Motonic Corp. | 25,710 | 240 |
| | Il Dong Pharmaceutical Co. Ltd. | 6,220 | 238 |
| | Daegu Department Store | 22,060 | 236 |
| | BHI Co. Ltd. | 14,469 | 233 |
| | S&T Holdings Co. Ltd. | 17,530 | 232 |
| | Sewon Cellontech Co. Ltd. | 62,900 | 232 |
| | Hansae Co. Ltd. | 36,840 | 229 |
| * | KEC Corp. | 235,900 | 227 |
| * | Shinwha Intertek Corp. | 38,278 | 227 |
| | Credu Corp. | 6,081 | 226 |
| | Infopia Co. Ltd. | 16,608 | 226 |
| | SBS Contents Hub Co. Ltd. | 19,368 | 224 |
| * | Kolon Engineering & Construction Co. Ltd. | 58,710 | 223 |
| | Dongil Industries Co. Ltd. | 3,004 | 221 |
| | A-Tech Solution Co. Ltd. | 14,834 | 217 |
| | Kolon Life Science Inc. | 7,754 | 217 |
| | Dragonfly GF Co. Ltd. | 13,172 | 214 |
| | Dong Ah Tire & Rubber Co. Ltd. | 23,980 | 209 |
| | NK Co. Ltd. | 40,200 | 209 |
| | Hanmi Semiconductor Co. Ltd. | 24,060 | 204 |
| * | UI ENERGY Corp. | 85,527 | 203 |
| * | Ssangyong Engineering & Construction Co. Ltd. | 29,600 | 203 |
| | Sambu Construction Co. Ltd. | 17,048 | 203 |
| | Moorim Paper Co. Ltd. | 26,150 | 202 |
79
| | | |
| Vanguard® Total International Stock Index Fund | | |
| Schedule of Investments | | |
| April 30, 2011 | | |
| |
| | | | Market |
| | | | Value |
| | | Shares | ($000) |
| | KCC Engineering & Construction Co. Ltd. | 5,059 | 202 |
| | Suprema Inc. | 26,274 | 198 |
| | Dongwha Pharm Co. Ltd. | 39,710 | 192 |
| | STX Metal Co. Ltd. | 18,500 | 192 |
| * | KT Hitel Co. Ltd. | 30,415 | 191 |
| * | Infraware Inc. | 30,932 | 190 |
| * | Hanmi Holdings Co. Ltd. | 5,858 | 184 |
| | S&T Corp. | 10,530 | 184 |
| | SSCP Co. Ltd. | 58,087 | 179 |
| * | Dasan Networks Inc. | 24,246 | 175 |
| | Samchuly Bicycle Co. Ltd. | 19,709 | 175 |
| * | Korea Real Estate Investment Trust Co. | 308,395 | 174 |
| | TS Corp. | 4,233 | 174 |
| * | Daewoo Motor Sales | 97,610 | 173 |
| * | Yungjin Pharmaceutical Co. Ltd. | 186,540 | 173 |
| | Jeil Pharmaceutical Co. | 14,760 | 172 |
| | Maeil Dairy Industry Co. Ltd. | 15,153 | 169 |
| | Dongbu Corp. | 26,730 | 167 |
| | Union Steel | 7,060 | 166 |
| | Dong-Ah Geological Engineering Co. Ltd. | 12,320 | 160 |
| | Kyeryong Construction Industrial Co. Ltd. | 12,090 | 159 |
| * | Heungkuk Fire & Marine Insurance Co. Ltd. | 32,020 | 159 |
| | Seohee Construction Co. Ltd. | 148,829 | 158 |
| | Kyungbang Ltd. | 1,473 | 158 |
| | Dohwa Engineering Co. Ltd. | 11,840 | 157 |
| | POSCO Coated & Color Steel Co. Ltd. | 5,700 | 156 |
| | Ahnlab Inc. | 8,687 | 151 |
| | Ilsung Pharmaceuticals Co. Ltd. | 2,009 | 151 |
| * | Insun ENT Co. Ltd. | 48,041 | 150 |
| | Hankuk Paper Manufacturing Co. Ltd. | 6,970 | 143 |
| * | Webzen Inc. | 18,955 | 143 |
| | KPX Fine Chemical Co. Ltd. | 3,790 | 142 |
| | Hanyang Securities Co. Ltd. | 18,270 | 142 |
| | China Great Star International Ltd. | 91,214 | 141 |
| | Woojeon & Handan Co. Ltd. | 29,796 | 141 |
| * | Daekyung Machinery & Engr Co. | 50,260 | 139 |
| | Daekyo Co. Ltd. Prior Pfd. | 33,110 | 136 |
| | KISCO Holdings Co. Ltd. | 3,539 | 134 |
| | GIIR Inc. | 13,820 | 133 |
| | Chosun Refractories Co. Ltd. | 2,253 | 132 |
| | Korea Development Financing Corp. | 7,700 | 132 |
| | Kolon Industries Inc. Prior Pfd. | 6,070 | 129 |
| | YESCO Co. Ltd. | 5,690 | 129 |
| * | People & Telecommunication Inc. | 21,092 | 128 |
| * | Nexcon Technology Co. Ltd. | 22,023 | 128 |
| | Jinro Distillers Co. Ltd. | 11,449 | 127 |
| | Golden Bridge Investment & Securities Co. Ltd. | 62,330 | 124 |
| | Samwhan Corp. | 16,940 | 124 |
| | Dongwon F&B Co. Ltd. | 2,948 | 123 |
| | Thinkware Systems Corp. | 12,764 | 123 |
| * | Lotte Tour Development Co. Ltd. | 6,990 | 122 |
| | Iljin Holdings Co. Ltd. | 37,000 | 122 |
| * | Yonghyun BM Co. Ltd. | 15,175 | 114 |
| | Kyungdong Pharm Co. Ltd. | 13,444 | 112 |
| | Tae Kyung Industrial Co. Ltd. | 26,220 | 110 |
| | Woojin Inc. | 7,390 | 109 |
| | YBM Sisa.com Inc. | 14,186 | 102 |
| * | Unison Co. Ltd. | 31,618 | 95 |
| * | Taesan LCD Co. Ltd. | 48,262 | 92 |
| | Kumho Investment Bank | 155,930 | 91 |
| | Daesung Industrial Co. Ltd. | 3,091 | 90 |
| * | KMW Co. Ltd. | 18,558 | 90 |
| * | Dongwha Holdings Co. Ltd. | 12,366 | 89 |
| | YuHwa Securities Co. Ltd. | 6,100 | 85 |
80
| | | |
| Vanguard® Total International Stock Index Fund | | |
| Schedule of Investments | | |
| April 30, 2011 | | |
| |
| | | | Market |
| | | | Value |
| | | Shares | ($000) |
| * | Namkwang Engr & Construction | 55,490 | 82 |
| | Handok Pharmaceuticals Co. Ltd. | 6,850 | 82 |
| | Pulmuone Holdings Co. Ltd. | 2,190 | 80 |
| * | Sungshin Cement Co. Ltd. | 28,620 | 80 |
| | JS Cable Co. Ltd. | 7,590 | 64 |
| * | Hanbit Soft Inc. | 24,735 | 61 |
| * | CT&T Co. Ltd. | 518,647 | 59 |
| * | Mysco | 15,382 | 58 |
| * | Pyeong San Co. Ltd. | 29,623 | 23 |
| | | | 2,110,847 |
| Spain (2.3%) | | |
| | Telefonica SA | 12,357,476 | 331,986 |
| | Banco Santander SA | 25,057,699 | 319,999 |
| | Banco Bilbao Vizcaya Argentaria SA | 12,837,873 | 164,447 |
| | Iberdrola SA | 11,387,445 | 105,602 |
| | Repsol YPF SA | 2,201,521 | 78,593 |
| | Inditex SA | 656,316 | 58,858 |
| | ACS Actividades de Construccion y Servicios SA | 424,768 | 21,372 |
| | Abertis Infraestructuras SA | 889,104 | 21,063 |
| | Red Electrica Corp. SA | 326,151 | 20,781 |
| | Gas Natural SDG SA | 972,403 | 19,995 |
| | Criteria Caixacorp SA | 2,531,035 | 18,670 |
| | Ferrovial SA | 1,329,595 | 18,332 |
| | Banco Popular Espanol SA | 2,677,635 | 16,040 |
| | Banco de Sabadell SA | 3,358,887 | 14,876 |
| | Enagas SA | 539,220 | 13,332 |
| * | Amadeus IT Holding SA | 609,376 | 12,771 |
| | Iberdrola Renovables SA | 2,561,571 | 11,723 |
| | Mapfre SA | 2,262,495 | 9,443 |
| | Acciona SA | 75,707 | 8,807 |
| | Grifols SA | 413,846 | 8,192 |
| | Zardoya Otis SA | 416,844 | 7,096 |
| ^ | Bolsas y Mercados Espanoles SA | 189,672 | 6,421 |
| | Bankinter SA | 855,576 | 6,382 |
| | Ebro Foods SA | 256,450 | 6,327 |
| | Indra Sistemas SA | 274,681 | 6,230 |
| * | International Consolidated Airlines Group SA | 1,549,719 | 6,179 |
| | Acerinox SA | 300,320 | 6,033 |
| | Viscofan SA | 134,771 | 5,941 |
| * | Gestevision Telecinco SA | 505,489 | 5,682 |
| | Obrascon Huarte Lain SA | 137,078 | 5,616 |
| * | Gamesa Corp. Tecnologica SA | 595,970 | 5,600 |
| *,^ | Sacyr Vallehermoso SA | 437,510 | 5,525 |
| ^ | Fomento de Construcciones y Contratas SA | 156,424 | 5,314 |
| * | International Consolidated Airlines Group SA | 1,289,783 | 5,132 |
| | Tecnicas Reunidas SA | 77,234 | 4,851 |
| ^ | Abengoa SA | 125,612 | 4,188 |
| | Prosegur Cia de Seguridad SA | 63,456 | 3,874 |
| * | Jazztel plc | 610,643 | 3,734 |
| | Grupo Catalana Occidente SA | 129,352 | 3,391 |
| | Construcciones y Auxiliar de Ferrocarriles SA | 5,066 | 3,087 |
| | Corp Financiera Alba | 43,729 | 2,695 |
| *,^ | Banco de Valencia SA | 646,706 | 2,615 |
| | Faes Farma SA | 594,559 | 2,391 |
| *,^ | Promotora de Informaciones SA | 827,955 | 2,342 |
| ^ | Sol Melia SA | 175,277 | 2,285 |
| ^ | Antena 3 de Television SA | 231,314 | 2,144 |
| *,^ | Zeltia SA | 480,577 | 2,003 |
| *,^ | NH Hoteles SA | 211,398 | 1,784 |
| | Banco Pastor SA | 342,142 | 1,652 |
| | Almirall SA | 141,938 | 1,617 |
| | Duro Felguera SA | 182,302 | 1,549 |
| * | Grupo Empresarial Ence SA | 330,724 | 1,384 |
| | Cementos Portland Valderrivas SA | 48,771 | 1,112 |
81
| | | |
| Vanguard® Total International Stock Index Fund | | |
| Schedule of Investments | | |
| April 30, 2011 | | |
| |
| | | | Market |
| | | | Value |
| | | Shares | ($000) |
| * | Tubacex SA | 246,974 | 1,058 |
| | Caja de Ahorros del Mediterraneo | 142,865 | 1,026 |
| * | Tubos Reunidos SA | 299,914 | 990 |
| ^ | Pescanova SA | 19,468 | 810 |
| * | Codere SA | 47,247 | 765 |
| * | SOS Corp. Alimentaria SA | 680,105 | 645 |
| * | Baron de Ley | 8,627 | 619 |
| * | Vueling Airlines SA | 42,865 | 603 |
| | Campofrio Food Group SA | 43,811 | 598 |
| | Miquel y Costas & Miquel SA | 17,425 | 582 |
| | Papeles y Cartones de Europa SA | 86,651 | 531 |
| * | Ercros SA | 277,646 | 425 |
| * | Grupo Ezentis SA | 638,767 | 423 |
| * | Solaria Energia y Medio Ambiente SA | 119,828 | 397 |
| *,^ | Laboratorios Farmaceuticos Rovi SA | 50,167 | 386 |
| * | Amper SA | 62,540 | 375 |
| * | Dinamia Capital Privado Sociedad de Capital Riesgo SA | 29,671 | 360 |
| *,^ | Sociedad Nacional de Industrias Apicaciones Celulosa Espanola SA | 148,622 | 360 |
| | Fersa Energias Renovables SA | 183,326 | 352 |
| * | Quabit Inmobiliaria SA | 781,277 | 193 |
| * | Natraceutical SA | 245,206 | 125 |
| *,^ | Banco de Valencia SA Rights Exp. 05/09/2011 | 646,788 | 51 |
| * | Banco Pastor SA Rights Exp. 05/12/2011 | 342,142 | 36 |
| | | | 1,418,768 |
| Sweden (2.3%) | | |
| ^ | Telefonaktiebolaget LM Ericsson Class B | 9,063,195 | 137,521 |
| ^ | Hennes & Mauritz AB Class B | 3,074,195 | 108,649 |
| | Nordea Bank AB | 7,900,991 | 90,083 |
| | Volvo AB Class B | 4,144,136 | 81,442 |
| ^ | Sandvik AB | 3,031,688 | 64,271 |
| ^ | Atlas Copco AB Class A | 2,020,460 | 59,341 |
| | TeliaSonera AB | 6,745,416 | 55,049 |
| | Svenska Handelsbanken AB Class A | 1,473,680 | 51,106 |
| | Skandinaviska Enskilda Banken AB Class A | 4,245,262 | 40,809 |
| | Swedbank AB Class A | 2,150,486 | 40,785 |
| ^ | SKF AB | 1,172,436 | 37,017 |
| ^ | Investor AB Class B | 1,370,728 | 34,141 |
| ^ | Atlas Copco AB Class B | 1,170,620 | 31,027 |
| *,^ | Assa Abloy AB Class B | 938,914 | 28,205 |
| ^ | Svenska Cellulosa AB Class B | 1,728,084 | 26,492 |
| | Skanska AB Class B | 1,204,610 | 25,897 |
| ^ | Scania AB Class B | 959,374 | 24,925 |
| | Millicom International Cellular SA | 229,750 | 24,923 |
| ^ | Swedish Match AB | 695,968 | 24,701 |
| ^ | Tele2 AB | 951,677 | 23,899 |
| ^ | Alfa Laval AB | 1,013,405 | 22,686 |
| ^ | Hexagon AB Class B | 764,450 | 19,862 |
| ^ | Boliden AB | 827,878 | 18,673 |
| | Electrolux AB Class B | 723,228 | 18,405 |
| ^ | Kinnevik Investment AB Class B | 650,024 | 16,784 |
| ^ | Getinge AB | 599,663 | 15,954 |
| | Ratos AB | 306,580 | 12,671 |
| ^ | Securitas AB Class B | 943,412 | 11,824 |
| | Elekta AB Class B | 258,470 | 11,796 |
| ^ | Modern Times Group AB Class B | 153,066 | 11,742 |
| | Lundin Petroleum AB | 664,485 | 10,085 |
| ^ | Husqvarna AB | 1,276,108 | 10,040 |
| | SSAB AB Class A | 539,087 | 9,634 |
| ^ | Trelleborg AB Class B | 693,394 | 8,391 |
| | Castellum AB | 465,540 | 7,217 |
| ^ | JM AB | 251,504 | 7,181 |
| ^ | Industrivarden AB | 357,416 | 7,133 |
| | Oriflame Cosmetics SA | 123,834 | 6,990 |
| ^ | Meda AB Class A | 642,279 | 6,804 |
82
| | | |
| Vanguard® Total International Stock Index Fund | | |
| Schedule of Investments | | |
| April 30, 2011 | | |
| |
| | | | Market |
| | | | Value |
| | | Shares | ($000) |
| | NCC AB Class B | 234,103 | 6,260 |
| | Holmen AB | 157,846 | 5,825 |
| *,^ | Alliance Oil Co. Ltd. | 261,928 | 5,193 |
| ^ | Lundbergforetagen AB Class B | 63,907 | 5,057 |
| | Kungsleden AB | 421,281 | 4,445 |
| ^ | Peab AB | 480,078 | 4,443 |
| | Fabege AB | 378,132 | 4,342 |
| | Hufvudstaden AB Class A | 333,262 | 4,275 |
| | Saab AB Class B | 182,321 | 4,119 |
| * | Nobia AB | 444,382 | 3,545 |
| ^ | Billerud AB | 268,308 | 3,265 |
| *,^ | Nibe Industrier AB Class B | 190,312 | 3,246 |
| | Intrum Justitia AB | 208,661 | 3,162 |
| ^ | Hoganas AB Class B | 74,067 | 3,076 |
| ^ | Wallenstam AB | 94,153 | 3,069 |
| | Axis Communications AB | 118,192 | 3,013 |
| ^ | Loomis AB Class B | 183,819 | 2,919 |
| ^ | Hakon Invest AB | 157,941 | 2,785 |
| ^ | AarhusKarlshamn AB | 83,521 | 2,737 |
| ^ | Wihlborgs Fastigheter AB | 90,614 | 2,729 |
| | Axfood AB | 69,580 | 2,556 |
| * | Lindab International AB | 175,745 | 2,346 |
| ^ | Mekonomen AB | 58,336 | 2,251 |
| * | Haldex AB | 126,491 | 2,231 |
| | Betsson AB | 92,214 | 2,077 |
| ^ | Niscayah Group AB | 969,590 | 1,990 |
| *,^ | AF AB | 88,256 | 1,964 |
| ^ | Indutrade AB | 55,484 | 1,960 |
| | Oresund Investment AB | 106,810 | 1,952 |
| ^ | Avanza Bank Holding AB | 51,558 | 1,886 |
| * | Hexpol AB | 72,273 | 1,872 |
| *,^ | Active Biotech AB | 112,603 | 1,846 |
| * | Rezidor Hotel Group AB | 250,313 | 1,806 |
| ^ | Clas Ohlson AB | 111,641 | 1,802 |
| *,^ | SAS AB | 527,429 | 1,755 |
| *,^ | Medivir AB Class B | 67,408 | 1,566 |
| ^ | Klovern AB | 261,989 | 1,422 |
| | B&B Tools AB | 74,244 | 1,413 |
| * | Vostok Nafta Investment Ltd. | 207,009 | 1,371 |
| * | Black Earth Farming Ltd. | 286,012 | 1,276 |
| *,^ | Swedish Orphan Biovitrum AB | 302,196 | 1,256 |
| | Bure Equity AB | 217,941 | 1,237 |
| *,^ | PA Resources AB | 1,634,221 | 1,204 |
| ^ | Bilia AB | 46,183 | 1,187 |
| ^ | East Capital Explorer AB | 84,770 | 1,126 |
| * | Diamyd Medical AB Class B | 54,452 | 1,125 |
| | Industrial & Financial Systems Class B | 53,857 | 1,105 |
| *,^ | Eniro AB | 285,362 | 1,080 |
| *,^ | New Wave Group AB Class B | 130,825 | 1,077 |
| ^ | KappAhl AB | 181,687 | 1,077 |
| * | EOS Russia AB | 161,932 | 1,073 |
| ^ | Duni AB | 94,003 | 1,044 |
| ^ | Gunnebo AB | 140,883 | 999 |
| | SkiStar AB | 57,564 | 990 |
| * | TradeDoubler AB | 122,495 | 983 |
| * | CDON Group AB | 145,428 | 934 |
| ^ | Byggmax Group AB | 95,154 | 914 |
| *,^ | ORC Software AB | 56,799 | 912 |
| *,^ | HIQ International AB | 133,262 | 900 |
| ^ | Proffice AB | 156,952 | 884 |
| * | BE Group AB | 107,597 | 802 |
| *,^ | BioGaia AB | 39,618 | 772 |
| ^ | Nordnet AB | 192,634 | 740 |
| ^ | Net Entertainment NE AB | 73,045 | 665 |
83
| | | |
| Vanguard® Total International Stock Index Fund | | |
| Schedule of Investments | | |
| April 30, 2011 | | |
| |
| | | | Market |
| | | | Value |
| | | Shares | ($000) |
| ^ | Nolato AB Class B | 53,881 | 649 |
| *,^ | Net Insight AB Class B | 1,045,242 | 639 |
| *,^ | BioInvent International AB | 126,807 | 570 |
| | Bjoern Borg AB | 50,510 | 495 |
| * | rnb Retail and Brands AB | 308,521 | 327 |
| | Transcom WorldWide SA Class B | 105,145 | 282 |
| | Bjoern Borg AB Exp. 05/16/11 | 101,020 | 43 |
| *,^ | Net Entertainment NE AB | 73,045 | 24 |
| | | | 1,386,117 |
| Switzerland (5.2%) | | |
| | Nestle SA | 10,424,259 | 647,017 |
| | Novartis AG | 6,348,113 | 376,444 |
| | Roche Holding AG | 2,113,621 | 343,083 |
| * | UBS AG | 10,948,514 | 219,108 |
| | ABB Ltd. | 6,592,456 | 182,053 |
| | Credit Suisse Group AG | 3,390,299 | 154,315 |
| | Zurich Financial Services AG | 438,302 | 123,241 |
| | Cie Financiere Richemont SA | 1,569,383 | 101,506 |
| | Syngenta AG | 284,811 | 100,725 |
| * | Transocean Ltd. | 958,546 | 70,874 |
| | Holcim Ltd. | 737,087 | 64,224 |
| | Swiss Reinsurance Co. Ltd. | 1,060,707 | 63,289 |
| | Swatch Group AG (Bearer) | 92,619 | 45,609 |
| | SGS SA | 16,489 | 32,764 |
| | Swisscom AG | 70,114 | 32,181 |
| 2 | Synthes Inc. | 178,581 | 30,777 |
| | Julius Baer Group Ltd. | 623,359 | 29,172 |
| | Givaudan SA | 24,998 | 27,815 |
| | Geberit AG | 117,202 | 27,422 |
| | Adecco SA | 370,001 | 26,442 |
| | Kuehne & Nagel International AG | 162,931 | 26,055 |
| | Schindler Holding AG (Bearer) | 147,050 | 19,032 |
| * | Actelion Ltd. | 307,784 | 18,135 |
| | Swiss Life Holding AG | 92,154 | 16,826 |
| * | Baloise Holding AG | 149,545 | 16,551 |
| * | Clariant AG | 763,575 | 15,852 |
| | Sika AG | 6,133 | 15,666 |
| | Sonova Holding AG | 138,379 | 13,981 |
| | Sulzer AG | 72,095 | 13,024 |
| * | Lindt & Spruengli AG | 336 | 12,512 |
| | Lonza Group AG | 143,353 | 12,328 |
| | GAM Holding AG | 624,061 | 12,300 |
| | Swatch Group AG (Registered) | 130,798 | 11,619 |
| | Swiss Prime Site AG | 129,971 | 10,842 |
| | Aryzta AG | 178,222 | 9,941 |
| ^ | Galenica AG | 14,618 | 9,653 |
| | PSP Swiss Property AG | 104,105 | 9,477 |
| * | Lindt & Spruengli AG | 2,670 | 8,851 |
| | Schindler Holding AG (Registered) | 64,766 | 8,341 |
| | Pargesa Holding SA | 80,739 | 8,304 |
| | Nobel Biocare Holding AG | 372,393 | 8,272 |
| | Partners Group Holding AG | 36,170 | 7,685 |
| *,^ | Logitech International SA | 553,841 | 7,681 |
| * | Georg Fischer AG | 11,690 | 7,643 |
| * | Helvetia Holding AG | 15,622 | 7,335 |
| * | Dufry Group | 53,020 | 6,936 |
| * | Temenos Group AG | 190,196 | 6,327 |
| | Straumann Holding AG | 23,691 | 6,198 |
| *,^ | Meyer Burger Technology AG | 117,089 | 5,858 |
| | Allreal Holding AG | 35,084 | 5,760 |
| * | Panalpina Welttransport Holding AG | 41,827 | 5,667 |
| | Banque Cantonale Vaudoise | 9,130 | 5,613 |
| | Barry Callebaut AG | 5,520 | 5,280 |
| | EMS-Chemie Holding AG | 24,964 | 5,155 |
84
| | | |
| Vanguard® Total International Stock Index Fund | | |
| Schedule of Investments | | |
| April 30, 2011 | | |
| |
| | | | Market |
| | | | Value |
| | | Shares | ($000) |
| | Bucher Industries AG | 20,940 | 5,108 |
| | Flughafen Zuerich AG | 11,257 | 4,960 |
| | Bank Sarasin & Cie AG Class B | 99,601 | 4,376 |
| | Petroplus Holdings AG | 289,441 | 4,338 |
| | St. Galler Kantonalbank AG | 7,695 | 4,314 |
| * | Gategroup Holding AG | 80,155 | 4,296 |
| | Aryzta AG | 76,275 | 4,192 |
| * | Rieter Holding AG | 9,377 | 4,041 |
| | Kuoni Reisen Holding AG | 8,393 | 3,862 |
| | Mobimo Holding AG | 14,496 | 3,509 |
| | Kaba Holding AG Class B | 7,832 | 3,497 |
| * | Forbo Holding AG | 3,986 | 3,262 |
| | Liechtensteinische Landesbank AG | 36,704 | 3,226 |
| | Vontobel Holding AG | 76,579 | 3,122 |
| * | OC Oerlikon Corp. AG | 349,741 | 3,073 |
| | Basler Kantonalbank | 17,329 | 2,845 |
| | Valora Holding AG | 8,251 | 2,817 |
| | Tecan Group AG | 31,993 | 2,666 |
| | Burckhardt Compression Holding AG | 8,011 | 2,575 |
| | EFG International AG | 160,307 | 2,394 |
| | Zehnder Group AG | 749 | 2,364 |
| * | Charles Voegele Holding AG | 26,435 | 2,112 |
| * | Basilea Pharmaceutica | 25,493 | 2,044 |
| | Schweiter Technologies AG | 2,269 | 1,786 |
| | Kudelski SA | 95,538 | 1,752 |
| * | AFG Arbonia-Forster Hldg | 41,703 | 1,723 |
| * | Austriamicrosystems AG | 29,915 | 1,699 |
| * | Schweizerische National-Versicherungs-Gesellschaft AG | 39,357 | 1,692 |
| | Swissquote Group Holding SA | 25,096 | 1,610 |
| | Orascom Development Holding AG | 36,164 | 1,540 |
| | Phoenix Mecano AG | 1,841 | 1,523 |
| | Vetropack Holding AG | 674 | 1,476 |
| | Verwaltungs- und Privat-Bank AG | 10,674 | 1,412 |
| * | Bobst Group AG | 26,778 | 1,298 |
| | Ascom Holding AG | 77,224 | 1,254 |
| | Schulthess Group | 17,814 | 1,179 |
| * | Inficon Holding AG | 4,773 | 1,126 |
| *,^ | Schmolz & Bickenbach AG | 92,969 | 1,106 |
| * | Komax Holding AG | 8,477 | 1,057 |
| | Mobilezone Holding AG | 87,246 | 1,049 |
| | Cie Financiere Tradition SA | 7,029 | 982 |
| ^ | Von Roll Holding AG | 185,563 | 966 |
| * | PubliGroupe AG | 5,282 | 930 |
| * | Gurit Holding AG | 1,144 | 893 |
| * | U-Blox AG | 15,023 | 859 |
| | Intershop Holdings | 2,410 | 855 |
| | Acino Holding AG | 8,673 | 834 |
| * | Micronas Semiconductor Holding AG | 84,918 | 812 |
| | Bachem Holding AG | 13,642 | 811 |
| | Swisslog Holding AG | 719,040 | 732 |
| | Coltene Holding AG | 9,236 | 567 |
| | Walter Meier AG | 1,910 | 524 |
| * | Zueblin Immobilien Holding AG | 111,387 | 502 |
| * | Kardex AG | 12,917 | 376 |
| * | Advanced Digital Broadcast Holdings SA | 11,333 | 327 |
| | LifeWatch AG | 26,438 | 235 |
| * | Gottex Fund Management Holdings Ltd. | 29,936 | 224 |
| * | Valartis Group AG | 5,714 | 137 |
| | | | 3,173,602 |
| Taiwan (2.9%) | | |
| | Taiwan Semiconductor Manufacturing Co. Ltd. | 54,739,063 | 141,582 |
| | Hon Hai Precision Industry Co. Ltd. | 26,159,191 | 99,340 |
| | HTC Corp. | 2,091,040 | 95,177 |
| | Taiwan Semiconductor Manufacturing Co. Ltd. ADR | 3,859,618 | 52,105 |
85
| | | |
| Vanguard® Total International Stock Index Fund | | |
| Schedule of Investments | | |
| April 30, 2011 | | |
| |
| | | | Market |
| | | | Value |
| | | Shares | ($000) |
| | Formosa Plastics Corp. | 11,968,780 | 49,014 |
| | Nan Ya Plastics Corp. | 14,187,780 | 43,579 |
| | China Steel Corp. | 30,545,081 | 37,825 |
| | Formosa Chemicals & Fibre Corp. | 8,558,500 | 34,609 |
| | Cathay Financial Holding Co. Ltd. | 19,826,100 | 33,149 |
| | MediaTek Inc. | 2,822,174 | 31,250 |
| | Chunghwa Telecom Co. Ltd. | 8,216,456 | 26,138 |
| | Chinatrust Financial Holding Co. Ltd. | 27,128,159 | 24,924 |
| | Delta Electronics Inc. | 5,396,240 | 24,155 |
| | Fubon Financial Holding Co. Ltd. | 15,398,610 | 22,620 |
| | Mega Financial Holding Co. Ltd. | 23,268,000 | 20,329 |
| | Uni-President Enterprises Corp. | 10,916,892 | 15,735 |
| | Asustek Computer Inc. | 1,710,040 | 15,438 |
| | Quanta Computer Inc. | 7,519,950 | 14,842 |
| * | Chimei Innolux Corp. | 14,358,101 | 14,780 |
| | Acer Inc. | 7,740,297 | 14,521 |
| | Compal Electronics Inc. | 12,747,689 | 14,479 |
| | Taiwan Mobile Co. Ltd. | 5,594,000 | 14,446 |
| | Taiwan Cement Corp. | 9,804,700 | 14,405 |
| | First Financial Holding Co. Ltd. | 14,633,630 | 13,577 |
| | Far Eastern New Century Corp. | 8,573,627 | 13,498 |
| | United Microelectronics Corp. | 25,733,175 | 13,431 |
| * | AU Optronics Corp. | 16,177,640 | 13,040 |
| | Yuanta Financial Holding Co. Ltd. | 18,255,000 | 12,705 |
| | Formosa Petrochemical Corp. | 3,459,950 | 12,171 |
| | Advanced Semiconductor Engineering Inc. | 10,293,556 | 12,056 |
| | China Development Financial Holding Corp. | 27,373,901 | 11,486 |
| | Chunghwa Telecom Co. Ltd. ADR | 324,671 | 10,243 |
| | Wistron Corp. | 5,673,293 | 10,224 |
| | Foxconn Technology Co. Ltd. | 2,031,913 | 9,743 |
| | Chang Hwa Commercial Bank | 11,146,000 | 9,741 |
| | Hua Nan Financial Holdings Co. Ltd. | 12,060,997 | 9,658 |
| | Catcher Technology Co. Ltd. | 1,510,800 | 9,508 |
| | Synnex Technology International Corp. | 3,666,463 | 9,373 |
| | Taiwan Cooperative Bank | 10,846,900 | 9,108 |
| | Largan Precision Co. Ltd. | 283,376 | 9,008 |
| | Cheng Shin Rubber Industry Co. Ltd. | 3,409,362 | 8,618 |
| | President Chain Store Corp. | 1,553,536 | 8,528 |
| * | MStar Semiconductor Inc. | 1,026,000 | 8,509 |
| | Siliconware Precision Industries Co. | 6,279,000 | 8,420 |
| * | TPK Holding Co. Ltd. | 272,000 | 8,143 |
| | SinoPac Financial Holdings Co. Ltd. | 16,922,000 | 8,041 |
| | Lite-On Technology Corp. | 6,148,442 | 7,796 |
| | Asia Cement Corp. | 5,544,915 | 7,434 |
| | Taiwan Fertilizer Co. Ltd. | 2,203,000 | 7,433 |
| * | Shin Kong Financial Holding Co. Ltd. | 16,769,297 | 7,362 |
| * | Taishin Financial Holding Co. Ltd. | 12,437,364 | 7,331 |
| | Far EasTone Telecommunications Co. Ltd. | 4,765,000 | 7,229 |
| | E.Sun Financial Holding Co. Ltd. | 9,737,432 | 6,909 |
| | Powertech Technology Inc. | 1,862,050 | 6,774 |
| | Macronix International | 10,051,927 | 6,609 |
| | United Microelectronics Corp. ADR | 2,295,148 | 6,518 |
| | Epistar Corp. | 1,902,408 | 6,325 |
| | Pou Chen Corp. | 6,629,517 | 6,264 |
| | Unimicron Technology Corp. | 3,718,750 | 6,135 |
| * | China Petrochemical Development Corp. | 4,903,000 | 6,119 |
| | WPG Holdings Ltd. | 3,264,801 | 6,048 |
| * | Wintek Corp. | 4,036,000 | 5,906 |
| * | Walsin Lihwa Corp. | 9,894,000 | 5,743 |
| | Tripod Technology Corp. | 1,145,760 | 5,429 |
| * | AU Optronics Corp. ADR | 639,016 | 5,176 |
| | Advanced Semiconductor Engineering Inc. ADR | 863,885 | 5,097 |
| | Yulon Motor Co. Ltd. | 2,410,015 | 5,023 |
| * | Hiwin Technologies Corp. | 494,000 | 4,933 |
86
| | | |
| Vanguard® Total International Stock Index Fund | | |
| Schedule of Investments | | |
| April 30, 2011 | | |
| |
| | | | Market |
| | | | Value |
| | | Shares | ($000) |
| * | E Ink Holdings Inc. | 2,324,000 | 4,747 |
| | Far Eastern Department Stores Co. Ltd. | 2,674,590 | 4,735 |
| * | Pegatron Corp. | 4,393,639 | 4,649 |
| * | China Airlines Ltd. | 7,099,491 | 4,545 |
| | Novatek Microelectronics Corp. | 1,467,275 | 4,497 |
| | Polaris Securities Co. Ltd. | 6,171,040 | 4,445 |
| | China Life Insurance Co. Ltd. | 3,688,388 | 4,320 |
| | Simplo Technology Co. Ltd. | 629,110 | 4,270 |
| | KGI Securities Co. Ltd. | 8,107,000 | 4,258 |
| * | Eva Airways Corp. | 4,586,900 | 4,229 |
| | TSRC Corp. | 1,346,000 | 4,026 |
| | Taiwan Glass Industrial Corp. | 2,449,526 | 4,005 |
| | Sino-American Silicon Products Inc. | 1,049,000 | 3,896 |
| | Giant Manufacturing Co. Ltd. | 918,319 | 3,674 |
| | Ruentex Industries Ltd. | 1,293,000 | 3,656 |
| | Siliconware Precision Industries Co. ADR | 537,175 | 3,642 |
| | Radiant Opto-Electronics Corp. | 1,194,000 | 3,617 |
| | LCY Chemical Corp. | 1,214,975 | 3,599 |
| * | Evergreen Marine Corp. Taiwan Ltd. | 3,822,000 | 3,542 |
| | Teco Electric and Machinery Co. Ltd. | 4,970,000 | 3,521 |
| * | Powerchip Technology Corp. | 16,224,460 | 3,511 |
| | Clevo Co. | 1,492,176 | 3,420 |
| | Yageo Corp. | 6,068,000 | 3,295 |
| * | Yang Ming Marine Transport Corp. | 3,790,776 | 3,215 |
| | Coretronic Corp. | 2,001,000 | 3,069 |
| | Inventec Co. Ltd. | 5,700,305 | 3,069 |
| * | Taiwan Business Bank | 7,450,320 | 3,033 |
| | Chroma ATE Inc. | 909,000 | 3,002 |
| | Kinsus Interconnect Technology Corp. | 841,000 | 2,938 |
| * | Inotera Memories Inc. | 5,768,002 | 2,901 |
| | Motech Industries Inc. | 765,827 | 2,894 |
| | Richtek Technology Corp. | 418,105 | 2,800 |
| | U-Ming Marine Transport Corp. | 1,263,000 | 2,739 |
| | Waterland Financial Holdings Co. Ltd. | 5,718,000 | 2,726 |
| * | Tatung Co. Ltd. | 5,287,058 | 2,654 |
| | Everlight Electronics Co. Ltd. | 922,497 | 2,641 |
| | Tung Ho Steel Enterprise Corp. | 2,229,842 | 2,640 |
| * | Qisda Corp. | 4,576,000 | 2,609 |
| | Formosa Taffeta Co. Ltd. | 2,397,000 | 2,599 |
| | Advantech Co. Ltd. | 782,659 | 2,597 |
| * | Winbond Electronics Corp. | 8,102,000 | 2,563 |
| | China Steel Chemical Corp. | 416,000 | 2,563 |
| | Highwealth Construction Corp. | 1,146,000 | 2,547 |
| * | Wan Hai Lines Ltd. | 3,316,500 | 2,541 |
| * | HannStar Display Corp. | 14,364,000 | 2,533 |
| | Realtek Semiconductor Corp. | 1,217,069 | 2,425 |
| | Ruentex Development Co. Ltd. | 1,442,000 | 2,405 |
| | Chicony Electronics Co. Ltd. | 1,204,599 | 2,376 |
| | Feng Hsin Iron & Steel Co. | 1,277,000 | 2,334 |
| | Gintech Energy Corp. | 807,000 | 2,300 |
| | Wistron NeWeb Corp. | 589,000 | 2,268 |
| | Nan Ya Printed Circuit Board Corp. | 691,320 | 2,263 |
| | Oriental Union Chemical Corp. | 1,523,000 | 2,239 |
| | USI Corp. | 1,666,000 | 2,234 |
| * | Nanya Technology Corp. | 4,358,419 | 2,214 |
| | Cheng Uei Precision Industry Co. Ltd. | 1,082,500 | 2,177 |
| | Eternal Chemical Co. Ltd. | 1,807,433 | 2,173 |
| * | Ritek Corp. | 7,468,000 | 2,131 |
| * | Chipbond Technology Corp. | 1,401,000 | 2,118 |
| | Farglory Land Development Co. Ltd. | 922,000 | 2,107 |
| | Phison Electronics Corp. | 388,510 | 2,097 |
| * | Nan Kang Rubber Tire Co. Ltd. | 1,314,000 | 2,087 |
| | Huaku Development Co. Ltd. | 701,000 | 2,061 |
| | Taiwan Hon Chuan Enterprise Co. Ltd. | 699,000 | 2,047 |
87
| | | |
| Vanguard® Total International Stock Index Fund | | |
| Schedule of Investments | | |
| April 30, 2011 | | |
| |
| | | | Market |
| | | | Value |
| | | Shares | ($000) |
| * | HannStar Touch Solution Inc. | 2,199,000 | 2,002 |
| | AmTRAN Technology Co. Ltd. | 2,240,000 | 1,992 |
| | Yungtay Engineering Co. Ltd. | 1,058,000 | 1,978 |
| | Young Fast Optoelectronics Co. Ltd. | 286,747 | 1,967 |
| | St. Shine Optical Co. Ltd. | 131,000 | 1,923 |
| * | G Tech Optoelectronics Corp. | 482,442 | 1,922 |
| * | King Yuan Electronics Co. Ltd. | 3,335,000 | 1,877 |
| * | Green Energy Technology Inc. | 457,000 | 1,872 |
| * | Ta Chong Bank Co. Ltd. | 4,586,000 | 1,846 |
| | Tainan Spinning Co. Ltd. | 2,745,000 | 1,845 |
| | Goldsun Development & Construction Co. Ltd. | 3,609,000 | 1,831 |
| * | CMC Magnetics Corp. | 7,485,000 | 1,823 |
| | Transcend Information Inc. | 612,363 | 1,802 |
| | CTCI Corp. | 1,417,000 | 1,793 |
| | Career Technology MFG. Co. Ltd. | 845,000 | 1,789 |
| * | Jih Sun Financial Holdings Co. Ltd. | 3,456,000 | 1,764 |
| | Solar Applied Materials Technology Co. | 722,000 | 1,749 |
| | Shinkong Synthetic Fibers Corp. | 3,741,000 | 1,735 |
| | China Motor Corp. | 1,822,000 | 1,727 |
| | Capital Securities Corp. | 3,514,764 | 1,714 |
| * | Chunghwa Picture Tubes | 12,693,351 | 1,707 |
| | D-Link Corp. | 1,788,000 | 1,707 |
| * | Compeq Manufacturing Co. | 2,919,000 | 1,694 |
| | Prince Housing & Development Corp. | 2,290,000 | 1,690 |
| | Kenda Rubber Industrial Co. Ltd. | 1,404,000 | 1,689 |
| | Taiwan Secom Co. Ltd. | 872,000 | 1,675 |
| | TXC Corp. | 849,000 | 1,669 |
| * | TTY Biopharm Co. Ltd. | 296,000 | 1,663 |
| | Grand Pacific Petrochemical | 2,385,000 | 1,634 |
| | Yuen Foong Yu Paper Manufacturing Co. Ltd. | 3,501,000 | 1,628 |
| | Zinwell Corp. | 929,000 | 1,628 |
| * | Chung Hung Steel Corp. | 2,706,000 | 1,615 |
| | Gigabyte Technology Co. Ltd. | 1,551,000 | 1,614 |
| | Far Eastern International Bank | 3,321,000 | 1,598 |
| * | Genesis Photonics Inc. | 479,000 | 1,591 |
| | Ability Enterprise Co. Ltd. | 1,054,000 | 1,589 |
| | Radium Life Tech Co. Ltd. | 1,241,000 | 1,576 |
| * | Taiwan Surface Mounting Technology Co. Ltd. | 613,000 | 1,570 |
| | Elan Microelectronics Corp. | 1,210,000 | 1,564 |
| * | King's Town Bank | 2,416,000 | 1,562 |
| | China Synthetic Rubber Corp. | 1,452,000 | 1,556 |
| | Micro-Star International Co. Ltd. | 2,972,000 | 1,548 |
| * | Neo Solar Power Corp. | 678,000 | 1,516 |
| * | China Manmade Fibers Corp. | 3,219,000 | 1,505 |
| | Formosa International Hotels Corp. | 80,310 | 1,497 |
| | President Securities Corp. | 2,237,000 | 1,488 |
| | Tong Yang Industry Co. Ltd. | 1,024,000 | 1,476 |
| | Ralink Technology Corp. | 458,000 | 1,464 |
| * | Taichung Commercial Bank | 3,481,000 | 1,461 |
| | BES Engineering Corp. | 4,263,000 | 1,460 |
| * | Via Technologies Inc. | 1,453,000 | 1,416 |
| | Mitac International Corp. | 3,314,995 | 1,403 |
| | Altek Corp. | 1,008,000 | 1,399 |
| | Greatek Electronics Inc. | 1,504,000 | 1,383 |
| * | Hey Song Corp. | 1,509,000 | 1,383 |
| | Pan-International Industrial | 1,081,000 | 1,375 |
| | Cheng Loong Corp. | 2,740,000 | 1,356 |
| | Ton Yi Industrial Corp. | 2,237,000 | 1,354 |
| | Shihlin Electric & Engineering Corp. | 1,043,000 | 1,313 |
| * | Wafer Works Corp. | 802,000 | 1,297 |
| | Unity Opto Technology Co. Ltd. | 770,000 | 1,286 |
| | Wei Chuan Food Corp. | 1,081,000 | 1,268 |
| | T JOIN Transportation Co. | 1,036,000 | 1,243 |
| | UPC Technology Corp. | 1,465,000 | 1,243 |
88
| | | |
| Vanguard® Total International Stock Index Fund | | |
| Schedule of Investments | | |
| April 30, 2011 | | |
| |
| | | | Market |
| | | | Value |
| | | Shares | ($000) |
| | Vanguard International Semiconductor Corp. | 2,392,000 | 1,231 |
| | Pixart Imaging Inc. | 313,719 | 1,230 |
| | Evergreen International Storage & Transport Corp. | 1,388,000 | 1,229 |
| | Ambassador Hotel | 740,000 | 1,227 |
| | Great Wall Enterprise Co. Ltd. | 986,000 | 1,226 |
| | Faraday Technology Corp. | 791,000 | 1,177 |
| * | Gigastorage Corp. | 720,997 | 1,173 |
| | Formosan Rubber Group Inc. | 1,148,000 | 1,168 |
| * | Pan Jit International Inc. | 906,000 | 1,167 |
| | Huang Hsiang Construction Co. | 420,000 | 1,150 |
| | ITEQ Corp. | 694,000 | 1,145 |
| | Solartech Energy Corp. | 454,000 | 1,143 |
| | Masterlink Securities Corp. | 2,534,000 | 1,135 |
| * | Asia Optical Co. Inc. | 585,000 | 1,128 |
| | Phihong Technology Co. Ltd. | 582,000 | 1,126 |
| * | Gloria Material Technology Corp. | 949,000 | 1,100 |
| | Dynapack International Technology Corp. | 331,000 | 1,093 |
| | Soft-World International Corp. | 272,000 | 1,089 |
| | Holy Stone Enterprise Co. Ltd. | 873,000 | 1,087 |
| | Chong Hong Construction Co. | 446,000 | 1,081 |
| * | Unizyx Holding Corp. | 1,202,000 | 1,077 |
| * | Cando Corp. | 1,310,675 | 1,067 |
| * | Sanyang Industry Co. Ltd. | 1,812,000 | 1,046 |
| | Tong Hsing Electronic Industries Ltd. | 244,000 | 1,043 |
| | Asia Polymer Corp. | 578,000 | 1,040 |
| | Visual Photonics Epitaxy Co. Ltd. | 398,000 | 1,034 |
| * | Genius Electronic Optical Co. Ltd. | 104,709 | 1,034 |
| | China Bills Finance Corp. | 2,678,000 | 1,025 |
| * | Forhouse Corp. | 1,086,000 | 1,020 |
| * | Kinpo Electronics | 3,115,000 | 1,019 |
| | Entire Technology Co. Ltd. | 275,636 | 1,017 |
| | MIN AIK Technology Co. Ltd. | 359,000 | 1,017 |
| | Formosa Epitaxy Inc. | 886,000 | 1,015 |
| * | Ho Tung Chemical Corp. | 1,430,000 | 1,006 |
| * | WT Microelectronics Co. Ltd. | 566,000 | 996 |
| | Lien Hwa Industrial Corp. | 1,280,000 | 983 |
| | Cathay Real Estate Development Co. Ltd. | 1,887,000 | 978 |
| | TA Chen Stainless Pipe | 1,354,000 | 968 |
| | Taiwan TEA Corp. | 1,538,000 | 967 |
| | Ardentec Corp. | 1,013,000 | 967 |
| * | Tong-Tai Machine & Tool Co. Ltd. | 569,000 | 966 |
| * | Youngtek Electronics Corp. | 264,000 | 961 |
| | Opto Technology Corp. | 1,395,000 | 960 |
| | Gemtek Technology Corp. | 739,000 | 951 |
| * | Microbio Co. Ltd. | 543,000 | 938 |
| | Yieh Phui Enterprise Co. Ltd. | 2,392,000 | 938 |
| | Merida Industry Co. Ltd. | 491,000 | 938 |
| | First Steamship Co. Ltd. | 385,000 | 935 |
| | Taiwan Paiho Ltd. | 748,000 | 932 |
| | Sincere Navigation | 809,000 | 932 |
| | Infortrend Technology Inc. | 711,000 | 920 |
| | Silicon Integrated Systems Corp. | 1,627,000 | 919 |
| | Elite Semiconductor Memory Technology Inc. | 595,000 | 916 |
| | ALI Corp. | 651,000 | 909 |
| * | CSBC Corp. Taiwan | 920,000 | 903 |
| * | YungShin Global Holding Corp. | 502,000 | 876 |
| * | J Touch Corp. | 253,087 | 868 |
| | Sonix Technology Co. Ltd. | 430,000 | 865 |
| | Wah Lee Industrial Corp. | 430,000 | 865 |
| | Makalot Industrial Co. Ltd. | 351,000 | 862 |
| | Lealea Enterprise Co. Ltd. | 1,455,000 | 848 |
| | Taiwan Life Insurance Co. Ltd. | 842,000 | 848 |
| * | Sunplus Technology Co. Ltd. | 1,268,000 | 831 |
| | Hung Sheng Construction Co. Ltd. | 1,394,000 | 825 |
89
| | | |
| Vanguard® Total International Stock Index Fund | | |
| Schedule of Investments | | |
| April 30, 2011 | | |
| |
| | | | Market |
| | | | Value |
| | | Shares | ($000) |
| * | Walsin Technology Corp. | 1,342,000 | 824 |
| | United Integrated Services Co. Ltd. | 538,000 | 822 |
| * | Taiflex Scientific Co. Ltd. | 372,760 | 819 |
| | Shin Zu Shing Co. Ltd. | 336,000 | 818 |
| | Global Mixed Mode Technology Inc. | 199,000 | 818 |
| | CyberTAN Technology Inc. | 802,000 | 813 |
| | ICP Electronics Inc. | 407,000 | 813 |
| * | Mosel Vitelic Inc. | 1,734,000 | 809 |
| * | Shihlin Paper Corp. | 367,000 | 800 |
| | Chin-Poon Industrial Co. | 962,000 | 799 |
| | Shinkong Textile Co. Ltd. | 557,000 | 776 |
| * | Union Bank Of Taiwan | 2,060,000 | 775 |
| | Everlight Chemical Industrial Corp. | 774,000 | 773 |
| | Silitech Technology Corp. | 304,000 | 769 |
| * | Sigurd Microelectronics Corp. | 808,000 | 763 |
| * | Powercom Co. Ltd. | 393,000 | 762 |
| | Cyberlink Corp. | 265,000 | 757 |
| | Accton Technology Corp. | 1,142,000 | 755 |
| | Avermedia Technologies | 579,000 | 755 |
| | Sinyi Realty Co. | 362,000 | 753 |
| * | Chung Hwa Pulp Corp. | 1,294,000 | 751 |
| * | Champion Building Materials Co. Ltd. | 871,000 | 750 |
| | Feng TAY Enterprise Co. Ltd. | 675,000 | 742 |
| | National Petroleum Co. Ltd. | 528,000 | 736 |
| | Taiwan Styrene Monomer | 1,479,000 | 735 |
| | Systex Corp. | 494,000 | 728 |
| | Nien Hsing Textile Co. Ltd. | 862,000 | 723 |
| | Chia Hsin Cement Corp. | 1,147,000 | 722 |
| * | FLEXium Interconnect Inc. | 310,000 | 722 |
| | Global Unichip Corp. | 228,000 | 722 |
| | International Games System Co. Ltd. | 149,000 | 722 |
| | Jess-Link Products Co. Ltd. | 348,000 | 718 |
| * | Newmax Technology Co. Ltd. | 157,370 | 716 |
| | A-DATA Technology Co. Ltd. | 487,000 | 715 |
| | Depo Auto Parts Ind Co. Ltd. | 283,000 | 713 |
| * | Kuoyang Construction Co. Ltd. | 898,000 | 712 |
| * | Lingsen Precision Industries Ltd. | 842,000 | 706 |
| | Hsin Kuang Steel Co. Ltd. | 623,000 | 705 |
| | Senao International Co. Ltd. | 214,000 | 703 |
| | Hung Poo Real Estate Development Corp. | 580,000 | 697 |
| * | Test Research Inc. | 353,000 | 692 |
| * | Pacific Hospital Supply Co. Ltd. | 152,000 | 683 |
| | Young Optics Inc. | 126,000 | 679 |
| | Universal Cement Corp. | 1,026,000 | 679 |
| * | Darfon Electronics Corp. | 527,000 | 673 |
| | King Slide Works Co. Ltd. | 130,000 | 673 |
| | Kinik Co. | 272,000 | 671 |
| * | Elite Material Co. Ltd. | 648,000 | 669 |
| * | Taiwan Sogo Shin Kong SEC | 763,000 | 669 |
| | Test-Rite International Co. | 835,000 | 669 |
| | Compal Communications Inc. | 781,000 | 668 |
| | Shih Wei Navigation Co. Ltd. | 490,000 | 666 |
| | Asia Vital Components Co. Ltd. | 596,344 | 666 |
| | Kindom Construction Co. | 839,000 | 663 |
| | AcBel Polytech Inc. | 864,000 | 661 |
| * | Excelsior Medical Co. Ltd. | 195,000 | 658 |
| * | Giga Solar Materials Corp. | 24,584 | 658 |
| | Holtek Semiconductor Inc. | 447,000 | 655 |
| | Yeun Chyang Industrial Co. Ltd. | 789,000 | 654 |
| * | Yem Chio Co. Ltd. | 637,000 | 651 |
| * | Sampo Corp. | 1,538,000 | 645 |
| * | China Chemical & Pharmaceutical Co. Ltd. | 686,000 | 643 |
| * | ITE Technology Inc. | 433,000 | 640 |
| | Chinese Gamer International Corp. | 109,000 | 633 |
90
| | | |
| Vanguard® Total International Stock Index Fund | | |
| Schedule of Investments | | |
| April 30, 2011 | | |
| |
| | | | Market |
| | | | Value |
| | | Shares | ($000) |
| | Etron Technology Inc. | 1,012,000 | 632 |
| * | E-Ton Solar Tech Co. Ltd. | 499,000 | 630 |
| | Tsann Kuen Enterprise Co. Ltd. | 285,000 | 630 |
| * | China Electric Manufacturing Corp. | 709,000 | 626 |
| * | Unitech Printed Circuit Board Corp. | 929,000 | 626 |
| * | Zig Sheng Industrial Co. Ltd. | 935,000 | 624 |
| | China Metal Products | 592,000 | 623 |
| * | Shining Building Business Co. Ltd. | 469,000 | 622 |
| * | PC Home Online | 96,000 | 621 |
| * | LES Enphants Co. Ltd. | 387,274 | 620 |
| * | Apex Biotechnology Corp. | 247,000 | 613 |
| * | ENG Electric Co. Ltd. | 165,000 | 612 |
| * | Episil Technologies Inc. | 850,000 | 610 |
| * | Tyntek Corp. | 828,000 | 610 |
| * | Pihsiang Machinery Manufacturing Co. Ltd. | 348,000 | 608 |
| | Elitegroup Computer Systems Co. Ltd. | 1,746,000 | 608 |
| | Advanced International Multitech Co. Ltd. | 281,000 | 607 |
| * | Edison Opto Corp. | 135,000 | 606 |
| | Taiwan Fire & Marine Insurance Co. | 650,000 | 606 |
| | Mercuries & Associates Ltd. | 740,000 | 604 |
| | Chung Hsin Electric & Machinery Manufacturing Corp. | 957,000 | 602 |
| | Taiwan Cogeneration Corp. | 865,000 | 601 |
| * | Rich Development Co. Ltd. | 1,074,000 | 597 |
| | Federal Corp. | 877,000 | 596 |
| * | Namchow Chemical Industrial Ltd. | 424,000 | 594 |
| * | WUS Printed Circuit Co. Ltd. | 935,000 | 588 |
| * | MPI Corp. | 161,000 | 586 |
| | Merry Electronics Co. Ltd. | 363,000 | 582 |
| | Springsoft Inc. | 486,000 | 574 |
| * | Sirtec International Co. Ltd. | 274,000 | 574 |
| | Globe Union Industrial Corp. | 514,000 | 573 |
| | Firich Enterprises Co. Ltd. | 364,000 | 573 |
| * | Taiwan Pulp & Paper Corp. | 930,000 | 561 |
| | Chun Yuan Steel | 1,017,000 | 557 |
| | Quanta Storage Inc. | 530,000 | 554 |
| * | Continental Holdings Corp. | 1,198,000 | 550 |
| * | Microelectronics Technology Inc. | 1,074,000 | 549 |
| * | Elite Advanced Laser Corp. | 169,000 | 549 |
| | Taiwan Semiconductor Co. Ltd. | 632,000 | 548 |
| | Alpha Networks Inc. | 683,000 | 546 |
| * | Gamania Digital Entertainment Co. Ltd. | 338,000 | 543 |
| * | Taiwan Sakura Corp. | 672,000 | 538 |
| * | AGV Products Corp. | 1,111,000 | 536 |
| * | KEE TAI Properties Co. Ltd. | 887,000 | 535 |
| * | Nantex Industry Co. Ltd. | 537,000 | 532 |
| | Topco Scientific Co. Ltd. | 353,000 | 527 |
| | Sunrex Technology Corp. | 533,000 | 525 |
| * | Fulltech Fiber Glass Corp. | 484,598 | 524 |
| * | Thye Ming Industrial Co. Ltd. | 384,000 | 524 |
| * | Weikeng Industrial Co. Ltd. | 534,000 | 521 |
| * | Aurora Corp. | 279,000 | 517 |
| | KYE Systems Corp. | 624,000 | 516 |
| * | Gold Circuit Electronics Ltd. | 1,163,000 | 515 |
| * | Taiwan PCB Techvest Co. Ltd. | 432,000 | 514 |
| * | Giantplus Technology Co. Ltd. | 753,000 | 513 |
| * | Phytohealth Corp. | 281,000 | 512 |
| * | Advanced Ceramic X Corp. | 114,000 | 511 |
| * | Insyde Software Corp. | 103,000 | 510 |
| * | Acme Electronics Corp. | 127,000 | 509 |
| * | Coxon Precise Industrial Co. Ltd. | 245,810 | 502 |
| * | Great China Metal Industry | 398,000 | 501 |
| * | Concord Securities Corp. | 1,474,000 | 499 |
| * | FSP Technology Inc. | 449,000 | 496 |
| | Sitronix Technology Corp. | 271,000 | 495 |
91
| | | |
| Vanguard® Total International Stock Index Fund | | |
| Schedule of Investments | | |
| April 30, 2011 | | |
| |
| | | | Market |
| | | | Value |
| | | Shares | ($000) |
| * | Jenn Feng New Energy Co. Ltd. | 306,000 | 494 |
| * | Eclat Textile Co. Ltd. | 318,000 | 492 |
| * | Eastern Media International Corp. | 2,027,000 | 492 |
| * | Li Peng Enterprise Co. Ltd. | 944,000 | 492 |
| * | I-Chiun Precision Industry Co. Ltd. | 502,000 | 490 |
| * | Lotes Co. Ltd. | 112,000 | 488 |
| * | Formosa Advanced Technologies Co. Ltd. | 378,000 | 487 |
| | Weltrend Semiconductor | 648,000 | 480 |
| * | Kenmec Mechanical Engineering Co. Ltd. | 511,000 | 479 |
| * | Great Taipei Gas Co. Ltd. | 744,000 | 477 |
| | Aten International Co. Ltd. | 244,000 | 473 |
| | HUA ENG Wire & Cable | 1,175,000 | 465 |
| * | Sesoda Corp. | 366,000 | 462 |
| * | Kinko Optical Co. Ltd. | 327,000 | 462 |
| * | Taisun Enterprise Co. Ltd. | 719,000 | 459 |
| * | Chinese Maritime Transport Ltd. | 219,000 | 458 |
| * | I-Sheng Electric Wire & Cable Co. Ltd. | 296,000 | 456 |
| | Huga Optotech Inc. | 473,425 | 455 |
| * | Flytech Technology Co. Ltd. | 153,000 | 455 |
| | Getac Technology Corp. | 893,000 | 454 |
| * | Adlink Technology Inc. | 223,000 | 454 |
| * | San Fang Chemical Industry Co. Ltd. | 357,000 | 454 |
| * | Actron Technology Corp. | 98,000 | 451 |
| * | Sinon Corp. | 923,000 | 448 |
| * | Yeh-Chiang Technology Corp. | 313,000 | 446 |
| | Syncmold Enterprise Corp. | 252,000 | 446 |
| | Star Comgistic Capital Co. Ltd. | 362,000 | 445 |
| | Ichia Technologies Inc. | 706,000 | 441 |
| * | Rechi Precision Co. Ltd. | 557,000 | 437 |
| * | Lumax International Corp. Ltd. | 191,000 | 437 |
| * | Ta Ya Electric Wire & Cable | 1,395,000 | 436 |
| | L&K Engineering Co. Ltd. | 354,000 | 435 |
| | Inventec Appliances Corp. | 538,000 | 434 |
| * | eMemory Technology Inc. | 162,225 | 433 |
| * | Lite-On Semiconductor Corp. | 703,000 | 433 |
| * | Tainan Enterprises Co. Ltd. | 292,000 | 431 |
| * | Sporton International Inc. | 160,000 | 430 |
| * | Advanced Wireless Semiconductor Co. | 241,000 | 430 |
| * | Taiwan Land Development Corp. | 817,000 | 430 |
| * | Taiwan Acceptance Corp. | 195,000 | 427 |
| * | Tekcore Co. Ltd. | 378,000 | 427 |
| * | Tatung Co. Ltd. GDR | 38,879 | 422 |
| | Long Chen Paper Co. Ltd. | 1,026,000 | 420 |
| | Shinkong Insurance Co. Ltd. | 497,000 | 417 |
| * | Grape King Industrial Co. | 259,000 | 415 |
| * | CyberPower Systems Inc. | 128,000 | 407 |
| * | Mirle Automation Corp. | 338,000 | 406 |
| * | Supreme Electronics Co. Ltd. | 421,000 | 404 |
| * | Chang Wah Electromaterials Inc. | 87,000 | 400 |
| * | Lextar Electronics Corp. | 276,710 | 398 |
| * | Taiyen Biotech Co. Ltd. | 444,000 | 397 |
| | China General Plastics Corp. | 747,000 | 396 |
| | AV Tech Corp. | 114,000 | 391 |
| * | Hu Lane Associate Inc. | 153,000 | 387 |
| * | ACES Electronic Co. Ltd. | 194,000 | 386 |
| * | Chien Kuo Construction Co. Ltd. | 668,000 | 385 |
| | GeoVision Inc. | 86,000 | 385 |
| * | SDI Corp. | 305,000 | 384 |
| * | Formosan Union Chemical | 587,000 | 380 |
| * | G Shank Enterprise Co. Ltd. | 492,000 | 379 |
| * | Wisdom Marine Lines Co. Ltd. | 251,150 | 378 |
| * | TA-I Technology Co. Ltd. | 339,000 | 375 |
| | Bright Led Electronics Corp. | 339,000 | 374 |
| * | Kaulin Manufacturing Co. Ltd. | 279,000 | 374 |
92
| | | |
| Vanguard® Total International Stock Index Fund | | |
| Schedule of Investments | | |
| April 30, 2011 | | |
| |
| | | | Market |
| | | | Value |
| | | Shares | ($000) |
| * | Wei Mon Industry Co. Ltd. | 553,000 | 373 |
| * | Froch Enterprise Co. Ltd. | 601,000 | 372 |
| * | Sanyo Electric Taiwan Co. Ltd. | 321,000 | 368 |
| * | Harvatek Corp. | 329,000 | 368 |
| * | Wellypower Optronics Corp. | 316,000 | 366 |
| * | ASROCK Inc. | 95,000 | 362 |
| | Long Bon International Co. Ltd. | 920,000 | 362 |
| * | First Hotel | 353,000 | 360 |
| * | Macroblock Inc. | 73,000 | 359 |
| * | Kwong Fong Industries | 822,000 | 355 |
| * | Leofoo Development Co. | 521,000 | 355 |
| * | Raydium Semiconductor Corp. | 75,311 | 353 |
| * | Shuttle Inc. | 605,000 | 352 |
| * | Sinbon Electronics Co. Ltd. | 424,000 | 350 |
| * | Ocean Plastics Co. Ltd. | 466,000 | 349 |
| * | Ways Technical Corp. Ltd. | 141,000 | 348 |
| * | Zeng Hsing Industrial Co. Ltd. | 90,000 | 346 |
| * | Bank of Kaohsiung | 703,000 | 344 |
| * | Tung Thih Electronic Co. Ltd. | 89,000 | 340 |
| * | Alcor Micro Corp. | 181,000 | 336 |
| * | Changs Ascending Enterprise Co. Ltd. | 52,261 | 333 |
| | Johnson Health Tech Co. Ltd. | 167,000 | 332 |
| * | Thinking Electronic Industrial Co. Ltd. | 204,000 | 331 |
| * | Super Dragon Technology Co. Ltd. | 200,000 | 331 |
| * | P-Two Industries Inc. | 270,000 | 328 |
| * | BenQ Materials Corp. | 367,000 | 326 |
| | Yung Chi Paint & Varnish Manufacturing Co. Ltd. | 199,000 | 324 |
| * | Janfusun Fancyworld Corp. | 926,000 | 323 |
| | Power Quotient International Co. Ltd. | 600,000 | 323 |
| | Basso Industry Corp. | 367,000 | 323 |
| * | Longwell Co. | 255,000 | 321 |
| * | E-LIFE MALL Corp. | 185,000 | 321 |
| * | Wah Hong Industrial Corp. | 126,000 | 318 |
| | Hannstar Board Corp. | 526,000 | 318 |
| | King's Town Construction Co. Ltd. | 304,000 | 315 |
| * | Hong TAI Electric Industrial | 652,000 | 313 |
| * | ShenMao Technology Inc. | 174,000 | 312 |
| * | Dynamic Electronics Co. Ltd. | 468,000 | 312 |
| * | San Chih Semiconductor Co. | 79,000 | 311 |
| * | Tah Hsin Industrial Co. Ltd. | 322,000 | 310 |
| * | Userjoy Technology Co. Ltd. | 57,000 | 308 |
| * | AVY Precision Technology Inc. | 92,000 | 301 |
| * | Orise Technology Co. Ltd. | 131,000 | 298 |
| * | China Hi-ment Corp. | 195,000 | 294 |
| * | Hold-Key Electric Wire & Cable Co. Ltd. | 435,000 | 294 |
| * | ProMOS Technologies Inc. | 5,975,000 | 293 |
| * | Orient Semiconductor Electronics Ltd. | 1,127,000 | 291 |
| * | Jentech Precision Industrial Co. Ltd. | 67,000 | 291 |
| * | APCB Inc. | 288,000 | 289 |
| * | Anpec Electronics Corp. | 276,000 | 285 |
| * | Capella Microsystems Taiwan Inc. | 55,000 | 284 |
| * | LAN FA Textile | 471,000 | 282 |
| * | Paragon Technologies Co. Ltd. | 159,000 | 282 |
| * | Sunonwealth Electric Machine Industry Co. Ltd. | 320,000 | 281 |
| * | Mayer Steel Pipe Corp. | 368,000 | 279 |
| * | Horizon Securities Co. Ltd. | 954,000 | 279 |
| * | Integrated Memory Logic Ltd. | 90,470 | 276 |
| * | Ablerex Electronics Co. Ltd. | 42,570 | 275 |
| * | Global Brands Manufacture Ltd. | 435,000 | 273 |
| * | Walton Advanced Engineering Inc. | 540,000 | 270 |
| * | Mag Layers Scientific-Technics Co. Ltd. | 107,000 | 265 |
| * | Leadtrend Technology Corp. | 75,000 | 265 |
| * | Topoint Technology Co. Ltd. | 260,000 | 263 |
| * | Abnova Corp. | 82,000 | 262 |
93
| | | |
| Vanguard® Total International Stock Index Fund | | |
| Schedule of Investments | | |
| April 30, 2011 | | |
| |
| | | | Market |
| | | | Value |
| | | Shares | ($000) |
| * | Topco Technologies Corp. | 84,000 | 261 |
| * | XinTec Inc. | 163,167 | 261 |
| * | Arcadyan Technology Corp. | 156,000 | 260 |
| * | DA CIN Construction Co. Ltd. | 387,000 | 260 |
| * | TYC Brother Industrial Co. Ltd. | 432,000 | 259 |
| * | Farglory F T Z Investment Holding Co. Ltd. | 223,000 | 258 |
| * | Shiny Chemical Industrial Co. Ltd. | 147,000 | 257 |
| * | Prosperity Dielectrics Co. Ltd. | 230,000 | 255 |
| * | Ve Wong Corp. | 310,000 | 252 |
| | O-TA Precision Industry Co. Ltd. | 234,000 | 251 |
| * | TaiDoc Technology Corp. | 107,440 | 251 |
| * | Channel Well Technology Co. Ltd. | 348,000 | 250 |
| * | Ta Chong Securities Co. Ltd. | 578,000 | 248 |
| * | Fortune Electric Co. Ltd. | 288,000 | 244 |
| * | Microlife Corp. | 135,000 | 241 |
| * | WAN HWA Enterprise Co. | 426,000 | 240 |
| * | Tang Eng Iron Works Co. Ltd. | 241,000 | 240 |
| * | China Glaze Co. Ltd. | 275,000 | 239 |
| * | ACHEM TECHNOLOGY Corp. | 358,000 | 239 |
| * | Astro Corp. | 101,000 | 236 |
| * | Meiloon Industrial Co. | 423,000 | 236 |
| | Taiwan Mask Corp. | 553,000 | 236 |
| * | Cosmos Bank Taiwan | 833,000 | 235 |
| * | Netronix Inc. | 114,000 | 229 |
| | Southeast Cement Co. Ltd. | 513,000 | 229 |
| | San Shing Fastech Corp. | 170,000 | 226 |
| * | Standard Chemical & Pharma | 194,000 | 219 |
| * | Portwell Inc. | 222,000 | 219 |
| * | HiTi Digital Inc. | 215,000 | 219 |
| | Sunspring Metal Corp. | 140,000 | 218 |
| | Sheng Yu Steel Co. Ltd. | 288,000 | 213 |
| * | ENE Technology Inc. | 164,000 | 209 |
| * | Well Shin Technology Co. Ltd. | 118,000 | 208 |
| * | DFI Inc. | 195,000 | 198 |
| * | Taiwan Chi Cheng Enterprise Co. Ltd. | 330,000 | 195 |
| * | Plotech Co. Ltd. | 257,000 | 188 |
| * | Solytech Enterprise Corp. | 313,000 | 188 |
| * | Hung Ching Development Co. | 285,000 | 176 |
| * | Yufo Electronics Co. Ltd. | 202,000 | 174 |
| * | Ta Yih Industrial Co. Ltd. | 73,000 | 170 |
| | Central Reinsurance Co. Ltd. | 269,000 | 167 |
| * | RDC Semiconductor Co. Ltd. | 121,000 | 164 |
| * | Sea Sonic Electronics Co. Ltd. | 96,000 | 163 |
| * | Zentel Electronic Corp. | 101,000 | 159 |
| * | ThaiLin Semiconductor Corp. | 308,000 | 159 |
| * | C-Media Electronics Inc. | 139,000 | 158 |
| * | Taiwan IC Packaging Corp. | 507,000 | 157 |
| * | Ruentex Engineering & Construction Co. | 119,000 | 156 |
| * | Cub Elecparts Inc. | 58,000 | 150 |
| * | Contrel Technology Co. Ltd. | 201,000 | 146 |
| * | EFUN Technologies Co. Ltd. | 98,000 | 144 |
| * | Tecom Co. Ltd. | 523,000 | 137 |
| * | China Life Insurance Rights EXP 05/12/2011 | 463,980 | 137 |
| * | Union Insurance Co. Ltd. | 201,000 | 124 |
| * | DelSolar Co. Ltd. | 59,842 | 113 |
| * | G Tech Optoelectronics Corp. Rights Expire 05/18/2011 | 67,892 | 104 |
| | Tatung Fine Chemical Co. | 34,202 | 72 |
| * | E-one Moli Energy Corp. | 65,355 | 61 |
| * | Kai Chieh International Investment Ltd. | 45,396 | 50 |
| * | Unitech Printed Circuit Board Corp. Rights Exp. 06/13/2011 | 165,248 | 25 |
| | | | 1,738,453 |
| Thailand (0.4%) | | |
| | PTT PCL (Foreign) | 2,366,115 | 29,780 |
| | PTT Exploration & Production PCL (Foreign) | 3,341,355 | 20,737 |
94
| | | |
| Vanguard® Total International Stock Index Fund | | |
| Schedule of Investments | | |
| April 30, 2011 | | |
| |
| | | | Market |
| | | | Value |
| | | Shares | ($000) |
| | Siam Commercial Bank PCL (Foreign) | 4,402,600 | 17,134 |
| | Kasikornbank PCL (Foreign) | 3,509,400 | 15,315 |
| | Bangkok Bank PCL (Foreign) | 2,544,600 | 14,523 |
| | Siam Cement PCL (Foreign) | 902,200 | 12,520 |
| | Banpu PCL | 396,440 | 9,922 |
| | CP ALL PCL (Foreign) | 6,247,285 | 9,064 |
| | Charoen Pokphand Foods PCL (Foreign) | 8,304,300 | 8,218 |
| | Bangkok Bank PCL (Local) | 1,434,300 | 8,179 |
| | Advanced Info Service PCL (Foreign) | 2,574,600 | 7,995 |
| | Kasikornbank PCL | 1,810,700 | 7,688 |
| | Indorama Ventures PCL | 4,205,648 | 7,519 |
| | Thai Oil PCL (Foreign) | 2,328,100 | 6,608 |
| | IRPC PCL (Foreign) | 28,064,000 | 5,839 |
| | Bank of Ayudhya PCL(Local) | 5,219,179 | 4,957 |
| | Krung Thai Bank PCL (Foreign) | 7,522,210 | 4,949 |
| | PTT Aromatics & Refining PCL (Foreign) | 3,141,600 | 4,352 |
| | PTT Chemical PCL (Foreign) | 769,295 | 4,140 |
| | BEC World PCL (Foreign) | 2,370,905 | 2,744 |
| | Banpu PCL (Local) | 106,100 | 2,657 |
| | Thai Airways International PCL | 2,020,500 | 2,595 |
| | PTT PCL | 202,100 | 2,544 |
| | Glow Energy PCL (Foreign) | 1,446,845 | 2,220 |
| | Thanachart Capital PCL | 2,033,000 | 2,079 |
| | PTT Chemical PCL | 323,585 | 1,741 |
| | Thai Union Frozen Products PCL | 1,052,800 | 1,635 |
| | Minor International PCL | 3,674,100 | 1,553 |
| | Siam Makro PCL | 276,000 | 1,531 |
| * | True Corp. PCL | 8,743,600 | 1,482 |
| | Tisco Financial Group PCL | 1,153,900 | 1,463 |
| | Jasmine International PCL | 10,483,800 | 1,351 |
| | Hana Microelectronics PCL | 1,537,600 | 1,274 |
| | Home Product Center PCL (Foreign) | 4,329,966 | 1,250 |
| | Esso Thailand PCL | 3,411,200 | 1,238 |
| | Robinson Department Store PCL | 1,291,200 | 1,233 |
| | Electricity Generating PCL | 376,100 | 1,195 |
| | Hemaraj Land and Development PCL | 14,648,000 | 1,139 |
| | Delta Electronics Thai PCL | 1,243,600 | 1,094 |
| | Pruksa Real Estate PCL | 1,581,600 | 1,083 |
| * | Sahaviriya Steel Industries PCL | 23,861,700 | 1,080 |
| | Sri Trang Agro-Industry PCL | 1,012,000 | 1,061 |
| | Bumrungrad Hospital PCL | 728,400 | 945 |
| * | Quality Houses PCL | 11,791,400 | 926 |
| | Kiatnakin Bank PCL | 835,500 | 924 |
| | PTT Exploration and Production PCL (Local) | 142,100 | 882 |
| | Thai Vegetable Oil PCL | 927,500 | 872 |
| | Supalai PCL | 2,122,600 | 854 |
| | Siam Commercial Bank PCL (Local) | 213,900 | 832 |
| | Amata Corp. PCL | 1,511,800 | 802 |
| | Charoen Pokphand Foods PCL | 808,400 | 800 |
| * | True Corp. PCL Rights Expire 6/3/11 | 7,563,214 | 785 |
| | Sino Thai Engineering & Construction PCL | 1,606,100 | 739 |
| * | Bangkokland PCL | 28,904,700 | 737 |
| | Dynasty Ceramic PCL | 409,700 | 722 |
| | Italian-Thai Development PCL | 4,838,300 | 717 |
| | Thoresen Thai Agencies PCL | 924,200 | 691 |
| | Bangkok Expressway PCL | 1,082,600 | 649 |
| | Thai Tap Water Supply PCL | 3,214,600 | 645 |
| | Major Cineplex Group PCL | 1,249,500 | 641 |
| | CP ALL PCL (Local) | 429,800 | 624 |
| | CalComp Electronics Thailand PCL | 5,517,600 | 622 |
| | Khon Kaen Sugar Industry PCL | 1,358,100 | 619 |
| | BEC World PCL | 520,400 | 602 |
| | LPN Development PCL | 1,648,200 | 591 |
| | BTS Group Holdings PCL | 23,170,200 | 591 |
95
| | | |
| Vanguard® Total International Stock Index Fund | | |
| Schedule of Investments | | |
| April 30, 2011 | | |
| |
| | | | Market |
| | | | Value |
| | | Shares | ($000) |
| * | Asian Property Development PCL | 2,686,200 | 568 |
| | Thai Plastic & Chemical PCL | 604,800 | 563 |
| | TPI Polene PCL | 1,309,800 | 554 |
| * | G Steel PCL | 23,002,700 | 549 |
| | Krung Thai Bank PCL | 831,300 | 547 |
| | Polyplex PCL | 694,000 | 543 |
| | Ticon Industrial Connection PCL | 1,076,100 | 498 |
| | Siamgas & Petrochemicals PCL | 775,400 | 489 |
| | Bangchak Petroleum PCL | 646,300 | 466 |
| | Bangkok Chain Hospital PCL | 1,727,800 | 428 |
| | Advanced Info Service PCL (Local) | 137,200 | 426 |
| | Precious Shipping PCL | 675,100 | 421 |
| | GFPT PCL | 912,500 | 337 |
| | CH Karnchang PCL | 1,141,100 | 329 |
| | Kim Eng Securities Thailand PCL | 645,800 | 325 |
| * | G J Steel PCL (Local) | 38,419,600 | 310 |
| | Thai Oil PCL | 108,200 | 307 |
| | IRPC PCL | 1,470,900 | 306 |
| | Sansiri PCL | 1,507,600 | 306 |
| * | Thaicom PCL | 1,213,000 | 303 |
| | Phatra Capital PCL | 265,800 | 301 |
| | MCOT PCL | 285,000 | 294 |
| | STP & I PCL | 302,800 | 274 |
| | Samart Corp. PCL | 810,500 | 260 |
| * | Tata Steel Thailand PCL | 5,109,900 | 253 |
| | PTT Aromatics & Refining PCL | 176,600 | 245 |
| | Thainox Stainless PCL | 5,406,300 | 243 |
| | Rojana Industrial Park PCL | 593,800 | 239 |
| | Indorama Ventures PCL | 123,900 | 222 |
| | Somboon Advance Technology PCL | 311,800 | 217 |
| | Central Plaza Hotel PCL | 1,040,400 | 211 |
| | Bank of Ayudhya PCL (Local) | 182,200 | 176 |
| * | Regional Container Lines PCL | 478,900 | 175 |
| * | Bangkok Metro PCL | 5,580,200 | 142 |
| * | Sahaviriya Steel Industries PCL | 2,752,860 | 125 |
| * | Glow Energy PCL | 11,900 | 18 |
| | | | 266,463 |
| Turkey (0.4%) | | |
| | Turkiye Garanti Bankasi AS | 6,322,619 | 32,746 |
| | Akbank TAS | 3,609,276 | 18,763 |
| | Turkiye Is Bankasi | 4,728,867 | 16,721 |
| | Turkcell Iletisim Hizmetleri AS | 2,315,759 | 13,698 |
| | Tupras Turkiye Petrol Rafinerileri AS | 379,438 | 12,346 |
| | KOC Holding AS | 1,842,346 | 9,905 |
| | Haci Omer Sabanci Holding AS (Bearer) | 1,840,773 | 9,854 |
| | Anadolu Efes Biracilik Ve Malt Sanayii AS | 610,298 | 9,371 |
| | BIM Birlesik Magazalar AS | 249,594 | 8,695 |
| | Turk Telekomunikasyon AS | 1,574,358 | 8,198 |
| * | Yapi ve Kredi Bankasi AS | 2,600,561 | 8,177 |
| | Turkiye Halk Bankasi AS | 935,350 | 8,108 |
| | Turkiye Vakiflar Bankasi Tao | 2,266,238 | 6,017 |
| * | Eregli Demir ve Celik Fabrikalari TAS | 1,635,433 | 4,980 |
| | Enka Insaat ve Sanayi AS | 849,234 | 3,715 |
| * | Turk Hava Yollari | 1,241,066 | 3,659 |
| | Arcelik AS | 633,629 | 3,592 |
| | Coca-Cola Icecek AS | 200,135 | 3,012 |
| | Asya Katilim Bankasi AS | 1,418,081 | 2,809 |
| | Koza Altin Isletmeleri AS | 145,521 | 2,283 |
| * | Dogan Sirketler Grubu Holdings | 2,721,451 | 2,160 |
| | Aygaz AS | 288,236 | 2,142 |
| * | Petkim Petrokimya Holding AS | 1,182,782 | 2,055 |
| * | Tekfen Holding AS | 419,168 | 1,798 |
| | Turkiye Sinai Kalkinma Bankasi AS | 807,010 | 1,547 |
| * | Trakya Cam Sanayi AS | 523,849 | 1,281 |
96
| | | |
| Vanguard® Total International Stock Index Fund | | |
| Schedule of Investments | | |
| April 30, 2011 | | |
| |
| | | | Market |
| | | | Value |
| | | Shares | ($000) |
| | Akmerkez Gayrimenkul Yatirim Ortakligi AS | 21,825 | 1,166 |
| | Yapi Kredi Sigorta AS | 88,720 | 1,116 |
| | Ulker Biskuvi Sanayi AS | 273,654 | 1,094 |
| * | Ihlas Holding AS | 871,243 | 1,057 |
| | Turk Traktor ve Ziraat Makineleri AS | 45,676 | 1,053 |
| * | Dogus Otomotiv Servis ve Ticaret AS | 263,527 | 1,040 |
| | Yazicilar Holding AS Class A | 117,091 | 1,037 |
| * | Kardemir Karabuk Demir Celik Sanayi ve Ticaret AS | 1,675,110 | 1,012 |
| * | Koza Anadolu Metal Madencilik Isletmeleri AS | 278,570 | 992 |
| | Albaraka Turk Katilim Bankasi AS | 586,379 | 987 |
| * | Akenerji Elektrik Uretim AS | 391,149 | 987 |
| | EIS Eczacibasi Ilac ve Sinai ve Finansal Yatirimlar Sanayi ve Ticaret AS | 569,066 | 973 |
| | Sekerbank TAS | 822,265 | 952 |
| | Aselsan Elektronik Sanayi Ve Ticaret AS | 149,802 | 885 |
| * | Dogan Yayin Holding AS | 729,292 | 867 |
| | Kartonsan Karton Sanayi ve Ticaret AS | 5,744 | 862 |
| | Cimsa Cimento Sanayi VE Tica | 127,595 | 861 |
| | Mardin Cimento Sanayii ve Ticaret AS | 156,365 | 828 |
| | Is Gayrimenkul Yatirim Ortakligi AS | 662,276 | 805 |
| | Hurriyet Gazetecilik AS | 605,721 | 789 |
| | Fenerbahce Sportif Hizmetleri Sanayi ve Ticaret AS | 10,363 | 700 |
| * | Sinpas Gayrimenkul Yatirim Ortakligi AS | 483,667 | 691 |
| | Akcansa Cimento AS | 132,255 | 684 |
| * | NET Holding AS | 656,754 | 660 |
| * | Gubre Fabrikalari TAS | 57,707 | 643 |
| * | Aksa Akrilik Kimya Sanayii | 230,087 | 630 |
| | Bagfas Bandirma Gubre Fabrik | 4,974 | 615 |
| * | Nortel Networks Netas Telekomunikasyon AS | 6,280 | 613 |
| * | Adana Cimento Sanayii TAS Class A | 158,417 | 593 |
| * | Selcuk Ecza Deposu Ticaret ve Sanayi A.S. | 343,259 | 590 |
| * | Anadolu Cam Sanayii AS | 239,219 | 580 |
| | Konya Cimento Sanayii AS | 2,693 | 567 |
| | Galatasaray Sportif Sinai ve Ticari Yatirimlar AS | 2,250 | 566 |
| | Anadolu Sigorta | 621,679 | 549 |
| * | Pinar SUT Mamulleri Sanayii AS | 49,721 | 536 |
| * | Park Elektrik Uretim Madencilik Sanayi ve Ticaret AS | 185,133 | 535 |
| | Turcas Petrol AS | 186,641 | 528 |
| | Anadolu Hayat Emeklilik AS | 138,182 | 509 |
| * | Aksigorta AS | 377,642 | 496 |
| * | Zorlu Enerji Elektrik Uretim AS | 272,592 | 485 |
| | Baticim Bati Anadolu Cimento Sanayii AS | 88,089 | 481 |
| * | Ipek Matbacilik Sanayi Ve Ticaret AS | 156,573 | 473 |
| | Goltas Goller Bolgesi Cimento Sanayi ve Ticaret A.S. | 7,955 | 461 |
| * | Deva Holding AS | 224,024 | 460 |
| | Alarko Holding AS | 185,256 | 457 |
| | Otokar Otomotiv Ve Savunma Sanayi A.S. | 23,210 | 441 |
| | Bursa Cimento Fabrikasi AS | 131,627 | 440 |
| * | Kardemir Karabuk Demir Celik Sanayi ve Ticaret AS Class A | 512,159 | 421 |
| * | Vestel Elektronik Sanayi ve Ticaret A.S. | 231,823 | 414 |
| * | Is Finansal Kiralama AS | 367,042 | 407 |
| | Eczacibasi Yatirim Holding Ortakligi AS | 87,076 | 401 |
| | Vestel Beyaz Esya Sanayi ve Ticaret AS | 183,899 | 392 |
| * | Izmir Demir Celik Sanayi AS | 103,655 | 391 |
| | Borusan Mannesmann Boru Sanayi ve Ticaret AS | 23,492 | 366 |
| * | TAT Konserve Sanayii AS | 131,544 | 336 |
| | Celebi Hava Servisi AS | 16,800 | 315 |
| * | Boyner Buyuk Magazacilik | 101,810 | 283 |
| * | Mondi Tire Kutsan Kagit Ve Ambalaj Sanayii AS | 246,827 | 282 |
| | Is Yatirim Menkul Degerler AS | 165,718 | 272 |
| | Bolu Cimento Sanayii AS | 197,964 | 247 |
| * | Kardemir Karabuk Demir Celik Sanayi ve Ticaret AS Class B | 254,237 | 234 |
| | Afyon Cimento Sanayi Tas | 1,990 | 229 |
| * | Besiktas Futbol Yatirimlari Sanayi ve Ticaret AS | 33,167 | 227 |
| | Banvit Bandirma Vitaminli Yem Sanayii ASA | 69,105 | 226 |
97
| | | |
| Vanguard® Total International Stock Index Fund | | |
| Schedule of Investments | | |
| April 30, 2011 | | |
| |
| | | | Market |
| | | | Value |
| | | Shares | ($000) |
| * | Tekstil Bankasi AS | 290,228 | 206 |
| * | Dogan Gazetecilik AS | 87,196 | 184 |
| * | Gunes Sigorta | 103,680 | 177 |
| | | | 237,988 |
| United Kingdom (14.5%) | | |
| | HSBC Holdings plc | 53,137,113 | 579,621 |
| | Vodafone Group plc | 156,843,203 | 453,408 |
| | BP plc | 56,462,841 | 434,051 |
| | GlaxoSmithKline plc | 15,608,643 | 340,975 |
| | Rio Tinto plc | 4,356,275 | 317,861 |
| | Royal Dutch Shell plc Class B | 8,099,535 | 315,114 |
| | Royal Dutch Shell plc Class A | 7,291,289 | 284,011 |
| | BHP Billiton plc | 6,615,068 | 279,689 |
| | British American Tobacco plc | 5,999,299 | 262,155 |
| | BG Group plc | 10,172,110 | 261,951 |
| | AstraZeneca plc | 4,248,882 | 210,823 |
| | Anglo American plc | 3,965,588 | 207,875 |
| | Standard Chartered plc | 7,045,762 | 195,817 |
| | Barclays plc | 34,770,341 | 165,301 |
| | Tesco plc | 24,124,620 | 162,648 |
| | Xstrata plc | 6,236,632 | 159,966 |
| | Diageo plc | 7,522,475 | 153,034 |
| | Royal Dutch Shell plc Class A | 3,361,631 | 129,858 |
| | Unilever plc | 3,855,123 | 125,241 |
| * | Lloyds Banking Group plc | 122,716,748 | 121,842 |
| | Imperial Tobacco Group plc | 3,058,403 | 107,879 |
| | National Grid plc | 10,496,375 | 107,695 |
| | SABMiller plc | 2,856,318 | 106,707 |
| | Reckitt Benckiser Group plc | 1,852,353 | 103,079 |
| | Prudential plc | 7,653,731 | 99,021 |
| | Centrica plc | 15,473,832 | 83,102 |
| | BT Group plc | 23,331,860 | 76,602 |
| | Tullow Oil plc | 2,666,108 | 63,969 |
| | Scottish & Southern Energy plc | 2,799,293 | 63,508 |
| | Aviva plc | 8,467,597 | 63,372 |
| | Rolls-Royce Group plc | 5,627,371 | 60,524 |
| | BAE Systems plc | 10,251,897 | 56,277 |
| | Compass Group plc | 5,667,031 | 55,455 |
| | Shire plc | 1,692,615 | 52,527 |
| | WPP plc | 3,703,704 | 48,513 |
| | British Sky Broadcasting Group plc | 3,420,694 | 48,171 |
| | Pearson plc | 2,445,240 | 46,866 |
| | ARM Holdings plc | 3,970,948 | 41,157 |
| | Experian plc | 3,029,907 | 40,888 |
| | Old Mutual plc | 16,401,449 | 38,234 |
| * | Royal Bank of Scotland Group plc | 52,408,297 | 36,527 |
| | Legal & General Group plc | 17,627,087 | 36,256 |
| | Kingfisher plc | 7,114,503 | 32,689 |
| | Reed Elsevier plc | 3,657,934 | 32,407 |
| * | Cairn Energy plc | 4,214,928 | 31,889 |
| | WM Morrison Supermarkets plc | 6,409,141 | 31,620 |
| | Wolseley plc | 856,429 | 31,109 |
| | Marks & Spencer Group plc | 4,747,130 | 30,843 |
| | Land Securities Group plc | 2,308,078 | 30,340 |
| | Smith & Nephew plc | 2,677,597 | 29,407 |
| | Burberry Group plc | 1,311,396 | 28,456 |
| | Antofagasta plc | 1,185,428 | 27,263 |
| | British Land Co. plc | 2,652,605 | 26,708 |
| | Smiths Group plc | 1,174,939 | 26,199 |
| | Standard Life plc | 6,884,537 | 26,089 |
| | International Power plc | 4,586,843 | 25,387 |
| | RSA Insurance Group plc | 10,455,940 | 24,096 |
| * | Randgold Resources Ltd. | 272,599 | 23,704 |
| | Aggreko plc | 781,365 | 23,377 |
98
| | | |
| Vanguard® Total International Stock Index Fund | | |
| Schedule of Investments | | |
| April 30, 2011 | | |
| |
| | | | Market |
| | | | Value |
| | | Shares | ($000) |
| | Capita Group plc | 1,835,542 | 22,593 |
| | Man Group plc | 5,380,946 | 22,519 |
| | Resolution Ltd. | 4,351,606 | 22,037 |
| | Carnival plc | 546,159 | 21,990 |
| | United Utilities Group plc | 2,044,210 | 21,602 |
| | Johnson Matthey plc | 644,155 | 21,578 |
| | J Sainsbury plc | 3,635,399 | 21,176 |
| | Next plc | 549,213 | 20,578 |
| | Weir Group plc | 634,618 | 20,441 |
| | AMEC plc | 993,562 | 19,946 |
| | Petrofac Ltd. | 780,060 | 19,721 |
| | G4S plc | 4,253,783 | 19,645 |
| | Intercontinental Hotels Group plc | 870,910 | 19,119 |
| | Sage Group plc | 3,963,758 | 18,916 |
| | Associated British Foods plc | 1,075,098 | 18,107 |
| | Severn Trent plc | 715,168 | 17,979 |
| * | Autonomy Corp. plc | 655,845 | 17,700 |
| | IMI plc | 963,073 | 17,625 |
| | GKN plc | 4,651,156 | 17,356 |
| | Admiral Group plc | 608,079 | 17,203 |
| | Rexam plc | 2,629,239 | 17,184 |
| | Intertek Group plc | 482,482 | 17,140 |
| | Hammerson plc | 2,124,088 | 16,699 |
| | Kazakhmys plc | 639,943 | 14,865 |
| | Fresnillo plc | 538,779 | 14,849 |
| | Whitbread plc | 528,108 | 14,847 |
| | ICAP plc | 1,682,948 | 14,604 |
| * | ITV plc | 11,044,230 | 14,065 |
| | Vedanta Resources plc | 358,329 | 13,993 |
| | Tate & Lyle plc | 1,406,943 | 13,983 |
| | Serco Group plc | 1,472,948 | 13,932 |
| | Meggitt plc | 2,313,042 | 13,917 |
| | Invensys plc | 2,426,896 | 13,819 |
| | 3i Group plc | 2,907,005 | 13,633 |
| | Inmarsat plc | 1,316,354 | 13,406 |
| | Lonmin plc | 484,221 | 13,265 |
| | Cobham plc | 3,470,104 | 13,255 |
| | John Wood Group plc | 1,120,303 | 12,999 |
| | Croda International plc | 410,680 | 12,904 |
| | Informa plc | 1,807,564 | 12,612 |
| | Travis Perkins plc | 692,547 | 12,474 |
| | Bunzl plc | 994,362 | 12,381 |
| | Segro plc | 2,224,455 | 12,107 |
| | Eurasian Natural Resources Corp. plc | 774,626 | 11,871 |
| * | Premier Oil plc | 353,060 | 11,867 |
| | Pennon Group plc | 1,071,896 | 11,841 |
| | Investec plc | 1,441,697 | 11,611 |
| | Babcock International Group plc | 1,080,016 | 11,569 |
| | Capital Shopping Centres Group plc | 1,689,997 | 11,485 |
| | Balfour Beatty plc | 2,064,011 | 11,325 |
| | Logica plc | 4,851,504 | 10,958 |
| | Mondi plc | 1,096,530 | 10,899 |
| | Schroders plc | 342,721 | 10,889 |
| | Amlin plc | 1,480,302 | 10,354 |
| * | Cookson Group plc | 827,364 | 9,926 |
| | Home Retail Group plc | 2,460,116 | 9,081 |
| | Northumbrian Water Group plc | 1,545,056 | 9,065 |
| | Melrose plc | 1,484,248 | 8,795 |
| | Michael Page International plc | 934,695 | 8,651 |
| * | Rentokil Initial plc | 5,451,343 | 8,612 |
| | Spectris plc | 344,532 | 8,538 |
| | Hays plc | 4,163,804 | 8,294 |
| | Derwent London plc | 271,887 | 8,157 |
| | Inchcape plc | 1,315,785 | 8,032 |
99
| | | |
| Vanguard® Total International Stock Index Fund | | |
| Schedule of Investments | | |
| April 30, 2011 | | |
| |
| | | | Market |
| | | | Value |
| | | Shares | ($000) |
| | Drax Group plc | 1,090,527 | 8,032 |
| | Carillion plc | 1,202,220 | 7,891 |
| | William Hill plc | 2,107,986 | 7,881 |
| | Aberdeen Asset Management plc | 2,050,833 | 7,876 |
| ^ | Henderson Group plc | 2,891,677 | 7,856 |
| *,^ | ASOS plc | 201,881 | 7,812 |
| | Firstgroup plc | 1,429,667 | 7,769 |
| | Spirax-Sarco Engineering plc | 230,657 | 7,755 |
| * | Afren plc | 2,893,897 | 7,752 |
| | IG Group Holdings plc | 970,432 | 7,592 |
| * | Essar Energy plc | 971,564 | 7,497 |
| | United Business Media Ltd. | 736,551 | 7,449 |
| | Rotork plc | 258,716 | 7,435 |
| | Hiscox Ltd. | 1,076,649 | 7,431 |
| | Thomas Cook Group plc | 2,578,021 | 7,397 |
| | Daily Mail & General Trust plc | 865,692 | 7,222 |
| | Petropavlovsk plc | 479,455 | 7,184 |
| | Halma plc | 1,144,061 | 7,145 |
| | Persimmon plc | 861,384 | 6,968 |
| | Hargreaves Lansdown plc | 642,824 | 6,926 |
| | Charter International plc | 503,296 | 6,918 |
| | Provident Financial plc | 407,131 | 6,863 |
| | Catlin Group Ltd. | 1,029,227 | 6,806 |
| | Stagecoach Group plc | 1,636,342 | 6,755 |
| | TUI Travel plc | 1,683,250 | 6,750 |
| * | Centamin Egypt Ltd. | 3,084,629 | 6,737 |
| * | Berkeley Group Holdings plc | 375,794 | 6,667 |
| | Great Portland Estates plc | 945,269 | 6,660 |
| | Ladbrokes plc | 2,611,384 | 6,658 |
| | Intermediate Capital Group plc | 1,192,715 | 6,596 |
| ^ | London Stock Exchange Group plc | 449,190 | 6,557 |
| | Homeserve plc | 801,766 | 6,551 |
| | Chemring Group plc | 582,443 | 6,533 |
| | Shaftesbury plc | 757,987 | 6,515 |
| | Cable & Wireless Worldwide plc | 8,086,206 | 6,507 |
| | Aegis Group plc | 2,705,096 | 6,339 |
| * | Taylor Wimpey plc | 9,658,147 | 6,312 |
| | Cable & Wireless Communications plc | 8,038,561 | 6,243 |
| | Electrocomponents plc | 1,316,658 | 6,129 |
| * | Gulf Keystone Petroleum Ltd. | 2,187,039 | 6,033 |
| | Ultra Electronics Holdings plc | 207,838 | 6,001 |
| | Victrex plc | 241,714 | 5,941 |
| | Close Brothers Group plc | 437,487 | 5,935 |
| | National Express Group plc | 1,328,714 | 5,850 |
| | Aveva Group plc | 207,383 | 5,554 |
| * | Barratt Developments plc | 2,938,636 | 5,498 |
| | Jardine Lloyd Thompson Group plc | 461,261 | 5,439 |
| | Hikma Pharmaceuticals plc | 411,162 | 5,403 |
| | Greene King plc | 656,882 | 5,383 |
| | Ashmore Group plc | 858,353 | 5,363 |
| | Premier Farnell plc | 1,116,126 | 5,326 |
| | New World Resources NV Class A | 313,125 | 5,320 |
| * | PartyGaming plc | 2,067,963 | 5,299 |
| | Hochschild Mining plc | 515,295 | 5,290 |
| | BBA Aviation plc | 1,451,470 | 5,276 |
| * | Imagination Technologies Group plc | 630,019 | 5,273 |
| | Ashtead Group plc | 1,541,878 | 5,220 |
| | Rightmove plc | 284,303 | 5,041 |
| | Britvic plc | 733,257 | 5,022 |
| | Spirent Communications plc | 2,052,966 | 5,008 |
| | International Personal Finance plc | 790,150 | 4,868 |
| | DS Smith plc | 1,334,594 | 4,838 |
| | Lancashire Holdings Ltd. | 441,598 | 4,773 |
| | Tullett Prebon plc | 662,259 | 4,667 |
100
| | | |
| Vanguard® Total International Stock Index Fund | | |
| Schedule of Investments | | |
| April 30, 2011 | | |
| |
| | | | Market |
| | | | Value |
| | | Shares | ($000) |
| | Hunting plc | 344,213 | 4,660 |
| * | Telecity Group plc | 518,705 | 4,566 |
| * | Debenhams plc | 3,959,029 | 4,521 |
| | Ferrexpo plc | 538,756 | 4,515 |
| | Davis Service Group plc | 515,818 | 4,485 |
| | Bellway plc | 370,371 | 4,385 |
| *,^ | Talvivaara Mining Co. plc | 483,464 | 4,302 |
| | Morgan Crucible Co. plc | 820,042 | 4,262 |
| | Millennium & Copthorne Hotels plc | 481,760 | 4,261 |
| * | SIG plc | 1,790,644 | 4,204 |
| * | Mitchells & Butlers plc | 757,831 | 4,176 |
| | Booker Group plc | 4,146,137 | 4,170 |
| * | BTG plc | 995,836 | 4,143 |
| * | QinetiQ Group plc | 2,017,186 | 4,085 |
| * | Soco International plc | 620,143 | 4,029 |
| | Capital & Counties Properties plc | 1,413,836 | 3,977 |
| | Halfords Group plc | 591,598 | 3,910 |
| | Micro Focus International plc | 628,536 | 3,909 |
| | Misys plc | 740,232 | 3,904 |
| * | EnQuest plc | 1,667,818 | 3,894 |
| | Jupiter Fund Management plc | 755,040 | 3,856 |
| | Forth Ports plc | 141,618 | 3,839 |
| | Atkins WS plc | 294,099 | 3,834 |
| | Regus plc | 2,024,062 | 3,796 |
| | De La Rue plc | 283,436 | 3,767 |
| | Fenner plc | 577,776 | 3,760 |
| | Elementis plc | 1,350,150 | 3,724 |
| ^ | Mitie Group plc | 1,051,242 | 3,723 |
| | Bodycote plc | 557,102 | 3,630 |
| | WH Smith plc | 459,054 | 3,616 |
| * | Howden Joinery Group plc | 1,939,218 | 3,587 |
| | Kesa Electricals plc | 1,616,153 | 3,489 |
| | Filtrona plc | 605,086 | 3,481 |
| | Restaurant Group plc | 614,658 | 3,448 |
| * | Premier Foods plc | 6,369,404 | 3,425 |
| | St. James's Place plc | 572,099 | 3,394 |
| * | Petra Diamonds Ltd. | 1,086,653 | 3,341 |
| * | CSR plc | 529,574 | 3,314 |
| | Renishaw plc | 110,952 | 3,279 |
| * | Cape plc | 342,906 | 3,217 |
| | African Barrick Gold Ltd. | 360,561 | 3,181 |
| * | BowLeven plc | 646,769 | 3,173 |
| | Senior plc | 1,241,323 | 3,172 |
| | Beazley plc | 1,442,327 | 3,164 |
| ^ | PZ Cussons plc | 565,165 | 3,096 |
| | Abcam plc | 468,007 | 3,081 |
| | Marston's plc | 1,677,311 | 3,042 |
| * | Rockhopper Exploration plc | 760,001 | 3,025 |
| | Genus plc | 180,570 | 3,014 |
| * | easyJet plc | 502,551 | 2,933 |
| | Bovis Homes Group plc | 390,929 | 2,882 |
| | ITE Group plc | 658,427 | 2,843 |
| | TalkTalk Telecom Group plc | 1,203,995 | 2,798 |
| | Fidessa Group plc | 94,949 | 2,798 |
| | Dairy Crest Group plc | 406,237 | 2,727 |
| | Yule Catto & Co. plc | 748,619 | 2,726 |
| | Go-Ahead Group plc | 113,336 | 2,682 |
| *,^ | Dixons Retail plc | 11,107,180 | 2,679 |
| | JD Wetherspoon plc | 346,594 | 2,635 |
| | Kier Group plc | 116,910 | 2,604 |
| | RPS Group plc | 678,475 | 2,594 |
| | Domino's Pizza UK & IRL plc | 333,638 | 2,582 |
| * | Punch Taverns plc | 1,907,018 | 2,509 |
| | Rathbone Brothers plc | 127,352 | 2,482 |
101
| | | |
| Vanguard® Total International Stock Index Fund | | |
| Schedule of Investments | | |
| April 30, 2011 | | |
| |
| | | | Market |
| | | | Value |
| | | Shares | ($000) |
| ^ | Heritage Oil plc | 590,037 | 2,467 |
| * | SDL plc | 226,586 | 2,450 |
| | Devro plc | 510,763 | 2,443 |
| | Shanks Group plc | 1,206,825 | 2,432 |
| | Playtech Ltd. | 449,699 | 2,420 |
| | Paragon Group of Cos. plc | 833,341 | 2,410 |
| | Greggs plc | 279,494 | 2,406 |
| * | London Mining plc | 331,030 | 2,400 |
| | N Brown Group plc | 471,942 | 2,395 |
| * | Colt Group SA | 950,467 | 2,391 |
| * | Enterprise Inns plc | 1,494,390 | 2,386 |
| | Savills plc | 355,855 | 2,386 |
| * | Northgate plc | 417,244 | 2,385 |
| | Synergy Health plc | 167,183 | 2,364 |
| * | Cove Energy plc | 1,505,779 | 2,360 |
| | Grainger plc | 1,207,777 | 2,327 |
| * | SuperGroup plc | 87,368 | 2,319 |
| * | Salamander Energy plc | 458,685 | 2,315 |
| | Pace plc | 857,560 | 2,307 |
| *,^ | Ocado Group plc | 607,088 | 2,302 |
| | Sthree plc | 296,347 | 2,172 |
| | Dignity plc | 165,058 | 2,113 |
| | Computacenter plc | 274,489 | 2,111 |
| | Diploma plc | 337,850 | 2,083 |
| | Dunelm Group plc | 272,856 | 2,083 |
| *,^ | Avocet Mining plc | 522,334 | 2,047 |
| | Big Yellow Group plc | 354,354 | 1,969 |
| | Keller Group plc | 177,615 | 1,957 |
| *,^ | Blinkx plc | 844,828 | 1,916 |
| | Brewin Dolphin Holdings plc | 664,227 | 1,916 |
| | Interserve plc | 400,562 | 1,883 |
| | Laird plc | 778,198 | 1,833 |
| | F&C Asset Management plc | 1,317,721 | 1,754 |
| *,^ | Kalahari Minerals plc | 456,426 | 1,732 |
| | Cranswick plc | 135,950 | 1,714 |
| * | Gem Diamonds Ltd. | 355,626 | 1,710 |
| | Rank Group plc | 670,186 | 1,689 |
| * | EnCore Oil plc | 875,726 | 1,689 |
| * | Sports Direct International plc | 497,201 | 1,676 |
| * | Songbird Estates plc | 656,333 | 1,671 |
| * | Mecom Group plc | 320,597 | 1,670 |
| | Stobart Group Ltd. | 690,106 | 1,665 |
| * | Unite Group plc | 457,935 | 1,646 |
| * | Chariot Oil & Gas Ltd. | 426,186 | 1,637 |
| | Galliford Try plc | 233,690 | 1,619 |
| * | Raven Russia Ltd. | 1,307,165 | 1,530 |
| | Kcom Group plc | 1,482,271 | 1,528 |
| | Dechra Pharmaceuticals plc | 189,120 | 1,518 |
| | JKX Oil & Gas plc | 292,660 | 1,502 |
| | Mothercare plc | 213,541 | 1,500 |
| | Anglo Pacific Group plc | 277,069 | 1,466 |
| * | Redrow plc | 662,320 | 1,450 |
| ^ | Euromoney Institutional Investor plc | 119,768 | 1,429 |
| *,^ | Velti plc | 75,139 | 1,412 |
| | Chesnara plc | 329,214 | 1,399 |
| | Chaucer Holdings plc | 1,493,988 | 1,378 |
| * | Faroe Petroleum plc | 451,056 | 1,322 |
| * | TT electronics plc | 441,706 | 1,321 |
| * | Aurelian Oil & Gas plc | 1,118,771 | 1,318 |
| | Development Securities plc | 347,694 | 1,262 |
| | Helical Bar plc | 286,921 | 1,253 |
| * | Wolfson Microelectronics plc | 313,067 | 1,245 |
| * | Gulfsands Petroleum plc | 257,411 | 1,240 |
| | Hamworthy plc | 129,522 | 1,230 |
102
| | | |
| Vanguard® Total International Stock Index Fund | | |
| Schedule of Investments | | |
| April 30, 2011 | | |
| |
| | | | Market |
| | | | Value |
| | | Shares | ($000) |
| | ST Modwen Properties plc | 429,369 | 1,221 |
| | Carpetright plc | 105,636 | 1,217 |
| | Morgan Sindall Group plc | 103,870 | 1,205 |
| | Workspace Group plc | 2,470,277 | 1,194 |
| * | Hansen Transmissions International NV | 1,438,149 | 1,194 |
| | Majestic Wine plc | 176,829 | 1,190 |
| * | Borders & Southern Petroleum plc | 1,042,436 | 1,186 |
| * | Quintain Estates & Development plc | 1,487,497 | 1,158 |
| | Moneysupermarket.com Group plc | 727,595 | 1,157 |
| | Mcbride plc | 504,874 | 1,130 |
| | WSP Group plc | 188,534 | 1,129 |
| * | Petroceltic International plc | 5,595,029 | 1,121 |
| | Marshalls plc | 549,472 | 1,116 |
| * | Petroneft Resources plc | 1,030,071 | 1,093 |
| | Sportingbet plc | 1,334,501 | 1,069 |
| | Robert Walters plc | 207,996 | 1,066 |
| | Hargreaves Services plc | 64,040 | 1,061 |
| | Severfield-Rowen plc | 253,653 | 1,045 |
| * | Vectura Group plc | 933,515 | 1,041 |
| | Telecom Plus plc | 127,479 | 1,037 |
| | Collins Stewart plc | 727,532 | 1,029 |
| * | Caledon Resources plc | 599,605 | 1,014 |
| * | John Menzies plc | 109,845 | 997 |
| | Primary Health Properties plc | 181,759 | 982 |
| | Mears Group plc | 242,873 | 979 |
| * | IQE plc | 1,300,583 | 971 |
| * | Metric Property Investments plc | 542,888 | 964 |
| * | Highland Gold Mining Ltd. | 327,559 | 949 |
| | Game Group plc | 988,949 | 878 |
| | Holidaybreak plc | 195,183 | 877 |
| * | Valiant Petroleum plc | 95,258 | 852 |
| *,^ | Yell Group plc | 6,752,312 | 805 |
| * | Avis Europe plc | 246,067 | 799 |
| *,^ | Pursuit Dynamics plc | 159,569 | 799 |
| * | Xchanging plc | 583,823 | 781 |
| | Evolution Group plc | 653,285 | 780 |
| * | Circle Oil plc | 1,353,606 | 777 |
| | Immunodiagnostic Systems Holdings plc | 52,024 | 772 |
| | Lavendon Group plc | 468,200 | 764 |
| | Speedy Hire plc | 1,428,780 | 747 |
| | Melrose Resources plc | 156,358 | 725 |
| | Lookers plc | 660,331 | 723 |
| * | Monitise plc | 1,690,028 | 707 |
| | PV Crystalox Solar plc | 777,200 | 702 |
| * | Pendragon plc | 1,699,721 | 670 |
| * | Axis-Shield plc | 128,488 | 668 |
| * | Clarkson plc | 29,835 | 629 |
| * | Trinity Mirror plc | 734,024 | 595 |
| | Wincanton plc | 335,699 | 592 |
| * | CLS Holdings plc | 50,481 | 572 |
| * | Hardy Oil & Gas plc | 150,253 | 557 |
| * | Findel plc | 5,380,190 | 543 |
| * | Minerva plc | 345,393 | 536 |
| | Robert Wiseman Dairies plc | 100,522 | 530 |
| | Topps Tiles plc | 413,497 | 504 |
| | RSM Tenon Group plc | 877,517 | 480 |
| *,^ | Nanoco Group plc | 323,569 | 469 |
| * | Capital & Regional plc | 693,143 | 448 |
| | Healthcare Locums plc | 236,557 | 445 |
| * | UK Coal plc | 629,484 | 426 |
| | Mouchel Group plc | 321,072 | 416 |
| ^ | Costain Group plc | 109,254 | 413 |
| * | Eros International plc | 99,966 | 398 |
| * | Sterling Energy plc | 438,752 | 367 |
103
| | | | | |
| Vanguard® Total International Stock Index Fund | | | | |
| Schedule of Investments | | | | |
| April 30, 2011 | | | | |
| |
| | | | | | Market |
| | | | | | Value |
| | | | | Shares | ($000) |
| | Promethean World plc | | | 310,660 | 353 |
| * | Falkland Oil & Gas Ltd. | | | 271,795 | 338 |
| | Hampson Industries plc | | | 728,387 | 321 |
| | 888 Holdings plc | | | 395,832 | 251 |
| * | Johnston Press plc | | | 1,629,294 | 217 |
| ^ | HMV Group plc | | | 1,153,588 | 207 |
| *,^ | Desire Petroleum plc | | | 784,758 | 178 |
| *,^ | Ceres Power Holdings plc | | | 180,520 | 139 |
| * | DTZ Holdings plc | | | 201,020 | 87 |
| * | Stobart Group Ltd. Rights Exp 05/16/2011 | | | 177,526 | — |
| | | | | | 8,820,899 |
| Total Common Stocks (Cost $50,397,593) | | | | 60,256,723 |
| |
| | | | | | Market |
| | | | | | Value |
| | | Coupon | | Shares | ($000) |
| Temporary Cash Investments (7.4%) | | | | |
| Money Market Fund (7.3%) | | | | |
| 3,4 | Vanguard Market Liquidity Fund | 0.179% | | 4,447,515,635 | 4,447,516 |
| |
| | | | | Face | Market |
| | | | Maturity | Amount | Value |
| | | Coupon | Date | ($000) | ($000) |
| U.S. Government and Agency Obligations (0.1%) | | | | |
| 5,6 | Federal Home Loan Bank Discount Notes | 0.210% | 6/3/11 | 15,000 | 14,998 |
| 5,6 | Federal Home Loan Bank Discount Notes | 0.145% | 6/23/11 | 7,000 | 6,999 |
| 5,6 | Freddie Mac Discount Notes | 0.210% | 5/23/11 | 2,000 | 2,000 |
| | | | | | 23,997 |
| Total Temporary Cash Investments (Cost $4,471,511)1 | | | | 4,471,513 |
| Total Investments (106.7%) (Cost $54,869,104) | | | | 64,728,236 |
| Other Assets and Liabilities—Net (-6.7%)4 | | | | (4,037,514) |
| Net Assets (100%) | | | | 60,690,722 |
* Non-income-producing security.
^ Part of security position is on loan to broker-dealers. The total value of securities on loan is $3,994,428,000.
1 The fund invests a portion of its cash reserves in equity markets through the use of index futures contracts. After giving effect to futures investments, the fund's effective common stock and temporary cash investment positions represent 99.9% and 6.8%, respectively, of net assets.
2 Security exempt from registration under Rule 144A of the Securities Act of 1933. Such securities may be sold in transactions exempt from registration, normally to qualified institutional buyers. At April 30, 2011, the aggregate value of these securities was $95,987,000, representing 0.2% of net assets.
3 Affiliated money market fund available only to Vanguard funds and certain trusts and accounts managed by Vanguard. Rate shown is the 7-day yield.
4 Includes $4,201,205,000 of collateral received for securities on loan.
5 The issuer operates under a congressional charter; its securities are not backed by the full faith and credit of the U.S. government.
6 Securities with a value of $23,997,000 have been segregated as initial margin for open futures contracts.
ADR—American Depositary Receipt.
GDR—Global Depositary Receipt.
REIT—Real Estate Investment Trust.
104
© 2011 The Vanguard Group. Inc.
All rights reserved.
Vanguard Marketing Corporation, Distributor.
SNA 1132_ 062011
 |
| Vanguard Developed Markets |
| Index Fund Semiannual Report |
|
| April 30, 2011 |
|
 |
|
> Vanguard Developed Markets Index Fund returned about 13% for the six months ended April 30, 2011.
> The fund’s return closely tracked that of its benchmark, the MSCI EAFE Index, and was just slightly higher than the average return of its peer international funds.
> European markets outperformed those in the Pacific Rim.
| |
| Contents | |
| Your Fund’s Total Returns. | 1 |
| Chairman’s Letter. | 2 |
| Fund Profile. | 7 |
| Performance Summary. | 9 |
| Financial Statements. | 10 |
| About Your Fund’s Expenses. | 25 |
| Trustees Approve Advisory Arrangement. | 27 |
| Glossary. | 28 |

Developed Markets Index Fund
Please note: The opinions expressed in this report are just that—informed opinions. They should not be considered promises or advice. Also, please keep in mind that the information and opinions cover the period through the date on the front of this report. Of course, the risks of investing in your fund are spelled out in the prospectus.
See the Glossary for definitions of investment terms used in this report.
Cover photograph: Jean Maher.
Your Fund’s Total Returns
| |
| Six Months Ended April 30, 2011 | |
| | Total |
| | Returns |
| Vanguard Developed Markets Index Fund | |
| Investor Shares | 12.73% |
| Institutional Shares | 12.83 |
| Institutional Plus Shares (Inception: 12/2/2010) | 13.47 |
| MSCI EAFE Index | 12.71 |
| International Funds Average | 12.64 |
| International Funds Average: Derived from data provided by Lipper Inc. | |
Institutional and Institutional Plus Shares are available to certain institutional investors who meet specific administrative, service, and account-size criteria.
| | | | |
| Your Fund’s Performance at a Glance | | | | |
| October 31, 2010 , Through April 30, 2011 | | | | |
| | | | Distributions Per Share |
| | Starting | Ending | Income | Capital |
| | Share Price | Share Price | Dividends | Gains |
| Vanguard Developed Markets Index Fund | | | | |
| Investor Shares | $10.06 | $11.03 | $0.281 | $0.000 |
| Institutional Shares | 9.99 | 10.95 | 0.291 | 0.000 |
| Institutional Plus Shares | | | | |
| (Inception: 12/2/2010) | 103.47 | 114.06 | 3.027 | 0.000 |
1

Chairman’s Letter
Dear Shareholder,
Developed markets in Europe and the Pacific region seesawed during the fiscal six months as investors reacted alternately to Europe’s ongoing debt problems, unrest in the Middle East and North Africa, and the devastating earthquake and nuclear disaster in Japan. Yet the markets quickly recovered from each event and ended the period on a high note.
For the six months ended April 30, 2011, Vanguard Developed Markets Index Fund returned about 13% for Investor and Institutional Shares, in line with the return of its benchmark, the MSCI EAFE Index, and slightly above the average return of its peers. (Institutional Plus Shares were launched in December.)
Strong returns around the globe
The headlines were dominated by political upheaval, natural and nuclear disaster, and economic distress, but global stock markets produced outstanding returns for the six months ended April 30, rising more than 12%. For U.S.-based investors, almost half of this return reflected exchange rate gains produced largely by strength in the euro and currencies in emerging economies.
The broad U.S. stock market returned more than 17%. Although rising food and gasoline prices put pressure on consumer budgets, corporate earnings growth remained strong, and the pace of new job creation bounced back from extremely depressed levels.
2
As the economy found its footing, rates edged higher
Rising longer-term interest rates put pressure on bond prices, which led to modest bond market returns for the six-month period. The broad taxable U.S. bond market returned about 0%. The broad municipal market returned –1.68%. The rise in rates reflected both confidence that the economic recovery would prove self-sustaining and thus nudge rates higher, and anxiety that higher rates would be necessary to provide some protection from inflation. Even so, inflation expectations remained subdued, as measured by the difference between the yields of inflation-protected and nominal U.S. Treasury bonds.
The return on short-term money market instruments such as the 3-month U.S. Treasury bill remained near 0%, consistent with the Federal Reserve Board’s target for short-term rates.
European stocks led markets overseas
Vanguard Developed Markets Index Fund tracks an index with broad exposure to companies primarily in Europe and the Pacific region. European stocks represented about two-thirds of the index, and Pacific region stocks about one-third.
For the six months, European markets surpassed those of the Pacific region. For U.S.-based investors, the dollar’s six-month
| | | |
| Market Barometer | | | |
| |
| | | | Total Returns |
| | | Periods Ended April 30, 2011 |
| | Six | One | Five Years |
| | Months | Year | (Annualized) |
| Stocks | | | |
| Russell 1000 Index (Large-caps) | 17.12% | 18.02% | 3.30% |
| Russell 2000 Index (Small-caps) | 23.73 | 22.20 | 3.89 |
| Dow Jones U.S. Total Stock Market Index | 17.28 | 18.40 | 3.65 |
| MSCI All Country World Index ex USA (International) | 12.44 | 19.73 | 3.55 |
| |
| Bonds | | | |
| Barclays Capital U.S. Aggregate Bond Index (Broad | | | |
| taxable market) | 0.02% | 5.36% | 6.33% |
| Barclays Capital Municipal Bond Index (Broad | | | |
| tax-exempt market) | -1.68 | 2.20 | 4.52 |
| Citigroup Three-Month U.S. Treasury Bill Index | 0.06 | 0.15 | 2.02 |
| |
| CPI | | | |
| Consumer Price Index | 2.83% | 3.16% | 2.22% |
3
decline against most major currencies enhanced returns from abroad. (For more on currencies, see the box on page 5.)
Developed markets in Europe contributed more than three-quarters of the fund’s return for the period. Europe’s larger economies, including the United Kingdom (13%), Germany (22%), and France (16%), were responsible for much of the fund’s gains. The industrial, energy, and materials sectors performed best, largely because of generally higher crude oil and commodity prices. Fears of supply disruptions following political turmoil in Libya, a key source of oil for several European countries, contributed to the spike in oil prices and turbulence in the markets. Many European companies also benefited from growth opportunities in emerging markets.
Several of Europe’s most troubled economies—Greece, Ireland, Spain, and Portugal—grabbed headlines throughout the period, but markets seemed to have priced in investor concerns about sovereign debt. Ireland, which received a $100-plus billion bailout package in November from the European Union and the International Monetary Fund, actually turned in the best result for the period, with a 26% gain. Greece was the only country in the index’s European holdings to post a negative return.
Despite the devastating events in Japan, the Pacific region returned a respectable 8%. The region’s performance was led by Australia (18%), which benefited from continued strength in its financial, materials, and energy sectors. Several of
| | | | |
| Expense Ratios | | | | |
| Your Fund Compared With Its Peer Group | | | | |
| | Investor | Institutional | Institutional | Peer Group |
| | Shares | Shares | Plus Shares | Average |
| Developed Markets Index Fund | 0.22% | 0.07% | 0.06% | 1.42% |
The fund expense ratios shown are from the prospectus dated February 28, 2011, and represent estimated costs for the current fiscal year. For the six months ended April 30, 2011, the annualized expense ratios were 0.21% for Investor Shares and 0.08% for Institutional Shares. The annualized expense ratio for Institutional Plus Shares since their inception on December 2, 2010, was 0.06%. The peer-group expense ratio is derived from data provided by Lipper Inc. and captures information through year-end 2010.
Peer group: International Funds.
4
the country’s financial companies posted double-digit gains. Despite severe flooding in parts of the country that disrupted some mining activities, companies involved in mining, oil, and gas produced strong results.
Japan—the fund’s largest country exposure in this region—did not significantly hurt returns despite its tragic earthquake, tsunami, and nuclear woes. Although Japanese stocks experienced a sell-off
Investment insight
A note on foreign currency translation effects
When you buy stocks of companies based outside of your home country, you gain
exposure to a wider array of economic and market forces, including the dynamics of
the foreign exchange markets.
The exchange rate of the U.S. dollar versus another currency is the price at which the
dollar can be converted into that currency. For example, if the exchange rate of the
U.S. dollar versus Britain’s pound sterling is $1.50, it takes 1.5 dollars to purchase 1
pound. If the U.S. dollar weakens—say, to a rate of $2.00—then you’ll need 2 dollars
to buy 1 pound. Conversely, if the dollar strengthens to $1.25, it will take fewer
dollars to buy a pound.
The price of one currency relative to another is determined by supply and demand
factors—including interest rates, the strength of the two economies, and geopolitical
risks. In the long run, the portfolio effects of exchange rate movements tend to
balance out. But a rise or fall in the dollar’s value versus other currencies can influence
short-term returns. Exchange rate changes also affect the purchasing power of each
new dollar you invest in foreign stocks, just as they affect the prices of foreign goods.
And they can have a less immediately visible impact on a company’s profits, ultimately
driving its stock price.
Performance during the period
From October 31, 2010, through April 30, 2011, most major currencies rose in value
against the U.S. dollar. In part, this reflected the Federal Reserve’s policy of holding
short-term interest rates near zero while some foreign central banks raised rates. For
U.S.-based investors, the shrinking dollar boosted returns earned in local markets. For
example: The MSCI Europe Index returned more than 15% when translated into U.S.
dollars, and the MSCI Emerging Markets Index returned nearly 10% in dollars—both
nearly double the indexes’ local-currency returns.
5
soon after the initial earthquake in March, by the end of the period, only the index’s Japanese utility holdings reported negative results.
Focus on the long term, tune out the noise
International stocks sustained some body blows during the past six months but quickly snapped back. The markets’ strong finish in April is encouraging and a reminder that it’s nearly impossible to figure out how they’ll react to unpredictable events. There will always be unexpected news—good or bad—to drive global stock markets up or down. As tempting as it may be, we should not let such events influence the way we invest but instead should remain focused on our long-term investment goals.
No matter what the market’s short-term direction, it’s prudent to build a well-balanced, diversified portfolio that includes a mix of stocks, bonds, and short-term investments appropriate for your time horizon, financial objectives, and risk tolerance. Vanguard Developed Markets Index Fund, with its low-cost strategy and wide exposure to markets in Europe and the Pacific region, can play a complementary role in such a balanced portfolio.
Thank you for entrusting your assets to Vanguard.
Sincerely,
F. William McNabb III
Chairman and Chief Executive Officer
May 12, 2011
6
Developed Markets Index Fund
Fund Profile
As of April 30, 2011
| | | |
| Share-Class Characteristics | |
| | Investor | Institutional | Institutional |
| | Shares | Shares | Plus Shares |
| Ticker Symbol | VDMIX | VIDMX | VDMPX |
| Expense Ratio1 | 0.22% | 0.07% | 0.06% |
| | | |
| Portfolio Characteristics | | |
| | | | MSCI AC |
| | | MSCI | World |
| | | EAFE | Index |
| | Fund | Index | ex USA |
| Number of Stocks | 984 | 966 | 1,869 |
| Median Market Cap | $39.9B | $39.9B | $33.8B |
| Price/Earnings Ratio | 13.4x | 13.4x | 13.8x |
| Price/Book Ratio | 1.5x | 1.5x | 1.7x |
| Return on Equity | 17.2% | 17.2% | 17.8% |
| Earnings Growth Rate | -1.3% | -1.3% | 2.8% |
| Dividend Yield | 3.1% | 3.1% | 2.9% |
| Turnover Rate | | | |
| (Annualized) | 5% | — | — |
| Short-Term Reserves | -0.4% | — | — |
| | | |
| Sector Diversification (% of equity exposure) |
| | | | MSCI AC |
| | | MSCI | World |
| | | EAFE | Index |
| | Fund | Index | ex USA |
| Consumer | | | |
| Discretionary | 10.2% | 10.2% | 9.0% |
| Consumer Staples | 9.9 | 9.9 | 8.5 |
| Energy | 8.5 | 8.5 | 11.6 |
| Financials | 24.0 | 24.0 | 24.8 |
| Health Care | 8.1 | 8.2 | 5.9 |
| Industrials | 12.9 | 12.9 | 11.0 |
| Information | | | |
| Technology | 4.7 | 4.7 | 6.3 |
| Materials | 11.3 | 11.2 | 13.0 |
| Telecommunication | | | |
| Services | 5.6 | 5.6 | 5.7 |
| Utilities | 4.8 | 4.8 | 4.2 |
| | |
| Volatility Measures | | |
| | MSCI | MSCI AC |
| | EAFE | World Index |
| | Index | ex USA |
| R-Squared | 0.99 | 0.97 |
| Beta | 1.04 | 1.00 |
These measures show the degree and timing of the fund’s fluctuations compared with the indexes over 36 months.
| | |
| Ten Largest Holdings (% of total net assets) |
| BHP Billiton | Diversified Metals | |
| | & Mining | 2.1% |
| Royal Dutch Shell plc | Integrated Oil & | |
| | Gas | 2.0 |
| Nestle SA | Packaged Foods & | |
| | Meats | 1.8 |
| HSBC Holdings plc | Diversified Banks | 1.6 |
| Vodafone Group plc | Wireless | |
| | Telecommunication | |
| | Services | 1.2 |
| Rio Tinto | Diversified Metals | |
| | & Mining | 1.2 |
| BP plc | Integrated Oil & | |
| | Gas | 1.2 |
| Total SA | Integrated Oil & | |
| | Gas | 1.1 |
| Novartis AG | Pharmaceuticals | 1.0 |
| Siemens AG | Industrial | |
| | Conglomerates | 1.0 |
| Top Ten | | 14.2% |
The holdings listed exclude any temporary cash investments and equity index products.
Allocation by Region (% of equity exposure)
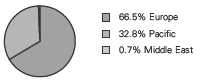
1 The expense ratios shown are from the prospectus dated February 28, 2011, and represent estimated costs for the current fiscal year. For the six months ended April 30, 2011, the annualized expense ratios were 0.21% for Investor Shares and 0.08% for Institutional Shares. The annualized expense ratio for Institutional Plus Shares since their inception on December 2, 2010, was 0.06%.
7
Developed Markets Index Fund
| | | |
| Market Diversification (% of equity exposure) |
| | | | MSCI AC |
| | | MSCI | World |
| | | EAFE | Index |
| | Fund | Index | ex USA |
| Europe | | | |
| United Kingdom | 21.5% | 21.5% | 14.7% |
| France | 10.3 | 10.4 | 7.1 |
| Germany | 9.0 | 9.0 | 6.2 |
| Switzerland | 8.0 | 8.0 | 5.5 |
| Spain | 3.6 | 3.7 | 2.5 |
| Sweden | 3.3 | 3.3 | 2.3 |
| Italy | 3.0 | 3.0 | 2.0 |
| Netherlands | 2.6 | 2.6 | 1.8 |
| Finland | 1.1 | 1.1 | 0.7 |
| Denmark | 1.1 | 1.1 | 0.7 |
| Belgium | 1.0 | 1.0 | 0.7 |
| Other | 2.0 | 2.0 | 1.4 |
| Subtotal | 66.5% | 66.7% | 45.6% |
| Pacific | | | |
| Japan | 19.5% | 19.3% | 13.2% |
| Australia | 8.8 | 8.8 | 6.0 |
| Hong Kong | 2.7 | 2.7 | 1.8 |
| Singapore | 1.7 | 1.7 | 1.2 |
| Other | 0.1 | 0.1 | 0.1 |
| Subtotal | 32.8% | 32.6% | 22.3% |
| Middle East | 0.7% | 0.7% | 0.5% |
| Emerging Markets | | | |
| Other | 0.0% | 0.0% | 23.5% |
| North America | 0.0% | 0.0% | 8.1% |
8
Developed Markets Index Fund
Performance Summary
All of the returns in this report represent past performance, which is not a guarantee of future results that may be achieved by the fund. (Current performance may be lower or higher than the performance data cited. For performance data current to the most recent month-end, visit our website at vanguard.com/performance.) Note, too, that both investment returns and principal value can fluctuate widely, so an investor’s shares, when sold, could be worth more or less than their original cost. The returns shown do not reflect taxes that a shareholder would pay on fund distributions or on the sale of fund shares.
Fiscal-Year Total Returns (%): October 31, 2000, Through April 30, 2011
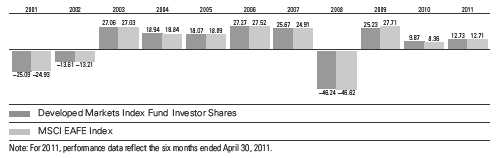
Average Annual Total Returns: Periods Ended March 31, 2011
This table presents returns through the latest calendar quarter—rather than through the end of the fiscal period.
Securities and Exchange Commission rules require that we provide this information.
| | | | |
| | Inception | One | Five | Ten |
| | Date | Year | Years | Years |
| Investor Shares | 5/8/2000 | 10.49% | 1.41% | 5.38% |
| Institutional Shares | 5/8/2000 | 10.69 | 1.45 | 5.40 |
| Institutional Plus Shares | 12/2/2010 | — | — | 6.641 |
| 1 Return since inception. | | | | |
The inception date of the Institutional Shares is January 22, 2010; the returns for the Institutional Shares shown in the table above reflect a blend of the historical performance of the fund’s Investor Shares prior to January 22, 2010, and of the Institutional Shares from then on. The inception date shown in the table is that of the fund’s Investor Shares.
Vanguard fund returns do not reflect the 2% fee on redemptions of shares held for less than two months.
See Financial Highlights for dividend and capital gains information.
9
Developed Markets Index Fund
Financial Statements (unaudited)
Statement of Net Assets—Investments Summary
As of April 30, 2011
This Statement summarizes the fund’s holdings by asset type. Details are reported for each of the fund’s 50 largest individual holdings and for investments that, in total for any issuer, represent more than 1% of the fund’s net assets. The total value of smaller holdings is reported as a single amount within each category.
The fund reports a complete list of its holdings in regulatory filings four times in each fiscal year, at the quarter-ends. For the second and fourth fiscal quarters, the complete listing of the fund’s holdings is available electronically on vanguard.com and on the Securities and Exchange Commission’s website (sec.gov), or you can have it mailed to you without charge by calling 800-662-7447. For the first and third fiscal quarters, the fund files the lists with the SEC on Form N-Q. Shareholders can look up the fund’s Forms N-Q on the SEC’s website. Forms N-Q may also be reviewed and copied at the SEC’s Public Reference Room (see the back cover of this report for further information).
| | | | |
| | | | Market | Percentage |
| | | | Value | of Net |
| | | Shares | ($000) | Assets |
| Common Stocks | | | |
| Australia | | | |
| | BHP Billiton Ltd. | 3,230,877 | 163,579 | 1.3% |
| | Commonwealth Bank of Australia | 1,558,257 | 91,989 | 0.8% |
| | Westpac Banking Corp. | 3,007,837 | 82,115 | 0.7% |
| | Australia & New Zealand Banking Group Ltd. | 2,576,872 | 68,641 | 0.6% |
| | National Australia Bank Ltd. | 2,150,591 | 64,029 | 0.5% |
| | Rio Tinto Ltd. | 438,405 | 39,687 | 0.3% |
| | Australia—Other † | | 556,729 | 4.5% |
| | | | 1,066,769 | 8.7% |
| |
| Austria † | | 39,965 | 0.3% |
| |
| Belgium † | | 118,286 | 1.0% |
| |
| Denmark | | | |
| | Novo Nordisk A/S Class B | 421,175 | 53,318 | 0.5% |
| | Denmark—Other † | | 76,933 | 0.6% |
| | | | 130,251 | 1.1% |
| |
| Finland † | | 131,315 | 1.1% |
| |
| France | | | |
| | Total SA | 2,126,364 | 136,175 | 1.1% |
| | Sanofi-Aventis SA | 1,055,100 | 83,476 | 0.7% |
| | BNP Paribas | 964,328 | 76,235 | 0.6% |
| | France—Other † | | 957,486 | 7.8% |
| | | | 1,253,372 | 10.2% |
| Germany | | | |
| | Siemens AG | 827,762 | 120,405 | 1.0% |
| *,^ | BASF SE | 924,039 | 94,884 | 0.8% |
| ^ | Bayer AG | 831,957 | 73,041 | 0.6% |
| ^ | Allianz SE | 456,651 | 71,745 | 0.6% |
| | Daimler AG | 826,595 | 63,885 | 0.5% |
10
Developed Markets Index Fund
| | | |
| | | Market | Percentage |
| | | Value | of Net |
| | Shares | ($000) | Assets |
| E.ON AG | 1,811,812 | 61,926 | 0.5% |
| Deutsche Bank AG | 935,134 | 60,905 | 0.5% |
| SAP AG | 863,870 | 55,651 | 0.4% |
| Germany—Other † | | 492,984 | 4.0% |
| | | 1,095,426 | 8.9% |
| |
| Greece † | | 30,083 | 0.2% |
| |
| Hong Kong † | | 326,328 | 2.7% |
| |
| Ireland † | | 32,497 | 0.3% |
| |
| Israel † | | 83,623 | 0.7% |
| |
| Italy | | | |
| ENI SPA | 2,619,251 | 70,127 | 0.6% |
| Italy—Other † | | 289,626 | 2.3% |
| | | 359,753 | 2.9% |
| Japan | | | |
| Toyota Motor Corp. | 2,796,093 | 111,539 | 0.9% |
| Honda Motor Co. Ltd. | 1,652,592 | 63,532 | 0.5% |
| Mitsubishi UFJ Financial Group Inc. | 12,909,836 | 61,962 | 0.5% |
| Canon Inc. | 1,149,235 | 54,120 | 0.4% |
| Japan—Other † | | 2,078,541 | 17.0% |
| | | 2,369,694 | 19.3% |
| Netherlands | | | |
| Unilever NV | 1,638,865 | 53,953 | 0.5% |
| Netherlands—Other † | | 260,642 | 2.1% |
| | | 314,595 | 2.6% |
| |
| New Zealand † | | 13,351 | 0.1% |
| |
| Norway † | | 113,414 | 0.9% |
| |
| Portugal † | | 32,793 | 0.3% |
| |
| Singapore † | | 208,246 | 1.7% |
| |
| Spain | | | |
| Telefonica SA | 4,067,380 | 109,271 | 0.9% |
| Banco Santander SA | 8,379,513 | 107,011 | 0.9% |
| Banco Bilbao Vizcaya Argentaria SA | 4,292,221 | 54,981 | 0.4% |
| Spain—Other † | | 171,983 | 1.4% |
| | | 443,246 | 3.6% |
| |
| Sweden † | | 398,457 | 3.2% |
| |
| Switzerland | | | |
| Nestle SA | 3,485,944 | 216,367 | 1.8% |
| Novartis AG | 2,122,862 | 125,886 | 1.0% |
| Roche Holding AG | 706,815 | 114,730 | 0.9% |
| * UBS AG | 3,636,450 | 72,775 | 0.6% |
| ABB Ltd. | 2,204,597 | 60,881 | 0.5% |
| Credit Suisse Group AG | 1,133,275 | 51,583 | 0.4% |
| 2 Switzerland—Other † | | 336,354 | 2.8% |
| | | 978,576 | 8.0% |
11
Developed Markets Index Fund
| | | | |
| | | | Market | Percentage |
| | | | Value | of Net |
| | | Shares | ($000) | Assets |
| United Kingdom | | | | |
| HSBC Holdings plc | | 17,927,950 | 195,559 | 1.6% |
| BP plc | | 19,049,979 | 146,444 | 1.2% |
| Vodafone Group plc | | 50,359,672 | 145,582 | 1.2% |
| GlaxoSmithKline plc | | 5,266,181 | 115,041 | 0.9% |
| Rio Tinto plc | | 1,469,758 | 107,243 | 0.9% |
| Royal Dutch Shell plc Class B | | 2,732,690 | 106,316 | 0.9% |
| BHP Billiton plc | | 2,231,845 | 94,364 | 0.8% |
| British American Tobacco plc | | 2,024,091 | 88,448 | 0.7% |
| BG Group plc | | 3,431,946 | 88,379 | 0.7% |
| Royal Dutch Shell plc Class A | | 2,002,898 | 78,017 | 0.6% |
| AstraZeneca plc | | 1,433,517 | 71,129 | 0.6% |
| Anglo American plc | | 1,337,936 | 70,134 | 0.6% |
| Standard Chartered plc | | 2,377,142 | 66,066 | 0.5% |
| Royal Dutch Shell plc Class A (Amsterdam Shares) | 1,564,209 | 60,424 | 0.5% |
| Barclays plc | | 11,730,176 | 55,766 | 0.5% |
| Tesco plc | | 8,137,854 | 54,865 | 0.4% |
| Xstrata plc | | 2,103,655 | 53,958 | 0.4% |
| Diageo plc | | 2,536,728 | 51,606 | 0.4% |
| Vodafone Group plc ADR | | 255,762 | 7,448 | 0.1% |
| United Kingdom—Other † | | | 974,800 | 7.9% |
| | | | 2,631,589 | 21.4% |
| Total Common Stocks (Cost $9,179,385) | | 12,171,629 | 99.2%1 |
| |
| | Coupon | | | |
| Temporary Cash Investments | | | | |
| Money Market Fund | | | | |
| 3,4 Vanguard Market Liquidity Fund | 0.179% | 597,218,000 | 597,218 | 4.9% |
| |
| 5U.S. Government and Agency Obligations † | | 3,249 | 0.0% |
| Total Temporary Cash Investments (Cost $600,467) | | 600,467 | 4.9%1 |
| Total Investments (Cost $9,779,852) | | 12,772,096 | 104.1% |
| Other Assets and Liabilities | | | | |
| Other Assets | | | 222,309 | 1.8% |
| Liabilities4 | | | (726,650) | (5.9%) |
| | | | (504,341) | (4.1%) |
| Net Assets | | | 12,267,755 | 100.0% |
12
Developed Markets Index Fund
| |
| At April 30, 2011, net assets consisted of: | |
| | Amount |
| | ($000) |
| Paid-in Capital | 11,074,806 |
| Undistributed Net Investment Income | 93,672 |
| Accumulated Net Realized Losses | (1,897,494) |
| Unrealized Appreciation (Depreciation) | |
| Investment Securities | 2,992,244 |
| Futures Contracts | 599 |
| Forward Currency Contracts | 1,841 |
| Foreign Currencies | 2,087 |
| Net Assets | 12,267,755 |
| |
| Investor Shares—Net Assets | |
| Applicable to 328,588,748 outstanding $.001 par value shares of beneficial | |
| interest (unlimited authorization) | 3,624,542 |
| Net Asset Value Per Share—Investor Shares | $11.03 |
| |
| Institutional Shares—Net Assets | |
| Applicable to 483,188,566 outstanding $.001 par value shares of beneficial | |
| interest (unlimited authorization) | 5,289,031 |
| Net Asset Value Per Share—Institutional Shares | $10.95 |
| |
| Institutional Plus Shares—Net Assets | |
| Applicable to 29,407,851 outstanding $.001 par value shares of beneficial | |
| interest (unlimited authorization) | 3,354,182 |
| Net Asset Value Per Share—Institutional Plus Shares | $114.06 |
See Note A in Notes to Financial Statements.
* Non-income-producing security.
^ Part of security position is on loan to broker-dealers. The total value of securities on loan is $567,552,000.
† Represents the aggregate value, by category, of securities that are not among the 50 largest holdings and, in total for any issuer, represent 1% or less of net assets.
1 The fund invests a portion of its cash reserves in equity markets through the use of index futures contracts. After giving effect to futures investments, the fund’s effective common stock and temporary cash investment positions represent 99.6% and 4.5%, respectively, of net assets.
2 Certain of the fund’s securities are exempt from registration under Rule 144A of the Securities Act of 1933. Such securities may be sold in transactions exempt from registration, normally to qualified institutional buyers. At April 30, 2011, the aggregate value of these securities was $10,294,000, representing 0.1% of net assets.
3 Affiliated money market fund available only to Vanguard funds and certain trusts and accounts managed by Vanguard. Rate shown is the 7-day yield.
4 Includes $597,217,000 of collateral received for securities on loan.
5 Securities with a value of $3,249,000 have been segregated as initial margin for open futures contracts.
ADR—American Depositary Receipt.
See accompanying Notes, which are an integral part of the Financial Statements.
13
Developed Markets Index Fund
| |
| Statement of Operations | |
| |
| | Six Months Ended |
| | April 30, 2011 |
| | ($000) |
| Investment Income | |
| Income | |
| Dividends1 | 166,993 |
| Interest2 | 30 |
| Security Lending | 1,786 |
| Total Income | 168,809 |
| Expenses | |
| The Vanguard Group—Note B | |
| Investment Advisory Services | 428 |
| Management and Administrative—Investor Shares | 2,643 |
| Management and Administrative—Institutional Shares | 500 |
| Management and Administrative—Institutional Plus Shares | 362 |
| Marketing and Distribution—Investor Shares | 463 |
| Marketing and Distribution—Institutional Shares | 1,034 |
| Marketing and Distribution—Institutional Plus Shares | 60 |
| Custodian Fees | 836 |
| Shareholders’ Reports—Investor Shares | 10 |
| Shareholders’ Reports—Institutional Shares | — |
| Shareholders’ Reports—Institutional Plus Shares | — |
| Trustees’ Fees and Expenses | 5 |
| Total Expenses | 6,341 |
| Net Investment Income | 162,468 |
| Realized Net Gain (Loss) | |
| Investment Securities Sold | 22,199 |
| Futures Contracts | 914 |
| Foreign Currencies and Forward Currency Contracts | 1,663 |
| Realized Net Gain (Loss) | 24,776 |
| Change in Unrealized Appreciation (Depreciation) | |
| Investment Securities | 1,167,967 |
| Futures Contracts | 808 |
| Foreign Currencies and Forward Currency Contracts | 2,593 |
| Change in Unrealized Appreciation (Depreciation) | 1,171,368 |
| Net Increase (Decrease) in Net Assets Resulting from Operations | 1,358,612 |
1 Dividends are net of foreign withholding taxes of $13,534,000.
2 Interest income from an affiliated company of the fund was $25,000.
See accompanying Notes, which are an integral part of the Financial Statements.
14
Developed Markets Index Fund
| | |
| Statement of Changes in Net Assets | | |
| |
| | Six Months Ended | Year Ended |
| | April 30, | October 31, |
| | 2011 | 2010 |
| | ($000) | ($000) |
| Increase (Decrease) in Net Assets | | |
| Operations | | |
| Net Investment Income | 162,468 | 250,410 |
| Realized Net Gain (Loss) | 24,776 | (52,379) |
| Change in Unrealized Appreciation (Depreciation) | 1,171,368 | 594,444 |
| Net Increase (Decrease) in Net Assets Resulting from Operations | 1,358,612 | 792,475 |
| Distributions | | |
| Net Investment Income | | |
| Investor Shares | (89,221) | (35,226) |
| Institutional Shares | (183,719) | — |
| Institutional Plus Shares | (22,195) | — |
| Realized Capital Gain | | |
| Investor Shares | — | — |
| Institutional Shares | — | — |
| Institutional Plus Shares | — | — |
| Total Distributions | (295,135) | (35,226) |
| Capital Share Transactions | | |
| Investor Shares | 107,843 | 15,292 |
| Institutional Shares | (2,129,562) | 6,411,271 |
| Institutional Plus Shares | 3,106,436 | — |
| Net Increase (Decrease) from Capital Share Transactions | 1,084,717 | 6,426,563 |
| Total Increase (Decrease) | 2,148,194 | 7,183,812 |
| Net Assets | | |
| Beginning of Period | 10,119,561 | 2,935,749 |
| End of Period1 | 12,267,755 | 10,119,561 |
| 1 Net Assets—End of Period includes undistributed net investment income of $93,672,000 and $224,910,000. | |
See accompanying Notes, which are an integral part of the Financial Statements.
15
Developed Markets Index Fund
Financial Highlights
| | | | | | |
| Investor Shares | | | | | | |
| Six Months | | | | | |
| | Ended | | | | | |
| For a Share Outstanding | April 30, | | | Year Ended October 31, |
| Throughout Each Period | 2011 | 2010 | 2009 | 2008 | 2007 | 2006 |
| Net Asset Value, Beginning of Period | $10.06 | $9.26 | $7.79 | $14.91 | $12.15 | $9.75 |
| Investment Operations | | | | | | |
| Net Investment Income | .143 | .2651 | .4522 | .3691 | .305 | .219 |
| Net Realized and Unrealized Gain (Loss) | | | | | | |
| on Investments | 1.108 | .644 | 1.416 | (7.097) | 2.759 | 2.400 |
| Total from Investment Operations | 1.251 | .909 | 1.868 | (6.728) | 3.064 | 2.619 |
| Distributions | | | | | | |
| Dividends from Net Investment Income | (.281) | (.109) | (.398) | (.387) | (.299) | (.219) |
| Distributions from Realized Capital Gains | — | — | — | (.005) | (.005) | — |
| Total Distributions | (.281) | (.109) | (.398) | (.392) | (.304) | (.219) |
| Net Asset Value, End of Period | $11.03 | $10.06 | $9.26 | $7.79 | $14.91 | $12.15 |
| |
| Total Return3 | 12.73% | 9.87% | 25.23% | -46.24% | 25.67% | 27.27% |
| |
| Ratios/Supplemental Data | | | | | | |
| Net Assets, End of Period (Millions) | $3,625 | $3,198 | $2,936 | $2,299 | $3,976 | $2,572 |
| Ratio of Total Expenses to | | | | | | |
| Average Net Assets | 0.21% | 0.22% | 0.10% | — | — | — |
| Acquired Fund Fees and Expenses | — | — | 0.15% | 0.22% | 0.22% | 0.27% |
| Ratio of Net Investment Income to | | | | | | |
| Average Net Assets | 2.91% | 3.09% | 5.93%2 | 3.04% | 2.05% | 1.82% |
| Portfolio Turnover Rate | 5% | 13% | 14%4 | 13% | 7% | 9% |
The expense ratio, net income ratio, and turnover rate for the current period have been annualized.
1 Calculated based on average shares outstanding.
2 Net investment income per share and the ratio of net investment income to average net assets include $.400 and 5.19%, respectively, of annual dividends received from Vanguard mutual funds in December 2008. Effective in June 2009, the fund’s equity investments are solely in common stocks.
3 Total returns do not include transaction or account service fees that may have applied in the periods shown. Fund prospectuses provide information about any applicable transaction and account service fees.
4 Excludes the value of securities received and mutual fund shares delivered in connection with a change in the fund’s investment policy to invest directly in individual stocks and reduce the fund’s investment in Vanguard mutual funds.
See accompanying Notes, which are an integral part of the Financial Statements.
16
Developed Markets Index Fund
Financial Highlights
| | |
| Institutional Shares | | |
| | Six Months | Jan. 22, |
| | Ended | 20101 to |
| | April 30, | Oct. 31, |
| For a Share Outstanding Throughout Each Period | 2011 | 2010 |
| Net Asset Value, Beginning of Period | $9.99 | $9.28 |
| Investment Operations | | |
| Net Investment Income | .149 | .2422 |
| Net Realized and Unrealized Gain (Loss) on Investments | 1.102 | .468 |
| Total from Investment Operations | 1.251 | .710 |
| Distributions | | |
| Dividends from Net Investment Income | (.291) | — |
| Distributions from Realized Capital Gains | — | — |
| Total Distributions | (.291) | — |
| Net Asset Value, End of Period | $10.95 | $9.99 |
| |
| Total Return3 | 12.83% | 7.65% |
| |
| Ratios/Supplemental Data | | |
| Net Assets, End of Period (Millions) | $5,289 | $6,922 |
| Ratio of Total Expenses to Average Net Assets | 0.08% | 0.07%4 |
| Ratio of Net Investment Income to Average Net Assets | 3.04% | 3.24%4 |
| Portfolio Turnover Rate | 5% | 13% |
The expense ratio, net income ratio, and turnover rate for the current period have been annualized.
1 Inception. See Note H in Notes to Financial Statements.
2 Calculated based on average shares outstanding.
3 Total returns do not include transaction fees that may have applied in the periods shown. Fund prospectuses provide information about any applicable transaction fees.
4 Annualized.
See accompanying Notes, which are an integral part of the Financial Statements.
17
Developed Markets Index Fund
| |
| Institutional Plus Shares | |
| | December 2, 20101 to |
| For a Share Outstanding Throughout the Period | April 30, 2011 |
| Net Asset Value, Beginning of Period | $103.47 |
| Investment Operations | |
| Net Investment Income | 1.240 |
| Net Realized and Unrealized Gain (Loss) on Investments | 12.377 |
| Total from Investment Operations | 13.617 |
| Distributions | |
| Dividends from Net Investment Income | (3.027) |
| Distributions from Realized Capital Gains | — |
| Total Distributions | (3.027) |
| Net Asset Value, End of Period | $114.06 |
| |
| Total Return2 | 13.47% |
| |
| Ratios/Supplemental Data | |
| Net Assets, End of Period (Millions) | $3,354 |
| Ratio of Total Expenses to Average Net Assets | 0.06% |
| Ratio of Net Investment Income to Average Net Assets | 3.06% |
| Portfolio Turnover Rate | 5% |
The expense ratio, net income ratio, and turnover rate for the current period have been annualized.
1 Inception.
2 Total returns do not include transaction fees that may have applied in the period shown. Fund prospectuses provide information about any applicable transaction fees.
See accompanying Notes, which are an integral part of the Financial Statements.
18
Developed Markets Index Fund
Notes to Financial Statements
Vanguard Developed Markets Index Fund is registered under the Investment Company Act of 1940 as an open-end investment company, or mutual fund. The fund invests in securities of foreign issuers, which may subject it to investment risks not normally associated with investing in securities of U.S. corporations. The fund offers three classes of shares: Investor Shares, Institutional Shares, and Institutional Plus Shares. Investor Shares are available to any investor who meets the fund’s minimum purchase requirements. Institutional Shares and Institutional Plus Shares are designed for investors who meet certain administrative, service, and account-size criteria. Institutional Plus Shares were first issued on December 2, 2010.
A. The following significant accounting policies conform to generally accepted accounting principles for U.S. mutual funds. The fund consistently follows such policies in preparing its financial statements.
1. Security Valuation: Securities are valued as of the close of trading on the New York Stock Exchange (generally 4 p.m., Eastern time) on the valuation date. Equity securities are valued at the latest quoted sales prices or official closing prices taken from the primary market in which each security trades; such securities not traded on the valuation date are valued at the mean of the latest quoted bid and asked prices. Securities for which market quotations are not readily available, or whose values have been affected by events occurring before the fund’s pricing time but after the close of the securities’ primary markets, are valued at their fair values calculated according to procedures adopted by the board of trustees. These procedures include obtaining quotations from an independent pricing service, monitoring news to identify significant market- or security-specific events, and evaluating changes in the values of foreign market proxies (for example, ADRs, futures contracts, or exchange-traded funds), between the time the foreign markets close and the fund’s pricing time. When fair-value pricing is employed, the prices of securities used by a fund to calculate its net asset value may differ from quoted or published prices for the same securities. Investments in Vanguard Market Liquidity Fund are valued at that fund’s net asset value. Temporary cash investments acquired over 60 days to maturity are valued using the latest bid prices or using valuations based on a matrix system (which considers such factors as security prices, yields, maturities, and ratings), both as furnished by independent pricing services. Other temporary cash investments are valued at amortized cost, which approximates market value.
2. Foreign Currency: Securities and other assets and liabilities denominated in foreign currencies are translated into U.S. dollars using exchange rates obtained from an independent third party as of the fund’s pricing time on the valuation date. Realized gains (losses) and unrealized appreciation (depreciation) on investment securities include the effects of changes in exchange rates since the securities were purchased, combined with the effects of changes in security prices. Fluctuations in the value of other assets and liabilities resulting from changes in exchange rates are recorded as unrealized foreign currency gains (losses) until the assets or liabilities are settled in cash, at which time they are recorded as realized foreign currency gains (losses).
3. Futures and Forward Currency Contracts: The fund uses index futures contracts to a limited extent, with the objectives of maintaining full exposure to the stock market, enhancing returns, maintaining liquidity, and minimizing transaction costs. The fund may purchase futures contracts to immediately invest incoming cash in the market, or sell futures in response to cash outflows, thereby simulating a fully invested position in the underlying index while maintaining a cash balance for liquidity. The fund may seek to enhance returns by using futures contracts instead of the underlying securities when futures are believed to be priced more attractively than the underlying securities. The primary risks associated with the use of futures contracts are imperfect correlation between changes in market values of stocks held by the fund and the prices of futures contracts, and the possibility of an illiquid market.
19
Developed Markets Index Fund
The fund also enters into forward currency contracts to provide the appropriate currency exposure related to any open futures contracts. The fund’s risks in using these contracts include movement in the values of the foreign currencies relative to the U.S. dollar and the ability of the counterparties to fulfill their obligations under the contracts. Counterparty risk is mitigated by entering into forward currency contracts only with highly rated counterparties, by a master netting arrangement between the fund and the counterparty, and by the posting of collateral by the counterparty. The forward currency contracts contain provisions whereby a counterparty may terminate open contracts if the fund’s net assets decline below a certain level, triggering a payment by the fund if the fund is in a net liability position at the time of the termination. The payment amount would be reduced by any collateral the fund has posted. Any securities posted as collateral for open contracts are noted in the Statement of Net Assets.
Futures contracts are valued at their quoted daily settlement prices. Forward currency contracts are valued at their quoted daily prices obtained from an independent third party, adjusted for currency risk based on the expiration date of each contract. The aggregate principal amounts of the contracts are not recorded in the Statement of Net Assets. Fluctuations in the value of the contracts are recorded in the Statement of Net Assets as an asset (liability) and in the Statement of Operations as unrealized appreciation (depreciation) until the contracts are closed, when they are recorded as realized gains (losses) on futures or forward currency contracts.
4. Federal Income Taxes: The fund intends to continue to qualify as a regulated investment company and distribute all of its taxable income. Management has analyzed the fund’s tax positions taken for all open federal income tax years (October 31, 2007–2010), and for the period ended April 30, 2011, and has concluded that no provision for federal income tax is required in the fund’s financial statements.
5. Distributions: Distributions to shareholders are recorded on the ex-dividend date.
6. Security Lending: The fund may lend its securities to qualified institutional borrowers to earn additional income. Security loans are required to be secured at all times by collateral at least equal to the market value of securities loaned. The fund invests cash collateral received in Vanguard Market Liquidity Fund, and records a liability for the return of the collateral, during the period the securities are on loan. Security lending income represents fees charged to borrowers plus income earned on investing cash collateral, less expenses associated with the loan.
7. Other: Dividend income is recorded on the ex-dividend date. Interest income includes income distributions received from Vanguard Market Liquidity Fund and is accrued daily. Security transactions are accounted for on the date securities are bought or sold. Costs used to determine realized gains (losses) on the sale of investment securities are those of the specific securities sold. Fees assessed on redemptions of capital shares are credited to paid-in capital.
Each class of shares has equal rights as to assets and earnings, except that each class separately bears certain class-specific expenses related to maintenance of shareholder accounts (included in Management and Administrative expenses) and shareholder reporting. Marketing and distribution expenses are allocated to each class of shares based on a method approved by the board of trustees. Income, other non-class-specific expenses, and gains and losses on investments are allocated to each class of shares based on its relative net assets.
B. The Vanguard Group furnishes at cost investment advisory, corporate management, administrative, marketing, and distribution services. The costs of such services are allocated to the fund under methods approved by the board of trustees. The fund has committed to provide up to 0.40% of its net assets in
20
Developed Markets Index Fund
capital contributions to Vanguard. At April 30, 2011, the fund had contributed capital of $1,819,000 to Vanguard (included in Other Assets), representing 0.01% of the fund’s net assets and 0.73% of Vanguard’s capitalization. The fund’s trustees and officers are also directors and officers of Vanguard.
C. Various inputs may be used to determine the value of the fund’s investments. These inputs are summarized in three broad levels for financial statement purposes. The inputs or methodologies used to value securities are not necessarily an indication of the risk associated with investing in those securities.
Level 1—Quoted prices in active markets for identical securities.
Level 2—Other significant observable inputs (including quoted prices for similar securities, interest rates, prepayment speeds, credit risk, etc.).
Level 3—Significant unobservable inputs (including the fund’s own assumptions used to determine the fair value of investments).
The following table summarizes the fund’s investments as of April 30, 2011, based on the inputs used to value them:
| | | |
| | Level 1 | Level 2 | Level 3 |
| Investments | ($000) | ($000) | ($000) |
| Common Stocks | 20,411 | 12,151,218 | — |
| Temporary Cash Investments | 597,218 | 3,249 | — |
| Futures Contracts—Liabilities1 | (88) | — | — |
| Forward Currency Contracts—Assets | — | 1,846 | — |
| Forward Currency Contracts—Liabilities | — | (5) | — |
| Total | 617,541 | 12,156,308 | — |
| 1 Represents variation margin on the last day of the reporting period. | | | |
D. At April 30, 2011, the fair values of derivatives were reflected in the Statement of Net Assets as follows:
| | | |
| | | Foreign | |
| | Equity | Exchange | |
| | Contracts1 | Contracts | Total |
| Statement of Net Assets Caption | ($000) | ($000) | ($000) |
| Other Assets | — | 1,846 | 1,846 |
| Liabilities | (88) | (5) | (93) |
| 1 Represents variation margin on the last day of the reporting period. | | | |
21
Developed Markets Index Fund
Realized net gain (loss) and the change in unrealized appreciation (depreciation) on derivatives for the six months ended April 30, 2011, were:
| | | |
| | | Foreign | |
| | Equity | Exchange | |
| | Contracts | Contracts | Total |
| Realized Net Gain (Loss) on Derivatives | ($000) | ($000) | ($000) |
| Futures Contracts | 914 | — | 914 |
| Forward Currency Contracts | — | 264 | 264 |
| Realized Net Gain (Loss) on Derivatives | 914 | 264 | 1,178 |
| |
| Change in Unrealized Appreciation (Depreciation) on Derivatives | | | |
| Futures Contracts | 808 | — | 808 |
| Forward Currency Contracts | — | 1,771 | 1,771 |
| Change in Unrealized Appreciation (Depreciation) on Derivatives | 808 | 1,771 | 2,579 |
At April 30, 2011, the aggregate settlement value of open futures contracts and the related unrealized appreciation (depreciation) were:
| | | | |
| | | | | ($000) |
| | | | Aggregate | |
| | | Number of | Settlement | Unrealized |
| | | Long (Short) | Value | Appreciation |
| Futures Contracts | Expiration | Contracts | Long (Short) | (Depreciation) |
| Topix Index | June 2011 | 142 | 14,937 | (753) |
| Dow Jones EURO STOXX 50 Index | June 2011 | 340 | 14,865 | 695 |
| FTSE 100 Index | June 2011 | 101 | 10,163 | 421 |
| S&P ASX 200 Index | June 2011 | 66 | 8,682 | 236 |
Unrealized appreciation (depreciation) on open FTSE 100 Index futures contracts is required to be treated as realized gain (loss) for tax purposes.
22
Developed Markets Index Fund
At April 30, 2011, the fund had open forward currency contracts to receive and deliver currencies as follows. Unrealized appreciation (depreciation) on open forward currency contracts is treated as realized gain (loss) for tax purposes.
| | | | | | |
| | | | | | | Unrealized |
| | Contract | | | | | Appreciation |
| | Settlement | | | Contract Amount (000) | (Depreciation) |
| Counterparty | Date | | Receive | | Deliver | ($000) |
| UBS AG | 6/22/11 | EUR | 9,551 | USD | 14,149 | 821 |
| UBS AG | 6/22/11 | GBP | 5,841 | USD | 9,735 | 296 |
| UBS AG | 6/22/11 | AUD | 7,718 | USD | 8,387 | 729 |
| UBS AG | 6/15/11 | USD | 351 | JPY | 28,510 | (5) |
| AUD—Australian dollar. | | | | | | |
| EUR—Euro. | | | | | | |
| GBP—British pound. | | | | | | |
| JPY—Japanese yen. | | | | | | |
| USD—U.S. dollar. | | | | | | |
At April 30, 2011, the counterparty had deposited in a segregated account securities with a value sufficient to cover substantially all amounts due to the fund in connection with open forward currency contracts.
E. Distributions are determined on a tax basis and may differ from net investment income and realized capital gains for financial reporting purposes. Differences may be permanent or temporary. Permanent differences are reclassified among capital accounts in the financial statements to reflect their tax character. Temporary differences arise when certain items of income, expense, gain, or loss are recognized in different periods for financial statement and tax purposes; these differences will reverse at some time in the future. Differences in classification may also result from the treatment of short-term gains as ordinary income for tax purposes.
During the six months ended April 30, 2011, the fund realized net foreign currency gains of $1,399,000, which increased distributable net income for tax purposes; accordingly, such gains have been reclassified from accumulated net realized losses to undistributed net investment income. Certain of the fund’s investments are in securities considered to be “passive foreign investment companies,” for which any unrealized appreciation and/or realized gains are required to be included in distributable net income for tax purposes. During the six months ended April 30, 2011, the fund realized gains on the sale of passive foreign investment companies of $30,000, which have been included in current and prior periods’ taxable income; accordingly, such gains have been reclassified from accumulated net realized losses to undistributed net investment income. Unrealized appreciation through the most recent mark-to-market date for tax purposes on passive foreign investment company holdings at April 30, 2011, was $25,408,000, all of which has been distributed and is reflected in the balance of undistributed net investment income.
The fund’s tax-basis capital gains and losses are determined only at the end of each fiscal year. For tax purposes, at October 31, 2010, the fund had available capital loss carryforwards totaling $1,898,814,000 to offset future net capital gains of $1,279,156,000 through October 31, 2016, $585,420,000 through October 31, 2017, and $34,238,000 through October 31, 2018. The fund will use these capital losses to offset net taxable capital gains, if any, realized during the year ending October 31, 2011; should the fund realize net capital losses for the year, the losses will be added to the loss carryforward balance above.
23
Developed Markets Index Fund
At April 30, 2011, the cost of investment securities for tax purposes was $9,805,260,000. Net unrealized appreciation of investment securities for tax purposes was $2,966,836,000, consisting of unrealized gains of $3,196,761,000 on securities that had risen in value since their purchase and $229,925,000 in unrealized losses on securities that had fallen in value since their purchase.
F. During the six months ended April 30, 2011, the fund purchased $1,161,338,000 of investment securities and sold $268,416,000 of investment securities, other than temporary cash investments.
G. Capital share transactions for each class of shares were:
| | | | |
| | Six Months Ended | | Year Ended |
| | | April 30, 2011 | October 31, 2010 |
| | Amount | Shares | Amount | Shares |
| | ($000) | (000) | ($000) | (000) |
| Investor Shares | | | | |
| Issued | 455,305 | 44,217 | 891,318 | 95,563 |
| Issued in Lieu of Cash Distributions | 81,158 | 8,140 | 32,170 | 3,355 |
| Redeemed1 | (428,620) | (41,725) | (908,196) | (97,962) |
| Net Increase (Decrease)—Investor Shares | 107,843 | 10,632 | 15,292 | 956 |
| Institutional Shares2 | | | | |
| Issued | 1,079,300 | 106,931 | 1,992,336 | 220,254 |
| Issued in Connection with Acquisition of Vanguard | | | | |
| Institutional Developed Markets Index Fund | — | — | 5,729,120 | 617,209 |
| Issued in Lieu of Cash Distributions | 149,659 | 15,132 | — | — |
| Redeemed1 | (3,358,521) | (331,957) | (1,310,185) | (144,380) |
| Net Increase (Decrease)—Institutional Shares | (2,129,562) | (209,894) | 6,411,271 | 693,083 |
| Institutional Plus Shares2 | | | | |
| Issued | 3,146,647 | 29,768 | — | — |
| Issued in Lieu of Cash Distributions | 17,522 | 170 | — | — |
| Redeemed1 | (57,733) | (530) | — | — |
| Net Increase (Decrease)—Institutional Plus Shares | 3,106,436 | 29,408 | — | — |
| 1 Net of redemption fees for fiscal 2011 and 2010 of $294,000 and $136,000, respectively (fund totals). | | |
| 2 Inception was January 22, 2010, for Institutional Shares and December 2, 2010, for Institutional Plus Shares. | |
H. On January 22, 2010, the fund acquired all the net assets of Vanguard Institutional Developed Markets Index Fund pursuant to a plan of reorganization approved by the funds’ board of trustees. The acquisition was accomplished by a tax-free exchange of 617,209,000 Institutional Shares of the fund for 617,209,000 shares of the Institutional Developed Markets Index Fund outstanding as of the close of business on January 22, 2010. The Institutional Developed Markets Index Fund’s net assets as of the close of business on January 22, 2010, of $5,729,120,000, including $822,409,000 of unrealized appreciation, were combined with the fund’s net assets. The net assets of the fund immediately before the acquisition were $3,143,852,000. The net assets of the fund immediately following the acquisition were $8,872,972,000.
I. In preparing the financial statements as of April 30, 2011, management considered the impact of subsequent events for potential recognition or disclosure in these financial statements.
24
About Your Fund’s Expenses
As a shareholder of the fund, you incur ongoing costs, which include costs for portfolio management, administrative services, and shareholder reports (like this one), among others. Operating expenses, which are deducted from a fund’s gross income, directly reduce the investment return of the fund.
A fund’s expenses are expressed as a percentage of its average net assets. This figure is known as the expense ratio. The following examples are intended to help you understand the ongoing costs (in dollars) of investing in your fund and to compare these costs with those of other mutual funds. The examples are based on an investment of $1,000 made at the beginning of the period shown and held for the entire period.
The accompanying table illustrates your fund’s costs in two ways:
• Based on actual fund return. This section helps you to estimate the actual expenses that you paid over the period. The ”Ending Account Value“ shown is derived from the fund‘s actual return, and the third column shows the dollar amount that would have been paid by an investor who started with $1,000 in the fund. You may use the information here, together with the amount you invested, to estimate the expenses that you paid over the period.
To do so, simply divide your account value by $1,000 (for example, an $8,600 account value divided by $1,000 = 8.6), then multiply the result by the number given for your fund under the heading ”Expenses Paid During Period.“
• Based on hypothetical 5% yearly return. This section is intended to help you compare your fund‘s costs with those of other mutual funds. It assumes that the fund had a yearly return of 5% before expenses, but that the expense ratio is unchanged. In this case—because the return used is not the fund’s actual return—the results do not apply to your investment. The example is useful in making comparisons because the Securities and Exchange Commission requires all mutual funds to calculate expenses based on a 5% return. You can assess your fund’s costs by comparing this hypothetical example with the hypothetical examples that appear in shareholder reports of other funds.
Note that the expenses shown in the table are meant to highlight and help you compare ongoing costs only and do not reflect transaction costs incurred by the fund for buying and selling securities. Further, the expenses do not include any purchase, redemption, or account service fees described in the fund prospectus. If such fees were applied to your account, your costs would be higher. Your fund does not carry a “sales load.”
The calculations assume no shares were bought or sold during the period. Your actual costs may have been higher or lower, depending on the amount of your investment and the timing of any purchases or redemptions.
You can find more information about the fund’s expenses, including annual expense ratios, in the Financial Statements section of this report. For additional information on operating expenses and other shareholder costs, please refer to your fund’s current prospectus.
25
| | | |
| Six Months Ended April 30, 2011 | | | |
| | Beginning | Ending | Expenses |
| | Account Value | Account Value | Paid During |
| Developed Markets Index Fund | 10/31/2010 | 4/30/2011 | Period |
| Based on Actual Fund Return | | | |
| Investor Shares | $1,000.00 | $1,127.32 | $1.11 |
| Institutional Shares | 1,000.00 | 1,128.35 | 0.42 |
| Based on Hypothetical 5% Yearly Return | | | |
| Investor Shares | $1,000.00 | $1,023.75 | $1.05 |
| Institutional Shares | 1,000.00 | 1,024.40 | 0.40 |
The calculations are based on expenses incurred in the most recent six-month period. The fund’s annualized six-month expense ratios for that period are 0.21% for Investor Shares and 0.08% for Institutional Shares. The dollar amounts shown as “Expenses Paid” are equal to the annualized expense ratio multiplied by the average account value over the period, multiplied by the number of days in the most recent six-month period, then divided by the number of days in the most recent 12-month period. This table does not include data for funds or share classes of funds with less than six months of history.
26
Trustees Approve Advisory Arrangement
The board of trustees of Vanguard Developed Markets Index Fund has renewed the fund’s investment advisory arrangement with The Vanguard Group, Inc. Vanguard—through its Quantitative Equity Group—serves as the investment advisor for the fund. The board determined that continuing the fund’s internalized management structure was in the best interests of the fund and its shareholders.
The board based its decision upon an evaluation of the advisor’s investment staff, portfolio management process, and performance. The trustees considered the factors discussed below, among others. However, no single factor determined whether the board approved the arrangement. Rather, it was the totality of the circumstances that drove the board’s decision.
Nature, extent, and quality of services
The board considered the quality of the fund’s investment management since the fund began investing directly in stocks in 2009, and took into account the organizational depth and stability of the advisor. Vanguard has been managing investments for more than three decades. The Quantitative Equity Group adheres to a sound, disciplined investment management process; the team has considerable experience, stability, and depth.
The board concluded that Vanguard’s experience, stability, depth, and performance, among other factors, warranted continuation of the advisory arrangement.
Investment performance
The board considered the fund’s performance since 2009, including any periods of outperformance or underperformance of its target index and peer group. The board concluded that the fund has performed in line with expectations, and that the results have been consistent with the fund’s investment strategy. Information about the fund’s most recent performance can be found in the Performance Summary section of this report.
Cost
The board concluded that the fund’s expense ratio was well below the average expense ratio charged by funds in its peer group and that the fund’s advisory expense fee rate was also well below its peer-group average. Information about the fund’s expenses appears in the About Your Fund’s Expenses section of this report as well as in the Financial Statements section.
The board does not conduct a profitability analysis of Vanguard, because of Vanguard’s unique “at-cost” structure. Unlike most other mutual fund management companies, Vanguard is owned by the funds it oversees, and produces “profits” only in the form of reduced expenses for fund shareholders.
The benefit of economies of scale
The board concluded that the fund’s low-cost arrangement with Vanguard ensures that the fund will realize economies of scale as it grows, with the cost to shareholders declining as the fund’s assets increase.
The board will consider whether to renew the advisory arrangement again after a one-year period.
27
Glossary
Beta. A measure of the magnitude of a fund’s past share-price fluctuations in relation to the ups and downs of a given market index. The index is assigned a beta of 1.00. Compared with a given index, a fund with a beta of 1.20 typically would have seen its share price rise or fall by 12% when the index rose or fell by 10%. For this report, beta is based on returns over the past 36 months for both the fund and the index. Note that a fund’s beta should be reviewed in conjunction with its R-squared (see definition). The lower the R-squared, the less correlation there is between the fund and the index, and the less reliable beta is as an indicator of volatility.
Dividend Yield. Dividend income earned by stocks, expressed as a percentage of the aggregate market value (or of net asset value, for a fund). The yield is determined by dividing the amount of the annual dividends by the aggregate value (or net asset value) at the end of the period. For a fund, the dividend yield is based solely on stock holdings and does not include any income produced by other investments.
Earnings Growth Rate. The average annual rate of growth in earnings over the past five years for the stocks now in a fund.
Equity Exposure. A measure that reflects a fund’s investments in stocks and stock futures. Any holdings in short-term reserves are excluded.
Expense Ratio. The percentage of a fund’s average net assets used to pay its annual administrative and advisory expenses. These expenses directly reduce returns to investors.
Inception Date. The date on which the assets of a fund (or one of its share classes) are first invested in accordance with the fund’s investment objective. For funds with a subscription period, the inception date is the day after that period ends. Investment performance is measured from the inception date.
Median Market Cap. An indicator of the size of companies in which a fund invests; the midpoint of market capitalization (market price x shares outstanding) of a fund’s stocks, weighted by the proportion of the fund’s assets invested in each stock. Stocks representing half of the fund’s assets have market capitalizations above the median, and the rest are below it.
Price/Book Ratio. The share price of a stock divided by its net worth, or book value, per share. For a fund, the weighted average price/book ratio of the stocks it holds.
Price/Earnings Ratio. The ratio of a stock’s current price to its per-share earnings over the past year. For a fund, the weighted average P/E of the stocks it holds. P/E is an indicator of market expectations about corporate prospects; the higher the P/E, the greater the expectations for a company’s future growth.
R-Squared. A measure of how much of a fund’s past returns can be explained by the returns from the market in general, as measured by a given index. If a fund’s total returns were precisely synchronized with an index’s returns, its R-squared would be 1.00. If the fund’s returns bore no relationship to the index’s returns, its R-squared would be 0. For this report, R-squared is based on returns over the past 36 months for both the fund and the index.
Return on Equity. The annual average rate of return generated by a company during the past five years for each dollar of shareholder’s equity (net income divided by shareholder’s equity). For a fund, the weighted average return on equity for the companies whose stocks it holds.
28
Short-Term Reserves. The percentage of a fund invested in highly liquid, short-term securities that can be readily converted to cash.
Turnover Rate. An indication of the fund’s trading activity. Funds with high turnover rates incur higher transaction costs and may be more likely to distribute capital gains (which may be taxable to investors). The turnover rate excludes in-kind transactions, which have minimal impact on costs.
29
This page intentionally left blank.
This page intentionally left blank.
The People Who Govern Your Fund
The trustees of your mutual fund are there to see that the fund is operated and managed in your best interests since, as a shareholder, you are a part owner of the fund. Your fund’s trustees also serve on the board of directors of The Vanguard Group, Inc., which is owned by the Vanguard funds and provides services to them on an at-cost basis.
A majority of Vanguard’s board members are independent, meaning that they have no affiliation with Vanguard or the funds they oversee, apart from the sizable personal investments they have made as private individuals. The independent board members have distinguished backgrounds in business, academia, and public service. Each of the trustees and executive officers oversees 179 Vanguard funds.
The following table provides information for each trustee and executive officer of the fund. More information about the trustees is in the Statement of Additional Information, which can be obtained, without charge, by contacting Vanguard at 800-662-7447, or online at vanguard.com.
| |
| Interested Trustee1 | and President (2006–2008) of Rohm and Haas Co. |
| | (chemicals); Director of Tyco International, Ltd. |
| F. William McNabb III | (diversified manufacturing and services) and Hewlett- |
| Born 1957. Trustee Since July 2009. Chairman of the | Packard Co. (electronic computer manufacturing); |
| Board. Principal Occupation(s) During the Past Five | Senior Advisor at New Mountain Capital; Trustee |
| Years: Chairman of the Board of The Vanguard Group, | of The Conference Board; Member of the Board of |
| Inc., and of each of the investment companies served | Managers of Delphi Automotive LLP (automotive |
| by The Vanguard Group, since January 2010; Director | components). |
| of The Vanguard Group since 2008; Chief Executive | |
| Officer and President of The Vanguard Group and of | Amy Gutmann |
| each of the investment companies served by The | Born 1949. Trustee Since June 2006. Principal |
| Vanguard Group since 2008; Director of Vanguard | Occupation(s) During the Past Five Years: President |
| Marketing Corporation; Managing Director of The | of the University of Pennsylvania; Christopher H. |
| Vanguard Group (1995–2008). | Browne Distinguished Professor of Political Science |
| | in the School of Arts and Sciences with secondary |
| | appointments at the Annenberg School for Commu- |
| Independent Trustees | nication and the Graduate School of Education |
| | of the University of Pennsylvania; Director of |
| Emerson U. Fullwood | Carnegie Corporation of New York, Schuylkill River |
| Born 1948. Trustee Since January 2008. Principal | Development Corporation, and Greater Philadelphia |
| Occupation(s) During the Past Five Years: Executive | Chamber of Commerce; Trustee of the National |
| Chief Staff and Marketing Officer for North America | Constitution Center; Chair of the Presidential |
| and Corporate Vice President (retired 2008) of Xerox | Commission for the Study of Bioethical Issues. |
| Corporation (document management products and | |
| services); Executive in Residence and 2010 | JoAnn Heffernan Heisen |
| Distinguished Minett Professor at the Rochester | Born 1950. Trustee Since July 1998. Principal |
| Institute of Technology; Director of SPX Corporation | Occupation(s) During the Past Five Years: Corporate |
| (multi-industry manufacturing), the United Way of | Vice President and Chief Global Diversity Officer |
| Rochester, Amerigroup Corporation (managed health | (retired 2008) and Member of the Executive |
| care), the University of Rochester Medical Center, | Committee (1997–2008) of Johnson & Johnson |
| Monroe Community College Foundation, and North | (pharmaceuticals/consumer products); Director of |
| Carolina A&T University. | Skytop Lodge Corporation (hotels), the University |
| | Medical Center at Princeton, the Robert Wood |
| Rajiv L. Gupta | Johnson Foundation, and the Center for Work Life |
| Born 1945. Trustee Since December 2001.2 | Policy; Member of the Advisory Board of the |
| Principal Occupation(s) During the Past Five Years: | Maxwell School of Citizenship and Public Affairs |
| Chairman and Chief Executive Officer (retired 2009) | at Syracuse University. |
| | |
| F. Joseph Loughrey | Thomas J. Higgins | |
| Born 1949. Trustee Since October 2009. Principal | Born 1957. Chief Financial Officer Since September |
| Occupation(s) During the Past Five Years: President | 2008. Principal Occupation(s) During the Past Five |
| and Chief Operating Officer (retired 2009) and Vice | Years: Principal of The Vanguard Group, Inc.; Chief |
| Chairman of the Board (2008–2009) of Cummins Inc. | Financial Officer of each of the investment companies |
| (industrial machinery); Director of SKF AB (industrial | served by The Vanguard Group since 2008; Treasurer |
| machinery), Hillenbrand, Inc. (specialized consumer | of each of the investment companies served by The |
| services), the Lumina Foundation for Education, and | Vanguard Group (1998–2008). |
| Oxfam America; Chairman of the Advisory Council | | |
| for the College of Arts and Letters and Member | Kathryn J. Hyatt | |
| of the Advisory Board to the Kellogg Institute for | Born 1955. Treasurer Since November 2008. Principal |
| International Studies at the University of Notre Dame. | Occupation(s) During the Past Five Years: Principal |
| | of The Vanguard Group, Inc.; Treasurer of each of |
| André F. Perold | the investment companies served by The Vanguard |
| Born 1952. Trustee Since December 2004. Principal | Group since 2008; Assistant Treasurer of each of the |
| Occupation(s) During the Past Five Years: George | investment companies served by The Vanguard Group |
| Gund Professor of Finance and Banking at the Harvard | (1988–2008). | |
| Business School; Chair of the Investment Committee | | |
| of HighVista Strategies LLC (private investment firm). | Heidi Stam | |
| | Born 1956. Secretary Since July 2005. Principal |
| Alfred M. Rankin, Jr. | Occupation(s) During the Past Five Years: Managing |
| Born 1941. Trustee Since January 1993. Principal | Director of The Vanguard Group, Inc., since 2006; |
| Occupation(s) During the Past Five Years: Chairman, | General Counsel of The Vanguard Group since 2005; |
| President, and Chief Executive Officer of NACCO | Secretary of The Vanguard Group and of each of the |
| Industries, Inc. (forklift trucks/housewares/lignite); | investment companies served by The Vanguard Group |
| Director of Goodrich Corporation (industrial products/ | since 2005; Director and Senior Vice President of |
| aircraft systems and services) and the National | Vanguard Marketing Corporation since 2005; |
| Association of Manufacturers; Chairman of the | Principal of The Vanguard Group (1997–2006). |
| Federal Reserve Bank of Cleveland; Vice Chairman | | |
| of University Hospitals of Cleveland; President of | | |
| the Board of The Cleveland Museum of Art. | Vanguard Senior Management Team |
| |
| Peter F. Volanakis | R. Gregory Barton | Michael S. Miller |
| Born 1955. Trustee Since July 2009. Principal | Mortimer J. Buckley | James M. Norris |
| Occupation(s) During the Past Five Years: President | Kathleen C. Gubanich | Glenn W. Reed |
| and Chief Operating Officer (retired 2010) of Corning | Paul A. Heller | George U. Sauter |
| Incorporated (communications equipment); Director of | Martha G. King | |
| Corning Incorporated (2000–2010) and Dow Corning | | |
| (2001–2010); Overseer of the Amos Tuck School of | | |
| Business Administration at Dartmouth College. | Chairman Emeritus and Senior Advisor |
| |
| | John J. Brennan | |
| Executive Officers | Chairman, 1996–2009 | |
| | Chief Executive Officer and President, 1996–2008 |
| Glenn Booraem | | |
| Born 1967. Controller Since July 2010. Principal | | |
| Occupation(s) During the Past Five Years: Principal | Founder | |
| of The Vanguard Group, Inc.; Controller of each of | | |
| the investment companies served by The Vanguard | John C. Bogle | |
| Group since 2010; Assistant Controller of each of | Chairman and Chief Executive Officer, 1974–1996 |
| the investment companies served by The Vanguard | | |
| Group (2001–2010). | | |
1 Mr. McNabb is considered an “interested person,” as defined in the Investment Company Act of 1940, because he is an officer of the Vanguard funds.
2 December 2002 for Vanguard Equity Income Fund, Vanguard Growth Equity Fund, the Vanguard Municipal Bond Funds, and the Vanguard State Tax-Exempt Funds.
|  |
| P.O. Box 2600 |
| Valley Forge, PA 19482-2600 |
Connect with Vanguard® > vanguard.com
| The funds or securities referred to herein are not |
| Fund Information > 800-662-7447 | sponsored, endorsed, or promoted by MSCI, and MSCI |
| Direct Investor Account Services > 800-662-2739 | bears no liability with respect to any such funds or |
| Institutional Investor Services > 800-523-1036 | securities. For any such funds or securities, the |
| Text Telephone for People | prospectus or the Statement of Additional Information |
| With Hearing Impairment > 800-749-7273 | contains a more detailed description of the limited |
| | relationship MSCI has with The Vanguard Group and |
| This material may be used in conjunction | any related funds. |
| with the offering of shares of any Vanguard | |
| fund only if preceded or accompanied by | |
| the fund’s current prospectus. | |
| |
| All comparative mutual fund data are from Lipper Inc. or | |
| Morningstar, Inc., unless otherwise noted. | |
| |
| You can obtain a free copy of Vanguard’s proxy voting | |
| guidelines by visiting vanguard.com/proxyreporting or by | |
| calling Vanguard at 800-662-2739. The guidelines are | |
| also available from the SEC’s website, sec.gov. In | |
| addition, you may obtain a free report on how your fund | |
| voted the proxies for securities it owned during the 12 | |
| months ended June 30. To get the report, visit either | |
| vanguard.com/proxyreporting or sec.gov. | |
| |
| You can review and copy information about your fund at | |
| the SEC’s Public Reference Room in Washington, D.C. To | |
| find out more about this public service, call the SEC at | |
| 202-551-8090. Information about your fund is also | |
| available on the SEC’s website, and you can receive | |
| copies of this information, for a fee, by sending a | |
| request in either of two ways: via e-mail addressed to | |
| publicinfo@sec.gov or via regular mail addressed to the | |
| Public Reference Section, Securities and Exchange | |
| Commission, Washington, DC 20549-1520. | |
| | © 2011 The Vanguard Group, Inc. |
| | All rights reserved. |
| | Vanguard Marketing Corporation, Distributor. |
| |
| | Q2272 062011 |
| | | |
| Vanguard® Developed Markets Index Fund | | |
| Schedule of Investments | | |
| April 30, 2011 | | |
| | | | Market |
| | | | Value |
| | | Shares | ($000) |
| Common Stocks (99.2%)1 | | |
| Australia (8.7%) | | |
| | BHP Billiton Ltd. | 3,230,877 | 163,579 |
| | Commonwealth Bank of Australia | 1,558,257 | 91,989 |
| | Westpac Banking Corp. | 3,007,837 | 82,115 |
| | Australia & New Zealand Banking Group Ltd. | 2,576,872 | 68,641 |
| | National Australia Bank Ltd. | 2,150,591 | 64,029 |
| | Rio Tinto Ltd. | 438,405 | 39,687 |
| | Wesfarmers Ltd. | 1,011,287 | 37,047 |
| | Woolworths Ltd. | 1,219,838 | 35,499 |
| | Newcrest Mining Ltd. | 757,863 | 34,517 |
| | Woodside Petroleum Ltd. | 627,903 | 32,289 |
| | Westfield Group | 2,205,746 | 21,858 |
| | QBE Insurance Group Ltd. | 1,058,029 | 21,736 |
| | CSL Ltd. | 551,325 | 20,805 |
| | Origin Energy Ltd. | 1,067,988 | 19,159 |
| | AMP Ltd. | 2,833,797 | 17,046 |
| | Telstra Corp. Ltd. | 4,381,762 | 13,996 |
| | Santos Ltd. | 840,260 | 13,964 |
| | Macquarie Group Ltd. | 348,004 | 13,454 |
| | Foster's Group Ltd. | 1,942,696 | 11,990 |
| | Suncorp Group Ltd. | 1,289,261 | 11,797 |
| | Brambles Ltd. | 1,443,285 | 10,689 |
| | Orica Ltd. | 364,329 | 10,644 |
| | Stockland | 2,397,725 | 9,955 |
| | Amcor Ltd. | 1,232,241 | 9,472 |
| | Fortescue Metals Group Ltd. | 1,252,566 | 8,490 |
| | Westfield Retail Trust | 2,904,600 | 8,437 |
| | Insurance Australia Group Ltd. | 2,091,896 | 8,202 |
| | Transurban Group | 1,305,203 | 7,596 |
| | Coca-Cola Amatil Ltd. | 570,516 | 7,478 |
| | AGL Energy Ltd. | 461,069 | 7,358 |
| | Incitec Pivot Ltd. | 1,638,842 | 6,783 |
| * | QR National Ltd. | 1,711,349 | 6,449 |
| | WorleyParsons Ltd. | 192,390 | 6,425 |
| | ASX Ltd. | 176,871 | 6,237 |
| | GPT Group | 1,780,188 | 6,184 |
| | Alumina Ltd. | 2,444,913 | 6,123 |
| | TABCORP Holdings Ltd. | 687,817 | 5,766 |
| | Wesfarmers Ltd. Price Protected Shares | 153,405 | 5,672 |
| | Asciano Ltd. | 2,954,993 | 5,365 |
| | OZ Minerals Ltd. | 3,270,517 | 5,191 |
| | Lend Lease Group | 542,579 | 5,189 |
| | Sonic Healthcare Ltd. | 369,669 | 5,085 |
| | Cochlear Ltd. | 57,225 | 5,059 |
| | Goodman Group | 6,385,115 | 4,981 |
| | Mirvac Group | 3,418,923 | 4,771 |
| | Computershare Ltd. | 446,029 | 4,746 |
| | Dexus Property Group | 4,851,450 | 4,692 |
| | Crown Ltd. | 454,903 | 4,220 |
| | CFS Retail Property Trust | 2,140,007 | 4,201 |
| | Toll Holdings Ltd. | 672,628 | 4,164 |
| ^ | Leighton Holdings Ltd. | 150,952 | 4,022 |
| | Boral Ltd. | 725,517 | 3,919 |
| | Bendigo and Adelaide Bank Ltd. | 368,398 | 3,781 |
| | BlueScope Steel Ltd. | 1,863,617 | 3,550 |
| | Metcash Ltd. | 771,993 | 3,439 |
| | Tatts Group Ltd. | 1,305,829 | 3,326 |
| | OneSteel Ltd. | 1,351,511 | 3,168 |
| | Sims Metal Management Ltd. | 164,737 | 3,162 |
| ^ | Fairfax Media Ltd. | 2,142,204 | 3,108 |
| * | James Hardie Industries SE | 437,172 | 2,842 |
| | Ramsay Health Care Ltd. | 131,810 | 2,615 |
1
| | | |
| Vanguard® Developed Markets Index Fund | | |
| Schedule of Investments | | |
| April 30, 2011 | | |
| |
| | | | Market |
| | | | Value |
| | | Shares | ($000) |
| * | Qantas Airways Ltd. | 1,110,460 | 2,574 |
| * | Paladin Energy Ltd. | 698,483 | 2,524 |
| | MacArthur Coal Ltd. | 179,473 | 2,291 |
| | Caltex Australia Ltd. | 135,809 | 2,117 |
| | CSR Ltd. | 507,980 | 1,675 |
| | Goodman Fielder Ltd. | 1,392,634 | 1,644 |
| | Harvey Norman Holdings Ltd. | 536,314 | 1,580 |
| | Billabong International Ltd. | 206,329 | 1,534 |
| | SP AusNet | 1,369,638 | 1,316 |
| | MAp Group | 373,836 | 1,212 |
| | Newcrest Mining Ltd. ADR | 11,997 | 549 |
| | | | 1,066,769 |
| Austria (0.3%) | | |
| | Erste Group Bank AG | 190,255 | 9,605 |
| | OMV AG | 150,933 | 6,881 |
| | Voestalpine AG | 109,951 | 5,409 |
| | Telekom Austria AG | 335,525 | 5,187 |
| *,^ | IMMOFINANZ AG | 996,849 | 4,738 |
| | Verbund AG | 68,486 | 3,096 |
| ^ | Raiffeisen Bank International AG | 49,500 | 2,728 |
| | Vienna Insurance Group AG Wiener Versicherung Gruppe | 38,904 | 2,321 |
| | | | 39,965 |
| Belgium (1.0%) | | |
| | Anheuser-Busch InBev NV | 726,545 | 46,367 |
| | Delhaize Group SA | 102,035 | 8,828 |
| | Solvay SA Class A | 59,659 | 8,602 |
| ^ | Groupe Bruxelles Lambert SA | 81,181 | 8,045 |
| | Ageas | 2,247,964 | 6,814 |
| * | KBC Groep NV | 162,660 | 6,621 |
| | Umicore SA | 114,244 | 6,548 |
| | Belgacom SA | 153,617 | 6,040 |
| | UCB SA | 101,933 | 4,925 |
| | Bekaert SA | 38,996 | 4,878 |
| | Colruyt SA | 75,775 | 4,371 |
| *,^ | Dexia SA | 558,549 | 2,225 |
| | Mobistar SA | 27,299 | 2,026 |
| * | Cie Nationale a Portefeuille | 27,621 | 1,996 |
| | | | 118,286 |
| Denmark (1.1%) | | |
| | Novo Nordisk A/S Class B | 421,175 | 53,318 |
| * | Danske Bank A/S | 609,339 | 14,633 |
| | AP Moller - Maersk A/S Class B | 1,329 | 13,470 |
| | Carlsberg A/S Class B | 107,630 | 12,771 |
| | Novozymes A/S | 46,266 | 8,001 |
| * | Vestas Wind Systems A/S | 205,730 | 7,290 |
| | DSV A/S | 211,213 | 5,523 |
| | AP Moller - Maersk A/S | 553 | 5,438 |
| | Coloplast A/S Class B | 22,826 | 3,358 |
| ^ | Pandora A/S | 58,775 | 2,650 |
| * | William Demant Holding A/S | 23,296 | 2,172 |
| | Tryg A/S | 25,458 | 1,627 |
| | | | 130,251 |
| Finland (1.1%) | | |
| ^ | Nokia Oyj | 3,767,703 | 34,710 |
| | Fortum Oyj | 446,902 | 15,386 |
| | Sampo Oyj | 422,636 | 14,228 |
| | UPM-Kymmene Oyj | 523,167 | 10,731 |
| | Kone Oyj Class B | 156,664 | 9,813 |
| | Metso Oyj | 128,590 | 7,897 |
| | Stora Enso Oyj | 585,380 | 7,057 |
| | Wartsila Oyj | 159,356 | 6,264 |
| | Nokian Renkaat Oyj | 109,178 | 5,658 |
| | Kesko Oyj Class B | 67,455 | 3,501 |
2
| | | |
| Vanguard® Developed Markets Index Fund | | |
| Schedule of Investments | | |
| April 30, 2011 | | |
| |
| | | | Market |
| | | | Value |
| | | Shares | ($000) |
| ^ | Elisa Oyj | 133,078 | 3,204 |
| | Neste Oil Oyj | 130,145 | 2,463 |
| | Orion Oyj Class B | 93,357 | 2,321 |
| | Rautaruukki Oyj | 84,828 | 2,201 |
| | Outokumpu Oyj | 127,256 | 2,120 |
| | Pohjola Bank plc | 137,863 | 2,046 |
| | Sanoma Oyj | 82,490 | 1,715 |
| | | | 131,315 |
| France (10.2%) | | |
| | Total SA | 2,126,364 | 136,175 |
| | Sanofi-Aventis SA | 1,055,100 | 83,476 |
| | BNP Paribas | 964,328 | 76,235 |
| ^ | GDF Suez | 1,244,815 | 50,900 |
| | LVMH Moet Hennessy Louis Vuitton SA | 246,459 | 44,249 |
| | France Telecom SA | 1,865,346 | 43,713 |
| ^ | Schneider Electric SA | 244,558 | 43,207 |
| | Danone | 586,669 | 42,954 |
| | Societe Generale | 638,310 | 42,657 |
| | Air Liquide SA | 284,916 | 42,098 |
| | Vivendi SA | 1,243,995 | 39,005 |
| ^ | AXA SA | 1,727,932 | 38,737 |
| | ArcelorMittal | 863,722 | 31,920 |
| ^ | L'Oreal SA | 241,146 | 30,569 |
| | Vinci SA | 444,303 | 29,658 |
| | Carrefour SA | 602,813 | 28,563 |
| | Cie de St-Gobain | 400,524 | 27,636 |
| ^ | Unibail-Rodamco SE | 92,277 | 21,589 |
| | Pernod-Ricard SA | 199,385 | 20,027 |
| | Cie Generale des Etablissements Michelin Class B | 177,619 | 17,803 |
| | Cie Generale d'Optique Essilor International SA | 203,443 | 17,035 |
| | Credit Agricole SA | 966,540 | 16,077 |
| * | Alcatel-Lucent | 2,332,550 | 15,115 |
| | Lafarge SA | 201,747 | 14,284 |
| | Vallourec SA | 111,401 | 13,898 |
| | Alstom SA | 207,213 | 13,777 |
| | PPR | 76,415 | 13,662 |
| * | European Aeronautic Defence and Space Co. NV | 410,669 | 12,707 |
| * | Renault SA | 193,402 | 11,776 |
| | Veolia Environnement SA | 350,295 | 11,700 |
| ^ | Bouygues SA | 232,592 | 11,575 |
| | Technip SA | 99,016 | 11,172 |
| | EDF SA | 260,435 | 10,955 |
| | Christian Dior SA | 63,998 | 10,266 |
| | Cap Gemini SA | 148,897 | 9,019 |
| | SES SA | 301,544 | 7,919 |
| | STMicroelectronics NV | 641,198 | 7,588 |
| | Sodexo | 94,866 | 7,390 |
| | Legrand SA | 158,875 | 7,254 |
| | Publicis Groupe SA | 125,345 | 7,101 |
| * | Peugeot SA | 153,079 | 6,947 |
| | Accor SA | 147,146 | 6,539 |
| ^ | Safran SA | 167,046 | 6,481 |
| | Suez Environnement Co. | 270,102 | 6,223 |
| | Groupe Eurotunnel SA | 539,491 | 5,865 |
| ^ | Casino Guichard Perrachon SA | 55,271 | 5,816 |
| | Lagardere SCA | 119,184 | 5,233 |
| | SCOR SE | 170,712 | 5,211 |
| * | Cie Generale de Geophysique - Veritas | 145,263 | 5,117 |
| * | Natixis | 881,049 | 5,064 |
| | Edenred | 158,324 | 4,909 |
| | Dassault Systemes SA | 59,828 | 4,865 |
| | Eutelsat Communications SA | 99,566 | 4,296 |
| | Bureau Veritas SA | 49,575 | 4,276 |
| | Thales SA | 89,779 | 3,966 |
3
| | | |
| Vanguard® Developed Markets Index Fund | | |
| Schedule of Investments | | |
| April 30, 2011 | | |
| |
| | | | Market |
| | | | Value |
| | | Shares | ($000) |
| | Klepierre | 95,750 | 3,935 |
| | CNP Assurances | 149,509 | 3,431 |
| | Fonciere Des Regions | 27,110 | 3,076 |
| | Neopost SA | 32,002 | 3,055 |
| | ICADE | 23,205 | 2,975 |
| | Imerys SA | 38,082 | 2,950 |
| | Aeroports de Paris | 29,701 | 2,847 |
| ^ | Eiffage SA | 40,779 | 2,819 |
| * | Atos Origin SA | 45,274 | 2,789 |
| | Gecina SA | 18,886 | 2,722 |
| | Societe BIC SA | 26,935 | 2,619 |
| | Eurazeo | 29,338 | 2,441 |
| * | Air France-KLM | 135,264 | 2,387 |
| * | JCDecaux SA | 66,964 | 2,338 |
| | Societe Television Francaise 1 | 117,872 | 2,213 |
| | Iliad SA | 16,409 | 2,110 |
| ^ | Eramet | 5,336 | 2,100 |
| | Metropole Television SA | 64,255 | 1,705 |
| ^ | PagesJaunes Groupe | 127,667 | 1,331 |
| | BioMerieux | 11,773 | 1,280 |
| | | | 1,253,372 |
| Germany (8.9%) | | |
| | Siemens AG | 827,762 | 120,405 |
| *,^ | BASF SE | 924,039 | 94,884 |
| ^ | Bayer AG | 831,957 | 73,041 |
| ^ | Allianz SE | 456,651 | 71,745 |
| | Daimler AG | 826,595 | 63,885 |
| | E.ON AG | 1,811,812 | 61,926 |
| | Deutsche Bank AG | 935,134 | 60,905 |
| | SAP AG | 863,870 | 55,651 |
| | Deutsche Telekom AG | 2,852,051 | 47,134 |
| *,^ | Volkswagen AG Prior Pfd. | 171,179 | 33,691 |
| | Bayerische Motoren Werke AG | 333,112 | 31,362 |
| | Muenchener Rueckversicherungs AG | 189,616 | 31,278 |
| | Linde AG | 170,105 | 30,613 |
| ^ | RWE AG | 421,273 | 27,483 |
| * | Deutsche Post AG | 851,485 | 16,828 |
| | Deutsche Boerse AG | 196,194 | 16,288 |
| | Adidas AG | 210,498 | 15,687 |
| | ThyssenKrupp AG | 336,466 | 15,469 |
| | Fresenius Medical Care AG & Co. KGaA | 194,881 | 15,327 |
| * | MAN SE | 106,380 | 14,820 |
| | Infineon Technologies AG | 1,093,413 | 12,397 |
| ^ | Henkel AG & Co. KGaA Prior Pfd. | 179,258 | 12,221 |
| | K&S AG | 144,434 | 11,665 |
| | Fresenius SE & Co. KGaA | 109,684 | 11,519 |
| | Porsche Automobil Holding SE Prior Pfd. | 154,069 | 11,137 |
| | HeidelbergCement AG | 141,492 | 10,819 |
| | Metro AG | 130,445 | 9,574 |
| | Lanxess AG | 83,720 | 7,660 |
| | Henkel AG & Co. KGaA | 130,705 | 7,423 |
| | Merck KGaA | 65,025 | 6,886 |
| | Beiersdorf AG | 101,013 | 6,579 |
| | Daimler AG | 81,276 | 6,249 |
| | GEA Group AG | 167,063 | 6,102 |
| * | Commerzbank AG | 853,020 | 5,428 |
| * | Volkswagen AG | 29,567 | 5,265 |
| * | Commerzbank AG | 842,442 | 5,253 |
| *,^ | Deutsche Lufthansa AG | 231,227 | 5,246 |
| * | Continental AG | 50,493 | 5,063 |
| * | QIAGEN NV | 235,145 | 5,028 |
| | Brenntag AG | 33,600 | 4,128 |
| | Hochtief AG | 42,374 | 4,015 |
| | Wacker Chemie AG | 15,819 | 3,917 |
4
| | | |
| Vanguard® Developed Markets Index Fund | | |
| Schedule of Investments | | |
| April 30, 2011 | | |
| |
| | | | Market |
| | | | Value |
| | | Shares | ($000) |
| | Hannover Rueckversicherung AG | 60,498 | 3,655 |
| * | Kabel Deutschland Holding AG | 54,596 | 3,410 |
| | Salzgitter AG | 42,163 | 3,306 |
| | Bayerische Motoren Werke AG Prior Pfd. | 52,285 | 3,260 |
| | Fraport AG Frankfurt Airport Services Worldwide | 36,773 | 2,937 |
| | Axel Springer AG | 14,898 | 2,442 |
| ^ | RWE AG Prior Pfd. | 38,945 | 2,369 |
| | United Internet AG | 120,942 | 2,366 |
| | ProSiebenSat.1 Media AG Prior Pfd. | 77,313 | 2,215 |
| | Suedzucker AG | 67,359 | 2,077 |
| | Celesio AG | 77,059 | 1,872 |
| | Puma AG Rudolf Dassler Sport | 5,299 | 1,766 |
| * | TUI AG | 137,461 | 1,755 |
| | | | 1,095,426 |
| Greece (0.2%) | | |
| | National Bank of Greece SA | 962,026 | 7,439 |
| | Coca Cola Hellenic Bottling Co. SA | 184,219 | 5,094 |
| | OPAP SA | 223,224 | 4,726 |
| | Bank of Cyprus plc | 851,189 | 3,104 |
| * | Alpha Bank AE | 513,656 | 2,994 |
| | Hellenic Telecommunications Organization SA | 212,103 | 2,516 |
| | Public Power Corp. SA | 117,763 | 1,949 |
| * | EFG Eurobank Ergasias SA | 327,190 | 1,842 |
| | Hellenic Telecommunications Organization SA ADR | 71,648 | 419 |
| | | | 30,083 |
| Hong Kong (2.7%) | | |
| * | AIA Group Ltd. | 7,876,525 | 26,564 |
| | Hutchison Whampoa Ltd. | 2,145,491 | 24,537 |
| | Hong Kong Exchanges and Clearing Ltd. | 1,030,554 | 23,567 |
| | Sun Hung Kai Properties Ltd. | 1,423,553 | 22,296 |
| | Cheung Kong Holdings Ltd. | 1,398,978 | 22,079 |
| | CLP Holdings Ltd. | 1,937,158 | 15,934 |
| | Li & Fung Ltd. | 2,834,769 | 14,508 |
| | Hang Seng Bank Ltd. | 769,497 | 12,027 |
| | Swire Pacific Ltd. Class A | 774,773 | 11,858 |
| | BOC Hong Kong Holdings Ltd. | 3,723,808 | 11,706 |
| | Wharf Holdings Ltd. | 1,524,922 | 11,190 |
| | Hang Lung Properties Ltd. | 2,471,478 | 11,021 |
| | Hong Kong & China Gas Co. Ltd. | 4,337,356 | 10,772 |
| | Power Assets Holdings Ltd. | 1,396,385 | 9,778 |
| | Henderson Land Development Co. Ltd. | 1,095,559 | 7,520 |
| | Link REIT | 2,224,024 | 7,009 |
| * | Sands China Ltd. | 2,420,800 | 6,802 |
| | Bank of East Asia Ltd. | 1,534,978 | 6,355 |
| | Wynn Macau Ltd. | 1,561,200 | 5,572 |
| | Hang Lung Group Ltd. | 815,819 | 5,497 |
| | MTR Corp. | 1,457,097 | 5,320 |
| | Esprit Holdings Ltd. | 1,162,693 | 4,852 |
| | Sino Land Co. Ltd. | 2,628,286 | 4,635 |
| | New World Development Ltd. | 2,574,601 | 4,531 |
| | Shangri-La Asia Ltd. | 1,422,231 | 3,971 |
| | Kerry Properties Ltd. | 726,773 | 3,886 |
| | Wheelock & Co. Ltd. | 918,353 | 3,792 |
| | SJM Holdings Ltd. | 1,630,000 | 3,522 |
| | Hysan Development Co. Ltd. | 633,624 | 2,963 |
| | Cathay Pacific Airways Ltd. | 1,183,280 | 2,957 |
| | ASM Pacific Technology Ltd. | 200,259 | 2,698 |
| | Yue Yuen Industrial Holdings Ltd. | 740,683 | 2,559 |
| | Cheung Kong Infrastructure Holdings Ltd. | 452,746 | 2,209 |
| | Wing Hang Bank Ltd. | 178,616 | 1,991 |
| | NWS Holdings Ltd. | 1,300,977 | 1,919 |
| | Hopewell Holdings Ltd. | 569,477 | 1,722 |
| | Lifestyle International Holdings Ltd. | 584,956 | 1,676 |
| | Orient Overseas International Ltd. | 217,659 | 1,670 |
5
| | | |
| Vanguard® Developed Markets Index Fund | | |
| Schedule of Investments | | |
| April 30, 2011 | | |
| |
| | | | Market |
| | | | Value |
| | | Shares | ($000) |
| | PCCW Ltd. | 4,035,347 | 1,602 |
| *,^ | Foxconn International Holdings Ltd. | 2,122,422 | 1,255 |
| * | Henderson Land Development Co. Ltd. Warrants Exp. 06/01/2011 | 200,711 | 6 |
| | | | 326,328 |
| Ireland (0.3%) | | |
| | CRH plc | 713,430 | 17,710 |
| | Kerry Group plc Class A | 141,291 | 5,852 |
| * | Elan Corp. plc | 503,389 | 4,047 |
| | Ryanair Holdings plc ADR | 61,018 | 1,860 |
| * | Governor & Co. of the Bank of Ireland | 3,423,611 | 1,394 |
| | WPP plc ADR | 19,480 | 1,272 |
| | Ryanair Holdings plc | 70,448 | 362 |
| | | | 32,497 |
| Israel (0.7%) | | |
| | Teva Pharmaceutical Industries Ltd. | 949,009 | 43,603 |
| | Israel Chemicals Ltd. | 450,640 | 7,998 |
| | Bank Leumi Le-Israel BM | 1,190,524 | 6,194 |
| * | Bank Hapoalim BM | 1,001,523 | 5,267 |
| | Bezeq The Israeli Telecommunication Corp. Ltd. | 1,769,041 | 5,256 |
| | Israel Corp. Ltd. | 2,334 | 2,909 |
| * | NICE Systems Ltd. | 63,070 | 2,406 |
| | Partner Communications Co. Ltd. | 86,398 | 1,639 |
| * | Israel Discount Bank Ltd. Class A | 773,646 | 1,638 |
| | Cellcom Israel Ltd. (Registered) | 50,534 | 1,625 |
| | Mizrahi Tefahot Bank Ltd. | 126,434 | 1,404 |
| | Elbit Systems Ltd. | 24,004 | 1,362 |
| * | Makhteshim-Agan Industries Ltd. | 233,130 | 1,258 |
| | Delek Group Ltd. | 3,999 | 1,064 |
| | | | 83,623 |
| Italy (2.9%) | | |
| | ENI SPA | 2,619,251 | 70,127 |
| | Enel SPA | 6,622,268 | 47,226 |
| | UniCredit SPA | 13,573,273 | 34,956 |
| | Assicurazioni Generali SPA | 1,174,758 | 28,152 |
| | Intesa Sanpaolo SPA (Registered) | 7,748,939 | 25,738 |
| | Saipem SPA | 266,381 | 15,130 |
| | Telecom Italia SPA (Registered) | 9,443,059 | 14,199 |
| | Tenaris SA | 475,117 | 11,998 |
| * | Fiat Industrial SPA | 769,274 | 11,428 |
| | Snam Rete Gas SPA | 1,437,153 | 8,939 |
| | Fiat SPA | 769,306 | 8,215 |
| | Telecom Italia SPA (Bearer) | 6,063,463 | 7,819 |
| | Atlantia SPA | 301,039 | 7,409 |
| * | Parmalat SPA | 1,750,011 | 6,626 |
| | Terna Rete Elettrica Nazionale SPA | 1,315,771 | 6,587 |
| | Finmeccanica SPA | 408,699 | 5,522 |
| | Unione di Banche Italiane SCPA | 608,861 | 5,458 |
| | Mediobanca SPA | 478,284 | 5,447 |
| | Enel Green Power SPA | 1,754,779 | 5,203 |
| | Prysmian SPA | 204,419 | 4,825 |
| | Mediaset SPA | 716,794 | 4,776 |
| | Banco Popolare SC | 1,544,274 | 4,581 |
| | Luxottica Group SPA | 117,463 | 3,883 |
| *,^ | Banca Monte dei Paschi di Siena SPA | 2,245,842 | 3,043 |
| | Intesa Sanpaolo SPA (Bearer) | 932,630 | 2,674 |
| | Pirelli & C SPA | 237,200 | 2,470 |
| | Exor SPA | 64,380 | 2,323 |
| | A2A SPA | 1,092,639 | 1,974 |
| * | Autogrill SPA | 116,176 | 1,666 |
| ^ | Banca Carige SPA | 560,649 | 1,359 |
| | | | 359,753 |
| Japan (19.3%) | | |
| | Toyota Motor Corp. | 2,796,093 | 111,539 |
6
| | |
| Vanguard® Developed Markets Index Fund | | |
| Schedule of Investments | | |
| April 30, 2011 | | |
| |
| | | Market |
| | | Value |
| | Shares | ($000) |
| Honda Motor Co. Ltd. | 1,652,592 | 63,532 |
| Mitsubishi UFJ Financial Group Inc. | 12,909,836 | 61,962 |
| Canon Inc. | 1,149,235 | 54,120 |
| Sumitomo Mitsui Financial Group Inc. | 1,362,352 | 42,317 |
| Mitsubishi Corp. | 1,377,039 | 37,356 |
| Takeda Pharmaceutical Co. Ltd. | 760,930 | 36,877 |
| Softbank Corp. | 822,487 | 34,706 |
| Komatsu Ltd. | 961,390 | 33,898 |
| Mizuho Financial Group Inc. | 20,739,336 | 32,858 |
| FANUC Corp. | 194,161 | 32,502 |
| Mitsui & Co. Ltd. | 1,761,020 | 31,338 |
| NTT DoCoMo Inc. | 15,537 | 28,827 |
| Sony Corp. | 1,018,135 | 28,748 |
| Panasonic Corp. | 2,238,252 | 27,522 |
| Hitachi Ltd. | 4,583,044 | 24,876 |
| Nissan Motor Co. Ltd. | 2,522,588 | 24,271 |
| Nintendo Co. Ltd. | 100,559 | 23,794 |
| Nippon Telegraph & Telephone Corp. | 485,077 | 22,603 |
| Mitsubishi Electric Corp. | 1,957,104 | 21,789 |
| Toshiba Corp. | 4,085,786 | 21,756 |
| Shin-Etsu Chemical Co. Ltd. | 416,619 | 21,674 |
| Mitsubishi Estate Co. Ltd. | 1,196,995 | 20,947 |
| Tokio Marine Holdings Inc. | 733,112 | 20,508 |
| KDDI Corp. | 2,952 | 19,708 |
| Seven & I Holdings Co. Ltd. | 763,061 | 19,203 |
| East Japan Railway Co. | 344,356 | 19,139 |
| Nomura Holdings Inc. | 3,578,763 | 18,282 |
| Kyocera Corp. | 164,756 | 18,178 |
| Japan Tobacco Inc. | 4,559 | 17,718 |
| Astellas Pharma Inc. | 450,330 | 17,200 |
| Inpex Corp. | 2,222 | 17,082 |
| Denso Corp. | 492,760 | 16,491 |
| Nippon Steel Corp. | 5,173,073 | 16,182 |
| JX Holdings Inc. | 2,276,372 | 16,032 |
| Kansai Electric Power Co. Inc. | 760,935 | 16,027 |
| ITOCHU Corp. | 1,525,573 | 15,892 |
| Sumitomo Corp. | 1,140,649 | 15,735 |
| Murata Manufacturing Co. Ltd. | 205,488 | 14,841 |
| Mitsui Fudosan Co. Ltd. | 849,235 | 14,739 |
| Mitsubishi Heavy Industries Ltd. | 3,077,383 | 14,705 |
| FUJIFILM Holdings Corp. | 469,472 | 14,595 |
| Bridgestone Corp. | 659,427 | 14,564 |
| Chubu Electric Power Co. Inc. | 657,267 | 14,402 |
| Kao Corp. | 547,564 | 13,707 |
| Daiichi Sankyo Co. Ltd. | 682,932 | 13,419 |
| Dai-ichi Life Insurance Co. Ltd. | 8,112 | 13,399 |
| Asahi Glass Co. Ltd. | 1,022,376 | 12,980 |
| JFE Holdings Inc. | 467,374 | 12,793 |
| MS&AD Insurance Group Holdings | 545,907 | 12,784 |
| Marubeni Corp. | 1,674,104 | 12,230 |
| Kirin Holdings Co. Ltd. | 856,787 | 12,056 |
| Central Japan Railway Co. | 1,527 | 11,545 |
| Tokyo Gas Co. Ltd. | 2,586,767 | 11,541 |
| Kubota Corp. | 1,173,548 | 11,252 |
| Keyence Corp. | 42,021 | 11,104 |
| Toray Industries Inc. | 1,489,568 | 11,049 |
| Sumitomo Mitsui Trust Holdings Inc. | 3,161,313 | 10,884 |
| Fujitsu Ltd. | 1,890,470 | 10,832 |
| Sumitomo Electric Industries Ltd. | 765,509 | 10,658 |
| Secom Co. Ltd. | 213,008 | 10,566 |
| ORIX Corp. | 106,299 | 10,443 |
| Tokyo Electron Ltd. | 174,145 | 10,082 |
| SMC Corp. | 54,771 | 10,005 |
| Nidec Corp. | 110,469 | 9,656 |
7
| | | |
| Vanguard® Developed Markets Index Fund | | |
| Schedule of Investments | | |
| April 30, 2011 | | |
| |
| | | | Market |
| | | | Value |
| | | Shares | ($000) |
| | Terumo Corp. | 171,253 | 9,551 |
| | Hoya Corp. | 441,729 | 9,514 |
| | Sumitomo Metal Mining Co. Ltd. | 531,878 | 9,497 |
| | Sharp Corp. | 1,015,077 | 9,339 |
| | Eisai Co. Ltd. | 256,005 | 9,309 |
| | NKSJ Holdings Inc. | 1,434,583 | 9,246 |
| | Nitto Denko Corp. | 167,679 | 8,980 |
| | Asahi Kasei Corp. | 1,283,011 | 8,869 |
| | Resona Holdings Inc. | 1,868,053 | 8,857 |
| | Mitsubishi Chemical Holdings Corp. | 1,300,946 | 8,809 |
| | Sumitomo Chemical Co. Ltd. | 1,597,823 | 8,497 |
| | Fast Retailing Co. Ltd. | 53,879 | 8,495 |
| | Suzuki Motor Corp. | 342,183 | 8,146 |
| | Tokyo Electric Power Co. Inc. | 1,470,346 | 7,885 |
| | Daikin Industries Ltd. | 238,549 | 7,598 |
| | Ajinomoto Co. Inc. | 676,525 | 7,524 |
| | Sumitomo Realty & Development Co. Ltd. | 363,152 | 7,517 |
| | Ricoh Co. Ltd. | 677,506 | 7,477 |
| | Asahi Breweries Ltd. | 393,589 | 7,394 |
| | Aeon Co. Ltd. | 610,605 | 7,357 |
| | Daiwa Securities Group Inc. | 1,689,452 | 7,292 |
| | Osaka Gas Co. Ltd. | 1,975,836 | 7,291 |
| | Sumitomo Metal Industries Ltd. | 3,421,577 | 7,238 |
| | Kyushu Electric Power Co. Inc. | 385,849 | 7,134 |
| | Aisin Seiki Co. Ltd. | 194,924 | 6,875 |
| | T&D Holdings Inc. | 277,390 | 6,850 |
| | Rakuten Inc. | 7,370 | 6,843 |
| | Nikon Corp. | 326,358 | 6,840 |
| | Otsuka Holdings Co. Ltd. | 255,400 | 6,839 |
| | Dai Nippon Printing Co. Ltd. | 566,050 | 6,790 |
| | Mitsui OSK Lines Ltd. | 1,157,692 | 6,457 |
| | Yamato Holdings Co. Ltd. | 401,786 | 6,415 |
| | TDK Corp. | 124,316 | 6,414 |
| | Tohoku Electric Power Co. Inc. | 431,695 | 6,340 |
| | West Japan Railway Co. | 1,717 | 6,261 |
| | Kobe Steel Ltd. | 2,517,070 | 6,246 |
| | Olympus Corp. | 219,177 | 6,203 |
| | Bank of Yokohama Ltd. | 1,246,600 | 6,176 |
| | JS Group Corp. | 252,969 | 6,097 |
| | Rohm Co. Ltd. | 99,020 | 5,964 |
| | Kawasaki Heavy Industries Ltd. | 1,433,661 | 5,925 |
| | Daito Trust Construction Co. Ltd. | 73,515 | 5,881 |
| | Daiwa House Industry Co. Ltd. | 484,470 | 5,870 |
| | Yamada Denki Co. Ltd. | 82,997 | 5,831 |
| | Nippon Yusen KK | 1,545,253 | 5,713 |
| | Shiseido Co. Ltd. | 343,332 | 5,711 |
| | Omron Corp. | 205,645 | 5,656 |
| | Sekisui House Ltd. | 581,163 | 5,634 |
| | Nippon Building Fund Inc. | 554 | 5,576 |
| | Shizuoka Bank Ltd. | 610,838 | 5,566 |
| | NEC Corp. | 2,630,777 | 5,549 |
| | Toyota Industries Corp. | 181,365 | 5,498 |
| | Yahoo Japan Corp. | 14,746 | 5,424 |
| | Nippon Electric Glass Co. Ltd. | 352,091 | 5,331 |
| | Chugoku Electric Power Co. Inc. | 299,996 | 5,328 |
| | JGC Corp. | 209,604 | 5,248 |
| | Makita Corp. | 113,139 | 5,202 |
| | Isuzu Motors Ltd. | 1,198,999 | 5,142 |
| | Odakyu Electric Railway Co. Ltd. | 634,085 | 5,124 |
| | Hankyu Hanshin Holdings Inc. | 1,155,491 | 5,119 |
| * | Yamaha Motor Co. Ltd. | 265,779 | 5,109 |
| | Kuraray Co. Ltd. | 348,535 | 5,077 |
| | Unicharm Corp. | 125,416 | 4,968 |
| ^ | Kintetsu Corp. | 1,642,012 | 4,917 |
8
| | | |
| Vanguard® Developed Markets Index Fund | | |
| Schedule of Investments | | |
| April 30, 2011 | | |
| |
| | | | Market |
| | | | Value |
| | | Shares | ($000) |
| | Shionogi & Co. Ltd. | 302,799 | 4,909 |
| | Japan Real Estate Investment Corp. | 494 | 4,890 |
| * | Mitsubishi Motors Corp. | 3,914,479 | 4,803 |
| | Tokyu Corp. | 1,148,150 | 4,750 |
| | Chiba Bank Ltd. | 770,380 | 4,561 |
| | Teijin Ltd. | 951,519 | 4,560 |
| | Dentsu Inc. | 168,878 | 4,491 |
| | Shikoku Electric Power Co. Inc. | 176,611 | 4,482 |
| | NGK Insulators Ltd. | 256,556 | 4,452 |
| | Toppan Printing Co. Ltd. | 566,236 | 4,451 |
| | Fuji Heavy Industries Ltd. | 596,655 | 4,441 |
| | Ibiden Co. Ltd. | 130,270 | 4,398 |
| | Ono Pharmaceutical Co. Ltd. | 85,823 | 4,357 |
| | Oriental Land Co. Ltd. | 50,598 | 4,296 |
| | Konica Minolta Holdings Inc. | 486,532 | 4,284 |
| | NTT Data Corp. | 1,285 | 4,258 |
| | NSK Ltd. | 449,760 | 3,991 |
| | Tobu Railway Co. Ltd. | 1,015,012 | 3,963 |
| | Mitsubishi Materials Corp. | 1,131,195 | 3,927 |
| | OJI Paper Co. Ltd. | 866,400 | 3,890 |
| | JSR Corp. | 182,149 | 3,832 |
| | Chugai Pharmaceutical Co. Ltd. | 227,776 | 3,777 |
| | Mitsubishi Tanabe Pharma Corp. | 226,392 | 3,756 |
| | Sumitomo Heavy Industries Ltd. | 562,726 | 3,711 |
| | Isetan Mitsukoshi Holdings Ltd. | 379,189 | 3,661 |
| | Sekisui Chemical Co. Ltd. | 436,104 | 3,659 |
| | Brother Industries Ltd. | 238,169 | 3,647 |
| | Hokuriku Electric Power Co. | 179,241 | 3,635 |
| | Shimano Inc. | 67,180 | 3,606 |
| | Toyota Tsusho Corp. | 214,553 | 3,577 |
| | TonenGeneral Sekiyu KK | 285,700 | 3,545 |
| | Mazda Motor Corp. | 1,533,940 | 3,522 |
| | Sega Sammy Holdings Inc. | 201,034 | 3,521 |
| | Nippon Express Co. Ltd. | 860,288 | 3,428 |
| | Hirose Electric Co. Ltd. | 32,578 | 3,395 |
| | IHI Corp. | 1,332,805 | 3,391 |
| | Kurita Water Industries Ltd. | 114,982 | 3,368 |
| | Hokkaido Electric Power Co. Inc. | 184,230 | 3,340 |
| | Keikyu Corp. | 473,807 | 3,308 |
| | Sony Financial Holdings Inc. | 176,700 | 3,284 |
| | Keio Corp. | 583,915 | 3,280 |
| | Fukuoka Financial Group Inc. | 786,182 | 3,267 |
| | Nitori Holdings Co. Ltd. | 37,666 | 3,257 |
| | Mitsui Chemicals Inc. | 887,188 | 3,251 |
| | Taisho Pharmaceutical Co. Ltd. | 137,239 | 3,237 |
| | Advantest Corp. | 162,309 | 3,226 |
| | Dena Co. Ltd. | 84,615 | 3,176 |
| | Daihatsu Motor Co. Ltd. | 193,861 | 3,132 |
| | THK Co. Ltd. | 121,284 | 3,118 |
| | Electric Power Development Co. Ltd. | 117,806 | 3,091 |
| | Mitsubishi Gas Chemical Co. Inc. | 393,907 | 3,086 |
| | Ube Industries Ltd. | 964,316 | 3,084 |
| | Bank of Kyoto Ltd. | 324,812 | 3,010 |
| | MEIJI Holdings Co. Ltd. | 70,122 | 2,995 |
| | Lawson Inc. | 60,676 | 2,977 |
| | JTEKT Corp. | 225,806 | 2,933 |
| | Benesse Holdings Inc. | 70,428 | 2,929 |
| | Santen Pharmaceutical Co. Ltd. | 75,362 | 2,915 |
| | Amada Co. Ltd. | 360,602 | 2,896 |
| | Showa Denko KK | 1,429,024 | 2,852 |
| | Sankyo Co. Ltd. | 54,780 | 2,849 |
| | Trend Micro Inc. | 98,944 | 2,825 |
| | Hisamitsu Pharmaceutical Co. Inc. | 67,055 | 2,798 |
| * | Elpida Memory Inc. | 186,251 | 2,791 |
9
| | | |
| Vanguard® Developed Markets Index Fund | | |
| Schedule of Investments | | |
| April 30, 2011 | | |
| |
| | | | Market |
| | | | Value |
| | | Shares | ($000) |
| | Obayashi Corp. | 656,738 | 2,770 |
| | Joyo Bank Ltd. | 672,983 | 2,716 |
| | Yakult Honsha Co. Ltd. | 97,337 | 2,704 |
| | Hamamatsu Photonics KK | 68,500 | 2,695 |
| | Yaskawa Electric Corp. | 228,507 | 2,675 |
| | Nippon Sheet Glass Co. Ltd. | 907,924 | 2,674 |
| | Jupiter Telecommunications Co. Ltd. | 2,486 | 2,672 |
| | Idemitsu Kosan Co. Ltd. | 22,326 | 2,640 |
| | Toyo Seikan Kaisha Ltd. | 154,362 | 2,624 |
| | Japan Retail Fund Investment Corp. Class A | 1,612 | 2,606 |
| | Kyowa Hakko Kirin Co. Ltd. | 260,735 | 2,602 |
| | Hachijuni Bank Ltd. | 432,370 | 2,581 |
| | Nippon Meat Packers Inc. | 185,574 | 2,571 |
| | Furukawa Electric Co. Ltd. | 645,843 | 2,566 |
| ^ | GS Yuasa Corp. | 375,002 | 2,566 |
| | Japan Steel Works Ltd. | 317,200 | 2,562 |
| | Shimizu Corp. | 605,133 | 2,557 |
| | Credit Saison Co. Ltd. | 151,140 | 2,534 |
| | Stanley Electric Co. Ltd. | 148,145 | 2,490 |
| | Denki Kagaku Kogyo KK | 484,357 | 2,488 |
| | Kajima Corp. | 866,827 | 2,486 |
| | Nabtesco Corp. | 97,000 | 2,483 |
| | All Nippon Airways Co. Ltd. | 836,075 | 2,457 |
| | Sojitz Corp. | 1,271,322 | 2,453 |
| | Taisei Corp. | 1,044,361 | 2,447 |
| | Hokuhoku Financial Group Inc. | 1,274,317 | 2,432 |
| | Hitachi Construction Machinery Co. Ltd. | 98,740 | 2,407 |
| | Nisshin Seifun Group Inc. | 190,766 | 2,388 |
| | Mitsubishi UFJ Lease & Finance Co. Ltd. | 59,701 | 2,387 |
| | Sysmex Corp. | 67,300 | 2,357 |
| | Kawasaki Kisen Kaisha Ltd. | 702,730 | 2,357 |
| | FamilyMart Co. Ltd. | 64,878 | 2,355 |
| | Rinnai Corp. | 35,464 | 2,354 |
| | NTN Corp. | 489,099 | 2,349 |
| | Nissin Foods Holdings Co. Ltd. | 64,920 | 2,301 |
| | NGK Spark Plug Co. Ltd. | 164,719 | 2,293 |
| * | Sumco Corp. | 117,671 | 2,270 |
| | Seiko Epson Corp. | 130,406 | 2,269 |
| | TOTO Ltd. | 286,262 | 2,248 |
| | Shimadzu Corp. | 257,846 | 2,240 |
| | Nomura Research Institute Ltd. | 103,820 | 2,232 |
| | Hitachi Metals Ltd. | 167,989 | 2,213 |
| | Asics Corp. | 152,367 | 2,204 |
| | Hiroshima Bank Ltd. | 503,445 | 2,200 |
| ^ | SBI Holdings Inc. | 20,351 | 2,194 |
| | Kaneka Corp. | 299,400 | 2,185 |
| | Toyo Suisan Kaisha Ltd. | 94,502 | 2,176 |
| | Gunma Bank Ltd. | 400,746 | 2,169 |
| | Hitachi Chemical Co. Ltd. | 104,843 | 2,161 |
| | Ushio Inc. | 105,625 | 2,151 |
| | Miraca Holdings Inc. | 56,400 | 2,147 |
| | Taiyo Nippon Sanso Corp. | 264,807 | 2,139 |
| | Kamigumi Co. Ltd. | 248,452 | 2,128 |
| | J Front Retailing Co. Ltd. | 486,287 | 2,113 |
| | Showa Shell Sekiyu KK | 193,215 | 2,108 |
| | Shimamura Co. Ltd. | 22,323 | 2,102 |
| | Namco Bandai Holdings Inc. | 188,636 | 2,083 |
| | Mitsui Mining & Smelting Co. Ltd. | 578,777 | 2,072 |
| | Iyo Bank Ltd. | 247,467 | 2,070 |
| | Chugoku Bank Ltd. | 174,351 | 2,032 |
| | Nippon Paper Group Inc. | 101,097 | 2,031 |
| | Yamaha Corp. | 161,574 | 2,021 |
| | Tokyu Land Corp. | 461,460 | 1,994 |
| | Nomura Real Estate Office Fund Inc. Class A | 275 | 1,991 |
10
| | | |
| Vanguard® Developed Markets Index Fund | | |
| Schedule of Investments | | |
| April 30, 2011 | | |
| |
| | | | Market |
| | | | Value |
| | | Shares | ($000) |
| | Kansai Paint Co. Ltd. | 220,336 | 1,987 |
| | Sumitomo Rubber Industries Ltd. | 175,355 | 1,987 |
| | Aeon Mall Co. Ltd. | 82,580 | 1,986 |
| | Toho Gas Co. Ltd. | 423,466 | 1,983 |
| | Tosoh Corp. | 511,848 | 1,980 |
| | Cosmo Oil Co. Ltd. | 594,594 | 1,963 |
| | Japan Prime Realty Investment Corp. | 689 | 1,959 |
| | Nishi-Nippon City Bank Ltd. | 689,619 | 1,953 |
| | Yamaguchi Financial Group Inc. | 214,421 | 1,937 |
| | Tsumura & Co. | 61,787 | 1,922 |
| | Casio Computer Co. Ltd. | 241,378 | 1,919 |
| * | Gree Inc. | 91,800 | 1,890 |
| | Konami Corp. | 94,774 | 1,889 |
| | Minebea Co. Ltd. | 341,984 | 1,851 |
| | Takashimaya Co. Ltd. | 267,991 | 1,832 |
| | Fuji Electric Co. Ltd. | 568,073 | 1,790 |
| | NOK Corp. | 104,558 | 1,787 |
| | Mitsui Engineering & Shipbuilding Co. Ltd. | 715,648 | 1,777 |
| | Air Water Inc. | 146,142 | 1,767 |
| | Daicel Chemical Industries Ltd. | 273,860 | 1,766 |
| | Yokogawa Electric Corp. | 217,483 | 1,762 |
| | Suruga Bank Ltd. | 209,578 | 1,749 |
| | McDonald's Holdings Co. Japan Ltd. | 67,701 | 1,735 |
| | USS Co. Ltd. | 22,189 | 1,705 |
| | Oracle Corp. Japan | 39,013 | 1,691 |
| | Suzuken Co. Ltd. | 67,070 | 1,677 |
| | Shinsei Bank Ltd. | 1,391,659 | 1,674 |
| | UNY Co. Ltd. | 190,400 | 1,669 |
| | Tokuyama Corp. | 315,718 | 1,641 |
| | Dowa Holdings Co. Ltd. | 249,155 | 1,634 |
| | Daido Steel Co. Ltd. | 284,294 | 1,625 |
| | Toho Co. Ltd. | 106,126 | 1,607 |
| | Keisei Electric Railway Co. Ltd. | 276,050 | 1,602 |
| | 77 Bank Ltd. | 345,576 | 1,596 |
| | Kikkoman Corp. | 158,463 | 1,573 |
| | Yamazaki Baking Co. Ltd. | 121,887 | 1,572 |
| | Marui Group Co. Ltd. | 226,913 | 1,568 |
| | Chiyoda Corp. | 157,000 | 1,563 |
| | Koito Manufacturing Co. Ltd. | 97,800 | 1,538 |
| | Dainippon Sumitomo Pharma Co. Ltd. | 159,453 | 1,533 |
| | Nomura Real Estate Holdings Inc. | 98,185 | 1,517 |
| | Citizen Holdings Co. Ltd. | 248,973 | 1,508 |
| | Mizuho Securities Co. Ltd. | 582,851 | 1,483 |
| | Nissan Chemical Industries Ltd. | 141,160 | 1,465 |
| | Toyoda Gosei Co. Ltd. | 66,825 | 1,460 |
| | Hitachi High-Technologies Corp. | 69,242 | 1,457 |
| | Sapporo Hokuyo Holdings Inc. | 325,795 | 1,445 |
| | Japan Petroleum Exploration Co. | 29,444 | 1,444 |
| | NHK Spring Co. Ltd. | 149,731 | 1,424 |
| | Tokyo Tatemono Co. Ltd. | 393,268 | 1,422 |
| | Nisshin Steel Co. Ltd. | 706,099 | 1,409 |
| | Yamato Kogyo Co. Ltd. | 42,248 | 1,394 |
| | Alfresa Holdings Corp. | 39,121 | 1,381 |
| | Obic Co. Ltd. | 7,024 | 1,303 |
| | Mitsubishi Logistics Corp. | 116,534 | 1,289 |
| | Mizuho Trust & Banking Co. Ltd. | 1,509,498 | 1,276 |
| | Nisshinbo Holdings Inc. | 127,834 | 1,265 |
| | Hakuhodo DY Holdings Inc. | 24,063 | 1,260 |
| | Mabuchi Motor Co. Ltd. | 25,267 | 1,254 |
| | Hino Motors Ltd. | 264,344 | 1,253 |
| | MediPal Holdings Corp. | 147,053 | 1,223 |
| | Kinden Corp. | 137,808 | 1,175 |
| | Maruichi Steel Tube Ltd. | 46,720 | 1,163 |
| | Coca-Cola West Co. Ltd. | 55,929 | 1,158 |
11
| | | |
| Vanguard® Developed Markets Index Fund | | |
| Schedule of Investments | | |
| April 30, 2011 | | |
| |
| | | | Market |
| | | | Value |
| | | Shares | ($000) |
| | Seven Bank Ltd. | 606 | 1,148 |
| | Tokyo Steel Manufacturing Co. Ltd. | 102,799 | 1,114 |
| | Square Enix Holdings Co. Ltd. | 65,125 | 1,085 |
| | Aeon Credit Service Co. Ltd. | 79,187 | 1,074 |
| | Aozora Bank Ltd. | 492,486 | 1,067 |
| | Itochu Techno-Solutions Corp. | 29,773 | 1,056 |
| | Toyota Boshoku Corp. | 66,415 | 1,035 |
| | Sapporo Holdings Ltd. | 253,883 | 1,020 |
| | Mitsumi Electric Co. Ltd. | 78,034 | 1,001 |
| | Otsuka Corp. | 15,832 | 994 |
| | Senshu Ikeda Holdings Inc. | 658,028 | 983 |
| | Ito En Ltd. | 55,246 | 981 |
| | ABC-Mart Inc. | 26,064 | 977 |
| | NTT Urban Development Corp. | 1,142 | 948 |
| | Shinko Electric Industries Co. Ltd. | 70,187 | 721 |
| | Canon Marketing Japan Inc. | 61,810 | 685 |
| | Matsui Securities Co. Ltd. | 128,002 | 631 |
| | Fuji Media Holdings Inc. | 470 | 628 |
| | | | 2,369,694 |
| Netherlands (2.6%) | | |
| | Unilever NV | 1,638,865 | 53,953 |
| * | ING Groep NV | 3,853,838 | 50,771 |
| | Koninklijke Philips Electronics NV | 992,075 | 29,383 |
| | Koninklijke KPN NV | 1,582,184 | 25,104 |
| | Akzo Nobel NV | 233,080 | 18,073 |
| | ASML Holding NV | 425,399 | 17,732 |
| | Koninklijke Ahold NV | 1,199,172 | 16,841 |
| | Heineken NV | 260,789 | 15,604 |
| * | Aegon NV | 1,728,359 | 13,738 |
| | Koninklijke DSM NV | 155,162 | 10,695 |
| | TNT NV | 378,662 | 9,318 |
| | Reed Elsevier NV | 691,910 | 9,027 |
| | Wolters Kluwer NV | 300,515 | 7,002 |
| | Fugro NV | 68,905 | 6,316 |
| | Randstad Holding NV | 111,196 | 6,256 |
| | Heineken Holding NV | 116,352 | 6,139 |
| * | SBM Offshore NV | 168,110 | 4,916 |
| | Corio NV | 59,733 | 4,230 |
| | Koninklijke Boskalis Westminster NV | 70,616 | 3,753 |
| | Koninklijke Vopak NV | 71,156 | 3,409 |
| ^ | Delta Lloyd NV | 74,969 | 1,972 |
| | ASML Holding NV ADR | 8,519 | 356 |
| * | Aegon NV | 860 | 7 |
| | | | 314,595 |
| New Zealand (0.1%) | | |
| | Fletcher Building Ltd. | 679,699 | 5,067 |
| | Telecom Corp. of New Zealand Ltd. | 1,935,333 | 3,394 |
| | Auckland International Airport Ltd. | 935,665 | 1,683 |
| | Sky City Entertainment Group Ltd. | 580,858 | 1,676 |
| | Contact Energy Ltd. | 317,395 | 1,531 |
| | | | 13,351 |
| Norway (0.9%) | | |
| | Statoil ASA | 1,122,809 | 32,892 |
| ^ | DnB NOR ASA | 983,254 | 15,988 |
| | Telenor ASA | 834,022 | 14,408 |
| | Yara International ASA | 190,692 | 11,164 |
| | Seadrill Ltd. | 278,767 | 9,890 |
| ^ | Norsk Hydro ASA | 897,160 | 7,958 |
| ^ | Orkla ASA | 776,479 | 7,858 |
| | Subsea 7 SA | 284,209 | 7,486 |
| *,^ | Aker Solutions ASA | 166,280 | 4,008 |
| *,^ | Renewable Energy Corp. ASA | 499,053 | 1,762 |
| | | | 113,414 |
12
| | | |
| Vanguard® Developed Markets Index Fund | | |
| Schedule of Investments | | |
| April 30, 2011 | | |
| |
| | | | Market |
| | | | Value |
| | | Shares | ($000) |
| Portugal (0.3%) | | |
| | EDP - Energias de Portugal SA | 1,916,355 | 7,829 |
| | Portugal Telecom SGPS SA | 586,352 | 7,176 |
| | Galp Energia SGPS SA Class B | 233,634 | 5,226 |
| | Jeronimo Martins SGPS SA | 220,748 | 3,621 |
| *,^ | Banco Comercial Portugues SA | 2,996,187 | 2,390 |
| ^ | Banco Espirito Santo SA | 530,341 | 2,234 |
| * | EDP Renovaveis SA | 223,206 | 1,719 |
| | Cimpor Cimentos de Portugal SGPS SA | 200,510 | 1,385 |
| * | Brisa Auto-Estradas de Portugal SA | 181,283 | 1,213 |
| | | | 32,793 |
| Singapore (1.7%) | | |
| | DBS Group Holdings Ltd. | 1,743,014 | 21,355 |
| | Singapore Telecommunications Ltd. | 8,016,744 | 20,464 |
| | United Overseas Bank Ltd. | 1,242,172 | 19,931 |
| | Oversea-Chinese Banking Corp. Ltd. | 2,522,085 | 19,696 |
| | Keppel Corp. Ltd. | 1,418,814 | 13,817 |
| * | Genting Singapore plc | 6,128,278 | 10,884 |
| | Wilmar International Ltd. | 1,930,824 | 8,321 |
| | CapitaLand Ltd. | 2,575,314 | 7,163 |
| | Noble Group Ltd. | 3,828,800 | 6,995 |
| | Singapore Airlines Ltd. | 542,720 | 6,252 |
| | Singapore Exchange Ltd. | 861,263 | 5,495 |
| | City Developments Ltd. | 550,861 | 5,336 |
| | Fraser and Neave Ltd. | 992,729 | 5,089 |
| | Singapore Press Holdings Ltd. | 1,545,749 | 5,030 |
| * | Hutchison Port Holdings Trust | 5,230,486 | 4,812 |
| | SembCorp Industries Ltd. | 992,023 | 4,383 |
| | Singapore Technologies Engineering Ltd. | 1,678,716 | 4,326 |
| | SembCorp Marine Ltd. | 830,386 | 3,853 |
| | Golden Agri-Resources Ltd. | 6,673,260 | 3,635 |
| | CapitaMall Trust | 2,242,404 | 3,469 |
| | Jardine Cycle & Carriage Ltd. | 107,899 | 3,256 |
| | Olam International Ltd. | 1,282,974 | 3,014 |
| | Ascendas Real Estate Investment Trust | 1,769,174 | 2,938 |
| | Yangzijiang Shipbuilding Holdings Ltd. | 1,931,000 | 2,860 |
| * | Global Logistic Properties Ltd. | 1,584,000 | 2,499 |
| | Keppel Land Ltd. | 725,000 | 2,474 |
| | ComfortDelGro Corp. Ltd. | 1,899,863 | 2,379 |
| | CapitaMalls Asia Ltd. | 1,350,000 | 1,956 |
| | UOL Group Ltd. | 467,201 | 1,850 |
| ^ | Cosco Corp. Singapore Ltd. | 1,006,993 | 1,833 |
| | StarHub Ltd. | 610,055 | 1,432 |
| | Neptune Orient Lines Ltd. | 915,562 | 1,410 |
| * | Golden Agri-Resources Ltd. Warrants Exp. 07/23/2012 | 296,075 | 39 |
| | | | 208,246 |
| Spain (3.6%) | | |
| | Telefonica SA | 4,067,380 | 109,271 |
| | Banco Santander SA | 8,379,513 | 107,011 |
| | Banco Bilbao Vizcaya Argentaria SA | 4,292,221 | 54,981 |
| | Iberdrola SA | 3,807,411 | 35,308 |
| | Repsol YPF SA | 736,977 | 26,309 |
| | Inditex SA | 219,498 | 19,684 |
| | ACS Actividades de Construccion y Servicios SA | 142,480 | 7,169 |
| | Abertis Infraestructuras SA | 297,453 | 7,046 |
| | Red Electrica Corp. SA | 108,890 | 6,938 |
| | Gas Natural SDG SA | 324,624 | 6,675 |
| | Criteria Caixacorp SA | 842,249 | 6,213 |
| | Ferrovial SA | 441,558 | 6,088 |
| | Banco Popular Espanol SA | 902,769 | 5,408 |
| | Banco de Sabadell SA | 1,112,676 | 4,928 |
| | Enagas SA | 179,940 | 4,449 |
| * | Amadeus IT Holding SA | 203,389 | 4,263 |
| | Iberdrola Renovables SA | 847,544 | 3,879 |
13
| | | |
| Vanguard® Developed Markets Index Fund | | |
| Schedule of Investments | | |
| April 30, 2011 | | |
| |
| | | | Market |
| | | | Value |
| | | Shares | ($000) |
| | Mapfre SA | 755,360 | 3,153 |
| | Acciona SA | 25,488 | 2,965 |
| | Grifols SA | 138,759 | 2,747 |
| | Zardoya Otis SA | 141,111 | 2,402 |
| | Bankinter SA | 287,069 | 2,141 |
| * | International Consolidated Airlines Group SA | 526,769 | 2,100 |
| | Indra Sistemas SA | 91,155 | 2,068 |
| | Acerinox SA | 100,509 | 2,019 |
| * | Gestevision Telecinco SA | 170,388 | 1,915 |
| | Telefonica SA ADR | 65,067 | 1,754 |
| ^ | Fomento de Construcciones y Contratas SA | 51,203 | 1,740 |
| * | International Consolidated Airlines Group SA | 431,952 | 1,719 |
| *,^ | Banco de Valencia SA | 219,215 | 886 |
| *,^ | Banco de Valencia SA Rights Exp. 05/09/2011 | 219,245 | 17 |
| | | | 443,246 |
| Sweden (3.2%) | | |
| | Telefonaktiebolaget LM Ericsson Class B | 3,029,864 | 45,974 |
| ^ | Hennes & Mauritz AB Class B | 1,028,679 | 36,356 |
| | Nordea Bank AB | 2,643,626 | 30,141 |
| | Volvo AB Class B | 1,386,664 | 27,251 |
| ^ | Sandvik AB | 1,014,493 | 21,507 |
| ^ | Atlas Copco AB Class A | 675,614 | 19,843 |
| | TeliaSonera AB | 2,258,938 | 18,435 |
| | Svenska Handelsbanken AB Class A | 492,366 | 17,075 |
| | Skandinaviska Enskilda Banken AB Class A | 1,419,156 | 13,642 |
| | Swedbank AB Class A | 718,619 | 13,629 |
| ^ | SKF AB | 392,307 | 12,386 |
| ^ | Investor AB Class B | 458,285 | 11,415 |
| ^ | Atlas Copco AB Class B | 392,624 | 10,407 |
| *,^ | Assa Abloy AB Class B | 313,994 | 9,432 |
| | Svenska Cellulosa AB Class B | 576,977 | 8,845 |
| | Skanska AB Class B | 401,839 | 8,639 |
| ^ | Scania AB Class B | 321,983 | 8,365 |
| | Millicom International Cellular SA | 76,524 | 8,301 |
| ^ | Swedish Match AB | 232,430 | 8,249 |
| ^ | Tele2 AB | 318,992 | 8,011 |
| ^ | Alfa Laval AB | 338,715 | 7,583 |
| | Hexagon AB Class B | 254,251 | 6,606 |
| ^ | Boliden AB | 274,045 | 6,181 |
| | Electrolux AB Class B | 240,314 | 6,116 |
| | Kinnevik Investment AB Class B | 219,210 | 5,660 |
| ^ | Getinge AB | 202,120 | 5,377 |
| | Ratos AB | 102,429 | 4,234 |
| | Securitas AB Class B | 316,772 | 3,970 |
| | Modern Times Group AB Class B | 50,957 | 3,909 |
| | Husqvarna AB | 418,987 | 3,296 |
| | SSAB AB Class A | 182,424 | 3,260 |
| | Industrivarden AB | 119,344 | 2,382 |
| | Holmen AB | 53,649 | 1,980 |
| | | | 398,457 |
| Switzerland (8.0%) | | |
| | Nestle SA | 3,485,944 | 216,367 |
| | Novartis AG | 2,122,862 | 125,886 |
| | Roche Holding AG | 706,815 | 114,730 |
| * | UBS AG | 3,636,450 | 72,775 |
| | ABB Ltd. | 2,204,597 | 60,881 |
| | Credit Suisse Group AG | 1,133,275 | 51,583 |
| | Zurich Financial Services AG | 146,522 | 41,199 |
| | Cie Financiere Richemont SA | 525,173 | 33,968 |
| | Syngenta AG | 95,177 | 33,660 |
| * | Transocean Ltd. | 320,965 | 23,732 |
| | Holcim Ltd. | 246,812 | 21,505 |
| | Swiss Reinsurance Co. Ltd. | 354,318 | 21,141 |
| | Swatch Group AG (Bearer) | 31,031 | 15,281 |
14
| | | |
| Vanguard® Developed Markets Index Fund | | |
| Schedule of Investments | | |
| April 30, 2011 | | |
| |
| | | | Market |
| | | | Value |
| | | Shares | ($000) |
| | SGS SA | 5,511 | 10,950 |
| | Swisscom AG | 23,456 | 10,766 |
| 2 | Synthes Inc. | 59,727 | 10,294 |
| | Julius Baer Group Ltd. | 207,906 | 9,729 |
| | Givaudan SA | 8,363 | 9,305 |
| | Geberit AG | 39,174 | 9,166 |
| | Adecco SA | 123,783 | 8,846 |
| | Kuehne & Nagel International AG | 54,336 | 8,689 |
| | Schindler Holding AG (Bearer) | 48,713 | 6,305 |
| * | Actelion Ltd. | 102,130 | 6,017 |
| | Swiss Life Holding AG | 30,778 | 5,620 |
| * | Baloise Holding AG | 50,493 | 5,588 |
| | Sika AG | 2,064 | 5,272 |
| | Sonova Holding AG | 46,309 | 4,679 |
| * | Lindt & Spruengli AG | 113 | 4,208 |
| | Lonza Group AG | 47,895 | 4,119 |
| | GAM Holding AG | 208,664 | 4,113 |
| | Swatch Group AG (Registered) | 43,559 | 3,869 |
| | Aryzta AG | 56,282 | 3,139 |
| * | Lindt & Spruengli AG | 902 | 2,990 |
| | Schindler Holding AG (Registered) | 21,513 | 2,771 |
| | Pargesa Holding SA | 26,932 | 2,770 |
| *,^ | Logitech International SA | 182,958 | 2,537 |
| | Straumann Holding AG | 7,771 | 2,033 |
| | Aryzta AG | 29,041 | 1,596 |
| * | UBS AG | 24,848 | 497 |
| | | | 978,576 |
| United Kingdom (21.4%) | | |
| | HSBC Holdings plc | 17,927,950 | 195,559 |
| | BP plc | 19,049,979 | 146,444 |
| | Vodafone Group plc | 50,359,672 | 145,582 |
| | GlaxoSmithKline plc | 5,266,181 | 115,041 |
| | Rio Tinto plc | 1,469,758 | 107,243 |
| | Royal Dutch Shell plc Class B | 2,732,690 | 106,316 |
| | BHP Billiton plc | 2,231,845 | 94,364 |
| | British American Tobacco plc | 2,024,091 | 88,448 |
| | BG Group plc | 3,431,946 | 88,379 |
| | Royal Dutch Shell plc Class A | 2,002,898 | 78,017 |
| | AstraZeneca plc | 1,433,517 | 71,129 |
| | Anglo American plc | 1,337,936 | 70,134 |
| | Standard Chartered plc | 2,377,142 | 66,066 |
| | Royal Dutch Shell plc Class A (Amsterdam Shares) | 1,564,209 | 60,424 |
| | Barclays plc | 11,730,176 | 55,766 |
| | Tesco plc | 8,137,854 | 54,865 |
| | Xstrata plc | 2,103,655 | 53,958 |
| | Diageo plc | 2,536,728 | 51,606 |
| | Unilever plc | 1,301,382 | 42,278 |
| * | Lloyds Banking Group plc | 41,417,918 | 41,123 |
| | Imperial Tobacco Group plc | 1,031,633 | 36,389 |
| | National Grid plc | 3,541,364 | 36,335 |
| | SABMiller plc | 963,728 | 36,003 |
| | Reckitt Benckiser Group plc | 624,774 | 34,767 |
| | Prudential plc | 2,579,334 | 33,370 |
| | Centrica plc | 5,224,156 | 28,056 |
| | BT Group plc | 7,869,263 | 25,836 |
| | Tullow Oil plc | 901,235 | 21,624 |
| | Scottish & Southern Energy plc | 943,296 | 21,401 |
| | Aviva plc | 2,855,271 | 21,369 |
| | Rolls-Royce Group plc | 1,895,364 | 20,385 |
| | BAE Systems plc | 3,452,088 | 18,950 |
| | Compass Group plc | 1,912,769 | 18,718 |
| | Shire plc | 569,465 | 17,672 |
| | British Sky Broadcasting Group plc | 1,154,435 | 16,257 |
| | Pearson plc | 823,485 | 15,783 |
15
| | | |
| Vanguard® Developed Markets Index Fund | | |
| Schedule of Investments | | |
| April 30, 2011 | | |
| |
| | | | Market |
| | | | Value |
| | | Shares | ($000) |
| | WPP plc | 1,181,058 | 15,470 |
| | ARM Holdings plc | 1,340,304 | 13,892 |
| | Experian plc | 1,023,586 | 13,813 |
| | Old Mutual plc | 5,532,675 | 12,897 |
| * | Royal Bank of Scotland Group plc | 17,637,352 | 12,293 |
| | Legal & General Group plc | 5,951,199 | 12,241 |
| | Kingfisher plc | 2,396,585 | 11,011 |
| | Reed Elsevier plc | 1,232,535 | 10,920 |
| * | Cairn Energy plc | 1,420,066 | 10,744 |
| | WM Morrison Supermarkets plc | 2,157,775 | 10,646 |
| | Wolseley plc | 288,759 | 10,489 |
| | Marks & Spencer Group plc | 1,607,264 | 10,443 |
| | Land Securities Group plc | 778,480 | 10,233 |
| | Smith & Nephew plc | 902,368 | 9,910 |
| | Burberry Group plc | 442,300 | 9,598 |
| | Antofagasta plc | 400,440 | 9,210 |
| | British Land Co. plc | 898,733 | 9,049 |
| | Smiths Group plc | 397,471 | 8,863 |
| | Standard Life plc | 2,319,812 | 8,791 |
| | International Power plc | 1,552,253 | 8,591 |
| | RSA Insurance Group plc | 3,546,830 | 8,174 |
| * | Randgold Resources Ltd. | 92,498 | 8,043 |
| | Aggreko plc | 264,753 | 7,921 |
| | Capita Group plc | 622,931 | 7,667 |
| | Man Group plc | 1,812,524 | 7,585 |
| | Resolution Ltd. | 1,477,336 | 7,481 |
| | Carnival plc | 185,345 | 7,463 |
| | Vodafone Group plc ADR | 255,762 | 7,448 |
| | United Utilities Group plc | 693,261 | 7,326 |
| | Johnson Matthey plc | 218,365 | 7,315 |
| | J Sainsbury plc | 1,233,775 | 7,187 |
| | Next plc | 186,505 | 6,988 |
| | Weir Group plc | 212,874 | 6,857 |
| | AMEC plc | 334,377 | 6,713 |
| | G4S plc | 1,435,399 | 6,629 |
| | Petrofac Ltd. | 261,857 | 6,620 |
| | Intercontinental Hotels Group plc | 291,848 | 6,407 |
| | Sage Group plc | 1,330,685 | 6,350 |
| | Associated British Foods plc | 359,912 | 6,062 |
| | Severn Trent plc | 239,736 | 6,027 |
| * | Autonomy Corp. plc | 220,537 | 5,952 |
| | Rexam plc | 885,520 | 5,787 |
| | Admiral Group plc | 204,081 | 5,774 |
| | Intertek Group plc | 161,123 | 5,724 |
| | Hammerson plc | 713,754 | 5,611 |
| | Kazakhmys plc | 216,206 | 5,022 |
| | Whitbread plc | 178,403 | 5,016 |
| | Fresnillo plc | 181,671 | 5,007 |
| | ICAP plc | 566,491 | 4,916 |
| * | ITV plc | 3,731,015 | 4,751 |
| | Serco Group plc | 498,729 | 4,717 |
| | Vedanta Resources plc | 120,785 | 4,717 |
| | Invensys plc | 819,733 | 4,667 |
| | 3i Group plc | 981,107 | 4,601 |
| | Inmarsat plc | 442,773 | 4,509 |
| | Lonmin plc | 163,919 | 4,490 |
| | Cobham plc | 1,170,271 | 4,470 |
| | Bunzl plc | 332,418 | 4,139 |
| | Segro plc | 755,483 | 4,112 |
| | Eurasian Natural Resources Corp. plc | 262,153 | 4,017 |
| | Investec plc | 490,067 | 3,947 |
| | Babcock International Group plc | 364,369 | 3,903 |
| | Capital Shopping Centres Group plc | 565,392 | 3,842 |
| | Balfour Beatty plc | 693,543 | 3,805 |
16
| | | | | |
| Vanguard® Developed Markets Index Fund | | | | |
| Schedule of Investments | | | | |
| April 30, 2011 | | | | |
| |
| | | | | | Market |
| | | | | | Value |
| | | | | Shares | ($000) |
| | Schroders plc | | | 115,325 | 3,664 |
| | Home Retail Group plc | | | 826,343 | 3,050 |
| | Firstgroup plc | | | 488,500 | 2,654 |
| * | Essar Energy plc | | | 331,772 | 2,560 |
| | Thomas Cook Group plc | | | 876,097 | 2,514 |
| | TUI Travel plc | | | 561,441 | 2,252 |
| | London Stock Exchange Group plc | | | 151,751 | 2,215 |
| | Cable & Wireless Worldwide plc | | | 2,684,712 | 2,160 |
| | | | | | 2,631,589 |
| Total Common Stocks (Cost $9,179,385) | | | | 12,171,629 |
| |
| | | Coupon | | | |
| |
| Temporary Cash Investments (4.9%)1 | | | | |
| Money Market Fund (4.9%) | | | | |
| 3,4 | Vanguard Market Liquidity Fund | 0.179% | | 597,218,000 | 597,218 |
| |
| | | | | Face | |
| | | | Maturity | Amount | |
| | | | Date | ($000) | |
| U.S. Government and Agency Obligations (0.0%) | | | | |
| 5,6 | Fannie Mae Discount Notes | 0.140% | 6/22/11 | 750 | 750 |
| 5,6 | Freddie Mac Discount Notes | 0.200% | 6/13/11 | 1,500 | 1,500 |
| 5,6 | Freddie Mac Discount Notes | 0.110% | 8/10/11 | 1,000 | 999 |
| | | | | | 3,249 |
| Total Temporary Cash Investments (Cost $600,467) | | | | 600,467 |
| Total Investments (104.1%) (Cost $9,779,852) | | | | 12,772,096 |
| Other Assets and Liabilities—Net (-4.1%)4 | | | | (504,341) |
| Net Assets (100%) | | | | 12,267,755 |
* Non-income-producing security.
^ Part of security position is on loan to broker-dealers. The total value of securities on loan is $567,552,000.
1 The fund invests a portion of its cash reserves in equity markets through the use of index futures contracts. After giving effect to futures investments, the fund's effective common stock and temporary cash investment positions represent 99.6% and 4.5%, respectively, of net assets.
2 Security exempt from registration under Rule 144A of the Securities Act of 1933. Such securities may be sold in transactions exempt from registration, normally to qualified institutional buyers. At April 30, 2011, the value of this security represented 0.1% of net assets.
3 Affiliated money market fund available only to Vanguard funds and certain trusts and accounts managed by Vanguard. Rate shown is the 7-day yield.
4 Includes $597,217,000 of collateral received for securities on loan.
5 The issuer operates under a congressional charter; its securities are not backed by the full faith and credit of the U.S. government.
6 Securities with a value of $3,249,000 have been segregated as initial margin for open futures contracts.
ADR—American Depositary Receipt.
REIT—Real Estate Investment Trust.
17
© 2011 The Vanguard Group. Inc.
All rights reserved.
Vanguard Marketing Corporation, Distributor.
SNA2272_062011
Item 2: Code of Ethics.
Not Applicable.
Item 3: Audit Committee Financial Expert.
Not Applicable.
Item 4: Principal Accountant Fees and Services.
Not Applicable.
Item 5: Audit Committee of Listed Registrants.
Not Applicable.
Item 6: Investments.
Not Applicable.
Item 7: Disclosure of Proxy Voting Policies and Procedures for Closed-End Management Investment Companies.
Not Applicable.
Item 8: Portfolio Managers of Closed-End Management Investment Companies.
Not Applicable.
Item 9: Purchase of Equity Securities by Closed-End Management Investment Company and Affiliated Purchasers.
Not Applicable.
Item 10: Submission of Matters to a Vote of Security Holders.
Not Applicable.
Item 11: Controls and Procedures.
(a) Disclosure Controls and Procedures. The Principal Executive and Financial Officers concluded that the Registrant's Disclosure Controls and Procedures are effective based on their evaluation of the Disclosure Controls and Procedures as of a date within 90 days of the filing date of this report.
(b) Internal Control Over Financial Reporting. There were no significant changes in Registrant’s Internal Control Over Financial Reporting or in other factors that could significantly affect this control subsequent to the date of the evaluation, including any corrective actions with regard to significant deficiencies and material weaknesses.
Item 12: Exhibits.
(a) Certifications.
Pursuant to the requirements of the Securities Exchange Act of 1934 and the Investment Company Act of 1940, the registrant has duly caused this report to be signed on its behalf by the undersigned, thereunto duly authorized.
| |
| | VANGUARD STAR FUNDS |
| |
| By: | /s/ F. WILLIAM MCNABB III* |
| | F. WILLIAM MCNABB III |
| | CHIEF EXECUTIVE OFFICER |
| |
| Date: June 16, 2011 | |
Pursuant to the requirements of the Securities Exchange Act of 1934 and the Investment Company Act of 1940, this report has been signed below by the following persons on behalf of the registrant and in the capacities and on the dates indicated.
| |
| | VANGUARD STAR FUNDS |
| |
| By: | /s/ F. WILLIAM MCNABB III* |
| | F. WILLIAM MCNABB III |
| | CHIEF EXECUTIVE OFFICER |
| |
| Date: June 16, 2011 | |
| |
| | VANGUARD STAR FUNDS |
| |
| By: | /s/ THOMAS J. HIGGINS* |
| | THOMAS J. HIGGINS |
| | CHIEF FINANCIAL OFFICER |
| |
| Date: June 16, 2011 | |
* By: /s/ Heidi Stam
Heidi Stam, pursuant to a Power of Attorney filed on April 26, 2010, see file Number 33-53683,
Incorporated by Reference.