UNITED STATES
SECURITIES AND EXCHANGE COMMISSION
Washington, D.C. 20549
FORM N-CSR
CERTIFIED SHAREHOLDER REPORT
OF
REGISTERED MANAGEMENT INVESTMENT COMPANIES
Investment Company Act file number: 811-03919
| | |
| Name of Registrant: | Vanguard STAR Funds |
| Address of Registrant: | P.O. Box 2600 |
| | Valley Forge, PA 19482 |
| Name and address of agent for service: | John E. Schadl, Esquire |
| | P.O. Box 876 |
| | Valley Forge, PA 19482 |
Registrant’s telephone number, including area code: (610) 669-1000
Date of fiscal year end: October 31
Date of reporting period: November 1, 2023—October 31, 2024
Item 1: Reports to Shareholders.
TABLE OF CONTENTS
Vanguard LifeStrategy Income Fund
Investor Shares - VASIX |
| | |
Vanguard LifeStrategy Conservative Growth Fund
Investor Shares - VSCGX |
| | |
Vanguard LifeStrategy Moderate Growth Fund
Investor Shares - VSMGX |
| | |
Vanguard LifeStrategy Growth Fund
Investor Shares - VASGX |
| | |
Vanguard STAR Fund
Investor Shares - VGSTX |
| | |
Vanguard Total International Stock Index Fund
Investor Shares - VGTSX |
| | |
Vanguard Total International Stock Index Fund
ETF Shares - VXUS |
| | |
Vanguard Total International Stock Index Fund
Admiral™ Shares - VTIAX |
| | |
Vanguard Total International Stock Index Fund
Institutional Shares - VTSNX |
| | |
Vanguard Total International Stock Index Fund
Institutional Plus Shares - VTPSX |
| | |
Vanguard Total International Stock Index Fund
Institutional Select Shares - VTISX |
| | |
Vanguard LifeStrategy Income Fund
Investor Shares (VASIX)
Annual Shareholder Report | October 31, 2024
This annual shareholder report contains important information about Vanguard LifeStrategy Income Fund (the "Fund") for the period of November 1, 2023, to October 31, 2024. You can find additional information about the Fund at https://personal1.vanguard.com/ngf-next-gen-form-webapp/fund-literature. You can also request this information by contacting us at 800-662-7447.
What were the Fund costs for the last year?
(based on a hypothetical $10,000 investment)
| Share Class Name | Costs of a $10,000 investment | Costs paid as a percentage of a $10,000 investment |
| Investor Shares | $12 | 0.11% |
How did the Fund perform during the reporting period?
For the 12 months ended October 31, 2024, the Fund underperformed its benchmark, the Income Composite Index. This was largely because of differences in the price of international equity securities used by the Fund to calculate its net asset value and the quoted published prices for the same securities. This practice is known as fair-value pricing. The Fund also diverged from the index due to tax withholding differences that were tied to investments in international equity securities.
Global economic growth appeared relatively stable at around 3% during the period, and U.S. recession fears faded. With inflation continuing to moderate across much of the world, major central banks including the European Central Bank, the Bank of England, and the U.S. Federal Reserve began lowering policy rates. Global stocks posted very strong returns.
As a fund of funds, the Fund provides a broadly diversified portfolio in a single fund. Its four underlying funds posted returns as follows: U.S. stocks about 38%, U.S. bonds about 10%, international stocks about 23%, and international bonds more than 9%.
How did the Fund perform over the past 10 years?
Keep in mind that the Fund's past performance does not indicate how the Fund will perform in the future. Updated performance information is available on our website at vanguard.com/performance or by calling Vanguard toll-free at 800-662-7447. The graph and returns shown do not reflect taxes that a shareholder would pay on fund distributions or on the sale of fund shares.
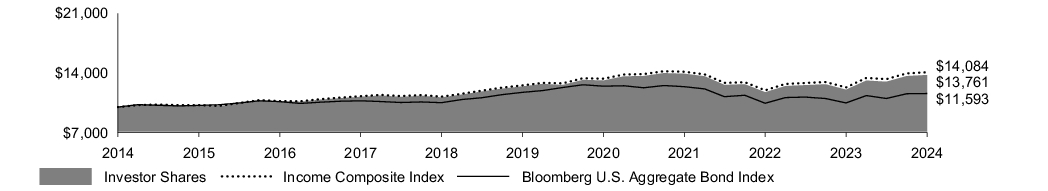
Cumulative Performance: October 31, 2014, Through October 31, 2024
Initial Investment of $ 10,000
| Average Annual Total Returns | | | |
| 1 Year | 5 Years | 10 Years |
| Investor Shares | 14.31% | 2.07% | 3.24% |
| Income Composite Index | 14.42% | 2.34% | 3.48% |
| Bloomberg U.S. Aggregate Bond Index | 10.55% | -0.23% | 1.49% |
This table reflects the Fund’s investments, including short-term investments, derivatives and other assets and liabilities.
Fund Statistics
(as of October 31, 2024) | |
Fund Net Assets
(in millions) | $3,971 |
| Number of Portfolio Holdings | 7 |
| Portfolio Turnover Rate | 5% |
Total Investment Advisory Fees
(in thousands) | $0 |
Portfolio Composition % of Net Assets
(as of October 31, 2024) |
| Vanguard Total Bond Market II Index Fund Investor Shares | 55.7% |
| Vanguard Total International Bond II Index Fund Investor Shares | 24.3% |
| Vanguard Total Stock Market Index Fund Investor Shares | 11.5% |
| Vanguard Total International Stock Index Fund Investor Shares | 7.9% |
| Other Assets and Liabilities—Net | 0.6% |
Where can I find additional information about the Fund?
Additional information about the Fund, including its prospectus, financial information, holdings, and proxy voting information is available at https://personal1.vanguard.com/ngf-next-gen-form-webapp/fund-literature.
Connect with Vanguard ® • vanguard.com
Fund Information • 800-662-7447
Direct Investor Account Services • 800-662-2739
Text Telephone for People Who Are Deaf or Hard of Hearing • 800-749-7273
© 2024 The Vanguard Group, Inc.
All rights reserved.
Vanguard Marketing Corporation, Distributor.
AR723
Vanguard LifeStrategy Conservative Growth Fund
Investor Shares (VSCGX)
Annual Shareholder Report | October 31, 2024
This annual shareholder report contains important information about Vanguard LifeStrategy Conservative Growth Fund (the "Fund") for the period of November 1, 2023, to October 31, 2024. You can find additional information about the Fund at https://personal1.vanguard.com/ngf-next-gen-form-webapp/fund-literature. You can also request this information by contacting us at 800-662-7447.
What were the Fund costs for the last year?
(based on a hypothetical $10,000 investment)
| Share Class Name | Costs of a $10,000 investment | Costs paid as a percentage of a $10,000 investment |
| Investor Shares | $13 | 0.12% |
How did the Fund perform during the reporting period?
For the 12 months ended October 31, 2024, the Fund underperformed its benchmark, the Conservative Growth Composite Index. This was largely because of differences in the price of international equity securities used by the Fund to calculate its net asset value and the quoted published prices for the same securities. This practice is known as fair-value pricing. The Fund also diverged from the index due to tax withholding differences that were tied to investments in international equity securities.
Global economic growth appeared relatively stable at around 3% during the period, and U.S. recession fears faded. With inflation continuing to moderate across much of the world, major central banks including the European Central Bank, the Bank of England, and the U.S. Federal Reserve began lowering policy rates. Global stocks posted very strong returns.
As a fund of funds, the Fund provides a broadly diversified portfolio in a single fund. Its four underlying funds posted returns as follows: U.S. stocks about 38%, U.S. bonds about 10%, international stocks about 23%, and international bonds more than 9%.
How did the Fund perform over the past 10 years?
Keep in mind that the Fund's past performance does not indicate how the Fund will perform in the future. Updated performance information is available on our website at vanguard.com/performance or by calling Vanguard toll-free at 800-662-7447. The graph and returns shown do not reflect taxes that a shareholder would pay on fund distributions or on the sale of fund shares.
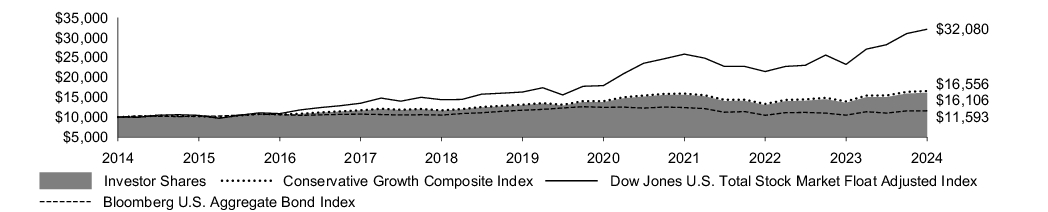
Cumulative Performance: October 31, 2014, Through October 31, 2024
Initial Investment of $ 10,000
| Average Annual Total Returns | | | |
| 1 Year | 5 Years | 10 Years |
| Investor Shares | 18.51% | 4.40% | 4.88% |
| Conservative Growth Composite Index | 18.78% | 4.76% | 5.17% |
| Dow Jones U.S. Total Stock Market Float Adjusted Index | 37.99% | 14.51% | 12.36% |
| Bloomberg U.S. Aggregate Bond Index | 10.55% | -0.23% | 1.49% |
This table reflects the Fund’s investments, including short-term investments, derivatives and other assets and liabilities.
Fund Statistics
(as of October 31, 2024) | |
Fund Net Assets
(in millions) | $10,302 |
| Number of Portfolio Holdings | 7 |
| Portfolio Turnover Rate | 5% |
Total Investment Advisory Fees
(in thousands) | $0 |
Portfolio Composition % of Net Assets
(as of October 31, 2024) |
| Vanguard Total Bond Market II Index Fund Investor Shares | 41.0% |
| Vanguard Total Stock Market Index Fund Investor Shares | 24.3% |
| Vanguard Total International Bond II Index Fund Investor Shares | 18.1% |
| Vanguard Total International Stock Index Fund Investor Shares | 16.0% |
| Other Assets and Liabilities—Net | 0.6% |
Where can I find additional information about the Fund?
Additional information about the Fund, including its prospectus, financial information, holdings, and proxy voting information is available at https://personal1.vanguard.com/ngf-next-gen-form-webapp/fund-literature.
Connect with Vanguard ® • vanguard.com
Fund Information • 800-662-7447
Direct Investor Account Services • 800-662-2739
Text Telephone for People Who Are Deaf or Hard of Hearing • 800-749-7273
© 2024 The Vanguard Group, Inc.
All rights reserved.
Vanguard Marketing Corporation, Distributor.
AR724
Vanguard LifeStrategy Moderate Growth Fund
Investor Shares (VSMGX)
Annual Shareholder Report | October 31, 2024
This annual shareholder report contains important information about Vanguard LifeStrategy Moderate Growth Fund (the "Fund") for the period of November 1, 2023, to October 31, 2024. You can find additional information about the Fund at https://personal1.vanguard.com/ngf-next-gen-form-webapp/fund-literature. You can also request this information by contacting us at 800-662-7447.
What were the Fund costs for the last year?
(based on a hypothetical $10,000 investment)
| Share Class Name | Costs of a $10,000 investment | Costs paid as a percentage of a $10,000 investment |
| Investor Shares | $14 | 0.13% |
How did the Fund perform during the reporting period?
For the 12 months ended October 31, 2024, the Fund underperformed its benchmark, the Moderate Growth Composite Index. This was largely because of differences in the price of international equity securities used by the Fund to calculate its net asset value and the quoted published prices for the same securities. This practice is known as fair-value pricing. The Fund also diverged from the index due to tax withholding differences that were tied to investments in international equity securities.
Global economic growth appeared relatively stable at around 3% during the period, and U.S. recession fears faded. With inflation continuing to moderate across much of the world, major central banks including the European Central Bank, the Bank of England, and the U.S. Federal Reserve began lowering policy rates. Global stocks posted very strong returns.
As a fund of funds, the Fund provides a broadly diversified portfolio in a single fund. Its four underlying funds posted returns as follows: U.S. stocks about 38%, U.S. bonds about 10%, international stocks about 23%, and international bonds more than 9%.
How did the Fund perform over the past 10 years?
Keep in mind that the Fund's past performance does not indicate how the Fund will perform in the future. Updated performance information is available on our website at vanguard.com/performance or by calling Vanguard toll-free at 800-662-7447. The graph and returns shown do not reflect taxes that a shareholder would pay on fund distributions or on the sale of fund shares.
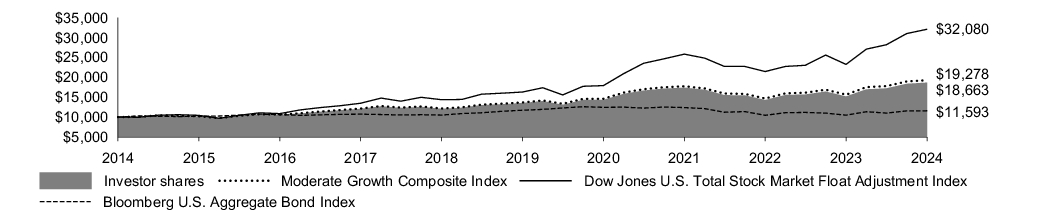
Cumulative Performance: October 31, 2014, Through October 31, 2024
Initial Investment of $ 10,000
| Average Annual Total Returns | | | |
| 1 Year | 5 Years | 10 Years |
| Investor Shares | 22.87% | 6.64% | 6.44% |
| Moderate Growth Composite Index | 23.26% | 7.10% | 6.78% |
| Dow Jones U.S. Total Stock Market Float Adjusted Index | 37.99% | 14.51% | 12.36% |
| Bloomberg U.S. Aggregate Bond Index | 10.55% | -0.23% | 1.49% |
This table reflects the Fund’s investments, including short-term investments, derivatives and other assets and liabilities.
Fund Statistics
(as of October 31, 2024) | |
Fund Net Assets
(in millions) | $21,375 |
| Number of Portfolio Holdings | 7 |
| Portfolio Turnover Rate | 6% |
Total Investment Advisory Fees
(in thousands) | $0 |
Portfolio Composition % of Net Assets
(as of October 31, 2024) |
| Vanguard Total Stock Market Index Fund Investor Shares | 36.3% |
| Vanguard Total Bond Market II Index Fund Investor Shares | 27.1% |
| Vanguard Total International Stock Index Fund Investor Shares | 24.0% |
| Vanguard Total International Bond II Index Fund Investor Shares | 12.0% |
| Other Assets and Liabilities—Net | 0.6% |
Where can I find additional information about the Fund?
Additional information about the Fund, including its prospectus, financial information, holdings, and proxy voting information is available at https://personal1.vanguard.com/ngf-next-gen-form-webapp/fund-literature.
Connect with Vanguard ® • vanguard.com
Fund Information • 800-662-7447
Direct Investor Account Services • 800-662-2739
Text Telephone for People Who Are Deaf or Hard of Hearing • 800-749-7273
© 2024 The Vanguard Group, Inc.
All rights reserved.
Vanguard Marketing Corporation, Distributor.
AR914
Vanguard LifeStrategy Growth Fund
Investor Shares (VASGX)
Annual Shareholder Report | October 31, 2024
This annual shareholder report contains important information about Vanguard LifeStrategy Growth Fund (the "Fund") for the period of November 1, 2023, to October 31, 2024. You can find additional information about the Fund at https://personal1.vanguard.com/ngf-next-gen-form-webapp/fund-literature. You can also request this information by contacting us at 800-662-7447.
What were the Fund costs for the last year?
(based on a hypothetical $10,000 investment)
| Share Class Name | Costs of a $10,000 investment | Costs paid as a percentage of a $10,000 investment |
| Investor Shares | $16 | 0.14% |
How did the Fund perform during the reporting period?
For the 12 months ended October 31, 2024, the Fund underperformed its benchmark, the Growth Composite Index. This was largely because of differences in the price of international equity securities used by the Fund to calculate its net asset value and the quoted published prices for the same securities. This practice is known as fair-value pricing. The Fund also diverged from the index due to tax withholding differences that were tied to investments in international equity securities.
Global economic growth appeared relatively stable at around 3% during the period, and U.S. recession fears faded. With inflation continuing to moderate across much of the world, major central banks including the European Central Bank, the Bank of England, and the U.S. Federal Reserve began lowering policy rates. Global stocks posted very strong returns.
As a fund of funds, the Fund provides a broadly diversified portfolio in a single fund. Its four underlying funds posted returns as follows: U.S. stocks about 38%, U.S. bonds about 10%, international stocks about 23%, and international bonds more than 9%.
How did the Fund perform over the past 10 years?
Keep in mind that the Fund's past performance does not indicate how the Fund will perform in the future. Updated performance information is available on our website at vanguard.com/performance or by calling Vanguard toll-free at 800-662-7447. The graph and returns shown do not reflect taxes that a shareholder would pay on fund distributions or on the sale of fund shares.
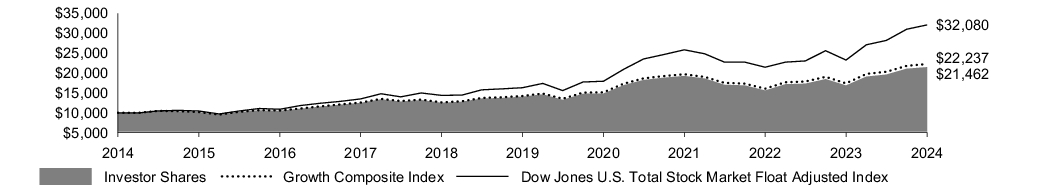
Cumulative Performance: October 31, 2014, Through October 31, 2024
Initial Investment of $ 10,000
| Average Annual Total Returns | | | |
| 1 Year | 5 Years | 10 Years |
| Investor Shares | 27.32% | 8.87% | 7.94% |
| Growth Composite Index | 27.85% | 9.36% | 8.32% |
| Dow Jones U.S. Total Stock Market Float Adjusted Index | 37.99% | 14.51% | 12.36% |
This table reflects the Fund’s investments, including short-term investments, derivatives and other assets and liabilities.
Fund Statistics
(as of October 31, 2024) | |
Fund Net Assets
(in millions) | $22,003 |
| Number of Portfolio Holdings | 7 |
| Portfolio Turnover Rate | 5% |
Total Investment Advisory Fees
(in thousands) | $0 |
Portfolio Composition % of Net Assets
(as of October 31, 2024) |
| Vanguard Total Stock Market Index Fund Investor Shares | 48.6% |
| Vanguard Total International Stock Index Fund Investor Shares | 31.5% |
| Vanguard Total Bond Market II Index Fund Investor Shares | 13.3% |
| Vanguard Total International Bond II Index Fund Investor Shares | 5.9% |
| Other Assets and Liabilities—Net | 0.7% |
Where can I find additional information about the Fund?
Additional information about the Fund, including its prospectus, financial information, holdings, and proxy voting information is available at https://personal1.vanguard.com/ngf-next-gen-form-webapp/fund-literature.
Connect with Vanguard ® • vanguard.com
Fund Information • 800-662-7447
Direct Investor Account Services • 800-662-2739
Text Telephone for People Who Are Deaf or Hard of Hearing • 800-749-7273
© 2024 The Vanguard Group, Inc.
All rights reserved.
Vanguard Marketing Corporation, Distributor.
AR122
Vanguard STAR Fund
Investor Shares (VGSTX)
Annual Shareholder Report | October 31, 2024
This annual shareholder report contains important information about Vanguard STAR Fund (the "Fund") for the period of November 1, 2023, to October 31, 2024. You can find additional information about the Fund at https://personal1.vanguard.com/ngf-next-gen-form-webapp/fund-literature. You can also request this information by contacting us at 800-662-7447.
What were the Fund costs for the last year?
(based on a hypothetical $10,000 investment)
| Share Class Name | Costs of a $10,000 investment | Costs paid as a percentage of a $10,000 investment |
| Investor Shares | $34 | 0.30% |
How did the Fund perform during the reporting period?
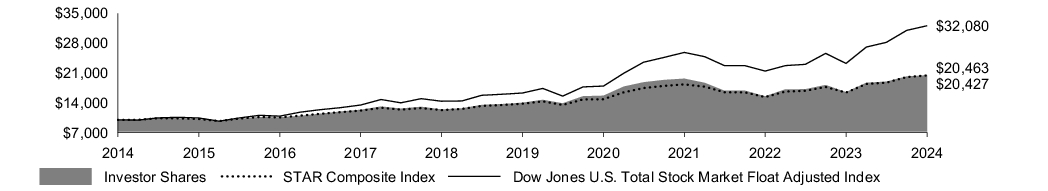
For the 12 months ended October 31, 2024, the Fund performed roughly in line with its benchmark, the STAR Composite Index.
Global economic growth appeared relatively stable at around 3% during the period. With inflation continuing to moderate across much of the world, major central banks including the European Central Bank, the Bank of England, and the U.S. Federal Reserve began lowering policy rates. U.S. stocks and bonds both posted very strong returns.
As a fund of funds, the Fund reflects the results of 10 underlying actively managed Vanguard funds invested in U.S. stocks, non-U.S. stocks, and U.S. bonds. Of those, stock funds made up about 63% of the Fund’s assets.
Total returns for the 10 underlying funds ranged from about 9% for Vanguard Short-Term Investment-Grade Fund to about 47% for Vanguard U.S. Growth Fund. Vanguard Long-Term Investment-Grade Fund delivered the highest return (about 18%) among STAR’s bond funds, while Vanguard International Value Fund reported the lowest return (about 19%) among the stock funds.
How did the Fund perform over the past 10 years?
Keep in mind that the Fund's past performance does not indicate how the Fund will perform in the future. Updated performance information is available on our website at vanguard.com/performance or by calling Vanguard toll-free at 800-662-7447. The graph and returns shown do not reflect taxes that a shareholder would pay on fund distributions or on the sale of fund shares.
Cumulative Performance: October 31, 2014, Through October 31, 2024
Initial Investment of $ 10,000
| Average Annual Total Returns | | | |
| 1 Year | 5 Years | 10 Years |
| Investor Shares | 24.07% | 7.85% | 7.42% |
| STAR Composite Index | 24.53% | 8.18% | 7.40% |
| Dow Jones U.S. Total Stock Market Float Adjusted Index | 37.99% | 14.51% | 12.36% |
This table reflects the Fund’s investments, including short-term investments and other assets and liabilities.
Fund Statistics
(as of October 31, 2024) | |
Fund Net Assets
(in millions) | $23,180 |
| Number of Portfolio Holdings | 11 |
| Portfolio Turnover Rate | 4% |
Total Investment Advisory Fees
(in thousands) | $0 |
Portfolio Composition % of Net Assets
(as of October 31, 2024) |
| Vanguard WindsorTM II Fund Investor Shares | 14.3% |
| Vanguard Short-Term Investment-Grade Fund Investor Shares | 12.6% |
| Vanguard GNMA Fund Investor Shares | 12.3% |
| Vanguard Long-Term Investment-Grade Fund Investor Shares | 12.1% |
| Vanguard U.S. Growth Fund Investor Shares | 12.1% |
| Vanguard International Growth Fund Investor Shares | 9.5% |
| Vanguard International Value Fund Investor Shares | 9.3% |
| Vanguard Windsor Fund Investor Shares | 7.9% |
| Vanguard PRIMECAP Fund Investor Shares | 6.0% |
| Vanguard ExplorerTM Fund Investor Shares | 3.9% |
| Other Assets and Liabilities—Net | (0.0)% |
Where can I find additional information about the Fund?
Additional information about the Fund, including its prospectus, financial information, holdings, and proxy voting information is available at https://personal1.vanguard.com/ngf-next-gen-form-webapp/fund-literature.
Connect with Vanguard ® • vanguard.com
Fund Information • 800-662-7447
Direct Investor Account Services • 800-662-2739
Text Telephone for People Who Are Deaf or Hard of Hearing • 800-749-7273
© 2024 The Vanguard Group, Inc.
All rights reserved.
Vanguard Marketing Corporation, Distributor.
AR56
Vanguard Total International Stock Index Fund
Investor Shares (VGTSX)
Annual Shareholder Report | October 31, 2024
This annual shareholder report contains important information about Vanguard Total International Stock Index Fund (the "Fund") for the period of November 1, 2023, to October 31, 2024. You can find additional information about the Fund at https://personal1.vanguard.com/ngf-next-gen-form-webapp/fund-literature. You can also request this information by contacting us at 800-662-7447.
What were the Fund costs for the last year?
(based on a hypothetical $10,000 investment)
| Share Class Name | Costs of a $10,000 investment | Costs paid as a percentage of a $10,000 investment |
| Investor Shares | $19 | 0.17% |
How did the Fund perform during the reporting period?
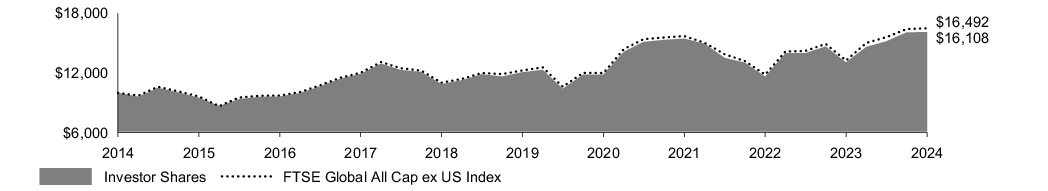
For the 12 months ended October 31, 2024, the Fund underperformed its benchmark index, largely because of differences in the prices of securities used by the Fund to calculate its net asset value and the quoted published prices for the same securities. This practice is known as fair-value pricing.
Global economic growth appeared relatively stable at around 3% during the period, and U.S. recession fears faded. With inflation continuing to moderate across much of the world, major central banks including the European Central Bank, the Bank of England, and the U.S. Federal Reserve began lowering policy rates. Global stocks posted very strong returns.
The Fund’s benchmark posted solid results across all regions and sectors. Of the two largest regions in the benchmark by weight, emerging markets posted the strongest returns; given its heavier weighting in the index, however, Europe contributed most to the Fund’s returns. By sector, financials, industrials, and technology contributed most.
How did the Fund perform over the past 10 years?
Keep in mind that the Fund's past performance does not indicate how the Fund will perform in the future. Updated performance information is available on our website at vanguard.com/performance or by calling Vanguard toll-free at 800-662-7447. The graph and returns shown do not reflect taxes that a shareholder would pay on fund distributions or on the sale of fund shares.
Cumulative Performance: October 31, 2014, Through October 31, 2024
Initial Investment of $ 10,000
| Average Annual Total Returns | | | |
| 1 Year | 5 Years | 10 Years |
| Investor Shares | 23.32% | 5.93% | 4.88% |
| FTSE Global All Cap ex US Index | 24.45% | 6.12% | 5.13% |
This table reflects the Fund’s investments, including short-term investments, derivatives and other assets and liabilities.
Fund Statistics
(as of October 31, 2024) | |
Fund Net Assets
(in millions) | $441,691 |
| Number of Portfolio Holdings | 8,695 |
| Portfolio Turnover Rate | 3% |
Total Investment Advisory Fees
(in thousands) | $25,598 |
Portfolio Composition % of Net Assets
(as of October 31, 2024) |
| Africa | 1.0% |
| Asia | 44.7% |
| Europe | 38.7% |
| North America | 8.0% |
| Oceania | 5.1% |
| Others | 0.1% |
| South America | 1.4% |
| Other Assets and Liabilities—Net | 1.0% |
Where can I find additional information about the Fund?
Additional information about the Fund, including its prospectus, financial information, holdings, and proxy voting information is available at https://personal1.vanguard.com/ngf-next-gen-form-webapp/fund-literature.
Connect with Vanguard ® • vanguard.com
Fund Information • 800-662-7447
Direct Investor Account Services • 800-662-2739
Text Telephone for People Who Are Deaf or Hard of Hearing • 800-749-7273
© 2024 The Vanguard Group, Inc.
All rights reserved.
Vanguard Marketing Corporation, Distributor.
AR113
Vanguard Total International Stock Index Fund
ETF Shares (VXUS) Nasdaq
Annual Shareholder Report | October 31, 2024
This annual shareholder report contains important information about Vanguard Total International Stock Index Fund (the "Fund") for the period of November 1, 2023, to October 31, 2024. You can find additional information about the Fund at https://personal1.vanguard.com/ngf-next-gen-form-webapp/fund-literature. You can also request this information by contacting us at 800-662-7447.
What were the Fund costs for the last year?
(based on a hypothetical $10,000 investment)
| Share Class Name | Costs of a $10,000 investment | Costs paid as a percentage of a $10,000 investment |
| ETF Shares | $8 | 0.07% |
How did the Fund perform during the reporting period?
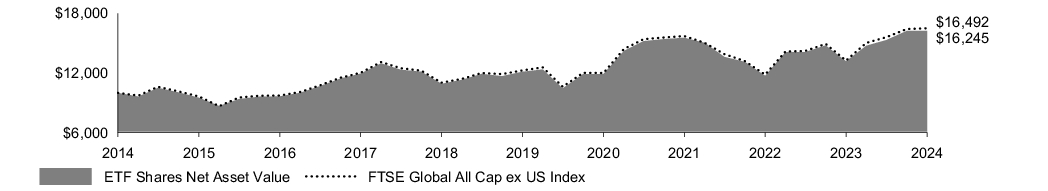
For the 12 months ended October 31, 2024, the Fund underperformed its benchmark index, largely because of differences in the prices of securities used by the Fund to calculate its net asset value and the quoted published prices for the same securities. This practice is known as fair-value pricing.
Global economic growth appeared relatively stable at around 3% during the period, and U.S. recession fears faded. With inflation continuing to moderate across much of the world, major central banks including the European Central Bank, the Bank of England, and the U.S. Federal Reserve began lowering policy rates. Global stocks posted very strong returns.
The Fund’s benchmark posted solid results across all regions and sectors. Of the two largest regions in the benchmark by weight, emerging markets posted the strongest returns; given its heavier weighting in the index, however, Europe contributed most to the Fund’s returns. By sector, financials, industrials, and technology contributed most.
How did the Fund perform over the past 10 years?
Keep in mind that the Fund's past performance does not indicate how the Fund will perform in the future. Updated performance information is available on our website at vanguard.com/performance or by calling Vanguard toll-free at 800-662-7447. The graph and returns shown do not reflect taxes that a shareholder would pay on fund distributions or on the sale of fund shares.
Cumulative Performance: October 31, 2014, Through October 31, 2024
Initial Investment of $ 10,000
| Average Annual Total Returns | | | |
| 1 Year | 5 Years | 10 Years |
| ETF Shares Net Asset Value | 23.37% | 6.04% | 4.97% |
| ETF Shares Market Price | 23.36% | 6.05% | 4.96% |
| FTSE Global All Cap ex US Index | 24.45% | 6.12% | 5.13% |
This table reflects the Fund’s investments, including short-term investments, derivatives and other assets and liabilities.
Fund Statistics
(as of October 31, 2024) | |
Fund Net Assets
(in millions) | $441,691 |
| Number of Portfolio Holdings | 8,695 |
| Portfolio Turnover Rate | 3% |
Total Investment Advisory Fees
(in thousands) | $25,598 |
Portfolio Composition % of Net Assets
(as of October 31, 2024) |
| Africa | 1.0% |
| Asia | 44.7% |
| Europe | 38.7% |
| North America | 8.0% |
| Oceania | 5.1% |
| Others | 0.1% |
| South America | 1.4% |
| Other Assets and Liabilities—Net | 1.0% |
Where can I find additional information about the Fund?
Additional information about the Fund, including its prospectus, financial information, holdings, and proxy voting information is available at https://personal1.vanguard.com/ngf-next-gen-form-webapp/fund-literature.
Connect with Vanguard ® • vanguard.com
Fund Information • 800-662-7447
Direct Investor Account Services • 800-662-2739
Text Telephone for People Who Are Deaf or Hard of Hearing • 800-749-7273
© 2024 The Vanguard Group, Inc.
All rights reserved.
Vanguard Marketing Corporation, Distributor.
AR3369
Vanguard Total International Stock Index Fund
Admiral™ Shares (VTIAX)
Annual Shareholder Report | October 31, 2024
This annual shareholder report contains important information about Vanguard Total International Stock Index Fund (the "Fund") for the period of November 1, 2023, to October 31, 2024. You can find additional information about the Fund at https://personal1.vanguard.com/ngf-next-gen-form-webapp/fund-literature. You can also request this information by contacting us at 800-662-7447.
What were the Fund costs for the last year?
(based on a hypothetical $10,000 investment)
| Share Class Name | Costs of a $10,000 investment | Costs paid as a percentage of a $10,000 investment |
| Admiral Shares | $12 | 0.11% |
How did the Fund perform during the reporting period?
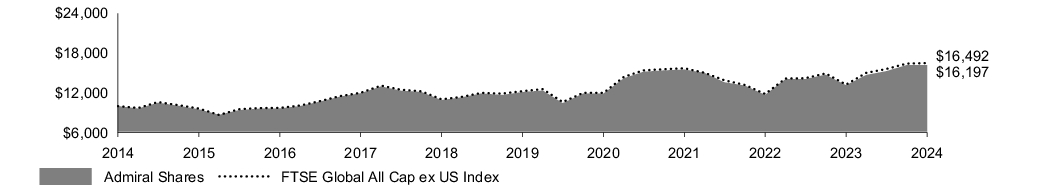
For the 12 months ended October 31, 2024, the Fund underperformed its benchmark index, largely because of differences in the prices of securities used by the Fund to calculate its net asset value and the quoted published prices for the same securities. This practice is known as fair-value pricing.
Global economic growth appeared relatively stable at around 3% during the period, and U.S. recession fears faded. With inflation continuing to moderate across much of the world, major central banks including the European Central Bank, the Bank of England, and the U.S. Federal Reserve began lowering policy rates. Global stocks posted very strong returns.
The Fund’s benchmark posted solid results across all regions and sectors. Of the two largest regions in the benchmark by weight, emerging markets posted the strongest returns; given its heavier weighting in the index, however, Europe contributed most to the Fund’s returns. By sector, financials, industrials, and technology contributed most.
How did the Fund perform over the past 10 years?
Keep in mind that the Fund's past performance does not indicate how the Fund will perform in the future. Updated performance information is available on our website at vanguard.com/performance or by calling Vanguard toll-free at 800-662-7447. The graph and returns shown do not reflect taxes that a shareholder would pay on fund distributions or on the sale of fund shares.
Cumulative Performance: October 31, 2014, Through October 31, 2024
Initial Investment of $ 10,000
| Average Annual Total Returns | | | |
| 1 Year | 5 Years | 10 Years |
| Admiral Shares | 23.34% | 5.98% | 4.94% |
| FTSE Global All Cap ex US Index | 24.45% | 6.12% | 5.13% |
This table reflects the Fund’s investments, including short-term investments, derivatives and other assets and liabilities.
Fund Statistics
(as of October 31, 2024) | |
Fund Net Assets
(in millions) | $441,691 |
| Number of Portfolio Holdings | 8,695 |
| Portfolio Turnover Rate | 3% |
Total Investment Advisory Fees
(in thousands) | $25,598 |
Portfolio Composition % of Net Assets
(as of October 31, 2024) |
| Africa | 1.0% |
| Asia | 44.7% |
| Europe | 38.7% |
| North America | 8.0% |
| Oceania | 5.1% |
| Others | 0.1% |
| South America | 1.4% |
| Other Assets and Liabilities—Net | 1.0% |
Where can I find additional information about the Fund?
Additional information about the Fund, including its prospectus, financial information, holdings, and proxy voting information is available at https://personal1.vanguard.com/ngf-next-gen-form-webapp/fund-literature.
Connect with Vanguard ® • vanguard.com
Fund Information • 800-662-7447
Direct Investor Account Services • 800-662-2739
Text Telephone for People Who Are Deaf or Hard of Hearing • 800-749-7273
© 2024 The Vanguard Group, Inc.
All rights reserved.
Vanguard Marketing Corporation, Distributor.
AR569
Vanguard Total International Stock Index Fund
Institutional Shares (VTSNX)
Annual Shareholder Report | October 31, 2024
This annual shareholder report contains important information about Vanguard Total International Stock Index Fund (the "Fund") for the period of November 1, 2023, to October 31, 2024. You can find additional information about the Fund at https://personal1.vanguard.com/ngf-next-gen-form-webapp/fund-literature. You can also request this information by contacting us at 800-662-7447.
What were the Fund costs for the last year?
(based on a hypothetical $10,000 investment)
| Share Class Name | Costs of a $10,000 investment | Costs paid as a percentage of a $10,000 investment |
| Institutional Shares | $9 | 0.08% |
How did the Fund perform during the reporting period?
For the 12 months ended October 31, 2024, the Fund underperformed its benchmark index, largely because of differences in the prices of securities used by the Fund to calculate its net asset value and the quoted published prices for the same securities. This practice is known as fair-value pricing.
Global economic growth appeared relatively stable at around 3% during the period, and U.S. recession fears faded. With inflation continuing to moderate across much of the world, major central banks including the European Central Bank, the Bank of England, and the U.S. Federal Reserve began lowering policy rates. Global stocks posted very strong returns.
The Fund’s benchmark posted solid results across all regions and sectors. Of the two largest regions in the benchmark by weight, emerging markets posted the strongest returns; given its heavier weighting in the index, however, Europe contributed most to the Fund’s returns. By sector, financials, industrials, and technology contributed most.
How did the Fund perform over the past 10 years?
Keep in mind that the Fund's past performance does not indicate how the Fund will perform in the future. Updated performance information is available on our website at vanguard.com/performance or by calling Vanguard toll-free at 800-662-7447. The graph and returns shown do not reflect taxes that a shareholder would pay on fund distributions or on the sale of fund shares.
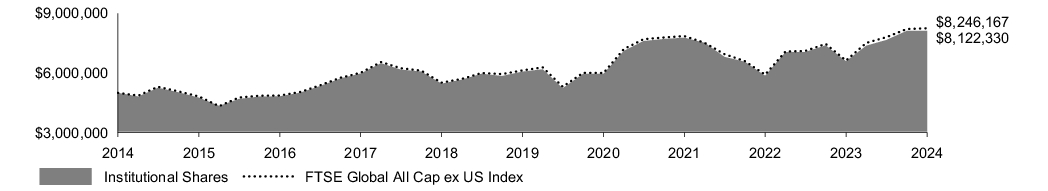
Cumulative Performance: October 31, 2014, Through October 31, 2024
Initial Investment of $ 5,000,000
| Average Annual Total Returns | | | |
| 1 Year | 5 Years | 10 Years |
| Institutional Shares | 23.37% | 6.02% | 4.97% |
| FTSE Global All Cap ex US Index | 24.45% | 6.12% | 5.13% |
This table reflects the Fund’s investments, including short-term investments, derivatives and other assets and liabilities.
Fund Statistics
(as of October 31, 2024) | |
Fund Net Assets
(in millions) | $441,691 |
| Number of Portfolio Holdings | 8,695 |
| Portfolio Turnover Rate | 3% |
Total Investment Advisory Fees
(in thousands) | $25,598 |
Portfolio Composition % of Net Assets
(as of October 31, 2024) |
| Africa | 1.0% |
| Asia | 44.7% |
| Europe | 38.7% |
| North America | 8.0% |
| Oceania | 5.1% |
| Others | 0.1% |
| South America | 1.4% |
| Other Assets and Liabilities—Net | 1.0% |
Where can I find additional information about the Fund?
Additional information about the Fund, including its prospectus, financial information, holdings, and proxy voting information is available at https://personal1.vanguard.com/ngf-next-gen-form-webapp/fund-literature.
Connect with Vanguard ® • vanguard.com
Fund Information • 800-662-7447
Institutional Investor Services • 800-523-1036
Text Telephone for People Who Are Deaf or Hard of Hearing • 800-749-7273
© 2024 The Vanguard Group, Inc.
All rights reserved.
Vanguard Marketing Corporation, Distributor.
AR1869
Vanguard Total International Stock Index Fund
Institutional Plus Shares (VTPSX)
Annual Shareholder Report | October 31, 2024
This annual shareholder report contains important information about Vanguard Total International Stock Index Fund (the "Fund") for the period of November 1, 2023, to October 31, 2024. You can find additional information about the Fund at https://personal1.vanguard.com/ngf-next-gen-form-webapp/fund-literature. You can also request this information by contacting us at 800-662-7447.
What were the Fund costs for the last year?
(based on a hypothetical $10,000 investment)
| Share Class Name | Costs of a $10,000 investment | Costs paid as a percentage of a $10,000 investment |
| Institutional Plus Shares | $8 | 0.07% |
How did the Fund perform during the reporting period?
For the 12 months ended October 31, 2024, the Fund underperformed its benchmark index, largely because of differences in the prices of securities used by the Fund to calculate its net asset value and the quoted published prices for the same securities. This practice is known as fair-value pricing.
Global economic growth appeared relatively stable at around 3% during the period, and U.S. recession fears faded. With inflation continuing to moderate across much of the world, major central banks including the European Central Bank, the Bank of England, and the U.S. Federal Reserve began lowering policy rates. Global stocks posted very strong returns.
The Fund’s benchmark posted solid results across all regions and sectors. Of the two largest regions in the benchmark by weight, emerging markets posted the strongest returns; given its heavier weighting in the index, however, Europe contributed most to the Fund’s returns. By sector, financials, industrials, and technology contributed most.
How did the Fund perform over the past 10 years?
Keep in mind that the Fund's past performance does not indicate how the Fund will perform in the future. Updated performance information is available on our website at vanguard.com/performance or by calling Vanguard toll-free at 800-662-7447. The graph and returns shown do not reflect taxes that a shareholder would pay on fund distributions or on the sale of fund shares.
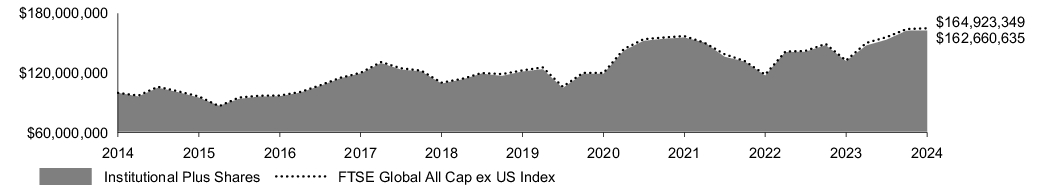
Cumulative Performance: October 31, 2014, Through October 31, 2024
Initial Investment of $ 100,000,000
| Average Annual Total Returns | | | |
| 1 Year | 5 Years | 10 Years |
| Institutional Plus Shares | 23.38% | 6.03% | 4.99% |
| FTSE Global All Cap ex US Index | 24.45% | 6.12% | 5.13% |
This table reflects the Fund’s investments, including short-term investments, derivatives and other assets and liabilities.
Fund Statistics
(as of October 31, 2024) | |
Fund Net Assets
(in millions) | $441,691 |
| Number of Portfolio Holdings | 8,695 |
| Portfolio Turnover Rate | 3% |
Total Investment Advisory Fees
(in thousands) | $25,598 |
Portfolio Composition % of Net Assets
(as of October 31, 2024) |
| Africa | 1.0% |
| Asia | 44.7% |
| Europe | 38.7% |
| North America | 8.0% |
| Oceania | 5.1% |
| Others | 0.1% |
| South America | 1.4% |
| Other Assets and Liabilities—Net | 1.0% |
Where can I find additional information about the Fund?
Additional information about the Fund, including its prospectus, financial information, holdings, and proxy voting information is available at https://personal1.vanguard.com/ngf-next-gen-form-webapp/fund-literature.
Connect with Vanguard ® • vanguard.com
Fund Information • 800-662-7447
Institutional Investor Services • 800-523-1036
Text Telephone for People Who Are Deaf or Hard of Hearing • 800-749-7273
© 2024 The Vanguard Group, Inc.
All rights reserved.
Vanguard Marketing Corporation, Distributor.
AR1870
Vanguard Total International Stock Index Fund
Institutional Select Shares (VTISX)
Annual Shareholder Report | October 31, 2024
This annual shareholder report contains important information about Vanguard Total International Stock Index Fund (the "Fund") for the period of November 1, 2023, to October 31, 2024. You can find additional information about the Fund at https://personal1.vanguard.com/ngf-next-gen-form-webapp/fund-literature. You can also request this information by contacting us at 800-662-7447.
What were the Fund costs for the last year?
(based on a hypothetical $10,000 investment)
| Share Class Name | Costs of a $10,000 investment | Costs paid as a percentage of a $10,000 investment |
| Institutional Select Shares | $5 | 0.047% |
How did the Fund perform during the reporting period?
For the 12 months ended October 31, 2024, the Fund underperformed its benchmark index, largely because of differences in the prices of securities used by the Fund to calculate its net asset value and the quoted published prices for the same securities. This practice is known as fair-value pricing.
Global economic growth appeared relatively stable at around 3% during the period, and U.S. recession fears faded. With inflation continuing to moderate across much of the world, major central banks including the European Central Bank, the Bank of England, and the U.S. Federal Reserve began lowering policy rates. Global stocks posted very strong returns.
The Fund’s benchmark posted solid results across all regions and sectors. Of the two largest regions in the benchmark by weight, emerging markets posted the strongest returns; given its heavier weighting in the index, however, Europe contributed most to the Fund’s returns. By sector, financials, industrials, and technology contributed most.
How did the Fund perform since inception?
Keep in mind that the Fund's past performance does not indicate how the Fund will perform in the future. Updated performance information is available on our website at vanguard.com/performance or by calling Vanguard toll-free at 800-662-7447. The graph and returns shown do not reflect taxes that a shareholder would pay on fund distributions or on the sale of fund shares.
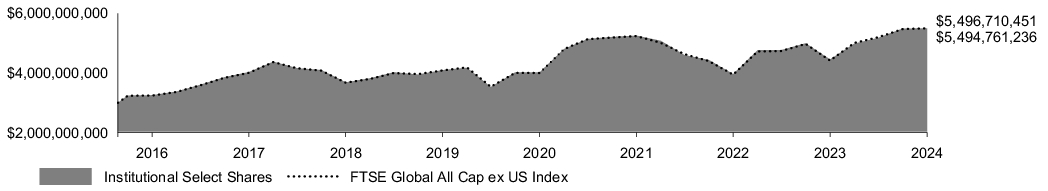
Cumulative Performance: June 24, 2016, Through October 31, 2024
Initial Investment of $ 3,000,000,000
| Average Annual Total Returns | | | |
| 1 Year | 5 Years | Since Inception
(6/24/2016) |
| Institutional Select Shares | 23.42% | 6.06% | 7.51% |
| FTSE Global All Cap ex US Index | 24.45% | 6.12% | 7.52% |
This table reflects the Fund’s investments, including short-term investments, derivatives and other assets and liabilities.
Fund Statistics
(as of October 31, 2024) | |
Fund Net Assets
(in millions) | $441,691 |
| Number of Portfolio Holdings | 8,695 |
| Portfolio Turnover Rate | 3% |
Total Investment Advisory Fees
(in thousands) | $25,598 |
Portfolio Composition % of Net Assets
(as of October 31, 2024) |
| Africa | 1.0% |
| Asia | 44.7% |
| Europe | 38.7% |
| North America | 8.0% |
| Oceania | 5.1% |
| Others | 0.1% |
| South America | 1.4% |
| Other Assets and Liabilities—Net | 1.0% |
Where can I find additional information about the Fund?
Additional information about the Fund, including its prospectus, financial information, holdings, and proxy voting information is available at https://personal1.vanguard.com/ngf-next-gen-form-webapp/fund-literature.
Connect with Vanguard ® • vanguard.com
Fund Information • 800-662-7447
Institutional Investor Services • 800-523-1036
Text Telephone for People Who Are Deaf or Hard of Hearing • 800-749-7273
© 2024 The Vanguard Group, Inc.
All rights reserved.
Vanguard Marketing Corporation, Distributor.
AR1969
Item 2: Code of Ethics.
The Registrant has adopted a code of ethics that applies to the Registrant’s principal executive officer, principal financial officer, principal accounting officer or controller or persons performing similar functions. The Code of Ethics was amended during the reporting period covered by this report to make certain technical, non-material changes.
Item 3: Audit Committee Financial Expert.
All members of the Audit Committee have been determined by the Registrant’s Board of Trustees to be Audit Committee Financial Experts and to be independent: F. Joseph Loughrey, Mark Loughridge, Sarah Bloom Raskin, and Peter F. Volanakis.
Item 4: Principal Accountant Fees and Services.
Includes fees billed in connection with services to the Registrant only.
| | | Fiscal Year Ended
October 31, 2024 | | | Fiscal Year Ended
October 31, 2023 | |
| (a) Audit Fees. | | $ | 202,000 | | | $ | 205,000 | |
| (b) Audit-Related Fees. | | | 0 | | | | 0 | |
| (c) Tax Fees. | | | 0 | | | | 0 | |
| (d) All Other Fees. | | | 0 | | | | 0 | |
| Total. | | $ | 202,000 | | | $ | 205,000 | |
| (e) | (1) Pre-Approval Policies. The audit committee is responsible for pre-approving all audit and non-audit services provided by PwC to: (i) the Vanguard funds; and (ii) Vanguard, or any entity controlled by Vanguard that provides ongoing services to the Vanguard funds. All services provided to Vanguard entities by the independent auditor, whether or not they are subject to preapproval, must be disclosed to the audit committee. The audit committee chair may preapprove any permissible audit and non-audit services as long as any preapproval is brought to the attention of the full audit committee at the next scheduled meeting. |
(2) No percentage of the principal accountant’s fees or services were approved pursuant to the waiver provision of paragraph (c)(7)(i)(C) of Rule 2-01 of Regulation S-X.
| (f) | For the most recent fiscal year, over 50% of the hours worked under the principal accountant’s engagement were not performed by persons other than full-time, permanent employees of the principal accountant. |
| (g) | Aggregate Non-Audit Fees. |
Includes fees billed for non-audit services provided to the Registrant, other registered investment companies in the Vanguard complex, The Vanguard Group, Inc., and Vanguard Marketing Corporation.
| | | Fiscal Year Ended
October 31, 2024 | | | Fiscal Year Ended
October 31, 2023 | |
| Non-audit fees to the Registrant only, listed as (b) through (d) above. | | $ | 0 | | | $ | 0 | |
| | | | | | | | | |
| Non-audit Fees to other registered investment companies in the Vanguard complex, The Vanguard Group, Inc., and Vanguard Marketing Corporation. | | | | | | | | |
| Audit-Related Fees. | | $ | 1,517,669 | | | $ | 3,295,934 | |
| Tax Fees. | | $ | 1,916,879 | | | $ | 1,678,928 | |
| All Other Fees. | | $ | 268,000 | | | $ | 25,000 | |
| Total. | | $ | 3,702,548 | | | $ | 4,999,862 | |
| (h) | For the most recent fiscal year, the Audit Committee has determined that the provision of all non-audit services was consistent with maintaining the principal accountant’s independence. |
Item 5: Audit Committee of Listed Registrants.
The Registrant is a listed issuer as defined in rule 10A-3 under the Securities Exchange Act of 1934 (“Exchange Act”). The Registrant has a separately-designated standing audit committee established in accordance with Section 3(a)(58)(A) of the Exchange Act. The Registrant’s audit committee members are: F. Joseph Loughrey, Mark Loughridge, Sarah Bloom Raskin, and Peter F. Volanakis.
Item 6: Investments.
Not applicable. The complete schedule of investments is included in the financial statements filed under Item 7 of this Form.
Item 7: Financial Statements and Financial Highlights for Open-End Management Investment Companies.
Financial Statements
For the year ended October 31, 2024
Vanguard LifeStrategy® Funds
| Vanguard LifeStrategy Income Fund |
| Vanguard LifeStrategy Conservative Growth Fund |
| Vanguard LifeStrategy Moderate Growth Fund |
| Vanguard LifeStrategy Growth Fund |
Contents
LifeStrategy Income Fund
| 1 |
LifeStrategy Conservative Growth Fund
| 9 |
LifeStrategy Moderate Growth Fund
| 17 |
LifeStrategy Growth Fund
| 25 |
Report of Independent Registered
Public Accounting Firm
| 33 |
Tax information
| 34 |
| | |
Schedule of Investments
As of October 31, 2024
The fund files its complete schedule of portfolio holdings with the Securities and Exchange Commission (SEC) for the first and third quarters of each fiscal year as an exhibit to its reports on Form N-PORT. The fund’s Form N-PORT reports are available on the SEC’s website at www.sec.gov.
| | | | | | Shares | Market
Value•
($000) |
| Investment Companies (99.4%) |
| U.S. Stock Fund (11.5%) |
| | Vanguard Total Stock Market Index Fund Investor Shares | 3,337,988 | 456,604 |
| International Stock Fund (7.9%) |
| | Vanguard Total International Stock Index Fund Investor Shares | 15,737,114 | 312,067 |
| U.S. Bond Fund (55.7%) |
| 1 | Vanguard Total Bond Market II Index Fund Investor Shares | 233,333,852 | 2,212,005 |
| International Bond Fund (24.3%) |
| 1 | Vanguard Total International Bond II Index Fund Investor Shares | 106,714,392 | 964,698 |
| Total Investment Companies (Cost $3,722,486) | 3,945,374 |
| Temporary Cash Investments (0.6%) |
| Money Market Fund (0.6%) |
| 1 | Vanguard Market Liquidity Fund, 4.834% (Cost $24,845) | 248,543 | 24,851 |
| Total Investments (100.0%) (Cost $3,747,331) | | 3,970,225 |
| Other Assets and Liabilities—Net (0.0%) | | 361 |
| Net Assets (100%) | | 3,970,586 |
| • | See Note A in Notes to Financial Statements. |
| 1 | Affiliated fund available only to Vanguard funds and certain trusts and accounts managed by Vanguard. Rate shown for Vanguard Market Liquidity Fund is the 7-day yield. |
Derivative Financial Instruments Outstanding as of Period End
| Futures Contracts |
| | | | ($000) |
| | Expiration | Number of
Long (Short)
Contracts | Notional
Amount | Value and
Unrealized
Appreciation
(Depreciation) |
| Long Futures Contracts |
| 10-Year U.S. Treasury Note | December 2024 | 110 | 12,152 | (405) |
| E-mini S&P 500 Index | December 2024 | 46 | 13,198 | 110 |
| | | | | (295) |
See accompanying Notes, which are an integral part of the Financial Statements.
Statement of Assets and Liabilities
|
| ($000s, except shares, footnotes, and per-share amounts) | Amount |
| Assets | |
| Investments in Securities, at Value—Affiliated Funds (Cost $3,747,331) | 3,970,225 |
| Cash Collateral Pledged—Futures Contracts | 896 |
| Receivables for Investment Securities Sold | 900 |
| Receivables for Accrued Income | 8,899 |
| Receivables for Capital Shares Issued | 1,223 |
| Total Assets | 3,982,143 |
| Liabilities | |
| Payables for Investment Securities Purchased | 8,890 |
| Payables for Capital Shares Redeemed | 2,380 |
| Variation Margin Payable—Futures Contracts | 287 |
| Total Liabilities | 11,557 |
| Net Assets | 3,970,586 |
At October 31, 2024, net assets consisted of: |
|
| | |
| Paid-in Capital | 3,704,983 |
| Total Distributable Earnings (Loss) | 265,603 |
| Net Assets | 3,970,586 |
| | |
| Net Assets | |
Applicable to 255,500,403 outstanding $.001 par value shares of
beneficial interest (unlimited authorization) | 3,970,586 |
| Net Asset Value Per Share | $15.54 |
See accompanying Notes, which are an integral part of the Financial Statements.
|
| | Year Ended
October 31, 2024 |
| | ($000) |
| Investment Income | |
| Income | |
| Income Distributions Received from Affiliated Funds | 143,874 |
| Net Investment Income—Note B | 143,874 |
| Realized Net Gain (Loss) | |
| Capital Gain Distributions Received from Affiliated Funds | — |
| Affiliated Funds Sold | 86,654 |
| Futures Contracts | 3,818 |
| Realized Net Gain (Loss) | 90,472 |
| Change in Unrealized Appreciation (Depreciation) | |
| Affiliated Funds | 308,565 |
| Futures Contracts | 1,254 |
| Change in Unrealized Appreciation (Depreciation) | 309,819 |
| Net Increase (Decrease) in Net Assets Resulting from Operations | 544,165 |
See accompanying Notes, which are an integral part of the Financial Statements.
Statement of Changes in Net Assets
|
| | Year Ended October 31, |
| | 2024
($000) | 2023
($000) |
| Increase (Decrease) in Net Assets | | |
| Operations | | |
| Net Investment Income | 143,874 | 110,240 |
| Realized Net Gain (Loss) | 90,472 | 34,529 |
| Change in Unrealized Appreciation (Depreciation) | 309,819 | (15,817) |
| Net Increase (Decrease) in Net Assets Resulting from Operations | 544,165 | 128,952 |
| Distributions | | |
| Total Distributions | (145,956) | (108,175) |
| Capital Share Transactions | | |
| Issued | 427,599 | 420,400 |
| Issued in Lieu of Cash Distributions | 132,340 | 98,550 |
| Redeemed | (998,126) | (1,008,015) |
| Net Increase (Decrease) from Capital Share Transactions | (438,187) | (489,065) |
| Total Increase (Decrease) | (39,978) | (468,288) |
| Net Assets | | |
| Beginning of Period | 4,010,564 | 4,478,852 |
| End of Period | 3,970,586 | 4,010,564 |
See accompanying Notes, which are an integral part of the Financial Statements.
For a Share Outstanding
Throughout Each Period | Year Ended October 31, |
| 2024 | 2023 | 2022 | 2021 | 2020 |
| Net Asset Value, Beginning of Period | $14.09 | $14.09 | $17.40 | $16.73 | $16.24 |
| Investment Operations | | | | | |
| Net Investment Income1 | .541 | .366 | .368 | .261 | .393 |
| Capital Gain Distributions Received1 | .0002 | .0002 | .046 | .092 | — |
| Net Realized and Unrealized Gain (Loss) on Investments | 1.461 | (.004) | (3.042) | .656 | .501 |
| Total from Investment Operations | 2.002 | .362 | (2.628) | 1.009 | .894 |
| Distributions | | | | | |
| Dividends from Net Investment Income | (.552) | (.362) | (.365) | (.264) | (.401) |
| Distributions from Realized Capital Gains | — | — | (.317) | (.075) | (.003) |
| Total Distributions | (.552) | (.362) | (.682) | (.339) | (.404) |
| Net Asset Value, End of Period | $15.54 | $14.09 | $14.09 | $17.40 | $16.73 |
| Total Return3 | 14.31% | 2.52% | -15.59% | 6.06% | 5.60% |
| Ratios/Supplemental Data | | | | | |
| Net Assets, End of Period (Millions) | $3,971 | $4,011 | $4,479 | $6,098 | $5,603 |
| Ratio of Total Expenses to Average Net Assets | — | — | — | — | — |
| Acquired Fund Fees and Expenses | 0.11% | 0.11% | 0.11% | 0.11% | 0.11% |
| Ratio of Net Investment Income to Average Net Assets | 3.55% | 2.50% | 2.34% | 1.51% | 2.39% |
| Portfolio Turnover Rate | 5% | 4% | 26% | 7% | 17% |
| 1 | Calculated based on average shares outstanding. |
| 2 | Distribution was less than $.001 per share. |
| 3 | Total returns do not include account service fees that may have applied in the periods shown. Fund prospectuses provide information about any applicable account service fees. |
See accompanying Notes, which are an integral part of the Financial Statements.
Notes to Financial Statements
Vanguard LifeStrategy Income Fund is registered under the Investment Company Act of 1940 as an open-end investment company, or mutual fund. The fund follows a balanced investment strategy by investing in selected Vanguard funds to achieve its targeted allocation of assets to U.S. and international stocks, and U.S. and international bonds. Financial statements and other information about each underlying fund are available at www.vanguard.com.
A. The following significant accounting policies conform to generally accepted accounting principles for U.S. investment companies. The fund consistently follows such policies in preparing its financial statements.
1. Security Valuation: Investments are valued at the net asset value of each underlying Vanguard fund determined as of the close of the New York Stock Exchange (generally 4 p.m., Eastern time) on the valuation date.
2. Futures Contracts: The fund uses stock and bond futures contracts to a limited extent, with the objectives of maintaining full exposure to the market and maintaining its target asset allocation. The primary risks associated with the use of futures contracts are imperfect correlation between changes in market values of investments held by the fund and the prices of futures contracts, and the possibility of an illiquid market. Counterparty risk involving futures is mitigated because a regulated clearinghouse is the counterparty instead of the clearing broker. To further mitigate counterparty risk, the fund trades futures contracts on an exchange, monitors the financial strength of its clearing brokers and clearinghouse, and has entered into clearing agreements with its clearing brokers. The clearinghouse imposes initial margin requirements to secure the fund’s performance and requires daily settlement of variation margin representing changes in the market value of each contract. Any securities pledged as initial margin for open contracts are noted in the Schedule of Investments.
Futures contracts are valued at their quoted daily settlement prices. The notional amounts of the contracts are not recorded in the Statement of Assets and Liabilities. Fluctuations in the value of the contracts are recorded in the Statement of Assets and Liabilities as an asset (liability) and in the Statement of Operations as unrealized appreciation (depreciation) until the contracts are closed, when they are recorded as realized gains (losses) on futures contracts.
During the year ended October 31, 2024, the fund’s average investments in long and short futures contracts represented 1% and 0% of net assets, respectively, based on the average of the notional amounts at each quarter-end during the period.
3. Federal Income Taxes: The fund intends to continue to qualify as a regulated investment company and distribute virtually all of its taxable income. The fund’s tax returns are open to examination by the relevant tax authorities until expiration of the applicable statute of limitations, which is generally three years after the filing of the tax return. Management has analyzed the fund’s tax positions taken for all open federal and state income tax years, and has concluded that no provision for income tax is required in the fund’s financial statements.
4. Distributions: Distributions to shareholders are recorded on the ex-dividend date. Distributions are determined on a tax basis at the fiscal year-end and may differ from net investment income and realized capital gains for financial reporting purposes.
5. Credit Facilities and Interfund Lending Program: The fund and certain other funds managed by The Vanguard Group ("Vanguard") participate in a $4.3 billion committed credit facility provided by a syndicate of lenders pursuant to a credit agreement and an uncommitted credit facility provided by Vanguard. Both facilities may be renewed annually. Each fund is individually liable for its borrowings, if any, under the credit facilities. Borrowings may be utilized for temporary or emergency purposes and are subject to the fund’s regulatory and contractual borrowing restrictions. With respect to the committed credit facility, the participating funds are charged administrative fees and an annual commitment fee of 0.10% of the undrawn committed amount of the facility, which are allocated to the funds based on a method approved by the fund’s board of trustees and borne by the funds in which the fund invests (see Note B). Any borrowings under either facility bear interest at an agreed-upon spread plus the higher of the federal funds effective rate, the overnight bank funding rate, or the Daily Simple Secured Overnight Financing Rate inclusive of an additional agreed-upon spread. However, borrowings under the uncommitted credit facility may bear interest based upon an alternate rate agreed to by the fund and Vanguard.
In accordance with an exemptive order (the “Order”) from the SEC, the fund may participate in a joint lending and borrowing program that allows registered open-end Vanguard funds to borrow money from and lend money to each other for temporary or emergency purposes (the “Interfund Lending Program”), subject to compliance with the terms and conditions of the Order, and to the extent permitted by the fund’s investment objective and investment policies. Interfund loans and borrowings normally extend overnight but can have a maximum duration of seven days. Loans may be called on one business day’s notice. The interest rate to be charged is governed by the conditions of the Order and internal procedures adopted by the board of trustees. The board of trustees is responsible for overseeing the Interfund Lending Program.
For the year ended October 31, 2024, the fund did not utilize the credit facilities or the Interfund Lending Program.
6. Other: Income and capital gain distributions received are recorded on the ex-dividend date. Security transactions are accounted for on the date securities are bought or sold. Costs used to determine realized gains (losses) on the sale of investment securities are those of the specific securities sold.
B. In accordance with the terms of a Funds’ Service Agreement (the “FSA”) between Vanguard and the fund, Vanguard furnishes to the fund investment advisory, corporate management, administrative, marketing, and distribution services at Vanguard’s cost of operations (as defined by the FSA). These costs of operations are allocated to the fund based on methods and guidelines approved by the board of trustees. The FSA provides that expenses otherwise allocable to Vanguard funds-of-funds may be reduced or eliminated to the extent of savings realized by the underlying Vanguard funds by virtue of being part of a fund-of-funds. Accordingly, all expenses for services provided by Vanguard to the fund and all other expenses incurred by the fund during the year ended October 31, 2024, were borne by the underlying Vanguard funds in which the fund invests. The fund's trustees and officers are also trustees and officers, respectively, of the underlying Vanguard funds, as well as directors and employees, respectively, of Vanguard.
C. Various inputs may be used to determine the value of the fund’s investments and derivatives. These inputs are summarized in three broad levels for financial statement purposes. The inputs or methodologies used to value securities are not necessarily an indication of the risk associated with investing in those securities.
Level 1—Quoted prices in active markets for identical securities.
Level 2—Other significant observable inputs (including quoted prices for similar securities, interest rates, prepayment speeds, credit risk, etc.).
Level 3—Significant unobservable inputs (including the fund’s own assumptions used to determine the fair value of investments). Any investments and derivatives valued with significant unobservable inputs are noted on the Schedule of Investments.
At October 31, 2024, 100% of the market value of the fund's investments and derivatives was determined based on Level 1 inputs.
D. Permanent differences between book-basis and tax-basis components of net assets are reclassified among capital accounts in the financial statements to reflect their tax character. These reclassifications have no effect on net assets or net asset value per share. As of period end, permanent differences primarily attributable to the accounting for distributions in connection with fund share redemptions were reclassified between the following accounts:
| | Amount
($000) |
| Paid-in Capital | 3,149 |
| Total Distributable Earnings (Loss) | (3,149) |
Temporary differences between book-basis and tax-basis components of total distributable earnings (loss) arise when certain items of income, gain, or loss are recognized in different periods for financial statement and tax purposes; these differences will reverse at some time in the future. The differences are primarily related to the deferral of losses from wash sales; and the recognition of unrealized gains or losses from certain derivative contracts. As of period end, the tax-basis components of total distributable earnings (loss) are detailed in the table as follows:
| | Amount
($000) |
| Undistributed Ordinary Income | 12,309 |
| Undistributed Long-Term Gains | 72,540 |
| Net Unrealized Gains (Losses) | 180,754 |
| Capital Loss Carryforwards | — |
| Qualified Late-Year Losses | — |
| Other Temporary Differences | — |
| Total | 265,603 |
The tax character of distributions paid was as follows:
| | Year Ended October 31, |
| | 2024
Amount
($000) | 2023
Amount
($000) |
| Ordinary Income* | 145,956 | 108,175 |
| Long-Term Capital Gains | — | — |
| Total | 145,956 | 108,175 |
| * | Includes short-term capital gains, if any. |
As of October 31, 2024, gross unrealized appreciation and depreciation for investments and derivatives based on cost for U.S. federal income tax purposes were as follows:
| | Amount
($000) |
| Tax Cost | 3,789,471 |
| Gross Unrealized Appreciation | 451,047 |
| Gross Unrealized Depreciation | (270,293) |
| Net Unrealized Appreciation (Depreciation) | 180,754 |
E. Capital shares issued and redeemed were:
| | Year Ended October 31, |
| | 2024
Shares
(000) | 2023
Shares
(000) |
| Issued | 28,021 | 28,658 |
| Issued in Lieu of Cash Distributions | 8,626 | 6,794 |
| Redeemed | (65,707) | (68,841) |
| Net Increase (Decrease) in Shares Outstanding | (29,060) | (33,389) |
F. Transactions during the period in affiliated underlying Vanguard funds were as follows:
| | | Current Period Transactions | |
| | Oct. 31, 2023
Market Value
($000) | Purchases
at Cost
($000) | Proceeds
from
Securities
Sold
($000) | Realized
Net Gain
(Loss)
($000) | Change in
Unrealized
App. (Dep.)
($000) | Income
($000) | Capital Gain
Distributions
Received
($000) | Oct. 31, 2024
Market Value
($000) |
| Vanguard Market Liquidity Fund | 25,141 | NA1 | NA1 | 2 | (1) | 1,509 | — | 24,851 |
| Vanguard Total Bond Market II Index Fund | 2,232,463 | 96,921 | 261,500 | (29,253) | 173,374 | 81,038 | — | 2,212,005 |
| Vanguard Total International Bond II Index Fund | 975,871 | 51,106 | 106,473 | (2,003) | 46,197 | 45,268 | — | 964,698 |
| Vanguard Total International Stock Index Fund | 315,007 | 20,693 | 83,573 | 11,085 | 48,855 | 9,760 | — | 312,067 |
| Vanguard Total Stock Market Index Fund | 461,098 | 29,989 | 181,446 | 106,823 | 40,140 | 6,299 | — | 456,604 |
| Total | 4,009,580 | 198,709 | 632,992 | 86,654 | 308,565 | 143,874 | — | 3,970,225 |
| 1 | Not applicable—purchases and sales are for temporary cash investment purposes. |
G. Significant market disruptions, such as those caused by pandemics, natural or environmental disasters, war, acts of terrorism, or other events, can adversely affect local and global markets and normal market operations. Any such disruptions could have an adverse impact on the value of the fund’s investments and fund performance.
To the extent the fund’s investment portfolio reflects concentration in a particular market, industry, sector, country or asset class, the fund may be adversely affected by the performance of these concentrations and may be subject to increased price volatility and other risks.
The use of derivatives may expose the fund to various risks. Derivatives can be highly volatile, and any initial investment is generally small relative to the notional amount so that transactions may be leveraged in terms of market exposure. A relatively small market movement may have a potentially larger impact on derivatives than on standard securities. Leveraged derivatives positions can, therefore, increase volatility. Additional information regarding the fund’s use of derivative(s) and the specific risks associated is described under significant accounting policies.
H. Management has determined that no events or transactions occurred subsequent to October 31, 2024, that would require recognition or disclosure in these financial statements.
LifeStrategy Conservative Growth Fund
Schedule of Investments
As of October 31, 2024
The fund files its complete schedule of portfolio holdings with the Securities and Exchange Commission (SEC) for the first and third quarters of each fiscal year as an exhibit to its reports on Form N-PORT. The fund’s Form N-PORT reports are available on the SEC’s website at www.sec.gov.
| | | | | | Shares | Market
Value•
($000) |
| Investment Companies (99.4%) |
| U.S. Stock Fund (24.3%) |
| | Vanguard Total Stock Market Index Fund Investor Shares | 18,270,542 | 2,499,227 |
| International Stock Fund (16.0%) |
| | Vanguard Total International Stock Index Fund Investor Shares | 83,203,324 | 1,649,922 |
| U.S. Bond Fund (41.0%) |
| 1 | Vanguard Total Bond Market II Index Fund Investor Shares | 445,321,602 | 4,221,649 |
| International Bond Fund (18.1%) |
| 1 | Vanguard Total International Bond II Index Fund Investor Shares | 206,196,673 | 1,864,018 |
| Total Investment Companies (Cost $7,974,316) | 10,234,816 |
| Temporary Cash Investments (0.6%) |
| Money Market Fund (0.6%) |
| 1 | Vanguard Market Liquidity Fund, 4.834% (Cost $63,803) | 638,273 | 63,821 |
| Total Investments (100.0%) (Cost $8,038,119) | | 10,298,637 |
| Other Assets and Liabilities—Net (0.0%) | | 3,505 |
| Net Assets (100%) | | 10,302,142 |
| • | See Note A in Notes to Financial Statements. |
| 1 | Affiliated fund available only to Vanguard funds and certain trusts and accounts managed by Vanguard. Rate shown for Vanguard Market Liquidity Fund is the 7-day yield. |
Derivative Financial Instruments Outstanding as of Period End
| Futures Contracts |
| | | | ($000) |
| | Expiration | Number of
Long (Short)
Contracts | Notional
Amount | Value and
Unrealized
Appreciation
(Depreciation) |
| Long Futures Contracts |
| 10-Year U.S. Treasury Note | December 2024 | 318 | 35,129 | (1,170) |
| E-mini S&P 500 Index | December 2024 | 121 | 34,718 | 289 |
| | | | | (881) |
See accompanying Notes, which are an integral part of the Financial Statements.
LifeStrategy Conservative Growth Fund
Statement of Assets and Liabilities
|
| ($000s, except shares, footnotes, and per-share amounts) | Amount |
| Assets | |
| Investments in Securities, at Value—Affiliated Funds (Cost $8,038,119) | 10,298,637 |
| Cash Collateral Pledged—Futures Contracts | 2,407 |
| Receivables for Investment Securities Sold | 3,466 |
| Receivables for Accrued Income | 17,118 |
| Receivables for Capital Shares Issued | 3,207 |
| Total Assets | 10,324,835 |
| Liabilities | |
| Payables for Investment Securities Purchased | 17,095 |
| Payables for Capital Shares Redeemed | 4,837 |
| Variation Margin Payable—Futures Contracts | 761 |
| Total Liabilities | 22,693 |
| Net Assets | 10,302,142 |
At October 31, 2024, net assets consisted of: |
|
| | |
| Paid-in Capital | 7,729,452 |
| Total Distributable Earnings (Loss) | 2,572,690 |
| Net Assets | 10,302,142 |
| | |
| Net Assets | |
Applicable to 480,475,761 outstanding $.001 par value shares of
beneficial interest (unlimited authorization) | 10,302,142 |
| Net Asset Value Per Share | $21.44 |
See accompanying Notes, which are an integral part of the Financial Statements.
LifeStrategy Conservative Growth Fund
|
| | Year Ended
October 31, 2024 |
| | ($000) |
| Investment Income | |
| Income | |
| Income Distributions Received from Affiliated Funds | 321,120 |
| Net Investment Income—Note B | 321,120 |
| Realized Net Gain (Loss) | |
| Capital Gain Distributions Received from Affiliated Funds | 1 |
| Affiliated Funds Sold | 396,606 |
| Futures Contracts | 9,856 |
| Realized Net Gain (Loss) | 406,463 |
| Change in Unrealized Appreciation (Depreciation) | |
| Affiliated Funds | 977,568 |
| Futures Contracts | 3,119 |
| Change in Unrealized Appreciation (Depreciation) | 980,687 |
| Net Increase (Decrease) in Net Assets Resulting from Operations | 1,708,270 |
See accompanying Notes, which are an integral part of the Financial Statements.
LifeStrategy Conservative Growth Fund
Statement of Changes in Net Assets
|
| | Year Ended October 31, |
| | 2024
($000) | 2023
($000) |
| Increase (Decrease) in Net Assets | | |
| Operations | | |
| Net Investment Income | 321,120 | 243,820 |
| Realized Net Gain (Loss) | 406,463 | 239,488 |
| Change in Unrealized Appreciation (Depreciation) | 980,687 | (31,120) |
| Net Increase (Decrease) in Net Assets Resulting from Operations | 1,708,270 | 452,188 |
| Distributions | | |
| Total Distributions | (552,586) | (311,559) |
| Capital Share Transactions | | |
| Issued | 995,329 | 869,660 |
| Issued in Lieu of Cash Distributions | 510,040 | 287,266 |
| Redeemed | (1,896,427) | (1,659,489) |
| Net Increase (Decrease) from Capital Share Transactions | (391,058) | (502,563) |
| Total Increase (Decrease) | 764,626 | (361,934) |
| Net Assets | | |
| Beginning of Period | 9,537,516 | 9,899,450 |
| End of Period | 10,302,142 | 9,537,516 |
See accompanying Notes, which are an integral part of the Financial Statements.
LifeStrategy Conservative Growth Fund
For a Share Outstanding
Throughout Each Period | Year Ended October 31, |
| 2024 | 2023 | 2022 | 2021 | 2020 |
| Net Asset Value, Beginning of Period | $19.10 | $18.87 | $23.66 | $21.49 | $20.79 |
| Investment Operations | | | | | |
| Net Investment Income1 | .656 | .476 | .472 | .360 | .488 |
| Capital Gain Distributions Received1 | .0002 | .0002 | .044 | .089 | — |
| Net Realized and Unrealized Gain (Loss) on Investments | 2.822 | .363 | (4.327) | 2.435 | .715 |
| Total from Investment Operations | 3.478 | .839 | (3.811) | 2.884 | 1.203 |
| Distributions | | | | | |
| Dividends from Net Investment Income | (.667) | (.468) | (.471) | (.362) | (.494) |
| Distributions from Realized Capital Gains | (.471) | (.141) | (.508) | (.352) | (.009) |
| Total Distributions | (1.138) | (.609) | (.979) | (.714) | (.503) |
| Net Asset Value, End of Period | $21.44 | $19.10 | $18.87 | $23.66 | $21.49 |
| Total Return3 | 18.51% | 4.43% | -16.67% | 13.57% | 5.89% |
| Ratios/Supplemental Data | | | | | |
| Net Assets, End of Period (Millions) | $10,302 | $9,538 | $9,899 | $12,746 | $10,790 |
| Ratio of Total Expenses to Average Net Assets | — | — | — | — | — |
| Acquired Fund Fees and Expenses | 0.12% | 0.12% | 0.12% | 0.12% | 0.12% |
| Ratio of Net Investment Income to Average Net Assets | 3.15% | 2.40% | 2.23% | 1.55% | 2.32% |
| Portfolio Turnover Rate | 5% | 4% | 21% | 5% | 23% |
| 1 | Calculated based on average shares outstanding. |
| 2 | Distribution was less than $.001 per share. |
| 3 | Total returns do not include account service fees that may have applied in the periods shown. Fund prospectuses provide information about any applicable account service fees. |
See accompanying Notes, which are an integral part of the Financial Statements.
LifeStrategy Conservative Growth Fund
Notes to Financial Statements
Vanguard LifeStrategy Conservative Growth Fund is registered under the Investment Company Act of 1940 as an open-end investment company, or mutual fund. The fund follows a balanced investment strategy by investing in selected Vanguard funds to achieve its targeted allocation of assets to U.S. and international stocks, and U.S. and international bonds. Financial statements and other information about each underlying fund are available at www.vanguard.com.
A. The following significant accounting policies conform to generally accepted accounting principles for U.S. investment companies. The fund consistently follows such policies in preparing its financial statements.
1. Security Valuation: Investments are valued at the net asset value of each underlying Vanguard fund determined as of the close of the New York Stock Exchange (generally 4 p.m., Eastern time) on the valuation date.
2. Futures Contracts: The fund uses stock and bond futures contracts to a limited extent, with the objectives of maintaining full exposure to the market and maintaining its target asset allocation. The primary risks associated with the use of futures contracts are imperfect correlation between changes in market values of investments held by the fund and the prices of futures contracts, and the possibility of an illiquid market. Counterparty risk involving futures is mitigated because a regulated clearinghouse is the counterparty instead of the clearing broker. To further mitigate counterparty risk, the fund trades futures contracts on an exchange, monitors the financial strength of its clearing brokers and clearinghouse, and has entered into clearing agreements with its clearing brokers. The clearinghouse imposes initial margin requirements to secure the fund’s performance and requires daily settlement of variation margin representing changes in the market value of each contract. Any securities pledged as initial margin for open contracts are noted in the Schedule of Investments.
Futures contracts are valued at their quoted daily settlement prices. The notional amounts of the contracts are not recorded in the Statement of Assets and Liabilities. Fluctuations in the value of the contracts are recorded in the Statement of Assets and Liabilities as an asset (liability) and in the Statement of Operations as unrealized appreciation (depreciation) until the contracts are closed, when they are recorded as realized gains (losses) on futures contracts.
During the year ended October 31, 2024, the fund’s average investments in long and short futures contracts represented 1% and 0% of net assets, respectively, based on the average of the notional amounts at each quarter-end during the period.
3. Federal Income Taxes: The fund intends to continue to qualify as a regulated investment company and distribute virtually all of its taxable income. The fund’s tax returns are open to examination by the relevant tax authorities until expiration of the applicable statute of limitations, which is generally three years after the filing of the tax return. Management has analyzed the fund’s tax positions taken for all open federal and state income tax years, and has concluded that no provision for income tax is required in the fund’s financial statements.
4. Distributions: Distributions to shareholders are recorded on the ex-dividend date. Distributions are determined on a tax basis at the fiscal year-end and may differ from net investment income and realized capital gains for financial reporting purposes.
5. Credit Facilities and Interfund Lending Program: The fund and certain other funds managed by The Vanguard Group ("Vanguard") participate in a $4.3 billion committed credit facility provided by a syndicate of lenders pursuant to a credit agreement and an uncommitted credit facility provided by Vanguard. Both facilities may be renewed annually. Each fund is individually liable for its borrowings, if any, under the credit facilities. Borrowings may be utilized for temporary or emergency purposes and are subject to the fund’s regulatory and contractual borrowing restrictions. With respect to the committed credit facility, the participating funds are charged administrative fees and an annual commitment fee of 0.10% of the undrawn committed amount of the facility, which are allocated to the funds based on a method approved by the fund’s board of trustees and borne by the funds in which the fund invests (see Note B). Any borrowings under either facility bear interest at an agreed-upon spread plus the higher of the federal funds effective rate, the overnight bank funding rate, or the Daily Simple Secured Overnight Financing Rate inclusive of an additional agreed-upon spread. However, borrowings under the uncommitted credit facility may bear interest based upon an alternate rate agreed to by the fund and Vanguard.
In accordance with an exemptive order (the “Order”) from the SEC, the fund may participate in a joint lending and borrowing program that allows registered open-end Vanguard funds to borrow money from and lend money to each other for temporary or emergency purposes (the “Interfund Lending Program”), subject to compliance with the terms and conditions of the Order, and to the extent permitted by the fund’s investment objective and investment policies. Interfund loans and borrowings normally extend overnight but can have a maximum duration of seven days. Loans may be called on one business day’s notice. The interest rate to be charged is governed by the conditions of the Order and internal procedures adopted by the board of trustees. The board of trustees is responsible for overseeing the Interfund Lending Program.
For the year ended October 31, 2024, the fund did not utilize the credit facilities or the Interfund Lending Program.
6. Other: Income and capital gain distributions received are recorded on the ex-dividend date. Security transactions are accounted for on the date securities are bought or sold. Costs used to determine realized gains (losses) on the sale of investment securities are those of the specific securities sold.
B. In accordance with the terms of a Funds’ Service Agreement (the “FSA”) between Vanguard and the fund, Vanguard furnishes to the fund investment advisory, corporate management, administrative, marketing, and distribution services at Vanguard’s cost of operations (as defined by the FSA). These costs of operations are allocated to the fund based on methods and guidelines approved by the board of trustees. The FSA provides that expenses otherwise allocable to Vanguard funds-of-funds may be reduced or eliminated to the extent of savings realized by the underlying Vanguard funds by virtue of being part of a fund-of-funds. Accordingly, all expenses for services provided by Vanguard to the fund and all other expenses incurred by the fund during the year ended October 31, 2024, were borne by the underlying Vanguard funds in which the fund invests. The fund's trustees and officers are also trustees and officers, respectively, of the underlying Vanguard funds, as well as directors and employees, respectively, of Vanguard.
LifeStrategy Conservative Growth Fund
C. Various inputs may be used to determine the value of the fund’s investments and derivatives. These inputs are summarized in three broad levels for financial statement purposes. The inputs or methodologies used to value securities are not necessarily an indication of the risk associated with investing in those securities.
Level 1—Quoted prices in active markets for identical securities.
Level 2—Other significant observable inputs (including quoted prices for similar securities, interest rates, prepayment speeds, credit risk, etc.).
Level 3—Significant unobservable inputs (including the fund’s own assumptions used to determine the fair value of investments). Any investments and derivatives valued with significant unobservable inputs are noted on the Schedule of Investments.
At October 31, 2024, 100% of the market value of the fund's investments and derivatives was determined based on Level 1 inputs.
D. Permanent differences between book-basis and tax-basis components of net assets are reclassified among capital accounts in the financial statements to reflect their tax character. These reclassifications have no effect on net assets or net asset value per share. As of period end, permanent differences primarily attributable to the accounting for distributions in connection with fund share redemptions were reclassified between the following accounts:
| | Amount
($000) |
| Paid-in Capital | 26,923 |
| Total Distributable Earnings (Loss) | (26,923) |
Temporary differences between book-basis and tax-basis components of total distributable earnings (loss) arise when certain items of income, gain, or loss are recognized in different periods for financial statement and tax purposes; these differences will reverse at some time in the future. The differences are primarily related to the deferral of losses from wash sales; and the recognition of unrealized gains or losses from certain derivative contracts. As of period end, the tax-basis components of total distributable earnings (loss) are detailed in the table as follows:
| | Amount
($000) |
| Undistributed Ordinary Income | 30,344 |
| Undistributed Long-Term Gains | 365,048 |
| Net Unrealized Gains (Losses) | 2,177,298 |
| Capital Loss Carryforwards | — |
| Qualified Late-Year Losses | — |
| Other Temporary Differences | — |
| Total | 2,572,690 |
The tax character of distributions paid was as follows:
| | Year Ended October 31, |
| | 2024
Amount
($000) | 2023
Amount
($000) |
| Ordinary Income* | 324,934 | 238,847 |
| Long-Term Capital Gains | 227,652 | 72,712 |
| Total | 552,586 | 311,559 |
| * | Includes short-term capital gains, if any. |
As of October 31, 2024, gross unrealized appreciation and depreciation for investments and derivatives based on cost for U.S. federal income tax purposes were as follows:
| | Amount
($000) |
| Tax Cost | 8,121,339 |
| Gross Unrealized Appreciation | 2,707,418 |
| Gross Unrealized Depreciation | (530,120) |
| Net Unrealized Appreciation (Depreciation) | 2,177,298 |
LifeStrategy Conservative Growth Fund
E. Capital shares issued and redeemed were:
| | Year Ended October 31, |
| | 2024
Shares
(000) | 2023
Shares
(000) |
| Issued | 47,730 | 43,876 |
| Issued in Lieu of Cash Distributions | 24,647 | 14,811 |
| Redeemed | (91,331) | (83,907) |
| Net Increase (Decrease) in Shares Outstanding | (18,954) | (25,220) |
F. Transactions during the period in affiliated underlying Vanguard funds were as follows:
| | | Current Period Transactions | |
| | Oct. 31, 2023
Market Value
($000) | Purchases
at Cost
($000) | Proceeds
from
Securities
Sold
($000) | Realized
Net Gain
(Loss)
($000) | Change in
Unrealized
App. (Dep.)
($000) | Income
($000) | Capital Gain
Distributions
Received
($000) | Oct. 31, 2024
Market Value
($000) |
| Vanguard Market Liquidity Fund | 67,235 | NA1 | NA1 | 1 | (1) | 4,040 | 1 | 63,821 |
| Vanguard Total Bond Market II Index Fund | 3,976,385 | 235,283 | 251,805 | (12,195) | 273,981 | 151,732 | — | 4,221,649 |
| Vanguard Total International Bond II Index Fund | 1,743,110 | 92,164 | 52,423 | (29) | 81,196 | 84,020 | — | 1,864,018 |
| Vanguard Total International Stock Index Fund | 1,508,862 | 96,804 | 248,621 | 30,926 | 261,951 | 48,862 | — | 1,649,922 |
| Vanguard Total Stock Market Index Fund | 2,240,253 | 110,787 | 590,157 | 377,903 | 360,441 | 32,466 | — | 2,499,227 |
| Total | 9,535,845 | 535,038 | 1,143,006 | 396,606 | 977,568 | 321,120 | 1 | 10,298,637 |
| 1 | Not applicable—purchases and sales are for temporary cash investment purposes. |
G. Significant market disruptions, such as those caused by pandemics, natural or environmental disasters, war, acts of terrorism, or other events, can adversely affect local and global markets and normal market operations. Any such disruptions could have an adverse impact on the value of the fund’s investments and fund performance.
To the extent the fund’s investment portfolio reflects concentration in a particular market, industry, sector, country or asset class, the fund may be adversely affected by the performance of these concentrations and may be subject to increased price volatility and other risks.
The use of derivatives may expose the fund to various risks. Derivatives can be highly volatile, and any initial investment is generally small relative to the notional amount so that transactions may be leveraged in terms of market exposure. A relatively small market movement may have a potentially larger impact on derivatives than on standard securities. Leveraged derivatives positions can, therefore, increase volatility. Additional information regarding the fund’s use of derivative(s) and the specific risks associated is described under significant accounting policies.
H. Management has determined that no events or transactions occurred subsequent to October 31, 2024, that would require recognition or disclosure in these financial statements.
LifeStrategy Moderate Growth Fund
Schedule of Investments
As of October 31, 2024
The fund files its complete schedule of portfolio holdings with the Securities and Exchange Commission (SEC) for the first and third quarters of each fiscal year as an exhibit to its reports on Form N-PORT. The fund’s Form N-PORT reports are available on the SEC’s website at www.sec.gov.
| | | | | | Shares | Market
Value•
($000) |
| Investment Companies (99.4%) |
| U.S. Stock Fund (36.3%) |
| | Vanguard Total Stock Market Index Fund Investor Shares | 56,749,916 | 7,762,821 |
| International Stock Fund (24.0%) |
| | Vanguard Total International Stock Index Fund Investor Shares | 258,577,697 | 5,127,596 |
| U.S. Bond Fund (27.1%) |
| 1 | Vanguard Total Bond Market II Index Fund Investor Shares | 611,687,199 | 5,798,794 |
| International Bond Fund (12.0%) |
| 1 | Vanguard Total International Bond II Index Fund Investor Shares | 283,288,917 | 2,560,932 |
| Total Investment Companies (Cost $13,608,667) | 21,250,143 |
| Temporary Cash Investments (0.6%) |
| Money Market Fund (0.6%) |
| 1 | Vanguard Market Liquidity Fund, 4.834% (Cost $126,520) | 1,265,605 | 126,548 |
| Total Investments (100.0%) (Cost $13,735,187) | | 21,376,691 |
| Other Assets and Liabilities—Net (0.0%) | | (1,853) |
| Net Assets (100%) | | 21,374,838 |
| • | See Note A in Notes to Financial Statements. |
| 1 | Affiliated fund available only to Vanguard funds and certain trusts and accounts managed by Vanguard. Rate shown for Vanguard Market Liquidity Fund is the 7-day yield. |
Derivative Financial Instruments Outstanding as of Period End
| Futures Contracts |
| | | | ($000) |
| | Expiration | Number of
Long (Short)
Contracts | Notional
Amount | Value and
Unrealized
Appreciation
(Depreciation) |
| Long Futures Contracts |
| 10-Year U.S. Treasury Note | December 2024 | 611 | 67,496 | (2,249) |
| E-mini S&P 500 Index | December 2024 | 213 | 61,115 | 510 |
| | | | | (1,739) |
See accompanying Notes, which are an integral part of the Financial Statements.
LifeStrategy Moderate Growth Fund
Statement of Assets and Liabilities
|
| ($000s, except shares, footnotes, and per-share amounts) | Amount |
| Assets | |
| Investments in Securities, at Value—Affiliated Funds (Cost $13,735,187) | 21,376,691 |
| Cash Collateral Pledged—Futures Contracts | 4,333 |
| Receivables for Investment Securities Sold | 675 |
| Receivables for Accrued Income | 23,695 |
| Receivables for Capital Shares Issued | 5,025 |
| Total Assets | 21,410,419 |
| Liabilities | |
| Payables for Investment Securities Purchased | 23,662 |
| Payables for Capital Shares Redeemed | 10,567 |
| Variation Margin Payable—Futures Contracts | 1,352 |
| Total Liabilities | 35,581 |
| Net Assets | 21,374,838 |
At October 31, 2024, net assets consisted of: |
|
| | |
| Paid-in Capital | 12,846,358 |
| Total Distributable Earnings (Loss) | 8,528,480 |
| Net Assets | 21,374,838 |
| | |
| Net Assets | |
Applicable to 646,547,904 outstanding $.001 par value shares of
beneficial interest (unlimited authorization) | 21,374,838 |
| Net Asset Value Per Share | $33.06 |
See accompanying Notes, which are an integral part of the Financial Statements.
LifeStrategy Moderate Growth Fund
|
| | Year Ended
October 31, 2024 |
| | ($000) |
| Investment Income | |
| Income | |
| Income Distributions Received from Affiliated Funds | 574,855 |
| Net Investment Income—Note B | 574,855 |
| Realized Net Gain (Loss) | |
| Capital Gain Distributions Received from Affiliated Funds | 1 |
| Affiliated Funds Sold | 907,854 |
| Futures Contracts | 18,920 |
| Realized Net Gain (Loss) | 926,775 |
| Change in Unrealized Appreciation (Depreciation) | |
| Affiliated Funds | 2,667,887 |
| Futures Contracts | 5,861 |
| Change in Unrealized Appreciation (Depreciation) | 2,673,748 |
| Net Increase (Decrease) in Net Assets Resulting from Operations | 4,175,378 |
See accompanying Notes, which are an integral part of the Financial Statements.
LifeStrategy Moderate Growth Fund
Statement of Changes in Net Assets
|
| | Year Ended October 31, |
| | 2024
($000) | 2023
($000) |
| Increase (Decrease) in Net Assets | | |
| Operations | | |
| Net Investment Income | 574,855 | 441,638 |
| Realized Net Gain (Loss) | 926,775 | 274,559 |
| Change in Unrealized Appreciation (Depreciation) | 2,673,748 | 375,154 |
| Net Increase (Decrease) in Net Assets Resulting from Operations | 4,175,378 | 1,091,351 |
| Distributions | | |
| Total Distributions | (841,949) | (513,788) |
| Capital Share Transactions | | |
| Issued | 2,066,103 | 1,649,703 |
| Issued in Connection with Acquisition of Vanguard Managed Allocation Fund—Note F | — | 1,071,642 |
| Issued in Lieu of Cash Distributions | 776,357 | 478,648 |
| Redeemed | (3,550,066) | (2,746,691) |
| Net Increase (Decrease) from Capital Share Transactions | (707,606) | 453,302 |
| Total Increase (Decrease) | 2,625,823 | 1,030,865 |
| Net Assets | | |
| Beginning of Period | 18,749,015 | 17,718,150 |
| End of Period | 21,374,838 | 18,749,015 |
See accompanying Notes, which are an integral part of the Financial Statements.
LifeStrategy Moderate Growth Fund
For a Share Outstanding
Throughout Each Period | Year Ended October 31, |
| 2024 | 2023 | 2022 | 2021 | 2020 |
| Net Asset Value, Beginning of Period | $28.04 | $27.13 | $34.35 | $29.27 | $28.29 |
| Investment Operations | | | | | |
| Net Investment Income1 | .873 | .668 | .660 | .528 | .633 |
| Capital Gain Distributions Received1 | .0002 | .0002 | .041 | .082 | — |
| Net Realized and Unrealized Gain (Loss) on Investments | 5.438 | 1.025 | (6.612) | 5.561 | 1.012 |
| Total from Investment Operations | 6.311 | 1.693 | (5.911) | 6.171 | 1.645 |
| Distributions | | | | | |
| Dividends from Net Investment Income | (.868) | (.627) | (.655) | (.537) | (.647) |
| Distributions from Realized Capital Gains | (.423) | (.156) | (.654) | (.554) | (.018) |
| Total Distributions | (1.291) | (.783) | (1.309) | (1.091) | (.665) |
| Net Asset Value, End of Period | $33.06 | $28.04 | $27.13 | $34.35 | $29.27 |
| Total Return3 | 22.87% | 6.26% | -17.80% | 21.38% | 5.89% |
| Ratios/Supplemental Data | | | | | |
| Net Assets, End of Period (Millions) | $21,375 | $18,749 | $17,718 | $22,295 | $17,658 |
| Ratio of Total Expenses to Average Net Assets | — | — | — | — | — |
| Acquired Fund Fees and Expenses | 0.13% | 0.13% | 0.13% | 0.13% | 0.13% |
| Ratio of Net Investment Income to Average Net Assets | 2.76% | 2.31% | 2.17% | 1.60% | 2.23% |
| Portfolio Turnover Rate | 6% | 5% | 15% | 5% | 21% |
| 1 | Calculated based on average shares outstanding. |
| 2 | Distribution was less than $.001 per share. |
| 3 | Total returns do not include account service fees that may have applied in the periods shown. Fund prospectuses provide information about any applicable account service fees. |
See accompanying Notes, which are an integral part of the Financial Statements.
LifeStrategy Moderate Growth Fund
Notes to Financial Statements
Vanguard LifeStrategy Moderate Growth Fund is registered under the Investment Company Act of 1940 as an open-end investment company, or mutual fund. The fund follows a balanced investment strategy by investing in selected Vanguard funds to achieve its targeted allocation of assets to U.S. and international stocks, and U.S. and international bonds. Financial statements and other information about each underlying fund are available at www.vanguard.com.
A. The following significant accounting policies conform to generally accepted accounting principles for U.S. investment companies. The fund consistently follows such policies in preparing its financial statements.
1. Security Valuation: Investments are valued at the net asset value of each underlying Vanguard fund determined as of the close of the New York Stock Exchange (generally 4 p.m., Eastern time) on the valuation date.
2. Futures Contracts: The fund uses stock and bond futures contracts to a limited extent, with the objectives of maintaining full exposure to the market and maintaining its target asset allocation. The primary risks associated with the use of futures contracts are imperfect correlation between changes in market values of investments held by the fund and the prices of futures contracts, and the possibility of an illiquid market. Counterparty risk involving futures is mitigated because a regulated clearinghouse is the counterparty instead of the clearing broker. To further mitigate counterparty risk, the fund trades futures contracts on an exchange, monitors the financial strength of its clearing brokers and clearinghouse, and has entered into clearing agreements with its clearing brokers. The clearinghouse imposes initial margin requirements to secure the fund’s performance and requires daily settlement of variation margin representing changes in the market value of each contract. Any securities pledged as initial margin for open contracts are noted in the Schedule of Investments.
Futures contracts are valued at their quoted daily settlement prices. The notional amounts of the contracts are not recorded in the Statement of Assets and Liabilities. Fluctuations in the value of the contracts are recorded in the Statement of Assets and Liabilities as an asset (liability) and in the Statement of Operations as unrealized appreciation (depreciation) until the contracts are closed, when they are recorded as realized gains (losses) on futures contracts.
During the year ended October 31, 2024, the fund’s average investments in long and short futures contracts represented 1% and 0% of net assets, respectively, based on the average of the notional amounts at each quarter-end during the period.
3. Federal Income Taxes: The fund intends to continue to qualify as a regulated investment company and distribute virtually all of its taxable income. The fund’s tax returns are open to examination by the relevant tax authorities until expiration of the applicable statute of limitations, which is generally three years after the filing of the tax return. Management has analyzed the fund’s tax positions taken for all open federal and state income tax years, and has concluded that no provision for income tax is required in the fund’s financial statements.
4. Distributions: Distributions to shareholders are recorded on the ex-dividend date. Distributions are determined on a tax basis at the fiscal year-end and may differ from net investment income and realized capital gains for financial reporting purposes.
5. Credit Facilities and Interfund Lending Program: The fund and certain other funds managed by The Vanguard Group ("Vanguard") participate in a $4.3 billion committed credit facility provided by a syndicate of lenders pursuant to a credit agreement and an uncommitted credit facility provided by Vanguard. Both facilities may be renewed annually. Each fund is individually liable for its borrowings, if any, under the credit facilities. Borrowings may be utilized for temporary or emergency purposes and are subject to the fund’s regulatory and contractual borrowing restrictions. With respect to the committed credit facility, the participating funds are charged administrative fees and an annual commitment fee of 0.10% of the undrawn committed amount of the facility, which are allocated to the funds based on a method approved by the fund’s board of trustees and borne by the funds in which the fund invests (see Note B). Any borrowings under either facility bear interest at an agreed-upon spread plus the higher of the federal funds effective rate, the overnight bank funding rate, or the Daily Simple Secured Overnight Financing Rate inclusive of an additional agreed-upon spread. However, borrowings under the uncommitted credit facility may bear interest based upon an alternate rate agreed to by the fund and Vanguard.
In accordance with an exemptive order (the “Order”) from the SEC, the fund may participate in a joint lending and borrowing program that allows registered open-end Vanguard funds to borrow money from and lend money to each other for temporary or emergency purposes (the “Interfund Lending Program”), subject to compliance with the terms and conditions of the Order, and to the extent permitted by the fund’s investment objective and investment policies. Interfund loans and borrowings normally extend overnight but can have a maximum duration of seven days. Loans may be called on one business day’s notice. The interest rate to be charged is governed by the conditions of the Order and internal procedures adopted by the board of trustees. The board of trustees is responsible for overseeing the Interfund Lending Program.
For the year ended October 31, 2024, the fund did not utilize the credit facilities or the Interfund Lending Program.
6. Other: Income and capital gain distributions received are recorded on the ex-dividend date. Security transactions are accounted for on the date securities are bought or sold. Costs used to determine realized gains (losses) on the sale of investment securities are those of the specific securities sold.
B. In accordance with the terms of a Funds’ Service Agreement (the “FSA”) between Vanguard and the fund, Vanguard furnishes to the fund investment advisory, corporate management, administrative, marketing, and distribution services at Vanguard’s cost of operations (as defined by the FSA). These costs of operations are allocated to the fund based on methods and guidelines approved by the board of trustees. The FSA provides that expenses otherwise allocable to Vanguard funds-of-funds may be reduced or eliminated to the extent of savings realized by the underlying Vanguard funds by virtue of being part of a fund-of-funds. Accordingly, all expenses for services provided by Vanguard to the fund and all other expenses incurred by the fund during the year ended October 31, 2024, were borne by the underlying Vanguard funds in which the fund invests. The fund's trustees and officers are also trustees and officers, respectively, of the underlying Vanguard funds, as well as directors and employees, respectively, of Vanguard.
LifeStrategy Moderate Growth Fund
C. Various inputs may be used to determine the value of the fund’s investments and derivatives. These inputs are summarized in three broad levels for financial statement purposes. The inputs or methodologies used to value securities are not necessarily an indication of the risk associated with investing in those securities.
Level 1—Quoted prices in active markets for identical securities.
Level 2—Other significant observable inputs (including quoted prices for similar securities, interest rates, prepayment speeds, credit risk, etc.).
Level 3—Significant unobservable inputs (including the fund’s own assumptions used to determine the fair value of investments). Any investments and derivatives valued with significant unobservable inputs are noted on the Schedule of Investments.
At October 31, 2024, 100% of the market value of the fund's investments and derivatives was determined based on Level 1 inputs.
D. Permanent differences between book-basis and tax-basis components of net assets are reclassified among capital accounts in the financial statements to reflect their tax character. These reclassifications have no effect on net assets or net asset value per share. As of period end, permanent differences primarily attributable to the accounting for distributions in connection with fund share redemptions were reclassified between the following accounts:
| | Amount
($000) |
| Paid-in Capital | 66,411 |
| Total Distributable Earnings (Loss) | (66,411) |
Temporary differences between book-basis and tax-basis components of total distributable earnings (loss) arise when certain items of income, gain, or loss are recognized in different periods for financial statement and tax purposes; these differences will reverse at some time in the future. The differences are primarily related to the deferral of losses from wash sales; and the recognition of unrealized gains or losses from certain derivative contracts. As of period end, the tax-basis components of total distributable earnings (loss) are detailed in the table as follows:
| | Amount
($000) |
| Undistributed Ordinary Income | 160,172 |
| Undistributed Long-Term Gains | 844,557 |
| Net Unrealized Gains (Losses) | 7,523,751 |
| Capital Loss Carryforwards | — |
| Qualified Late-Year Losses | — |
| Other Temporary Differences | — |
| Total | 8,528,480 |
The tax character of distributions paid was as follows:
| | Year Ended October 31, |
| | 2024
Amount
($000) | 2023
Amount
($000) |
| Ordinary Income* | 574,307 | 413,296 |
| Long-Term Capital Gains | 267,642 | 100,492 |
| Total | 841,949 | 513,788 |
| * | Includes short-term capital gains, if any. |
As of October 31, 2024, gross unrealized appreciation and depreciation for investments and derivatives based on cost for U.S. federal income tax purposes were as follows:
| | Amount
($000) |
| Tax Cost | 13,852,940 |
| Gross Unrealized Appreciation | 8,211,665 |
| Gross Unrealized Depreciation | (687,914) |
| Net Unrealized Appreciation (Depreciation) | 7,523,751 |
LifeStrategy Moderate Growth Fund
E. Capital shares issued and redeemed were:
| | Year Ended October 31, |
| | 2024
Shares
(000) | 2023
Shares
(000) |
| Issued | 65,495 | 57,191 |
| Issued in Connection with Acquisition of Vanguard Managed Allocation Fund—Note F | — | 36,763 |
| Issued in Lieu of Cash Distributions | 25,136 | 17,062 |
| Redeemed | (112,771) | (95,326) |
| Net Increase (Decrease) in Shares Outstanding | (22,140) | 15,690 |
F. On May 19, 2023, the fund acquired all the net assets of Vanguard Managed Allocation Fund pursuant to a plan of reorganization approved by the funds' board of trustees in February 2023. The purpose of the transaction was to combine two funds with comparable investment objectives. The acquisition was accomplished by a tax-free exchange of 36,763,000 shares of the fund for 68,695,000 shares of the Vanguard Managed Allocation Fund. Vanguard Managed Allocation Fund's net assets of $1,071,642,000 including $153,596,000 of unrealized appreciation, were combined with the fund's net assets of $18,749,286,000, resulting in combined net assets of $19,820,928,000.
G. Transactions during the period in affiliated underlying Vanguard funds were as follows:
| | | Current Period Transactions | |
| | Oct. 31, 2023
Market Value
($000) | Purchases
at Cost
($000) | Proceeds
from
Securities
Sold
($000) | Realized
Net Gain
(Loss)
($000) | Change in
Unrealized
App. (Dep.)
($000) | Income
($000) | Capital Gain
Distributions
Received
($000) | Oct. 31, 2024
Market Value
($000) |
| Vanguard Market Liquidity Fund | 131,477 | NA1 | NA1 | 7 | (1) | 7,769 | 1 | 126,548 |
| Vanguard Total Bond Market II Index Fund | 5,150,436 | 550,822 | 245,312 | (16,596) | 359,444 | 205,027 | — | 5,798,794 |
| Vanguard Total International Bond II Index Fund | 2,304,812 | 200,125 | 53,541 | 387 | 109,149 | 112,772 | — | 2,560,932 |
| Vanguard Total International Stock Index Fund | 4,479,956 | 242,217 | 470,285 | 38,130 | 837,578 | 149,072 | — | 5,127,596 |
| Vanguard Total Stock Market Index Fund | 6,679,214 | 183,858 | 1,347,894 | 885,926 | 1,361,717 | 100,215 | — | 7,762,821 |
| Total | 18,745,895 | 1,177,022 | 2,117,032 | 907,854 | 2,667,887 | 574,855 | 1 | 21,376,691 |
| 1 | Not applicable—purchases and sales are for temporary cash investment purposes. |
H. Significant market disruptions, such as those caused by pandemics, natural or environmental disasters, war, acts of terrorism, or other events, can adversely affect local and global markets and normal market operations. Any such disruptions could have an adverse impact on the value of the fund’s investments and fund performance.
To the extent the fund’s investment portfolio reflects concentration in a particular market, industry, sector, country or asset class, the fund may be adversely affected by the performance of these concentrations and may be subject to increased price volatility and other risks.
The use of derivatives may expose the fund to various risks. Derivatives can be highly volatile, and any initial investment is generally small relative to the notional amount so that transactions may be leveraged in terms of market exposure. A relatively small market movement may have a potentially larger impact on derivatives than on standard securities. Leveraged derivatives positions can, therefore, increase volatility. Additional information regarding the fund’s use of derivative(s) and the specific risks associated is described under significant accounting policies.
I. Management has determined that no events or transactions occurred subsequent to October 31, 2024, that would require recognition or disclosure in these financial statements.
Schedule of Investments
As of October 31, 2024
The fund files its complete schedule of portfolio holdings with the Securities and Exchange Commission (SEC) for the first and third quarters of each fiscal year as an exhibit to its reports on Form N-PORT. The fund’s Form N-PORT reports are available on the SEC’s website at www.sec.gov.
| | | | | | Shares | Market
Value•
($000) |
| Investment Companies (99.3%) |
| U.S. Stock Fund (48.6%) |
| | Vanguard Total Stock Market Index Fund Investor Shares | 78,127,593 | 10,687,073 |
| International Stock Fund (31.5%) |
| | Vanguard Total International Stock Index Fund Investor Shares | 349,624,571 | 6,933,055 |
| U.S. Bond Fund (13.3%) |
| 1 | Vanguard Total Bond Market II Index Fund Investor Shares | 309,236,671 | 2,931,564 |
| International Bond Fund (5.9%) |
| 1 | Vanguard Total International Bond II Index Fund Investor Shares | 142,864,917 | 1,291,499 |
| Total Investment Companies (Cost $11,354,250) | 21,843,191 |
| Temporary Cash Investments (0.7%) |
| Money Market Fund (0.7%) |
| 1 | Vanguard Market Liquidity Fund, 4.834% (Cost $160,945) | 1,609,899 | 160,974 |
| Total Investments (100.0%) (Cost $11,515,195) | | 22,004,165 |
| Other Assets and Liabilities—Net (0.0%) | | (1,191) |
| Net Assets (100%) | | 22,002,974 |
| • | See Note A in Notes to Financial Statements. |
| 1 | Affiliated fund available only to Vanguard funds and certain trusts and accounts managed by Vanguard. Rate shown for Vanguard Market Liquidity Fund is the 7-day yield. |
Derivative Financial Instruments Outstanding as of Period End
| Futures Contracts |
| | | | ($000) |
| | Expiration | Number of
Long (Short)
Contracts | Notional
Amount | Value and
Unrealized
Appreciation
(Depreciation) |
| Long Futures Contracts |
| 10-Year U.S. Treasury Note | December 2024 | 731 | 80,753 | (2,690) |
| E-mini S&P 500 Index | December 2024 | 293 | 84,069 | 701 |
| | | | | (1,989) |
See accompanying Notes, which are an integral part of the Financial Statements.
Statement of Assets and Liabilities
|
| ($000s, except shares, footnotes, and per-share amounts) | Amount |
| Assets | |
| Investments in Securities, at Value—Affiliated Funds (Cost $11,515,195) | 22,004,165 |
| Cash Collateral Pledged—Futures Contracts | 5,747 |
| Receivables for Investment Securities Sold | 2,359 |
| Receivables for Accrued Income | 12,335 |
| Receivables for Capital Shares Issued | 4,492 |
| Total Assets | 22,029,098 |
| Liabilities | |
| Payables for Investment Securities Purchased | 12,327 |
| Payables for Capital Shares Redeemed | 11,963 |
| Variation Margin Payable—Futures Contracts | 1,834 |
| Total Liabilities | 26,124 |
| Net Assets | 22,002,974 |
At October 31, 2024, net assets consisted of: |
|
| | |
| Paid-in Capital | 10,704,784 |
| Total Distributable Earnings (Loss) | 11,298,190 |
| Net Assets | 22,002,974 |
| | |
| Net Assets | |
Applicable to 477,183,799 outstanding $.001 par value shares of
beneficial interest (unlimited authorization) | 22,002,974 |
| Net Asset Value Per Share | $46.11 |
See accompanying Notes, which are an integral part of the Financial Statements.
|
| | Year Ended
October 31, 2024 |
| | ($000) |
| Investment Income | |
| Income | |
| Income Distributions Received from Affiliated Funds | 495,845 |
| Net Investment Income—Note B | 495,845 |
| Realized Net Gain (Loss) | |
| Capital Gain Distributions Received from Affiliated Funds | 2 |
| Affiliated Funds Sold | 805,429 |
| Futures Contracts | 17,745 |
| Realized Net Gain (Loss) | 823,176 |
| Change in Unrealized Appreciation (Depreciation) | |
| Affiliated Funds | 3,532,964 |
| Futures Contracts | 8,585 |
| Change in Unrealized Appreciation (Depreciation) | 3,541,549 |
| Net Increase (Decrease) in Net Assets Resulting from Operations | 4,860,570 |
See accompanying Notes, which are an integral part of the Financial Statements.
Statement of Changes in Net Assets
|
| | Year Ended October 31, |
| | 2024
($000) | 2023
($000) |
| Increase (Decrease) in Net Assets | | |
| Operations | | |
| Net Investment Income | 495,845 | 410,286 |
| Realized Net Gain (Loss) | 823,176 | 109,850 |
| Change in Unrealized Appreciation (Depreciation) | 3,541,549 | 871,120 |
| Net Increase (Decrease) in Net Assets Resulting from Operations | 4,860,570 | 1,391,256 |
| Distributions | | |
| Total Distributions | (620,172) | (417,946) |
| Capital Share Transactions | | |
| Issued | 2,061,373 | 1,640,645 |
| Issued in Lieu of Cash Distributions | 583,587 | 394,381 |
| Redeemed | (2,919,915) | (2,248,485) |
| Net Increase (Decrease) from Capital Share Transactions | (274,955) | (213,459) |
| Total Increase (Decrease) | 3,965,443 | 759,851 |
| Net Assets | | |
| Beginning of Period | 18,037,531 | 17,277,680 |
| End of Period | 22,002,974 | 18,037,531 |
See accompanying Notes, which are an integral part of the Financial Statements.
For a Share Outstanding
Throughout Each Period | Year Ended October 31, |
| 2024 | 2023 | 2022 | 2021 | 2020 |
| Net Asset Value, Beginning of Period | $37.33 | $35.36 | $45.26 | $36.15 | $34.92 |
| Investment Operations | | | | | |
| Net Investment Income1 | 1.029 | .843 | .845 | .705 | .740 |
| Capital Gain Distributions Received1 | .0002 | .0002 | .026 | .051 | — |
| Net Realized and Unrealized Gain (Loss) on Investments | 9.049 | 1.990 | (9.175) | 9.813 | 1.246 |
| Total from Investment Operations | 10.078 | 2.833 | (8.304) | 10.569 | 1.986 |
| Distributions | | | | | |
| Dividends from Net Investment Income | (1.023) | (.820) | (.851) | (.709) | (.749) |
| Distributions from Realized Capital Gains | (.275) | (.043) | (.745) | (.750) | (.007) |
| Total Distributions | (1.298) | (.863) | (1.596) | (1.459) | (.756) |
| Net Asset Value, End of Period | $46.11 | $37.33 | $35.36 | $45.26 | $36.15 |
| Total Return3 | 27.32% | 8.03% | -18.92% | 29.69% | 5.74% |
| Ratios/Supplemental Data | | | | | |
| Net Assets, End of Period (Millions) | $22,003 | $18,038 | $17,278 | $21,449 | $16,125 |
| Ratio of Total Expenses to Average Net Assets | — | — | — | — | — |
| Acquired Fund Fees and Expenses | 0.14% | 0.14% | 0.14% | 0.14% | 0.14% |
| Ratio of Net Investment Income to Average Net Assets | 2.36% | 2.20% | 2.12% | 1.65% | 2.12% |
| Portfolio Turnover Rate | 5% | 3% | 8% | 4% | 13% |
| 1 | Calculated based on average shares outstanding. |
| 2 | Distribution was less than $.001 per share. |
| 3 | Total returns do not include account service fees that may have applied in the periods shown. Fund prospectuses provide information about any applicable account service fees. |
See accompanying Notes, which are an integral part of the Financial Statements.
Notes to Financial Statements
Vanguard LifeStrategy Growth Fund is registered under the Investment Company Act of 1940 as an open-end investment company, or mutual fund. The fund follows a balanced investment strategy by investing in selected Vanguard funds to achieve its targeted allocation of assets to U.S. and international stocks, and U.S. and international bonds. Financial statements and other information about each underlying fund are available at www.vanguard.com.
A. The following significant accounting policies conform to generally accepted accounting principles for U.S. investment companies. The fund consistently follows such policies in preparing its financial statements.
1. Security Valuation: Investments are valued at the net asset value of each underlying Vanguard fund determined as of the close of the New York Stock Exchange (generally 4 p.m., Eastern time) on the valuation date.
2. Futures Contracts: The fund uses stock and bond futures contracts to a limited extent, with the objectives of maintaining full exposure to the market and maintaining its target asset allocation. The primary risks associated with the use of futures contracts are imperfect correlation between changes in market values of investments held by the fund and the prices of futures contracts, and the possibility of an illiquid market. Counterparty risk involving futures is mitigated because a regulated clearinghouse is the counterparty instead of the clearing broker. To further mitigate counterparty risk, the fund trades futures contracts on an exchange, monitors the financial strength of its clearing brokers and clearinghouse, and has entered into clearing agreements with its clearing brokers. The clearinghouse imposes initial margin requirements to secure the fund’s performance and requires daily settlement of variation margin representing changes in the market value of each contract. Any securities pledged as initial margin for open contracts are noted in the Schedule of Investments.
Futures contracts are valued at their quoted daily settlement prices. The notional amounts of the contracts are not recorded in the Statement of Assets and Liabilities. Fluctuations in the value of the contracts are recorded in the Statement of Assets and Liabilities as an asset (liability) and in the Statement of Operations as unrealized appreciation (depreciation) until the contracts are closed, when they are recorded as realized gains (losses) on futures contracts.
During the year ended October 31, 2024, the fund’s average investments in long and short futures contracts represented 1% and 0% of net assets, respectively, based on the average of the notional amounts at each quarter-end during the period.
3. Federal Income Taxes: The fund intends to continue to qualify as a regulated investment company and distribute virtually all of its taxable income. The fund’s tax returns are open to examination by the relevant tax authorities until expiration of the applicable statute of limitations, which is generally three years after the filing of the tax return. Management has analyzed the fund’s tax positions taken for all open federal and state income tax years, and has concluded that no provision for income tax is required in the fund’s financial statements.
4. Distributions: Distributions to shareholders are recorded on the ex-dividend date. Distributions are determined on a tax basis at the fiscal year-end and may differ from net investment income and realized capital gains for financial reporting purposes.
5. Credit Facilities and Interfund Lending Program: The fund and certain other funds managed by The Vanguard Group ("Vanguard") participate in a $4.3 billion committed credit facility provided by a syndicate of lenders pursuant to a credit agreement and an uncommitted credit facility provided by Vanguard. Both facilities may be renewed annually. Each fund is individually liable for its borrowings, if any, under the credit facilities. Borrowings may be utilized for temporary or emergency purposes and are subject to the fund’s regulatory and contractual borrowing restrictions. With respect to the committed credit facility, the participating funds are charged administrative fees and an annual commitment fee of 0.10% of the undrawn committed amount of the facility, which are allocated to the funds based on a method approved by the fund’s board of trustees and borne by the funds in which the fund invests (see Note B). Any borrowings under either facility bear interest at an agreed-upon spread plus the higher of the federal funds effective rate, the overnight bank funding rate, or the Daily Simple Secured Overnight Financing Rate inclusive of an additional agreed-upon spread. However, borrowings under the uncommitted credit facility may bear interest based upon an alternate rate agreed to by the fund and Vanguard.
In accordance with an exemptive order (the “Order”) from the SEC, the fund may participate in a joint lending and borrowing program that allows registered open-end Vanguard funds to borrow money from and lend money to each other for temporary or emergency purposes (the “Interfund Lending Program”), subject to compliance with the terms and conditions of the Order, and to the extent permitted by the fund’s investment objective and investment policies. Interfund loans and borrowings normally extend overnight but can have a maximum duration of seven days. Loans may be called on one business day’s notice. The interest rate to be charged is governed by the conditions of the Order and internal procedures adopted by the board of trustees. The board of trustees is responsible for overseeing the Interfund Lending Program.
For the year ended October 31, 2024, the fund did not utilize the credit facilities or the Interfund Lending Program.
6. Other: Income and capital gain distributions received are recorded on the ex-dividend date. Security transactions are accounted for on the date securities are bought or sold. Costs used to determine realized gains (losses) on the sale of investment securities are those of the specific securities sold.
B. In accordance with the terms of a Funds’ Service Agreement (the “FSA”) between Vanguard and the fund, Vanguard furnishes to the fund investment advisory, corporate management, administrative, marketing, and distribution services at Vanguard’s cost of operations (as defined by the FSA). These costs of operations are allocated to the fund based on methods and guidelines approved by the board of trustees. The FSA provides that expenses otherwise allocable to Vanguard funds-of-funds may be reduced or eliminated to the extent of savings realized by the underlying Vanguard funds by virtue of being part of a fund-of-funds. Accordingly, all expenses for services provided by Vanguard to the fund and all other expenses incurred by the fund during the year ended October 31, 2024, were borne by the underlying Vanguard funds in which the fund invests. The fund's trustees and officers are also trustees and officers, respectively, of the underlying Vanguard funds, as well as directors and employees, respectively, of Vanguard.
C. Various inputs may be used to determine the value of the fund’s investments and derivatives. These inputs are summarized in three broad levels for financial statement purposes. The inputs or methodologies used to value securities are not necessarily an indication of the risk associated with investing in those securities.
Level 1—Quoted prices in active markets for identical securities.
Level 2—Other significant observable inputs (including quoted prices for similar securities, interest rates, prepayment speeds, credit risk, etc.).
Level 3—Significant unobservable inputs (including the fund’s own assumptions used to determine the fair value of investments). Any investments and derivatives valued with significant unobservable inputs are noted on the Schedule of Investments.
At October 31, 2024, 100% of the market value of the fund's investments and derivatives was determined based on Level 1 inputs.
D. Permanent differences between book-basis and tax-basis components of net assets are reclassified among capital accounts in the financial statements to reflect their tax character. These reclassifications have no effect on net assets or net asset value per share. As of period end, permanent differences primarily attributable to the accounting for distributions in connection with fund share redemptions were reclassified between the following accounts:
| | Amount
($000) |
| Paid-in Capital | 50,268 |
| Total Distributable Earnings (Loss) | (50,268) |
Temporary differences between book-basis and tax-basis components of total distributable earnings (loss) arise when certain items of income, gain, or loss are recognized in different periods for financial statement and tax purposes; these differences will reverse at some time in the future. The differences are primarily related to the deferral of losses from wash sales; and the recognition of unrealized gains or losses from certain derivative contracts. As of period end, the tax-basis components of total distributable earnings (loss) are detailed in the table as follows:
| | Amount
($000) |
| Undistributed Ordinary Income | 120,067 |
| Undistributed Long-Term Gains | 765,084 |
| Net Unrealized Gains (Losses) | 10,413,039 |
| Capital Loss Carryforwards | — |
| Qualified Late-Year Losses | — |
| Other Temporary Differences | — |
| Total | 11,298,190 |
The tax character of distributions paid was as follows:
| | Year Ended October 31, |
| | 2024
Amount
($000) | 2023
Amount
($000) |
| Ordinary Income* | 494,414 | 397,014 |
| Long-Term Capital Gains | 125,758 | 20,932 |
| Total | 620,172 | 417,946 |
| * | Includes short-term capital gains, if any. |
As of October 31, 2024, gross unrealized appreciation and depreciation for investments and derivatives based on cost for U.S. federal income tax purposes were as follows:
| | Amount
($000) |
| Tax Cost | 11,591,126 |
| Gross Unrealized Appreciation | 10,799,704 |
| Gross Unrealized Depreciation | (386,665) |
| Net Unrealized Appreciation (Depreciation) | 10,413,039 |
E. Capital shares issued and redeemed were:
| | Year Ended October 31, |
| | 2024
Shares
(000) | 2023
Shares
(000) |
| Issued | 47,533 | 42,873 |
| Issued in Lieu of Cash Distributions | 13,758 | 10,602 |
| Redeemed | (67,331) | (58,826) |
| Net Increase (Decrease) in Shares Outstanding | (6,040) | (5,351) |
F. Transactions during the period in affiliated underlying Vanguard funds were as follows:
| | | Current Period Transactions | |
| | Oct. 31, 2023
Market Value
($000) | Purchases
at Cost
($000) | Proceeds
from
Securities
Sold
($000) | Realized
Net Gain
(Loss)
($000) | Change in
Unrealized
App. (Dep.)
($000) | Income
($000) | Capital Gain
Distributions
Received
($000) | Oct. 31, 2024
Market Value
($000) |
| Vanguard Market Liquidity Fund | 212,261 | NA1 | NA1 | 6 | (5) | 10,073 | 2 | 160,974 |
| Vanguard Total Bond Market II Index Fund | 2,372,481 | 439,661 | 39,106 | (3,408) | 161,936 | 99,550 | — | 2,931,564 |
| Vanguard Total International Bond II Index Fund | 1,064,775 | 178,455 | 3,607 | (48) | 51,924 | 54,428 | — | 1,291,499 |
| Vanguard Total International Stock Index Fund | 5,659,078 | 226,576 | 77,878 | 6,580 | 1,118,699 | 195,984 | — | 6,933,055 |
| Vanguard Total Stock Market Index Fund | 8,722,759 | 142,896 | 1,181,291 | 802,299 | 2,200,410 | 135,810 | — | 10,687,073 |
| Total | 18,031,354 | 987,588 | 1,301,882 | 805,429 | 3,532,964 | 495,845 | 2 | 22,004,165 |
| 1 | Not applicable—purchases and sales are for temporary cash investment purposes. |
G. Significant market disruptions, such as those caused by pandemics, natural or environmental disasters, war, acts of terrorism, or other events, can adversely affect local and global markets and normal market operations. Any such disruptions could have an adverse impact on the value of the fund’s investments and fund performance.
To the extent the fund’s investment portfolio reflects concentration in a particular market, industry, sector, country or asset class, the fund may be adversely affected by the performance of these concentrations and may be subject to increased price volatility and other risks.
The use of derivatives may expose the fund to various risks. Derivatives can be highly volatile, and any initial investment is generally small relative to the notional amount so that transactions may be leveraged in terms of market exposure. A relatively small market movement may have a potentially larger impact on derivatives than on standard securities. Leveraged derivatives positions can, therefore, increase volatility. Additional information regarding the fund’s use of derivative(s) and the specific risks associated is described under significant accounting policies.
H. Management has determined that no events or transactions occurred subsequent to October 31, 2024, that would require recognition or disclosure in these financial statements.
Report of Independent Registered
Public Accounting Firm
To the Board of Trustees of Vanguard STAR Funds and Shareholders of Vanguard LifeStrategy Income Fund, Vanguard LifeStrategy Conservative Growth Fund, Vanguard LifeStrategy Moderate Growth Fund and Vanguard LifeStrategy Growth Fund
Opinions on the Financial Statements
We have audited the accompanying statements of assets and liabilities, including the schedules of investments, of Vanguard LifeStrategy Income Fund, Vanguard LifeStrategy Conservative Growth Fund, Vanguard LifeStrategy Moderate Growth Fund and Vanguard LifeStrategy Growth Fund (four of the funds constituting Vanguard STAR Funds, hereafter collectively referred to as the "Funds") as of October 31, 2024, the related statements of operations for the year ended October 31, 2024, the statements of changes in net assets for each of the two years in the period ended October 31, 2024, including the related notes, and the financial highlights for each of the five years in the period ended October 31, 2024 (collectively referred to as the "financial statements"). In our opinion, the financial statements present fairly, in all material respects, the financial position of each of the Funds as of October 31, 2024, the results of each of their operations for the year then ended, the changes in each of their net assets for each of the two years in the period ended October 31, 2024 and each of the financial highlights for each of the five years in the period ended October 31, 2024 in conformity with accounting principles generally accepted in the United States of America.
Basis for Opinions
These financial statements are the responsibility of the Funds’ management. Our responsibility is to express an opinion on the Funds’ financial statements based on our audits. We are a public accounting firm registered with the Public Company Accounting Oversight Board (United States) (PCAOB) and are required to be independent with respect to the Funds in accordance with the U.S. federal securities laws and the applicable rules and regulations of the Securities and Exchange Commission and the PCAOB.
We conducted our audits of these financial statements in accordance with the standards of the PCAOB. Those standards require that we plan and perform the audit to obtain reasonable assurance about whether the financial statements are free of material misstatement, whether due to error or fraud.
Our audits included performing procedures to assess the risks of material misstatement of the financial statements, whether due to error or fraud, and performing procedures that respond to those risks. Such procedures included examining, on a test basis, evidence regarding the amounts and disclosures in the financial statements. Our audits also included evaluating the accounting principles used and significant estimates made by management, as well as evaluating the overall presentation of the financial statements. Our procedures included confirmation of securities owned as of October 31, 2024 by correspondence with the transfer agent and brokers; when replies were not received from brokers, we performed other auditing procedures. We believe that our audits provide a reasonable basis for our opinions.
/s/PricewaterhouseCoopers LLP
Philadelphia, Pennsylvania
December 20, 2024
We have served as the auditor of one or more investment companies in The Vanguard Group of Funds since 1975.
Tax information (unaudited)
The following percentages, or if subsequently determined to be different, the maximum percentages allowable by law, of ordinary income (dividend income plus short-term gains, if any) for the fiscal year qualified for the dividends-received deduction for corporate shareholders.
| Fund | Percentage |
| LifeStrategy Income Fund | 3.8% |
| LifeStrategy Conservative Growth Fund | 8.5 |
| LifeStrategy Moderate Growth Fund | 14.5 |
| LifeStrategy Growth Fund | 23.0 |
The following amounts, or if subsequently determined to be different, the maximum amounts allowable by law, are hereby designated as qualified dividend income for purposes of the maximum rate under section 1(h)(11) for calendar year 2023. Shareholders will be notified in January 2025 via IRS Form 1099 of the amounts for use in preparing their 2024 income tax return.
| Fund | ($000) |
| LifeStrategy Income Fund | 13,711 |
| LifeStrategy Conservative Growth Fund | 66,344 |
| LifeStrategy Moderate Growth Fund | 195,878 |
| LifeStrategy Growth Fund | 252,682 |
The following amounts for the fiscal year, or if subsequently determined to be different, the maximum amounts allowable by law, are hereby designated as interest earned from obligations of the U.S. government which is generally exempt from state income tax.
| Fund | ($000) |
| LifeStrategy Income Fund | 33,063 |
| LifeStrategy Conservative Growth Fund | 62,539 |
| LifeStrategy Moderate Growth Fund | 85,833 |
| LifeStrategy Growth Fund | 44,926 |
For nonresident alien shareholders, 100% of short-term capital gain dividends distributed by the LifeStrategy Income Fund, LifeStrategy Conservative Growth Fund, LifeStrategy Moderate Growth Fund and LifeStrategy Growth Fund for the fiscal year are qualified short-term capital gains.
The following amounts were distributed as capital gain dividends (20% rate gain distributions) to shareholders during the fiscal year.
| Fund | ($000) |
| LifeStrategy Income Fund | 3,008 |
| LifeStrategy Conservative Growth Fund | 253,611 |
| LifeStrategy Moderate Growth Fund | 332,300 |
| LifeStrategy Growth Fund | 175,292 |
The following percentages, or if subsequently determined to be different, the maximum percentages allowable by law, are hereby designated as ordinary income dividends eligible to be treated as interest income for purposes of section 163(j) and the regulations thereunder for the fiscal year.
| Fund | Percentage |
| LifeStrategy Income Fund | 87.1% |
| LifeStrategy Conservative Growth Fund | 73.0 |
| LifeStrategy Moderate Growth Fund | 55.7 |
| LifeStrategy Growth Fund | 32.3 |
The following amounts, or if subsequently determined to be different, the maximum amounts allowable by law, are hereby designated to shareholders as foreign source income and foreign taxes paid. Form 1099-DIV reports calendar-year amounts that can be included on the income tax return of shareholders.
| Fund | Foreign Source Income
($000) | Foreign Taxes Paid
($000) |
| LifeStrategy Income Fund | 28,273 | 760 |
| LifeStrategy Conservative Growth Fund | 82,175 | 3,500 |
| LifeStrategy Moderate Growth Fund | 191,151 | 10,371 |
| LifeStrategy Growth Fund | 212,098 | 13,411 |
Q880 122024
Financial Statements
For the year ended October 31, 2024
Vanguard STAR® Fund
Contents
Financial Statements
| 1 |
Report of Independent Registered
Public Accounting Firm
| 9 |
Tax information
| 10 |
| | |
Schedule of Investments
As of October 31, 2024
The fund files its complete schedule of portfolio holdings with the Securities and Exchange Commission (SEC) for the first and third quarters of each fiscal year as an exhibit to its reports on Form N-PORT. The fund’s Form N-PORT reports are available on the SEC’s website at www.sec.gov.
| | | | | | Shares | Market
Value•
($000) |
| Investment Companies (100.0%) |
| U.S. Stock Funds (44.2%) |
| | Vanguard WindsorTM II Fund Investor Shares | 68,467,472 | 3,321,357 |
| | Vanguard U.S. Growth Fund Investor Shares | 40,015,413 | 2,791,075 |
| | Vanguard Windsor Fund Investor Shares | 78,233,048 | 1,836,912 |
| | Vanguard PRIMECAP Fund Investor Shares | 8,110,066 | 1,386,254 |
| | Vanguard ExplorerTM Fund Investor Shares | 7,502,091 | 906,928 |
| | | | | | | 10,242,526 |
| International Stock Funds (18.8%) |
| | Vanguard International Growth Fund Investor Shares | 61,191,362 | 2,202,277 |
| | Vanguard International Value Fund Investor Shares | 50,681,593 | 2,147,379 |
| | | | | | | 4,349,656 |
| U.S. Bond Funds (37.0%) |
| | Vanguard Short-Term Investment-Grade Fund Investor Shares | 282,589,118 | 2,919,145 |
| | Vanguard GNMA Fund Investor Shares | 311,860,983 | 2,869,121 |
| | Vanguard Long-Term Investment-Grade Fund Investor Shares | 359,053,557 | 2,800,618 |
| | | | | | | 8,588,884 |
| Total Investment Companies (Cost $14,790,203) | 23,181,066 |
| Temporary Cash Investments (0.0%) |
| Money Market Fund (0.0%) |
| 1 | Vanguard Market Liquidity Fund, 4.834% (Cost $1) | 10 | 1 |
| Total Investments (100.0%) (Cost $14,790,204) | | 23,181,067 |
| Other Assets and Liabilities—Net (0.0%) | | (613) |
| Net Assets (100%) | | 23,180,454 |
| • | See Note A in Notes to Financial Statements. |
| 1 | Affiliated money market fund available only to Vanguard funds and certain trusts and accounts managed by Vanguard. Rate shown is the 7-day yield. |
See accompanying Notes, which are an integral part of the Financial Statements.
Statement of Assets and Liabilities
|
| ($000s, except shares, footnotes, and per-share amounts) | Amount |
| Assets | |
| Investments in Securities, at Value—Affiliated Funds (Cost $14,790,204) | 23,181,067 |
| Receivables for Investment Securities Sold | 6,754 |
| Receivables for Accrued Income | 30,302 |
| Receivables for Capital Shares Issued | 1,236 |
| Total Assets | 23,219,359 |
| Liabilities | |
| Due to Custodian | 849 |
| Payables for Investment Securities Purchased | 30,310 |
| Payables for Capital Shares Redeemed | 7,746 |
| Total Liabilities | 38,905 |
| Net Assets | 23,180,454 |
At October 31, 2024, net assets consisted of: |
|
| | |
| Paid-in Capital | 13,897,427 |
| Total Distributable Earnings (Loss) | 9,283,027 |
| Net Assets | 23,180,454 |
| | |
| Net Assets | |
Applicable to 799,184,437 outstanding $.001 par value shares of
beneficial interest (unlimited authorization) | 23,180,454 |
| Net Asset Value Per Share | $29.01 |
See accompanying Notes, which are an integral part of the Financial Statements.
|
| | Year Ended
October 31, 2024 |
| | ($000) |
| Investment Income | |
| Income | |
| Income Distributions Received from Affiliated Funds | 550,338 |
| Net Investment Income—Note B | 550,338 |
| Realized Net Gain (Loss) | |
| Capital Gain Distributions Received from Affiliated Funds | 316,584 |
| Affiliated Funds Sold | 614,688 |
| Realized Net Gain (Loss) | 931,272 |
| Change in Unrealized Appreciation (Depreciation) from Affiliated Funds | 3,368,730 |
| Net Increase (Decrease) in Net Assets Resulting from Operations | 4,850,340 |
See accompanying Notes, which are an integral part of the Financial Statements.
Statement of Changes in Net Assets
|
| | Year Ended October 31, |
| | 2024
($000) | 2023
($000) |
| Increase (Decrease) in Net Assets | | |
| Operations | | |
| Net Investment Income | 550,338 | 479,888 |
| Realized Net Gain (Loss) | 931,272 | 662,067 |
| Change in Unrealized Appreciation (Depreciation) | 3,368,730 | 199,539 |
| Net Increase (Decrease) in Net Assets Resulting from Operations | 4,850,340 | 1,341,494 |
| Distributions | | |
| Total Distributions | (1,233,361) | (1,696,712) |
| Capital Share Transactions | | |
| Issued | 666,361 | 791,674 |
| Issued in Lieu of Cash Distributions | 1,158,761 | 1,598,030 |
| Redeemed | (2,943,796) | (2,356,237) |
| Net Increase (Decrease) from Capital Share Transactions | (1,118,674) | 33,467 |
| Total Increase (Decrease) | 2,498,305 | (321,751) |
| Net Assets | | |
| Beginning of Period | 20,682,149 | 21,003,900 |
| End of Period | 23,180,454 | 20,682,149 |
See accompanying Notes, which are an integral part of the Financial Statements.
For a Share Outstanding
Throughout Each Period | Year Ended October 31, |
| 2024 | 2023 | 2022 | 2021 | 2020 |
| Net Asset Value, Beginning of Period | $24.68 | $25.23 | $34.17 | $29.01 | $27.51 |
| Investment Operations | | | | | |
| Net Investment Income1 | .663 | .563 | .464 | .395 | .515 |
| Capital Gain Distributions Received1 | .381 | .717 | 1.827 | .960 | .797 |
| Net Realized and Unrealized Gain (Loss) on Investments | 4.781 | .233 | (9.076) | 5.846 | 1.816 |
| Total from Investment Operations | 5.825 | 1.513 | (6.785) | 7.201 | 3.128 |
| Distributions | | | | | |
| Dividends from Net Investment Income | (.652) | (.551) | (.449) | (.405) | (.544) |
| Distributions from Realized Capital Gains | (.843) | (1.512) | (1.706) | (1.636) | (1.084) |
| Total Distributions | (1.495) | (2.063) | (2.155) | (2.041) | (1.628) |
| Net Asset Value, End of Period | $29.01 | $24.68 | $25.23 | $34.17 | $29.01 |
| Total Return2 | 24.07% | 6.24% | -21.07% | 25.52% | 11.75% |
| Ratios/Supplemental Data | | | | | |
| Net Assets, End of Period (Millions) | $23,180 | $20,682 | $21,004 | $28,992 | $23,531 |
| Ratio of Total Expenses to Average Net Assets | — | — | — | — | — |
| Acquired Fund Fees and Expenses | 0.30% | 0.31% | 0.31% | 0.31% | 0.31% |
| Ratio of Net Investment Income to Average Net Assets | 2.38% | 2.18% | 1.61% | 1.21% | 1.87% |
| Portfolio Turnover Rate | 4% | 6% | 12% | 9% | 26% |
| 1 | Calculated based on average shares outstanding. |
| 2 | Total returns do not include account service fees that may have applied in the periods shown. Fund prospectuses provide information about any applicable account service fees. |
See accompanying Notes, which are an integral part of the Financial Statements.
Notes to Financial Statements
Vanguard STAR Fund is registered under the Investment Company Act of 1940 as an open-end investment company, or mutual fund. The fund follows a balanced investment strategy by investing in selected Vanguard funds. The fund invests 60% to 70% of its net assets in stock funds (predominantly large-capitalization U.S. stock funds), 20% to 30% in intermediate- to long-term bond funds, and 10% to 20% in a short-term bond fund. Financial statements and other information about each underlying fund are available at www.vanguard.com.
A. The following significant accounting policies conform to generally accepted accounting principles for U.S. investment companies. The fund consistently follows such policies in preparing its financial statements.
1. Security Valuation: Investments are valued at the net asset value of each underlying Vanguard fund determined as of the close of the New York Stock Exchange (generally 4 p.m., Eastern time) on the valuation date.
2. Federal Income Taxes: The fund intends to continue to qualify as a regulated investment company and distribute virtually all of its taxable income. The fund’s tax returns are open to examination by the relevant tax authorities until expiration of the applicable statute of limitations, which is generally three years after the filing of the tax return. Management has analyzed the fund’s tax positions taken for all open federal and state income tax years, and has concluded that no provision for income tax is required in the fund’s financial statements.
3. Distributions: Distributions to shareholders are recorded on the ex-dividend date. Distributions are determined on a tax basis at the fiscal year-end and may differ from net investment income and realized capital gains for financial reporting purposes.
4. Credit Facilities and Interfund Lending Program: The fund and certain other funds managed by The Vanguard Group ("Vanguard") participate in a $4.3 billion committed credit facility provided by a syndicate of lenders pursuant to a credit agreement and an uncommitted credit facility provided by Vanguard. Both facilities may be renewed annually. Each fund is individually liable for its borrowings, if any, under the credit facilities. Borrowings may be utilized for temporary or emergency purposes and are subject to the fund’s regulatory and contractual borrowing restrictions. With respect to the committed credit facility, the participating funds are charged administrative fees and an annual commitment fee of 0.10% of the undrawn committed amount of the facility, which are allocated to the funds based on a method approved by the fund’s board of trustees and borne by the funds in which the fund invests (see Note B). Any borrowings under either facility bear interest at an agreed-upon spread plus the higher of the federal funds effective rate, the overnight bank funding rate, or the Daily Simple Secured Overnight Financing Rate inclusive of an additional agreed-upon spread. However, borrowings under the uncommitted credit facility may bear interest based upon an alternate rate agreed to by the fund and Vanguard.
In accordance with an exemptive order (the “Order”) from the SEC, the fund may participate in a joint lending and borrowing program that allows registered open-end Vanguard funds to borrow money from and lend money to each other for temporary or emergency purposes (the “Interfund Lending Program”), subject to compliance with the terms and conditions of the Order, and to the extent permitted by the fund’s investment objective and investment policies. Interfund loans and borrowings normally extend overnight but can have a maximum duration of seven days. Loans may be called on one business day’s notice. The interest rate to be charged is governed by the conditions of the Order and internal procedures adopted by the board of trustees. The board of trustees is responsible for overseeing the Interfund Lending Program.
For the year ended October 31, 2024, the fund did not utilize the credit facilities or the Interfund Lending Program.
5. Other: Income and capital gain distributions received are recorded on the ex-dividend date. Security transactions are accounted for on the date securities are bought or sold. Costs used to determine realized gains (losses) on the sale of investment securities are those of the specific securities sold.
B. In accordance with the terms of a Funds’ Service Agreement (the “FSA”) between Vanguard and the fund, Vanguard furnishes to the fund investment advisory, corporate management, administrative, marketing, and distribution services at Vanguard’s cost of operations (as defined by the FSA). These costs of operations are allocated to the fund based on methods and guidelines approved by the board of trustees. The FSA provides that expenses otherwise allocable to Vanguard funds-of-funds may be reduced or eliminated to the extent of savings realized by the underlying Vanguard funds by virtue of being part of a fund-of-funds. Accordingly, all expenses for services provided by Vanguard to the fund and all other expenses incurred by the fund during the year ended October 31, 2024, were borne by the underlying Vanguard funds in which the fund invests. The fund's trustees and officers are also trustees and officers, respectively, of the underlying Vanguard funds, as well as directors and employees, respectively, of Vanguard.
C. Various inputs may be used to determine the value of the fund’s investments. These inputs are summarized in three broad levels for financial statement purposes. The inputs or methodologies used to value securities are not necessarily an indication of the risk associated with investing in those securities.
Level 1—Quoted prices in active markets for identical securities.
Level 2—Other significant observable inputs (including quoted prices for similar securities, interest rates, prepayment speeds, credit risk, etc.).
Level 3—Significant unobservable inputs (including the fund’s own assumptions used to determine the fair value of investments). Any investments valued with significant unobservable inputs are noted on the Schedule of Investments.
At October 31, 2024, 100% of the market value of the fund's investments was determined based on Level 1 inputs.
D. Permanent differences between book-basis and tax-basis components of net assets are reclassified among capital accounts in the financial statements to reflect their tax character. These reclassifications have no effect on net assets or net asset value per share. As of period end, permanent differences primarily attributable to the accounting for distributions in connection with fund share redemptions were reclassified between the following accounts:
| | Amount
($000) |
| Paid-in Capital | 50,845 |
| Total Distributable Earnings (Loss) | (50,845) |
Temporary differences between book-basis and tax-basis components of total distributable earnings (loss) arise when certain items of income, gain, or loss are recognized in different periods for financial statement and tax purposes; these differences will reverse at some time in the future. The differences are primarily related to the deferral of losses from wash sales. As of period end, the tax-basis components of total distributable earnings (loss) are detailed in the table as follows:
| | Amount
($000) |
| Undistributed Ordinary Income | 144,950 |
| Undistributed Long-Term Gains | 785,925 |
| Net Unrealized Gains (Losses) | 8,352,152 |
| Capital Loss Carryforwards | — |
| Qualified Late-Year Losses | — |
| Other Temporary Differences | — |
| Total | 9,283,027 |
The tax character of distributions paid was as follows:
| | Year Ended October 31, |
| | 2024
Amount
($000) | 2023
Amount
($000) |
| Ordinary Income* | 640,211 | 459,647 |
| Long-Term Capital Gains | 593,150 | 1,237,065 |
| Total | 1,233,361 | 1,696,712 |
| * | Includes short-term capital gains, if any. |
As of October 31, 2024, gross unrealized appreciation and depreciation for investments based on cost for U.S. federal income tax purposes were as follows:
| | Amount
($000) |
| Tax Cost | 14,828,915 |
| Gross Unrealized Appreciation | 9,323,544 |
| Gross Unrealized Depreciation | (971,392) |
| Net Unrealized Appreciation (Depreciation) | 8,352,152 |
E. Capital shares issued and redeemed were:
| | Year Ended October 31, |
| | 2024
Shares
(000) | 2023
Shares
(000) |
| Issued | 24,038 | 30,691 |
| Issued in Lieu of Cash Distributions | 42,688 | 66,179 |
| Redeemed | (105,578) | (91,397) |
| Net Increase (Decrease) in Shares Outstanding | (38,852) | 5,473 |
F. Transactions during the period in affiliated underlying Vanguard funds were as follows:
| | | Current Period Transactions | |
| | Oct. 31, 2023
Market Value
($000) | Purchases
at Cost
($000) | Proceeds
from
Securities
Sold
($000) | Realized
Net Gain
(Loss)
($000) | Change in
Unrealized
App. (Dep.)
($000) | Income
($000) | Capital Gain
Distributions
Received
($000) | Oct. 31, 2024
Market Value
($000) |
| Vanguard Explorer Fund | 772,868 | 7,069 | 102,799 | (5,834) | 235,624 | 4,647 | 2,422 | 906,928 |
| Vanguard GNMA Fund | 2,611,263 | 99,073 | 20,703 | 124 | 179,364 | 99,070 | — | 2,869,121 |
| Vanguard International Growth Fund | 1,845,864 | 38,792 | 226,790 | (30,292) | 574,703 | 21,427 | 17,365 | 2,202,277 |
| Vanguard International Value Fund | 1,959,955 | 60,148 | 186,334 | 37,633 | 275,977 | 60,148 | — | 2,147,379 |
| Vanguard Long-Term Investment-Grade Fund | 2,483,609 | 136,905 | 132,127 | (42,694) | 354,925 | 136,904 | — | 2,800,618 |
| Vanguard Market Liquidity Fund | 991 | NA1 | NA1 | (2) | — | 34 | — | 1 |
| Vanguard PRIMECAP Fund | 1,250,751 | 94,760 | 226,355 | 103,624 | 163,474 | 14,542 | 80,219 | 1,386,254 |
| Vanguard Short-Term Investment-Grade Fund | 2,704,805 | 112,192 | 18,532 | (520) | 121,200 | 111,804 | — | 2,919,145 |
| Vanguard U.S. Growth Fund | 2,473,800 | 7,884 | 750,952 | 390,422 | 669,921 | 7,884 | — | 2,791,075 |
| Vanguard Windsor Fund | 1,624,611 | 144,508 | 198,690 | 12,334 | 254,149 | 38,018 | 106,490 | 1,836,912 |
| Vanguard Windsor II Fund | 2,954,631 | 165,948 | 488,508 | 149,893 | 539,393 | 55,860 | 110,088 | 3,321,357 |
| Total | 20,683,148 | 867,279 | 2,351,790 | 614,688 | 3,368,730 | 550,338 | 316,584 | 23,181,067 |
| 1 | Not applicable—purchases and sales are for temporary cash investment purposes. |
G. Significant market disruptions, such as those caused by pandemics, natural or environmental disasters, war, acts of terrorism, or other events, can adversely affect local and global markets and normal market operations. Any such disruptions could have an adverse impact on the value of the fund’s investments and fund performance.
To the extent the fund’s investment portfolio reflects concentration in a particular market, industry, sector, country or asset class, the fund may be adversely affected by the performance of these concentrations and may be subject to increased price volatility and other risks.
H. Management has determined that no events or transactions occurred subsequent to October 31, 2024, that would require recognition or disclosure in these financial statements.
Report of Independent Registered
Public Accounting Firm
To the Board of Trustees of Vanguard STAR Funds and Shareholders of Vanguard STAR Fund
Opinion on the Financial Statements
We have audited the accompanying statement of assets and liabilities, including the schedule of investments, of Vanguard STAR Fund (one of the funds constituting Vanguard STAR Funds, referred to hereafter as the "Fund") as of October 31, 2024, the related statement of operations for the year ended October 31, 2024, the statement of changes in net assets for each of the two years in the period ended October 31, 2024, including the related notes, and the financial highlights for each of the five years in the period ended October 31, 2024 (collectively referred to as the "financial statements"). In our opinion, the financial statements present fairly, in all material respects, the financial position of the Fund as of October 31, 2024, the results of its operations for the year then ended, the changes in its net assets for each of the two years in the period ended October 31, 2024 and the financial highlights for each of the five years in the period ended October 31, 2024 in conformity with accounting principles generally accepted in the United States of America.
Basis for Opinion
These financial statements are the responsibility of the Fund’s management. Our responsibility is to express an opinion on the Fund’s financial statements based on our audits. We are a public accounting firm registered with the Public Company Accounting Oversight Board (United States) (PCAOB) and are required to be independent with respect to the Fund in accordance with the U.S. federal securities laws and the applicable rules and regulations of the Securities and Exchange Commission and the PCAOB.
We conducted our audits of these financial statements in accordance with the standards of the PCAOB. Those standards require that we plan and perform the audit to obtain reasonable assurance about whether the financial statements are free of material misstatement, whether due to error or fraud.
Our audits included performing procedures to assess the risks of material misstatement of the financial statements, whether due to error or fraud, and performing procedures that respond to those risks. Such procedures included examining, on a test basis, evidence regarding the amounts and disclosures in the financial statements. Our audits also included evaluating the accounting principles used and significant estimates made by management, as well as evaluating the overall presentation of the financial statements. Our procedures included confirmation of securities owned as of October 31, 2024 by correspondence with the transfer agent. We believe that our audits provide a reasonable basis for our opinion.
/s/PricewaterhouseCoopers LLP
Philadelphia, Pennsylvania
December 20, 2024
We have served as the auditor of one or more investment companies in The Vanguard Group of Funds since 1975.
Tax information (unaudited)
For corporate shareholders, 10.4%, or if subsequently determined to be different, the maximum percentage allowable by law, of ordinary income (dividend income plus short-term gains, if any) for the fiscal year qualified for the dividends-received deduction.
The fund hereby designates $184,207,000, or if subsequently determined to be different, the maximum amount allowable by law, as qualified dividend income for purposes of the maximum rate under section 1(h)(11) for calendar year 2023. Shareholders will be notified in January 2025 via IRS Form 1099 of the amounts for use in preparing their 2024 income tax return.
The fund hereby designates for the fiscal year $23,170,000, or if subsequently determined to be different, the maximum amount allowable by law, of interest earned from obligations of the U.S. government which is generally exempt from state income tax.
For nonresident alien shareholders, 100% of short-term capital gain dividends distributed by the fund for the fiscal year are qualified short-term capital gains.
The fund distributed $642,269,000 as capital gain dividends (20% rate gain distributions) to shareholders during the fiscal year.
The fund hereby designates 53.0%, or if subsequently determined to be different, the maximum percentage allowable by law, of ordinary income dividends eligible to be treated as interest income for purposes of section 163(j) and the regulations thereunder for the fiscal year.
The fund designates to shareholders foreign source income of $86,666,000 and foreign taxes paid of $5,088,000, or if subsequently determined to be different, the maximum amounts allowable by law. Form 1099-DIV reports calendar-year amounts that can be included on the income tax return of shareholders.
Q560 122024
Financial Statements
For the year ended October 31, 2024
Vanguard Total International Stock Index Fund
Contents
Financial Statements
| 1 |
Report of Independent Registered
Public Accounting Firm
| 146 |
Tax information
| 147 |
| | |
Total International Stock Index Fund
Schedule of Investments
As of October 31, 2024
The fund files its complete schedule of portfolio holdings with the Securities and Exchange Commission (SEC) for the first and third quarters of each fiscal year as an exhibit to its reports on Form N-PORT. The fund’s Form N-PORT reports are available on the SEC’s website at www.sec.gov.
| | | | | | Shares | Market
Value•
($000) |
| Common Stocks (98.4%) |
| Australia (4.9%) |
| | Commonwealth Bank of Australia | 23,361,942 | 2,179,071 |
| | CSL Ltd. | 6,728,997 | 1,263,405 |
| | BHP Group Ltd. (XASX) | 43,227,159 | 1,200,962 |
| | National Australia Bank Ltd. | 43,303,794 | 1,097,540 |
| | Westpac Banking Corp. | 48,414,332 | 1,016,788 |
| | ANZ Group Holdings Ltd. | 41,962,951 | 855,227 |
| | BHP Group Ltd. | 27,076,249 | 751,466 |
| | Macquarie Group Ltd. | 4,889,718 | 740,041 |
| | Wesfarmers Ltd. | 15,788,957 | 694,574 |
| | Goodman Group | 26,001,721 | 620,908 |
| | Rio Tinto Ltd. | 5,177,565 | 406,530 |
| | Transurban Group | 43,092,042 | 359,127 |
| | Aristocrat Leisure Ltd. | 8,853,127 | 356,247 |
| | Woodside Energy Group Ltd. (XASX) | 21,462,654 | 337,789 |
| | Woolworths Group Ltd. | 17,034,783 | 334,107 |
| | Fortescue Ltd. | 22,203,621 | 278,053 |
| | QBE Insurance Group Ltd. | 20,927,174 | 236,270 |
| | Brambles Ltd. | 19,435,053 | 233,998 |
| | Amcor plc | 20,035,902 | 220,880 |
| | Coles Group Ltd. | 18,152,900 | 209,512 |
| | Suncorp Group Ltd. | 17,743,767 | 208,139 |
| * | Xero Ltd. | 2,105,740 | 204,584 |
| | Santos Ltd. | 45,277,612 | 201,434 |
| * | James Hardie Industries plc | 6,046,006 | 192,827 |
| | Northern Star Resources Ltd. | 15,668,104 | 181,819 |
| | WiseTech Global Ltd. | 2,254,961 | 173,132 |
| | Scentre Group | 72,586,408 | 166,416 |
| | Cochlear Ltd. | 890,367 | 164,841 |
| | Insurance Australia Group Ltd. | 33,309,596 | 163,565 |
| | South32 Ltd. | 63,221,766 | 151,616 |
| | Origin Energy Ltd. | 23,963,777 | 151,310 |
| | Computershare Ltd. | 8,177,987 | 141,377 |
| | Telstra Group Ltd. | 56,401,893 | 141,198 |
| | CAR Group Ltd. | 5,133,685 | 126,448 |
| | Sonic Healthcare Ltd. | 6,685,419 | 117,799 |
| | ASX Ltd. | 2,706,444 | 115,259 |
| | Stockland | 33,396,805 | 112,935 |
| | REA Group Ltd. | 702,090 | 103,793 |
| | Lottery Corp. Ltd. | 31,010,446 | 101,326 |
| | Medibank Pvt Ltd. | 38,486,547 | 90,450 |
| | Pro Medicus Ltd. | 713,092 | 90,331 |
| * | NEXTDC Ltd. | 8,386,070 | 89,581 |
| | Evolution Mining Ltd. | 26,072,191 | 89,390 |
| | Treasury Wine Estates Ltd. | 11,341,812 | 84,206 |
| | GPT Group | 26,854,786 | 83,200 |
| | BlueScope Steel Ltd. | 6,180,989 | 82,135 |
| | JB Hi-Fi Ltd. | 1,525,501 | 81,862 |
| | APA Group | 17,878,039 | 81,859 |
| | SEEK Ltd. | 4,913,462 | 79,825 |
| | Mirvac Group | 55,259,016 | 77,249 |
| | Orica Ltd. | 6,783,479 | 77,053 |
| | Woodside Energy Group Ltd. | 4,892,708 | 76,477 |
| | Vicinity Ltd. | 52,859,370 | 75,146 |
| | Seven Group Holdings Ltd. | 2,744,681 | 74,779 |
| *,1 | Pilbara Minerals Ltd. | 40,262,504 | 74,574 |
| 1 | Washington H Soul Pattinson & Co. Ltd. | 3,394,926 | 74,394 |
| | Dexus | 15,060,361 | 70,682 |
| | Endeavour Group Ltd. | 22,385,264 | 68,860 |
| | Charter Hall Group | 6,596,171 | 65,090 |
| * | Lynas Rare Earths Ltd. | 13,000,342 | 64,609 |
Total International Stock Index Fund
| | | | | | Shares | Market
Value•
($000) |
| | Ramsay Health Care Ltd. | 2,446,041 | 64,335 |
| | Bendigo & Adelaide Bank Ltd. | 7,921,478 | 63,822 |
| | Technology One Ltd. | 3,910,042 | 62,318 |
| | ALS Ltd. | 6,733,770 | 62,162 |
| | Mineral Resources Ltd. | 2,405,214 | 61,808 |
| | Worley Ltd. | 6,651,029 | 61,074 |
| | Ampol Ltd. | 3,322,244 | 60,825 |
| | Qube Holdings Ltd. | 24,490,134 | 59,730 |
| * | Qantas Airways Ltd. | 11,137,150 | 58,965 |
| | AGL Energy Ltd. | 8,325,562 | 57,163 |
| | Cleanaway Waste Management Ltd. | 31,138,039 | 55,749 |
| | Steadfast Group Ltd. | 15,356,618 | 55,306 |
| | Aurizon Holdings Ltd. | 24,659,908 | 54,678 |
| * | Telix Pharmaceuticals Ltd. | 3,975,447 | 54,323 |
| | Incitec Pivot Ltd. | 27,077,832 | 53,417 |
| | Atlas Arteria Ltd. | 15,803,107 | 50,589 |
| | Reece Ltd. | 2,974,580 | 44,323 |
| | Whitehaven Coal Ltd. | 9,752,933 | 43,619 |
| * | Sandfire Resources Ltd. | 6,322,964 | 42,792 |
| | Lendlease Corp. Ltd. | 9,635,313 | 42,691 |
| *,2 | Life360 Inc. | 2,956,160 | 42,178 |
| | Breville Group Ltd. | 2,003,068 | 41,635 |
| | Ansell Ltd. | 2,026,420 | 41,207 |
| | Bank of Queensland Ltd. | 9,224,290 | 39,455 |
| | Reliance Worldwide Corp. Ltd. | 11,010,090 | 37,487 |
| | HUB24 Ltd. | 795,224 | 35,791 |
| | Perseus Mining Ltd. | 19,062,676 | 35,640 |
| | IDP Education Ltd. | 3,880,972 | 35,332 |
| | Downer EDI Ltd. | 9,340,916 | 34,226 |
| | AMP Ltd. | 36,228,065 | 33,842 |
| | Ventia Services Group Pty Ltd. | 11,177,712 | 33,570 |
| * | Zip Co. Ltd. | 16,727,401 | 32,610 |
| | AUB Group Ltd. | 1,488,486 | 31,195 |
| | National Storage REIT | 18,895,720 | 31,087 |
| | Metcash Ltd. | 15,214,255 | 30,518 |
| | Flight Centre Travel Group Ltd. | 2,849,915 | 29,807 |
| | IGO Ltd. | 8,662,503 | 29,675 |
| | Orora Ltd. | 18,763,571 | 29,657 |
| | ARB Corp. Ltd. | 1,067,585 | 28,922 |
| | Challenger Ltd. | 7,251,361 | 28,719 |
| | Sigma Healthcare Ltd. | 22,219,775 | 28,527 |
| * | De Grey Mining Ltd. | 27,526,102 | 27,402 |
| * | Paladin Energy Ltd. | 4,084,795 | 26,893 |
| 2 | Viva Energy Group Ltd. | 15,576,620 | 26,796 |
| | nib holdings Ltd. | 6,789,780 | 25,702 |
| | Premier Investments Ltd. | 1,137,496 | 25,032 |
| | Ramelius Resources Ltd. | 15,874,123 | 24,767 |
| | Harvey Norman Holdings Ltd. | 8,252,213 | 24,749 |
| | Champion Iron Ltd. | 6,428,656 | 24,674 |
| * | Genesis Minerals Ltd. | 15,260,526 | 24,367 |
| | HMC Capital Ltd. | 3,627,825 | 24,092 |
| | Charter Hall Long Wale REIT | 9,198,044 | 23,431 |
| | Westgold Resources Ltd. | 11,118,372 | 23,403 |
| | Region RE Ltd. | 16,081,286 | 23,125 |
| * | Vault Minerals Ltd. | 89,033,395 | 22,932 |
| | Iluka Resources Ltd. | 5,924,732 | 22,770 |
| | New Hope Corp. Ltd. | 7,111,375 | 22,705 |
| | Super Retail Group Ltd. | 2,271,843 | 21,543 |
| * | Emerald Resources NL | 7,654,664 | 21,024 |
| | Netwealth Group Ltd. | 1,162,976 | 20,983 |
| | Perpetual Ltd. | 1,580,580 | 20,973 |
| | Insignia Financial Ltd. | 9,345,432 | 20,228 |
| | Beach Energy Ltd. | 24,634,239 | 20,177 |
| | Domino's Pizza Enterprises Ltd. | 901,214 | 19,724 |
| | Gold Road Resources Ltd. | 15,107,372 | 19,704 |
| | Yancoal Australia Ltd. | 4,572,710 | 19,567 |
| | HomeCo Daily Needs REIT | 24,208,066 | 19,199 |
| * | West African Resources Ltd. | 15,895,918 | 19,083 |
| | GrainCorp Ltd. Class A | 3,126,634 | 18,475 |
| * | Bellevue Gold Ltd. | 17,400,232 | 18,465 |
Total International Stock Index Fund
| | | | | | Shares | Market
Value•
($000) |
| | Sims Ltd. | 2,214,793 | 18,405 |
| | Eagers Automotive Ltd. | 2,519,727 | 18,282 |
| | Pinnacle Investment Management Group Ltd. | 1,351,726 | 17,754 |
| | Codan Ltd. | 1,686,355 | 17,448 |
| *,3 | Capricorn Metals Ltd. | 4,316,836 | 17,386 |
| * | Regis Resources Ltd. | 9,757,065 | 17,187 |
| * | Clarity Pharmaceuticals Ltd. | 3,819,647 | 17,001 |
| | BWP Trust | 7,519,280 | 16,985 |
| * | IRESS Ltd. | 2,556,243 | 16,623 |
| * | PEXA Group Ltd. | 1,847,644 | 16,414 |
| | GQG Partners Inc. | 8,902,307 | 16,159 |
| | Ingenia Communities Group | 5,117,903 | 16,142 |
| * | Resolute Mining Ltd. | 29,499,883 | 15,773 |
| | Charter Hall Retail REIT | 7,110,548 | 15,742 |
| | NRW Holdings Ltd. | 6,092,363 | 15,353 |
| | TPG Telecom Ltd. | 5,142,041 | 15,220 |
| | Waypoint REIT Ltd. | 9,327,369 | 15,197 |
| | Lovisa Holdings Ltd. | 767,123 | 14,906 |
| | Centuria Industrial REIT | 7,431,892 | 14,844 |
| | Brickworks Ltd. | 827,673 | 14,704 |
| | Nine Entertainment Co. Holdings Ltd. | 18,685,868 | 14,377 |
| * | Spartan Resources Ltd. | 13,810,587 | 14,356 |
| | Deterra Royalties Ltd. | 5,931,862 | 14,351 |
| | Bega Cheese Ltd. | 4,218,611 | 14,219 |
| | Bapcor Ltd. | 4,688,757 | 14,049 |
| * | WEB Travel Group Ltd. | 5,307,387 | 13,938 |
| * | Nuix Ltd. | 2,697,492 | 13,623 |
| | Amotiv Ltd. | 1,950,005 | 13,572 |
| | Nickel Industries Ltd. | 22,894,159 | 13,526 |
| | Nufarm Ltd. | 5,321,723 | 13,411 |
| | Centuria Capital Group | 11,073,971 | 13,376 |
| | Magellan Financial Group Ltd. | 1,897,368 | 13,293 |
| | Arena REIT | 5,020,195 | 13,201 |
| * | SiteMinder Ltd. | 2,983,377 | 12,887 |
| | Corporate Travel Management Ltd. | 1,583,397 | 12,827 |
| *,1 | Mesoblast Ltd. | 14,703,924 | 12,629 |
| * | Boss Energy Ltd. | 5,593,824 | 12,440 |
| * | Neuren Pharmaceuticals Ltd. | 1,518,254 | 12,220 |
| | Elders Ltd. | 2,167,196 | 12,089 |
| | Imdex Ltd. | 7,017,199 | 11,921 |
| * | Deep Yellow Ltd. | 13,155,566 | 11,671 |
| *,1 | Liontown Resources Ltd. | 21,799,104 | 11,646 |
| * | Temple & Webster Group Ltd. | 1,530,559 | 11,564 |
| * | Macquarie Technology Group Ltd. | 210,214 | 11,416 |
| * | PolyNovo Ltd. | 8,510,768 | 11,382 |
| | Monadelphous Group Ltd. | 1,332,835 | 10,988 |
| | IPH Ltd. | 3,067,825 | 10,794 |
| | Helia Group Ltd. | 4,053,007 | 10,769 |
| | EVT Ltd. | 1,485,506 | 10,607 |
| | Karoon Energy Ltd. | 11,202,629 | 10,212 |
| * | Healius Ltd. | 9,278,011 | 10,037 |
| | G8 Education Ltd. | 11,156,057 | 9,827 |
| | Perenti Ltd. | 12,715,386 | 9,769 |
| | Tabcorp Holdings Ltd. | 31,770,865 | 9,746 |
| | Nick Scali Ltd. | 1,051,099 | 9,664 |
| | Inghams Group Ltd. | 5,096,351 | 9,579 |
| * | Megaport Ltd. | 2,107,052 | 9,563 |
| | Data#3 Ltd. | 1,993,890 | 9,552 |
| * | Austal Ltd. | 4,388,854 | 9,477 |
| | Stanmore Resources Ltd. | 4,549,899 | 9,336 |
| *,1 | Opthea Ltd. | 16,950,541 | 9,296 |
| * | Silex Systems Ltd. | 2,688,747 | 9,124 |
| * | Judo Capital Holdings Ltd. | 7,336,345 | 9,016 |
| | Credit Corp. Group Ltd. | 791,960 | 8,948 |
| * | Alpha HPA Ltd. | 13,242,716 | 8,888 |
| | Lifestyle Communities Ltd. | 1,541,006 | 8,686 |
| * | Tuas Ltd. | 2,481,660 | 8,364 |
| | Aussie Broadband Ltd. | 3,458,610 | 8,259 |
| | Collins Foods Ltd. | 1,497,918 | 8,178 |
| | McMillan Shakespeare Ltd. | 825,372 | 7,920 |
Total International Stock Index Fund
| | | | | | Shares | Market
Value•
($000) |
| | Regis Healthcare Ltd. | 1,839,632 | 7,825 |
| | Service Stream Ltd. | 7,760,975 | 7,693 |
| | Charter Hall Social Infrastructure REIT | 4,441,968 | 7,571 |
| | Hansen Technologies Ltd. | 2,227,974 | 7,276 |
| | Accent Group Ltd. | 4,671,248 | 7,220 |
| *,1 | Vulcan Energy Resources Ltd. | 2,093,959 | 7,024 |
| | Kelsian Group Ltd. | 2,732,070 | 6,995 |
| * | Superloop Ltd. | 5,713,905 | 6,981 |
| | Domain Holdings Australia Ltd. | 3,524,898 | 6,948 |
| * | Nanosonics Ltd. | 3,295,984 | 6,874 |
| 2 | Coronado Global Resources Inc. | 10,300,436 | 6,862 |
| | Myer Holdings Ltd. | 11,399,365 | 6,763 |
| | Hotel Property Investments Ltd. | 2,869,856 | 6,633 |
| *,1 | DroneShield Ltd. | 10,583,485 | 6,552 |
| | Johns Lyng Group Ltd. | 2,604,289 | 6,521 |
| | Growthpoint Properties Australia Ltd. | 3,767,093 | 6,518 |
| | Vulcan Steel Ltd. | 1,325,844 | 6,480 |
| | Rural Funds Group | 5,167,866 | 6,333 |
| * | Audinate Group Ltd. | 1,021,838 | 6,227 |
| | Abacus Storage King | 7,547,014 | 6,214 |
| * | FleetPartners Group Ltd. | 3,226,304 | 6,184 |
| | SmartGroup Corp. Ltd. | 1,202,831 | 6,103 |
| | Jumbo Interactive Ltd. | 718,172 | 6,060 |
| | Ridley Corp. Ltd. | 3,399,358 | 5,904 |
| | Platinum Asset Management Ltd. | 7,251,336 | 5,830 |
| | Clinuvel Pharmaceuticals Ltd. | 624,010 | 5,810 |
| *,1 | Star Entertainment Group Ltd. | 35,935,351 | 5,602 |
| *,1 | Chalice Mining Ltd. | 4,737,843 | 5,594 |
| | Abacus Group | 6,969,931 | 5,539 |
| *,1 | ioneer Ltd. | 29,122,532 | 5,498 |
| *,1 | Strike Energy Ltd. | 38,853,763 | 5,432 |
| | GWA Group Ltd. | 3,451,641 | 5,264 |
| | Dexus Industria REIT | 2,947,451 | 5,213 |
| | PWR Holdings Ltd. | 871,440 | 5,200 |
| | Centuria Office REIT | 6,566,133 | 5,146 |
| * | Bravura Solutions Ltd. | 5,159,256 | 5,117 |
| | oOh!media Ltd. | 6,045,946 | 4,904 |
| | Infomedia Ltd. | 5,146,350 | 4,801 |
| | Cromwell Property Group | 17,493,500 | 4,763 |
| * | Latin Resources Ltd. | 37,378,733 | 4,730 |
| | HealthCo REIT | 6,055,631 | 4,570 |
| 1 | Integral Diagnostics Ltd. | 2,202,299 | 4,516 |
| | Australian Ethical Investment Ltd. | 1,506,552 | 4,452 |
| * | Oceania Healthcare Ltd. | 9,562,273 | 4,447 |
| * | Select Harvests Ltd. | 1,820,976 | 4,337 |
| *,3 | Leo Lithium Ltd. | 12,697,269 | 4,220 |
| * | Australian Agricultural Co. Ltd. | 4,555,108 | 4,212 |
| | MyState Ltd. | 1,669,424 | 4,155 |
| | Australian Clinical Labs Ltd. | 1,724,780 | 4,101 |
| | Dicker Data Ltd. | 716,002 | 4,042 |
| * | Cooper Energy Ltd. | 35,164,096 | 4,036 |
| | Navigator Global Investments Ltd. | 3,215,305 | 3,643 |
| * | Emeco Holdings Ltd. | 7,081,556 | 3,587 |
| * | St. Barbara Ltd. | 11,558,627 | 3,490 |
| *,1 | BrainChip Holdings Ltd. | 22,494,940 | 3,422 |
| | Kogan.com Ltd. | 1,083,667 | 3,297 |
| *,1 | Weebit Nano Ltd. | 2,483,370 | 3,284 |
| * | Mayne Pharma Group Ltd. | 1,145,908 | 3,227 |
| | Cedar Woods Properties Ltd. | 852,351 | 3,219 |
| * | OFX Group Ltd. | 3,344,840 | 3,208 |
| | Praemium Ltd. | 6,841,258 | 3,035 |
| *,1 | Arafura Rare Earths Ltd. | 30,754,376 | 3,015 |
| | Australian Finance Group Ltd. | 2,759,603 | 2,895 |
| *,1 | Cettire Ltd. | 2,842,639 | 2,818 |
| | GDI Property Group Partnership | 6,792,882 | 2,814 |
| * | Aurelia Metals Ltd. | 22,993,468 | 2,797 |
| *,1 | Syrah Resources Ltd. | 14,359,927 | 2,795 |
| * | Webjet Group Ltd. | 5,312,970 | 2,710 |
| | SG Fleet Group Ltd. | 1,516,771 | 2,694 |
| *,1 | Wildcat Resources Ltd. | 12,796,575 | 2,687 |
Total International Stock Index Fund
| | | | | | Shares | Market
Value•
($000) |
| *,1 | Imugene Ltd. | 92,935,232 | 2,616 |
| *,1 | Sayona Mining Ltd. | 115,164,485 | 2,546 |
| * | Carnarvon Energy Ltd. | 24,349,742 | 2,464 |
| * | Alkane Resources Ltd. | 6,587,274 | 2,454 |
| * | Tyro Payments Ltd. | 4,590,621 | 2,321 |
| * | Omni Bridgeway Ltd. | 3,856,349 | 2,318 |
| | Humm Group Ltd. | 4,927,046 | 2,296 |
| *,3 | AVZ Minerals Ltd. | 33,065,566 | 2,176 |
| 1 | Baby Bunting Group Ltd. | 1,778,262 | 2,096 |
| *,1 | Core Lithium Ltd. | 27,797,020 | 1,986 |
| * | Mount Gibson Iron Ltd. | 9,900,164 | 1,983 |
| 1 | Solvar Ltd. | 2,273,837 | 1,967 |
| *,1 | EML Payments Ltd. | 4,387,565 | 1,923 |
| *,1 | Fineos Corp. Ltd. | 1,913,967 | 1,699 |
| *,1 | Coast Entertainment Holdings Ltd. | 5,437,328 | 1,595 |
| | Jupiter Mines Ltd. | 13,306,053 | 1,529 |
| *,1 | 29Metals Ltd. | 4,953,224 | 1,359 |
| *,1 | Novonix Ltd. | 2,912,384 | 1,333 |
| *,1 | Calix Ltd. | 2,240,911 | 1,294 |
| * | Seven West Media Ltd. | 11,915,399 | 1,253 |
| *,3 | Firefinch Ltd. | 14,620,770 | 577 |
| | Sims Ltd. ADR | 57 | — |
| | | | | | | 21,716,641 |
| Austria (0.2%) |
| | Erste Group Bank AG | 4,370,641 | 247,228 |
| 2 | BAWAG Group AG | 1,067,260 | 82,723 |
| | OMV AG | 1,976,890 | 81,924 |
| | Verbund AG | 921,800 | 75,914 |
| | ANDRITZ AG | 970,626 | 58,600 |
| | Wienerberger AG | 1,557,766 | 47,046 |
| | Raiffeisen Bank International AG | 1,797,215 | 32,195 |
| 1 | voestalpine AG | 1,535,235 | 31,959 |
| | Vienna Insurance Group AG Wiener Versicherung Gruppe | 526,565 | 16,808 |
| * | DO & CO AG | 102,980 | 16,009 |
| | Oesterreichische Post AG | 455,875 | 14,458 |
| | EVN AG | 509,894 | 14,163 |
| | UNIQA Insurance Group AG | 1,523,983 | 11,947 |
| 1 | CA Immobilien Anlagen AG | 470,220 | 11,401 |
| | Telekom Austria AG Class A | 1,229,761 | 10,166 |
| *,1 | Lenzing AG | 263,593 | 9,043 |
| *,1 | IMMOFINANZ AG | 441,967 | 7,179 |
| | Strabag SE | 180,771 | 7,117 |
| *,1 | AT&S Austria Technologie & Systemtechnik AG | 345,769 | 6,347 |
| | Schoeller-Bleckmann Oilfield Equipment AG | 156,697 | 4,705 |
| | Palfinger AG | 197,594 | 4,392 |
| | Porr AG | 239,065 | 3,780 |
| * | S IMMO AG | 115,414 | 2,773 |
| 1 | Agrana Beteiligungs AG | 164,285 | 1,894 |
| * | Eurotelesites AG | 340,305 | 1,845 |
| | | | | | | 801,616 |
| Belgium (0.7%) |
| | Anheuser-Busch InBev SA/NV | 12,657,301 | 750,469 |
| * | Argenx SE | 829,243 | 488,968 |
| | UCB SA | 1,689,665 | 325,343 |
| | KBC Group NV | 3,323,850 | 242,113 |
| | Ageas SA/NV | 2,302,882 | 120,184 |
| | Groupe Bruxelles Lambert NV | 1,169,070 | 84,471 |
| | Syensqo SA | 985,398 | 76,443 |
| | Lotus Bakeries NV | 5,594 | 73,327 |
| | D'ieteren Group | 311,643 | 67,470 |
| | Ackermans & van Haaren NV | 309,191 | 62,967 |
| | Sofina SA | 238,232 | 58,408 |
| | Warehouses De Pauw CVA | 2,404,903 | 57,234 |
| | Elia Group SA/NV | 524,709 | 49,929 |
| | Aedifica SA | 665,565 | 42,967 |
| | Azelis Group NV | 2,093,749 | 41,946 |
| | Solvay SA | 983,341 | 40,006 |
| | Umicore SA | 2,851,982 | 34,336 |
| 1 | Cofinimmo SA | 511,905 | 32,322 |
Total International Stock Index Fund
| | | | | | Shares | Market
Value•
($000) |
| | Colruyt Group NV | 667,097 | 31,164 |
| | KBC Ancora | 483,880 | 24,561 |
| | Montea NV | 281,547 | 20,617 |
| | Melexis NV | 280,498 | 18,319 |
| | Shurgard Self Storage Ltd. | 424,811 | 18,192 |
| | Bekaert SA | 480,831 | 17,572 |
| | Xior Student Housing NV | 499,406 | 16,778 |
| | Fagron | 798,953 | 16,171 |
| | Proximus SADP | 2,101,495 | 15,347 |
| | Deme Group NV | 95,892 | 14,661 |
| | Barco NV | 968,791 | 12,047 |
| | Retail Estates NV | 175,546 | 11,850 |
| | VGP NV | 139,114 | 11,699 |
| | Gimv NV | 281,754 | 11,632 |
| | Tessenderlo Group SA | 326,784 | 8,858 |
| | Kinepolis Group NV | 191,534 | 8,077 |
| * | Ontex Group NV | 943,089 | 7,935 |
| 1 | CMB Tech NV | 333,761 | 4,732 |
| | bpost SA | 1,403,444 | 3,674 |
| | | | | | | 2,922,789 |
| Brazil (0.9%) |
| | Vale SA | 54,049,767 | 580,243 |
| | Petroleo Brasileiro SA | 51,609,563 | 348,712 |
| | WEG SA | 20,693,534 | 193,694 |
| | B3 SA - Brasil Bolsa Balcao | 77,533,831 | 142,436 |
| | Ambev SA | 60,214,578 | 131,660 |
| | Centrais Eletricas Brasileiras SA | 17,465,611 | 114,717 |
| | Banco do Brasil SA | 23,741,596 | 108,135 |
| | Localiza Rent a Car SA | 13,765,815 | 100,060 |
| | Suzano SA | 9,613,404 | 99,395 |
| | JBS SA | 15,801,553 | 98,430 |
| | Banco BTG Pactual SA | 16,409,940 | 92,313 |
| | Cia de Saneamento Basico do Estado de Sao Paulo SABESP | 5,305,461 | 84,507 |
| | Equatorial Energia SA | 13,570,550 | 75,401 |
| * | Embraer SA | 8,242,939 | 69,127 |
| | PRIO SA | 9,386,080 | 66,537 |
| | Raia Drogasil SA | 15,442,229 | 65,018 |
| | Vibra Energia SA | 15,467,292 | 59,692 |
| | Rumo SA | 17,271,233 | 59,454 |
| | BB Seguridade Participacoes SA | 9,334,160 | 55,334 |
| 2 | Rede D'Or Sao Luiz SA | 10,741,705 | 54,555 |
| | Telefonica Brasil SA | 5,207,926 | 47,423 |
| | Banco Bradesco SA | 21,111,242 | 46,525 |
| | Lojas Renner SA | 13,281,684 | 42,665 |
| | Klabin SA | 11,523,195 | 41,581 |
| * | BRF SA | 9,145,086 | 41,495 |
| | Ultrapar Participacoes SA | 11,460,435 | 41,414 |
| *,2 | Hapvida Participacoes e Investimentos SA | 66,237,053 | 40,332 |
| | Cosan SA | 16,589,361 | 33,920 |
| | Energisa SA | 4,497,998 | 33,574 |
| | CCR SA | 15,407,127 | 32,648 |
| | TOTVS SA | 6,156,255 | 31,778 |
| | Natura & Co. Holding SA | 13,321,550 | 31,593 |
| | Itau Unibanco Holding SA | 5,817,954 | 30,384 |
| | TIM SA | 9,990,712 | 28,654 |
| | XP MALLS FDO INV IMOB FII | 1,587,426 | 28,476 |
| | Allos SA | 6,410,946 | 24,531 |
| | Banco Santander Brasil SA | 5,115,207 | 24,068 |
| | Kinea Renda Imobiliaria FII | 939,318 | 22,472 |
| * | Sendas Distribuidora SA | 16,541,431 | 21,432 |
| | Santos Brasil Participacoes SA | 9,783,047 | 21,374 |
| * | Hypera SA | 5,541,328 | 21,184 |
| | Multiplan Empreendimentos Imobiliarios SA | 4,347,138 | 19,243 |
| | Transmissora Alianca de Energia Eletrica SA | 2,996,575 | 18,153 |
| | Kinea Indice de Precos FII | 1,114,995 | 17,644 |
| | Kinea Rendimentos Imobiliarios FII (BVMF) | 974,201 | 17,614 |
| | Engie Brasil Energia SA | 2,405,433 | 17,256 |
| 2 | GPS Participacoes e Empreendimentos SA | 5,762,900 | 17,007 |
| | Porto Seguro SA | 2,554,958 | 16,861 |
Total International Stock Index Fund
| | | | | | Shares | Market
Value•
($000) |
| * | Embraer SA ADR | 500,190 | 16,766 |
| | Cia De Sanena Do Parana | 3,334,895 | 15,576 |
| | Caixa Seguridade Participacoes SA | 6,250,600 | 15,570 |
| | Iguatemi SA | 4,069,200 | 14,881 |
| * | Ambipar Participacoes e Empreendimentos SA Class B | 664,329 | 14,859 |
| | CPFL Energia SA | 2,588,000 | 14,671 |
| | Cyrela Brazil Realty SA Empreendimentos e Participacoes | 3,774,654 | 14,195 |
| | Cia Paranaense de Energia - Copel | 9,315,038 | 14,035 |
| | Cia Siderurgica Nacional SA | 6,865,233 | 13,978 |
| | Tres Tentos Agroindustrial SA | 6,914,900 | 13,600 |
| | Patria Log Fundo de Investimento Imobiliario Responsabilidade Limitada | 501,944 | 13,532 |
| * | Eneva SA | 5,761,552 | 13,036 |
| * | Marfrig Global Foods SA | 4,774,742 | 12,959 |
| | Brava Energia | 4,161,278 | 12,223 |
| | Azzas 2154 SA | 1,616,468 | 11,532 |
| | Cia de Saneamento Basico do Estado de Sao Paulo SABESP ADR | 698,508 | 11,099 |
| | Fleury SA | 4,272,243 | 10,952 |
| | Neoenergia SA | 3,139,600 | 10,373 |
| | Cia de Saneamento de Minas Gerais Copasa MG | 2,589,103 | 10,323 |
| | Cia Energetica de Minas Gerais ADR | 5,197,706 | 10,032 |
| | Sao Martinho SA | 2,261,717 | 9,906 |
| | FII BTLG | 574,697 | 9,547 |
| * | Atacadao SA | 7,284,665 | 9,438 |
| | Direcional Engenharia SA | 1,694,947 | 9,171 |
| | Auren Energia SA | 4,930,384 | 8,742 |
| * | Magazine Luiza SA | 5,277,165 | 8,636 |
| * | IRB-Brasil Resseguros SA | 1,119,784 | 8,395 |
| | SLC Agricola SA | 2,818,854 | 8,294 |
| | Telefonica Brasil SA ADR | 898,342 | 8,184 |
| | Petroreconcavo SA | 2,749,050 | 8,075 |
| * | Orizon Valorizacao de Residuos SA | 1,004,776 | 8,060 |
| | Alupar Investimento SA | 1,584,170 | 8,040 |
| | CSN Mineracao SA | 7,318,000 | 7,861 |
| | XP Log FII | 466,467 | 7,823 |
| | M Dias Branco SA | 1,730,092 | 7,485 |
| | Fundo De Investimento Imobiliario Tg Ativo Real | 417,575 | 7,381 |
| | Odontoprev SA | 3,865,908 | 7,356 |
| | YDUQS Participacoes SA | 3,986,420 | 7,317 |
| | Itau Unibanco Holding SA ADR | 1,201,809 | 7,271 |
| * | Grupo Mateus SA | 5,540,280 | 7,265 |
| | Wilson Sons SA | 2,641,700 | 7,261 |
| | Vinci Shopping Centers FII | 396,848 | 7,212 |
| | Dexco SA | 4,882,848 | 6,994 |
| | Maxi Renda FII | 4,036,937 | 6,739 |
| * | Serena Energia SA | 4,648,350 | 6,674 |
| * | Cogna Educacao SA | 26,134,485 | 6,374 |
| * | MRV Engenharia e Participacoes SA | 5,312,440 | 6,359 |
| | Smartfit Escola de Ginastica e Danca SA | 1,565,400 | 5,917 |
| | FII Iridium | 497,854 | 5,792 |
| | Hedge Brasil Shopping FII | 168,804 | 5,774 |
| | Vamos Locacao de Caminhoes Maquinas e Equipamentos SA | 5,303,463 | 5,771 |
| | Vivara Participacoes SA | 1,291,900 | 5,714 |
| | AES Brasil Energia SA | 4,022,810 | 5,644 |
| | Capitania Securities II FII | 4,375,450 | 5,457 |
| | Kinea High Yield CRI - FII | 300,000 | 5,355 |
| | Patria Renda Urbana Fundo de Investimento Imobiliario Responsabilidade Limitada | 254,450 | 5,326 |
| | Cury Construtora e Incorporadora SA | 1,224,100 | 5,175 |
| | FII VBI Prime Properties | 364,711 | 5,046 |
| * | Kinea Rendimentos Imobiliarios FII | 275,647 | 4,984 |
| | Fii UBS Br Receb Imob | 365,529 | 4,878 |
| | Vulcabras SA | 1,660,300 | 4,716 |
| | Fras-Le SA | 1,193,899 | 4,506 |
| | Grendene SA | 4,707,976 | 4,333 |
| | Tupy SA | 987,560 | 3,989 |
| | Pet Center Comercio e Participacoes SA | 4,612,222 | 3,941 |
| | Mahle Metal Leve SA | 748,664 | 3,877 |
| * | SIMPAR SA | 4,052,000 | 3,750 |
| * | Minerva SA | 3,672,743 | 3,685 |
| | EcoRodovias Infraestrutura e Logistica SA | 2,938,671 | 3,624 |
| * | Log-in Logistica Intermodal SA | 788,474 | 3,605 |
Total International Stock Index Fund
| | | | | | Shares | Market
Value•
($000) |
| * | Oncoclinicas do Brasil Servicos Medicos SA | 4,501,906 | 3,582 |
| | BrasilAgro - Co. Brasileira de Propriedades Agricolas | 875,316 | 3,566 |
| | Mills Locacao Servicos e Logistica SA | 1,935,467 | 3,515 |
| 1 | Centrais Eletricas Brasileiras SA ADR | 532,827 | 3,506 |
| | TIM SA ADR | 243,230 | 3,478 |
| | JHSF Participacoes SA | 4,411,900 | 3,389 |
| | Ez Tec Empreendimentos e Participacoes SA | 1,372,902 | 3,318 |
| | Intelbras SA Industria de Telecomunicacao Eletronica Brasileira | 995,560 | 3,296 |
| | Cia Siderurgica Nacional SA ADR | 1,588,434 | 3,240 |
| *,2 | LWSA SA | 4,504,205 | 3,233 |
| | Iochpe Maxion SA | 1,829,971 | 3,226 |
| | Grupo SBF SA | 1,241,641 | 3,112 |
| | Armac Locacao Logistica E Servicos SA | 2,350,200 | 3,037 |
| * | Hidrovias do Brasil SA | 5,518,500 | 3,007 |
| *,1 | Sendas Distribuidora SA ADR | 462,038 | 3,003 |
| * | Cia Brasileira de Aluminio | 2,951,276 | 2,971 |
| | Patria Ren FII | 134,310 | 2,811 |
| | Gerdau SA ADR | 800,508 | 2,498 |
| * | Cia Brasileira de Distribuicao | 4,577,054 | 2,375 |
| | Cia Energetica de Minas Gerais | 933,649 | 2,343 |
| | LOG Commercial Properties e Participacoes SA | 590,356 | 2,310 |
| | Usinas Siderurgicas de Minas Gerais SA Usiminas | 1,916,592 | 2,112 |
| | Camil Alimentos SA | 1,445,226 | 1,975 |
| * | CVC Brasil Operadora e Agencia de Viagens SA | 5,418,381 | 1,921 |
| | Anima Holding SA | 4,278,055 | 1,887 |
| * | Movida Participacoes SA | 1,815,992 | 1,885 |
| * | Diagnosticos da America SA | 3,747,733 | 1,718 |
| | FII Hectare Ce | 305,291 | 1,453 |
| | Centrais Eletricas Brasileiras SA ADR (XNYS) | 197,501 | 1,424 |
| | Lojas Quero-Quero SA | 2,631,616 | 1,311 |
| *,1 | Braskem SA Class A ADR | 213,266 | 1,297 |
| * | Zamp SA | 3,114,964 | 1,293 |
| 1 | Cia Paranaense de Energia - Copel ADR (XNYS) | 205,996 | 1,230 |
| | Ambev SA ADR | 383,229 | 835 |
| * | Cia Brasileira de Distribuicao ADR | 455,545 | 219 |
| | Cia Paranaense de Energia - Copel ADR | 8,914 | 60 |
| | Petroleo Brasileiro SA ADR | 98 | 1 |
| | | | | | | 4,083,069 |
| Canada (7.4%) |
| | Royal Bank of Canada | 19,670,440 | 2,378,932 |
| | Toronto-Dominion Bank | 24,626,310 | 1,361,358 |
| * | Shopify Inc. Class A (XTSE) | 16,671,363 | 1,304,158 |
| | Enbridge Inc. | 29,642,935 | 1,197,342 |
| | Brookfield Corp. Class A | 20,736,977 | 1,099,588 |
| | Canadian Pacific Kansas City Ltd. | 13,010,773 | 1,003,690 |
| | Canadian Natural Resources Ltd. | 29,325,397 | 997,276 |
| 1 | Bank of Montreal | 10,130,031 | 923,114 |
| 1 | Bank of Nova Scotia | 17,060,115 | 878,400 |
| | Canadian National Railway Co. | 7,834,096 | 845,948 |
| | Constellation Software Inc. | 276,813 | 834,811 |
| | Canadian Imperial Bank of Commerce | 13,086,823 | 818,755 |
| | Manulife Financial Corp. | 25,207,387 | 736,298 |
| | Suncor Energy Inc. | 17,986,821 | 678,987 |
| | TC Energy Corp. | 14,479,047 | 673,439 |
| | Waste Connections Inc. | 3,588,490 | 634,348 |
| | Agnico Eagle Mines Ltd. | 6,947,618 | 599,680 |
| | Alimentation Couche-Tard Inc. | 10,948,964 | 570,980 |
| | Intact Financial Corp. | 2,485,481 | 474,657 |
| | Sun Life Financial Inc. | 8,145,212 | 451,618 |
| | National Bank of Canada | 4,734,511 | 451,570 |
| | Wheaton Precious Metals Corp. | 6,314,915 | 417,033 |
| | Dollarama Inc. | 3,838,260 | 399,415 |
| | Fairfax Financial Holdings Ltd. | 298,471 | 370,905 |
| | Franco-Nevada Corp. | 2,665,610 | 353,832 |
| | Pembina Pipeline Corp. | 8,087,354 | 338,340 |
| | Nutrien Ltd. | 6,907,916 | 329,383 |
| | Teck Resources Ltd. Class B | 7,061,316 | 328,532 |
| * | CGI Inc. | 2,840,657 | 314,679 |
| | Thomson Reuters Corp. | 1,920,721 | 314,398 |
Total International Stock Index Fund
| | | | | | Shares | Market
Value•
($000) |
| | WSP Global Inc. | 1,740,370 | 311,075 |
| | Cameco Corp. | 5,899,156 | 308,272 |
| | Brookfield Asset Management Ltd. Class A | 5,760,280 | 305,607 |
| | Restaurant Brands International Inc. | 4,357,151 | 303,046 |
| | Fortis Inc. | 6,870,345 | 297,196 |
| | Cenovus Energy Inc. | 18,176,399 | 292,290 |
| | Barrick Gold Corp. (XTSE) | 14,505,538 | 280,349 |
| | Loblaw Cos. Ltd. | 2,016,242 | 254,921 |
| | Power Corp. of Canada | 7,602,044 | 240,289 |
| | Tourmaline Oil Corp. | 4,893,748 | 225,611 |
| | RB Global Inc. | 2,549,753 | 216,034 |
| | Barrick Gold Corp. (XLON) | 9,008,462 | 173,341 |
| | Kinross Gold Corp. | 17,107,971 | 172,634 |
| | Metro Inc. Class A | 2,872,530 | 170,596 |
| | Imperial Oil Ltd. | 2,276,964 | 169,912 |
| 1 | Emera Inc. | 3,988,322 | 150,670 |
| | TFI International Inc. | 1,111,595 | 148,758 |
| | Magna International Inc. | 3,737,657 | 147,563 |
| 2 | Hydro One Ltd. | 4,415,016 | 142,152 |
| | ARC Resources Ltd. | 8,330,948 | 137,977 |
| | BCE Inc. | 4,240,721 | 136,723 |
| | Stantec Inc. | 1,591,479 | 129,092 |
| | Great-West Lifeco Inc. | 3,826,021 | 128,381 |
| * | Descartes Systems Group Inc. | 1,187,678 | 123,387 |
| | George Weston Ltd. | 773,433 | 122,679 |
| * | First Quantum Minerals Ltd. | 9,468,078 | 122,333 |
| * | Ivanhoe Mines Ltd. Class A | 9,240,436 | 122,179 |
| | TMX Group Ltd. | 3,827,842 | 119,562 |
| | Pan American Silver Corp. | 5,082,734 | 118,859 |
| | AtkinsRealis Group Inc. | 2,447,886 | 117,792 |
| | Alamos Gold Inc. Class A | 5,747,837 | 116,125 |
| | Gildan Activewear Inc. | 2,351,712 | 115,090 |
| * | Celestica Inc. | 1,642,954 | 112,429 |
| | Element Fleet Management Corp. | 5,432,548 | 111,160 |
| | Open Text Corp. | 3,700,655 | 110,992 |
| | GFL Environmental Inc. (XTSE) | 2,647,492 | 110,760 |
| | TELUS Corp. | 6,867,568 | 108,561 |
| | iA Financial Corp. Inc. | 1,326,914 | 108,109 |
| | FirstService Corp. | 558,759 | 103,457 |
| | Toromont Industries Ltd. | 1,146,150 | 101,251 |
| | Keyera Corp. | 3,194,135 | 98,094 |
| | AltaGas Ltd. | 4,096,743 | 97,891 |
| | West Fraser Timber Co. Ltd. | 1,044,348 | 94,320 |
| | Colliers International Group Inc. | 603,490 | 92,252 |
| | Lundin Mining Corp. | 9,118,979 | 88,678 |
| * | Bombardier Inc. Class B | 1,200,899 | 88,337 |
| * | CAE Inc. | 4,443,468 | 78,188 |
| | Canadian Apartment Properties REIT | 2,335,679 | 77,820 |
| 1 | Canadian Tire Corp. Ltd. Class A | 718,545 | 76,466 |
| | Capital Power Corp. | 1,801,081 | 73,047 |
| * | South Bow Corp. | 2,892,128 | 72,223 |
| | MEG Energy Corp. | 3,794,113 | 69,350 |
| 1 | PrairieSky Royalty Ltd. | 3,302,081 | 66,072 |
| | Brookfield Infrastructure Corp. Class A (XTSE) | 1,605,891 | 66,019 |
| | Saputo Inc. | 3,403,041 | 64,915 |
| | Onex Corp. | 900,262 | 64,800 |
| 1 | Whitecap Resources Inc. | 8,283,972 | 61,817 |
| | B2Gold Corp. | 18,008,904 | 59,497 |
| | Brookfield Renewable Corp. Class A | 1,881,406 | 57,604 |
| 1 | RioCan REIT | 4,202,561 | 57,348 |
| | Primo Water Corp. | 2,183,881 | 57,344 |
| | Finning International Inc. | 1,959,771 | 57,202 |
| | Canadian Western Bank | 1,346,709 | 55,373 |
| *,1 | NexGen Energy Ltd. | 7,412,621 | 54,516 |
| 1 | Northland Power Inc. | 3,569,449 | 54,246 |
| | Algonquin Power & Utilities Corp. | 10,680,233 | 51,623 |
| | Osisko Gold Royalties Ltd. (XTSE) | 2,470,069 | 49,708 |
| * | Eldorado Gold Corp. | 2,828,634 | 49,204 |
| | Hudbay Minerals Inc. | 5,484,860 | 49,202 |
| | Granite REIT | 881,443 | 48,100 |
Total International Stock Index Fund
| | | | | | Shares | Market
Value•
($000) |
| | Stella-Jones Inc. | 790,675 | 47,803 |
| | Boyd Group Services Inc. | 298,439 | 46,448 |
| * | Capstone Copper Corp. | 6,671,939 | 46,146 |
| | Parkland Corp. | 1,946,123 | 45,286 |
| | Veren Inc. | 8,609,960 | 44,338 |
| * | Kinaxis Inc. | 390,115 | 43,328 |
| | Definity Financial Corp. | 1,115,592 | 43,050 |
| | Chartwell Retirement Residences | 3,727,536 | 41,897 |
| * | Aritzia Inc. | 1,258,855 | 40,532 |
| * | IAMGOLD Corp. (XTSE) | 7,233,987 | 40,161 |
| 1 | Choice Properties REIT | 3,804,638 | 38,747 |
| 1 | TransAlta Corp. | 3,704,497 | 38,738 |
| * | Bausch Health Cos. Inc. | 4,207,990 | 38,715 |
| 1 | Gibson Energy Inc. | 2,266,069 | 37,596 |
| 1 | First Capital REIT | 2,913,035 | 37,199 |
| 1 | Dream Industrial REIT | 3,840,665 | 36,466 |
| | Atco Ltd. | 1,020,168 | 35,404 |
| * | ATS Corp. | 1,162,384 | 34,838 |
| | IGM Financial Inc. | 1,126,175 | 33,833 |
| * | Air Canada | 2,451,563 | 33,225 |
| | Lundin Gold Inc. | 1,366,994 | 33,057 |
| 1 | SmartCentres REIT | 1,797,180 | 32,153 |
| | Premium Brands Holdings Corp. Class A | 514,317 | 32,115 |
| | Stelco Holdings Inc. | 648,839 | 31,749 |
| 2 | Nuvei Corp. | 885,516 | 29,809 |
| | Methanex Corp. | 755,767 | 29,583 |
| | Boardwalk REIT | 569,133 | 29,553 |
| | Boralex Inc. Class A | 1,214,784 | 29,202 |
| 1 | First Majestic Silver Corp. | 3,949,525 | 29,188 |
| | CI Financial Corp. | 1,758,062 | 28,915 |
| | OceanaGold Corp. | 9,903,157 | 28,095 |
| | Baytex Energy Corp. | 9,779,566 | 27,603 |
| 1 | H&R REIT | 3,635,131 | 27,596 |
| * | Equinox Gold Corp. | 4,953,483 | 27,394 |
| * | Lightspeed Commerce Inc. (XTSE) | 1,742,626 | 26,346 |
| * | Torex Gold Resources Inc. | 1,205,857 | 26,008 |
| 1 | Topaz Energy Corp. | 1,287,727 | 24,703 |
| | North West Co. Inc. | 655,716 | 24,682 |
| | Russel Metals Inc. | 842,267 | 23,453 |
| | Linamar Corp. | 572,432 | 23,422 |
| 1 | Allied Properties REIT | 1,743,966 | 23,009 |
| 1 | BRP Inc. | 445,023 | 21,942 |
| 1 | Paramount Resources Ltd. Class A | 1,129,565 | 21,791 |
| | Centerra Gold Inc. | 3,008,201 | 21,259 |
| | Vermilion Energy Inc. | 2,204,114 | 20,548 |
| | GFL Environmental Inc. | 462,534 | 19,334 |
| | Barrick Gold Corp. | 998,659 | 19,294 |
| *,1 | BlackBerry Ltd. | 8,216,770 | 18,589 |
| | Quebecor Inc. Class B | 719,722 | 17,921 |
| | SSR Mining Inc. | 2,812,376 | 17,371 |
| 1 | Superior Plus Corp. | 3,391,328 | 16,076 |
| | Maple Leaf Foods Inc. | 1,029,258 | 15,568 |
| | Winpak Ltd. | 433,490 | 15,445 |
| 1 | Primaris REIT | 1,346,038 | 15,100 |
| | Innergex Renewable Energy Inc. | 2,272,617 | 14,886 |
| * | Shopify Inc. Class A | 170,845 | 13,362 |
| 1 | Parex Resources Inc. | 1,395,189 | 12,956 |
| | Enghouse Systems Ltd. | 606,162 | 12,830 |
| | Transcontinental Inc. Class A | 1,030,709 | 12,733 |
| * | Novagold Resources Inc. | 3,359,307 | 11,605 |
| | Cargojet Inc. | 116,134 | 11,351 |
| * | Canfor Corp. | 769,564 | 9,180 |
| 1 | Westshore Terminals Investment Corp. | 500,881 | 8,278 |
| | Cameco Corp. (XTSE) | 157,192 | 8,209 |
| | Cogeco Communications Inc. | 142,721 | 7,191 |
| | First National Financial Corp. | 244,771 | 7,137 |
| *,1 | Cronos Group Inc. | 2,750,743 | 5,808 |
| * | Lightspeed Commerce Inc. | 174,409 | 2,637 |
| | Osisko Gold Royalties Ltd. | 122,359 | 2,463 |
| * | IAMGOLD Corp. | 407,645 | 2,258 |
Total International Stock Index Fund
| | | | | | Shares | Market
Value•
($000) |
| | Brookfield Infrastructure Corp. Class A | 52,023 | 2,137 |
| | | | | | | 32,676,580 |
| Chile (0.1%) |
| | Banco de Chile | 609,212,828 | 70,765 |
| | Empresas Copec SA | 6,800,134 | 42,904 |
| * | Falabella SA | 11,069,795 | 39,649 |
| | Banco de Credito e Inversiones SA | 1,323,053 | 38,703 |
| | Cencosud SA | 18,483,094 | 38,036 |
| | Latam Airlines Group SA | 2,815,584,190 | 37,556 |
| | Banco Santander Chile | 556,933,251 | 27,546 |
| | Empresas CMPC SA | 16,703,069 | 26,602 |
| | Enel Americas SA | 264,957,765 | 24,797 |
| | Enel Chile SA | 341,023,883 | 18,084 |
| | Parque Arauco SA | 9,426,548 | 15,424 |
| | Banco Santander Chile ADR | 775,887 | 15,161 |
| | Cia Sud Americana de Vapores SA | 243,069,008 | 13,147 |
| | Colbun SA | 100,928,730 | 12,486 |
| | Quinenco SA | 3,705,774 | 11,926 |
| | Banco Itau Chile SA | 1,051,365 | 11,373 |
| | Aguas Andinas SA Class A | 38,180,872 | 10,900 |
| | Cencosud Shopping SA | 6,602,799 | 10,876 |
| | Cia Cervecerias Unidas SA | 1,864,537 | 10,304 |
| | Plaza SA | 4,602,363 | 7,496 |
| | SMU SA | 41,063,916 | 6,359 |
| * | Engie Energia Chile SA | 6,785,341 | 6,326 |
| * | CAP SA | 1,038,767 | 6,229 |
| | Empresa Nacional de Telecomunicaciones SA | 1,822,607 | 5,950 |
| | Inversiones Aguas Metropolitanas SA | 6,637,065 | 4,924 |
| * | Ripley Corp. SA | 14,849,019 | 4,242 |
| | Vina Concha y Toro SA | 3,599,565 | 4,160 |
| | Inversiones La Construccion SA | 442,231 | 3,471 |
| | SONDA SA | 7,561,749 | 2,775 |
| | Enel Chile SA ADR | 125,450 | 344 |
| | Sociedad de Inversiones Oro Blanco SA | 5,360,048 | 25 |
| | | | | | | 528,540 |
| China (7.9%) |
| | Tencent Holdings Ltd. | 86,411,740 | 4,505,692 |
| | Alibaba Group Holding Ltd. | 237,144,896 | 2,900,831 |
| *,2 | Meituan Class B | 78,687,307 | 1,859,410 |
| * | PDD Holdings Inc. ADR | 9,866,763 | 1,189,833 |
| | China Construction Bank Corp. Class H | 1,303,354,479 | 1,011,711 |
| | JD.com Inc. Class A | 37,241,907 | 755,237 |
| *,2 | Xiaomi Corp. Class B | 204,143,393 | 700,191 |
| | Industrial & Commercial Bank of China Ltd. Class H | 1,099,512,246 | 659,550 |
| | Bank of China Ltd. Class H | 1,166,932,141 | 553,861 |
| | BYD Co. Ltd. Class H | 15,300,648 | 552,638 |
| | Ping An Insurance Group Co. of China Ltd. Class H | 87,336,022 | 541,115 |
| * | Trip.com Group Ltd. | 7,790,631 | 501,362 |
| | NetEase Inc. | 25,111,309 | 404,011 |
| * | Baidu Inc. Class A | 31,014,073 | 353,896 |
| | China Merchants Bank Co. Ltd. Class H | 52,838,696 | 258,568 |
| | Kweichow Moutai Co. Ltd. Class A | 1,118,621 | 240,257 |
| *,2 | Kuaishou Technology | 39,302,349 | 231,609 |
| | China Life Insurance Co. Ltd. Class H | 103,803,338 | 220,036 |
| | PetroChina Co. Ltd. Class H | 290,136,085 | 217,867 |
| | Agricultural Bank of China Ltd. Class H | 429,011,504 | 210,793 |
| | China Shenhua Energy Co. Ltd. Class H | 47,138,060 | 204,104 |
| | China Petroleum & Chemical Corp. Class H | 340,227,718 | 191,647 |
| * | Li Auto Inc. Class A | 15,026,969 | 188,966 |
| | ANTA Sports Products Ltd. | 17,479,130 | 186,558 |
| | KE Holdings Inc. ADR | 8,463,733 | 185,610 |
| | Yum China Holdings Inc. | 4,066,446 | 182,727 |
| | Zijin Mining Group Co. Ltd. Class H | 83,628,595 | 178,135 |
| * | BeiGene Ltd. | 10,907,168 | 171,783 |
| | PICC Property & Casualty Co. Ltd. Class H | 93,964,973 | 142,542 |
| | Contemporary Amperex Technology Co. Ltd. Class A | 3,918,653 | 136,004 |
| | Geely Automobile Holdings Ltd. | 75,839,744 | 133,319 |
| | New Oriental Education & Technology Group Inc. | 21,210,896 | 132,739 |
| | China Resources Land Ltd. | 38,419,735 | 128,070 |
Total International Stock Index Fund
| | | | | | Shares | Market
Value•
($000) |
| | China Pacific Insurance Group Co. Ltd. Class H | 35,982,683 | 124,963 |
| | Haier Smart Home Co. Ltd. Class H | 32,301,725 | 117,230 |
| | Tencent Music Entertainment Group ADR | 10,231,645 | 113,878 |
| | CITIC Ltd. | 88,712,062 | 104,202 |
| *,2 | Wuxi Biologics Cayman Inc. | 48,693,874 | 103,445 |
| * | XPeng Inc. Class A | 18,140,774 | 102,500 |
| | China Overseas Land & Investment Ltd. | 53,492,828 | 102,215 |
| | H World Group Ltd. | 27,162,660 | 99,980 |
| | China Merchants Bank Co. Ltd. Class A | 18,326,429 | 96,327 |
| | China Mengniu Dairy Co. Ltd. | 42,829,424 | 95,915 |
| | Full Truck Alliance Co. Ltd. ADR | 10,416,826 | 93,231 |
| * | NIO Inc. Class A | 17,757,764 | 91,336 |
| 2 | Nongfu Spring Co. Ltd. Class H | 24,371,523 | 90,805 |
| *,2 | Innovent Biologics Inc. | 20,445,978 | 88,882 |
| 2 | China Tower Corp. Ltd. Class H | 652,365,646 | 88,024 |
| * | Bilibili Inc. | 3,959,788 | 87,488 |
| 2 | Postal Savings Bank of China Co. Ltd. Class H | 151,438,794 | 86,969 |
| | CSPC Pharmaceutical Group Ltd. | 116,606,056 | 86,327 |
| 2 | Pop Mart International Group Ltd. | 9,546,198 | 86,306 |
| | China Yangtze Power Co. Ltd. Class A | 21,810,700 | 84,557 |
| | China Resources Beer Holdings Co. Ltd. | 21,987,343 | 81,448 |
| | China CITIC Bank Corp. Ltd. Class H | 129,698,797 | 80,834 |
| *,2 | Akeso Inc. | 9,545,260 | 76,934 |
| | Bank of Communications Co. Ltd. Class H | 101,261,044 | 76,694 |
| | Ping An Insurance Group Co. of China Ltd. Class A | 9,603,947 | 75,562 |
| * | J&T Global Express Ltd. | 95,282,800 | 75,239 |
| | ENN Energy Holdings Ltd. | 10,623,851 | 74,848 |
| | Wuliangye Yibin Co. Ltd. Class A | 3,456,735 | 71,372 |
| | Vipshop Holdings Ltd. ADR | 4,779,822 | 69,021 |
| | Yangzijiang Shipbuilding Holdings Ltd. | 35,436,322 | 68,846 |
| *,2 | SenseTime Group Inc. Class B | 336,416,000 | 67,250 |
| | BYD Co. Ltd. Class A | 1,623,477 | 66,895 |
| * | TAL Education Group ADR | 5,806,018 | 64,563 |
| | CITIC Securities Co. Ltd. Class H | 23,129,825 | 63,881 |
| | Li Ning Co. Ltd. | 31,305,224 | 63,875 |
| * | GCL Technology Holdings Ltd. | 287,344,000 | 63,448 |
| | Kanzhun Ltd. ADR | 4,359,200 | 63,426 |
| | China Resources Power Holdings Co. Ltd. | 26,254,882 | 63,156 |
| | Sino Biopharmaceutical Ltd. | 135,564,818 | 61,583 |
| 2 | Fuyao Glass Industry Group Co. Ltd. Class H | 8,508,447 | 60,185 |
| | Sunny Optical Technology Group Co. Ltd. | 9,071,077 | 59,007 |
| | COSCO SHIPPING Holdings Co. Ltd. Class H | 39,387,725 | 58,331 |
| | Industrial & Commercial Bank of China Ltd. Class A | 68,622,398 | 58,303 |
| | People's Insurance Co. Group of China Ltd. Class H | 114,881,106 | 57,987 |
| | Yankuang Energy Group Co. Ltd. Class H | 43,485,805 | 56,581 |
| 2 | CGN Power Co. Ltd. Class H | 156,381,720 | 56,210 |
| | Yum China Holdings Inc. (XHKG) | 1,249,287 | 55,106 |
| | Tsingtao Brewery Co. Ltd. Class H | 8,530,719 | 54,930 |
| 2 | Longfor Group Holdings Ltd. | 32,879,157 | 53,264 |
| | Qifu Technology Inc. Class A ADR | 1,579,592 | 51,826 |
| *,2 | JD Health International Inc. | 14,443,895 | 51,700 |
| 1 | Great Wall Motor Co. Ltd. Class H | 32,470,951 | 51,635 |
| | Agricultural Bank of China Ltd. Class A | 76,841,300 | 51,110 |
| | China Hongqiao Group Ltd. | 31,369,783 | 50,402 |
| | Kunlun Energy Co. Ltd. | 51,328,728 | 48,678 |
| | China Resources Gas Group Ltd. | 12,447,074 | 47,991 |
| | Anhui Conch Cement Co. Ltd. Class H | 16,405,266 | 47,655 |
| | Industrial Bank Co. Ltd. Class A | 18,521,979 | 47,611 |
| *,2 | JD Logistics Inc. | 23,392,776 | 47,602 |
| *,1 | Midea Group Co. Ltd. | 5,010,025 | 47,077 |
| | BYD Electronic International Co. Ltd. | 10,786,874 | 46,226 |
| | China Galaxy Securities Co. Ltd. Class H | 51,859,033 | 46,164 |
| | East Money Information Co. Ltd. Class A | 14,150,143 | 46,070 |
| | CMOC Group Ltd. Class H | 55,149,170 | 45,651 |
| | Sinopharm Group Co. Ltd. Class H | 17,522,127 | 43,653 |
| | Zijin Mining Group Co. Ltd. Class A | 18,308,467 | 42,946 |
| 2 | Haidilao International Holding Ltd. | 21,259,310 | 42,878 |
| 2 | Giant Biogene Holding Co. Ltd. | 6,261,400 | 42,467 |
| 2 | China Feihe Ltd. | 56,249,189 | 42,454 |
| * | Kingdee International Software Group Co. Ltd. | 40,339,286 | 42,229 |
Total International Stock Index Fund
| | | | | | Shares | Market
Value•
($000) |
| | CITIC Securities Co. Ltd. Class A | 10,663,173 | 42,076 |
| * | Zai Lab Ltd. | 13,590,720 | 41,440 |
| | China Longyuan Power Group Corp. Ltd. Class H | 46,450,772 | 41,304 |
| * | Alibaba Health Information Technology Ltd. | 81,367,919 | 41,149 |
| | Weichai Power Co. Ltd. Class H | 27,176,364 | 41,065 |
| | Shenzhen Mindray Bio-Medical Electronics Co. Ltd. Class A | 1,082,587 | 40,560 |
| | Haitong Securities Co. Ltd. Class H | 48,683,319 | 40,549 |
| | Kingsoft Corp. Ltd. | 11,455,300 | 39,478 |
| | Tingyi Cayman Islands Holding Corp. | 26,015,630 | 37,954 |
| 2 | China International Capital Corp. Ltd. Class H | 20,774,822 | 37,546 |
| | Hygon Information Technology Co. Ltd. Class A | 2,076,254 | 37,445 |
| | Foxconn Industrial Internet Co. Ltd. Class A | 11,131,905 | 37,335 |
| | Jiangsu Hengrui Pharmaceuticals Co. Ltd. Class A | 5,688,378 | 37,315 |
| | Tongcheng Travel Holdings Ltd. | 16,479,419 | 37,284 |
| *,2 | Zhejiang Leapmotor Technology Co. Ltd. | 9,421,300 | 37,192 |
| | Zhaojin Mining Industry Co. Ltd. Class H | 20,862,192 | 36,560 |
| | CRRC Corp. Ltd. Class H | 55,977,034 | 36,232 |
| | China State Construction International Holdings Ltd. | 24,614,645 | 36,128 |
| | China Coal Energy Co. Ltd. Class H | 28,822,441 | 35,955 |
| | Shanghai Pudong Development Bank Co. Ltd. Class A | 25,919,072 | 35,911 |
| | China Shenhua Energy Co. Ltd. Class A | 6,299,766 | 35,458 |
| | Aluminum Corp. of China Ltd. Class H | 55,618,012 | 35,437 |
| | New China Life Insurance Co. Ltd. Class H | 10,415,732 | 35,151 |
| | Bank of Communications Co. Ltd. Class A | 35,105,997 | 35,106 |
| | China Gas Holdings Ltd. | 40,829,553 | 35,063 |
| | China Taiping Insurance Holdings Co. Ltd. | 20,205,893 | 34,804 |
| 2 | China Resources Mixc Lifestyle Services Ltd. | 8,151,890 | 33,630 |
| | China Petroleum & Chemical Corp. Class A | 38,641,536 | 33,578 |
| | China Minsheng Banking Corp. Ltd. Class H | 88,842,717 | 32,998 |
| | Inner Mongolia Yitai Coal Co. Ltd. Class B | 14,229,556 | 32,987 |
| 2 | Smoore International Holdings Ltd. | 25,221,246 | 32,928 |
| 2 | Huatai Securities Co. Ltd. Class H | 19,306,905 | 32,680 |
| | China Pacific Insurance Group Co. Ltd. Class A | 6,140,975 | 31,779 |
| | Huaneng Power International Inc. Class H | 59,018,098 | 31,622 |
| | China State Construction Engineering Corp. Ltd. Class A | 37,177,838 | 31,489 |
| 2 | Hansoh Pharmaceutical Group Co. Ltd. | 13,407,836 | 31,261 |
| | Shanxi Xinghuacun Fen Wine Factory Co. Ltd. Class A | 1,087,852 | 30,734 |
| 2 | WuXi AppTec Co. Ltd. Class H | 4,602,771 | 30,610 |
| | Xinyi Solar Holdings Ltd. | 59,663,252 | 30,599 |
| | Shaanxi Coal Industry Co. Ltd. Class A | 8,641,910 | 29,989 |
| * | Muyuan Foods Co. Ltd. Class A | 4,864,409 | 29,850 |
| | Wanhua Chemical Group Co. Ltd. Class A | 2,801,183 | 29,655 |
| * | GDS Holdings Ltd. Class A | 10,978,686 | 29,609 |
| *,1 | China Vanke Co. Ltd. Class H | 31,094,661 | 29,604 |
| *,1 | Sunac China Holdings Ltd. | 83,803,000 | 29,307 |
| | China Merchants Port Holdings Co. Ltd. | 17,499,261 | 28,778 |
| | Zhuzhou CRRC Times Electric Co. Ltd. Class H | 7,379,118 | 28,317 |
| | Jiangxi Copper Co. Ltd. Class H | 16,698,420 | 28,089 |
| | China Railway Group Ltd. Class H | 55,954,618 | 27,922 |
| | Ping An Bank Co. Ltd. Class A | 17,388,113 | 27,846 |
| 2 | Yadea Group Holdings Ltd. | 16,120,488 | 27,844 |
| | Bosideng International Holdings Ltd. | 49,414,417 | 27,709 |
| *,1 | China Ruyi Holdings Ltd. | 112,687,121 | 27,670 |
| * | Genscript Biotech Corp. | 17,880,403 | 27,349 |
| | Bank of China Ltd. Class A | 40,165,200 | 27,220 |
| | SF Holding Co. Ltd. Class A | 4,320,781 | 27,172 |
| | China National Building Material Co. Ltd. Class H | 63,827,010 | 27,155 |
| | Foshan Haitian Flavouring & Food Co. Ltd. Class A | 4,388,635 | 27,018 |
| | China Power International Development Ltd. | 62,306,568 | 26,748 |
| | NARI Technology Co. Ltd. Class A | 7,191,318 | 26,277 |
| | NAURA Technology Group Co. Ltd. Class A | 475,408 | 26,170 |
| | ZTE Corp. Class H | 10,488,128 | 26,104 |
| | Guangdong Investment Ltd. | 40,879,201 | 26,023 |
| | Anhui Gujing Distillery Co. Ltd. Class B | 1,686,523 | 25,822 |
| | CRRC Corp. Ltd. Class A | 21,901,800 | 25,598 |
| | PetroChina Co. Ltd. Class A | 22,430,270 | 25,508 |
| | Luzhou Laojiao Co. Ltd. Class A | 1,318,961 | 25,148 |
| * | HUTCHMED China Ltd. | 6,866,983 | 25,039 |
| | Chinasoft International Ltd. | 34,200,258 | 25,014 |
| | Hengan International Group Co. Ltd. | 8,466,007 | 24,999 |
Total International Stock Index Fund
| | | | | | Shares | Market
Value•
($000) |
| | Sinotruk Hong Kong Ltd. | 9,251,475 | 24,970 |
| | Kingboard Holdings Ltd. | 10,145,740 | 24,568 |
| | China Everbright Environment Group Ltd. | 50,305,687 | 24,361 |
| 1 | MINISO Group Holding Ltd. | 4,814,516 | 24,127 |
| * | Cambricon Technologies Corp. Ltd. Class A | 372,589 | 23,729 |
| | China Oilfield Services Ltd. Class H | 25,277,043 | 23,651 |
| | COSCO SHIPPING Holdings Co. Ltd. Class A | 11,403,336 | 23,359 |
| 2 | Hua Hong Semiconductor Ltd. | 8,257,895 | 23,096 |
| | Autohome Inc. ADR | 813,179 | 22,850 |
| 1 | China Cinda Asset Management Co. Ltd. Class H | 118,435,397 | 22,849 |
| | Haier Smart Home Co. Ltd. Class A | 5,519,194 | 22,682 |
| | Greentown China Holdings Ltd. | 16,921,250 | 22,413 |
| | Haitian International Holdings Ltd. | 8,049,058 | 22,264 |
| | Inner Mongolia Yili Industrial Group Co. Ltd. Class A | 5,622,578 | 22,097 |
| | GF Securities Co. Ltd. Class H | 15,531,386 | 22,064 |
| | Gree Electric Appliances Inc. of Zhuhai Class A | 3,596,083 | 22,002 |
| * | Seres Group Co. Ltd. Class A | 1,342,000 | 21,990 |
| | Beijing Enterprises Holdings Ltd. | 6,639,413 | 21,753 |
| | Country Garden Services Holdings Co. Ltd. | 28,621,942 | 21,567 |
| | Bank of Ningbo Co. Ltd. Class A | 5,924,042 | 21,299 |
| | China National Nuclear Power Co. Ltd. Class A | 15,034,231 | 21,242 |
| | BOE Technology Group Co. Ltd. Class A | 31,773,000 | 20,854 |
| | China CSSC Holdings Ltd. Class A | 3,991,264 | 20,607 |
| | Bank of Jiangsu Co. Ltd. Class A | 16,491,204 | 20,436 |
| *,2 | China Literature Ltd. | 5,618,877 | 20,287 |
| | Shandong Weigao Group Medical Polymer Co. Ltd. Class H | 32,471,750 | 20,207 |
| | China CITIC Bank Corp. Ltd. Class A | 21,956,677 | 20,176 |
| | China Everbright Bank Co. Ltd. Class A | 40,433,709 | 19,615 |
| | Sany Heavy Industry Co. Ltd. Class A | 7,593,265 | 19,493 |
| | Beijing-Shanghai High Speed Railway Co. Ltd. Class A | 25,406,557 | 19,388 |
| *,2 | ZhongAn Online P&C Insurance Co. Ltd. Class H | 10,462,046 | 18,873 |
| | Atour Lifestyle Holdings Ltd. ADR | 720,219 | 18,870 |
| | AviChina Industry & Technology Co. Ltd. Class H | 35,072,655 | 18,839 |
| | LONGi Green Energy Technology Co. Ltd. Class A | 6,755,288 | 18,762 |
| 2 | 3SBio Inc. | 24,974,141 | 18,733 |
| | Yuexiu Property Co. Ltd. | 22,618,657 | 18,712 |
| | Shenzhen Inovance Technology Co. Ltd. Class A | 2,393,614 | 18,689 |
| *,2 | China CITIC Financial Asset Management Co. Ltd. Class H | 215,060,000 | 18,466 |
| | Chongqing Rural Commercial Bank Co. Ltd. Class H | 33,918,778 | 18,395 |
| | Shanghai Pharmaceuticals Holding Co. Ltd. Class H | 11,883,576 | 18,367 |
| | TravelSky Technology Ltd. Class H | 13,085,068 | 18,340 |
| | China Conch Venture Holdings Ltd. | 19,750,534 | 18,295 |
| | Far East Horizon Ltd. | 25,919,309 | 18,177 |
| | China Merchants Securities Co. Ltd. Class A | 6,678,922 | 18,070 |
| *,2 | Tuhu Car Inc. Class A | 6,883,000 | 18,053 |
| 2 | Shandong Gold Mining Co. Ltd. Class H | 9,107,350 | 18,042 |
| * | Minth Group Ltd. | 9,870,408 | 18,038 |
| | C&D International Investment Group Ltd. | 9,521,833 | 18,018 |
| | China Communications Services Corp. Ltd. Class H | 33,499,501 | 17,998 |
| | Hisense Home Appliances Group Co. Ltd. Class H | 5,584,133 | 17,692 |
| | Tongwei Co. Ltd. Class A | 4,067,484 | 17,635 |
| | China United Network Communications Ltd. Class A | 25,078,500 | 17,588 |
| | Zhangzhou Pientzehuang Pharmaceutical Co. Ltd. Class A | 532,356 | 17,566 |
| | RLX Technology Inc. ADR | 10,754,812 | 17,423 |
| *,2 | Ascentage Pharma Group International | 3,135,228 | 17,419 |
| | Jiangsu Expressway Co. Ltd. Class H | 17,239,059 | 17,347 |
| | Luxshare Precision Industry Co. Ltd. Class A | 2,914,751 | 17,173 |
| | Aier Eye Hospital Group Co. Ltd. Class A | 8,436,084 | 17,163 |
| | China Medical System Holdings Ltd. | 17,136,045 | 17,140 |
| | Guotai Junan Securities Co. Ltd. Class A | 6,399,400 | 17,064 |
| | COSCO SHIPPING Energy Transportation Co. Ltd. Class H | 17,822,543 | 17,058 |
| | Zhongji Innolight Co. Ltd. Class A | 856,190 | 16,918 |
| | China Minsheng Banking Corp. Ltd. Class A | 31,805,700 | 16,900 |
| | China Railway Group Ltd. Class A | 18,616,400 | 16,780 |
| | WuXi AppTec Co. Ltd. Class A | 2,289,896 | 16,751 |
| | Dongyue Group Ltd. | 20,527,811 | 16,731 |
| | Fosun International Ltd. | 29,353,006 | 16,665 |
| | Shenzhen International Holdings Ltd. | 19,464,334 | 16,525 |
| | Will Semiconductor Co. Ltd. Shanghai Class A | 1,095,341 | 16,478 |
| | Beijing Enterprises Water Group Ltd. | 55,118,578 | 16,411 |
Total International Stock Index Fund
| | | | | | Shares | Market
Value•
($000) |
| | Poly Developments & Holdings Group Co. Ltd. Class A | 10,771,825 | 16,380 |
| 2 | China Resources Pharmaceutical Group Ltd. | 23,042,203 | 16,298 |
| 1,2 | Guotai Junan Securities Co. Ltd. Class H | 11,088,158 | 16,245 |
| *,1 | iQIYI Inc. ADR | 6,207,133 | 16,201 |
| | CSC Financial Co. Ltd. Class A | 4,518,060 | 16,150 |
| 1 | Guangzhou Automobile Group Co. Ltd. Class H | 44,871,508 | 15,729 |
| | Shenwan Hongyuan Group Co. Ltd. Class A | 21,018,432 | 15,723 |
| | Shanghai Baosight Software Co. Ltd. Class B | 10,273,178 | 15,550 |
| * | China Gold International Resources Corp. Ltd. | 3,323,700 | 15,513 |
| 1 | JinkoSolar Holding Co. Ltd. ADR | 582,596 | 15,474 |
| | ZTE Corp. Class A | 3,643,864 | 15,465 |
| | Wens Foodstuff Group Co. Ltd. Class A | 5,892,459 | 15,431 |
| 1,2 | CSC Financial Co. Ltd. Class H | 12,759,945 | 15,217 |
| 2 | Ganfeng Lithium Group Co. Ltd. Class H | 5,539,589 | 15,197 |
| | China Everbright Bank Co. Ltd. Class H | 44,911,762 | 15,181 |
| | Baoshan Iron & Steel Co. Ltd. Class A | 16,510,744 | 15,152 |
| *,2 | Keymed Biosciences Inc. | 2,832,291 | 15,102 |
| | Uni-President China Holdings Ltd. | 16,134,074 | 15,101 |
| | Advanced Micro-Fabrication Equipment Inc. China Class A | 558,611 | 15,089 |
| | Zhejiang Expressway Co. Ltd. Class H | 22,769,562 | 15,086 |
| 1,2 | Jinxin Fertility Group Ltd. | 33,914,515 | 15,045 |
| | Bank of Beijing Co. Ltd. Class A | 18,927,614 | 15,044 |
| | Jiangsu Yanghe Distillery Co. Ltd. Class A | 1,323,167 | 14,961 |
| | China Three Gorges Renewables Group Co. Ltd. Class A | 22,287,900 | 14,899 |
| | Huatai Securities Co. Ltd. Class A | 6,004,000 | 14,879 |
| | Postal Savings Bank of China Co. Ltd. Class A | 20,276,173 | 14,862 |
| | Beijing Kingsoft Office Software Inc. Class A | 410,003 | 14,823 |
| | China Jinmao Holdings Group Ltd. | 94,851,558 | 14,725 |
| | Daqin Railway Co. Ltd. Class A | 15,809,600 | 14,475 |
| | AECC Aviation Power Co. Ltd. Class A | 2,387,206 | 14,352 |
| | Shanghai Fosun Pharmaceutical Group Co. Ltd. Class H | 7,509,382 | 14,280 |
| | Sinopec Engineering Group Co. Ltd. Class H | 20,565,326 | 14,280 |
| | Zoomlion Heavy Industry Science & Technology Co. Ltd. Class H | 20,968,924 | 14,264 |
| | SDIC Power Holdings Co. Ltd. Class A | 6,661,603 | 14,245 |
| | Huaxia Bank Co. Ltd. Class A | 14,236,134 | 14,149 |
| | Sungrow Power Supply Co. Ltd. Class A | 1,109,671 | 14,143 |
| *,1 | Daqo New Energy Corp. ADR | 623,054 | 14,069 |
| | Lens Technology Co. Ltd. Class A | 4,437,193 | 14,008 |
| *,2 | Cloud Music Inc. | 874,650 | 13,997 |
| | Hithink RoyalFlush Information Network Co. Ltd. Class A | 485,031 | 13,989 |
| | Fuyao Glass Industry Group Co. Ltd. Class A | 1,747,900 | 13,986 |
| | Zhongsheng Group Holdings Ltd. | 9,074,397 | 13,955 |
| | Anhui Conch Cement Co. Ltd. Class A | 3,708,300 | 13,946 |
| | Bank of Shanghai Co. Ltd. Class A | 12,760,260 | 13,911 |
| | China Overseas Property Holdings Ltd. | 17,847,294 | 13,722 |
| *,1 | Air China Ltd. Class H | 24,376,218 | 13,719 |
| | Hello Group Inc. Class A ADR | 1,934,292 | 13,675 |
| | Chongqing Changan Automobile Co. Ltd. Class A | 7,325,657 | 13,636 |
| * | JOYY Inc. ADR | 398,471 | 13,568 |
| | Haitong Securities Co. Ltd. Class A | 8,175,400 | 13,546 |
| | SAIC Motor Corp. Ltd. Class A | 7,433,276 | 13,449 |
| | Iflytek Co. Ltd. Class A | 2,069,250 | 13,328 |
| 2 | Meitu Inc. | 39,107,704 | 13,289 |
| | Focus Media Information Technology Co. Ltd. Class A | 13,038,872 | 13,217 |
| 2 | Topsports International Holdings Ltd. | 39,311,479 | 13,098 |
| | Brilliance China Automotive Holdings Ltd. | 40,278,000 | 13,001 |
| | China Nonferrous Mining Corp. Ltd. | 18,232,316 | 12,928 |
| | China Galaxy Securities Co. Ltd. Class A | 6,235,319 | 12,765 |
| | China Merchants Shekou Industrial Zone Holdings Co. Ltd. Class A | 8,013,900 | 12,737 |
| | TCL Technology Group Corp. Class A | 17,017,440 | 12,682 |
| | Kingboard Laminates Holdings Ltd. | 14,537,229 | 12,633 |
| 1 | Flat Glass Group Co. Ltd. Class H | 6,170,777 | 12,575 |
| | Shandong Gold Mining Co. Ltd. Class A | 3,399,585 | 12,510 |
| * | Shanghai Electric Group Co. Ltd. Class A | 9,809,935 | 12,434 |
| | Eve Energy Co. Ltd. Class A | 1,820,258 | 12,426 |
| * | Qinghai Salt Lake Industry Co. Ltd. Class A | 4,866,266 | 12,272 |
| | Aluminum Corp. of China Ltd. Class A | 11,393,700 | 12,204 |
| | New China Life Insurance Co. Ltd. Class A | 1,795,591 | 12,118 |
| | Power Construction Corp. of China Ltd. Class A | 15,505,502 | 12,007 |
| | Sinotrans Ltd. Class H | 26,700,079 | 11,929 |
Total International Stock Index Fund
| | | | | | Shares | Market
Value•
($000) |
| | Rongsheng Petrochemical Co. Ltd. Class A | 8,956,364 | 11,870 |
| | Yunnan Baiyao Group Co. Ltd. Class A | 1,469,935 | 11,807 |
| | Kuang-Chi Technologies Co. Ltd. Class A | 1,970,100 | 11,737 |
| *,1 | Alibaba Pictures Group Ltd. | 188,301,139 | 11,731 |
| | Fufeng Group Ltd. | 20,722,124 | 11,707 |
| | Xtep International Holdings Ltd. | 15,783,841 | 11,706 |
| | XCMG Construction Machinery Co. Ltd. Class A | 10,686,964 | 11,653 |
| | Yihai International Holding Ltd. | 6,515,377 | 11,611 |
| *,1 | Shanghai Electric Group Co. Ltd. Class H | 35,926,589 | 11,583 |
| *,2 | Ping An Healthcare & Technology Co. Ltd. | 7,791,535 | 11,552 |
| *,1,2 | East Buy Holding Ltd. | 5,994,841 | 11,445 |
| | Weichai Power Co. Ltd. Class A | 6,045,900 | 11,351 |
| | China Suntien Green Energy Corp. Ltd. Class H | 24,871,313 | 11,315 |
| | Anhui Jianghuai Automobile Group Corp. Ltd. Class A | 1,961,600 | 11,289 |
| | GF Securities Co. Ltd. Class A | 4,941,388 | 11,248 |
| | Grand Pharmaceutical Group Ltd. | 19,040,903 | 11,160 |
| *,1 | Seazen Group Ltd. | 36,894,348 | 11,144 |
| 1 | Huadian Power International Corp. Ltd. Class H | 22,340,209 | 11,100 |
| | China Reinsurance Group Corp. Class H | 92,540,308 | 11,023 |
| | Lao Feng Xiang Co. Ltd. Class B | 3,113,572 | 10,960 |
| | GD Power Development Co. Ltd. Class A | 16,100,270 | 10,953 |
| * | China Vanke Co. Ltd. Class A | 8,363,038 | 10,935 |
| *,2 | Hygeia Healthcare Holdings Co. Ltd. | 4,823,848 | 10,908 |
| | FinVolution Group ADR | 1,793,639 | 10,869 |
| * | Sichuan Kelun-Biotech Biopharmaceutical Co. Ltd. | 487,600 | 10,827 |
| | Shanghai International Airport Co. Ltd. Class A | 2,191,136 | 10,770 |
| 1,2 | China Merchants Securities Co. Ltd. Class H | 6,308,025 | 10,728 |
| | Greentown Service Group Co. Ltd. | 19,968,059 | 10,492 |
| | China Zheshang Bank Co. Ltd. Class H | 37,772,000 | 10,491 |
| *,1 | Microport Scientific Corp. | 12,660,139 | 10,486 |
| 1,2 | China Tourism Group Duty Free Corp. Ltd. Class H | 1,529,800 | 10,446 |
| | Tianli International Holdings Ltd. | 17,095,057 | 10,371 |
| | Yankuang Energy Group Co. Ltd. Class A | 4,783,155 | 10,370 |
| * | China Traditional Chinese Medicine Holdings Co. Ltd. | 33,855,682 | 10,365 |
| * | China Southern Airlines Co. Ltd. Class H | 23,662,505 | 10,343 |
| *,1 | Canadian Solar Inc. | 724,814 | 10,321 |
| | Bank of Hangzhou Co. Ltd. Class A | 5,270,504 | 10,271 |
| | Sichuan Chuantou Energy Co. Ltd. Class A | 4,339,276 | 10,211 |
| | Eoptolink Technology Inc. Ltd. Class A | 559,258 | 10,140 |
| | Gushengtang Holdings Ltd. | 2,157,296 | 10,138 |
| | China Energy Engineering Corp. Ltd. Class A | 30,615,038 | 10,072 |
| | Henan Shuanghui Investment & Development Co. Ltd. Class A | 2,843,980 | 9,952 |
| *,1 | EHang Holdings Ltd. ADR | 583,408 | 9,935 |
| | China Northern Rare Earth Group High-Tech Co. Ltd. Class A | 3,297,800 | 9,928 |
| | Orient Securities Co. Ltd. Class A | 6,678,515 | 9,887 |
| | GoerTek Inc. Class A | 3,005,986 | 9,868 |
| | China Merchants Expressway Network & Technology Holdings Co. Ltd. Class A | 6,033,228 | 9,855 |
| | Dongfeng Motor Group Co. Ltd. Class H | 31,880,225 | 9,829 |
| | Chongqing Changan Automobile Co. Ltd. Class B | 21,773,899 | 9,807 |
| | Sichuan Changhong Electric Co. Ltd. Class A | 4,222,100 | 9,771 |
| | WUS Printed Circuit Kunshan Co. Ltd. Class A | 1,721,450 | 9,767 |
| | Yangzijiang Financial Holding Ltd. | 32,218,058 | 9,738 |
| | Montage Technology Co. Ltd. Class A | 1,006,331 | 9,666 |
| * | Nine Dragons Paper Holdings Ltd. | 22,071,711 | 9,612 |
| | Shanghai Industrial Holdings Ltd. | 6,293,014 | 9,598 |
| | Anhui Gujing Distillery Co. Ltd. Class A | 360,637 | 9,569 |
| *,2 | Luye Pharma Group Ltd. | 26,601,039 | 9,555 |
| * | ANE Cayman Inc. | 8,886,500 | 9,551 |
| * | China Southern Airlines Co. Ltd. Class A | 10,981,500 | 9,520 |
| | COSCO SHIPPING Ports Ltd. | 16,529,910 | 9,453 |
| | SSY Group Ltd. | 19,432,411 | 9,434 |
| | People's Insurance Co. Group of China Ltd. Class A | 9,375,299 | 9,370 |
| | China Construction Bank Corp. Class A | 8,395,301 | 9,364 |
| | China Water Affairs Group Ltd. | 15,345,909 | 9,352 |
| | China Datang Corp. Renewable Power Co. Ltd. Class H | 32,273,753 | 9,288 |
| | Guangdong Haid Group Co. Ltd. Class A | 1,505,358 | 9,286 |
| | Chaozhou Three-Circle Group Co. Ltd. Class A | 1,773,850 | 9,263 |
| | Shanghai Lujiazui Finance & Trade Zone Development Co. Ltd. Class B | 15,104,278 | 9,196 |
| | Weibo Corp. ADR | 1,015,478 | 9,190 |
| * | Beijing Capital International Airport Co. Ltd. Class H | 25,232,191 | 9,171 |
Total International Stock Index Fund
| | | | | | Shares | Market
Value•
($000) |
| | JCET Group Co. Ltd. Class A | 1,634,581 | 9,118 |
| | Ningbo Tuopu Group Co. Ltd. Class A | 1,494,061 | 9,080 |
| | TBEA Co. Ltd. Class A | 4,551,899 | 9,042 |
| 2 | Simcere Pharmaceutical Group Ltd. | 9,989,248 | 9,013 |
| | Great Wall Motor Co. Ltd. Class A | 2,431,064 | 8,952 |
| | Founder Securities Co. Ltd. Class A | 7,301,770 | 8,879 |
| | China Education Group Holdings Ltd. | 14,224,248 | 8,877 |
| | Shougang Fushan Resources Group Ltd. | 24,438,233 | 8,839 |
| | Suzhou TFC Optical Communication Co. Ltd. Class A | 495,212 | 8,833 |
| | Everbright Securities Co. Ltd. Class A | 3,623,200 | 8,823 |
| | Goldwind Science & Technology Co. Ltd. Class H | 10,354,863 | 8,796 |
| 2 | China Railway Signal & Communication Corp. Ltd. Class H | 21,214,444 | 8,744 |
| | IEIT Systems Co. Ltd. Class A | 1,334,452 | 8,725 |
| 2 | BAIC Motor Corp. Ltd. Class H | 31,586,954 | 8,723 |
| | Zhejiang NHU Co. Ltd. Class A | 2,727,620 | 8,694 |
| | Shanghai Fudan Microelectronics Group Co. Ltd. Class H | 4,052,863 | 8,631 |
| | China Coal Energy Co. Ltd. Class A | 4,700,254 | 8,559 |
| | 360 Security Technology Inc. Class A | 6,269,491 | 8,520 |
| * | Inner Mongolia BaoTou Steel Union Co. Ltd. Class A | 35,245,985 | 8,469 |
| *,1,2,3 | New Horizon Health Ltd. | 4,645,117 | 8,449 |
| | Zhongjin Gold Corp. Ltd. Class A | 4,244,085 | 8,432 |
| | Chongqing Zhifei Biological Products Co. Ltd. Class A | 2,110,673 | 8,426 |
| | China Energy Engineering Corp. Ltd. Class H | 61,836,185 | 8,342 |
| *,2 | InnoCare Pharma Ltd. | 9,743,135 | 8,288 |
| | CMOC Group Ltd. Class A | 7,806,900 | 8,287 |
| | Sanan Optoelectronics Co. Ltd. Class A | 4,264,581 | 8,220 |
| | Onewo Inc. Class H | 2,781,200 | 8,207 |
| | Jinko Solar Co. Ltd. Class A | 6,155,560 | 8,204 |
| * | Air China Ltd. Class A | 7,937,500 | 8,187 |
| | Isoftstone Information Technology Group Co. Ltd. Class A | 858,178 | 8,164 |
| | Satellite Chemical Co. Ltd. Class A | 3,035,848 | 8,069 |
| * | XD Inc. | 3,004,836 | 8,067 |
| * | Jiangsu Hoperun Software Co. Ltd. Class A | 797,700 | 8,065 |
| | Poly Property Services Co. Ltd. Class H | 1,937,572 | 8,046 |
| | National Silicon Industry Group Co. Ltd. Class A | 2,545,348 | 8,014 |
| | Sany Heavy Equipment International Holdings Co. Ltd. | 12,150,124 | 7,969 |
| | Yihai Kerry Arawana Holdings Co. Ltd. Class A | 1,732,300 | 7,934 |
| 1,2 | Pharmaron Beijing Co. Ltd. Class H | 4,096,470 | 7,924 |
| 2 | Blue Moon Group Holdings Ltd. | 20,398,772 | 7,923 |
| | Shenzhen Expressway Corp. Ltd. Class H | 8,724,965 | 7,918 |
| | Lingyi iTech Guangdong Co. Class A | 6,246,400 | 7,873 |
| | Sun Art Retail Group Ltd. | 26,747,328 | 7,872 |
| | Huaneng Lancang River Hydropower Inc. Class A | 5,734,200 | 7,854 |
| *,1 | DingDong Cayman Ltd. ADR | 1,962,811 | 7,851 |
| | China Resources Building Materials Technology Holdings Ltd. | 30,355,498 | 7,850 |
| | Shanghai International Port Group Co. Ltd. Class A | 9,356,000 | 7,836 |
| | Metallurgical Corp. of China Ltd. Class H | 36,406,697 | 7,818 |
| 2 | Orient Securities Co. Ltd. Class H | 11,723,698 | 7,814 |
| | Anhui Expressway Co. Ltd. Class H | 7,003,025 | 7,803 |
| | Citic Pacific Special Steel Group Co. Ltd. Class A | 4,579,988 | 7,799 |
| | China Tobacco International HK Co. Ltd. | 2,408,123 | 7,795 |
| | Shanghai Fosun Pharmaceutical Group Co. Ltd. Class A | 2,074,399 | 7,755 |
| * | GigaDevice Semiconductor Inc. Class A | 614,061 | 7,749 |
| | Jiangsu Hengli Hydraulic Co. Ltd. Class A | 1,063,952 | 7,740 |
| | Sinopec Kantons Holdings Ltd. | 13,930,714 | 7,673 |
| * | OFILM Group Co. Ltd. Class A | 3,062,214 | 7,571 |
| | Ningbo Deye Technology Co. Ltd. Class A | 568,026 | 7,562 |
| * | China Eastern Airlines Corp. Ltd. Class A | 14,001,200 | 7,560 |
| | China International Marine Containers Group Co. Ltd. Class H | 9,597,716 | 7,557 |
| | China Everbright Ltd. | 11,604,287 | 7,549 |
| * | COFCO Joycome Foods Ltd. | 38,069,541 | 7,533 |
| * | Shijiazhuang Changshan BeiMing Technology Co. Ltd. Class A | 1,453,486 | 7,520 |
| 2 | Shenwan Hongyuan Group Co. Ltd. Class H | 23,610,400 | 7,520 |
| | Huizhou Desay Sv Automotive Co. Ltd. Class A | 439,319 | 7,510 |
| | Tianneng Power International Ltd. | 9,235,375 | 7,503 |
| | Sieyuan Electric Co. Ltd. Class A | 694,800 | 7,462 |
| | Datang International Power Generation Co. Ltd. Class H | 38,038,302 | 7,424 |
| 1,2 | Hangzhou Tigermed Consulting Co. Ltd. Class H | 1,644,017 | 7,423 |
| | China Resources Sanjiu Medical & Pharmaceutical Co. Ltd. Class A | 1,165,201 | 7,379 |
| | Guangzhou Baiyunshan Pharmaceutical Holdings Co. Ltd. Class H | 3,131,267 | 7,378 |
Total International Stock Index Fund
| | | | | | Shares | Market
Value•
($000) |
| * | Hainan Airlines Holding Co. Ltd. Class A | 37,691,522 | 7,327 |
| | Ganfeng Lithium Group Co. Ltd. Class A | 1,534,351 | 7,324 |
| * | Sinopec Shanghai Petrochemical Co. Ltd. Class H | 47,433,906 | 7,321 |
| *,1 | Xinte Energy Co. Ltd. Class H | 5,262,205 | 7,308 |
| | Huadong Medicine Co. Ltd. Class A | 1,573,263 | 7,307 |
| | Zhejiang China Commodities City Group Co. Ltd. Class A | 4,863,800 | 7,298 |
| * | Tianfeng Securities Co. Ltd. Class A | 8,053,000 | 7,291 |
| | Zhejiang Juhua Co. Ltd. Class A | 2,460,546 | 7,239 |
| | Guosen Securities Co. Ltd. Class A | 4,454,452 | 7,224 |
| | Industrial Securities Co. Ltd. Class A | 7,826,910 | 7,184 |
| *,1,2 | Weimob Inc. | 34,549,666 | 7,173 |
| | CIMC Enric Holdings Ltd. | 8,464,208 | 7,143 |
| *,2 | Legend Holdings Corp. Class H | 7,240,053 | 7,103 |
| | Unigroup Guoxin Microelectronics Co. Ltd. Class A | 757,222 | 7,098 |
| | Metallurgical Corp. of China Ltd. Class A | 15,008,294 | 7,046 |
| | China Tourism Group Duty Free Corp. Ltd. Class A | 736,192 | 7,023 |
| * | China Eastern Airlines Corp. Ltd. Class H | 24,237,864 | 7,020 |
| | China Merchants Energy Shipping Co. Ltd. Class A | 7,379,300 | 6,971 |
| 1 | China Risun Group Ltd. | 16,527,094 | 6,969 |
| * | Loongson Technology Corp. Ltd. Class A | 357,643 | 6,922 |
| | Fu Shou Yuan International Group Ltd. | 13,494,420 | 6,853 |
| | Suzhou Dongshan Precision Manufacturing Co. Ltd. Class A | 1,549,400 | 6,822 |
| | Zhejiang Dahua Technology Co. Ltd. Class A | 2,955,493 | 6,817 |
| * | Hytera Communications Corp. Ltd. Class A | 1,706,400 | 6,802 |
| | Tianqi Lithium Corp. Class A | 1,348,590 | 6,790 |
| | Trina Solar Co. Ltd. Class A | 1,927,685 | 6,789 |
| | Sichuan Road & Bridge Group Co. Ltd. Class A | 6,307,070 | 6,784 |
| 1,2 | ZJLD Group Inc. | 7,172,600 | 6,775 |
| 2 | Genertec Universal Medical Group Co. Ltd. | 10,797,925 | 6,766 |
| 1 | Lufax Holding Ltd. ADR | 2,512,790 | 6,734 |
| | Zhejiang Huayou Cobalt Co. Ltd. Class A | 1,543,575 | 6,729 |
| *,1,3 | Country Garden Holdings Co. Ltd. | 179,595,898 | 6,723 |
| | ENN Natural Gas Co. Ltd. Class A | 2,599,663 | 6,706 |
| | Beijing New Building Materials plc Class A | 1,528,735 | 6,703 |
| | Beijing Tong Ren Tang Co. Ltd. Class A | 1,201,934 | 6,692 |
| | Jiangsu Zhongtian Technology Co. Ltd. Class A | 3,017,400 | 6,683 |
| | SPIC Industry-Finance Holdings Co. Ltd. Class A | 4,905,894 | 6,680 |
| | Wingtech Technology Co. Ltd. Class A | 1,087,146 | 6,651 |
| | Spring Airlines Co. Ltd. Class A | 859,500 | 6,648 |
| | Yutong Bus Co. Ltd. Class A | 1,950,400 | 6,643 |
| | COSCO SHIPPING Development Co. Ltd. Class H | 49,628,512 | 6,636 |
| | Jiangsu King's Luck Brewery JSC Ltd. Class A | 1,070,369 | 6,616 |
| | Consun Pharmaceutical Group Ltd. | 6,195,994 | 6,603 |
| | Zhejiang Sanhua Intelligent Controls Co. Ltd. Class A | 2,153,218 | 6,596 |
| * | Hopson Development Holdings Ltd. | 14,668,716 | 6,570 |
| | China Lesso Group Holdings Ltd. | 13,144,416 | 6,548 |
| | Huaneng Power International Inc. Class A | 6,414,876 | 6,545 |
| | Sichuan Kelun Pharmaceutical Co. Ltd. Class A | 1,448,731 | 6,541 |
| 3 | Hangzhou Steam Turbine Power Group Co. Ltd. Class B | 6,209,011 | 6,494 |
| | Shanghai Pharmaceuticals Holding Co. Ltd. Class A | 2,383,467 | 6,489 |
| | Zhejiang Zheneng Electric Power Co. Ltd. Class A | 7,844,900 | 6,476 |
| | TCL Electronics Holdings Ltd. | 9,103,213 | 6,461 |
| * | Hangzhou Silan Microelectronics Co. Ltd. Class A | 1,483,228 | 6,450 |
| *,2 | Bairong Inc. Class B | 5,073,500 | 6,437 |
| | TCL Zhonghuan Renewable Energy Technology Co. Ltd. Class A | 3,606,875 | 6,431 |
| | Hundsun Technologies Inc. Class A | 1,702,151 | 6,402 |
| | Livzon Pharmaceutical Group Inc. Class H | 1,898,205 | 6,392 |
| | Shanjin International Gold Co. Ltd. Class A | 2,530,518 | 6,377 |
| * | Lifetech Scientific Corp. | 29,502,619 | 6,338 |
| *,2 | YiChang HEC ChangJiang Pharmaceutical Co. Ltd. Class H | 5,576,264 | 6,337 |
| | Hangzhou Tigermed Consulting Co. Ltd. Class A | 715,980 | 6,335 |
| * | DPC Dash Ltd. | 775,700 | 6,324 |
| | Digital China Holdings Ltd. | 17,629,283 | 6,306 |
| | Guanghui Energy Co. Ltd. Class A | 5,873,900 | 6,305 |
| | Towngas Smart Energy Co. Ltd. | 15,307,733 | 6,300 |
| * | China Greatwall Technology Group Co. Ltd. Class A | 2,824,500 | 6,284 |
| | Imeik Technology Development Co. Ltd. Class A | 210,280 | 6,283 |
| * | Vnet Group Inc. ADR | 1,889,613 | 6,198 |
| | Shanghai RAAS Blood Products Co. Ltd. Class A | 5,981,479 | 6,189 |
| | China BlueChemical Ltd. Class H | 23,751,366 | 6,173 |
Total International Stock Index Fund
| | | | | | Shares | Market
Value•
($000) |
| | Bank of Nanjing Co. Ltd. Class A | 4,261,048 | 6,144 |
| | Dongfang Electric Corp. Ltd. Class H | 4,662,900 | 6,120 |
| | Kunlun Tech Co. Ltd. Class A | 1,073,145 | 6,114 |
| | Yunnan Aluminium Co. Ltd. Class A | 3,043,000 | 6,069 |
| | Sailun Group Co. Ltd. Class A | 2,972,743 | 6,054 |
| | Zoomlion Heavy Industry Science & Technology Co. Ltd. Class A | 6,192,699 | 6,052 |
| | Guangdong Provincial Expressway Development Co. Ltd. Class B | 6,554,536 | 6,043 |
| | COSCO SHIPPING Energy Transportation Co. Ltd. Class A | 3,278,000 | 6,034 |
| | Flat Glass Group Co. Ltd. Class A | 1,491,565 | 6,032 |
| | China Resources Microelectronics Ltd. Class A | 852,624 | 6,032 |
| | China National Chemical Engineering Co. Ltd. Class A | 5,303,743 | 6,031 |
| *,1 | Gaotu Techedu Inc. ADR | 1,956,571 | 6,026 |
| | Shandong Hualu Hengsheng Chemical Co. Ltd. Class A | 1,863,346 | 6,004 |
| | Shanxi Coking Coal Energy Group Co. Ltd. Class A | 5,162,407 | 5,976 |
| | Dongfang Electric Corp. Ltd. Class A | 2,691,600 | 5,966 |
| | Huayu Automotive Systems Co. Ltd. Class A | 2,808,305 | 5,958 |
| | China Overseas Grand Oceans Group Ltd. | 22,599,402 | 5,954 |
| | Skyworth Group Ltd. | 14,964,344 | 5,953 |
| | Zhejiang Jingsheng Mechanical & Electrical Co. Ltd. Class A | 1,172,425 | 5,934 |
| | Lee & Man Paper Manufacturing Ltd. | 19,089,016 | 5,889 |
| | YTO Express Group Co. Ltd. Class A | 2,549,659 | 5,883 |
| | Pharmaron Beijing Co. Ltd. Class A | 1,430,159 | 5,874 |
| | Tsingtao Brewery Co. Ltd. Class A | 622,358 | 5,866 |
| *,2 | Maoyan Entertainment | 5,856,777 | 5,866 |
| | Shengyi Technology Co. Ltd. Class A | 2,035,900 | 5,863 |
| | Maxscend Microelectronics Co. Ltd. Class A | 437,405 | 5,863 |
| | Inner Mongolia Dian Tou Energy Corp. Ltd. Class A | 2,073,204 | 5,855 |
| 2 | Qingdao Port International Co. Ltd. Class H | 8,288,832 | 5,807 |
| * | BAIC BluePark New Energy Technology Co. Ltd. Class A | 5,002,086 | 5,803 |
| | Mango Excellent Media Co. Ltd. Class A | 1,643,799 | 5,795 |
| | Bank of Chongqing Co. Ltd. Class H | 7,965,546 | 5,789 |
| | Poly Property Group Co. Ltd. | 26,771,730 | 5,777 |
| * | Zhongyu Energy Holdings Ltd. | 10,077,677 | 5,775 |
| | LB Group Co. Ltd. Class A | 2,159,900 | 5,723 |
| | Shandong Nanshan Aluminum Co. Ltd. Class A | 9,985,735 | 5,720 |
| | Tong Ren Tang Technologies Co. Ltd. Class H | 8,723,777 | 5,713 |
| | Inner Mongolia ERDOS Resources Co. Ltd. Class B | 6,551,040 | 5,697 |
| | China Jushi Co. Ltd. Class A | 3,558,388 | 5,654 |
| | Tianshui Huatian Technology Co. Ltd. Class A | 2,917,045 | 5,607 |
| | Hengli Petrochemical Co. Ltd. Class A | 2,900,320 | 5,601 |
| | Xinhua Winshare Publishing & Media Co. Ltd. Class H | 4,616,720 | 5,588 |
| * | New Hope Liuhe Co. Ltd. Class A | 4,050,887 | 5,583 |
| | CSG Holding Co. Ltd. Class B | 17,537,213 | 5,576 |
| | PAX Global Technology Ltd. | 8,379,609 | 5,552 |
| | Tongling Nonferrous Metals Group Co. Ltd. Class A | 11,660,306 | 5,549 |
| | Beijing Jingneng Clean Energy Co. Ltd. Class H | 22,655,492 | 5,526 |
| | Jiangxi Copper Co. Ltd. Class A | 1,810,801 | 5,517 |
| | Shanghai Zhangjiang High-Tech Park Development Co. Ltd. Class A | 1,366,800 | 5,496 |
| | Ming Yuan Cloud Group Holdings Ltd. | 15,819,192 | 5,490 |
| * | Yonghui Superstores Co. Ltd. Class A | 8,468,400 | 5,483 |
| | Chongqing Zongshen Power Machinery Co. Ltd. Class A | 1,152,295 | 5,453 |
| | JNBY Design Ltd. | 2,848,164 | 5,451 |
| | Canvest Environmental Protection Group Co. Ltd. | 9,755,428 | 5,443 |
| | Western Mining Co. Ltd. Class A | 2,200,367 | 5,439 |
| | Yealink Network Technology Corp. Ltd. Class A | 991,641 | 5,430 |
| 1,2 | Jiumaojiu International Holdings Ltd. | 12,535,535 | 5,413 |
| | Shanxi Lu'an Environmental Energy Development Co. Ltd. Class A | 2,641,216 | 5,412 |
| | Zhejiang Wanfeng Auto Wheel Co. Ltd. Class A | 1,852,600 | 5,385 |
| | Victory Giant Technology Huizhou Co. Ltd. Class A | 860,562 | 5,384 |
| | Shoucheng Holdings Ltd. | 40,336,332 | 5,384 |
| | China Railway Signal & Communication Corp. Ltd. Class A | 6,084,428 | 5,367 |
| | Beijing Roborock Technology Co. Ltd. Class A | 161,642 | 5,360 |
| | Beijing Tiantan Biological Products Corp. Ltd. Class A | 1,762,344 | 5,332 |
| * | Shenzhen Infogem Technologies Co. Ltd. Class A | 648,800 | 5,322 |
| | Goneo Group Co. Ltd. Class A | 519,347 | 5,321 |
| *,1 | Shanghai MicroPort MedBot Group Co. Ltd. | 4,816,500 | 5,321 |
| | NetDragon Websoft Holdings Ltd. | 4,073,129 | 5,306 |
| | China Oriental Group Co. Ltd. | 33,151,391 | 5,290 |
| | SooChow Securities Co. Ltd. Class A | 4,608,877 | 5,273 |
| | Changchun High-Tech Industry Group Co. Ltd. Class A | 359,073 | 5,263 |
Total International Stock Index Fund
| | | | | | Shares | Market
Value•
($000) |
| | China XD Electric Co. Ltd. Class A | 4,522,183 | 5,249 |
| | COFCO Capital Holdings Co. Ltd. Class A | 1,726,984 | 5,248 |
| | Huaibei Mining Holdings Co. Ltd. Class A | 2,411,112 | 5,242 |
| | Shanghai Belling Co. Ltd. Class A | 726,100 | 5,232 |
| | Guangshen Railway Co. Ltd. Class H | 18,829,193 | 5,229 |
| | Hengtong Optic-electric Co. Ltd. Class A | 2,139,860 | 5,211 |
| | Shenergy Co. Ltd. Class A | 4,293,600 | 5,205 |
| | SG Micro Corp. Class A | 415,370 | 5,202 |
| | Lonking Holdings Ltd. | 26,996,798 | 5,197 |
| | Sihuan Pharmaceutical Holdings Group Ltd. | 55,159,035 | 5,170 |
| | Shenzhen Goodix Technology Co. Ltd. Class A | 409,100 | 5,154 |
| | Changjiang Securities Co. Ltd. Class A | 5,169,432 | 5,134 |
| | First Capital Securities Co. Ltd. Class A | 4,252,600 | 5,133 |
| | TongFu Microelectronics Co. Ltd. Class A | 1,358,802 | 5,130 |
| | Yunnan Yuntianhua Co. Ltd. Class A | 1,585,273 | 5,130 |
| *,2 | China Bohai Bank Co. Ltd. Class H | 40,208,427 | 5,119 |
| * | Lifan Technology Group Co. Ltd. Class A | 4,819,400 | 5,115 |
| | Eastroc Beverage Group Co. Ltd. Class A | 171,080 | 5,096 |
| | Ningxia Baofeng Energy Group Co. Ltd. Class A | 2,269,000 | 5,069 |
| | Sunwoda Electronic Co. Ltd. Class A | 1,592,204 | 5,066 |
| | Huadian Power International Corp. Ltd. Class A | 6,238,600 | 5,058 |
| 2 | Sunac Services Holdings Ltd. | 20,281,708 | 5,027 |
| | Guoyuan Securities Co. Ltd. Class A | 4,218,740 | 5,023 |
| | GalaxyCore Inc. Class A | 2,301,465 | 4,983 |
| | Gotion High-tech Co. Ltd. Class A | 1,557,700 | 4,976 |
| 2 | Angelalign Technology Inc. | 632,678 | 4,971 |
| * | China National Software & Service Co. Ltd. Class A | 778,298 | 4,967 |
| | Shenzhen Transsion Holdings Co. Ltd. Class A | 369,177 | 4,945 |
| | Dong-E-E-Jiao Co. Ltd. Class A | 596,480 | 4,940 |
| | Concord New Energy Group Ltd. | 71,940,075 | 4,909 |
| | Henan Shenhuo Coal Industry & Electricity Power Co. Ltd. Class A | 1,950,900 | 4,898 |
| | SUPCON Technology Co. Ltd. Class A | 723,267 | 4,896 |
| | Huagong Tech Co. Ltd. Class A | 887,200 | 4,895 |
| * | Ninestar Corp. Class A | 1,234,664 | 4,883 |
| * | Yonyou Network Technology Co. Ltd. Class A | 3,053,285 | 4,876 |
| | Shandong Himile Mechanical Science & Technology Co. Ltd. Class A | 761,541 | 4,868 |
| * | Newborn Town Inc. | 9,988,747 | 4,855 |
| | Guangzhou Baiyunshan Pharmaceutical Holdings Co. Ltd. Class A | 1,230,716 | 4,834 |
| | Wuhan Guide Infrared Co. Ltd. Class A | 3,879,837 | 4,833 |
| | First Tractor Co. Ltd. Class H | 5,400,714 | 4,829 |
| | CNPC Capital Co. Ltd. Class A | 3,882,657 | 4,826 |
| | Ningbo Orient Wires & Cables Co. Ltd. Class A | 604,900 | 4,812 |
| | Ningbo Sanxing Medical Electric Co. Ltd. Class A | 1,105,200 | 4,805 |
| * | Fenbi Ltd. | 14,396,000 | 4,802 |
| * | CCOOP Group Co. Ltd. Class A | 17,516,100 | 4,798 |
| | Tianqi Lithium Corp. Class H | 1,427,800 | 4,770 |
| | Youngor Fashion Co. Ltd. Class A | 4,510,400 | 4,766 |
| | BOE Technology Group Co. Ltd. Class B | 12,351,229 | 4,764 |
| | COSCO SHIPPING Development Co. Ltd. Class A | 12,765,172 | 4,756 |
| | AVIC Industry-Finance Holdings Co. Ltd. Class A | 8,139,195 | 4,743 |
| * | Hainan Airport Infrastructure Co. Ltd. Class A | 9,541,639 | 4,726 |
| * | Yanlord Land Group Ltd. | 8,933,292 | 4,708 |
| | Accelink Technologies Co. Ltd. Class A | 735,000 | 4,697 |
| | APT Medical Inc. Class A | 89,672 | 4,686 |
| | Hwatsing Technology Co. Ltd. Class A | 172,977 | 4,679 |
| * | Talkweb Information System Co. Ltd. Class A | 1,235,783 | 4,670 |
| | China Shineway Pharmaceutical Group Ltd. | 3,929,854 | 4,658 |
| | Caitong Securities Co. Ltd. Class A | 3,984,290 | 4,631 |
| *,2 | Evergrande Property Services Group Ltd. | 44,413,000 | 4,598 |
| | Sichuan Expressway Co. Ltd. Class H | 11,293,253 | 4,593 |
| | Shanghai BOCHU Electronic Technology Corp. Ltd. Class A | 172,688 | 4,588 |
| | Guangzhou Tinci Materials Technology Co. Ltd. Class A | 1,721,252 | 4,582 |
| | Minmetals Capital Co. Ltd. Class A | 4,344,200 | 4,572 |
| | Shenzhen Kaifa Technology Co. Ltd. Class A | 1,380,450 | 4,565 |
| | CNGR Advanced Material Co. Ltd. Class A | 845,058 | 4,557 |
| | Wasion Holdings Ltd. | 6,020,000 | 4,555 |
| | Sichuan Development Lomon Co. Ltd. Class A | 1,709,150 | 4,544 |
| | CGN New Energy Holdings Co. Ltd. | 15,353,506 | 4,538 |
| | Western Securities Co. Ltd. Class A | 3,943,344 | 4,537 |
| *,1 | Guangzhou R&F Properties Co. Ltd. Class H | 22,872,575 | 4,533 |
Total International Stock Index Fund
| | | | | | Shares | Market
Value•
($000) |
| * | Zhejiang Century Huatong Group Co. Ltd. Class A | 6,807,400 | 4,519 |
| | Jiangsu Jiejie Microelectronics Co. Ltd. Class A | 721,761 | 4,514 |
| | Shenzhen Huaqiang Industry Co. Ltd. Class A | 831,330 | 4,504 |
| * | FIH Mobile Ltd. | 39,068,562 | 4,502 |
| | Dongxing Securities Co. Ltd. Class A | 2,900,222 | 4,485 |
| | Yuexiu REIT | 33,576,986 | 4,484 |
| | Huaxin Cement Co. Ltd. Class H | 4,142,072 | 4,464 |
| | Shanghai Putailai New Energy Technology Co. Ltd. Class A | 1,887,224 | 4,462 |
| | RoboTechnik Intelligent Technology Co. Ltd. Class A | 155,400 | 4,452 |
| | Shanghai Jinjiang International Hotels Co. Ltd. Class B | 2,940,433 | 4,427 |
| | Yuexiu Transport Infrastructure Ltd. | 9,002,245 | 4,418 |
| | West China Cement Ltd. | 29,628,756 | 4,417 |
| | Changzhou Xingyu Automotive Lighting Systems Co. Ltd. Class A | 228,060 | 4,399 |
| | Hoshine Silicon Industry Co. Ltd. Class A | 527,780 | 4,384 |
| | Piotech Inc. Class A | 193,982 | 4,384 |
| | Unisplendour Corp. Ltd. Class A | 1,193,152 | 4,380 |
| | Shanghai Baosight Software Co. Ltd. Class A | 1,158,371 | 4,376 |
| 2 | A-Living Smart City Services Co. Ltd. | 10,795,289 | 4,361 |
| *,2 | CanSino Biologics Inc. Class H | 1,197,102 | 4,351 |
| | Jiangsu Eastern Shenghong Co. Ltd. Class A | 3,914,065 | 4,349 |
| | Hangzhou Great Star Industrial Co. Ltd. Class A | 1,078,000 | 4,342 |
| | Shanghai Jinqiao Export Processing Zone Development Co. Ltd. Class B | 5,098,443 | 4,335 |
| *,1,2 | Remegen Co. Ltd. Class H | 2,003,320 | 4,318 |
| | Shui On Land Ltd. | 47,198,378 | 4,316 |
| | Zangge Mining Co. Ltd. Class A | 1,069,679 | 4,305 |
| | GEM Co. Ltd. Class A | 4,388,120 | 4,302 |
| * | Sohu.com Ltd. ADR | 304,407 | 4,289 |
| | Humanwell Healthcare Group Co. Ltd. Class A | 1,415,300 | 4,285 |
| | Jiangsu Yuyue Medical Equipment & Supply Co. Ltd. Class A | 898,330 | 4,280 |
| | Yantai Jereh Oilfield Services Group Co. Ltd. Class A | 902,073 | 4,251 |
| | Shenzhen Investment Ltd. | 34,333,328 | 4,226 |
| | Shandong Sun Paper Industry JSC Ltd. Class A | 2,310,000 | 4,226 |
| | SDIC Capital Co. Ltd. Class A | 3,767,000 | 4,200 |
| | Sealand Securities Co. Ltd. Class A | 5,956,200 | 4,191 |
| | Xiamen Amoytop Biotech Co. Ltd. Class A | 383,982 | 4,174 |
| | Shenzhen Energy Group Co. Ltd. Class A | 4,450,157 | 4,168 |
| * | Kingsoft Cloud Holdings Ltd. | 21,629,915 | 4,149 |
| | Shenzhen Salubris Pharmaceuticals Co. Ltd. Class A | 912,427 | 4,128 |
| | Inner Mongolia Junzheng Energy & Chemical Industry Group Co. Ltd. Class A | 6,899,200 | 4,127 |
| * | Angang Steel Co. Ltd. Class H | 21,301,121 | 4,126 |
| | Guobo Electronics Co. Ltd. Class A | 542,686 | 4,123 |
| | Western Superconducting Technologies Co. Ltd. Class A | 581,959 | 4,121 |
| * | J-Yuan Trust Co. Ltd. Class A | 8,780,700 | 4,114 |
| | Guangdong Electric Power Development Co. Ltd. Class B | 15,075,212 | 4,111 |
| | Beijing Wantai Biological Pharmacy Enterprise Co. Ltd. Class A | 409,249 | 4,102 |
| *,1,2 | Haichang Ocean Park Holdings Ltd. | 44,205,070 | 4,089 |
| | Sinolink Securities Co. Ltd. Class A | 3,180,100 | 4,088 |
| | Bank of Changsha Co. Ltd. Class A | 3,399,400 | 4,075 |
| | AECC Aero-Engine Control Co. Ltd. Class A | 1,203,600 | 4,055 |
| | Yili Chuanning Biotechnology Co. Ltd. Class A | 2,063,800 | 4,053 |
| 3 | Huafon Chemical Co. Ltd. Class A | 3,612,805 | 4,046 |
| | Hubei Energy Group Co. Ltd. Class A | 5,766,467 | 4,043 |
| | Suzhou Maxwell Technologies Co. Ltd. Class A | 246,865 | 4,027 |
| | China Rare Earth Resources & Technology Co. Ltd. Class A | 942,500 | 4,019 |
| * | Jiangxi Zhengbang Technology Co. Ltd. Class A | 9,516,100 | 4,018 |
| | Han's Laser Technology Industry Group Co. Ltd. Class A | 1,106,400 | 4,006 |
| | CSPC Innovation Pharmaceutical Co. Ltd. Class A | 1,114,080 | 4,003 |
| | Chervon Holdings Ltd. | 1,508,100 | 3,971 |
| | China Resources Medical Holdings Co. Ltd. | 7,944,418 | 3,963 |
| * | Seazen Holdings Co. Ltd. Class A | 1,934,035 | 3,962 |
| | Zhejiang Crystal-Optech Co. Ltd. Class A | 1,232,983 | 3,954 |
| | China Modern Dairy Holdings Ltd. | 37,639,317 | 3,948 |
| *,1 | Adicon Holdings Ltd. | 4,794,227 | 3,936 |
| | Yunnan Energy New Material Co. Ltd. Class A | 785,630 | 3,930 |
| | Xuji Electric Co. Ltd. Class A | 920,400 | 3,928 |
| | Hualan Biological Engineering Inc. Class A | 1,694,155 | 3,926 |
| | Shenzhen Fortune Trend Technology Co. Ltd. Class A | 183,236 | 3,926 |
| | Avary Holding Shenzhen Co. Ltd. Class A | 744,640 | 3,920 |
| | AIMA Technology Group Co. Ltd. Class A | 804,394 | 3,919 |
| * | Wintime Energy Group Co. Ltd. Class A | 19,829,700 | 3,912 |
Total International Stock Index Fund
| | | | | | Shares | Market
Value•
($000) |
| | Angel Yeast Co. Ltd. Class A | 762,500 | 3,903 |
| | Southwest Securities Co. Ltd. Class A | 5,775,609 | 3,903 |
| | DBG Technology Co. Ltd. Class A | 748,242 | 3,877 |
| *,2 | Alphamab Oncology | 8,034,959 | 3,869 |
| * | Vantone Neo Development Group Co. Ltd. Class A | 1,893,441 | 3,868 |
| | AVICOPTER plc Class A | 650,991 | 3,844 |
| *,1,2 | Shanghai Junshi Biosciences Co. Ltd. Class H | 2,292,394 | 3,833 |
| | Bethel Automotive Safety Systems Co. Ltd. Class A | 562,540 | 3,833 |
| * | Hainan Meilan International Airport Co. Ltd. Class H | 3,192,641 | 3,823 |
| | Hunan Valin Steel Co. Ltd. Class A | 5,789,440 | 3,819 |
| | Yantai Changyu Pioneer Wine Co. Ltd. Class B | 3,446,137 | 3,818 |
| | Tiangong International Co. Ltd. | 16,509,510 | 3,810 |
| | Qingdao Sentury Tire Co. Ltd. Class A | 984,279 | 3,810 |
| | China Zheshang Bank Co. Ltd. Class A | 9,531,730 | 3,805 |
| | Zhejiang Longsheng Group Co. Ltd. Class A | 2,689,805 | 3,804 |
| * | Pacific Securities Co. Ltd. Class A | 6,025,299 | 3,784 |
| | Ecovacs Robotics Co. Ltd. Class A | 515,840 | 3,783 |
| | China International Capital Corp. Ltd. Class A | 758,900 | 3,779 |
| *,1 | Zhihu Inc. ADR | 1,058,218 | 3,778 |
| *,2 | Yidu Tech Inc. | 8,152,795 | 3,755 |
| | Hisense Home Appliances Group Co. Ltd. Class A | 946,457 | 3,730 |
| | Ginlong Technologies Co. Ltd. Class A | 366,910 | 3,725 |
| | GRG Banking Equipment Co. Ltd. Class A | 2,152,643 | 3,721 |
| | Guolian Securities Co. Ltd. Class A | 2,147,200 | 3,712 |
| | Jiangsu Yoke Technology Co. Ltd. Class A | 415,900 | 3,707 |
| | Qilu Bank Co. Ltd. Class A | 4,878,185 | 3,703 |
| | Shanghai Mechanical & Electrical Industry Co. Ltd. Class B | 3,360,439 | 3,701 |
| | Nanjing Securities Co. Ltd. Class A | 2,894,700 | 3,691 |
| | Yifeng Pharmacy Chain Co. Ltd. Class A | 1,097,070 | 3,660 |
| | Amlogic Shanghai Co. Ltd. Class A | 373,373 | 3,650 |
| * | Shengyi Electronics Co. Ltd. Class A | 745,913 | 3,645 |
| | Gan & Lee Pharmaceuticals Co. Ltd. Class A | 528,983 | 3,642 |
| | Yunnan Copper Co. Ltd. Class A | 1,980,800 | 3,637 |
| | Tongkun Group Co. Ltd. Class A | 2,192,760 | 3,630 |
| | Hangzhou Chang Chuan Technology Co. Ltd. Class A | 588,500 | 3,630 |
| | Jinduicheng Molybdenum Co. Ltd. Class A | 2,406,000 | 3,628 |
| * | Tsinghua Tongfang Co. Ltd. Class A | 3,025,200 | 3,622 |
| | Sinofert Holdings Ltd. | 24,268,198 | 3,615 |
| | Beijing Yanjing Brewery Co. Ltd. Class A | 2,523,610 | 3,605 |
| | CNOOC Energy Technology & Services Ltd. Class A | 5,872,800 | 3,603 |
| | Chongqing Brewery Co. Ltd. Class A | 440,789 | 3,600 |
| | CGN Power Co. Ltd. Class A | 6,348,800 | 3,600 |
| | Ingenic Semiconductor Co. Ltd. Class A | 351,646 | 3,598 |
| | Zhejiang Chint Electrics Co. Ltd. Class A | 1,094,902 | 3,596 |
| | Meihua Holdings Group Co. Ltd. Class A | 2,687,000 | 3,576 |
| | Yunnan Chihong Zinc&Germanium Co. Ltd. Class A | 4,413,100 | 3,573 |
| | Shijiazhuang Yiling Pharmaceutical Co. Ltd. Class A | 1,493,746 | 3,571 |
| | Livzon Pharmaceutical Group Inc. Class A | 692,843 | 3,568 |
| | Shenzhen Capchem Technology Co. Ltd. Class A | 660,283 | 3,568 |
| *,1 | Canaan Inc. ADR | 3,066,997 | 3,558 |
| * | Biwin Storage Technology Co. Ltd. Class A | 406,484 | 3,555 |
| | Xiamen C & D Inc. Class A | 2,711,800 | 3,553 |
| | Shanghai Zhenhua Heavy Industries Co. Ltd. Class B | 14,924,161 | 3,552 |
| | Empyrean Technology Co. Ltd. Class A | 252,783 | 3,550 |
| | Zhejiang Huahai Pharmaceutical Co. Ltd. Class A | 1,364,740 | 3,547 |
| * | Everdisplay Optronics Shanghai Co. Ltd. Class A | 9,957,352 | 3,532 |
| | Henan Pinggao Electric Co. Ltd. Class A | 1,377,200 | 3,526 |
| * | Hubei Dinglong Co. Ltd. Class A | 927,300 | 3,519 |
| | Kingnet Network Co. Ltd. Class A | 1,873,000 | 3,511 |
| | Jason Furniture Hangzhou Co. Ltd. Class A | 753,349 | 3,511 |
| | Chifeng Jilong Gold Mining Co. Ltd. Class A | 1,318,900 | 3,491 |
| | Shenzhen Woer Heat-Shrinkable Material Co. Ltd. Class A | 1,179,900 | 3,488 |
| | Hisense Visual Technology Co. Ltd. Class A | 1,110,900 | 3,484 |
| | Hangzhou Binjiang Real Estate Group Co. Ltd. Class A | 2,490,333 | 3,484 |
| * | Pangang Group Vanadium Titanium & Resources Co. Ltd. Class A | 8,615,305 | 3,483 |
| * | Q Technology Group Co. Ltd. | 5,318,379 | 3,478 |
| | Inner Mongolia MengDian HuaNeng Thermal Power Corp. Ltd. Class A | 5,542,400 | 3,470 |
| | Jiangsu Nata Opto-electronic Material Co. Ltd. Class A | 591,100 | 3,464 |
| * | Agile Group Holdings Ltd. | 29,022,040 | 3,462 |
| | Xiamen Tungsten Co. Ltd. Class A | 1,266,791 | 3,461 |
Total International Stock Index Fund
| | | | | | Shares | Market
Value•
($000) |
| | State Grid Information & Communication Co. Ltd. Class A | 1,205,122 | 3,454 |
| | BOE Varitronix Ltd. | 4,875,854 | 3,445 |
| * | IRICO Display Devices Co. Ltd. Class A | 3,212,768 | 3,441 |
| *,2 | JS Global Lifestyle Co. Ltd. | 17,078,751 | 3,439 |
| 2 | AsiaInfo Technologies Ltd. | 5,210,827 | 3,438 |
| 1,2 | Everbright Securities Co. Ltd. Class H | 3,514,632 | 3,436 |
| | Oriental Pearl Group Co. Ltd. Class A | 3,086,500 | 3,432 |
| | HLA Group Corp. Ltd. Class A | 4,288,763 | 3,432 |
| | Central China Securities Co. Ltd. Class H | 14,369,093 | 3,426 |
| | Jinneng Holding Shanxi Coal Industry Co. Ltd. Class A | 1,638,300 | 3,413 |
| | Guangzhou Haige Communications Group Inc. Co. Class A | 2,142,959 | 3,407 |
| | Shenzhen Longsys Electronics Co. Ltd. Class A | 276,515 | 3,406 |
| | Wuchan Zhongda Group Co. Ltd. Class A | 4,822,385 | 3,404 |
| | China Baoan Group Co. Ltd. Class A | 2,230,264 | 3,402 |
| | Ming Yang Smart Energy Group Ltd. Class A | 2,004,183 | 3,390 |
| * | Sinomach Heavy Equipment Group Co. Ltd. Class A | 6,909,900 | 3,388 |
| * | Greenland Holdings Corp. Ltd. Class A | 11,481,006 | 3,383 |
| | China Oilfield Services Ltd. Class A | 1,590,490 | 3,370 |
| | Chengdu Hi-tech Development Co. Ltd. Class A | 335,100 | 3,370 |
| | Jointown Pharmaceutical Group Co. Ltd. Class A | 4,624,896 | 3,362 |
| | Inner Mongolia Xingye Silver&Tin Mining Co. Ltd. Class A | 1,771,900 | 3,360 |
| | Juneyao Airlines Co. Ltd. Class A | 1,871,852 | 3,359 |
| | Shanghai Electric Power Co. Ltd. Class A | 2,501,608 | 3,358 |
| | Ningbo Zhoushan Port Co. Ltd. Class A | 6,418,146 | 3,357 |
| | Yangzhou Yangjie Electronic Technology Co. Ltd. Class A | 500,800 | 3,350 |
| | Digital China Group Co. Ltd. Class A | 677,400 | 3,350 |
| | Eastern Air Logistics Co. Ltd. Class A | 1,400,391 | 3,349 |
| | Zhejiang Cfmoto Power Co. Ltd. Class A | 150,600 | 3,342 |
| | Bestechnic Shanghai Co. Ltd. Class A | 107,502 | 3,335 |
| | Weihai Guangwei Composites Co. Ltd. Class A | 677,984 | 3,333 |
| | Cathay Biotech Inc. Class A | 502,955 | 3,331 |
| | TangShan Port Group Co. Ltd. Class A | 5,421,300 | 3,330 |
| | Sinoma International Engineering Co. Class A | 2,290,700 | 3,325 |
| | Gemdale Corp. Class A | 3,857,884 | 3,324 |
| | Shan Xi Hua Yang Group New Energy Co. Ltd. Class A | 3,159,900 | 3,324 |
| | Weifu High-Technology Group Co. Ltd. Class B | 2,019,242 | 3,319 |
| | ACM Research Shanghai Inc. Class A | 220,818 | 3,311 |
| | Shenzhen Megmeet Electrical Co. Ltd. Class A | 519,225 | 3,306 |
| | Heilongjiang Agriculture Co. Ltd. Class A | 1,516,900 | 3,303 |
| | Pingdingshan Tianan Coal Mining Co. Ltd. Class A | 2,314,600 | 3,301 |
| | Xinjiang Daqo New Energy Co. Ltd. Class A | 722,147 | 3,297 |
| | Haohua Chemical Science & Technology Co. Ltd. Class A | 725,297 | 3,286 |
| | Giant Network Group Co. Ltd. Class A | 1,873,300 | 3,277 |
| | Zhejiang Supor Co. Ltd. Class A | 445,175 | 3,274 |
| | Beijing Shougang Co. Ltd. Class A | 7,091,095 | 3,269 |
| | Hangcha Group Co. Ltd. Class A | 1,314,201 | 3,257 |
| | Zhuzhou CRRC Times Electric Co. Ltd. Class A | 476,124 | 3,257 |
| | Xiamen Faratronic Co. Ltd. Class A | 204,220 | 3,255 |
| | Hebei Yangyuan Zhihui Beverage Co. Ltd. Class A | 1,119,295 | 3,255 |
| | JCHX Mining Management Co. Ltd. Class A | 577,834 | 3,246 |
| | Sunresin New Materials Co. Ltd. Class A | 470,442 | 3,232 |
| | Shanghai Yuyuan Tourist Mart Group Co. Ltd. Class A | 3,861,168 | 3,230 |
| | Hangzhou First Applied Material Co. Ltd. Class A | 1,229,201 | 3,227 |
| | Hubei Feilihua Quartz Glass Co. Ltd. Class A | 546,944 | 3,225 |
| | People.cn Co. Ltd. Class A | 1,006,600 | 3,224 |
| | Nanjing Iron & Steel Co. Ltd. Class A | 5,280,746 | 3,223 |
| | Inner Mongolia Yuan Xing Energy Co. Ltd. Class A | 3,394,230 | 3,222 |
| | Andon Health Co. Ltd. Class A | 493,572 | 3,221 |
| | Beijing Capital Eco-Environment Protection Group Co. Ltd. Class A | 6,677,590 | 3,220 |
| * | Shanghai Junshi Biosciences Co. Ltd. Class A | 764,276 | 3,219 |
| | Shanghai Chlor-Alkali Chemical Co. Ltd. Class B | 5,370,897 | 3,214 |
| * | Wanda Film Holding Co. Ltd. Class A | 1,885,998 | 3,200 |
| | Jilin Aodong Pharmaceutical Group Co. Ltd. Class A | 1,309,087 | 3,193 |
| | Guangzhou Shiyuan Electronic Technology Co. Ltd. Class A | 630,407 | 3,191 |
| | Sinomine Resource Group Co. Ltd. Class A | 683,675 | 3,183 |
| | China Hainan Rubber Industry Group Co. Ltd. Class A | 3,848,000 | 3,182 |
| 1,2 | Yangtze Optical Fibre & Cable Joint Stock Ltd. Co. Class H | 2,414,103 | 3,181 |
| * | SICC Co. Ltd. Class A | 382,997 | 3,180 |
| | Beijing Enlight Media Co. Ltd. Class A | 2,552,180 | 3,176 |
| | China Zhenhua Group Science & Technology Co. Ltd. Class A | 476,300 | 3,173 |
Total International Stock Index Fund
| | | | | | Shares | Market
Value•
($000) |
| * | CPMC Holdings Ltd. | 3,635,018 | 3,172 |
| | Shanghai Rural Commercial Bank Co. Ltd. Class A | 2,908,101 | 3,170 |
| * | Baoding Tianwei Baobian Electric Co. Ltd. Class A | 1,792,000 | 3,170 |
| | Thunder Software Technology Co. Ltd. Class A | 386,628 | 3,148 |
| | Jiangsu Nhwa Pharmaceutical Co. Ltd. Class A | 842,700 | 3,139 |
| | Shenzhen Kedali Industry Co. Ltd. Class A | 226,505 | 3,139 |
| | Jiangsu Xinquan Automotive Trim Co. Ltd. Class A | 444,572 | 3,131 |
| | Guangxi Liugong Machinery Co. Ltd. Class A | 1,855,663 | 3,124 |
| 2 | AK Medical Holdings Ltd. | 5,081,497 | 3,124 |
| | Shanxi Coal International Energy Group Co. Ltd. Class A | 1,672,300 | 3,123 |
| | Shanxi Securities Co. Ltd. Class A | 3,488,979 | 3,119 |
| | Anjoy Foods Group Co. Ltd. Class A | 258,228 | 3,111 |
| | Shanghai Huace Navigation Technology Ltd. Class A | 600,720 | 3,100 |
| | China Foods Ltd. | 9,632,706 | 3,095 |
| | Sichuan New Energy Power Co. Ltd. Class A | 1,870,007 | 3,088 |
| | Olympic Circuit Technology Co. Ltd. Class A | 745,800 | 3,087 |
| | Hangzhou Robam Appliances Co. Ltd. Class A | 900,362 | 3,077 |
| | Shenzhen Envicool Technology Co. Ltd. Class A | 676,178 | 3,076 |
| * | COL Group Co. Ltd. Class A | 730,400 | 3,076 |
| | Hesteel Co. Ltd. Class A | 9,894,043 | 3,072 |
| | BBMG Corp. Class H | 30,245,454 | 3,071 |
| | Beijing Ultrapower Software Co. Ltd. Class A | 1,702,000 | 3,068 |
| | Shanghai Lingang Holdings Corp. Ltd. Class A | 1,923,545 | 3,065 |
| | Liaoning Port Co. Ltd. Class A | 14,139,765 | 3,063 |
| | Shanghai Allist Pharmaceuticals Co. Ltd. Class A | 418,278 | 3,060 |
| | Yunnan Tin Co. Ltd. Class A | 1,429,273 | 3,059 |
| | Zhejiang JIULI Hi-tech Metals Co. Ltd. Class A | 963,350 | 3,056 |
| | Shenzhen Urban Transport Planning Center Co. Ltd. Class A | 383,300 | 3,056 |
| *,3 | China Dili Group | 35,982,893 | 3,055 |
| * | Hebei Changshan Biochemical Pharmaceutical Co. Ltd. Class A | 932,800 | 3,052 |
| * | Shenzhen Overseas Chinese Town Co. Ltd. Class A | 7,313,566 | 3,049 |
| | Ningbo Joyson Electronic Corp. Class A | 1,301,400 | 3,042 |
| | Huaan Securities Co. Ltd. Class A | 3,515,500 | 3,041 |
| | China Great Wall Securities Co. Ltd. Class A | 2,532,100 | 3,041 |
| | Goldwind Science & Technology Co. Ltd. Class A | 1,985,858 | 3,039 |
| * | Beijing Compass Technology Development Co. Ltd. Class A | 210,900 | 3,039 |
| * | Nexchip Semiconductor Corp. Class A | 1,060,520 | 3,037 |
| * | Nations Technologies Inc. Class A | 541,000 | 3,028 |
| | Geovis Technology Co. Ltd. Class A | 517,812 | 3,016 |
| | Shenzhen Sunlord Electronics Co. Ltd. Class A | 725,600 | 3,013 |
| | Hengdian Group DMEGC Magnetics Co. Ltd. Class A | 1,438,800 | 3,012 |
| | Glarun Technology Co. Ltd. Class A | 1,186,100 | 3,012 |
| *,1 | Yeahka Ltd. | 2,114,972 | 3,002 |
| * | Beiqi Foton Motor Co. Ltd. Class A | 7,936,400 | 2,996 |
| | China National Medicines Corp. Ltd. Class A | 674,300 | 2,995 |
| | Zhejiang Weixing New Building Materials Co. Ltd. Class A | 1,427,740 | 2,992 |
| | INESA Intelligent Tech Inc. Class B | 4,838,246 | 2,983 |
| | Sinotrans Ltd. Class A | 4,160,521 | 2,983 |
| | Offshore Oil Engineering Co. Ltd. Class A | 3,910,000 | 2,981 |
| | Shenzhen Sunway Communication Co. Ltd. Class A | 854,235 | 2,969 |
| | Datang International Power Generation Co. Ltd. Class A | 7,154,411 | 2,965 |
| | Shaanxi Energy Investment Co. Ltd. Class A | 2,240,325 | 2,965 |
| | Harbin Electric Co. Ltd. Class H | 8,965,020 | 2,964 |
| | Hengyi Petrochemical Co. Ltd. Class A | 3,299,840 | 2,962 |
| | Joincare Pharmaceutical Group Industry Co. Ltd. Class A | 1,865,496 | 2,961 |
| * | Bohai Leasing Co. Ltd. Class A | 6,310,900 | 2,956 |
| | Guangdong HEC Technology Holding Co. Ltd. Class A | 2,649,467 | 2,953 |
| | Haisco Pharmaceutical Group Co. Ltd. Class A | 600,763 | 2,951 |
| * | Sinopec Oilfield Service Corp. Class H | 33,802,792 | 2,949 |
| | Chengdu Xingrong Environment Co. Ltd. Class A | 2,830,200 | 2,937 |
| | 37 Interactive Entertainment Network Technology Group Co. Ltd. Class A | 1,280,700 | 2,937 |
| | Songcheng Performance Development Co. Ltd. Class A | 2,158,770 | 2,934 |
| | Walvax Biotechnology Co. Ltd. Class A | 1,413,265 | 2,933 |
| 2 | Linklogis Inc. Class B | 13,488,293 | 2,919 |
| * | NavInfo Co. Ltd. Class A | 2,031,819 | 2,915 |
| | Hubei Xingfa Chemicals Group Co. Ltd. Class A | 937,000 | 2,908 |
| | Citic Offshore Helicopter Co. Ltd. Class A | 781,200 | 2,900 |
| | Jafron Biomedical Co. Ltd. Class A | 659,726 | 2,896 |
| | Jiangsu Yangnong Chemical Co. Ltd. Class A | 355,810 | 2,892 |
| | Shenzhen Kinwong Electronic Co. Ltd. Class A | 799,460 | 2,892 |
Total International Stock Index Fund
| | | | | | Shares | Market
Value•
($000) |
| | Kangji Medical Holdings Ltd. | 3,874,782 | 2,887 |
| | Northeast Securities Co. Ltd. Class A | 2,402,200 | 2,884 |
| | Guangshen Railway Co. Ltd. Class A | 5,982,200 | 2,872 |
| | CSI Solar Co. Ltd. Class A | 1,380,048 | 2,866 |
| | Baiyin Nonferrous Group Co. Ltd. Class A | 6,557,900 | 2,861 |
| | DHC Software Co. Ltd. Class A | 2,776,500 | 2,855 |
| | Shenzhen SC New Energy Technology Corp. Class A | 271,506 | 2,849 |
| | Bank of Guiyang Co. Ltd. Class A | 3,375,900 | 2,848 |
| | Shenzhen SED Industry Co. Ltd. Class A | 1,035,200 | 2,847 |
| | Shenzhen MTC Co. Ltd. Class A | 3,810,500 | 2,845 |
| | CECEP Wind-Power Corp. Class A | 6,070,147 | 2,845 |
| | Wanxiang Qianchao Co. Ltd. Class A | 3,093,830 | 2,836 |
| | By-health Co. Ltd. Class A | 1,585,200 | 2,836 |
| | Gemdale Properties & Investment Corp. Ltd. | 77,186,302 | 2,834 |
| | Luxi Chemical Group Co. Ltd. Class A | 1,721,200 | 2,830 |
| * | Jinke Smart Services Group Co. Ltd. Class H | 2,908,100 | 2,829 |
| | Wangsu Science & Technology Co. Ltd. Class A | 2,090,700 | 2,828 |
| | Tian Di Science & Technology Co. Ltd. Class A | 3,268,145 | 2,824 |
| | Yunnan Botanee Bio-Technology Group Co. Ltd. Class A | 381,800 | 2,820 |
| | Jiangsu Phoenix Publishing & Media Corp. Ltd. Class A | 1,990,001 | 2,815 |
| | Fiberhome Telecommunication Technologies Co. Ltd. Class A | 1,046,680 | 2,814 |
| | Jiayou International Logistics Co. Ltd. Class A | 1,008,068 | 2,814 |
| | Newland Digital Technology Co. Ltd. Class A | 1,047,997 | 2,808 |
| * | Tianma Microelectronics Co. Ltd. Class A | 2,177,821 | 2,801 |
| | China Resources Double Crane Pharmaceutical Co. Ltd. Class A | 938,654 | 2,801 |
| | Shanghai Lujiazui Finance & Trade Zone Development Co. Ltd. Class A | 1,833,449 | 2,800 |
| | Guangxi Guiguan Electric Power Co. Ltd. Class A | 3,242,584 | 2,799 |
| | Chongqing Rural Commercial Bank Co. Ltd. Class A | 3,562,100 | 2,793 |
| * | Shanxi Meijin Energy Co. Ltd. Class A | 3,805,900 | 2,787 |
| * | Verisilicon Microelectronics Shanghai Co. Ltd. Class A | 474,687 | 2,787 |
| | Lepu Medical Technology Beijing Co. Ltd. Class A | 1,639,748 | 2,778 |
| | China South Publishing & Media Group Co. Ltd. Class A | 1,634,061 | 2,778 |
| | Raytron Technology Co. Ltd. Class A | 390,556 | 2,775 |
| | Qingdao TGOOD Electric Co. Ltd. Class A | 885,418 | 2,769 |
| * | Shanxi Taigang Stainless Steel Co. Ltd. Class A | 5,208,104 | 2,769 |
| | Hebei Sinopack Electronic Technology Co. Ltd. Class A | 379,498 | 2,768 |
| * | Sichuan Biokin Pharmaceutical Co. Ltd. Class A | 108,021 | 2,767 |
| | Shenzhen Fastprint Circuit Tech Co. Ltd. Class A | 1,754,400 | 2,763 |
| | Sinoma Science & Technology Co. Ltd. Class A | 1,513,872 | 2,761 |
| | Anji Microelectronics Technology Shanghai Co. Ltd. Class A | 127,206 | 2,757 |
| | AVIC Chengdu UAS Co. Ltd. Class A | 388,390 | 2,756 |
| | All Winner Technology Co. Ltd. Class A | 492,830 | 2,753 |
| | Bank of Chengdu Co. Ltd. Class A | 1,269,227 | 2,750 |
| 2 | Medlive Technology Co. Ltd. | 2,525,500 | 2,749 |
| * | QuantumCTek Co. Ltd. Class A | 76,536 | 2,737 |
| | Shanghai Tunnel Engineering Co. Ltd. Class A | 2,834,720 | 2,734 |
| | Jiangsu Expressway Co. Ltd. Class A | 1,542,675 | 2,732 |
| * | Quzhou Xin'an Development Co. Ltd. Class A | 6,612,700 | 2,732 |
| | CCCC Design & Consulting Group Co. Ltd. Class A | 2,005,500 | 2,727 |
| | Guangzhou Automobile Group Co. Ltd. Class A | 2,426,040 | 2,725 |
| * | Beijing E-Hualu Information Technology Co. Ltd. Class A | 650,823 | 2,716 |
| | Capital Securities Co. Ltd. Class A | 893,500 | 2,709 |
| * | Shenzhen Everwin Precision Technology Co. Ltd. Class A | 1,075,104 | 2,702 |
| | China Automotive Engineering Research Institute Co. Ltd. Class A | 1,081,590 | 2,700 |
| * | Guosheng Financial Holding Inc. Class A | 1,666,300 | 2,699 |
| | COFCO Sugar Holding Co. Ltd. Class A | 1,964,900 | 2,699 |
| * | Siasun Robot & Automation Co. Ltd. Class A | 1,410,640 | 2,697 |
| | Shanghai United Imaging Healthcare Co. Ltd. Class A | 156,954 | 2,697 |
| | Shenzhen Zhongjin Lingnan Nonfemet Co. Ltd. Class A | 3,906,300 | 2,696 |
| | China Coal Xinji Energy Co. Ltd. Class A | 2,359,030 | 2,694 |
| | Topchoice Medical Corp. Class A | 380,652 | 2,689 |
| | FAW Jiefang Group Co. Ltd. Class A | 2,217,237 | 2,686 |
| | Xinyi Energy Holdings Ltd. | 23,701,177 | 2,681 |
| *,2,3 | Venus MedTech Hangzhou Inc. Class H | 3,706,377 | 2,679 |
| | Hunan Yuneng New Energy Battery Material Co. Ltd. Class A | 405,937 | 2,670 |
| | Hebei Hengshui Laobaigan Liquor Co. Ltd. Class A | 923,000 | 2,664 |
| * | Golden Solar New Energy Technology Holdings Ltd. | 8,397,231 | 2,662 |
| | Jinan Shengquan Group Share Holding Co. Ltd. Class A | 880,200 | 2,656 |
| | Red Avenue New Materials Group Co. Ltd. Class A | 566,400 | 2,653 |
| | Wuxi Taiji Industry Ltd. Co. Class A | 2,381,953 | 2,653 |
Total International Stock Index Fund
| | | | | | Shares | Market
Value•
($000) |
| | Huaxin Cement Co. Ltd. Class A | 1,238,181 | 2,653 |
| | Jiangsu Financial Leasing Co. Ltd. Class A | 3,654,587 | 2,648 |
| | Hunan Gold Corp. Ltd. Class A | 1,130,420 | 2,647 |
| | Shandong Hi-speed Co. Ltd. Class A | 2,185,500 | 2,640 |
| | Tianjin Pharmaceutical Da Re Tang Group Corp. Ltd. Class A | 568,168 | 2,639 |
| * | CITIC Guoan Information Industry Co. Ltd. Class A | 5,016,900 | 2,632 |
| * | China First Heavy Industries Co. Ltd. Class A | 5,864,500 | 2,630 |
| 2 | Zhou Hei Ya International Holdings Co. Ltd. | 13,146,752 | 2,623 |
| * | Shandong Chenming Paper Holdings Ltd. Class B | 14,771,945 | 2,621 |
| | Telling Telecommunication Holding Co. Ltd. Class A | 1,200,300 | 2,614 |
| | Shede Spirits Co. Ltd. Class A | 294,100 | 2,614 |
| | Bloomage Biotechnology Corp. Ltd. Class A | 309,325 | 2,613 |
| | Chongqing Fuling Electric Power Industrial Co. Ltd. Class A | 1,543,483 | 2,612 |
| | Beijing Shiji Information Technology Co. Ltd. Class A | 2,398,177 | 2,610 |
| | BGI Genomics Co. Ltd. Class A | 404,890 | 2,606 |
| | Skshu Paint Co. Ltd. Class A | 414,569 | 2,604 |
| * | Fulin Precision Co. Ltd. Class A | 1,437,670 | 2,597 |
| | Suofeiya Home Collection Co. Ltd. Class A | 950,700 | 2,593 |
| | Central China Securities Co. Ltd. Class A | 4,044,600 | 2,591 |
| * | Shanghai Bairun Investment Holding Group Co. Ltd. Class A | 870,599 | 2,586 |
| | Konfoong Materials International Co. Ltd. Class A | 272,200 | 2,581 |
| | Tasly Pharmaceutical Group Co. Ltd. Class A | 1,224,900 | 2,580 |
| | Jiangxi Lianchuang Optoelectronic Science & Technology Co. Ltd. Class A | 390,400 | 2,572 |
| | Shanghai Moons' Electric Co. Ltd. Class A | 390,000 | 2,568 |
| | Zhuhai CosMX Battery Co. Ltd. Class A | 1,015,035 | 2,567 |
| | Shanghai Waigaoqiao Free Trade Zone Group Co. Ltd. Class B | 3,176,313 | 2,566 |
| | Health & Happiness H&H International Holdings Ltd. | 1,953,307 | 2,565 |
| | Sinotruk Jinan Truck Co. Ltd. Class A | 1,086,919 | 2,565 |
| * | Founder Technology Group Corp. Class A | 4,395,200 | 2,561 |
| | Shenzhen Kangtai Biological Products Co. Ltd. Class A | 962,300 | 2,556 |
| | Zhejiang Narada Power Source Co. Ltd. Class A | 836,500 | 2,549 |
| | Guangzhou Baiyun International Airport Co. Ltd. Class A | 1,868,400 | 2,545 |
| | Zhejiang Sanmei Chemical Industry Co. Ltd. Class A | 566,035 | 2,545 |
| | China Lilang Ltd. | 5,142,094 | 2,541 |
| | Beijing Dabeinong Technology Group Co. Ltd. Class A | 3,822,800 | 2,541 |
| | Sharetronic Data Technology Co. Ltd. Class A | 248,200 | 2,539 |
| | Xiangcai Co. Ltd. Class A | 2,377,242 | 2,538 |
| | Guangdong Hongda Holdings Group Co. Ltd. Class A | 716,200 | 2,532 |
| | Kingfa Sci & Tech Co. Ltd. Class A | 2,008,400 | 2,527 |
| | Shenzhen Rongda Photosensitive & Technology Co. Ltd. Class A | 335,260 | 2,527 |
| | China Yongda Automobiles Services Holdings Ltd. | 12,220,260 | 2,521 |
| | Grandblue Environment Co. Ltd. Class A | 811,936 | 2,521 |
| | Willfar Information Technology Co. Ltd. Class A | 451,991 | 2,521 |
| | Beijing Easpring Material Technology Co. Ltd. Class A | 430,000 | 2,517 |
| | StarPower Semiconductor Ltd. Class A | 185,575 | 2,508 |
| | JSTI Group Class A | 1,259,980 | 2,500 |
| | Ningbo Shanshan Co. Ltd. Class A | 1,950,424 | 2,499 |
| | Asymchem Laboratories Tianjin Co. Ltd. Class A | 213,696 | 2,495 |
| | Zhejiang Dingli Machinery Co. Ltd. Class A | 349,785 | 2,493 |
| * | Qi An Xin Technology Group Inc. Class A | 558,449 | 2,493 |
| | Beijing Sinnet Technology Co. Ltd. Class A | 1,636,900 | 2,491 |
| * | CETC Chips Technology Inc. Class A | 1,171,400 | 2,484 |
| | Shanghai Huayi Group Co. Ltd. Class B | 4,563,835 | 2,483 |
| | Hexing Electrical Co. Ltd. Class A | 456,320 | 2,477 |
| | China International Marine Containers Group Co. Ltd. Class A | 2,041,550 | 2,477 |
| | Apeloa Pharmaceutical Co. Ltd. Class A | 1,088,400 | 2,469 |
| | Shanghai Jinjiang International Hotels Co. Ltd. Class A | 650,400 | 2,466 |
| | Beijing Originwater Technology Co. Ltd. Class A | 3,467,284 | 2,465 |
| | TianShan Material Co. Ltd. Class A | 2,853,280 | 2,465 |
| | Zhuhai Huafa Properties Co. Ltd. Class A | 2,514,347 | 2,464 |
| | Zhengzhou Coal Mining Machinery Group Co. Ltd. Class A | 1,306,800 | 2,463 |
| * | Shanghai Aiko Solar Energy Co. Ltd. Class A | 1,367,081 | 2,462 |
| | Shaanxi International Trust Co. Ltd. Class A | 4,351,800 | 2,459 |
| | China Film Co. Ltd. Class A | 1,521,832 | 2,455 |
| | Sany Renewable Energy Co. Ltd. Class A | 593,138 | 2,449 |
| | Guangdong Fenghua Advanced Technology Holding Co. Ltd. Class A | 1,077,072 | 2,447 |
| | Wolong Electric Group Co. Ltd. Class A | 1,162,300 | 2,446 |
| | Venustech Group Inc. Class A | 981,774 | 2,445 |
| | Kingsemi Co. Ltd. Class A | 199,647 | 2,445 |
| | China National Accord Medicines Corp. Ltd. Class B | 1,297,620 | 2,444 |
Total International Stock Index Fund
| | | | | | Shares | Market
Value•
($000) |
| | Bank of Chongqing Co. Ltd. Class A | 2,050,159 | 2,444 |
| | Motic Xiamen Electric Group Co. Ltd. Class A | 607,100 | 2,443 |
| * | Tangshan Jidong Cement Co. Ltd. Class A | 2,918,800 | 2,439 |
| | Shandong Buchang Pharmaceuticals Co. Ltd. Class A | 1,034,494 | 2,436 |
| | Wuhan DR Laser Technology Corp. Ltd. Class A | 220,416 | 2,429 |
| * | Hwa Create Co. Ltd. Class A | 613,400 | 2,428 |
| * | Chongqing Iron & Steel Co. Ltd. Class A | 9,896,474 | 2,427 |
| | CSSC Science & Technology Co. Ltd. Class A | 1,264,000 | 2,420 |
| | Shenghe Resources Holding Co. Ltd. Class A | 1,519,800 | 2,415 |
| | Sichuan Swellfun Co. Ltd. Class A | 411,620 | 2,410 |
| | XGD Inc. Class A | 622,900 | 2,409 |
| * | Dizal Jiangsu Pharmaceutical Co. Ltd. Class A | 386,040 | 2,409 |
| | JA Solar Technology Co. Ltd. Class A | 883,891 | 2,405 |
| | Shenzhen New Industries Biomedical Engineering Co. Ltd. Class A | 248,430 | 2,395 |
| | Tian Lun Gas Holdings Ltd. | 5,484,020 | 2,391 |
| | Huaxi Securities Co. Ltd. Class A | 2,013,739 | 2,391 |
| | Aisino Corp. Class A | 1,673,900 | 2,391 |
| | Eyebright Medical Technology Beijing Co. Ltd. Class A | 179,315 | 2,391 |
| | Huali Industrial Group Co. Ltd. Class A | 254,258 | 2,388 |
| | Beijing United Information Technology Co. Ltd. Class A | 641,287 | 2,386 |
| * | Ningbo Jifeng Auto Parts Co. Ltd. Class A | 1,296,800 | 2,386 |
| | CECEP Solar Energy Co. Ltd. Class A | 3,272,400 | 2,383 |
| | Inner Mongolia ERDOS Resources Co. Ltd. Class A | 1,778,936 | 2,381 |
| * | Huafon Microfibre Shanghai Technology Co. Ltd. Class A | 1,824,763 | 2,380 |
| | Huangshan Tourism Development Co. Ltd. Class B | 3,230,688 | 2,377 |
| | Jizhong Energy Resources Co. Ltd. Class A | 2,849,376 | 2,376 |
| | Guangzhou Yuexiu Capital Holdings Group Co. Ltd. Class A | 2,173,761 | 2,374 |
| | Fujian Sunner Development Co. Ltd. Class A | 1,180,100 | 2,373 |
| | Zhejiang Hailiang Co. Ltd. Class A | 1,920,200 | 2,373 |
| | Shennan Circuits Co. Ltd. Class A | 161,587 | 2,369 |
| | An Hui Wenergy Co. Ltd. Class A | 2,156,921 | 2,364 |
| | Bluefocus Intelligent Communications Group Co. Ltd. Class A | 2,295,200 | 2,357 |
| | China Green Electricity Investment of Tianjin Co. Ltd. Class A | 1,686,690 | 2,356 |
| | Winner Medical Co. Ltd. Class A | 536,169 | 2,353 |
| | Electric Connector Technology Co. Ltd. Class A | 373,122 | 2,352 |
| * | SOHO China Ltd. | 25,340,856 | 2,345 |
| | Fangda Carbon New Material Co. Ltd. Class A | 3,147,945 | 2,341 |
| * | Xiangtan Electric Manufacturing Co. Ltd. Class A | 1,182,400 | 2,338 |
| | CETC Potevio Science & Technology Co. Ltd. Class A | 672,300 | 2,334 |
| * | Shenzhen Special Economic Zone Real Estate & Properties Group Co. Ltd. Class A | 915,500 | 2,334 |
| | Zhefu Holding Group Co. Ltd. Class A | 4,826,150 | 2,333 |
| | Dongfang Electronics Co. Ltd. Class A | 1,442,200 | 2,330 |
| 2 | China New Higher Education Group Ltd. | 10,122,112 | 2,328 |
| | Canmax Technologies Co. Ltd. Class A | 701,123 | 2,322 |
| * | Hubei Biocause Pharmaceutical Co. Ltd. Class A | 4,601,991 | 2,318 |
| 2 | Shanghai Haohai Biological Technology Co. Ltd. Class H | 598,774 | 2,318 |
| | Foryou Corp. Class A | 555,390 | 2,318 |
| | North Copper Co. Ltd. Class A | 1,818,700 | 2,318 |
| * | Asia - Potash International Investment Guangzhou Co. Ltd. Class A | 859,900 | 2,317 |
| | Yusys Technologies Co. Ltd. Class A | 644,320 | 2,316 |
| | Hainan Drinda New Energy Technology Co. Ltd. Class A | 205,884 | 2,314 |
| | Sineng Electric Co. Ltd. Class A | 360,917 | 2,313 |
| | Chinese Universe Publishing & Media Group Co. Ltd. Class A | 1,286,980 | 2,312 |
| | Jiangsu Lihua Animal Husbandry Stock Co. Ltd. Class A | 767,586 | 2,312 |
| | Wangfujing Group Co. Ltd. Class A | 1,092,000 | 2,310 |
| | Intco Medical Technology Co. Ltd. Class A | 631,800 | 2,308 |
| | Sichuan Hebang Biotechnology Co. Ltd. Class A | 7,881,700 | 2,305 |
| | Shanghai Zhonggu Logistics Co. Ltd. Class A | 1,981,868 | 2,303 |
| | Hainan Jinpan Smart Technology Co. Ltd. Class A | 470,174 | 2,303 |
| | Zhejiang Weixing Industrial Development Co. Ltd. Class A | 1,230,278 | 2,301 |
| | Jilin Electric Power Co. Ltd. Class A | 2,676,400 | 2,298 |
| | Shenzhen YUTO Packaging Technology Co. Ltd. Class A | 641,480 | 2,298 |
| * | Sinopec Shanghai Petrochemical Co. Ltd. Class A | 5,540,900 | 2,296 |
| * | GCL System Integration Technology Co. Ltd. Class A | 6,023,500 | 2,289 |
| *,1,2 | Ocumension Therapeutics | 3,163,327 | 2,286 |
| | Risen Energy Co. Ltd. Class A | 1,128,190 | 2,283 |
| | Shanghai Chinafortune Co. Ltd. Class A | 1,045,200 | 2,281 |
| | Shenyang Fortune Precision Equipment Co. Ltd. Class A | 254,823 | 2,279 |
| | Sichuan Huafeng Technology Co. Ltd. Class A | 430,522 | 2,276 |
| | YongXing Special Materials Technology Co. Ltd. Class A | 419,190 | 2,274 |
Total International Stock Index Fund
| | | | | | Shares | Market
Value•
($000) |
| | Guangzhou Zhujiang Brewery Co. Ltd. Class A | 1,811,696 | 2,273 |
| * | Shenyang Machine Tool Co. Ltd. Class A | 1,870,600 | 2,273 |
| | Fujian Kuncai Material Technology Co. Ltd. Class A | 598,480 | 2,262 |
| *,2 | AInnovation Technology Group Co. Ltd. | 3,369,700 | 2,260 |
| * | Shanghai DZH Ltd. Class A | 1,812,088 | 2,256 |
| | Meinian Onehealth Healthcare Holdings Co. Ltd. Class A | 3,371,793 | 2,254 |
| | China Wafer Level CSP Co. Ltd. Class A | 571,583 | 2,253 |
| | China Petroleum Engineering Corp. Class A | 4,485,100 | 2,253 |
| * | Sichuan Hongda Co. Ltd. Class A | 1,846,000 | 2,250 |
| | China Railway Materials Co. Ltd. Class A | 5,721,100 | 2,249 |
| * | ASR Microelectronics Co. Ltd. Class A | 394,539 | 2,249 |
| | China Railway Hi-tech Industry Co. Ltd. Class A | 1,962,300 | 2,242 |
| * | Wuhan P&S Information Technology Co. Ltd. Class A | 1,212,000 | 2,242 |
| | China Resources Boya Bio-pharmaceutical Group Co. Ltd. Class A | 514,519 | 2,241 |
| | State Grid Yingda Co. Ltd. Class A | 2,734,269 | 2,238 |
| * | United Nova Technology Co. Ltd. Class A | 3,308,380 | 2,238 |
| | Cinda Securities Co. Ltd. Class A | 1,036,900 | 2,237 |
| | Wuhan East Lake High Technology Group Co. Ltd. Class A | 1,241,900 | 2,232 |
| | Xi'an Triangle Defense Co. Ltd. Class A | 592,620 | 2,229 |
| | Shanghai Shyndec Pharmaceutical Co. Ltd. Class A | 1,306,542 | 2,226 |
| | Shanghai Construction Group Co. Ltd. Class A | 6,290,900 | 2,223 |
| | Jiangxi Jovo Energy Co. Ltd. Class A | 598,400 | 2,223 |
| | Wuhan Jingce Electronic Group Co. Ltd. Class A | 257,761 | 2,222 |
| | Shaanxi Beiyuan Chemical Industry Group Co. Ltd. Class A | 3,710,160 | 2,221 |
| | Anhui Yingjia Distillery Co. Ltd. Class A | 260,800 | 2,206 |
| | Shanghai Stonehill Technology Co. Ltd. Class A | 5,067,821 | 2,200 |
| | Hongta Securities Co. Ltd. Class A | 1,841,900 | 2,199 |
| | CITIC Heavy Industries Co. Ltd. Class A | 3,535,287 | 2,194 |
| | Infore Environment Technology Group Co. Ltd. Class A | 3,230,888 | 2,192 |
| | Sichuan Jiuzhou Electric Co. Ltd. Class A | 1,091,700 | 2,192 |
| | Shenzhen Airport Co. Ltd. Class A | 2,236,800 | 2,186 |
| * | Zhejiang Jinke Tom Culture Industry Co. Ltd. Class A | 2,999,149 | 2,185 |
| | Loncin Motor Co. Ltd. Class A | 1,901,600 | 2,183 |
| | Shanghai Haixin Group Co. Class B | 7,509,733 | 2,179 |
| | Anhui Anke Biotechnology Group Co. Ltd. Class A | 1,687,517 | 2,177 |
| | Winning Health Technology Group Co. Ltd. Class A | 1,963,130 | 2,171 |
| | CETC Digital Technology Co. Ltd. Class A | 640,150 | 2,171 |
| * | Shandong Iron & Steel Co. Ltd. Class A | 10,002,700 | 2,170 |
| | Hefei Chipmore Technology Co. Ltd. Class A | 1,207,728 | 2,169 |
| * | Genimous Technology Co. Ltd. Class A | 1,322,640 | 2,162 |
| | Shanghai Daimay Automotive Interior Co. Ltd. Class A | 1,592,788 | 2,162 |
| | Shenzhen Gas Corp. Ltd. Class A | 2,087,100 | 2,154 |
| | Hoymiles Power Electronics Inc. Class A | 105,857 | 2,149 |
| | Hangzhou Dptech Technologies Co. Ltd. Class A | 659,931 | 2,144 |
| | Jonjee Hi-Tech Industrial & Commercial Holding Co. Ltd. Class A | 663,343 | 2,133 |
| | Zheshang Securities Co. Ltd. Class A | 1,173,647 | 2,130 |
| * | Dada Nexus Ltd. ADR | 1,275,492 | 2,130 |
| | Hangzhou Lion Microelectronics Co. Ltd. Class A | 572,480 | 2,130 |
| | Jiangsu Shagang Co. Ltd. Class A | 2,347,300 | 2,129 |
| | Fujian Funeng Co. Ltd. Class A | 1,610,134 | 2,128 |
| | Shaanxi Construction Engineering Group Corp. Ltd. Class A | 3,322,900 | 2,125 |
| * | Visionox Technology Inc. Class A | 1,583,072 | 2,122 |
| | Guangzhou Great Power Energy & Technology Co. Ltd. Class A | 445,300 | 2,118 |
| | Pacific Shuanglin Bio-pharmacy Co. Ltd. Class A | 671,959 | 2,114 |
| | Zhejiang Huace Film & Television Co. Ltd. Class A | 1,783,700 | 2,113 |
| | Nanjing King-Friend Biochemical Pharmaceutical Co. Ltd. Class A | 1,020,904 | 2,113 |
| * | BeiGene Ltd. Class A | 89,723 | 2,109 |
| | Neway Valve Suzhou Co. Ltd. Class A | 672,700 | 2,097 |
| | China World Trade Center Co. Ltd. Class A | 649,700 | 2,095 |
| | Wuhu Token Science Co. Ltd. Class A | 2,045,128 | 2,095 |
| | Hainan Haide Capital Management Co. Ltd. Class A | 1,772,132 | 2,095 |
| | Shijiazhuang Shangtai Technology Co. Ltd. Class A | 230,100 | 2,095 |
| | Arcsoft Corp. Ltd. Class A | 427,821 | 2,094 |
| * | Shenzhen Mason Technologies Co. Ltd. Class A | 762,600 | 2,092 |
| | Shandong Linglong Tyre Co. Ltd. Class A | 763,616 | 2,087 |
| | Keda Industrial Group Co. Ltd. Class A | 1,760,841 | 2,083 |
| * | Nanjing Tanker Corp. Class A | 4,365,671 | 2,080 |
| | Sichuan Expressway Co. Ltd. Class A | 2,667,492 | 2,078 |
| | Sonoscape Medical Corp. Class A | 415,061 | 2,078 |
| | Henan Mingtai Al Industrial Co. Ltd. Class A | 1,145,278 | 2,078 |
Total International Stock Index Fund
| | | | | | Shares | Market
Value•
($000) |
| | Yonfer Agricultural Technology Co. Ltd. Class A | 1,110,800 | 2,074 |
| | Anhui Zhongding Sealing Parts Co. Ltd. Class A | 1,108,380 | 2,072 |
| | Shanghai Huafon Aluminium Corp. Class A | 901,900 | 2,069 |
| | Lakala Payment Co. Ltd. Class A | 660,500 | 2,067 |
| | China Meheco Group Co. Ltd. Class A | 1,291,309 | 2,065 |
| | Sinocare Inc. Class A | 564,449 | 2,065 |
| | Weifu High-Technology Group Co. Ltd. Class A | 826,241 | 2,062 |
| | CNNC Hua Yuan Titanium Dioxide Co. Ltd. Class A | 3,400,870 | 2,061 |
| | China Railway Construction Heavy Industry Corp. Ltd. Class A | 3,274,384 | 2,054 |
| * | China Reform Health Management & Services Group Co. Ltd. Class A | 1,001,003 | 2,053 |
| | Zhongtai Securities Co. Ltd. Class A | 2,145,300 | 2,053 |
| | Shandong Pharmaceutical Glass Co. Ltd. Class A | 580,080 | 2,051 |
| * | Maanshan Iron & Steel Co. Ltd. Class H | 12,956,000 | 2,049 |
| | Titan Wind Energy Suzhou Co. Ltd. Class A | 1,592,800 | 2,049 |
| | Anhui Heli Co. Ltd. Class A | 811,000 | 2,047 |
| | Hunan TV & Broadcast Intermediary Co. Ltd. Class A | 1,428,270 | 2,038 |
| | Hangzhou Oxygen Plant Group Co. Ltd. Class A | 576,100 | 2,037 |
| | GCL Energy Technology Co. Ltd. Class A | 1,779,800 | 2,037 |
| | Taiji Computer Corp. Ltd. Class A | 542,591 | 2,036 |
| | Ovctek China Inc. Class A | 771,904 | 2,032 |
| | Oppein Home Group Inc. Class A | 205,000 | 2,029 |
| | Shannon Semiconductor Technology Co. Ltd. Class A | 425,200 | 2,027 |
| | COSCO SHIPPING Specialized Carriers Co. Ltd. Class A | 1,972,400 | 2,023 |
| | Harbin Boshi Automation Co. Ltd. Class A | 973,925 | 2,022 |
| | Shenzhen Yinghe Technology Co. Ltd. Class A | 610,474 | 2,022 |
| | Beijing BDStar Navigation Co. Ltd. Class A | 505,000 | 2,009 |
| | Guangzhou Kingmed Diagnostics Group Co. Ltd. Class A | 418,157 | 2,006 |
| 2 | China East Education Holdings Ltd. | 5,453,627 | 2,003 |
| * | Sinopec Oilfield Service Corp. Class A | 6,875,700 | 2,000 |
| | Shaanxi Huaqin Technology Industry Co. Ltd. Class A | 144,803 | 1,999 |
| | BBMG Corp. Class A | 7,690,291 | 1,998 |
| * | Polaris Bay Group Co. Ltd. Class A | 1,816,800 | 1,994 |
| * | Ourpalm Co. Ltd. Class A | 2,521,175 | 1,991 |
| | Eternal Asia Supply Chain Management Ltd. Class A | 2,267,197 | 1,989 |
| | Dajin Heavy Industry Co. Ltd. Class A | 598,500 | 1,987 |
| | Shenyang Xingqi Pharmaceutical Co. Ltd. Class A | 162,340 | 1,986 |
| | China Kings Resources Group Co. Ltd. Class A | 539,110 | 1,983 |
| | Yifan Pharmaceutical Co. Ltd. Class A | 1,109,900 | 1,982 |
| | STO Express Co. Ltd. Class A | 1,295,147 | 1,975 |
| | Xinxing Ductile Iron Pipes Co. Ltd. Class A | 3,607,800 | 1,974 |
| | Chongqing Fuling Zhacai Group Co. Ltd. Class A | 932,202 | 1,963 |
| | Changzhou Fusion New Material Co. Ltd. Class A | 269,969 | 1,958 |
| | TRS Information Technology Corp. Ltd. Class A | 816,200 | 1,952 |
| | Eastern Communications Co. Ltd. Class B | 4,633,259 | 1,951 |
| | JiuGui Liquor Co. Ltd. Class A | 275,000 | 1,951 |
| | Zhejiang Medicine Co. Ltd. Class A | 841,500 | 1,950 |
| | Anhui Jiangnan Chemical Industry Co. Ltd. Class A | 2,636,140 | 1,946 |
| | Zhejiang Weiming Environment Protection Co. Ltd. Class A | 675,175 | 1,945 |
| * | Tonghua Golden-Horse Pharmaceutical Industry Co. Ltd. Class A | 902,300 | 1,943 |
| | Jiangsu Guotai International Group Co. Ltd. Class A | 1,901,884 | 1,942 |
| | Huaming Power Equipment Co. Ltd. Class A | 806,000 | 1,941 |
| | Yankershop Food Co. Ltd. Class A | 275,244 | 1,940 |
| * | Suzhou Novosense Microelectronics Co. Ltd. Class A | 109,231 | 1,937 |
| | Zhejiang Orient Financial Holdings Group Co. Ltd. Class A | 2,718,627 | 1,933 |
| | Guangzhou Development Group Inc. Class A | 2,142,592 | 1,933 |
| | Wuxi NCE Power Co. Ltd. Class A | 383,301 | 1,929 |
| | Xinjiang Xintai Natural Gas Co. Ltd. Class A | 421,760 | 1,928 |
| | China Meidong Auto Holdings Ltd. | 6,664,558 | 1,924 |
| * | Guangdong Create Century Intelligent Equipment Group Corp. Ltd. Class A | 1,680,200 | 1,921 |
| | Tianshan Aluminum Group Co. Ltd. Class A | 1,653,200 | 1,921 |
| | Shanghai Wanye Enterprises Co. Ltd. Class A | 898,000 | 1,919 |
| | CETC Cyberspace Security Technology Co. Ltd. Class A | 707,989 | 1,918 |
| | CHN Energy Changyuan Electric Power Co. Ltd. Class A | 2,733,500 | 1,917 |
| | BTG Hotels Group Co. Ltd. Class A | 981,188 | 1,915 |
| | Ningbo Boway Alloy Material Co. Ltd. Class A | 692,100 | 1,912 |
| | Xi'an Bright Laser Technologies Co. Ltd. Class A | 299,576 | 1,910 |
| | Zibo Qixiang Tengda Chemical Co. Ltd. Class A | 2,590,664 | 1,907 |
| * | Suzhou Zelgen Biopharmaceutical Co. Ltd. Class A | 219,109 | 1,907 |
| | Yantai Eddie Precision Machinery Co. Ltd. Class A | 814,184 | 1,899 |
| | Huaihe Energy Group Co. Ltd. Class A | 3,608,500 | 1,898 |
Total International Stock Index Fund
| | | | | | Shares | Market
Value•
($000) |
| | Xiamen Bank Co. Ltd. Class A | 2,587,906 | 1,896 |
| | IKD Co. Ltd. Class A | 876,568 | 1,894 |
| * | Youdao Inc. ADR | 369,834 | 1,894 |
| | Chongqing Three Gorges Water Conservancy & Electric Power Co. Ltd. Class A | 1,827,216 | 1,883 |
| | Zhejiang Yinlun Machinery Co. Ltd. Class A | 707,662 | 1,883 |
| | Triumph Science & Technology Co. Ltd. Class A | 1,002,100 | 1,879 |
| | Xinxiang Richful Lube Additive Co. Ltd. Class A | 309,090 | 1,877 |
| * | Gree Real Estate Co. Ltd. Class A | 1,853,769 | 1,875 |
| | Guangdong Advertising Group Co. Ltd. Class A | 2,015,300 | 1,875 |
| | Archermind Technology Nanjing Co. Ltd. Class A | 204,093 | 1,875 |
| | ORG Technology Co. Ltd. Class A | 2,629,700 | 1,874 |
| * | Grandjoy Holdings Group Co. Ltd. Class A | 4,017,346 | 1,871 |
| *,2 | Mobvista Inc. | 7,240,000 | 1,869 |
| | Skyverse Technology Co. Ltd. Class A | 188,245 | 1,869 |
| | Gaona Aero Material Co. Ltd. Class A | 771,520 | 1,863 |
| | Southchip Semiconductor Technology Shanghai Co. Ltd. Class A | 371,700 | 1,863 |
| | Shantui Construction Machinery Co. Ltd. Class A | 1,481,100 | 1,860 |
| | Beijing Huafeng Test & Control Technology Co. Ltd. Class A | 110,391 | 1,857 |
| | Hubei Yihua Chemical Industry Co. Ltd. Class A | 930,400 | 1,850 |
| | Tonghua Dongbao Pharmaceutical Co. Ltd. Class A | 1,555,593 | 1,849 |
| | BrightGene Bio-Medical Technology Co. Ltd. Class A | 436,435 | 1,849 |
| | Jiangsu Pacific Quartz Co. Ltd. Class A | 429,649 | 1,847 |
| | China National Gold Group Gold Jewellery Co. Ltd. Class A | 1,484,700 | 1,844 |
| | Sichuan Hexie Shuangma Co. Ltd. Class A | 706,900 | 1,842 |
| | Goke Microelectronics Co. Ltd. Class A | 183,500 | 1,840 |
| | Jiangsu Azure Corp. Class A | 1,408,600 | 1,838 |
| | China Enterprise Co. Ltd. Class A | 4,193,931 | 1,835 |
| | Guangdong Construction Engineering Group Co. Ltd. Class A | 3,447,500 | 1,834 |
| | INESA Intelligent Tech Inc. Class A | 865,283 | 1,833 |
| *,1 | CMGE Technology Group Ltd. | 18,134,990 | 1,830 |
| | Beijing Sifang Automation Co. Ltd. Class A | 717,900 | 1,829 |
| | Jiangsu Linyang Energy Co. Ltd. Class A | 1,763,000 | 1,828 |
| * | Suzhou Secote Precision Electronic Co. Ltd. Class A | 184,500 | 1,824 |
| * | Anhui Tatfook Technology Co. Ltd. Class A | 764,216 | 1,821 |
| * | Bank of Zhengzhou Co. Ltd. Class A | 6,314,685 | 1,820 |
| | Liaoning Cheng Da Co. Ltd. Class A | 1,123,100 | 1,820 |
| | Gansu Energy Chemical Co. Ltd. Class A | 4,745,472 | 1,819 |
| * | Antong Holdings Co. Ltd. Class A | 4,679,400 | 1,818 |
| | Shenzhen Kingdom Sci-Tech Co. Ltd. Class A | 871,965 | 1,817 |
| | Shanghai Awinic Technology Co. Ltd. Class A | 187,162 | 1,816 |
| | Zhejiang Shuanghuan Driveline Co. Ltd. Class A | 459,462 | 1,814 |
| | Sansure Biotech Inc. Class A | 573,367 | 1,811 |
| | Fujian Longking Co. Ltd. Class A | 955,600 | 1,810 |
| | Tibet Urban Development & Investment Co. Ltd. Class A | 986,000 | 1,810 |
| * | Beijing Jetsen Technology Co. Ltd. Class A | 2,250,400 | 1,805 |
| * | Red Star Macalline Group Corp. Ltd. Class A | 4,083,564 | 1,803 |
| | Jiangsu Broadcasting Cable Information Network Corp. Ltd. Class A | 3,743,300 | 1,800 |
| | Rockchip Electronics Co. Ltd. Class A | 145,199 | 1,799 |
| | Edifier Technology Co. Ltd. Class A | 850,900 | 1,795 |
| | Huada Automotive Technology Corp. Ltd. Class A | 399,075 | 1,793 |
| * | Jiangxi Special Electric Motor Co. Ltd. Class A | 1,554,500 | 1,791 |
| | Espressif Systems Shanghai Co. Ltd. Class A | 100,713 | 1,790 |
| | Shenzhen Leaguer Co. Ltd. Class A | 1,195,900 | 1,783 |
| | Sai Micro Electronics Inc. Class A | 644,774 | 1,778 |
| | Arctech Solar Holding Co. Ltd. Class A | 148,591 | 1,778 |
| | Shenzhen Ysstech Info-tech Co. Ltd. Class A | 794,000 | 1,775 |
| | Guobang Pharma Ltd. Class A | 645,587 | 1,775 |
| | Castech Inc. Class A | 406,120 | 1,773 |
| | Shenzhen Topband Co. Ltd. Class A | 1,084,300 | 1,769 |
| | Joinn Laboratories China Co. Ltd. Class A | 718,582 | 1,768 |
| | Shenzhen Sunline Tech Co. Ltd. Class A | 694,400 | 1,767 |
| | Shanghai M&G Stationery Inc. Class A | 433,200 | 1,766 |
| | North Industries Group Red Arrow Co. Ltd. Class A | 739,900 | 1,766 |
| | Autel Intelligent Technology Corp. Ltd. Class A | 410,665 | 1,762 |
| | Zhuzhou Kibing Group Co. Ltd. Class A | 1,769,000 | 1,756 |
| * | 3peak Inc. Class A | 112,424 | 1,755 |
| | Qingdao Port International Co. Ltd. Class A | 1,484,720 | 1,751 |
| | Dongguan Yiheda Automation Co. Ltd. Class A | 481,105 | 1,751 |
| | Leader Harmonious Drive Systems Co. Ltd. Class A | 136,645 | 1,751 |
| | Beijing Balance Medical Technology Co. Ltd. Class A | 104,108 | 1,751 |
Total International Stock Index Fund
| | | | | | Shares | Market
Value•
($000) |
| *,2 | Microport Cardioflow Medtech Corp. | 18,860,905 | 1,749 |
| | Beibuwan Port Co. Ltd. Class A | 1,547,140 | 1,745 |
| | Nantong Jianghai Capacitor Co. Ltd. Class A | 834,345 | 1,744 |
| | Zhejiang Jingu Co. Ltd. Class A | 1,054,612 | 1,743 |
| | Fujian Boss Software Development Co. Ltd. Class A | 729,480 | 1,743 |
| *,1 | China South City Holdings Ltd. | 60,545,084 | 1,731 |
| | Jiangling Motors Corp. Ltd. Class A | 481,278 | 1,731 |
| | Xiamen Xiangyu Co. Ltd. Class A | 2,093,901 | 1,731 |
| | Tibet Rhodiola Pharmaceutical Holding Co. Class A | 326,170 | 1,729 |
| | Wasu Media Holding Co. Ltd. Class A | 1,649,700 | 1,727 |
| | Vanchip Tianjin Technology Co. Ltd. Class A | 359,858 | 1,725 |
| | Riyue Heavy Industry Co. Ltd. Class A | 937,561 | 1,720 |
| | Range Intelligent Computing Technology Group Co. Ltd. Class A | 382,000 | 1,717 |
| | Shenzhen Senior Technology Material Co. Ltd. Class A | 1,117,821 | 1,712 |
| | Shanghai Haohai Biological Technology Co. Ltd. Class A | 186,185 | 1,710 |
| | Beijing eGOVA Co. Ltd. Class A | 591,742 | 1,708 |
| | Wondershare Technology Group Co. Ltd. Class A | 198,569 | 1,708 |
| * | Farasis Energy Gan Zhou Co. Ltd. Class A | 1,009,067 | 1,706 |
| *,2 | Arrail Group Ltd. | 4,038,500 | 1,705 |
| | YGSOFT Inc. Class A | 1,901,455 | 1,703 |
| * | Maanshan Iron & Steel Co. Ltd. Class A | 5,170,861 | 1,700 |
| | Dazhong Mining Co. Ltd. | 1,427,980 | 1,698 |
| | Xiamen ITG Group Corp. Ltd. Class A | 1,848,300 | 1,697 |
| | Quectel Wireless Solutions Co. Ltd. Class A | 230,518 | 1,696 |
| | Shuangliang Eco-Energy Systems Co. Ltd. Class A | 1,674,100 | 1,696 |
| | Zhejiang Wolwo Bio-Pharmaceutical Co. Ltd. Class A | 507,652 | 1,695 |
| | Beijing Jingneng Power Co. Ltd. Class A | 3,184,600 | 1,691 |
| | Anker Innovations Technology Co. Ltd. Class A | 150,020 | 1,691 |
| | China Tianying Inc. Class A | 2,447,700 | 1,690 |
| | Chongqing Taiji Industry Group Co. Ltd. Class A | 468,100 | 1,690 |
| | ZWSOFT Co. Ltd. Guangzhou Class A | 128,339 | 1,688 |
| | Longshine Technology Group Co. Ltd. Class A | 970,856 | 1,683 |
| * | Oriental Energy Co. Ltd. Class A | 1,355,200 | 1,682 |
| | Hainan Strait Shipping Co. Ltd. Class A | 2,024,051 | 1,680 |
| | Kehua Data Co. Ltd. Class A | 451,480 | 1,679 |
| | KPC Pharmaceuticals Inc. Class A | 784,700 | 1,678 |
| | Xi'An Shaangu Power Co. Ltd. Class A | 1,355,800 | 1,678 |
| | CITIC Metal Co. Ltd. Class A | 1,501,100 | 1,678 |
| * | Beijing Shunxin Agriculture Co. Ltd. Class A | 666,729 | 1,676 |
| | Bank of Xi'an Co. Ltd. Class A | 3,288,339 | 1,676 |
| * | Sensteed Hi-tech Group Class A | 8,327,700 | 1,674 |
| | Bank of Lanzhou Co. Ltd. Class A | 4,778,000 | 1,672 |
| | Fibocom Wireless Inc. Class A | 726,408 | 1,671 |
| | Hangzhou EZVIZ Network Co. Ltd. Class A | 381,217 | 1,671 |
| | Zhejiang Xianju Pharmaceutical Co. Ltd. Class A | 951,400 | 1,669 |
| | Beijing Urban Construction Investment & Development Co. Ltd. Class A | 1,822,400 | 1,669 |
| * | Sinocelltech Group Ltd. Class A | 312,213 | 1,669 |
| | Jiangzhong Pharmaceutical Co. Ltd. Class A | 563,400 | 1,668 |
| * | Harbin Hatou Investment Co. Ltd. Class A | 1,591,549 | 1,667 |
| | Huaxia Eye Hospital Group Co. Ltd. Class A | 554,270 | 1,667 |
| * | Sino-Ocean Group Holding Ltd. | 38,729,553 | 1,665 |
| | Shanghai Dazhong Public Utilities Group Co. Ltd. Class A | 2,224,000 | 1,665 |
| | Jiangxi Ganyue Expressway Co. Ltd. Class A | 2,307,600 | 1,665 |
| | G-bits Network Technology Xiamen Co. Ltd. Class A | 58,049 | 1,663 |
| | Hainan Mining Co. Ltd. Class A | 1,699,100 | 1,663 |
| * | Orient Group Inc. Class A | 3,504,600 | 1,663 |
| | Guangzhou Port Co. Ltd. Class A | 3,386,200 | 1,663 |
| | Bank of Qingdao Co. Ltd. Class A | 3,192,893 | 1,662 |
| | Shenzhen Expressway Corp. Ltd. Class A | 1,204,348 | 1,662 |
| * | Jushri Technologies Inc. Class A | 562,200 | 1,660 |
| | Bluestar Adisseo Co. Class A | 1,072,112 | 1,659 |
| | MLS Co. Ltd. Class A | 1,374,116 | 1,658 |
| | Shenzhen CECport Technologies Co. Ltd. Class A | 584,199 | 1,653 |
| | Ningbo Ronbay New Energy Technology Co. Ltd. Class A | 391,033 | 1,650 |
| | Yunnan Lincang Xinyuan Germanium Industrial Co. Ltd. Class A | 607,489 | 1,647 |
| * | Roshow Technology Co. Ltd. Class A | 1,757,200 | 1,647 |
| | Tibet Huayu Mining Co. Ltd. Class A | 882,000 | 1,645 |
| | Winall Hi-Tech Seed Co. Ltd. Class A | 855,960 | 1,644 |
| | iRay Technology Co. Ltd. Class A | 99,411 | 1,641 |
| | Zhuzhou Hongda Electronics Corp. Ltd. Class A | 349,100 | 1,640 |
Total International Stock Index Fund
| | | | | | Shares | Market
Value•
($000) |
| | Mehow Innovative Ltd. Class A | 360,700 | 1,638 |
| | Yuan Longping High-tech Agriculture Co. Ltd. Class A | 1,061,000 | 1,635 |
| | Shanghai MicroPort Endovascular MedTech Group Co. Ltd. Class A | 116,695 | 1,635 |
| | Advanced Fiber Resources Zhuhai Ltd. Class A | 227,965 | 1,632 |
| * | Angang Steel Co. Ltd. Class A | 4,720,450 | 1,631 |
| * | Sinochem International Corp. Class A | 2,742,000 | 1,631 |
| | Guangzhou Guangri Stock Co. Ltd. Class A | 888,400 | 1,626 |
| * | Financial Street Holdings Co. Ltd. Class A | 3,228,505 | 1,623 |
| | Sinofibers Technology Co. Ltd. Class A | 372,623 | 1,622 |
| | Wuxi Autowell Technology Co. Ltd. Class A | 213,052 | 1,618 |
| | CQ Pharmaceutical Holding Co. Ltd. Class A | 2,093,501 | 1,616 |
| | Hangjin Technology Co. Ltd. Class A | 636,200 | 1,612 |
| | City Development Environment Co. Ltd. Class A | 850,600 | 1,612 |
| | Zhejiang Jiuzhou Pharmaceutical Co. Ltd. Class A | 701,665 | 1,611 |
| | Guangzhou Wondfo Biotech Co. Ltd. Class A | 462,076 | 1,610 |
| | Biem.L.Fdlkk Garment Co. Ltd. Class A | 583,540 | 1,610 |
| | Caida Securities Co. Ltd. Class A | 1,539,600 | 1,608 |
| | Mayinglong Pharmaceutical Group Co. Ltd. Class A | 455,425 | 1,607 |
| | China Merchants Port Group Co. Ltd. Class A | 559,474 | 1,603 |
| | POCO Holding Co. Ltd. Class A | 243,800 | 1,602 |
| | Anhui Jinhe Industrial Co. Ltd. Class A | 494,773 | 1,601 |
| * | Addsino Co. Ltd. Class A | 1,350,000 | 1,600 |
| | Leo Group Co. Ltd. Class A | 5,903,800 | 1,599 |
| | Shenzhen FRD Science & Technology Co. Ltd. Class A | 537,901 | 1,595 |
| * | Zotye Automobile Co. Ltd. Class A | 4,649,655 | 1,593 |
| * | Guangdong Golden Dragon Development Inc. Class A | 854,000 | 1,592 |
| | Guizhou Chanhen Chemical Corp. Class A | 532,100 | 1,591 |
| 3 | Ningbo Xusheng Group Co. Ltd. Class A | 882,240 | 1,590 |
| | Guangdong Xinbao Electrical Appliances Holdings Co. Ltd. Class A | 761,215 | 1,589 |
| | First Tractor Co. Ltd. Class A | 744,400 | 1,589 |
| | Xinjiang Joinworld Co. Ltd. Class A | 1,535,900 | 1,589 |
| | Hubei Jumpcan Pharmaceutical Co. Ltd. Class A | 373,617 | 1,586 |
| | Chinalin Securities Co. Ltd. Class A | 913,000 | 1,585 |
| | Advanced Technology & Materials Co. Ltd. Class A | 1,038,800 | 1,584 |
| | Guangdong Aofei Data Technology Co. Ltd. Class A | 890,070 | 1,583 |
| | Xinhuanet Co. Ltd. Class A | 470,135 | 1,581 |
| | HBIS Resources Co. Ltd. Class A | 766,800 | 1,581 |
| | Guangdong Provincial Expressway Development Co. Ltd. Class A | 1,045,600 | 1,580 |
| | Zhejiang Daily Digital Culture Group Co. Ltd. Class A | 1,027,500 | 1,580 |
| | Sanwei Holding Group Co. Ltd. Class A | 878,700 | 1,580 |
| | Do-Fluoride New Materials Co. Ltd. Class A | 923,300 | 1,577 |
| | Hangzhou Honghua Digital Technology Stock Co. Ltd. Class A | 162,861 | 1,577 |
| | Tianjin Chase Sun Pharmaceutical Co. Ltd. Class A | 2,715,377 | 1,575 |
| | Zhejiang Jingxin Pharmaceutical Co. Ltd. Class A | 899,160 | 1,573 |
| | Guocheng Mining Co. Ltd. Class A | 935,164 | 1,571 |
| * | Beijing Aosaikang Pharmaceutical Co. Ltd. Class A | 842,800 | 1,571 |
| | China Southern Power Grid Energy Storage Co. Ltd. Class A | 1,036,100 | 1,571 |
| | Zhongshan Public Utilities Group Co. Ltd. Class A | 1,257,430 | 1,567 |
| | Wuhan Raycus Fiber Laser Technologies Co. Ltd. Class A | 523,372 | 1,564 |
| | Shanxi Lanhua Sci-Tech Venture Co. Ltd. Class A | 1,330,940 | 1,562 |
| | Hangzhou Iron & Steel Co. Class A | 2,703,700 | 1,560 |
| | Shandong Weifang Rainbow Chemical Co. Ltd. Class A | 235,000 | 1,559 |
| | Shanghai Foreign Service Holding Group Co. Ltd. Class A | 2,139,700 | 1,558 |
| | Hoyuan Green Energy Co. Ltd. Class A | 465,554 | 1,558 |
| | Perfect World Co. Ltd. Class A | 1,102,250 | 1,555 |
| | Tianjin Port Co. Ltd. Class A | 2,299,829 | 1,553 |
| | Ganzhou Teng Yuan Cobalt New Material Co. Ltd. Class A | 228,159 | 1,552 |
| | Kidswant Children Products Co. Ltd. Class A | 985,213 | 1,548 |
| | Chengxin Lithium Group Co. Ltd. Class A | 754,270 | 1,545 |
| | Xiamen Kingdomway Group Co. Class A | 667,531 | 1,538 |
| | Micro-Tech Nanjing Co. Ltd. Class A | 151,102 | 1,538 |
| | Fushun Special Steel Co. Ltd. Class A | 1,557,400 | 1,535 |
| | China Southern Power Grid Energy Efficiency&Clean Energy Co. Ltd. Class A | 2,315,615 | 1,530 |
| * | Xian International Medical Investment Co. Ltd. Class A | 2,001,300 | 1,528 |
| | Yantai Zhenghai Magnetic Material Co. Ltd. Class A | 793,700 | 1,526 |
| | Beijing Haohua Energy Resource Co. Ltd. Class A | 1,273,120 | 1,526 |
| | Lizhong Sitong Light Alloys Group Co. Ltd. Class A | 565,478 | 1,525 |
| * | Jiangsu Haili Wind Power Equipment Technology Co. Ltd. Class A | 158,547 | 1,525 |
| | Sunflower Pharmaceutical Group Co. Ltd. Class A | 550,695 | 1,523 |
| | Tongyu Heavy Industry Co. Ltd. Class A | 3,654,500 | 1,522 |
Total International Stock Index Fund
| | | | | | Shares | Market
Value•
($000) |
| 2 | Joinn Laboratories China Co. Ltd. Class H | 1,339,958 | 1,519 |
| | DongFeng Automobile Co. Ltd. Class A | 1,642,900 | 1,517 |
| | Guangdong Baolihua New Energy Stock Co. Ltd. Class A | 2,261,700 | 1,516 |
| | Yangling Metron New Material Inc. Class A | 423,700 | 1,516 |
| | Leyard Optoelectronic Co. Ltd. Class A | 2,029,000 | 1,515 |
| | China Conch Environment Protection Holdings Ltd. | 14,083,611 | 1,515 |
| | Xiamen King Long Motor Group Co. Ltd. Class A | 736,421 | 1,515 |
| | M-Grass Ecology & Environment Group Co. Ltd. Class A | 1,505,600 | 1,512 |
| | CNSIG Inner Mongolia Chemical Industry Co. Ltd. Class A | 1,271,974 | 1,512 |
| * | Cinda Real Estate Co. Ltd. Class A | 1,999,514 | 1,511 |
| * | Aerospace Hi-Tech Holdings Group Ltd. Class A | 772,084 | 1,510 |
| | Baoji Titanium Industry Co. Ltd. Class A | 350,242 | 1,508 |
| | Shenzhen Techwinsemi Technology Co. Ltd. Class A | 129,900 | 1,508 |
| | Hangzhou Shunwang Technology Co. Ltd. Class A | 727,143 | 1,507 |
| * | Guizhou Broadcasting & TV Information Network Co. Ltd. Class A | 1,080,600 | 1,507 |
| | China Merchants Property Operation & Service Co. Ltd. Class A | 926,700 | 1,507 |
| | Xianhe Co. Ltd. Class A | 575,100 | 1,507 |
| | Anhui Expressway Co. Ltd. Class A | 789,733 | 1,505 |
| | Yunnan Energy Investment Co. Ltd. Class A | 834,362 | 1,493 |
| | Kailuan Energy Chemical Co. Ltd. Class A | 1,567,500 | 1,490 |
| | Yantai Dongcheng Pharmaceutical Co. Ltd. Class A | 809,419 | 1,489 |
| | Jiangsu Provincial Agricultural Reclamation & Development Corp. Class A | 1,047,900 | 1,489 |
| * | TPV Technology Co. Ltd. Class A | 3,715,200 | 1,486 |
| | Chongqing Sanfeng Environment Group Corp. Ltd. Class A | 1,207,100 | 1,485 |
| * | Client Service International Inc. Class A | 412,050 | 1,482 |
| | Henan Lingrui Pharmaceutical Co. Class A | 491,300 | 1,482 |
| | Shanxi Coking Co. Ltd. Class A | 2,524,771 | 1,480 |
| | Zhejiang Provincial New Energy Investment Group Co. Ltd. Class A | 1,289,500 | 1,475 |
| | Universal Scientific Industrial Shanghai Co. Ltd. Class A | 704,700 | 1,471 |
| | Beijing Dahao Technology Corp. Ltd. Class A | 702,180 | 1,471 |
| | Shanghai Sinyang Semiconductor Materials Co. Ltd. Class A | 264,700 | 1,468 |
| | Qianhe Condiment & Food Co. Ltd. Class A | 846,422 | 1,466 |
| | Zhejiang Communications Technology Co. Ltd. Class A | 2,424,941 | 1,465 |
| | Chengdu Information Technology of Chinese Academy of Sciences Co. Ltd. Class A | 274,400 | 1,463 |
| | Estun Automation Co. Ltd. Class A | 686,000 | 1,461 |
| | Zhejiang Jiahua Energy Chemical Industry Co. Ltd. Class A | 1,347,200 | 1,459 |
| | Shenzhen H&T Intelligent Control Co. Ltd. Class A | 852,900 | 1,454 |
| | Juewei Food Co. Ltd. Class A | 567,264 | 1,451 |
| * | Zhejiang Dun'An Artificial Environment Co. Ltd. Class A | 927,700 | 1,451 |
| | Hefei Meiya Optoelectronic Technology Inc. Class A | 662,896 | 1,450 |
| | Eastern Communications Co. Ltd. Class A | 819,500 | 1,450 |
| | Jiangxi Hongcheng Environment Co. Ltd. Class A | 1,086,600 | 1,446 |
| | Shandong Humon Smelting Co. Ltd. Class A | 927,700 | 1,444 |
| | DeHua TB New Decoration Materials Co. Ltd. Class A | 821,154 | 1,442 |
| | FESCO Group Co. Ltd. Class A | 503,100 | 1,441 |
| | Qingdao Baheal Pharmaceutical Co. Ltd. Class A | 375,285 | 1,439 |
| | Servyou Software Group Co. Ltd. Class A | 353,600 | 1,438 |
| | Shenzhen Zhaowei Machinery & Electronic Co. Ltd. Class A | 220,780 | 1,438 |
| * | COFCO Biotechnology Co. Ltd. Class A | 1,751,138 | 1,436 |
| * | Henan Zhongfu Industry Co. Ltd. Class A | 3,517,300 | 1,435 |
| * | Zhuhai Aerospace Microchips Science & Technology Co. Ltd. Class A | 599,600 | 1,433 |
| | China Science Publishing & Media Ltd. Class A | 479,300 | 1,433 |
| | Beijing Aerospace Shenzhou Intelligent Equipment Technology Co. Ltd. Class A | 702,000 | 1,432 |
| | China Tungsten & Hightech Materials Co. Ltd. Class A | 1,060,020 | 1,432 |
| 2 | Midea Real Estate Holding Ltd. | 3,341,135 | 1,431 |
| | Liaoning Chengda Biotechnology Co. Ltd. Class A | 373,129 | 1,431 |
| | Norinco International Cooperation Ltd. Class A | 988,849 | 1,430 |
| | China Bester Group Telecom Co. Ltd. Class A | 399,179 | 1,429 |
| | Sichuan Injet Electric Co. Ltd. Class A | 201,500 | 1,427 |
| | Zhejiang Qianjiang Motorcycle Co. Ltd. Class A | 581,400 | 1,424 |
| | Focus Technology Co. Ltd. Class A | 338,500 | 1,421 |
| | XTC New Energy Materials Xiamen Co. Ltd. Class A | 279,197 | 1,420 |
| | CMST Development Co. Ltd. Class A | 1,922,706 | 1,419 |
| * | Hybio Pharmaceutical Co. Ltd. Class A | 839,100 | 1,419 |
| * | Beijing Orient National Communication Science & Technology Co. Ltd. Class A | 1,008,100 | 1,417 |
| | Jiangsu Jiangyin Rural Commercial Bank Co. Ltd. Class A | 2,506,315 | 1,417 |
| | Guangdong Zhongsheng Pharmaceutical Co. Ltd. Class A | 777,800 | 1,417 |
| * | Gansu Jiu Steel Group Hongxing Iron & Steel Co. Ltd. Class A | 5,012,900 | 1,417 |
| * | JoulWatt Technology Co. Ltd. Class A | 394,340 | 1,417 |
| | Shenzhen Yan Tian Port Holding Co. Ltd. Class A | 2,032,955 | 1,416 |
Total International Stock Index Fund
| | | | | | Shares | Market
Value•
($000) |
| * | LianChuang Electronic Technology Co. Ltd. Class A | 1,011,309 | 1,416 |
| | New Guomai Digital Culture Co. Ltd. Class A | 743,579 | 1,416 |
| | Shanghai Fullhan Microelectronics Co. Ltd. Class A | 203,110 | 1,416 |
| * | Remegen Co. Ltd. Class A | 321,254 | 1,415 |
| | Shanghai SMI Holding Co. Ltd. Class A | 2,007,400 | 1,414 |
| | Shandong Publishing & Media Co. Ltd. Class A | 941,487 | 1,413 |
| * | China Kepei Education Group Ltd. | 8,583,574 | 1,413 |
| | Hunan Jiudian Pharmaceutical Co. Ltd. Class A | 432,000 | 1,413 |
| *,1 | LVGEM China Real Estate Investment Co. Ltd. | 15,188,602 | 1,412 |
| | Tangshan Sanyou Chemical Industries Co. Ltd. Class A | 1,820,900 | 1,410 |
| | Sichuan Yahua Industrial Group Co. Ltd. Class A | 945,700 | 1,407 |
| | Zhongmin Energy Co. Ltd. Class A | 1,631,800 | 1,406 |
| | Shanghai Zijiang Enterprise Group Co. Ltd. Class A | 1,642,603 | 1,404 |
| | JS Corrugating Machinery Co. Ltd. Class A | 610,600 | 1,403 |
| | Skyworth Digital Co. Ltd. Class A | 701,757 | 1,402 |
| | Tibet Mineral Development Co. Ltd. Class A | 454,900 | 1,402 |
| | Anhui Hengyuan Coal Industry & Electricity Power Co. Ltd. Class A | 1,055,700 | 1,401 |
| | Shenzhen Suntak Circuit Technology Co. Ltd. Class A | 1,064,400 | 1,401 |
| | Sichuan Teway Food Group Co. Ltd. Class A | 699,942 | 1,400 |
| * | Wonders Information Co. Ltd. Class A | 1,247,700 | 1,398 |
| * | Guangdong Dongfang Precision Science & Technology Co. Ltd. Class A | 1,365,400 | 1,397 |
| * | BOE HC SemiTek Corp. | 1,584,500 | 1,397 |
| | Shanghai Fudan Microelectronics Group Co. Ltd. Class A | 226,094 | 1,396 |
| | Jingjin Equipment Inc. Class A | 549,340 | 1,393 |
| | Shanghai Yaoji Technology Co. Ltd. Class A | 371,100 | 1,391 |
| * | Shanghai Anlogic Infotech Co. Ltd. Class A | 347,094 | 1,391 |
| | Fangda Special Steel Technology Co. Ltd. Class A | 2,242,839 | 1,390 |
| | Shenzhen Tagen Group Co. Ltd. Class A | 2,235,945 | 1,389 |
| | Tongling Jingda Special Magnet Wire Co. Ltd. Class A | 1,734,400 | 1,388 |
| | B-Soft Co. Ltd. Class A | 1,746,795 | 1,387 |
| * | CICT Mobile Communication Technology Co. Ltd. Class A | 1,510,599 | 1,387 |
| * | Vcanbio Cell & Gene Engineering Corp. Ltd. Class A | 449,274 | 1,386 |
| *,3 | Tianjin Trolia Information Technology Co. Ltd. Class A | 3,161,500 | 1,386 |
| *,2 | Red Star Macalline Group Corp. Ltd. Class H | 6,526,764 | 1,383 |
| | Levima Advanced Materials Corp. Class A | 600,553 | 1,381 |
| | Anhui Xinhua Media Co. Ltd. Class A | 1,323,400 | 1,379 |
| | Tianjin Capital Environmental Protection Group Co. Ltd. Class A | 1,617,775 | 1,379 |
| | Wuxi Rural Commercial Bank Co. Ltd. Class A | 1,727,000 | 1,379 |
| | Guotai Epoint Software Co. Ltd. Class A | 262,788 | 1,378 |
| * | Beijing VRV Software Corp. Ltd. Class A | 1,547,200 | 1,376 |
| | Beijing Zhong Ke San Huan High-Tech Co. Ltd. Class A | 962,205 | 1,375 |
| | Laobaixing Pharmacy Chain JSC Class A | 602,674 | 1,374 |
| * | Gosuncn Technology Group Co. Ltd. Class A | 1,743,400 | 1,373 |
| | Shanghai AJ Group Co. Ltd. Class A | 1,631,100 | 1,373 |
| | Sino-Platinum Metals Co. Ltd. Class A | 689,858 | 1,373 |
| * | Shenzhen Dynanonic Co. Ltd. Class A | 245,166 | 1,371 |
| | Bright Dairy & Food Co. Ltd. Class A | 1,157,448 | 1,370 |
| | HUYA Inc. ADR | 395,636 | 1,369 |
| | Guangdong Tapai Group Co. Ltd. Class A | 1,237,687 | 1,368 |
| | Kunshan Kinglai Hygienic Materials Co. Ltd. Class A | 369,405 | 1,365 |
| | Sinopep-Allsino Bio Pharmaceutical Co. Ltd. Class A | 200,060 | 1,365 |
| * | China Express Airlines Co. Ltd. Class A | 1,222,790 | 1,364 |
| | Shenzhen Agricultural Products Group Co. Ltd. Class A | 1,482,400 | 1,363 |
| | Shanghai Waigaoqiao Free Trade Zone Group Co. Ltd. Class A | 845,509 | 1,363 |
| | Sumec Corp. Ltd. Class A | 1,073,300 | 1,361 |
| | Shanghai Pret Composites Co. Ltd. Class A | 1,151,160 | 1,360 |
| | Shenzhen Changhong Technology Co. Ltd. Class A | 473,753 | 1,359 |
| | Shenzhen Kstar Science & Technology Co. Ltd. Class A | 486,850 | 1,358 |
| | Zhejiang Jolly Pharmaceutical Co. Ltd. Class A | 590,800 | 1,356 |
| | China TransInfo Technology Co. Ltd. Class A | 940,000 | 1,355 |
| | Beijing CTJ Information Technology Co. Ltd. Class A | 319,084 | 1,354 |
| | Valiant Co. Ltd. Class A | 899,400 | 1,348 |
| | Lao Feng Xiang Co. Ltd. Class A | 195,328 | 1,348 |
| * | Guangxi Huaxi Nonferrous Metal Co. Ltd. Class A | 537,900 | 1,348 |
| | Shengda Resources Co. Ltd. Class A | 648,000 | 1,346 |
| | Kaishan Group Co. Ltd. Class A | 1,002,149 | 1,345 |
| | Henan Yuguang Gold & Lead Co. Ltd. Class A | 1,385,700 | 1,345 |
| | Weaver Network Technology Co. Ltd. Class A | 227,700 | 1,343 |
| | Nanjing Gaoke Co. Ltd. Class A | 1,260,300 | 1,341 |
| * | RongFa Nuclear Equipment Co. Ltd. Class A | 1,877,700 | 1,341 |
Total International Stock Index Fund
| | | | | | Shares | Market
Value•
($000) |
| * | CGN Nuclear Technology Development Co. Ltd. Class A | 1,314,728 | 1,338 |
| * | Konka Group Co. Ltd. Class A | 1,345,700 | 1,335 |
| | Anhui Truchum Advanced Materials & Technology Co. Ltd. Class A | 1,492,400 | 1,335 |
| | Yuanjie Semiconductor Technology Co. Ltd. Class A | 60,981 | 1,335 |
| * | Alpha Group Class A | 1,335,100 | 1,329 |
| | Shanghai Runda Medical Technology Co. Ltd. Class A | 557,000 | 1,329 |
| | Shanying International Holding Co. Ltd. Class A | 5,151,400 | 1,326 |
| * | Xi'an Tian He Defense Technology Co. Ltd. Class A | 673,100 | 1,325 |
| | Pylon Technologies Co. Ltd. Class A | 192,577 | 1,325 |
| | Yunda Holding Co. Ltd. Class A | 1,130,885 | 1,323 |
| | Zhejiang Huatie Emergency Equipment Science & Technology Co. Ltd. | 1,729,400 | 1,323 |
| * | Beijing Thunisoft Corp. Ltd. Class A | 908,600 | 1,318 |
| | Anhui Construction Engineering Group Co. Ltd. Class A | 1,928,587 | 1,316 |
| | Guangzhou Restaurant Group Co. Ltd. Class A | 583,360 | 1,315 |
| | Zhejiang Xinan Chemical Industrial Group Co. Ltd. Class A | 1,122,800 | 1,314 |
| * | Zhejiang Hisoar Pharmaceutical Co. Ltd. Class A | 1,569,000 | 1,311 |
| * | Western Region Gold Co. Ltd. Class A | 713,000 | 1,311 |
| | Shandong Yisheng Livestock & Poultry Breeding Co. Ltd. Class A | 1,036,813 | 1,310 |
| | Shenzhen YHLO Biotech Co. Ltd. Class A | 515,376 | 1,310 |
| | Ningbo Huaxiang Electronic Co. Ltd. Class A | 727,600 | 1,309 |
| | Far East Smarter Energy Co. Ltd. Class A | 1,763,900 | 1,309 |
| * | Harbin Pharmaceutical Group Co. Ltd. Class A | 2,347,809 | 1,308 |
| 1 | Helens International Holdings Co. Ltd. | 4,434,223 | 1,306 |
| | Shanghai Bailian Group Co. Ltd. Class B | 2,293,420 | 1,305 |
| | Shenzhen Microgate Technology Co. Ltd. Class A | 688,200 | 1,305 |
| * | Yueyang Forest & Paper Co. Ltd. Class A | 1,508,435 | 1,303 |
| | Chongqing Chuanyi Automation Co. Ltd. Class A | 447,980 | 1,303 |
| | Fujian Star-net Communication Co. Ltd. Class A | 529,433 | 1,302 |
| * | Inner Mongolia Furui Medical Science Co. Ltd. Class A | 239,500 | 1,302 |
| | BOC International China Co. Ltd. Class A | 798,300 | 1,301 |
| | China National Accord Medicines Corp. Ltd. Class A | 331,563 | 1,299 |
| * | YaGuang Technology Group Co. Ltd. Class A | 1,272,500 | 1,294 |
| | Huapont Life Sciences Co. Ltd. Class A | 1,996,100 | 1,293 |
| * | Chengdu CORPRO Technology Co. Ltd. Class A | 526,000 | 1,291 |
| | Neusoft Corp. Class A | 824,800 | 1,290 |
| | Changzheng Engineering Technology Co. Ltd. Class A | 579,526 | 1,290 |
| | Zhejiang Wanma Co. Ltd. Class A | 1,167,518 | 1,289 |
| | Bank of Suzhou Co. Ltd. Class A | 1,199,880 | 1,289 |
| * | Leshan Giantstar Farming & Husbandry Corp. Ltd. Class A | 467,125 | 1,289 |
| | Shandong Hi-Speed Road & Bridge Co. Ltd. Class A | 1,416,900 | 1,286 |
| | China CAMC Engineering Co. Ltd. Class A | 1,140,800 | 1,286 |
| | CIG Shanghai Co. Ltd. Class A | 247,600 | 1,286 |
| * | Shenzhen Chipscreen Biosciences Co. Ltd. Class A | 396,267 | 1,285 |
| | Explosive Co. Ltd. Class A | 741,200 | 1,284 |
| | Shenzhen Desay Battery Technology Co. Class A | 362,251 | 1,280 |
| * | Huatu Cendes Co. Ltd. Class A | 120,600 | 1,277 |
| | GoodWe Technologies Co. Ltd. Class A | 170,735 | 1,275 |
| | Chengzhi Co. Ltd. Class A | 1,133,107 | 1,274 |
| | NYOCOR Co. Ltd. Class A | 1,586,600 | 1,273 |
| | Guizhou Panjiang Refined Coal Co. Ltd. Class A | 1,651,900 | 1,271 |
| | Sichuan Anning Iron & Titanium Co. Ltd. Class A | 311,770 | 1,271 |
| * | Shenzhen Baoming Technology Co. Ltd. Class A | 164,300 | 1,271 |
| | Hunan Zhongke Electric Co. Ltd. Class A | 630,497 | 1,269 |
| | Jointo Energy Investment Co. Ltd. Hebei Class A | 1,716,400 | 1,264 |
| | Triangle Tyre Co. Ltd. Class A | 618,800 | 1,262 |
| | Anhui Yingliu Electromechanical Co. Ltd. Class A | 597,200 | 1,261 |
| | Chongqing Department Store Co. Ltd. Class A | 406,400 | 1,260 |
| | ABA Chemicals Corp. Class A | 1,014,400 | 1,259 |
| * | Tibet Tianlu Co. Ltd. Class A | 1,376,050 | 1,256 |
| | IReader Technology Co. Ltd. Class A | 454,300 | 1,254 |
| * | Beijing Tongtech Co. Ltd. Class A | 526,422 | 1,254 |
| * | Dosilicon Co. Ltd. Class A | 365,795 | 1,254 |
| | Zhejiang Conba Pharmaceutical Co. Ltd. Class A | 1,877,400 | 1,253 |
| | Toread Holdings Group Co. Ltd. Class A | 1,045,798 | 1,253 |
| * | 5I5J Holding Group Co. Ltd. Class A | 2,501,981 | 1,252 |
| | Shinva Medical Instrument Co. Ltd. Class A | 514,540 | 1,252 |
| | Nanjing Vazyme Biotech Co. Ltd. Class A | 374,444 | 1,252 |
| | Baowu Magnesium Technology Co. Ltd. Class A | 876,212 | 1,251 |
| | PCI Technology Group Co. Ltd. Class A | 1,814,000 | 1,250 |
| | Sinosteel Engineering & Technology Co. Ltd. Class A | 1,367,500 | 1,249 |
Total International Stock Index Fund
| | | | | | Shares | Market
Value•
($000) |
| | Beijing SuperMap Software Co. Ltd. Class A | 455,102 | 1,246 |
| | Hualan Biological Vaccine Inc. Class A | 461,400 | 1,245 |
| | Jiangsu Xukuang Energy Co. Ltd. Class A | 1,651,100 | 1,245 |
| * | China Fortune Land Development Co. Ltd. Class A | 3,858,700 | 1,242 |
| | Changjiang Publishing & Media Co. Ltd. Class A | 1,063,000 | 1,241 |
| | Guangdong South New Media Co. Ltd. Class A | 222,495 | 1,241 |
| | Suzhou Good-Ark Electronics Co. Ltd. Class A | 736,800 | 1,241 |
| | Nanjing Hanrui Cobalt Co. Ltd. Class A | 246,600 | 1,237 |
| | Qingdao Eastsoft Communication Technology Co. Ltd. Class A | 511,800 | 1,236 |
| | Qiming Information Technology Co. Ltd. Class A | 404,400 | 1,236 |
| * | China Nonferrous Metal Industry's Foreign Engineering & Construction Co. Ltd. Class A | 1,746,900 | 1,235 |
| * | Jilin Yatai Group Co. Ltd. Class A | 3,948,800 | 1,233 |
| | Amoy Diagnostics Co. Ltd. Class A | 362,970 | 1,232 |
| | Sumavision Technologies Co. Ltd. Class A | 1,459,200 | 1,231 |
| | Suzhou Anjie Technology Co. Ltd. Class A | 559,721 | 1,231 |
| | Chengdu Wintrue Holding Co. Ltd. Class A | 1,102,400 | 1,230 |
| | Tofflon Science & Technology Group Co. Ltd. Class A | 683,400 | 1,229 |
| | Innuovo Technology Co. Ltd. Class A | 1,168,300 | 1,228 |
| | Jack Technology Co. Ltd. Class A | 299,400 | 1,227 |
| * | Shanghai Aerospace Automobile Electromechanical Co. Ltd. Class A | 1,073,000 | 1,227 |
| * | Bio-Thera Solutions Ltd. Class A | 376,874 | 1,226 |
| | Nanjing Xinjiekou Department Store Co. Ltd. Class A | 1,321,272 | 1,224 |
| * | Sun Create Electronics Co. Ltd. Class A | 291,300 | 1,223 |
| | Dongguan Development Holdings Co. Ltd. Class A | 805,100 | 1,221 |
| | Sinomach Automobile Co. Ltd. Class A | 1,352,400 | 1,220 |
| * | Beijing Philisense Technology Co. Ltd. Class A | 1,597,300 | 1,219 |
| | FAWER Automotive Parts Co. Ltd. Class A | 1,637,010 | 1,218 |
| | Camel Group Co. Ltd. Class A | 1,012,512 | 1,218 |
| * | Jiangsu Zongyi Co. Ltd. Class A | 1,398,100 | 1,218 |
| | Anhui Kouzi Distillery Co. Ltd. Class A | 223,300 | 1,217 |
| | Zhuzhou Times New Material Technology Co. Ltd. Class A | 701,600 | 1,217 |
| | Sichuan Haite High-tech Co. Ltd. Class A | 723,100 | 1,214 |
| | Qingdao Haier Biomedical Co. Ltd. Class A | 278,959 | 1,214 |
| | Jiangsu Cnano Technology Co. Ltd. Class A | 291,265 | 1,210 |
| | Sunward Intelligent Equipment Co. Ltd. Class A | 1,073,708 | 1,208 |
| | Jiangsu ToLand Alloy Co. Ltd. Class A | 347,750 | 1,207 |
| | Xinyu Iron & Steel Co. Ltd. Class A | 2,250,100 | 1,205 |
| * | Mabwell Shanghai Bioscience Co. Ltd. Class A | 374,375 | 1,205 |
| * | CIMC Vehicles Group Co. Ltd. Class A | 840,000 | 1,204 |
| | Shenzhen Batian Ecotypic Engineering Co. Ltd. Class A | 1,054,100 | 1,203 |
| | Shanghai Hanbell Precise Machinery Co. Ltd. Class A | 464,700 | 1,203 |
| | Jiangsu Gian Technology Co. Ltd. Class A | 196,200 | 1,202 |
| | China Southern Power Grid Technology Co. Ltd. Class A | 242,933 | 1,202 |
| | Southern Publishing & Media Co. Ltd. Class A | 615,100 | 1,202 |
| | Sanquan Food Co. Ltd. Class A | 782,125 | 1,201 |
| | Jiangsu Asia-Pacific Light Alloy Technology Co. Ltd. Class A | 1,519,600 | 1,201 |
| | China Publishing & Media Co. Ltd. Class A | 1,246,300 | 1,200 |
| | Shandong Yulong Gold Co. Ltd. Class A | 688,800 | 1,200 |
| | Zhongyuan Environment-Protection Co. Ltd. Class A | 948,783 | 1,199 |
| | Jiang Su Suyan Jingshen Co. Ltd. Class A | 756,500 | 1,199 |
| | Porton Pharma Solutions Ltd. Class A | 459,571 | 1,198 |
| | Anhui Honglu Steel Construction Group Co. Ltd. Class A | 589,811 | 1,198 |
| | Ningbo Yongxin Optics Co. Ltd. Class A | 97,000 | 1,197 |
| | C&S Paper Co. Ltd. Class A | 1,196,908 | 1,196 |
| | Moon Environment Technology Co. Ltd. Class A | 794,000 | 1,194 |
| | Suning Universal Co. Ltd. Class A | 3,542,392 | 1,192 |
| * | China High Speed Railway Technology Co. Ltd. Class A | 3,251,913 | 1,189 |
| | Shenzhen Hello Tech Energy Co. Ltd. Class A | 100,679 | 1,188 |
| | ShaanXi Provincial Natural Gas Co. Ltd. Class A | 1,084,100 | 1,187 |
| | Guangdong Ellington Electronics Technology Co. Ltd. Class A | 862,400 | 1,187 |
| | Sangfor Technologies Inc. Class A | 127,679 | 1,186 |
| | Gansu Yasheng Industrial Group Co. Ltd. Class A | 2,948,600 | 1,186 |
| | Beijing Chunlizhengda Medical Instruments Co. Ltd. Class H | 1,162,090 | 1,186 |
| * | Phenix Optical Co. Ltd. Class A | 320,521 | 1,186 |
| | Zhongshan Broad Ocean Motor Co. Ltd. Class A | 1,457,100 | 1,185 |
| | Giantec Semiconductor Corp. Class A | 139,415 | 1,183 |
| | Zhejiang Shaoxing RuiFeng Rural Commercial Bank Co. Ltd. Class A | 1,621,394 | 1,183 |
| | Linktel Technologies Co. Ltd. Class A | 108,400 | 1,179 |
| | Milkyway Intelligent Supply Chain Service Group Co. Ltd. Class A | 147,000 | 1,178 |
| | Shandong Jinjing Science & Technology Co. Ltd. Class A | 1,358,800 | 1,177 |
Total International Stock Index Fund
| | | | | | Shares | Market
Value•
($000) |
| | Shaanxi Fenghuo Electronics Co. Ltd. Class A | 763,900 | 1,175 |
| | Baimtec Material Co. Ltd. Class A | 140,289 | 1,172 |
| | Shanghai Jahwa United Co. Ltd. Class A | 505,000 | 1,169 |
| | Foran Energy Group Co. Ltd. Class A | 734,945 | 1,168 |
| | Shanghai Zhenhua Heavy Industries Co. Ltd. Class A | 2,024,800 | 1,168 |
| | Montnets Cloud Technology Group Co. Ltd. Class A | 738,900 | 1,167 |
| | Beyondsoft Corp. Class A | 610,300 | 1,167 |
| | Shanghai Bailian Group Co. Ltd. Class A | 848,500 | 1,166 |
| * | Anhui Golden Seed Winery Co. Ltd. Class A | 649,900 | 1,166 |
| | Qinhuangdao Port Co. Ltd. Class A | 2,434,200 | 1,164 |
| * | Focused Photonics Hangzhou Inc. Class A | 469,100 | 1,164 |
| | Shanghai Datun Energy Resources Co. Ltd. Class A | 636,900 | 1,163 |
| * | Chongqing Genrix Biopharmaceutical Co. Ltd. Class A | 286,152 | 1,163 |
| * | China Union Holdings Ltd. Class A | 1,762,187 | 1,160 |
| | Luxin Venture Capital Group Co. Ltd. Class A | 563,000 | 1,160 |
| | Guodian Nanjing Automation Co. Ltd. Class A | 1,101,840 | 1,160 |
| | North Huajin Chemical Industries Co. Ltd. Class A | 1,535,800 | 1,159 |
| * | Shenyang Jinbei Automotive Co. Ltd. Class A | 1,399,200 | 1,158 |
| | Shanghai AtHub Co. Ltd. Class A | 498,989 | 1,157 |
| * | Shandong Hi-Speed New Energy Group Ltd. | 5,940,861 | 1,157 |
| | Beijing North Star Co. Ltd. Class A | 4,025,381 | 1,156 |
| | CTS International Logistics Corp. Ltd. Class A | 1,327,532 | 1,156 |
| * | GuangYuYuan Chinese Herbal Medicine Co. Ltd. Class A | 421,100 | 1,156 |
| | Chongqing Water Group Co. Ltd. Class A | 1,660,200 | 1,155 |
| * | Beijing Haixin Energy Technology Co. Ltd. Class A | 2,051,961 | 1,154 |
| | Xinjiang Xuefeng Sci-Tech Group Co. Ltd. Class A | 939,300 | 1,154 |
| | North China Pharmaceutical Co. Ltd. Class A | 1,432,800 | 1,151 |
| | Shanghai Huayi Group Co. Ltd. Class A | 1,214,400 | 1,148 |
| | Shanghai Mechanical & Electrical Industry Co. Ltd. Class A | 432,800 | 1,147 |
| | Changzhou Qianhong Biopharma Co. Ltd. Class A | 1,283,800 | 1,146 |
| | Jinko Power Technology Co. Ltd. Class A | 2,547,200 | 1,143 |
| | Beijing Wandong Medical Technology Co. Ltd. Class A | 570,800 | 1,142 |
| | Lihuayi Weiyuan Chemical Co. Ltd. Class A | 540,956 | 1,139 |
| | Hymson Laser Technology Group Co. Ltd. Class A | 214,485 | 1,137 |
| | Cheng De Lolo Co. Ltd. Class A | 929,868 | 1,136 |
| | Jiangxi Ganneng Co. Ltd. Class A | 910,200 | 1,136 |
| | Nanjing Cosmos Chemical Co. Ltd. Class A | 306,800 | 1,136 |
| | Sichuan Jiuyuan Yinhai Software Co. Ltd. Class A | 359,100 | 1,135 |
| | PNC Process Systems Co. Ltd. Class A | 308,880 | 1,133 |
| * | Shenzhen Hepalink Pharmaceutical Group Co. Ltd. Class A | 727,807 | 1,132 |
| * | Hainan Development Holdings Nanhai Co. Ltd. Class A | 984,600 | 1,129 |
| | Chengdu Fusen Noble-House Industrial Co. Ltd. Class A | 600,500 | 1,128 |
| | Kunshan Dongwei Technology Co. Ltd. Class A | 287,303 | 1,128 |
| | Hand Enterprise Solutions Co. Ltd. Class A | 845,500 | 1,125 |
| * | China Harzone Industry Corp. Ltd. Class A | 841,475 | 1,125 |
| * | Qinchuan Machine Tool & Tool Group Share Co. Ltd. Class A | 894,700 | 1,125 |
| | Jiangsu Guoxin Corp. Ltd. Class A | 1,035,300 | 1,124 |
| | Beijing Yuanliu Hongyuan Electronic Technology Co. Ltd. Class A | 191,235 | 1,124 |
| * | Geo-Jade Petroleum Corp. Class A | 3,272,700 | 1,124 |
| | Guomai Technologies Inc. Class A | 953,500 | 1,121 |
| | Aotecar New Energy Technology Co. Ltd. Class A | 2,748,200 | 1,119 |
| * | Shenzhen Fine Made Electronics Group Co. Ltd. Class A | 182,266 | 1,118 |
| | Shanghai Pudong Construction Co. Ltd. Class A | 1,302,839 | 1,117 |
| * | Beijing Watertek Information Technology Co. Ltd. Class A | 1,926,800 | 1,117 |
| | Jiangsu Changshu Rural Commercial Bank Co. Ltd. Class A | 1,142,240 | 1,117 |
| | Luenmei Quantum Co. Ltd. Class A | 1,340,770 | 1,116 |
| * | Primarius Technologies Co. Ltd. Class A | 395,638 | 1,116 |
| | Guangdong Hongtu Technology Holdings Co. Ltd. Class A | 660,469 | 1,115 |
| * | CSG Smart Science&Technology Co. Ltd. Class A | 937,300 | 1,114 |
| * | Shaanxi Aerospace Power Hi-Tech Co. Ltd. Class A | 678,800 | 1,114 |
| | Windey Energy Technology Group Co. Ltd. Class A | 587,600 | 1,113 |
| * | CCCG Real Estate Corp. Ltd. Class A | 731,300 | 1,113 |
| | Central China Land Media Co. Ltd. Class A | 733,200 | 1,113 |
| | Tianneng Battery Group Co. Ltd. Class A | 269,555 | 1,113 |
| | Chengdu RML Technology Co. Ltd. Class A | 133,210 | 1,110 |
| | Guizhou Xinbang Pharmaceutical Co. Ltd. Class A | 2,213,800 | 1,106 |
| | Keboda Technology Co. Ltd. Class A | 138,400 | 1,104 |
| | Zhejiang HangKe Technology Inc. Co. Class A | 426,585 | 1,103 |
| | Beijing Strong Biotechnologies Inc. Class A | 569,700 | 1,102 |
| * | ChangYuan Technology Group Ltd. Class A | 1,356,100 | 1,101 |
Total International Stock Index Fund
| | | | | | Shares | Market
Value•
($000) |
| * | Bestway Marine & Energy Technology Co. Ltd. Class A | 1,374,100 | 1,101 |
| * | New Journey Health Technology Group Co. Ltd. Class A | 3,056,100 | 1,101 |
| | Jihua Group Corp. Ltd. Class A | 2,623,700 | 1,100 |
| * | Shandong Dongyue Silicone Material Co. Ltd. Class A | 922,000 | 1,100 |
| * | Shandong Longda Meishi Co. Ltd. Class A | 1,142,099 | 1,097 |
| | TDG Holdings Co. Ltd. Class A | 1,007,100 | 1,097 |
| | Fujian Apex Software Co. Ltd. Class A | 199,320 | 1,097 |
| | Tayho Advanced Materials Group Co. Ltd. Class A | 785,700 | 1,096 |
| | Guangdong Electric Power Development Co. Ltd. Class A | 1,588,300 | 1,096 |
| | Grinm Advanced Materials Co. Ltd. Class A | 676,800 | 1,091 |
| | Chow Tai Seng Jewellery Co. Ltd. Class A | 687,201 | 1,090 |
| | Zhejiang Jiecang Linear Motion Technology Co. Ltd. Class A | 397,261 | 1,090 |
| * | Zhejiang Hisun Pharmaceutical Co. Ltd. Class A | 917,100 | 1,089 |
| | Wuxi Huaguang Environment & Energy Group Co. Ltd. Class A | 848,200 | 1,089 |
| | ZheJiang Dali Technology Co. Ltd. Class A | 581,440 | 1,088 |
| * | Jinneng Holding Shanxi Electric Power Co. Ltd. Class A | 2,901,501 | 1,087 |
| | GRG Metrology & Test Group Co. Ltd. Class A | 444,960 | 1,087 |
| | Anhui Guangxin Agrochemical Co. Ltd. Class A | 715,008 | 1,087 |
| | Suzhou Gold Mantis Construction Decoration Co. Ltd. Class A | 2,121,150 | 1,083 |
| * | Shanghai Milkground Food Tech Co. Ltd. Class A | 473,600 | 1,082 |
| | Daan Gene Co. Ltd. Class A | 1,241,370 | 1,079 |
| | ZhongMan Petroleum & Natural Gas Group Corp. Ltd. Class A | 363,241 | 1,079 |
| | Xinfengming Group Co. Ltd. Class A | 681,669 | 1,079 |
| | Jiaozuo Wanfang Aluminum Manufacturing Co. Ltd. Class A | 1,032,576 | 1,079 |
| | Ningbo Yunsheng Co. Ltd. Class A | 1,100,300 | 1,078 |
| | Shandong Denghai Seeds Co. Ltd. Class A | 754,700 | 1,078 |
| | Youngy Co. Ltd. Class A | 219,700 | 1,076 |
| | Beijing Bei Mo Gao Ke Friction Material Co. Ltd. Class A | 314,613 | 1,073 |
| | Mesnac Co. Ltd. Class A | 972,100 | 1,073 |
| | Shenzhen Noposin Crop Science Co. Ltd. Class A | 823,100 | 1,072 |
| | CSG Holding Co. Ltd. Class A | 1,382,132 | 1,071 |
| | Zhejiang Jiemei Electronic & Technology Co. Ltd. Class A | 356,260 | 1,070 |
| * | INKON Life Technology Co. Ltd. Class A | 743,300 | 1,070 |
| | Kuangda Technology Group Co. Ltd. Class A | 1,373,700 | 1,070 |
| | Beijing GeoEnviron Engineering & Technology Inc. Class A | 1,433,955 | 1,066 |
| | Autohome Inc. Class A | 151,457 | 1,066 |
| * | Rising Nonferrous Metals Share Co. Ltd. Class A | 251,100 | 1,066 |
| | Shanghai Ganglian E-Commerce Holdings Co. Ltd. Class A | 304,300 | 1,065 |
| * | Zhejiang Yongtai Technology Co. Ltd. Class A | 772,264 | 1,062 |
| | Dian Diagnostics Group Co. Ltd. Class A | 594,000 | 1,062 |
| | Greattown Holdings Ltd. Class A | 1,986,700 | 1,061 |
| * | Wellhope Foods Co. Ltd. Class A | 921,083 | 1,061 |
| | Chengdu Kanghua Biological Products Co. Ltd. Class A | 124,909 | 1,061 |
| * | Huayi Brothers Media Corp. Class A | 2,624,300 | 1,060 |
| * | Minmetals Development Co. Ltd. Class A | 990,610 | 1,059 |
| | Guizhou Zhenhua Fengguang Semiconductor Co. Ltd. Class A | 128,072 | 1,059 |
| * | Beijing Capital Development Co. Ltd. Class A | 2,560,813 | 1,058 |
| | Shandong Xinhua Pharmaceutical Co. Ltd. Class A | 475,500 | 1,058 |
| * | VanJee Technology Co. Ltd. Class A | 189,800 | 1,056 |
| | Beijing Gehua CATV Network Co. Ltd. Class A | 1,005,666 | 1,054 |
| * | Toyou Feiji Electronics Co. Ltd. Class A | 405,900 | 1,054 |
| *,1 | Jin Medical International Ltd. | 527,068 | 1,054 |
| | Shenzhen Laibao Hi-tech Co. Ltd. Class A | 654,800 | 1,053 |
| | Jinlei Technology Co. Ltd. Class A | 300,359 | 1,053 |
| | Opple Lighting Co. Ltd. Class A | 429,756 | 1,052 |
| | Jiangsu Kanion Pharmaceutical Co. Ltd. Class A | 522,600 | 1,052 |
| | Henan Zhongyuan Expressway Co. Ltd. Class A | 1,866,800 | 1,052 |
| * | JiangSu WuZhong Pharmaceutical Development Co. Ltd. Class A | 742,100 | 1,052 |
| | Hangzhou Sunrise Technology Co. Ltd. Class A | 440,200 | 1,051 |
| | Shanghai Liangxin Electrical Co. Ltd. Class A | 1,084,192 | 1,044 |
| * | UTour Group Co. Ltd. Class A | 955,700 | 1,043 |
| | Luoyang Xinqianglian Slewing Bearing Co. Ltd. Class A | 327,793 | 1,043 |
| | NanJi E-Commerce Co. Ltd. Class A | 2,289,093 | 1,042 |
| | Autobio Diagnostics Co. Ltd. Class A | 164,505 | 1,041 |
| | PhiChem Corp. Class A | 472,160 | 1,040 |
| | Joyoung Co. Ltd. Class A | 733,277 | 1,039 |
| * | Shenzhen Intellifusion Technologies Co. Ltd. Class A | 243,444 | 1,039 |
| * | Jishi Media Co. Ltd. Class A | 3,645,900 | 1,037 |
| | Jiangsu Suzhou Rural Commercial Bank Co. Ltd. Class A | 1,460,600 | 1,037 |
| | Jiangsu Ruitai New Energy Materials Co. Ltd. Class A | 439,300 | 1,036 |
Total International Stock Index Fund
| | | | | | Shares | Market
Value•
($000) |
| | Visual China Group Co. Ltd. Class A | 497,697 | 1,035 |
| | Shanghai Yizhong Pharmaceutical Co. Ltd. Class A | 183,389 | 1,035 |
| | Chengdu Leejun Industrial Co. Ltd. Class A | 1,188,300 | 1,034 |
| | Chongqing Road & Bridge Co. Ltd. Class A | 1,061,900 | 1,034 |
| | Beijing Aerospace Changfeng Co. Ltd. Class A | 572,558 | 1,033 |
| | Vatti Corp. Ltd. Class A | 931,300 | 1,031 |
| | Anhui Huaheng Biotechnology Co. Ltd. Class A | 210,973 | 1,029 |
| | Xinhua Winshare Publishing & Media Co. Ltd. Class A | 520,052 | 1,027 |
| * | Shanghai Guijiu Co. Ltd. Class A | 403,600 | 1,027 |
| | Insigma Technology Co. Ltd. Class A | 1,024,600 | 1,027 |
| | Bros Eastern Co. Ltd. Class A | 1,372,600 | 1,026 |
| * | Shandong Sinobioway Biomedicine Co. Ltd. Class A | 610,900 | 1,026 |
| * | Sansteel Minguang Co. Ltd. Fujian Class A | 2,107,900 | 1,025 |
| | Lingyun Industrial Corp. Ltd. Class A | 808,000 | 1,025 |
| * | Kingsignal Technology Co. Ltd. Class A | 781,700 | 1,024 |
| | Sino Biological Inc. Class A | 108,269 | 1,024 |
| * | Hunan New Wellful Co. Ltd. Class A | 1,133,700 | 1,021 |
| | Jiangsu Yinhe Electronics Co. Ltd. Class A | 1,164,400 | 1,019 |
| | Jiangsu Zijin Rural Commercial Bank Co. Ltd. Class A | 2,580,000 | 1,017 |
| | Qingdao East Steel Tower Stock Co. Ltd. Class A | 1,036,900 | 1,017 |
| * | Huafu Fashion Co. Ltd. Class A | 1,846,024 | 1,016 |
| | Jiangsu Dingsheng New Energy Materials Co. Ltd. Class A | 775,300 | 1,015 |
| | Goldenmax International Group Ltd. Class A | 858,300 | 1,014 |
| | Sunstone Development Co. Ltd. Class A | 522,642 | 1,014 |
| | Hubei Jiuzhiyang Infrared System Co. Ltd. Class A | 184,800 | 1,014 |
| | Jade Bird Fire Co. Ltd. Class A | 685,772 | 1,014 |
| | Zhejiang Chengchang Technology Co. Ltd. Class A | 165,087 | 1,013 |
| * | Guangdong Zhongnan Iron & Steel Co. Ltd. Class A | 2,336,400 | 1,012 |
| * | Beijing UniStrong Science & Technology Co. Ltd. Class A | 903,200 | 1,009 |
| | Beijing SL Pharmaceutical Co. Ltd. Class A | 980,900 | 1,008 |
| | Sino Wealth Electronic Ltd. Class A | 279,255 | 1,008 |
| | Jinhui Liquor Co. Ltd. Class A | 349,682 | 1,008 |
| * | Datang Huayin Electric Power Co. Ltd. Class A | 2,062,900 | 1,008 |
| | Digiwin Co. Ltd. | 300,763 | 1,007 |
| | Bear Electric Appliance Co. Ltd. Class A | 158,890 | 1,006 |
| | Guangxi Wuzhou Zhongheng Group Co. Ltd. Class A | 2,754,700 | 1,005 |
| * | Shanghai Shibei Hi-Tech Co. Ltd. Class A | 1,326,300 | 1,003 |
| | Shenzhen Hopewind Electric Co. Ltd. Class A | 387,980 | 1,002 |
| | Zhejiang Garden Biopharmaceutical Co. Ltd. Class A | 483,991 | 1,001 |
| | Suzhou New District Hi-Tech Industrial Co. Ltd. Class A | 1,187,830 | 1,000 |
| | Shenzhen Fuanna Bedding & Furnishing Co. Ltd. Class A | 844,500 | 998 |
| * | Sinodata Co. Ltd. Class A | 362,900 | 998 |
| * | MCC Meili Cloud Computing Industry Investment Co. Ltd. Class A | 694,600 | 997 |
| | Stanley Agricultural Group Co. Ltd. Class A | 973,864 | 996 |
| * | Pengxin International Mining Co. Ltd. Class A | 2,182,819 | 995 |
| | Shanghai Highly Group Co. Ltd. Class A | 618,900 | 995 |
| | Jiangsu Etern Co. Ltd. Class A | 1,338,400 | 994 |
| | PharmaBlock Sciences Nanjing Inc. Class A | 195,977 | 993 |
| | Changshu Tianyin Electromechanical Co. Ltd. Class A | 365,400 | 991 |
| * | Hainan Haiyao Co. Ltd. Class A | 1,341,500 | 991 |
| | Northeast Pharmaceutical Group Co. Ltd. Class A | 1,393,800 | 990 |
| | Guangdong DFP New Material Group Co. Ltd. | 1,969,800 | 990 |
| | Wuxi Boton Technology Co. Ltd. Class A | 369,100 | 987 |
| | Lancy Co. Ltd. Class A | 396,400 | 987 |
| * | Shanghai Electric Wind Power Group Co. Ltd. Class A | 1,394,678 | 987 |
| * | AECC Aero Science & Technology Co. Ltd. Class A | 339,600 | 986 |
| | Hainan Expressway Co. Ltd. Class A | 1,172,600 | 984 |
| | Shanghai Baolong Automotive Corp. Class A | 182,600 | 984 |
| | Shenzhen Das Intellitech Co. Ltd. Class A | 2,018,100 | 983 |
| | Anhui Wanwei Updated High-Tech Material Industry Co. Ltd. Class A | 1,722,900 | 983 |
| | Suzhou Nanomicro Technology Co. Ltd. Class A | 339,400 | 983 |
| | Shanghai Tongji Science & Technology Industrial Co. Ltd. Class A | 835,500 | 982 |
| | Edan Instruments Inc. Class A | 671,600 | 982 |
| | Luoniushan Co. Ltd. Class A | 1,132,600 | 979 |
| * | Zhewen Interactive Group Co. Ltd. Class A | 1,247,300 | 976 |
| | Ningbo Zhenyu Technology Co. Ltd. Class A | 100,473 | 975 |
| * | Hongbo Co. Ltd. Class A | 461,726 | 975 |
| | Changhong Meiling Co. Ltd. Class A | 783,800 | 975 |
| | Jolywood Suzhou Sunwatt Co. Ltd. Class A | 845,400 | 974 |
| | Changchun Faway Automobile Components Co. Ltd. Class A | 764,150 | 970 |
Total International Stock Index Fund
| | | | | | Shares | Market
Value•
($000) |
| | Shenzhen Minglida Precision Technology Co. Ltd. Class A | 364,200 | 969 |
| | Dlg Exhibitions & Events Corp. Ltd. Class A | 946,260 | 968 |
| * | Shenzhen Neptunus Bioengineering Co. Ltd. Class A | 2,479,900 | 968 |
| | Jiangsu Hengshun Vinegar Industry Co. Ltd. Class A | 885,900 | 968 |
| | Wuxi Paike New Materials Technology Co. Ltd. Class A | 118,600 | 968 |
| | Xinjiang Communications Construction Group Co. Ltd. Class A | 603,000 | 966 |
| * | Lecron Industrial Development Group Co. Ltd. Class A | 1,169,300 | 966 |
| | Semitronix Corp. Class A | 122,001 | 966 |
| * | ADAMA Ltd. Class A | 933,088 | 965 |
| | Qingdao Gaoce Technology Co. Ltd. Class A | 499,470 | 965 |
| * | Greatoo Intelligent Equipment Inc. Class A | 1,877,400 | 964 |
| | Zhejiang Construction Investment Group Co. Ltd. Class A | 751,300 | 963 |
| | Top Energy Co. Ltd. Shanxi Class A | 1,028,100 | 963 |
| | Yixintang Pharmaceutical Group Co. Ltd. Class A | 509,579 | 962 |
| | Guilin Sanjin Pharmaceutical Co. Ltd. Class A | 461,205 | 962 |
| | Zhejiang Runtu Co. Ltd. Class A | 1,053,712 | 961 |
| * | Henan Ancai Hi-Tech Co. Ltd. Class A | 1,226,244 | 961 |
| * | Wutong Holding Group Co. Ltd. Class A | 1,150,300 | 959 |
| | Beijing Relpow Technology Co. Ltd. Class A | 507,650 | 959 |
| | Zhejiang Hangmin Co. Ltd. Class A | 925,800 | 958 |
| | Keshun Waterproof Technologies Co. Ltd. Class A | 1,167,720 | 958 |
| *,3 | Shanghai Bright Power Semiconductor Co. Ltd. Class A | 66,735 | 958 |
| * | Sino GeoPhysical Co. Ltd. Class A | 469,463 | 957 |
| | China Television Media Ltd. Class A | 373,522 | 955 |
| | Yibin Tianyuan Group Co. Ltd. Class A | 1,517,850 | 955 |
| | Zhongtong Bus Co. Ltd. Class A | 600,900 | 955 |
| | Shenzhen Click Technology Co. Ltd. Class A | 554,900 | 954 |
| | Sufa Technology Industry Co. Ltd. CNNC Class A | 367,300 | 952 |
| | Fujian Expressway Development Co. Ltd. Class A | 1,948,800 | 951 |
| * | Ningxia Western Venture Industrial Co. Ltd. Class A | 1,367,600 | 951 |
| * | Merit Interactive Co. Ltd. Class A | 423,300 | 949 |
| * | Tangrenshen Group Co. Ltd. Class A | 1,270,500 | 948 |
| | Topsec Technologies Group Inc. Class A | 854,400 | 947 |
| | Jiajiayue Group Co. Ltd. Class A | 610,605 | 947 |
| | Guangdong Marubi Biotechnology Co. Ltd. Class A | 225,700 | 945 |
| | Shanghai Industrial Development Co. Ltd. Class A | 1,824,500 | 944 |
| | Ningbo Peacebird Fashion Co. Ltd. Class A | 512,029 | 944 |
| | Shandong Lukang Pharma Class A | 806,300 | 944 |
| * | Lanzhou LS Heavy Equipment Co. Ltd. Class A | 1,186,600 | 943 |
| * | Offcn Education Technology Co. Ltd. Class A | 2,041,662 | 943 |
| | Shenzhen Properties & Resources Development Group Ltd. Class A | 647,200 | 943 |
| * | Guoguang Electric Co. Ltd. Class A | 505,800 | 942 |
| | Wushang Group Co. Ltd. Class A | 797,600 | 937 |
| * | Hunan Er-Kang Pharmaceutical Co. Ltd. Class A | 2,233,600 | 935 |
| * | Beijing Join-Cheer Software Co. Ltd. Class A | 1,015,600 | 935 |
| | Shanxi Guoxin Energy Corp. Ltd. Class A | 2,324,280 | 934 |
| * | Shenzhen Clou Electronics Co. Ltd. Class A | 1,560,016 | 932 |
| | Shandong Bohui Paper Industrial Co. Ltd. Class A | 1,434,600 | 931 |
| | Sichuan EM Technology Co. Ltd. Class A | 771,500 | 929 |
| | Wuhan Fingu Electronic Technology Co. Ltd. Class A | 601,800 | 926 |
| * | Jiangyin Hengrun Heavy Industries Co. Ltd. Class A | 438,650 | 926 |
| * | KingClean Electric Co. Ltd. Class A | 265,519 | 924 |
| | Guangdong Dowstone Technology Co. Ltd. Class A | 524,300 | 923 |
| | Shanghai Flyco Electrical Appliance Co. Ltd. Class A | 173,746 | 921 |
| * | Kunwu Jiuding Investment Holdings Co. Ltd. Class A | 396,900 | 918 |
| | Xilinmen Furniture Co. Ltd. Class A | 322,900 | 918 |
| * | Minmetals New Energy Materials(Hunan) Co. Ltd. | 1,135,273 | 918 |
| * | C*Core Technology Co. Ltd. Class A | 305,497 | 917 |
| | Shenzhen Sinovatio Technology Co. Ltd. Class A | 198,300 | 916 |
| | Renhe Pharmacy Co. Ltd. Class A | 1,128,600 | 915 |
| | Chengdu Guoguang Electric Co. Ltd. Class A | 99,397 | 914 |
| | Shenzhen Topway Video Communication Co. Ltd. Class A | 692,200 | 914 |
| | Jinhong Gas Co. Ltd. Class A | 341,237 | 914 |
| | Zhende Medical Co. Ltd. Class A | 281,700 | 913 |
| | Shandong WIT Dyne Health Co. Ltd. Class A | 226,875 | 913 |
| | Asian Star Anchor Chain Co. Ltd. Jiangsu Class A | 803,300 | 913 |
| | Innovation New Material Technology Co. Ltd. Class A | 1,562,540 | 911 |
| | Zhejiang Yonggui Electric Equipment Co. Ltd. Class A | 368,700 | 911 |
| * | Anyang Iron & Steel Inc. Class A | 3,158,700 | 910 |
| | Betta Pharmaceuticals Co. Ltd. Class A | 140,100 | 909 |
Total International Stock Index Fund
| | | | | | Shares | Market
Value•
($000) |
| | China Wuyi Co. Ltd. Class A | 2,073,805 | 908 |
| | Jiangsu Guomao Reducer Co. Ltd. Class A | 649,389 | 907 |
| | China Sports Industry Group Co. Ltd. Class A | 785,901 | 905 |
| | Shanxi Blue Flame Holding Co. Ltd. Class A | 995,643 | 904 |
| | Zhejiang Yasha Decoration Co. Ltd. Class A | 1,623,492 | 904 |
| | Sanjiang Shopping Club Co. Ltd. Class A | 604,200 | 904 |
| | Appotronics Corp. Ltd. Class A | 393,065 | 904 |
| * | NSFOCUS Technologies Group Co. Ltd. Class A | 687,484 | 903 |
| | Sinosoft Co. Ltd. Class A | 289,380 | 903 |
| | Foshan Electrical & Lighting Co. Ltd. Class A | 1,141,500 | 900 |
| * | Henan Yuneng Holdings Co. Ltd. Class A | 1,485,524 | 900 |
| | Hangxiao Steel Structure Co. Ltd. Class A | 2,212,840 | 896 |
| | Tongyu Communication Inc. Class A | 459,810 | 895 |
| | Zhejiang Jinggong Integration Technology Co. Ltd. Class A | 479,500 | 895 |
| | Chengdu Kanghong Pharmaceutical Group Co. Ltd. Class A | 332,643 | 894 |
| | Changjiang & Jinggong Steel Building Group Co. Ltd. Class A | 2,004,200 | 894 |
| * | Suzhou Everbright Photonics Co. Ltd. Class A | 138,812 | 894 |
| | Hunan Corun New Energy Co. Ltd. Class A | 1,482,100 | 894 |
| | Hangzhou Jiebai Group Co. Ltd. Class A | 919,676 | 893 |
| | Shanghai Kaibao Pharmaceutical Co. Ltd. Class A | 960,700 | 893 |
| * | Beijing Teamsun Technology Co. Ltd. Class A | 1,076,520 | 891 |
| | Befar Group Co. Ltd. Class A | 1,597,400 | 891 |
| | Shanghai Environment Group Co. Ltd. Class A | 753,600 | 890 |
| * | Lier Chemical Co. Ltd. Class A | 767,622 | 890 |
| | Yuneng Technology Co. Ltd. Class A | 104,118 | 890 |
| * | Shenzhen World Union Group Inc. Class A | 2,389,380 | 889 |
| * | Guangdong Shenglu Telecommunication Tech Co. Ltd. Class A | 884,631 | 889 |
| * | Baosheng Science & Technology Innovation Co. Ltd. Class A | 1,513,143 | 889 |
| | ApicHope Pharmaceutical Co. Ltd. Class A | 410,400 | 889 |
| * | Suzhou Jinfu Technology Co. Ltd. Class A | 1,073,500 | 889 |
| | Huadian Heavy Industries Co. Ltd. Class A | 1,056,500 | 888 |
| | Suzhou Recodeal Interconnect System Co. Ltd. Class A | 158,611 | 888 |
| | Nanjing Pharmaceutical Co. Ltd. Class A | 1,283,500 | 888 |
| | Jiaze Renewables Co. Ltd. | 1,883,200 | 887 |
| | China Railway Special Cargo Logistics Co. Ltd. Class A | 1,500,600 | 887 |
| | China Railway Tielong Container Logistics Co. Ltd. Class A | 1,025,913 | 885 |
| | Zhejiang Ausun Pharmaceutical Co. Ltd. Class A | 731,864 | 885 |
| | Zhejiang Wanliyang Co. Ltd. Class A | 1,102,725 | 884 |
| | Guangdong Vanward New Electric Co. Ltd. Class A | 668,000 | 882 |
| | Jiangsu Huaxicun Co. Ltd. Class A | 792,000 | 882 |
| | Eastcompeace Technology Co. Ltd. Class A | 547,210 | 881 |
| * | RiseSun Real Estate Development Co. Ltd. Class A | 3,487,556 | 880 |
| | MYS Group Co. Ltd. Class A | 1,908,300 | 880 |
| | Guangxi Energy Co. Ltd. Class A | 1,192,500 | 880 |
| | Anhui Huilong Agricultural Means of Production Co. Ltd. Class A | 1,159,352 | 880 |
| | Ningxia Building Materials Group Co. Ltd. Class A | 429,000 | 879 |
| | Shandong Xiantan Co. Ltd. Class A | 1,040,300 | 878 |
| | Guangzhou Zhiguang Electric Co. Ltd. Class A | 786,900 | 877 |
| | Time Publishing & Media Co. Ltd. Class A | 758,520 | 877 |
| * | Great Chinasoft Technology Co. Ltd. Class A | 962,600 | 876 |
| | Jinyu Bio-Technology Co. Ltd. Class A | 918,700 | 875 |
| * | HyUnion Holding Co. Ltd. Class A | 943,800 | 875 |
| | Dongfeng Electronic Technology Co. Ltd. Class A | 617,955 | 875 |
| | Three's Co. Media Group Co. Ltd. Class A | 203,916 | 874 |
| | Streamax Technology Co. Ltd. Class A | 136,700 | 874 |
| * | Changzhou Tronly New Electronic Materials Co. Ltd. Class A | 417,400 | 872 |
| | Orient International Enterprise Ltd. Class A | 870,800 | 872 |
| * | Beijing Bohui Innovation Biotechnology Group Co. Ltd. Class A | 1,047,500 | 872 |
| | Guizhou Gas Group Corp. Ltd. Class A | 861,400 | 870 |
| * | Zhejiang Huatong Meat Products Co. Ltd. Class A | 542,600 | 870 |
| | Qingdao Hanhe Cable Co. Ltd. Class A | 1,790,630 | 869 |
| | Beijing Sanlian Hope Shin-Gosen Technical Service Co. Ltd. Class A | 368,600 | 869 |
| | Rizhao Port Co. Ltd. Class A | 1,956,100 | 869 |
| * | Guangdong Meiyan Jixiang Hydropower Co. Ltd. Class A | 2,653,601 | 864 |
| | Daheng New Epoch Technology Inc. Class A | 676,900 | 863 |
| * | CanSino Biologics Inc. Class A | 108,088 | 862 |
| | HeiLongJiang ZBD Pharmaceutical Co. Ltd. Class A | 539,962 | 862 |
| | Dalian Huarui Heavy Industry Group Co. Ltd. Class A | 1,248,079 | 861 |
| * | Zhongfu Straits Pingtan Development Co. Ltd. Class A | 2,356,500 | 859 |
| * | Zhongnongfa Seed Industry Group Co. Ltd. Class A | 916,903 | 859 |
Total International Stock Index Fund
| | | | | | Shares | Market
Value•
($000) |
| * | Luoxin Pharmaceuticals Group Stock Co. Ltd. Class A | 1,325,601 | 857 |
| | EIT Environmental Development Group Co. Ltd. Class A | 400,744 | 857 |
| | Digital China Information Service Group Co. Ltd. Class A | 496,802 | 856 |
| * | JC Finance & Tax Interconnect Holdings Ltd. Class A | 762,685 | 856 |
| * | Beijing Global Safety Technology Co. Ltd. Class A | 255,900 | 853 |
| | Huangshan Novel Co. Ltd. Class A | 588,000 | 853 |
| | JL Mag Rare-Earth Co. Ltd. Class A | 352,064 | 851 |
| | Lushang Freda Pharmaceutical Co. Ltd. Class A | 884,000 | 851 |
| * | Dongjiang Environmental Co. Ltd. Class A | 1,174,181 | 849 |
| * | Nuode New Materials Co. Ltd. Class A | 1,508,846 | 849 |
| | Jiangsu Transimage Technology Co. Ltd. Class A | 354,400 | 849 |
| | Shenzhen Jinjia Group Co. Ltd. Class A | 1,360,968 | 848 |
| | Unilumin Group Co. Ltd. Class A | 842,477 | 846 |
| | Guangdong Kinlong Hardware Products Co. Ltd. Class A | 202,300 | 846 |
| * | Xinjiang Ba Yi Iron & Steel Co. Ltd. Class A | 1,652,400 | 845 |
| * | Zhejiang Vie Science & Technology Co. Ltd. Class A | 410,493 | 845 |
| * | Xizang Zhufeng Resources Co. Ltd. Class A | 543,640 | 844 |
| | Chongqing Pharscin Pharmaceutical Co. Ltd. Class A | 432,492 | 844 |
| | Jinghua Pharmaceutical Group Co. Ltd. Class A | 772,963 | 844 |
| | OPT Machine Vision Tech Co. Ltd. Class A | 97,338 | 844 |
| | Zhejiang Asia-Pacific Mechanical & Electronic Co. Ltd. Class A | 739,600 | 843 |
| * | Sinopec Oilfield Equipment Corp. Class A | 1,049,940 | 841 |
| | Guangdong Guangzhou Daily Media Co. Ltd. Class A | 1,364,800 | 841 |
| | Jiangsu Hongdou Industrial Co. Ltd. Class A | 2,308,700 | 840 |
| | Hongli Zhihui Group Co. Ltd. Class A | 777,000 | 834 |
| | Hanwei Electronics Group Corp. Class A | 337,836 | 834 |
| * | Shenzhen Silver Basis Technology Co. Ltd. Class A | 435,400 | 833 |
| | Maccura Biotechnology Co. Ltd. Class A | 421,315 | 832 |
| | BMC Medical Co. Ltd. Class A | 79,940 | 831 |
| * | Kunming Yunnei Power Co. Ltd. Class A | 1,670,300 | 829 |
| | Hubei Chutian Smart Communication Co. Ltd. Class A | 1,430,300 | 829 |
| | Vats Liquor Chain Store Management JSC Ltd. Class A | 349,500 | 828 |
| | CITIC Press Corp. Class A | 191,000 | 825 |
| | Jiangsu Boqian New Materials Stock Co. Ltd. Class A | 221,700 | 824 |
| | Rianlon Corp. Class A | 212,700 | 823 |
| | Xiamen International Airport Co. Ltd. Class A | 401,520 | 822 |
| | China West Construction Group Co. Ltd. Class A | 788,377 | 822 |
| * | Xinxiang Chemical Fiber Co. Ltd. Class A | 1,580,387 | 822 |
| * | Hainan Haiqi Transportation Group Co. Ltd. Class A | 287,700 | 822 |
| | Chengdu Hongqi Chain Co. Ltd. Class A | 1,167,833 | 821 |
| | Beijing Jingyuntong Technology Co. Ltd. Class A | 1,842,380 | 821 |
| | Shenzhen Jieshun Science & Technology Industry Co. Ltd. Class A | 697,900 | 821 |
| | Qingdao Rural Commercial Bank Corp. Class A | 2,000,025 | 821 |
| | Jangho Group Co. Ltd. Class A | 1,022,300 | 821 |
| | Shenzhen Center Power Tech Co. Ltd. Class A | 452,561 | 820 |
| | China CYTS Tours Holding Co. Ltd. Class A | 574,100 | 819 |
| | YanTai Shuangta Food Co. Ltd. Class A | 1,114,400 | 819 |
| | Jinneng Science&Technology Co. Ltd. Class A | 986,880 | 817 |
| | Jiangsu General Science Technology Co. Ltd. Class A | 1,141,200 | 814 |
| | Haining China Leather Market Co. Ltd. Class A | 1,496,500 | 812 |
| | Guangdong Topstar Technology Co. Ltd. Class A | 443,461 | 812 |
| * | Zhejiang Orient Gene Biotech Co. Ltd. Class A | 163,480 | 812 |
| | Inmyshow Digital Technology Group Co. Ltd. Class A | 1,226,351 | 811 |
| | Wencan Group Co. Ltd. Class A | 245,885 | 811 |
| | Hongrun Construction Group Co. Ltd. Class A | 1,383,900 | 808 |
| | Tianjin 712 Communication & Broadcasting Co. Ltd. Class A | 329,300 | 807 |
| | Shanghai Kelai Mechatronics Engineering Co. Ltd. Class A | 245,800 | 806 |
| | Guangxi LiuYao Group Co. Ltd. Class A | 316,420 | 805 |
| | Guangzhou Hengyun Enterprises Holdings Ltd. Class A | 1,019,062 | 804 |
| | Emei Shan Tourism Co. Ltd. Class A | 431,300 | 803 |
| | Hunan Aihua Group Co. Ltd. Class A | 392,897 | 802 |
| * | Hanwang Technology Co. Ltd. Class A | 280,600 | 802 |
| * | Hubei Broadcasting & Television Information Network Co. Ltd. Class A | 1,198,600 | 801 |
| * | Guizhou Zhongyida Co. Ltd. Class A | 905,400 | 800 |
| | Shenzhen Aisidi Co. Ltd. Class A | 389,000 | 798 |
| | Easyhome New Retail Group Co. Ltd. Class A | 2,016,000 | 798 |
| | Hangzhou Electronic Soul Network Technology Co. Ltd. Class A | 276,297 | 797 |
| | Fujian Qingshan Paper Industry Co. Ltd. Class A | 2,532,400 | 797 |
| * | Guangdong Guanhao High-Tech Co. Ltd. Class A | 1,681,400 | 795 |
| | Shanghai Hile Bio-Technology Co. Ltd. Class A | 747,400 | 794 |
Total International Stock Index Fund
| | | | | | Shares | Market
Value•
($000) |
| | Shanghai Baosteel Packaging Co. Ltd. Class A | 1,090,900 | 794 |
| * | Tongding Interconnection Information Co. Ltd. Class A | 1,265,500 | 792 |
| * | China Aluminum International Engineering Corp. Ltd. Class A | 1,147,900 | 792 |
| * | 263 Network Communications Co. Ltd. Class A | 1,314,630 | 790 |
| | Xinzhi Group Co. Ltd. Class A | 409,300 | 790 |
| | Qinghai Huzhu TianYouDe Highland Barley Spirit Co. Ltd. Class A | 560,688 | 789 |
| * | Zhejiang Tony Electronic Co. Ltd. Class A | 266,700 | 787 |
| | Zhejiang Guyuelongshan Shaoxing Wine Co. Ltd. Class A | 646,400 | 784 |
| | Anhui Sierte Fertilizer Industry Ltd. Co. Class A | 988,700 | 784 |
| | Hengbao Co. Ltd. Class A | 766,500 | 781 |
| | Yotrio Group Co. Ltd. Class A | 1,733,900 | 778 |
| | Shenzhen Tellus Holding Co. Ltd. Class A | 275,900 | 777 |
| * | Beijing Baination Pictures Co. Ltd. Class A | 1,043,500 | 777 |
| | Lianhe Chemical Technology Co. Ltd. Class A | 926,552 | 776 |
| | Yantai Changyu Pioneer Wine Co. Ltd. Class A | 238,531 | 772 |
| | Hangzhou Weiguang Electronic Co. Ltd. Class A | 257,400 | 772 |
| | Shenma Industry Co. Ltd. Class A | 780,300 | 772 |
| * | DBAPP Security Ltd. Class A | 112,074 | 769 |
| | Qingdao Citymedia Co. Ltd. Class A | 766,400 | 768 |
| * | Guangdong Guanghua Sci-Tech Co. Ltd. Class A | 410,700 | 767 |
| | Jiangsu Lianyungang Port Co. Ltd. Class A | 1,406,100 | 767 |
| | Yangtze Optical Fibre & Cable Joint Stock Ltd. Co. Class A | 193,203 | 766 |
| | Luyang Energy-Saving Materials Co. Ltd. | 458,998 | 766 |
| * | Guangdong Orient Zirconic Ind Sci & Tech Co. Ltd. Class A | 803,700 | 766 |
| | Foshan Nationstar Optoelectronics Co. Ltd. Class A | 654,700 | 763 |
| | Shenzhen Xinyichang Technology Co. Ltd. Class A | 96,278 | 761 |
| * | Liaoning Energy Industry Co. Ltd. Class A | 1,544,200 | 761 |
| | Yabao Pharmaceutical Group Co. Ltd. Class A | 874,000 | 760 |
| | Sunyard Technology Co. Ltd. Class A | 389,300 | 760 |
| | Suzhou Oriental Semiconductor Co. Ltd. Class A | 111,567 | 758 |
| | Double Medical Technology Inc. Class A | 153,925 | 757 |
| | Deppon Logistics Co. Ltd. Class A | 375,100 | 754 |
| | Shida Shinghwa Advanced Material Group Co. Ltd. Class A | 158,504 | 754 |
| | Ningbo Cixing Co. Ltd. Class A | 661,800 | 754 |
| | Huangshan Tourism Development Co. Ltd. Class A | 472,100 | 750 |
| * | Taiyuan Heavy Industry Co. Ltd. Class A | 2,221,100 | 749 |
| | Guizhou Zhenhua E-chem Inc. Class A | 452,140 | 749 |
| | Wuhan Yangtze Communications Industry Group Co. Ltd. Class A | 274,200 | 748 |
| | Center International Group Co. Ltd. Class A | 502,088 | 748 |
| | Shenzhen Invt Electric Co. Ltd. Class A | 778,900 | 746 |
| | Bright Real Estate Group Co. Ltd. Class A | 1,749,000 | 744 |
| | Cybrid Technologies Inc. Class A | 420,000 | 744 |
| | Shenzhen Textile Holdings Co. Ltd. Class A | 383,500 | 744 |
| | Shanghai Bright Meat Group Co. Ltd. Class A | 764,000 | 743 |
| | Cangzhou Dahua Co. Ltd. Class A | 484,500 | 743 |
| | Hangzhou Onechance Tech Corp. Class A | 254,009 | 743 |
| * | Zhongfu Information Inc. Class A | 310,100 | 741 |
| | Jiangsu Changbao Steeltube Co. Ltd. Class A | 1,024,100 | 741 |
| * | Henan Huanghe Whirlwind Co. Ltd. Class A | 1,242,500 | 740 |
| 3 | Shandong Dawn Polymer Co. Ltd. Class A | 400,200 | 740 |
| | CCS Supply Chain Management Co. Ltd. Class A | 1,170,400 | 739 |
| * | Piesat Information Technology Co. Ltd. Class A | 238,662 | 739 |
| | Zhejiang Huamei Holding Co. Ltd. Class A | 1,355,600 | 739 |
| | ZhongYeDa Electric Co. Ltd. Class A | 694,100 | 737 |
| | China Animal Husbandry Industry Co. Ltd. Class A | 757,400 | 734 |
| * | Foshan Yowant Technology Co. Ltd. Class A | 892,200 | 734 |
| | Cangzhou Mingzhu Plastic Co. Ltd. Class A | 1,460,190 | 733 |
| | Zhejiang NetSun Co. Ltd. Class A | 344,300 | 728 |
| * | Liuzhou Iron & Steel Co. Ltd. Class A | 1,610,700 | 728 |
| | Baoxiniao Holding Co. Ltd. Class A | 1,266,700 | 727 |
| | Chongyi Zhangyuan Tungsten Industry Co. Ltd. Class A | 776,230 | 726 |
| | Zhejiang Gongdong Medical Technology Co. Ltd. Class A | 166,600 | 724 |
| | Guizhou Tyre Co. Ltd. Class A | 1,038,468 | 723 |
| * | Guangxi Radio & Television Information Network Corp. Ltd. Class A | 1,704,600 | 722 |
| * | Suzhou Chunxing Precision Mechanical Co. Ltd. Class A | 1,407,200 | 720 |
| | North Electro-Optic Co. Ltd. Class A | 444,700 | 720 |
| | Jiangsu Yunyi Electric Co. Ltd. Class A | 622,100 | 720 |
| | Nantong Jiangshan Agrochemical & Chemical LLC Class A | 359,875 | 717 |
| | Guangdong Jia Yuan Technology Shares Co. Ltd. Class A | 376,661 | 716 |
| | Henan Liliang Diamond Co. Ltd. Class A | 177,300 | 711 |
Total International Stock Index Fund
| | | | | | Shares | Market
Value•
($000) |
| | Shanghai Haoyuan Chemexpress Co. Ltd. Class A | 137,060 | 708 |
| | Changshu Fengfan Power Equipment Co. Ltd. Class A | 1,021,300 | 707 |
| * | Shanghai Medicilon Inc. Class A | 142,305 | 701 |
| | Zhejiang Tianyu Pharmaceutical Co. Ltd. Class A | 297,711 | 700 |
| | Jiangnan Mould & Plastic Technology Co. Ltd. Class A | 704,200 | 699 |
| | Dashang Co. Ltd. Class A | 273,350 | 698 |
| | Chengdu ALD Aviation Manufacturing Corp. Class A | 272,300 | 698 |
| | Longhua Technology Group Luoyang Co. Ltd. Class A | 684,800 | 697 |
| | Hangzhou Haoyue Personal Care Co. Ltd. Class A | 126,853 | 697 |
| | Shenzhen Guangju Energy Co. Ltd. Class A | 406,600 | 695 |
| | Truking Technology Ltd. Class A | 666,100 | 694 |
| * | Jiangsu Lopal Tech Co. Ltd. Class A | 501,667 | 694 |
| | Yechiu Metal Recycling China Ltd. Class A | 1,858,500 | 691 |
| | Shanghai Jinqiao Export Processing Zone Development Co. Ltd. Class A | 437,587 | 690 |
| | Shenzhen Gongjin Electronics Co. Ltd. Class A | 582,100 | 688 |
| | Shenzhen Heungkong Holding Co. Ltd. Class A | 2,640,600 | 687 |
| | Hubei Century Network Technology Co. Ltd. Class A | 435,800 | 686 |
| | Xiamen Jihong Technology Co. Ltd. Class A | 387,300 | 685 |
| | Canny Elevator Co. Ltd. Class A | 767,200 | 683 |
| * | Guangdong Shaoneng Group Co. Ltd. Class A | 1,156,000 | 681 |
| | Xizi Clean Energy Equipment Manufacturing Co. Ltd. Class A | 370,440 | 681 |
| * | Lingyuan Iron & Steel Co. Ltd. Class A | 2,440,300 | 679 |
| | DaShenLin Pharmaceutical Group Co. Ltd. Class A | 332,248 | 677 |
| | Zhejiang Hailide New Material Co. Ltd. Class A | 1,119,300 | 671 |
| | Jiangsu Rainbow Heavy Industries Co. Ltd. Class A | 921,100 | 671 |
| | Transfar Zhilian Co. Ltd. Class A | 1,103,868 | 670 |
| | Chengdu Bright Eye Hospital Group Co. Ltd. Class A | 121,800 | 669 |
| *,3 | China Grand Automotive Services Group Co. Ltd. | 6,096,000 | 668 |
| * | Shandong Chenming Paper Holdings Ltd. Class H | 3,104,406 | 667 |
| | Marssenger Kitchenware Co. Ltd. Class A | 342,300 | 665 |
| | Zhejiang China Light & Textile Industrial City Group Co. Ltd. Class A | 1,278,900 | 664 |
| | Zhejiang Semir Garment Co. Ltd. Class A | 778,119 | 662 |
| | Zhejiang Meida Industrial Co. Ltd. Class A | 655,580 | 661 |
| * | KBC Corp. Ltd. Class A | 187,135 | 661 |
| * | Long Yuan Construction Group Co. Ltd. Class A | 1,247,700 | 660 |
| | Shanghai Titan Scientific Co. Ltd. Class A | 204,498 | 658 |
| | Macmic Science & Technology Co. Ltd. Class A | 246,905 | 657 |
| | Shanghai Tianchen Co. Ltd. Class A | 760,800 | 654 |
| | Bafang Electric Suzhou Co. Ltd. Class A | 217,168 | 652 |
| | Weihai Guangtai Airport Equipment Co. Ltd. Class A | 385,000 | 651 |
| | Jiangsu Xiuqiang Glasswork Co. Ltd. Class A | 780,700 | 647 |
| | Jiangxi Huangshanghuang Group Food Co. Ltd. Class A | 612,900 | 645 |
| * | JinJian Cereals Industry Co. Ltd. Class A | 652,700 | 640 |
| | Guangdong Shirongzhaoye Co. Ltd. Class A | 653,500 | 639 |
| * | Zhejiang Tiantie Industry Co. Ltd. Class A | 914,970 | 639 |
| | Inner Mongolia OJing Science & Technology Co. Ltd. Class A | 153,420 | 639 |
| | Realcan Pharmaceutical Group Co. Ltd. Class A | 1,464,500 | 638 |
| | Luolai Lifestyle Technology Co. Ltd. Class A | 634,400 | 638 |
| | Bestore Co. Ltd. Class A | 366,891 | 632 |
| * | Beijing Electronic Zone High-tech Group Co. Ltd. Class A | 813,600 | 632 |
| | Jiangxi Wannianqing Cement Co. Ltd. Class A | 824,190 | 631 |
| | Jiangsu Shuangxing Color Plastic New Materials Co. Ltd. Class A | 781,300 | 631 |
| * | Duolun Technology Corp. Ltd. Class A | 554,300 | 631 |
| * | Nanfang Zhongjin Environment Co. Ltd. Class A | 1,330,100 | 629 |
| * | Zhuhai Bojay Electronics Co. Ltd. Class A | 154,400 | 629 |
| | Changchun BCHT Biotechnology Co. Ltd. Class A | 168,794 | 628 |
| | Joeone Co. Ltd. Class A | 544,200 | 627 |
| * | Jinzhou Yongshan Lithium Co. Ltd. Class A | 473,100 | 624 |
| * | Baotailong New Materials Co. Ltd. Class A | 1,913,100 | 623 |
| | Shunfa Hengneng Corp. Class A | 1,492,300 | 620 |
| * | EGing Photovoltaic Technology Co. Ltd. Class A | 1,244,100 | 619 |
| * | Shanghai STEP Electric Corp. Class A | 583,100 | 619 |
| | Hengdian Entertainment Co. Ltd. Class A | 345,700 | 617 |
| | Era Co. Ltd. Class A | 974,000 | 617 |
| * | MGI Tech Co. Ltd. Class A | 87,790 | 616 |
| | Youzu Interactive Co. Ltd. Class A | 441,400 | 615 |
| | Beijing Water Business Doctor Co. Ltd. Class A | 813,300 | 615 |
| | Shandong Head Group Co. Ltd. Class A | 312,967 | 615 |
| | Sichuan Tianyi Comheart Telecom Co. Ltd. Class A | 249,100 | 614 |
| | Guangzhou Pearl River Piano Group Co. Ltd. Class A | 975,800 | 614 |
Total International Stock Index Fund
| | | | | | Shares | Market
Value•
($000) |
| | Guangxi Wuzhou Communications Co. Ltd. Class A | 1,158,903 | 613 |
| | Shandong Jincheng Pharmaceutical Group Co. Ltd. Class A | 325,400 | 612 |
| | Top Resource Energy Co. Ltd. Class A | 762,200 | 609 |
| | East China Engineering Science & Technology Co. Ltd. Class A | 508,975 | 609 |
| | Guizhou Guihang Automotive Components Co. Ltd. Class A | 318,100 | 605 |
| | Tianjin Benefo Tejing Electric Co. Ltd. Class A | 880,200 | 604 |
| * | Shaanxi Construction Machinery Co. Ltd. Class A | 1,136,100 | 602 |
| | Guiyang Longmaster Information & Technology Co. Ltd. Class A | 286,000 | 601 |
| * | Fujian Snowman Group Co. Ltd. Class A | 661,700 | 592 |
| | Nanjing Kangni Mechanical & Electrical Co. Ltd. Class A | 694,400 | 592 |
| | Goldcard Smart Group Co. Ltd. Class A | 303,400 | 591 |
| | Xiangyu Medical Co. Ltd. Class A | 147,114 | 591 |
| | Xiamen Intretech Inc. Class A | 319,260 | 590 |
| | Black Peony Group Co. Ltd. Class A | 854,300 | 584 |
| | Shandong New Beiyang Information Technology Co. Ltd. Class A | 588,300 | 581 |
| | Ligao Foods Co. Ltd. Class A | 112,820 | 579 |
| * | Beijing Sinohytec Co. Ltd. Class A | 163,755 | 573 |
| * | Shenzhen New Nanshan Holding Group Co. Ltd. Class A | 1,512,200 | 556 |
| *,2 | Shimao Services Holdings Ltd. | 4,374,563 | 551 |
| | Guangdong Hybribio Biotech Co. Ltd. Class A | 649,135 | 550 |
| * | Triumph New Energy Co. Ltd. Class A | 361,900 | 549 |
| | Tibet Cheezheng Tibetan Medicine Co. Ltd. Class A | 172,030 | 546 |
| | Shandong Huatai Paper Industry Shareholding Co. Ltd. Class A | 1,097,511 | 546 |
| | Huludao Zinc Industry Co. Class A | 1,290,700 | 545 |
| | Rainbow Digital Commercial Co. Ltd. Class A | 759,992 | 543 |
| | Tungkong Inc. Class A | 467,600 | 543 |
| | Gansu Shangfeng Cement Co. Ltd. Class A | 432,120 | 537 |
| | Tangshan Sunfar Silicon Industry Co. Ltd. Class A | 315,056 | 531 |
| | Chongqing Port Co. Ltd. Class A | 854,000 | 531 |
| * | Jiangsu Huahong Technology Stock Co. Ltd. Class A | 461,659 | 529 |
| | Shanghai Chlor-Alkali Chemical Co. Ltd. Class A | 403,800 | 528 |
| | Beijing WKW Automotive Parts Co. Ltd. Class A | 1,105,000 | 522 |
| | Shenzhen Topraysolar Co. Ltd. Class A | 969,900 | 519 |
| | Jiangsu Zhangjiagang Rural Commercial Bank Co. Ltd. Class A | 860,160 | 513 |
| * | Blue Sail Medical Co. Ltd. Class A | 663,503 | 509 |
| | Beijing Tianyishangjia New Material Corp. Ltd. Class A | 542,151 | 508 |
| | Guangdong Great River Smarter Logistics Co. Ltd. Class A | 317,360 | 507 |
| *,2 | CStone Pharmaceuticals | 1,839,876 | 506 |
| | Beijing SDL Technology Co. Ltd. Class A | 553,300 | 504 |
| | Huabao Flavours & Fragrances Co. Ltd. Class A | 204,344 | 501 |
| | Beijing Science Sun Pharmaceutical Co. Ltd. Class A | 445,800 | 495 |
| | Hunan Friendship & Apollo Commercial Co. Ltd. Class A | 1,197,700 | 488 |
| * | Transwarp Technology Shanghai Co. Ltd. Class A | 89,734 | 486 |
| | Solareast Holdings Co. Ltd. Class A | 777,400 | 483 |
| * | Shenzhen Deren Electronic Co. Ltd. Class A | 454,700 | 481 |
| | Chengdu XGimi Technology Co. Ltd. Class A | 46,902 | 478 |
| | Wuhan Keqian Biology Co. Ltd. Class A | 231,984 | 469 |
| | Bestsun Energy Co. Ltd. Class A | 944,984 | 467 |
| * | Delixi New Energy Technology Co. Ltd. Class A | 189,980 | 457 |
| | Zhejiang Starry Pharmaceutical Co. Ltd. Class A | 354,733 | 454 |
| | Tianjin Teda Co. Ltd. Class A | 659,000 | 448 |
| | Toly Bread Co. Ltd. Class A | 527,612 | 445 |
| | Beijing Sanyuan Foods Co. Ltd. Class A | 728,300 | 442 |
| * | Hiconics Eco-energy Technology Co. Ltd. Class A | 558,300 | 441 |
| | Shenzhen Comix Group Co. Ltd. Class A | 510,300 | 429 |
| | Monalisa Group Co. Ltd. Class A | 338,185 | 423 |
| | Rongan Property Co. Ltd. Class A | 1,182,600 | 413 |
| * | Yijiahe Technology Co. Ltd. Class A | 143,360 | 413 |
| * | China Zhonghua Geotechnical Engineering Group Co. Ltd. Class A | 664,500 | 398 |
| | Tuoxin Pharmaceutical Group Co. Ltd. Class A | 82,354 | 381 |
| * | Royal Group Co. Ltd. Class A | 751,400 | 377 |
| * | Tellhow Sci-Tech Co. Ltd. Class A | 458,400 | 371 |
| *,1,2 | Redco Properties Group Ltd. | 6,424,787 | 364 |
| | Fortune Ng Fung Food Hebei Co. Ltd. Class A | 626,900 | 356 |
| * | Shandong Chenming Paper Holdings Ltd. Class A | 659,200 | 343 |
| | Tianjin Tianyao Pharmaceutical Co. Ltd. Class A | 548,600 | 331 |
| | Shanghai Zhezhong Group Co. Ltd. Class A | 215,600 | 305 |
| | Jenkem Technology Co. Ltd. Class A | 37,841 | 300 |
| *,3 | Pengdu Agriculture & Animal Husbandry Co. Ltd. | 5,811,900 | 294 |
| | Sanchuan Wisdom Technology Co. Ltd. Class A | 472,800 | 290 |
Total International Stock Index Fund
| | | | | | Shares | Market
Value•
($000) |
| | Zhuhai Port Co. Ltd. Class A | 411,800 | 289 |
| *,3 | Jiangsu Zhongnan Construction Group Co. Ltd. | 3,591,330 | 283 |
| | Huaren Pharmaceutical Co. Ltd. Class A | 534,800 | 282 |
| | Guangdong Goworld Co. Ltd. Class A | 195,400 | 275 |
| | Three Squirrels Inc. Class A | 75,800 | 273 |
| | Sichuan Meifeng Chemical IND Class A | 238,300 | 245 |
| | Shanghai Haixin Group Co. Class A | 274,500 | 231 |
| | Xiamen Comfort Science & Technology Group Co. Ltd. Class A | 260,800 | 227 |
| | Xiamen Port Development Co. Ltd. Class A | 240,400 | 222 |
| *,2 | XJ International Holdings Co. Ltd. | 10,557,194 | 211 |
| *,3 | Tunghsu Optoelectronic Technology Co. Ltd. | 4,027,807 | 209 |
| *,3 | Guangdong Highsun Group Co. Ltd. Class A | 1,759,500 | 153 |
| * | Moody Technology Holdings Ltd. | 24,797,605 | 73 |
| *,3 | Blivex Energy Technology Co. Ltd. | 3,837,700 | 59 |
| *,3 | Ningxia Zhongyin Cashmere Co. Ltd. | 2,148,600 | 54 |
| *,3 | ChangjiangRunfa Health Industry Co. Ltd. | 556,100 | 29 |
| *,2 | Shenzhen Hepalink Pharmaceutical Group Co. Ltd. Class H | 20,000 | 11 |
| *,3 | China Fishery Group Ltd. | 9,033,000 | — |
| *,3 | Zhongtian Financial Group Co. Ltd. Class A | 6,203,600 | — |
| *,3 | Yango Group Co. Ltd. Class A | 3,984,593 | — |
| *,3 | Zhejiang Akcome New Energy Technology Co. Ltd. | 3,917,400 | — |
| | | | | | | 35,066,899 |
| Colombia (0.0%) |
| | Ecopetrol SA | 65,929,533 | 25,327 |
| | Interconexion Electrica SA ESP | 6,104,241 | 24,250 |
| | Bancolombia SA ADR | 723,676 | 23,093 |
| | Cementos Argos SA | 7,075,989 | 13,736 |
| | Bancolombia SA | 10,463 | 89 |
| | | | | | | 86,495 |
| Czech Republic (0.0%) |
| | CEZ A/S | 2,211,031 | 85,666 |
| | Komercni Banka A/S | 1,049,303 | 36,258 |
| 2 | Moneta Money Bank A/S | 4,671,248 | 23,293 |
| | Colt CZ Group SE | 111,354 | 2,947 |
| | | | | | | 148,164 |
| Denmark (1.9%) |
| | Novo Nordisk A/S Class B | 43,105,182 | 4,834,893 |
| | DSV A/S | 2,688,433 | 588,513 |
| | Novonesis (Novozymes) B | 4,811,291 | 302,350 |
| | Danske Bank A/S | 9,217,600 | 272,556 |
| * | Vestas Wind Systems A/S | 14,033,294 | 267,437 |
| | Coloplast A/S Class B | 1,734,840 | 217,290 |
| * | Genmab A/S | 901,609 | 201,922 |
| | Pandora A/S | 1,116,939 | 168,877 |
| *,1,2 | Orsted A/S | 2,627,822 | 154,665 |
| | Carlsberg A/S Class B | 1,271,374 | 140,504 |
| | Tryg A/S | 4,574,128 | 107,953 |
| * | Zealand Pharma A/S | 926,540 | 106,962 |
| * | NKT A/S | 749,900 | 70,308 |
| | AP Moller - Maersk A/S Class A | 42,993 | 65,562 |
| | Ringkjoebing Landbobank A/S | 363,223 | 60,075 |
| | AP Moller - Maersk A/S Class B | 37,406 | 59,167 |
| | Royal Unibrew A/S | 699,353 | 52,614 |
| | ROCKWOOL A/S Class B | 118,364 | 51,222 |
| * | Demant A/S | 1,336,735 | 49,374 |
| * | Ambu A/S Class B | 2,539,382 | 47,122 |
| | Jyske Bank A/S (Registered) | 628,579 | 44,095 |
| * | ALK-Abello A/S Class B | 1,837,091 | 43,016 |
| | ISS A/S | 2,135,432 | 41,273 |
| | FLSmidth & Co. A/S | 787,786 | 41,241 |
| * | GN Store Nord A/S | 2,032,352 | 39,955 |
| | Sydbank A/S | 740,483 | 35,340 |
| *,1 | Bavarian Nordic A/S | 979,145 | 30,828 |
| *,2 | Netcompany Group A/S | 601,503 | 28,709 |
| | H Lundbeck A/S | 3,575,372 | 23,275 |
| | Alm Brand A/S | 11,794,711 | 22,963 |
| | Spar Nord Bank A/S | 993,811 | 19,157 |
| | TORM plc Class A | 564,405 | 14,831 |
Total International Stock Index Fund
| | | | | | Shares | Market
Value•
($000) |
| | Schouw & Co. A/S | 169,482 | 14,092 |
| | Chemometec A/S | 216,693 | 12,723 |
| | Dfds A/S | 448,974 | 10,268 |
| | D/S Norden A/S | 296,141 | 10,230 |
| 2 | Scandinavian Tobacco Group A/S | 643,530 | 9,697 |
| * | NTG Nordic Transport Group A/S | 219,674 | 8,933 |
| * | Svitzer Group A/S | 181,929 | 6,345 |
| | H Lundbeck A/S Class A | 766,645 | 4,002 |
| | | | | | | 8,280,339 |
| Egypt (0.0%) |
| | Commercial International Bank - Egypt (CIB) | 31,722,237 | 51,844 |
| | Talaat Moustafa Group | 14,029,074 | 16,941 |
| | Eastern Co. SAE | 18,133,547 | 10,113 |
| * | EFG Holding S.A.E. | 16,439,168 | 7,436 |
| * | Fawry for Banking & Payment Technology Services SAE | 37,276,013 | 6,016 |
| | Telecom Egypt Co. | 4,743,948 | 3,254 |
| | | | | | | 95,604 |
| Finland (0.7%) |
| | Nordea Bank Abp | 46,404,360 | 543,255 |
| | Nokia OYJ | 72,662,045 | 343,839 |
| | Sampo OYJ Class A | 7,016,607 | 311,124 |
| | Kone OYJ Class B | 4,548,460 | 249,424 |
| | UPM-Kymmene OYJ | 7,425,050 | 218,494 |
| | Wartsila OYJ Abp | 6,768,293 | 129,629 |
| | Elisa OYJ | 1,993,494 | 94,995 |
| | Neste OYJ | 5,801,544 | 93,150 |
| | Stora Enso OYJ | 8,229,946 | 91,842 |
| | Fortum OYJ | 6,072,358 | 89,657 |
| | Metso OYJ | 8,928,580 | 84,975 |
| | Kesko OYJ Class B | 3,774,459 | 81,069 |
| | Orion OYJ Class B | 1,485,008 | 72,229 |
| | Konecranes OYJ | 992,248 | 68,500 |
| | Valmet OYJ | 2,302,321 | 58,989 |
| | Huhtamaki OYJ | 1,299,335 | 50,927 |
| | Kemira OYJ | 1,590,859 | 33,773 |
| | Cargotec OYJ Class B | 529,450 | 32,046 |
| | Mandatum OYJ | 6,534,880 | 30,177 |
| | TietoEVRY OYJ | 1,474,952 | 27,480 |
| * | Kojamo OYJ | 2,204,653 | 21,704 |
| * | QT Group OYJ | 272,874 | 20,788 |
| * | Kalmar OYJ Class B | 666,040 | 20,741 |
| | Outokumpu OYJ | 4,926,152 | 17,722 |
| | Nokian Renkaat OYJ | 1,734,323 | 14,395 |
| 2 | Terveystalo OYJ | 1,032,173 | 11,193 |
| | Metsa Board OYJ Class B | 1,943,092 | 10,453 |
| | Revenio Group OYJ | 320,401 | 10,308 |
| | Sanoma OYJ | 1,024,043 | 8,068 |
| | Tokmanni Group Corp. | 662,699 | 7,581 |
| * | YIT OYJ | 2,482,376 | 7,056 |
| | Citycon OYJ | 1,212,951 | 4,697 |
| | F-Secure OYJ | 1,535,966 | 3,146 |
| * | Finnair OYJ | 1,183,271 | 3,002 |
| *,3 | Ahlstrom-Munksjo OYJ | 147,018 | 2,853 |
| | | | | | | 2,869,281 |
| France (6.0%) |
| | LVMH Moet Hennessy Louis Vuitton SE | 3,435,367 | 2,286,994 |
| | Schneider Electric SE | 7,433,112 | 1,925,538 |
| | TotalEnergies SE | 28,022,600 | 1,758,578 |
| | Sanofi SA | 15,337,289 | 1,620,842 |
| | Air Liquide SA | 7,908,576 | 1,418,019 |
| | Airbus SE | 8,185,326 | 1,248,600 |
| | L'Oreal SA | 3,220,806 | 1,208,351 |
| | Hermes International SCA | 472,342 | 1,073,517 |
| | Safran SA | 4,703,013 | 1,064,601 |
| | EssilorLuxottica SA | 4,254,099 | 997,833 |
| | BNP Paribas SA | 13,970,304 | 954,088 |
| | AXA SA | 25,017,168 | 939,327 |
| | Vinci SA | 6,911,211 | 774,199 |
Total International Stock Index Fund
| | | | | | Shares | Market
Value•
($000) |
| | Danone SA | 8,725,107 | 623,309 |
| | Cie de Saint-Gobain SA | 6,396,295 | 580,048 |
| | Engie SA | 24,420,118 | 409,318 |
| | Legrand SA | 3,522,940 | 397,629 |
| | Capgemini SE | 2,233,282 | 387,432 |
| | Pernod Ricard SA | 2,815,180 | 351,246 |
| | Publicis Groupe SA | 3,171,162 | 337,042 |
| | Cie Generale des Etablissements Michelin SCA | 9,774,504 | 330,334 |
| | Dassault Systemes SE | 9,344,847 | 319,829 |
| | Orange SA | 26,717,017 | 293,505 |
| | Societe Generale SA | 10,184,490 | 292,514 |
| | Veolia Environnement SA | 8,712,314 | 276,613 |
| | Kering SA | 1,002,863 | 250,486 |
| | STMicroelectronics NV | 9,066,172 | 246,441 |
| | Thales SA | 1,358,910 | 219,054 |
| | Credit Agricole SA | 14,006,288 | 214,690 |
| | Accor SA | 3,154,098 | 143,093 |
| | Bureau Veritas SA | 4,254,826 | 134,942 |
| | Renault SA | 2,667,839 | 122,066 |
| | Unibail-Rodamco-Westfield | 1,442,125 | 117,926 |
| | Carrefour SA | 7,081,461 | 112,460 |
| | Edenred SE | 3,476,436 | 112,437 |
| * | Alstom SA | 4,827,435 | 106,187 |
| | Sodexo SA | 1,182,515 | 102,794 |
| | Vivendi SE | 9,316,267 | 99,549 |
| | Eiffage SA | 1,059,206 | 98,584 |
| | Klepierre SA | 2,880,324 | 92,089 |
| | Rexel SA | 3,281,846 | 90,420 |
| | Teleperformance SE | 837,879 | 88,817 |
| | Eurofins Scientific SE | 1,799,964 | 88,778 |
| | Getlink SE | 4,913,105 | 83,496 |
| | Bouygues SA | 2,519,363 | 80,976 |
| | Gecina SA | 726,338 | 77,622 |
| | Sartorius Stedim Biotech | 352,829 | 70,778 |
| | Arkema SA | 802,049 | 70,678 |
| | Gaztransport Et Technigaz SA | 484,471 | 70,490 |
| | SPIE SA | 1,884,334 | 68,201 |
| | BioMerieux | 566,849 | 63,444 |
| | Bollore SE | 9,753,811 | 60,893 |
| | Nexans SA | 420,813 | 58,578 |
| | Ipsen SA | 478,117 | 58,286 |
| 2 | Amundi SA | 797,384 | 57,814 |
| 2 | La Francaise des Jeux SAEM | 1,349,106 | 57,668 |
| | Elis SA | 2,436,627 | 55,431 |
| | Aeroports de Paris SA | 447,313 | 53,216 |
| | Eurazeo SE | 687,547 | 52,442 |
| | Dassault Aviation SA | 251,845 | 50,851 |
| | Technip Energies NV | 1,916,752 | 47,856 |
| | SCOR SE | 2,103,030 | 45,246 |
| | Covivio SA | 759,730 | 43,221 |
| 2 | Neoen SA | 958,364 | 41,232 |
| | Sopra Steria Group | 199,039 | 38,280 |
| * | Vallourec SACA | 2,271,294 | 37,395 |
| | Wendel SE | 373,833 | 37,154 |
| | SEB SA | 349,364 | 36,908 |
| | Alten SA | 412,421 | 34,887 |
| | Rubis SCA | 1,315,447 | 32,231 |
| | Valeo SE | 3,103,442 | 30,172 |
| 2 | Verallia SA | 963,682 | 27,792 |
| * | SOITEC | 347,020 | 27,479 |
| | IPSOS SA | 525,687 | 25,814 |
| * | Pluxee NV | 1,224,150 | 25,765 |
| *,2 | Worldline SA | 3,429,274 | 24,308 |
| | Societe BIC SA | 322,975 | 23,630 |
| | Coface SA | 1,456,996 | 23,496 |
| | Virbac SACA | 58,828 | 22,359 |
| * | Ubisoft Entertainment SA | 1,443,202 | 21,748 |
| 1 | SES SA Class A ADR | 4,954,941 | 19,803 |
| | Remy Cointreau SA | 314,356 | 19,783 |
| * | JCDecaux SE | 1,014,562 | 19,160 |
Total International Stock Index Fund
| | | | | | Shares | Market
Value•
($000) |
| | Imerys SA | 541,886 | 17,591 |
| | Forvia SE | 1,823,831 | 17,399 |
| 1 | VusionGroup | 109,655 | 17,238 |
| *,1 | Air France-KLM | 1,654,407 | 16,367 |
| * | ID Logistics Group SACA | 36,614 | 16,339 |
| | Mercialys SA | 1,298,206 | 15,317 |
| | Trigano SA | 111,423 | 15,233 |
| | Carmila SA | 790,048 | 14,877 |
| | Interparfums SA | 289,534 | 13,224 |
| 2 | Ayvens SA | 1,897,879 | 12,610 |
| | Argan SA | 167,372 | 12,426 |
| | ICADE | 457,701 | 11,972 |
| | Television Francaise 1 SA | 1,440,985 | 11,956 |
| | Metropole Television SA | 889,998 | 11,244 |
| *,1 | Eutelsat Communications SACA | 2,241,986 | 9,382 |
| *,1 | Nexity SA | 589,899 | 9,215 |
| | Quadient SA | 469,096 | 8,255 |
| | Altarea SCA | 73,459 | 8,047 |
| | Vicat SACA | 212,820 | 7,885 |
| * | Exclusive Networks SA | 302,675 | 7,800 |
| 1 | Eramet SA | 131,699 | 7,783 |
| | Opmobility | 770,666 | 7,575 |
| | Derichebourg SA | 1,313,379 | 7,458 |
| *,2 | Elior Group SA | 1,549,275 | 7,094 |
| | Lagardere SA | 295,688 | 6,840 |
| | Wavestone | 127,658 | 6,795 |
| | Peugeot Invest SA | 68,809 | 5,686 |
| 1 | Beneteau SACA | 506,552 | 5,572 |
| | Mersen SA | 238,217 | 5,558 |
| | Vetoquinol SA | 54,686 | 4,755 |
| *,1 | Voltalia SA (Registered) | 509,626 | 4,722 |
| 1 | Fnac Darty SA | 155,838 | 4,372 |
| * | Viridien | 100,730 | 4,224 |
| | Antin Infrastructure Partners SA | 357,487 | 4,113 |
| | Etablissements Maurel et Prom SA | 777,361 | 4,080 |
| | GL Events SACA | 182,636 | 3,841 |
| *,1 | Valneva SE | 1,349,263 | 3,815 |
| 1 | Equasens | 70,441 | 3,738 |
| | Forvia SE (MTAA) | 380,259 | 3,612 |
| *,1,2 | X-Fab Silicon Foundries SE | 756,219 | 3,605 |
| | LISI SA | 146,570 | 3,568 |
| | Esso SA Francaise | 31,300 | 3,537 |
| *,1 | OVH Groupe SAS | 362,698 | 3,450 |
| * | Sodexo Inc. | 37,643 | 3,268 |
| | Manitou BF SA | 172,193 | 3,259 |
| | Boiron SA | 48,259 | 1,721 |
| *,2 | Aramis Group SAS | 226,870 | 1,551 |
| | LISI SA (XPAR) | 55,481 | 1,351 |
| *,1 | Believe SA | 67,455 | 1,100 |
| | | | | | | 26,489,122 |
| Germany (4.9%) |
| | SAP SE | 15,304,769 | 3,573,435 |
| | Siemens AG (Registered) | 10,364,553 | 2,016,422 |
| | Allianz SE (Registered) | 5,444,145 | 1,713,846 |
| | Deutsche Telekom AG (Registered) | 46,635,273 | 1,409,949 |
| | Muenchener Rueckversicherungs-Gesellschaft AG in Muenchen (Registered) | 1,840,907 | 941,403 |
| | Mercedes-Benz Group AG | 11,662,399 | 708,499 |
| | BASF SE | 12,406,766 | 603,125 |
| | Deutsche Boerse AG | 2,582,585 | 599,878 |
| | Infineon Technologies AG | 18,116,187 | 572,918 |
| | adidas AG | 2,303,154 | 551,585 |
| | Deutsche Post AG | 13,586,637 | 545,769 |
| | Deutsche Bank AG (Registered) | 27,261,560 | 463,168 |
| | E.ON SE | 30,904,566 | 417,060 |
| | Bayer AG (Registered) | 13,705,783 | 369,329 |
| * | Siemens Energy AG | 8,819,925 | 362,262 |
| | Bayerische Motoren Werke AG | 4,107,750 | 323,839 |
| | RWE AG | 9,926,008 | 321,698 |
| | Vonovia SE | 9,805,509 | 321,481 |
Total International Stock Index Fund
| | | | | | Shares | Market
Value•
($000) |
| | Rheinmetall AG | 605,885 | 311,931 |
| | Daimler Truck Holding AG | 7,300,906 | 301,897 |
| | Merck KGaA | 1,802,031 | 297,921 |
| | Commerzbank AG | 14,364,085 | 254,756 |
| | MTU Aero Engines AG | 750,780 | 245,386 |
| | Hannover Rueck SE | 838,211 | 220,109 |
| | Symrise AG Class A | 1,816,471 | 218,577 |
| * | Fresenius SE & Co. KGaA | 5,737,470 | 209,479 |
| 2 | Siemens Healthineers AG | 3,882,322 | 202,675 |
| | Heidelberg Materials AG | 1,809,709 | 199,320 |
| | Beiersdorf AG | 1,374,563 | 185,558 |
| *,2 | Covestro AG | 2,634,450 | 166,857 |
| * | QIAGEN NV | 3,024,727 | 128,183 |
| | Brenntag SE | 1,816,025 | 118,465 |
| | GEA Group AG | 2,388,406 | 117,643 |
| *,2 | Delivery Hero SE Class A | 2,740,360 | 116,334 |
| | Fresenius Medical Care AG | 2,837,228 | 111,063 |
| | Henkel AG & Co. KGaA | 1,374,271 | 107,271 |
| | LEG Immobilien SE | 1,035,458 | 97,817 |
| | Continental AG | 1,507,841 | 94,105 |
| *,2 | Zalando SE | 3,060,963 | 92,664 |
| 2 | Scout24 SE | 1,025,779 | 88,612 |
| | CTS Eventim AG & Co. KGaA | 820,604 | 86,176 |
| | Nemetschek SE | 755,257 | 81,381 |
| | Evonik Industries AG | 3,506,525 | 77,281 |
| | Knorr-Bremse AG | 923,705 | 76,197 |
| | Rational AG | 66,428 | 65,053 |
| | Talanx AG | 842,859 | 64,958 |
| | Puma SE | 1,389,399 | 63,356 |
| | Deutsche Lufthansa AG (Registered) | 8,340,043 | 57,954 |
| * | TUI AG | 6,226,192 | 51,902 |
| | Freenet AG | 1,666,368 | 49,525 |
| | Gerresheimer AG | 482,151 | 40,607 |
| | Volkswagen AG | 397,336 | 39,587 |
| | Bechtle AG | 1,145,780 | 39,122 |
| | KION Group AG | 1,002,081 | 38,908 |
| | HOCHTIEF AG | 296,302 | 36,286 |
| | LANXESS AG | 1,207,273 | 35,059 |
| * | TAG Immobilien AG | 2,108,364 | 35,049 |
| 1 | Aurubis AG | 421,459 | 33,142 |
| 1 | Carl Zeiss Meditec AG | 510,909 | 32,163 |
| 1 | HUGO BOSS AG | 660,814 | 30,423 |
| 1 | K+S AG (Registered) | 2,503,494 | 30,399 |
| * | Aroundtown SA | 9,526,534 | 28,366 |
| *,2 | TeamViewer SE | 1,950,829 | 28,104 |
| *,1 | Nordex SE | 1,950,391 | 27,794 |
| | Hensoldt AG | 804,453 | 27,371 |
| * | Fraport AG Frankfurt Airport Services Worldwide | 496,686 | 26,877 |
| | Krones AG | 203,989 | 26,571 |
| | Stroeer SE & Co. KGaA | 437,204 | 25,942 |
| * | Encavis AG | 1,296,153 | 24,607 |
| *,1 | HelloFresh SE | 2,207,895 | 24,453 |
| | thyssenkrupp AG | 6,879,498 | 24,015 |
| 1 | AIXTRON SE | 1,486,357 | 23,601 |
| | United Internet AG (Registered) | 1,122,103 | 22,973 |
| 1 | Traton SE | 717,311 | 22,968 |
| 2 | DWS Group GmbH & Co. KGaA | 435,619 | 18,592 |
| | Wacker Chemie AG | 209,966 | 17,661 |
| | Deutsche Wohnen SE | 689,235 | 17,608 |
| | Bilfinger SE | 360,315 | 17,319 |
| | flatexDEGIRO AG | 1,163,018 | 17,085 |
| *,1 | Evotec SE | 2,199,226 | 17,009 |
| | Fielmann Group AG | 335,868 | 16,894 |
| *,2 | Redcare Pharmacy NV | 110,283 | 16,890 |
| | Jenoptik AG | 707,936 | 16,609 |
| | Siltronic AG | 290,746 | 16,516 |
| * | RENK Group AG | 819,539 | 16,468 |
| 1 | RTL Group SA | 512,464 | 16,308 |
| | Duerr AG | 686,621 | 15,912 |
| | Schott Pharma AG & Co. KGaA | 484,563 | 15,696 |
Total International Stock Index Fund
| | | | | | Shares | Market
Value•
($000) |
| 1 | Sixt SE | 195,723 | 15,503 |
| 1 | ProSiebenSat.1 Media SE | 2,355,333 | 14,498 |
| | Atoss Software SE | 108,980 | 14,335 |
| * | Hypoport SE | 60,062 | 14,103 |
| | Stabilus SE | 339,342 | 13,434 |
| *,2 | Auto1 Group SE | 1,308,689 | 13,430 |
| | FUCHS SE | 372,051 | 13,366 |
| 2 | Befesa SA | 560,114 | 13,045 |
| | CANCOM SE | 444,185 | 11,861 |
| * | Grand City Properties SA | 892,698 | 11,832 |
| | Hornbach Holding AG & Co. KGaA | 135,232 | 11,832 |
| *,1 | Nagarro SE | 115,747 | 11,308 |
| 1 | Suedzucker AG | 833,506 | 9,999 |
| | KWS Saat SE & Co. KGaA | 143,462 | 9,905 |
| *,1,2 | Deutsche Pfandbriefbank AG | 1,714,136 | 9,735 |
| * | Douglas AG | 473,322 | 9,657 |
| 1 | Kontron AG | 562,913 | 9,479 |
| | 1&1 AG | 642,164 | 9,022 |
| | Eckert & Ziegler SE | 198,256 | 8,506 |
| | Deutz AG | 1,865,249 | 8,294 |
| | METRO AG | 1,755,290 | 8,268 |
| * | CECONOMY AG | 2,531,727 | 8,149 |
| * | IONOS Group SE | 296,893 | 8,108 |
| | Dermapharm Holding SE | 235,706 | 8,007 |
| | Pfeiffer Vacuum Technology AG | 46,866 | 7,838 |
| 1 | PNE AG | 599,104 | 7,705 |
| | GRENKE AG | 366,809 | 7,248 |
| | Elmos Semiconductor SE | 117,917 | 7,045 |
| | Sartorius AG | 33,339 | 6,834 |
| | Hamburger Hafen und Logistik AG | 370,753 | 6,487 |
| | Vossloh AG | 125,682 | 6,083 |
| | Norma Group SE | 434,027 | 6,018 |
| | Indus Holding AG | 259,638 | 5,781 |
| | Wuestenrot & Wuerttembergische AG | 421,045 | 5,467 |
| | Deutsche EuroShop AG | 243,027 | 5,401 |
| 1 | Adtran Networks SE | 248,527 | 5,288 |
| | Wacker Neuson SE | 341,943 | 5,272 |
| | CompuGroup Medical SE & Co. KGaA | 341,049 | 5,071 |
| | GFT Technologies SE | 228,448 | 5,038 |
| | Energiekontor AG | 93,304 | 4,974 |
| 1 | Salzgitter AG | 324,415 | 4,955 |
| 1 | Deutsche Beteiligungs AG | 197,619 | 4,813 |
| | PATRIZIA SE | 559,638 | 4,730 |
| | Takkt AG | 457,232 | 4,475 |
| *,1 | Thyssenkrupp Nucera AG & Co. KGaA | 419,319 | 4,340 |
| 1 | Verbio SE | 279,308 | 4,294 |
| | Kloeckner & Co. SE | 825,372 | 4,215 |
| | STRATEC SE | 98,881 | 3,858 |
| * | Encavis AG (XETR) | 198,330 | 3,712 |
| 1 | Adesso SE | 50,269 | 3,668 |
| * | Schaeffler AG | 720,274 | 3,599 |
| *,1 | SGL Carbon SE | 682,311 | 3,482 |
| | Secunet Security Networks AG | 21,592 | 2,521 |
| 1 | SMA Solar Technology AG | 123,024 | 2,153 |
| * | About You Holding SE | 635,068 | 2,125 |
| *,1 | BayWa AG | 184,914 | 2,032 |
| | Draegerwerk AG & Co. KGaA | 42,325 | 1,913 |
| * | Pentixapharm Holding AG | 198,256 | 766 |
| | | | | | | 21,761,903 |
| Greece (0.2%) |
| | National Bank of Greece SA | 11,672,859 | 91,454 |
| | Eurobank Ergasias Services & Holdings SA | 35,090,049 | 72,609 |
| | Metlen Energy & Metals SA | 1,525,416 | 53,590 |
| | Piraeus Financial Holdings SA | 14,146,432 | 53,301 |
| | Alpha Services & Holdings SA | 29,832,393 | 44,937 |
| | OPAP SA | 2,614,749 | 44,673 |
| | JUMBO SA | 1,532,945 | 40,914 |
| | Public Power Corp. SA | 2,795,721 | 36,757 |
| | Hellenic Telecommunications Organization SA | 1,906,899 | 31,510 |
Total International Stock Index Fund
| | | | | | Shares | Market
Value•
($000) |
| | Titan Cement International SA | 539,106 | 19,279 |
| | Motor Oil Hellas Corinth Refineries SA | 790,985 | 16,892 |
| | Terna Energy SA | 740,969 | 15,969 |
| | GEK Terna SA | 772,968 | 14,589 |
| | Optima bank SA | 920,463 | 12,911 |
| | Hellenic Telecommunications Organization SA ADR | 1,283,191 | 10,561 |
| | HELLENiQ ENERGY Holdings SA | 1,287,248 | 9,681 |
| | Athens International Airport SA | 1,026,434 | 8,805 |
| * | LAMDA Development SA | 1,094,232 | 8,789 |
| | Aegean Airlines SA | 516,949 | 5,628 |
| | Sarantis SA | 410,194 | 4,909 |
| | Cenergy Holdings SA | 497,684 | 4,729 |
| | Holding Co. ADMIE IPTO SA | 1,552,263 | 4,011 |
| * | Intralot SA-Integrated Information Systems & Gaming Services | 3,619,958 | 3,994 |
| | Fourlis Holdings SA | 966,811 | 3,877 |
| | Athens Water Supply & Sewage Co. SA | 606,719 | 3,828 |
| | Autohellas Tourist & Trading SA | 298,644 | 3,689 |
| * | Intrakat Technical & Energy Projects SA | 670,525 | 3,586 |
| | Viohalco SA | 605,606 | 3,400 |
| | Piraeus Port Authority SA | 111,305 | 3,361 |
| | Hellenic Exchanges - Athens Stock Exchange SA | 729,362 | 3,358 |
| | Ideal Holdings SA | 386,239 | 2,556 |
| | Quest Holdings SA | 405,424 | 2,449 |
| | Ellaktor SA | 1,192,089 | 2,306 |
| | Intracom Holdings SA (Registered) | 697,569 | 2,096 |
| *,3 | FF Group | 554,339 | — |
| | | | | | | 644,998 |
| Hong Kong (1.3%) |
| | AIA Group Ltd. | 156,709,294 | 1,236,800 |
| | Hong Kong Exchanges & Clearing Ltd. | 17,692,483 | 708,413 |
| | Techtronic Industries Co. Ltd. | 18,294,441 | 264,637 |
| | Sun Hung Kai Properties Ltd. | 19,825,109 | 214,666 |
| | CK Hutchison Holdings Ltd. | 37,076,760 | 194,991 |
| | CLP Holdings Ltd. | 22,922,811 | 194,720 |
| | Link REIT | 35,675,672 | 166,228 |
| | BOC Hong Kong Holdings Ltd. | 50,023,900 | 163,315 |
| | Lenovo Group Ltd. | 107,380,297 | 141,596 |
| | Galaxy Entertainment Group Ltd. | 30,119,625 | 134,050 |
| | Power Assets Holdings Ltd. | 19,084,921 | 127,130 |
| | Hang Seng Bank Ltd. | 10,096,651 | 123,504 |
| | Hong Kong & China Gas Co. Ltd. | 151,790,177 | 117,571 |
| | CK Asset Holdings Ltd. | 26,646,167 | 108,929 |
| | Jardine Matheson Holdings Ltd. | 2,758,340 | 105,987 |
| * | Sands China Ltd. | 33,497,071 | 85,226 |
| 2 | WH Group Ltd. | 109,028,079 | 84,858 |
| | Shenzhou International Group Holdings Ltd. | 10,544,704 | 81,426 |
| | MTR Corp. Ltd. | 20,225,914 | 73,590 |
| | Hongkong Land Holdings Ltd. | 15,307,204 | 65,631 |
| | Wharf Real Estate Investment Co. Ltd. | 21,595,906 | 64,930 |
| | CK Infrastructure Holdings Ltd. | 8,235,676 | 58,279 |
| | Henderson Land Development Co. Ltd. | 18,120,942 | 58,108 |
| | PRADA SpA | 7,128,478 | 54,729 |
| | Swire Pacific Ltd. Class A | 6,369,032 | 53,345 |
| | SITC International Holdings Co. Ltd. | 17,819,448 | 50,363 |
| 2 | ESR Group Ltd. | 36,809,451 | 49,903 |
| | Sino Land Co. Ltd. | 49,018,963 | 49,056 |
| | ASMPT Ltd. | 4,337,382 | 47,021 |
| 2 | Samsonite International SA | 19,111,561 | 44,910 |
| | AAC Technologies Holdings Inc. | 9,445,792 | 38,152 |
| | Wharf Holdings Ltd. | 13,285,707 | 37,644 |
| | Want Want China Holdings Ltd. | 59,773,511 | 37,195 |
| | Xinyi Glass Holdings Ltd. | 29,495,865 | 33,495 |
| | PCCW Ltd. | 58,107,742 | 31,913 |
| | Swire Properties Ltd. | 14,740,350 | 30,000 |
| | Orient Overseas International Ltd. | 1,830,169 | 24,947 |
| 2 | Budweiser Brewing Co. APAC Ltd. | 23,663,956 | 24,681 |
| | Bank of East Asia Ltd. | 19,365,559 | 23,991 |
| | Chow Tai Fook Jewellery Group Ltd. | 24,339,314 | 23,053 |
| 2 | BOC Aviation Ltd. | 2,918,736 | 22,638 |
Total International Stock Index Fund
| | | | | | Shares | Market
Value•
($000) |
| | Yue Yuen Industrial Holdings Ltd. | 9,773,408 | 20,545 |
| | Hang Lung Properties Ltd. | 24,045,667 | 20,197 |
| | New World Development Co. Ltd. | 19,656,422 | 19,756 |
| | United Laboratories International Holdings Ltd. | 13,479,797 | 18,297 |
| | Pacific Basin Shipping Ltd. | 66,069,523 | 18,197 |
| | First Pacific Co. Ltd. | 32,055,977 | 18,026 |
| | Kerry Properties Ltd. | 8,300,913 | 17,533 |
| * | MMG Ltd. | 48,106,137 | 16,933 |
| | VTech Holdings Ltd. | 2,232,222 | 16,616 |
| | Wynn Macau Ltd. | 20,506,519 | 16,183 |
| | Hang Lung Group Ltd. | 12,127,649 | 15,857 |
| | Stella International Holdings Ltd. | 8,260,303 | 15,420 |
| | Man Wah Holdings Ltd. | 20,439,193 | 14,850 |
| 1 | Cathay Pacific Airways Ltd. | 13,926,987 | 14,486 |
| | Hysan Development Co. Ltd. | 8,423,995 | 13,663 |
| | NWS Holdings Ltd. | 13,125,126 | 13,540 |
| | MGM China Holdings Ltd. | 10,374,206 | 13,463 |
| | Vitasoy International Holdings Ltd. | 11,262,026 | 12,738 |
| * | SJM Holdings Ltd. | 32,319,253 | 11,114 |
| * | Vobile Group Ltd. | 24,567,636 | 11,072 |
| | Shangri-La Asia Ltd. | 15,216,647 | 10,992 |
| | Fortune REIT | 18,999,671 | 9,905 |
| | DFI Retail Group Holdings Ltd. | 4,153,690 | 9,857 |
| *,1 | Cowell e Holdings Inc. | 3,193,833 | 9,856 |
| | Luk Fook Holdings International Ltd. | 4,752,475 | 9,105 |
| 1 | CGN Mining Co. Ltd. | 34,055,000 | 8,538 |
| * | Mongolian Mining Corp. | 7,047,000 | 8,010 |
| | Dah Sing Financial Holdings Ltd. | 2,446,066 | 7,975 |
| * | NagaCorp Ltd. | 19,231,328 | 7,908 |
| | Johnson Electric Holdings Ltd. | 5,030,648 | 7,636 |
| | Swire Pacific Ltd. Class B | 5,148,944 | 6,948 |
| * | Melco International Development Ltd. | 10,705,822 | 6,586 |
| | Champion REIT | 26,147,197 | 6,117 |
| *,2 | Everest Medicines Ltd. | 1,501,612 | 6,081 |
| | CITIC Telecom International Holdings Ltd. | 20,523,157 | 5,883 |
| | IGG Inc. | 10,269,256 | 5,430 |
| *,2 | FIT Hon Teng Ltd. | 15,241,576 | 5,140 |
| | Dah Sing Banking Group Ltd. | 5,316,647 | 5,007 |
| | Jinchuan Group International Resources Co. Ltd. | 68,311,080 | 4,927 |
| | VSTECS Holdings Ltd. | 8,490,627 | 4,909 |
| | HKBN Ltd. | 11,068,577 | 4,875 |
| | Guotai Junan International Holdings Ltd. | 32,852,952 | 4,853 |
| | Cafe de Coral Holdings Ltd. | 4,505,439 | 4,833 |
| *,1 | Realord Group Holdings Ltd. | 4,978,715 | 4,751 |
| | Value Partners Group Ltd. | 20,304,030 | 4,714 |
| | China Travel International Investment Hong Kong Ltd. | 34,433,626 | 4,517 |
| *,1 | Super Hi International Holding Ltd. | 2,678,331 | 4,417 |
| 1 | United Energy Group Ltd. | 103,515,817 | 4,314 |
| | Nexteer Automotive Group Ltd. | 11,381,741 | 4,154 |
| * | SUNeVision Holdings Ltd. | 8,289,064 | 4,147 |
| | Huabao International Holdings Ltd. | 13,335,468 | 4,015 |
| | K Wah International Holdings Ltd. | 16,753,282 | 3,877 |
| | Kerry Logistics Network Ltd. | 3,829,896 | 3,597 |
| 1 | Beijing Tong Ren Tang Chinese Medicine Co. Ltd. | 3,294,282 | 3,444 |
| | Giordano International Ltd. | 15,478,259 | 3,396 |
| 1 | Theme International Holdings Ltd. | 66,390,416 | 3,323 |
| *,2 | CARsgen Therapeutics Holdings Ltd. | 4,832,000 | 3,179 |
| | Sunlight REIT | 13,150,138 | 3,159 |
| | Truly International Holdings Ltd. | 21,455,268 | 2,912 |
| | SmarTone Telecommunications Holdings Ltd. | 5,222,637 | 2,845 |
| | Prosperity REIT | 16,993,006 | 2,838 |
| | Far East Consortium International Ltd. | 17,756,103 | 2,642 |
| | Chow Sang Sang Holdings International Ltd. | 3,011,782 | 2,480 |
| | Texhong International Group Ltd. | 3,981,066 | 2,160 |
| | Hutchison Telecommunications Hong Kong Holdings Ltd. | 15,952,764 | 1,949 |
| 1 | LK Technology Holdings Ltd. | 5,015,105 | 1,932 |
| *,1 | C-Mer Medical Holdings Ltd. | 6,272,736 | 1,845 |
| * | Television Broadcasts Ltd. | 4,007,306 | 1,673 |
| | CITIC Resources Holdings Ltd. | 30,636,497 | 1,653 |
| | Asia Cement China Holdings Corp. | 5,377,727 | 1,644 |
Total International Stock Index Fund
| | | | | | Shares | Market
Value•
($000) |
| | Singamas Container Holdings Ltd. | 18,140,193 | 1,606 |
| * | Powerlong Real Estate Holdings Ltd. | 20,164,942 | 1,552 |
| * | Shun Tak Holdings Ltd. | 17,080,391 | 1,473 |
| *,2 | IMAX China Holding Inc. | 1,338,618 | 1,417 |
| *,2 | Fosun Tourism Group | 2,915,400 | 1,357 |
| | Sa Sa International Holdings Ltd. | 14,974,275 | 1,311 |
| * | Hong Kong Technology Venture Co. Ltd. | 5,437,817 | 1,012 |
| * | OCI International Holdings Ltd. | 8,807,369 | 565 |
| *,2 | Jacobio Pharmaceuticals Group Co. Ltd. | 1,208,737 | 285 |
| *,2 | Frontage Holdings Corp. | 1,530,775 | 157 |
| * | Apollo Future Mobility Group Ltd. | 1,779,696 | 121 |
| * | Renze Harvest International Ltd. | 3,408,457 | 52 |
| *,3 | Convoy Global Holdings Ltd. | 147,589,460 | — |
| | | | | | | 5,827,963 |
| Hungary (0.1%) |
| | OTP Bank Nyrt. | 3,203,735 | 159,501 |
| | Richter Gedeon Nyrt. | 2,035,783 | 58,839 |
| | MOL Hungarian Oil & Gas plc | 6,291,912 | 43,663 |
| | Magyar Telekom Telecommunications plc | 4,500,637 | 13,780 |
| | Opus Global Nyrt. | 3,874,135 | 5,410 |
| | | | | | | 281,193 |
| Iceland (0.0%) |
| | Marel HF | 7,907,371 | 33,340 |
| 2 | Arion Banki HF | 18,740,348 | 21,523 |
| * | Alvotech SA | 1,139,848 | 14,989 |
| | Islandsbanki HF | 15,521,826 | 14,275 |
| | Hagar hf | 14,385,456 | 9,967 |
| * | Kvika banki hf | 64,199,255 | 8,854 |
| | Festi hf | 4,203,493 | 7,627 |
| | Reitir fasteignafelag hf | 10,307,669 | 7,323 |
| | Sjova-Almennar Tryggingar hf | 13,698,287 | 4,571 |
| | Hampidjan HF | 5,175,048 | 4,499 |
| | Eimskipafelag Islands hf | 1,533,657 | 4,045 |
| | Vatryggingafelag Islands Hf | 24,340,066 | 3,396 |
| | Siminn HF | 35,328,092 | 3,012 |
| * | Icelandair Group HF | 287,157,748 | 2,306 |
| * | Olgerdin Egill Skallagrims HF | 16,884,668 | 2,118 |
| | | | | | | 141,845 |
| India (6.3%) |
| | HDFC Bank Ltd. | 78,523,473 | 1,614,027 |
| | Reliance Industries Ltd. | 92,686,480 | 1,465,556 |
| | Infosys Ltd. | 48,939,179 | 1,021,099 |
| | ICICI Bank Ltd. | 53,940,964 | 827,430 |
| | Bharti Airtel Ltd. (XNSE) | 35,671,247 | 682,765 |
| | Tata Consultancy Services Ltd. | 14,410,380 | 677,823 |
| | Axis Bank Ltd. | 31,901,124 | 438,231 |
| | Mahindra & Mahindra Ltd. | 12,747,401 | 411,645 |
| | Larsen & Toubro Ltd. | 9,400,553 | 403,817 |
| | Hindustan Unilever Ltd. | 12,378,094 | 371,638 |
| | Sun Pharmaceutical Industries Ltd. | 15,155,315 | 332,587 |
| | NTPC Ltd. | 66,038,343 | 319,400 |
| | HCL Technologies Ltd. | 14,747,719 | 308,590 |
| | Tata Motors Ltd. | 29,449,375 | 291,285 |
| | Bajaj Finance Ltd. | 3,493,913 | 285,385 |
| * | Zomato Ltd. | 95,778,392 | 274,789 |
| | Maruti Suzuki India Ltd. | 1,920,070 | 252,014 |
| | ITC Ltd. | 41,734,372 | 242,138 |
| | Power Grid Corp. of India Ltd. | 58,448,228 | 222,336 |
| | Asian Paints Ltd. | 6,337,316 | 220,717 |
| | Titan Co. Ltd. | 5,689,467 | 220,380 |
| | Trent Ltd. | 2,530,209 | 213,810 |
| | UltraTech Cement Ltd. | 1,597,427 | 209,768 |
| | Tata Steel Ltd. | 117,398,899 | 206,331 |
| | Kotak Mahindra Bank Ltd. | 9,722,163 | 199,598 |
| | State Bank of India | 19,692,001 | 191,628 |
| | Oil & Natural Gas Corp. Ltd. | 54,142,511 | 170,751 |
| | Coal India Ltd. | 31,658,575 | 169,815 |
| * | Jio Financial Services Ltd. | 44,038,271 | 168,438 |
Total International Stock Index Fund
| | | | | | Shares | Market
Value•
($000) |
| | Bharat Electronics Ltd. | 49,788,844 | 168,067 |
| | Adani Ports & Special Economic Zone Ltd. | 10,282,832 | 167,771 |
| | Grasim Industries Ltd. | 5,201,351 | 166,577 |
| | Tech Mahindra Ltd. | 8,476,720 | 161,346 |
| | JSW Steel Ltd. | 14,083,712 | 160,802 |
| | Hindalco Industries Ltd. | 19,278,859 | 156,437 |
| | Adani Enterprises Ltd. | 4,349,042 | 152,110 |
| | Shriram Finance Ltd. | 3,918,018 | 145,465 |
| | Cipla Ltd. | 7,457,681 | 137,197 |
| | Nestle India Ltd. | 5,009,727 | 134,727 |
| | Hindustan Aeronautics Ltd. | 2,642,791 | 132,990 |
| * | Suzlon Energy Ltd. | 164,800,705 | 130,685 |
| | Max Healthcare Institute Ltd. | 10,311,212 | 124,471 |
| | Divi's Laboratories Ltd. | 1,776,005 | 124,126 |
| *,2 | InterGlobe Aviation Ltd. | 2,570,543 | 123,488 |
| | Vedanta Ltd. | 22,072,888 | 121,504 |
| 2 | HDFC Life Insurance Co. Ltd. | 13,779,303 | 117,696 |
| | Varun Beverages Ltd. | 16,268,762 | 115,651 |
| | Apollo Hospitals Enterprise Ltd. | 1,381,218 | 115,068 |
| * | Adani Power Ltd. | 16,137,895 | 113,307 |
| 2 | SBI Life Insurance Co. Ltd. | 5,871,485 | 113,042 |
| | Dr Reddy's Laboratories Ltd. | 7,453,550 | 112,741 |
| | Britannia Industries Ltd. | 1,656,711 | 112,637 |
| | Eicher Motors Ltd. | 1,937,321 | 112,438 |
| * | Adani Green Energy Ltd. | 5,868,567 | 111,149 |
| | Bajaj Finserv Ltd. | 5,332,808 | 110,663 |
| | Bajaj Auto Ltd. | 933,631 | 109,043 |
| | Power Finance Corp. Ltd. | 20,286,076 | 108,982 |
| | Hero MotoCorp Ltd. | 1,821,480 | 107,705 |
| | REC Ltd. | 17,423,974 | 107,579 |
| | Tata Consumer Products Ltd. | 8,986,891 | 106,919 |
| | Tata Power Co. Ltd. | 20,392,254 | 106,296 |
| | Bharat Petroleum Corp. Ltd. | 27,977,186 | 103,202 |
| | Siemens Ltd. | 1,243,604 | 102,879 |
| | TVS Motor Co. Ltd. | 3,291,629 | 97,432 |
| *,2 | Avenue Supermarts Ltd. | 2,082,846 | 97,212 |
| | Indian Oil Corp. Ltd. | 57,240,880 | 96,473 |
| | Info Edge India Ltd. | 1,066,875 | 94,135 |
| | Indian Hotels Co. Ltd. Class A | 11,585,605 | 92,914 |
| | Wipro Ltd. | 13,878,413 | 90,340 |
| | Persistent Systems Ltd. | 1,410,511 | 89,809 |
| * | PB Fintech Ltd. | 4,404,596 | 88,993 |
| | GAIL India Ltd. | 36,804,492 | 87,207 |
| | Lupin Ltd. | 3,350,951 | 86,946 |
| 2 | LTIMindtree Ltd. | 1,279,568 | 86,587 |
| | Cholamandalam Investment & Finance Co. Ltd. | 5,741,739 | 86,557 |
| | DLF Ltd. | 8,637,121 | 83,959 |
| | Dixon Technologies India Ltd. | 498,799 | 83,219 |
| | Samvardhana Motherson International Ltd. | 37,441,858 | 80,222 |
| | Coforge Ltd. | 885,933 | 79,877 |
| | Pidilite Industries Ltd. | 2,124,730 | 79,337 |
| | Cummins India Ltd. | 1,882,905 | 78,103 |
| | Godrej Consumer Products Ltd. | 5,087,328 | 77,515 |
| | Tube Investments of India Ltd. | 1,453,268 | 77,263 |
| | Ambuja Cements Ltd. | 11,165,515 | 76,974 |
| 2 | ICICI Lombard General Insurance Co. Ltd. | 3,363,563 | 76,411 |
| | CG Power & Industrial Solutions Ltd. | 8,942,383 | 74,682 |
| * | Indus Towers Ltd. | 18,394,956 | 74,222 |
| 2 | HDFC Asset Management Co. Ltd. | 1,400,953 | 71,493 |
| | United Spirits Ltd. | 4,019,245 | 69,160 |
| * | Yes Bank Ltd. | 281,915,097 | 68,055 |
| | Colgate-Palmolive India Ltd. | 1,852,798 | 67,387 |
| | Torrent Power Ltd. | 3,013,623 | 65,193 |
| | Havells India Ltd. | 3,348,389 | 65,164 |
| | ABB India Ltd. | 738,298 | 65,029 |
| | Voltas Ltd. | 3,195,818 | 62,556 |
| * | Adani Energy Solutions Ltd. | 5,310,409 | 61,391 |
| | Aurobindo Pharma Ltd. | 3,693,252 | 61,220 |
| | Federal Bank Ltd. | 25,129,113 | 60,782 |
| | PI Industries Ltd. | 1,125,960 | 59,894 |
Total International Stock Index Fund
| | | | | | Shares | Market
Value•
($000) |
| | JSW Energy Ltd. | 7,420,120 | 59,816 |
| | Bharat Forge Ltd. | 3,552,247 | 59,459 |
| | Jindal Steel & Power Ltd. | 5,435,597 | 59,323 |
| | Hindustan Petroleum Corp. Ltd. | 12,691,627 | 57,388 |
| | Embassy Office Parks REIT | 12,208,611 | 57,331 |
| | Shree Cement Ltd. | 188,209 | 55,981 |
| | Marico Ltd. | 7,299,510 | 55,463 |
| | MRF Ltd. | 37,658 | 54,769 |
| | Sundaram Finance Ltd. | 933,697 | 53,362 |
| | Torrent Pharmaceuticals Ltd. | 1,383,664 | 52,594 |
| | SRF Ltd. | 1,968,662 | 52,344 |
| | Mphasis Ltd. | 1,535,598 | 52,342 |
| 2 | Macrotech Developers Ltd. | 3,622,977 | 51,796 |
| | Dabur India Ltd. | 8,066,594 | 51,726 |
| | Polycab India Ltd. | 667,438 | 51,190 |
| | State Bank of India GDR | 529,121 | 51,021 |
| * | Max Financial Services Ltd. | 3,346,419 | 50,989 |
| | Bharat Heavy Electricals Ltd. | 17,874,505 | 50,599 |
| | Fortis Healthcare Ltd. | 6,800,608 | 50,488 |
| | Bosch Ltd. | 121,031 | 50,487 |
| | APL Apollo Tubes Ltd. | 2,742,396 | 49,528 |
| | Alkem Laboratories Ltd. | 720,397 | 49,436 |
| * | Godrej Properties Ltd. | 1,449,945 | 49,350 |
| | BSE Ltd. | 925,002 | 48,855 |
| | Ashok Leyland Ltd. | 19,632,487 | 48,496 |
| | UPL Ltd. | 7,330,233 | 48,187 |
| | Phoenix Mills Ltd. | 2,623,186 | 47,385 |
| 2 | ICICI Prudential Life Insurance Co. Ltd. | 5,335,970 | 46,914 |
| * | GMR Airports Infrastructure Ltd. | 49,915,453 | 46,863 |
| 2 | Sona Blw Precision Forgings Ltd. | 5,743,318 | 46,718 |
| 2 | Indian Railway Finance Corp. Ltd. | 24,829,861 | 45,846 |
| | Supreme Industries Ltd. | 890,657 | 45,377 |
| | Bajaj Holdings & Investment Ltd. | 371,709 | 45,172 |
| | Rail Vikas Nigam Ltd. | 7,892,559 | 44,027 |
| * | One 97 Communications Ltd. | 4,872,399 | 43,761 |
| | Page Industries Ltd. | 85,023 | 43,567 |
| | Bank of Baroda | 14,512,257 | 43,157 |
| | Kalyan Jewellers India Ltd. | 5,488,917 | 42,814 |
| | Oil India Ltd. | 7,591,754 | 42,544 |
| | NMDC Ltd. | 16,118,093 | 42,330 |
| | Glenmark Pharmaceuticals Ltd. | 2,097,385 | 42,199 |
| | Zydus Lifesciences Ltd. | 3,508,821 | 41,678 |
| * | Mankind Pharma Ltd. | 1,311,045 | 41,488 |
| | Crompton Greaves Consumer Electricals Ltd. | 8,933,407 | 41,462 |
| | Oracle Financial Services Software Ltd. | 320,330 | 41,342 |
| | Petronet LNG Ltd. | 10,458,813 | 41,271 |
| | Solar Industries India Ltd. | 338,706 | 41,074 |
| | Indian Railway Catering & Tourism Corp. Ltd. | 4,190,109 | 40,812 |
| * | FSN E-Commerce Ventures Ltd. | 18,940,186 | 40,741 |
| | NHPC Ltd. | 41,489,586 | 40,621 |
| * | IDFC First Bank Ltd. | 51,088,923 | 39,912 |
| | Tata Elxsi Ltd. | 477,424 | 39,777 |
| | 360 ONE WAM Ltd. | 3,023,978 | 39,130 |
| | Blue Star Ltd. | 1,753,922 | 38,901 |
| | Container Corp. of India Ltd. | 3,828,505 | 38,497 |
| | Oberoi Realty Ltd. | 1,636,827 | 38,138 |
| | KPIT Technologies Ltd. | 2,304,570 | 38,037 |
| | Balkrishna Industries Ltd. | 1,123,992 | 37,826 |
| | KEI Industries Ltd. | 786,036 | 37,769 |
| 1 | Wipro Ltd. ADR | 5,787,328 | 37,502 |
| 2 | AU Small Finance Bank Ltd. | 5,073,681 | 36,883 |
| | Punjab National Bank | 30,898,962 | 35,889 |
| | Ipca Laboratories Ltd. | 1,895,218 | 35,740 |
| | Jindal Stainless Ltd. | 4,451,010 | 35,636 |
| | Astral Ltd. | 1,672,901 | 35,152 |
| | Coromandel International Ltd. | 1,750,941 | 34,691 |
| | Exide Industries Ltd. | 6,407,078 | 34,657 |
| | Jubilant Foodworks Ltd. | 5,035,510 | 34,403 |
| | Prestige Estates Projects Ltd. | 1,770,315 | 34,369 |
| | Muthoot Finance Ltd. | 1,492,493 | 34,172 |
Total International Stock Index Fund
| | | | | | Shares | Market
Value•
($000) |
| | Computer Age Management Services Ltd. | 640,745 | 33,758 |
| | Tata Communications Ltd. | 1,586,959 | 33,417 |
| | National Aluminium Co. Ltd. | 12,414,401 | 33,351 |
| | SBI Cards & Payment Services Ltd. | 4,065,315 | 33,200 |
| | Adani Total Gas Ltd. | 3,861,800 | 32,943 |
| 2 | Laurus Labs Ltd. | 5,410,831 | 31,556 |
| * | Delhivery Ltd. | 7,437,004 | 31,416 |
| | Radico Khaitan Ltd. | 1,110,340 | 31,402 |
| | LIC Housing Finance Ltd. | 4,193,962 | 31,381 |
| | ACC Ltd. | 1,130,240 | 31,115 |
| | Canara Bank | 25,562,468 | 31,061 |
| | Amara Raja Energy & Mobility Ltd. | 1,884,572 | 31,050 |
| | Tata Chemicals Ltd. | 2,246,482 | 30,588 |
| | GE T&D India Ltd. | 1,451,117 | 30,541 |
| | Apollo Tyres Ltd. | 5,076,450 | 30,348 |
| | Deepak Nitrite Ltd. | 967,942 | 30,294 |
| | JK Cement Ltd. | 585,435 | 30,015 |
| | Union Bank of India Ltd. | 21,451,121 | 29,747 |
| * | Vodafone Idea Ltd. | 305,957,153 | 29,419 |
| | Angel One Ltd. | 802,031 | 28,950 |
| | Gujarat Fluorochemicals Ltd. | 554,516 | 28,368 |
| | Apar Industries Ltd. | 236,454 | 28,247 |
| | Patanjali Foods Ltd. | 1,321,584 | 28,153 |
| | Tata Technologies Ltd. | 2,343,463 | 27,956 |
| | Steel Authority of India Ltd. | 20,132,979 | 27,582 |
| | UNO Minda Ltd. | 2,338,803 | 27,242 |
| | Cholamandalam Financial Holdings Ltd. | 1,336,574 | 27,196 |
| * | Aditya Birla Capital Ltd. | 11,255,215 | 27,139 |
| | Hindustan Zinc Ltd. | 4,118,154 | 27,020 |
| | Linde India Ltd. | 297,285 | 26,989 |
| | Multi Commodity Exchange of India Ltd. | 348,188 | 26,864 |
| | Indian Bank | 3,752,003 | 26,409 |
| | Thermax Ltd. | 449,381 | 26,302 |
| | Mahindra & Mahindra Financial Services Ltd. | 8,188,483 | 26,271 |
| | Central Depository Services India Ltd. | 1,425,470 | 26,125 |
| | Berger Paints India Ltd. | 4,059,861 | 25,872 |
| | Cyient Ltd. | 1,182,049 | 25,700 |
| * | Five-Star Business Finance Ltd. | 3,021,949 | 25,500 |
| | Carborundum Universal Ltd. | 1,539,200 | 25,182 |
| | Dalmia Bharat Ltd. | 1,149,190 | 25,021 |
| * | Inox Wind Ltd. | 9,369,725 | 24,751 |
| | AIA Engineering Ltd. | 540,511 | 24,516 |
| | IRB Infrastructure Developers Ltd. | 39,737,383 | 24,403 |
| | Indraprastha Gas Ltd. | 4,874,135 | 24,304 |
| | Brigade Enterprises Ltd. | 1,740,649 | 24,299 |
| * | Kaynes Technology India Ltd. | 376,028 | 24,268 |
| | Hitachi Energy India Ltd. | 147,878 | 24,217 |
| | Emami Ltd. | 2,880,879 | 24,044 |
| | Piramal Pharma Ltd. | 7,526,756 | 23,958 |
| | Biocon Ltd. | 6,357,527 | 23,855 |
| * | Aditya Birla Fashion & Retail Ltd. | 6,524,994 | 23,855 |
| 2 | Bandhan Bank Ltd. | 11,010,069 | 23,738 |
| | Elgi Equipments Ltd. | 3,016,141 | 23,701 |
| | Sundram Fasteners Ltd. | 1,479,564 | 23,661 |
| | IIFL Finance Ltd. | 4,550,487 | 23,605 |
| | Aditya Birla Real Estate Ltd. | 723,183 | 23,499 |
| 2 | Syngene International Ltd. | 2,290,356 | 23,397 |
| * | Indian Renewable Energy Development Agency Ltd. | 9,367,720 | 23,206 |
| | Schaeffler India Ltd. | 563,794 | 22,939 |
| | Himadri Speciality Chemical Ltd. | 3,286,533 | 22,326 |
| | JB Chemicals & Pharmaceuticals Ltd. | 953,326 | 22,212 |
| *,2 | Krishna Institute of Medical Sciences Ltd. | 3,416,916 | 22,142 |
| * | Suven Pharmaceuticals Ltd. | 1,420,586 | 22,101 |
| | Motilal Oswal Financial Services Ltd. | 1,971,301 | 21,897 |
| | United Breweries Ltd. | 959,107 | 21,886 |
| | Great Eastern Shipping Co. Ltd. | 1,424,753 | 21,759 |
| | Bharti Airtel Ltd. | 1,511,674 | 21,624 |
| | Ajanta Pharma Ltd. | 592,425 | 21,575 |
| 2 | L&T Technology Services Ltd. | 368,634 | 21,575 |
| | Atul Ltd. | 227,487 | 21,164 |
Total International Stock Index Fund
| | | | | | Shares | Market
Value•
($000) |
| | Piramal Enterprises Ltd. | 1,657,329 | 20,827 |
| | Escorts Kubota Ltd. | 467,024 | 20,750 |
| | NCC Ltd. | 5,845,589 | 20,688 |
| 2 | Aster DM Healthcare Ltd. | 3,912,300 | 20,631 |
| | Mazagon Dock Shipbuilders Ltd. | 426,739 | 20,615 |
| | Kalpataru Projects International Ltd. | 1,343,586 | 20,336 |
| | L&T Finance Ltd. | 11,712,678 | 20,288 |
| | Natco Pharma Ltd. | 1,218,091 | 20,218 |
| | SKF India Ltd. | 327,073 | 20,010 |
| | Whirlpool of India Ltd. | 846,896 | 19,989 |
| | CESC Ltd. | 8,926,297 | 19,956 |
| 2 | Nippon Life India Asset Management Ltd. | 2,363,883 | 19,839 |
| * | Reliance Power Ltd. | 39,102,457 | 19,786 |
| | Neuland Laboratories Ltd. | 113,915 | 19,767 |
| * | Global Health Ltd. | 1,497,030 | 19,640 |
| | Sonata Software Ltd. | 2,687,023 | 19,494 |
| | Nexus Select Trust | 11,379,776 | 19,460 |
| | Poly Medicure Ltd. | 565,987 | 19,319 |
| | KEC International Ltd. | 1,634,733 | 19,114 |
| * | Star Health & Allied Insurance Co. Ltd. | 3,186,950 | 19,070 |
| | Redington Ltd. | 8,259,250 | 19,044 |
| | GlaxoSmithKline Pharmaceuticals Ltd. | 590,419 | 19,021 |
| | Navin Fluorine International Ltd. | 481,259 | 19,007 |
| | Lloyds Metals & Energy Ltd. | 1,623,838 | 18,729 |
| | Ramco Cements Ltd. | 1,773,272 | 18,671 |
| * | PVR Inox Ltd. | 992,183 | 18,448 |
| | Gujarat State Petronet Ltd. | 3,930,227 | 18,137 |
| * | Amber Enterprises India Ltd. | 252,935 | 18,097 |
| 2 | Dr Lal PathLabs Ltd. | 487,886 | 18,023 |
| | UTI Asset Management Co. Ltd. | 1,137,545 | 17,992 |
| | Timken India Ltd. | 443,927 | 17,866 |
| | Aegis Logistics Ltd. | 1,879,861 | 17,856 |
| | Housing & Urban Development Corp. Ltd. | 6,926,699 | 17,796 |
| | Concord Biotech Ltd. | 815,165 | 17,708 |
| 2 | Cochin Shipyard Ltd. | 996,349 | 17,662 |
| | Motherson Sumi Wiring India Ltd. | 23,611,198 | 17,580 |
| | Gujarat Gas Ltd. | 2,800,555 | 17,267 |
| | Poonawalla Fincorp Ltd. | 3,868,352 | 17,155 |
| | Grindwell Norton Ltd. | 648,099 | 17,069 |
| | Ratnamani Metals & Tubes Ltd. | 389,442 | 17,010 |
| | Firstsource Solutions Ltd. | 4,205,073 | 16,929 |
| | Castrol India Ltd. | 6,765,944 | 16,846 |
| | 3M India Ltd. | 39,285 | 16,823 |
| | Aarti Industries Ltd. | 2,773,657 | 16,789 |
| | Honeywell Automation India Ltd. | 30,845 | 16,765 |
| * | Zee Entertainment Enterprises Ltd. | 11,556,389 | 16,719 |
| | Kajaria Ceramics Ltd. | 1,152,973 | 16,449 |
| | Anant Raj Ltd. | 1,869,903 | 16,370 |
| | HFCL Ltd. | 11,366,623 | 16,368 |
| | Bank of India | 12,676,026 | 16,315 |
| *,2 | Tejas Networks Ltd. | 1,020,580 | 16,225 |
| *,2 | PNB Housing Finance Ltd. | 1,417,518 | 16,211 |
| | Kirloskar Oil Engines Ltd. | 1,184,998 | 16,116 |
| | LMW Ltd. | 79,910 | 15,791 |
| | Welspun Corp. Ltd. | 1,823,555 | 15,699 |
| | Jubilant Pharmova Ltd. Class A | 1,088,949 | 15,660 |
| | Titagarh Rail System Ltd. | 1,078,536 | 15,605 |
| | Triveni Turbine Ltd. | 1,886,304 | 15,465 |
| | Godfrey Phillips India Ltd. | 195,510 | 15,380 |
| | Finolex Cables Ltd. | 1,056,571 | 15,344 |
| * | Reliance Infrastructure Ltd. | 4,608,809 | 15,308 |
| | Strides Pharma Science Ltd. | 828,180 | 15,295 |
| | Narayana Hrudayalaya Ltd. | 1,002,729 | 15,151 |
| | NBCC India Ltd. | 13,152,666 | 15,115 |
| | Praj Industries Ltd. | 1,713,387 | 15,023 |
| | CRISIL Ltd. | 230,456 | 14,993 |
| | Tata Investment Corp. Ltd. | 182,739 | 14,912 |
| | Karur Vysya Bank Ltd. | 5,511,299 | 14,784 |
| * | Wockhardt Ltd. | 1,031,446 | 14,732 |
| | ZF Commercial Vehicle Control Systems India Ltd. | 86,071 | 14,666 |
Total International Stock Index Fund
| | | | | | Shares | Market
Value•
($000) |
| | Finolex Industries Ltd. | 4,062,015 | 14,618 |
| | BASF India Ltd. | 160,331 | 14,601 |
| | NLC India Ltd. | 4,747,909 | 14,455 |
| * | Jaiprakash Power Ventures Ltd. | 66,585,840 | 14,387 |
| | Dr Reddy's Laboratories Ltd. ADR | 194,598 | 14,381 |
| | Birlasoft Ltd. | 2,196,838 | 14,288 |
| * | Affle India Ltd. | 783,820 | 14,275 |
| | Bata India Ltd. | 883,271 | 14,205 |
| | Bayer CropScience Ltd. | 179,287 | 14,102 |
| | Manappuram Finance Ltd. | 7,528,753 | 14,001 |
| | Vedant Fashions Ltd. | 839,655 | 13,974 |
| * | Honasa Consumer Ltd. | 2,942,293 | 13,758 |
| | Deepak Fertilisers & Petrochemicals Corp. Ltd. | 925,041 | 13,716 |
| | Asahi India Glass Ltd. | 1,529,764 | 13,610 |
| | Sobha Ltd. | 718,842 | 13,542 |
| | Mahanagar Gas Ltd. | 791,627 | 13,536 |
| | CMS Info Systems Ltd. | 2,121,828 | 13,516 |
| | Ramkrishna Forgings Ltd. | 1,235,306 | 13,473 |
| | Zensar Technologies Ltd. | 1,611,199 | 13,425 |
| | SJVN Ltd. | 9,949,406 | 13,303 |
| | Can Fin Homes Ltd. | 1,277,785 | 13,148 |
| *,2 | Eris Lifesciences Ltd. | 836,260 | 13,126 |
| 2 | Mindspace Business Parks REIT | 2,963,325 | 13,109 |
| | EID Parry India Ltd. | 1,370,924 | 13,101 |
| * | Aavas Financiers Ltd. | 659,589 | 13,086 |
| | Bharat Dynamics Ltd. | 1,016,978 | 13,064 |
| | Newgen Software Technologies Ltd. | 858,864 | 13,056 |
| | Gillette India Ltd. | 110,004 | 13,018 |
| | BEML Ltd. | 267,403 | 12,894 |
| 2 | Indian Energy Exchange Ltd. | 6,088,035 | 12,823 |
| 2 | Endurance Technologies Ltd. | 454,228 | 12,790 |
| | JSW Infrastructure Ltd. | 3,423,763 | 12,758 |
| | Chambal Fertilisers & Chemicals Ltd. | 2,200,678 | 12,609 |
| | KPR Mill Ltd. | 1,139,141 | 12,606 |
| * | VA Tech Wabag Ltd. | 599,195 | 12,605 |
| | Granules India Ltd. | 1,855,914 | 12,545 |
| 2 | RBL Bank Ltd. | 6,245,249 | 12,544 |
| | PG Electroplast Ltd. | 1,659,411 | 12,516 |
| | EIH Ltd. | 2,893,597 | 12,482 |
| | Balrampur Chini Mills Ltd. | 1,655,647 | 12,333 |
| | Rainbow Children's Medicare Ltd. | 642,760 | 12,322 |
| | Jindal Saw Ltd. | 3,283,000 | 12,308 |
| * | Devyani International Ltd. | 6,038,880 | 12,127 |
| | Voltamp Transformers Ltd. | 87,641 | 12,081 |
| | Marksans Pharma Ltd. | 3,503,121 | 12,033 |
| | Hindustan Copper Ltd. | 3,461,694 | 12,030 |
| | Sumitomo Chemical India Ltd. | 1,744,469 | 11,880 |
| *,2 | Lemon Tree Hotels Ltd. | 8,502,226 | 11,854 |
| | Swan Energy Ltd. | 2,001,421 | 11,823 |
| 2 | IndiaMart InterMesh Ltd. | 397,837 | 11,799 |
| | Nuvama Wealth Management Ltd. | 141,281 | 11,705 |
| | Zen Technologies Ltd. | 523,404 | 11,649 |
| | Jyothy Labs Ltd. | 1,890,682 | 11,623 |
| | V-Guard Industries Ltd. | 2,247,317 | 11,587 |
| | Sammaan Capital Ltd. | 6,696,158 | 11,433 |
| | Anand Rathi Wealth Ltd. | 233,694 | 11,419 |
| | Nava Ltd. | 993,083 | 11,323 |
| * | Godrej Industries Ltd. | 915,731 | 11,300 |
| 2 | PowerGrid Infrastructure Investment Trust | 10,443,348 | 11,235 |
| | Intellect Design Arena Ltd. | 1,284,605 | 11,211 |
| | Edelweiss Financial Services Ltd. | 8,587,489 | 11,154 |
| | Kfin Technologies Ltd. | 937,648 | 11,124 |
| | Genus Power Infrastructures Ltd. | 2,256,504 | 11,065 |
| | Usha Martin Ltd. | 2,192,139 | 11,053 |
| | Aptus Value Housing Finance India Ltd. | 2,612,309 | 11,051 |
| | Bombay Burmah Trading Co. | 332,632 | 10,933 |
| | Data Patterns India Ltd. | 381,217 | 10,916 |
| | Olectra Greentech Ltd. | 558,100 | 10,851 |
| | Jupiter Wagons Ltd. | 1,771,691 | 10,818 |
| | HBL Power Systems Ltd. | 1,625,240 | 10,796 |
Total International Stock Index Fund
| | | | | | Shares | Market
Value•
($000) |
| | City Union Bank Ltd. | 5,096,502 | 10,613 |
| | TVS Holdings Ltd. | 71,557 | 10,608 |
| | Sun TV Network Ltd. | 1,180,289 | 10,549 |
| | Craftsman Automation Ltd. | 170,361 | 10,295 |
| | JBM Auto Ltd. | 534,521 | 10,242 |
| | Sanofi India Ltd. | 126,731 | 10,237 |
| * | Sapphire Foods India Ltd. | 2,681,400 | 10,221 |
| * | Sterling & Wilson Renewable | 1,471,913 | 10,218 |
| | eClerx Services Ltd. | 294,473 | 10,167 |
| * | Chalet Hotels Ltd. | 983,394 | 10,159 |
| * | Equinox India Developments Ltd. | 7,682,545 | 10,034 |
| * | Raymond Lifestyle Ltd. | 380,233 | 9,996 |
| | Ceat Ltd. | 299,169 | 9,958 |
| | IIFL Securities Ltd. | 2,191,628 | 9,869 |
| 2 | General Insurance Corp. of India | 2,256,133 | 9,854 |
| | CIE Automotive India Ltd. | 1,635,240 | 9,618 |
| 2 | ICICI Securities Ltd. | 933,434 | 9,608 |
| | Kansai Nerolac Paints Ltd. | 2,821,755 | 9,528 |
| * | Gokaldas Exports Ltd. | 879,458 | 9,367 |
| | JM Financial Ltd. | 5,658,211 | 9,365 |
| * | SignatureGlobal India Ltd. | 577,429 | 9,331 |
| | Jubilant Ingrevia Ltd. | 1,082,124 | 9,199 |
| * | Hindustan Construction Co. Ltd. | 19,088,486 | 9,191 |
| | Raymond Ltd. | 472,881 | 9,181 |
| * | India Cements Ltd. | 2,114,508 | 9,127 |
| | Mrs Bectors Food Specialities Ltd. | 404,460 | 9,079 |
| | Relaxo Footwears Ltd. | 990,062 | 9,074 |
| 2 | Home First Finance Co. India Ltd. | 644,570 | 9,023 |
| | Electrosteel Castings Ltd. | 4,631,290 | 9,021 |
| 2 | IRCON International Ltd. | 3,493,082 | 9,008 |
| | Gujarat Pipavav Port Ltd. | 3,852,604 | 9,006 |
| | ION Exchange India Ltd. | 1,079,938 | 9,004 |
| | Gujarat Narmada Valley Fertilizers & Chemicals Ltd. | 1,213,701 | 9,001 |
| 2 | Metropolis Healthcare Ltd. | 353,469 | 8,992 |
| * | NMDC Steel Ltd. | 15,962,145 | 8,980 |
| * | Adani Wilmar Ltd. | 2,172,566 | 8,912 |
| | Vinati Organics Ltd. | 376,202 | 8,820 |
| | Arvind Ltd. | 2,001,469 | 8,798 |
| | Alembic Pharmaceuticals Ltd. | 655,507 | 8,776 |
| | Engineers India Ltd. | 3,792,482 | 8,752 |
| | Bank of Maharashtra | 13,374,335 | 8,695 |
| | Bikaji Foods International Ltd. | 858,711 | 8,668 |
| | Safari Industries India Ltd. | 329,577 | 8,630 |
| | Elecon Engineering Co. Ltd. | 1,259,177 | 8,570 |
| * | PTC Industries Ltd. | 59,570 | 8,488 |
| | CreditAccess Grameen Ltd. | 727,311 | 8,464 |
| | Vardhman Textiles Ltd. | 1,515,715 | 8,461 |
| | DCM Shriram Ltd. | 678,649 | 8,442 |
| | Century Plyboards India Ltd. | 837,670 | 8,432 |
| 2 | Sansera Engineering Ltd. | 458,722 | 8,276 |
| | Happiest Minds Technologies Ltd. | 910,750 | 8,253 |
| | Akzo Nobel India Ltd. | 157,078 | 8,223 |
| | Tanla Platforms Ltd. | 918,338 | 8,179 |
| | JK Lakshmi Cement Ltd. | 843,624 | 8,115 |
| | Action Construction Equipment Ltd. | 503,546 | 8,032 |
| | Mastek Ltd. | 234,246 | 8,020 |
| | Blue Dart Express Ltd. | 82,703 | 7,992 |
| | Godawari Power & Ispat Ltd. | 3,432,495 | 7,954 |
| | CCL Products India Ltd. | 984,487 | 7,923 |
| * | Westlife Foodworld Ltd. | 874,795 | 7,892 |
| | JK Tyre & Industries Ltd. | 1,680,227 | 7,888 |
| | IDBI Bank Ltd. | 7,917,668 | 7,834 |
| | Gujarat State Fertilizers & Chemicals Ltd. | 3,162,784 | 7,822 |
| 2 | Quess Corp. Ltd. | 912,580 | 7,811 |
| | AstraZeneca Pharma India Ltd. | 86,059 | 7,788 |
| | Texmaco Rail & Engineering Ltd. | 2,946,521 | 7,755 |
| | Garden Reach Shipbuilders & Engineers Ltd. | 402,383 | 7,694 |
| | GHCL Ltd. | 1,077,346 | 7,616 |
| | BLS International Services Ltd. | 1,611,331 | 7,588 |
| | Shyam Metalics & Energy Ltd. | 754,673 | 7,584 |
Total International Stock Index Fund
| | | | | | Shares | Market
Value•
($000) |
| | Aditya Birla Sun Life Asset Management Co. Ltd. | 797,188 | 7,506 |
| * | Medplus Health Services Ltd. | 944,386 | 7,485 |
| | Arvind Fashions Ltd. | 1,113,872 | 7,484 |
| * | Nazara Technologies Ltd. | 667,523 | 7,471 |
| | Infibeam Avenues Ltd. | 21,625,383 | 7,464 |
| * | Sanofi Consumer Healthcare India Ltd. | 126,731 | 7,422 |
| | ITD Cementation India Ltd. | 1,108,241 | 7,411 |
| | Kirloskar Pneumatic Co. Ltd. | 373,051 | 7,358 |
| | Cello World Ltd. | 735,663 | 7,234 |
| | LT Foods Ltd. | 1,557,245 | 7,199 |
| | PTC India Ltd. | 3,331,175 | 7,179 |
| 2 | New India Assurance Co. Ltd. | 3,085,292 | 7,160 |
| | Techno Electric & Engineering Co. Ltd. | 383,321 | 7,095 |
| | RR Kabel Ltd. | 396,119 | 7,066 |
| | KSB Ltd. | 737,860 | 7,011 |
| | Pfizer Ltd. | 115,251 | 6,975 |
| * | Rategain Travel Technologies Ltd. | 776,136 | 6,921 |
| | Trident Ltd. | 16,740,771 | 6,867 |
| | Sudarshan Chemical Industries Ltd. | 550,661 | 6,848 |
| | EPL Ltd. | 2,131,782 | 6,844 |
| | Zydus Wellness Ltd. | 294,117 | 6,805 |
| | Clean Science & Technology Ltd. | 373,626 | 6,775 |
| | Minda Corp. Ltd. | 1,107,951 | 6,757 |
| | KNR Constructions Ltd. | 1,904,049 | 6,701 |
| * | V-Mart Retail Ltd. | 131,966 | 6,674 |
| | Care Ratings Ltd. | 382,166 | 6,625 |
| | Procter & Gamble Health Ltd. | 106,317 | 6,619 |
| | Saregama India Ltd. | 1,033,342 | 6,594 |
| | Karnataka Bank Ltd. | 2,535,790 | 6,521 |
| | Cera Sanitaryware Ltd. | 75,995 | 6,474 |
| 2 | Equitas Small Finance Bank Ltd. | 7,804,839 | 6,466 |
| | Rhi Magnesita India Ltd. | 896,438 | 6,303 |
| | GMM Pfaudler Ltd. | 379,932 | 6,300 |
| | NIIT Learning Systems Ltd. | 1,214,375 | 6,283 |
| * | Restaurant Brands Asia Ltd. | 5,789,627 | 6,223 |
| | Fine Organic Industries Ltd. | 107,545 | 6,204 |
| | Route Mobile Ltd. | 342,332 | 6,180 |
| * | IFCI Ltd. | 8,975,396 | 6,135 |
| * | Nuvoco Vistas Corp. Ltd. | 1,464,156 | 6,128 |
| * | Tata Teleservices Maharashtra Ltd. | 7,021,519 | 6,112 |
| | Supreme Petrochem Ltd. | 681,165 | 6,100 |
| | Metro Brands Ltd. | 424,634 | 6,047 |
| | Mahindra Lifespace Developers Ltd. | 1,022,432 | 5,996 |
| | HEG Ltd. | 1,167,570 | 5,993 |
| | Jammu & Kashmir Bank Ltd. | 5,029,594 | 5,990 |
| | Graphite India Ltd. | 945,257 | 5,937 |
| | Shipping Corp. of India Ltd. | 2,315,522 | 5,935 |
| | Railtel Corp. of India Ltd. | 1,190,733 | 5,930 |
| | PNC Infratech Ltd. | 1,570,724 | 5,910 |
| 2 | Ujjivan Small Finance Bank Ltd. | 13,059,107 | 5,898 |
| | JK Paper Ltd. | 1,076,953 | 5,897 |
| | Archean Chemical Industries Ltd. | 768,674 | 5,888 |
| | Welspun Living Ltd. | 3,259,190 | 5,879 |
| | Bajaj Electricals Ltd. | 568,156 | 5,875 |
| | Astra Microwave Products Ltd. | 623,525 | 5,848 |
| * | Schneider Electric Infrastructure Ltd. | 622,774 | 5,751 |
| * | Rajesh Exports Ltd. | 1,875,502 | 5,741 |
| * | Shree Renuka Sugars Ltd. | 11,262,704 | 5,736 |
| 2 | Godrej Agrovet Ltd. | 657,758 | 5,583 |
| | Capri Global Capital Ltd. | 2,311,352 | 5,535 |
| | TTK Prestige Ltd. | 535,416 | 5,497 |
| | VIP Industries Ltd. | 966,655 | 5,476 |
| | Tamilnad Mercantile Bank Ltd. | 1,021,490 | 5,465 |
| | Rallis India Ltd. | 1,355,343 | 5,451 |
| | Orient Electric Ltd. | 1,854,225 | 5,446 |
| | Garware Technical Fibres Ltd. | 113,030 | 5,426 |
| * | Sterlite Technologies Ltd. | 3,807,737 | 5,343 |
| | NOCIL Ltd. | 1,561,293 | 5,326 |
| | Jupiter Life Line Hospitals Ltd. | 333,944 | 5,318 |
| | Balaji Amines Ltd. | 210,577 | 5,312 |
Total International Stock Index Fund
| | | | | | Shares | Market
Value•
($000) |
| * | MTAR Technologies Ltd. | 263,498 | 5,220 |
| | Chennai Petroleum Corp. Ltd. | 688,684 | 5,218 |
| | Rain Industries Ltd. | 2,715,637 | 5,201 |
| | South Indian Bank Ltd. | 17,766,366 | 5,168 |
| | Avanti Feeds Ltd. | 732,104 | 5,107 |
| | Vesuvius India Ltd. | 81,406 | 5,096 |
| * | Chemplast Sanmar Ltd. | 892,512 | 5,081 |
| * | Sheela Foam Ltd. | 513,702 | 5,071 |
| | Birla Corp. Ltd. | 360,856 | 5,003 |
| | Syrma SGS Technology Ltd. | 808,760 | 4,952 |
| | Suprajit Engineering Ltd. | 804,242 | 4,902 |
| * | G R Infraprojects Ltd. | 255,279 | 4,893 |
| | Mangalore Refinery & Petrochemicals Ltd. | 2,788,896 | 4,890 |
| | Gateway Distriparks Ltd. | 4,584,188 | 4,787 |
| * | TVS Supply Chain Solutions Ltd. | 2,111,424 | 4,716 |
| 2 | IRB InvIT Fund | 6,454,985 | 4,678 |
| | Alkyl Amines Chemicals | 186,064 | 4,618 |
| | Galaxy Surfactants Ltd. | 132,332 | 4,608 |
| * | Alok Industries Ltd. | 17,220,050 | 4,583 |
| * | TeamLease Services Ltd. | 135,390 | 4,487 |
| | Maharashtra Seamless Ltd. | 600,370 | 4,458 |
| | Polyplex Corp. Ltd. | 324,864 | 4,417 |
| | RITES Ltd. | 1,225,524 | 4,366 |
| | AurionPro Solutions Ltd. | 222,722 | 4,353 |
| | Symphony Ltd. | 228,056 | 4,212 |
| * | Campus Activewear Ltd. | 1,092,480 | 3,822 |
| | KRBL Ltd. | 1,095,851 | 3,799 |
| 2 | KPI Green Energy Ltd. | 409,055 | 3,764 |
| * | TV18 Broadcast Ltd. | 6,266,536 | 3,744 |
| 2 | Dilip Buildcon Ltd. | 612,949 | 3,647 |
| * | Dhani Services Ltd. | 5,353,153 | 3,635 |
| * | Borosil Renewables Ltd. | 683,870 | 3,613 |
| * | Just Dial Ltd. | 267,309 | 3,599 |
| | Paisalo Digital Ltd. | 6,280,683 | 3,442 |
| * | Jai Balaji Industries Ltd. | 257,923 | 3,321 |
| * | Central Bank of India Ltd. | 4,814,071 | 3,302 |
| | Bajaj Consumer Care Ltd. | 1,194,768 | 3,248 |
| | DCB Bank Ltd. | 2,099,942 | 3,054 |
| | Kaveri Seed Co. Ltd. | 268,334 | 2,906 |
| * | RattanIndia Power Ltd. | 16,777,308 | 2,864 |
| | Vakrangee Ltd. | 8,787,103 | 2,772 |
| | Allcargo Logistics Ltd. | 4,114,288 | 2,759 |
| | Vaibhav Global Ltd. | 745,725 | 2,612 |
| | Thomas Cook India Ltd. | 1,062,626 | 2,444 |
| *,3 | Brightcom Group Ltd. | 22,811,941 | 2,195 |
| | NIIT Ltd. | 1,142,342 | 2,096 |
| * | Sun Pharma Advanced Research Co. Ltd. | 747,223 | 1,907 |
| *,3 | Odigma Consultancy Solutions Ltd. | 242,981 | 368 |
| *,3 | Chennai Super Kings Cricket Ltd. | 951,110 | — |
| | | | | | | 27,896,936 |
| Indonesia (0.5%) |
| | Bank Central Asia Tbk. PT | 772,435,997 | 503,612 |
| | Bank Rakyat Indonesia Persero Tbk. PT | 973,442,247 | 296,758 |
| | Bank Mandiri Persero Tbk. PT | 617,815,950 | 262,275 |
| | Telkom Indonesia Persero Tbk. PT | 647,068,758 | 115,659 |
| * | Amman Mineral Internasional PT | 174,541,500 | 101,725 |
| | Astra International Tbk. PT | 282,194,407 | 91,614 |
| | Bank Negara Indonesia Persero Tbk. PT | 207,841,312 | 69,323 |
| * | GoTo Gojek Tokopedia Tbk. PT Class A | 13,579,308,101 | 58,616 |
| | Sumber Alfaria Trijaya Tbk. PT | 262,615,723 | 55,457 |
| * | Merdeka Copper Gold Tbk. PT | 247,544,600 | 38,267 |
| | United Tractors Tbk. PT | 20,526,539 | 35,829 |
| | Charoen Pokphand Indonesia Tbk. PT | 101,079,814 | 33,839 |
| | Adaro Energy Indonesia Tbk. PT | 145,852,345 | 33,570 |
| * | Bumi Resources Minerals Tbk. PT | 1,377,471,311 | 32,202 |
| | Indofood Sukses Makmur Tbk. PT | 61,163,672 | 29,593 |
| | Kalbe Farma Tbk. PT | 258,637,917 | 26,649 |
| | Indofood CBP Sukses Makmur Tbk. PT | 31,638,135 | 24,828 |
| | Barito Pacific Tbk. PT | 349,035,473 | 22,098 |
Total International Stock Index Fund
| | | | | | Shares | Market
Value•
($000) |
| | Indah Kiat Pulp & Paper Tbk. PT | 36,601,345 | 18,800 |
| * | Bumi Resources Tbk. PT | 1,662,514,929 | 14,712 |
| | Perusahaan Gas Negara Tbk. PT | 146,238,791 | 14,563 |
| | Mitra Keluarga Karyasehat Tbk. PT | 77,061,892 | 13,292 |
| | Sarana Menara Nusantara Tbk. PT | 260,263,899 | 13,267 |
| * | Bank Jago Tbk. PT | 70,866,400 | 12,783 |
| | Siloam International Hospitals Tbk. PT | 50,441,000 | 12,070 |
| | Aneka Tambang Tbk. | 118,099,897 | 12,007 |
| | Indosat Tbk. PT | 74,016,804 | 11,779 |
| | Semen Indonesia Persero Tbk. PT | 45,907,130 | 11,543 |
| | Japfa Comfeed Indonesia Tbk. PT | 96,282,651 | 11,225 |
| | Elang Mahkota Teknologi Tbk. PT | 345,183,463 | 11,211 |
| | Bank Syariah Indonesia Tbk. PT | 58,000,023 | 11,162 |
| | Bukit Asam Tbk. PT | 56,253,516 | 10,596 |
| | Ciputra Development Tbk. PT | 122,534,884 | 10,461 |
| | Mitra Adiperkasa Tbk. PT | 101,747,373 | 10,223 |
| | Dayamitra Telekomunikasi PT | 252,450,543 | 10,130 |
| | Unilever Indonesia Tbk. PT | 80,027,660 | 10,016 |
| | AKR Corporindo Tbk. PT | 112,572,807 | 9,676 |
| | Pakuwon Jati Tbk. PT | 313,826,524 | 9,551 |
| | Jasa Marga Persero Tbk. PT | 30,345,659 | 9,360 |
| | Indocement Tunggal Prakarsa Tbk. PT | 19,968,429 | 9,141 |
| | Indo Tambangraya Megah Tbk. PT | 5,553,238 | 8,875 |
| | XL Axiata Tbk. PT | 61,597,958 | 8,820 |
| | Cisarua Mountain Dairy PT Tbk. | 24,241,958 | 8,800 |
| * | Petrindo Jaya Kreasi Tbk. PT | 17,541,979 | 8,489 |
| | ESSA Industries Indonesia Tbk. PT | 135,255,255 | 8,486 |
| | Map Aktif Adiperkasa PT | 120,087,100 | 8,300 |
| | Pabrik Kertas Tjiwi Kimia Tbk. PT | 17,501,945 | 8,251 |
| * | Adaro Minerals Indonesia Tbk. PT | 91,418,192 | 8,147 |
| | Mayora Indah Tbk. PT | 48,262,998 | 7,990 |
| * | Bumi Serpong Damai Tbk. PT | 97,973,780 | 7,591 |
| | Medco Energi Internasional Tbk. PT | 91,450,134 | 7,455 |
| | Summarecon Agung Tbk. PT | 171,262,763 | 7,310 |
| * | Vale Indonesia Tbk. PT | 29,580,811 | 7,185 |
| * | Bukalapak.com PT Tbk. | 873,578,000 | 7,112 |
| * | Panin Financial Tbk. PT | 225,602,809 | 6,833 |
| | Avia Avian Tbk. PT | 221,653,169 | 6,742 |
| | BFI Finance Indonesia Tbk. PT | 105,490,772 | 6,654 |
| | Trimegah Bangun Persada Tbk. PT | 111,009,500 | 6,354 |
| * | Bank Pan Indonesia Tbk. PT | 50,805,727 | 6,141 |
| | Bank Tabungan Negara Persero Tbk. PT | 65,330,984 | 5,831 |
| * | Gudang Garam Tbk. PT | 6,275,436 | 5,628 |
| | Aspirasi Hidup Indonesia Tbk. PT | 94,779,821 | 5,429 |
| | PT Tower Bersama Infrastructure Tbk. | 39,091,922 | 4,734 |
| * | MNC Digital Entertainment Tbk. PT | 51,001,935 | 4,220 |
| * | Lippo Karawaci Tbk. PT | 426,728,626 | 3,344 |
| *,3 | Waskita Karya Persero Tbk. PT | 248,206,980 | 3,194 |
| | Industri Jamu Dan Farmasi Sido Muncul Tbk. PT | 80,883,100 | 3,142 |
| * | Timah Tbk. PT | 37,469,801 | 3,098 |
| | Perusahaan Perkebunan London Sumatra Indonesia Tbk. PT | 37,593,057 | 2,931 |
| | Matahari Department Store Tbk. PT | 25,587,081 | 2,501 |
| | Bank Pembangunan Daerah Jawa Barat Dan Banten Tbk. PT | 36,504,974 | 2,278 |
| | Astra Agro Lestari Tbk. PT | 5,228,592 | 2,253 |
| | Surya Citra Media Tbk. PT | 247,868,397 | 2,181 |
| | Bank BTPN Syariah Tbk. PT | 30,478,557 | 2,066 |
| * | Bank Neo Commerce Tbk. PT | 120,838,252 | 2,049 |
| * | Media Nusantara Citra Tbk. PT | 85,411,798 | 1,795 |
| | Bank Danamon Indonesia Tbk. PT | 9,524,650 | 1,560 |
| * | Global Mediacom Tbk. PT | 103,724,233 | 1,469 |
| * | Bank Bukopin Tbk. PT | 2,895,107 | 11 |
| | | | | | | 2,294,731 |
| Ireland (0.2%) |
| | Kerry Group plc Class A | 2,079,569 | 207,698 |
| | Kingspan Group plc | 2,127,403 | 187,865 |
| | AIB Group plc | 25,170,827 | 134,942 |
| | Bank of Ireland Group plc | 14,221,086 | 131,804 |
| | Glanbia plc | 2,438,669 | 40,572 |
| | Dalata Hotel Group plc | 3,103,602 | 14,557 |
Total International Stock Index Fund
| | | | | | Shares | Market
Value•
($000) |
| | Glanbia plc (XLON) | 8,754 | 153 |
| *,3 | Irish Bank Resolution Corp. Ltd. | 698,992 | — |
| | | | | | | 717,591 |
| Israel (0.5%) |
| * | Teva Pharmaceutical Industries Ltd. | 15,708,239 | 289,060 |
| | Bank Leumi Le-Israel BM | 21,155,980 | 214,935 |
| | Bank Hapoalim BM | 18,675,753 | 194,587 |
| * | Nice Ltd. | 877,492 | 152,472 |
| | Israel Discount Bank Ltd. Class A | 17,311,650 | 101,758 |
| | Mizrahi Tefahot Bank Ltd. | 1,924,482 | 79,351 |
| | Elbit Systems Ltd. | 342,879 | 78,540 |
| * | Nova Ltd. | 405,413 | 76,240 |
| * | Tower Semiconductor Ltd. | 1,553,497 | 65,519 |
| | ICL Group Ltd. | 10,066,014 | 41,322 |
| | Azrieli Group Ltd. | 512,287 | 39,108 |
| | Bezeq The Israeli Telecommunication Corp. Ltd. | 28,578,798 | 36,626 |
| | First International Bank of Israel Ltd. | 730,138 | 32,399 |
| | Camtek Ltd. | 383,177 | 30,387 |
| | Melisron Ltd. | 353,397 | 28,007 |
| | Phoenix Financial Ltd. | 2,292,299 | 26,579 |
| * | Enlight Renewable Energy Ltd. | 1,628,705 | 25,858 |
| | Shufersal Ltd. | 2,802,697 | 24,817 |
| | Mivne Real Estate KD Ltd. | 8,738,637 | 23,828 |
| * | Big Shopping Centers Ltd. | 194,136 | 23,210 |
| | Alony Hetz Properties & Investments Ltd. | 2,243,101 | 18,124 |
| * | Clal Insurance Enterprises Holdings Ltd. | 925,341 | 17,732 |
| | Harel Insurance Investments & Financial Services Ltd. | 1,521,040 | 15,860 |
| | Sapiens International Corp. NV | 422,705 | 15,832 |
| | Paz Retail & Energy Ltd. | 135,524 | 15,340 |
| | Amot Investments Ltd. | 3,027,268 | 14,727 |
| * | Shapir Engineering & Industry Ltd. | 2,001,165 | 13,124 |
| | Delek Group Ltd. | 110,549 | 13,022 |
| | Tel Aviv Stock Exchange Ltd. | 1,282,142 | 12,855 |
| | Energix-Renewable Energies Ltd. | 3,635,978 | 12,652 |
| * | OPC Energy Ltd. | 1,557,315 | 12,611 |
| * | Airport City Ltd. | 820,828 | 12,470 |
| | Strauss Group Ltd. | 708,632 | 11,941 |
| | Reit 1 Ltd. | 2,614,795 | 11,881 |
| * | Shikun & Binui Ltd. | 4,390,777 | 11,619 |
| | FIBI Holdings Ltd. | 244,766 | 11,443 |
| * | Fattal Holdings 1998 Ltd. | 90,689 | 11,415 |
| | Electra Ltd. | 24,797 | 11,267 |
| | Formula Systems 1985 Ltd. | 130,865 | 11,203 |
| | Israel Corp. Ltd. | 50,981 | 11,138 |
| | Hilan Ltd. | 192,852 | 10,570 |
| | Isracard Ltd. | 2,610,579 | 10,115 |
| | Menora Mivtachim Holdings Ltd. | 316,744 | 9,853 |
| * | Bet Shemesh Engines Holdings 1997 Ltd. | 123,177 | 9,757 |
| | Matrix IT Ltd. | 452,541 | 9,078 |
| * | Equital Ltd. | 248,493 | 8,983 |
| | One Software Technologies Ltd. | 582,206 | 8,597 |
| | Summit Real Estate Holdings Ltd. | 547,084 | 8,431 |
| | Oil Refineries Ltd. | 32,922,991 | 8,395 |
| | Migdal Insurance & Financial Holdings Ltd. | 5,136,126 | 8,358 |
| | Kenon Holdings Ltd. | 288,293 | 8,217 |
| * | Ashtrom Group Ltd. | 533,295 | 8,152 |
| | YH Dimri Construction & Development Ltd. | 92,704 | 8,096 |
| | Mega Or Holdings Ltd. | 275,005 | 7,701 |
| | Israel Canada T.R Ltd. | 2,045,894 | 7,665 |
| | Next Vision Stabilized Systems Ltd. | 670,152 | 7,620 |
| | Fox Wizel Ltd. | 98,518 | 7,232 |
| | Danel Adir Yeoshua Ltd. | 67,070 | 6,714 |
| | Sella Capital Real Estate Ltd. | 3,063,535 | 6,484 |
| | Rami Levy Chain Stores Hashikma Marketing 2006 Ltd. | 102,629 | 6,201 |
| * | OY Nofar Energy Ltd. | 261,385 | 6,081 |
| * | Partner Communications Co. Ltd. | 1,428,793 | 6,072 |
| | Delta Galil Ltd. | 127,801 | 5,702 |
| * | Cellcom Israel Ltd. | 1,197,603 | 5,650 |
| * | Perion Network Ltd. | 604,148 | 4,911 |
Total International Stock Index Fund
| | | | | | Shares | Market
Value•
($000) |
| * | Priortech Ltd. | 109,601 | 4,694 |
| | Gav-Yam Lands Corp. Ltd. | 559,927 | 4,620 |
| | G City Ltd. | 1,185,462 | 4,405 |
| * | Delek Automotive Systems Ltd. | 651,221 | 4,029 |
| | Elco Ltd. | 124,961 | 3,837 |
| | IDI Insurance Co. Ltd. | 104,077 | 3,541 |
| * | Kamada Ltd. | 596,170 | 3,450 |
| * | AFI Properties Ltd. | 62,573 | 2,994 |
| | AudioCodes Ltd. | 316,983 | 2,950 |
| | | | | | | 2,080,014 |
| Italy (1.8%) |
| | UniCredit SpA | 22,144,229 | 979,643 |
| | Intesa Sanpaolo SpA | 222,226,248 | 951,131 |
| | Enel SpA | 108,257,526 | 821,033 |
| | Ferrari NV | 1,635,709 | 780,837 |
| | Generali | 17,445,716 | 483,703 |
| | Eni SpA | 31,409,945 | 478,474 |
| | Stellantis NV | 28,401,381 | 389,165 |
| | Prysmian SpA | 3,901,013 | 275,311 |
| | Moncler SpA | 3,160,971 | 175,616 |
| | Terna - Rete Elettrica Nazionale | 19,630,057 | 170,030 |
| | Snam SpA | 31,667,786 | 152,129 |
| | FinecoBank Banca Fineco SpA | 8,534,352 | 136,244 |
| | Leonardo SpA | 5,592,585 | 133,304 |
| | Banco BPM SpA | 19,121,159 | 128,974 |
| | Mediobanca Banca di Credito Finanziario SpA | 7,596,707 | 125,325 |
| | Tenaris SA | 6,134,392 | 101,067 |
| | BPER Banca SpA | 14,747,376 | 89,791 |
| 2 | Poste Italiane SpA | 6,298,866 | 88,571 |
| | Recordati Industria Chimica e Farmaceutica SpA | 1,358,866 | 77,099 |
| | Unipol Gruppo SpA | 6,008,452 | 74,673 |
| *,1,2 | Nexi SpA | 11,083,923 | 70,059 |
| | Banca Monte dei Paschi di Siena SpA | 12,523,133 | 68,727 |
| 2 | Infrastrutture Wireless Italiane SpA | 4,871,581 | 54,926 |
| | Amplifon SpA | 1,808,604 | 50,522 |
| | Interpump Group SpA | 1,110,773 | 49,355 |
| | A2A SpA | 21,461,994 | 49,059 |
| | Reply SpA | 313,315 | 47,767 |
| | Brunello Cucinelli SpA | 472,423 | 46,733 |
| | Buzzi SpA | 1,187,144 | 46,510 |
| | Davide Campari-Milano NV | 6,665,467 | 44,750 |
| * | Saipem SpA | 18,211,828 | 43,300 |
| | Italgas SpA | 6,836,592 | 41,940 |
| | Hera SpA | 10,716,807 | 40,998 |
| | Banca Popolare di Sondrio SPA | 5,032,841 | 37,537 |
| | Banca Mediolanum SpA | 3,016,734 | 37,289 |
| | Azimut Holding SpA | 1,507,301 | 37,282 |
| *,1 | Telecom Italia SpA (Registered) | 141,106,375 | 35,743 |
| | Banca Generali SpA | 751,113 | 33,286 |
| | DiaSorin SpA | 297,070 | 32,265 |
| 2 | Pirelli & C SpA | 5,586,039 | 30,524 |
| | De' Longhi SpA | 968,695 | 30,276 |
| | Iveco Group NV | 2,699,997 | 28,058 |
| 2 | BFF Bank SpA | 2,449,713 | 23,921 |
| | Brembo NV | 2,014,928 | 21,162 |
| 2 | Technogym SpA | 1,845,970 | 19,899 |
| | Iren SpA | 9,030,306 | 19,558 |
| | SOL SpA | 501,340 | 19,444 |
| * | Telecom Italia SpA (Bearer) | 65,385,905 | 19,125 |
| | Lottomatica Group SpA | 1,493,377 | 18,654 |
| | Webuild SpA | 6,495,500 | 18,420 |
| 2 | Anima Holding SpA | 2,954,037 | 17,898 |
| | ERG SpA | 759,365 | 17,054 |
| | Maire SpA | 2,203,005 | 16,628 |
| * | Technoprobe SpA | 2,264,617 | 15,377 |
| 2 | Enav SpA | 3,542,090 | 15,007 |
| 2 | Carel Industries SpA | 690,127 | 14,185 |
| | MFE-MediaForEurope NV Class A | 3,918,557 | 12,821 |
| | Intercos SpA | 705,564 | 11,321 |
Total International Stock Index Fund
| | | | | | Shares | Market
Value•
($000) |
| | ACEA SpA | 587,008 | 11,140 |
| | Credito Emiliano SpA | 999,296 | 10,791 |
| | Tamburi Investment Partners SpA | 1,112,246 | 10,457 |
| | Danieli & C Officine Meccaniche SpA | 479,890 | 9,701 |
| 1 | Sesa SpA | 102,681 | 8,917 |
| | Salcef Group SpA | 295,764 | 8,320 |
| | Moltiply Group SpA | 217,820 | 8,101 |
| | Banca IFIS SpA | 336,958 | 8,076 |
| | El.En. SpA | 706,041 | 7,644 |
| | Sanlorenzo SpA | 199,646 | 7,517 |
| 2 | RAI Way SpA | 1,286,757 | 7,388 |
| *,1 | Fincantieri SpA | 1,196,493 | 6,674 |
| *,2 | GVS SpA | 960,937 | 6,432 |
| | Cementir Holding NV | 610,799 | 6,346 |
| | Ariston Holding NV | 1,424,802 | 5,997 |
| 1 | Salvatore Ferragamo SpA | 890,499 | 5,947 |
| | Italmobiliare SpA | 195,623 | 5,886 |
| 1 | Piaggio & C SpA | 2,331,737 | 5,614 |
| *,1 | Juventus Football Club SpA | 1,927,872 | 5,140 |
| | Zignago Vetro SpA | 437,685 | 4,993 |
| 1 | Danieli & C Officine Meccaniche SpA Saving Shares | 163,959 | 4,440 |
| | Arnoldo Mondadori Editore SpA | 1,661,116 | 4,412 |
| | MARR SpA | 322,033 | 3,745 |
| | Tinexta SpA | 253,782 | 2,992 |
| | MFE-MediaForEurope NV Class B | 618,336 | 2,856 |
| | Rizzoli Corriere Della Sera Mediagroup SpA | 1,603,470 | 1,387 |
| 1 | Alerion Cleanpower SpA | 76,442 | 1,276 |
| | Tenaris SA ADR | 7 | — |
| *,3 | Gemina SpA | 315,232 | — |
| | | | | | | 8,021,689 |
| Japan (15.2%) |
| | Toyota Motor Corp. | 165,494,413 | 2,851,534 |
| | Mitsubishi UFJ Financial Group Inc. | 157,979,716 | 1,665,145 |
| | Hitachi Ltd. | 61,837,740 | 1,553,665 |
| | Sony Group Corp. | 83,715,355 | 1,473,182 |
| | Keyence Corp. | 2,716,988 | 1,226,486 |
| | Recruit Holdings Co. Ltd. | 18,717,159 | 1,142,917 |
| | Sumitomo Mitsui Financial Group Inc. | 51,982,279 | 1,102,780 |
| | Mitsubishi Corp. | 55,841,434 | 1,021,568 |
| | Shin-Etsu Chemical Co. Ltd. | 26,584,945 | 974,178 |
| | Tokio Marine Holdings Inc. | 26,524,089 | 955,296 |
| | ITOCHU Corp. | 18,881,988 | 934,051 |
| | Tokyo Electron Ltd. | 6,129,977 | 902,045 |
| | Daiichi Sankyo Co. Ltd. | 26,220,721 | 853,438 |
| | Mitsui & Co. Ltd. | 40,796,102 | 831,737 |
| | SoftBank Group Corp. | 13,657,865 | 814,261 |
| | Fast Retailing Co. Ltd. | 2,518,608 | 805,253 |
| | Nintendo Co. Ltd. | 14,528,994 | 767,465 |
| | Mizuho Financial Group Inc. | 35,390,722 | 735,101 |
| | Honda Motor Co. Ltd. | 66,483,521 | 668,632 |
| | Hoya Corp. | 4,893,135 | 654,672 |
| | KDDI Corp. | 20,913,033 | 652,056 |
| | Takeda Pharmaceutical Co. Ltd. | 21,612,163 | 603,006 |
| | Advantest Corp. | 10,301,604 | 596,459 |
| | Mitsubishi Heavy Industries Ltd. | 41,111,890 | 580,375 |
| | SoftBank Corp. | 381,087,840 | 479,753 |
| | Mitsubishi Electric Corp. | 26,885,495 | 472,984 |
| | Japan Tobacco Inc. | 16,514,933 | 461,055 |
| | Seven & i Holdings Co. Ltd. | 31,844,143 | 458,554 |
| | Daikin Industries Ltd. | 3,700,445 | 444,263 |
| | Fujitsu Ltd. | 22,665,330 | 435,760 |
| | Chugai Pharmaceutical Co. Ltd. | 9,073,350 | 431,724 |
| | Canon Inc. | 12,799,687 | 416,310 |
| | MS&AD Insurance Group Holdings Inc. | 18,622,330 | 411,914 |
| | Murata Manufacturing Co. Ltd. | 23,469,645 | 410,041 |
| | Otsuka Holdings Co. Ltd. | 6,694,705 | 404,432 |
| | Denso Corp. | 28,467,764 | 404,342 |
| | FUJIFILM Holdings Corp. | 16,078,986 | 382,492 |
| | Terumo Corp. | 19,917,334 | 379,332 |
Total International Stock Index Fund
| | | | | | Shares | Market
Value•
($000) |
| | Nippon Telegraph & Telephone Corp. | 390,816,175 | 377,073 |
| | Oriental Land Co. Ltd. | 15,041,995 | 363,522 |
| | FANUC Corp. | 13,209,200 | 350,458 |
| | Disco Corp. | 1,165,386 | 331,593 |
| | Marubeni Corp. | 22,088,994 | 330,214 |
| | SMC Corp. | 771,631 | 327,593 |
| | Komatsu Ltd. | 12,619,974 | 326,672 |
| | ORIX Corp. | 15,248,369 | 321,281 |
| | Mitsui Fudosan Co. Ltd. | 37,352,104 | 318,701 |
| | Dai-ichi Life Holdings Inc. | 12,597,302 | 314,055 |
| | NEC Corp. | 3,577,756 | 304,433 |
| | East Japan Railway Co. | 15,054,585 | 302,377 |
| | Sumitomo Corp. | 14,218,852 | 299,967 |
| | TDK Corp. | 25,080,660 | 294,831 |
| | Astellas Pharma Inc. | 25,016,661 | 292,903 |
| | Nidec Corp. | 14,424,636 | 287,351 |
| | Renesas Electronics Corp. | 21,159,706 | 283,505 |
| | Kao Corp. | 6,333,483 | 279,151 |
| | Bridgestone Corp. | 7,813,935 | 278,451 |
| | Sompo Holdings Inc. | 12,780,127 | 273,994 |
| | Olympus Corp. | 15,171,901 | 267,060 |
| | Central Japan Railway Co. | 12,631,920 | 261,597 |
| | Ajinomoto Co. Inc. | 6,710,687 | 257,796 |
| | Suzuki Motor Corp. | 25,035,724 | 248,438 |
| | Japan Post Holdings Co. Ltd. | 26,787,989 | 247,148 |
| | Daiwa House Industry Co. Ltd. | 8,238,985 | 245,758 |
| | Aeon Co. Ltd. | 9,916,691 | 242,990 |
| | Panasonic Holdings Corp. | 28,460,427 | 234,230 |
| | Nippon Steel Corp. | 11,525,250 | 230,613 |
| | Asahi Group Holdings Ltd. | 18,971,162 | 227,754 |
| | Mitsubishi Estate Co. Ltd. | 15,018,833 | 222,099 |
| | Sumitomo Mitsui Trust Group Inc. | 9,788,176 | 214,658 |
| | Nippon Yusen KK | 6,142,981 | 205,664 |
| | ENEOS Holdings Inc. | 40,745,596 | 205,543 |
| | Resona Holdings Inc. | 30,695,712 | 202,523 |
| | Nomura Holdings Inc. | 39,217,621 | 201,104 |
| | Secom Co. Ltd. | 5,611,142 | 199,549 |
| | Sekisui House Ltd. | 7,584,512 | 183,178 |
| | Japan Post Bank Co. Ltd. | 20,140,524 | 179,882 |
| | Sumitomo Realty & Development Co. Ltd. | 5,906,319 | 175,204 |
| | Kubota Corp. | 13,669,553 | 174,657 |
| | Nomura Research Institute Ltd. | 5,809,050 | 173,769 |
| | Unicharm Corp. | 5,355,201 | 172,678 |
| | Japan Exchange Group Inc. | 14,529,942 | 170,306 |
| | Bandai Namco Holdings Inc. | 8,100,894 | 169,844 |
| | Kyocera Corp. | 16,654,204 | 168,902 |
| | Lasertec Corp. | 1,197,417 | 162,484 |
| | Kansai Electric Power Co. Inc. | 10,120,515 | 162,304 |
| | Sumitomo Electric Industries Ltd. | 10,488,926 | 161,347 |
| | Asics Corp. | 9,211,404 | 160,895 |
| | Nitto Denko Corp. | 9,763,755 | 160,650 |
| 1 | Mitsui OSK Lines Ltd. | 4,708,980 | 160,320 |
| | Kirin Holdings Co. Ltd. | 10,867,442 | 159,997 |
| | Toyota Tsusho Corp. | 9,313,799 | 158,323 |
| | Shimano Inc. | 1,056,394 | 155,195 |
| | Toyota Industries Corp. | 2,230,723 | 154,638 |
| | Inpex Corp. | 11,701,294 | 154,247 |
| | Obic Co. Ltd. | 4,607,335 | 150,556 |
| | Subaru Corp. | 8,318,153 | 148,556 |
| | Kikkoman Corp. | 12,612,385 | 147,978 |
| | Sysmex Corp. | 7,881,710 | 146,233 |
| | Shionogi & Co. Ltd. | 9,912,364 | 141,576 |
| | NTT Data Group Corp. | 8,768,201 | 138,715 |
| | Pan Pacific International Holdings Corp. | 5,579,530 | 138,419 |
| | Fujikura Ltd. | 3,686,511 | 135,491 |
| | Nitori Holdings Co. Ltd. | 1,040,793 | 132,550 |
| | Eisai Co. Ltd. | 3,689,923 | 125,015 |
| | Daiwa Securities Group Inc. | 18,614,158 | 121,779 |
| | Konami Group Corp. | 1,326,080 | 121,548 |
| | Tokyo Gas Co. Ltd. | 4,858,154 | 119,865 |
Total International Stock Index Fund
| | | | | | Shares | Market
Value•
($000) |
| | Asahi Kasei Corp. | 17,224,336 | 118,825 |
| | Shiseido Co. Ltd. | 5,415,640 | 116,896 |
| * | Rakuten Group Inc. | 19,428,359 | 115,959 |
| | Toray Industries Inc. | 21,141,661 | 114,970 |
| | Obayashi Corp. | 9,370,995 | 114,881 |
| | Idemitsu Kosan Co. Ltd. | 16,850,290 | 114,876 |
| | West Japan Railway Co. | 6,317,828 | 112,291 |
| | TOPPAN Holdings Inc. | 3,806,348 | 111,340 |
| | T&D Holdings Inc. | 6,956,491 | 111,041 |
| | Shimadzu Corp. | 3,748,228 | 110,565 |
| | Osaka Gas Co. Ltd. | 5,135,591 | 110,049 |
| | Makita Corp. | 3,369,735 | 110,028 |
| | Dentsu Group Inc. | 3,502,555 | 108,116 |
| | Yamaha Motor Co. Ltd. | 12,337,806 | 107,845 |
| | Kajima Corp. | 6,234,704 | 107,396 |
| | Dai Nippon Printing Co. Ltd. | 6,075,726 | 105,453 |
| | Chubu Electric Power Co. Inc. | 9,162,240 | 105,321 |
| | Nippon Paint Holdings Co. Ltd. | 13,614,407 | 104,198 |
| | Isuzu Motors Ltd. | 7,991,266 | 103,341 |
| | Yaskawa Electric Corp. | 3,593,274 | 102,981 |
| | Nexon Co. Ltd. | 5,855,260 | 101,483 |
| | Omron Corp. | 2,527,461 | 99,788 |
| | MINEBEA MITSUMI Inc. | 5,645,680 | 99,389 |
| | LY Corp. | 36,345,987 | 99,144 |
| | JFE Holdings Inc. | 8,196,433 | 98,680 |
| | Capcom Co. Ltd. | 4,930,724 | 97,571 |
| | Taisei Corp. | 2,315,100 | 97,492 |
| | Mitsubishi Chemical Group Corp. | 17,779,991 | 95,942 |
| | Ebara Corp. | 6,370,500 | 95,738 |
| | Trend Micro Inc. | 1,818,412 | 95,144 |
| | IHI Corp. | 1,779,660 | 94,747 |
| | Sumitomo Metal Mining Co. Ltd. | 3,299,996 | 91,240 |
| | Nippon Building Fund Inc. | 106,192 | 91,086 |
| | Fuji Electric Co. Ltd. | 1,744,437 | 88,841 |
| | Daito Trust Construction Co. Ltd. | 800,717 | 88,482 |
| | Yakult Honsha Co. Ltd. | 4,052,916 | 88,074 |
| | Nippon Sanso Holdings Corp. | 2,522,291 | 87,554 |
| | Ricoh Co. Ltd. | 7,794,967 | 84,440 |
| | Tokyu Corp. | 6,764,710 | 83,398 |
| | MEIJI Holdings Co. Ltd. | 3,562,642 | 83,106 |
| | SBI Holdings Inc. | 3,780,400 | 83,014 |
| * | Tokyo Electric Power Co. Holdings Inc. | 20,418,643 | 82,461 |
| | Hankyu Hanshin Holdings Inc. | 3,031,218 | 82,419 |
| | Mitsubishi HC Capital Inc. | 11,769,606 | 78,812 |
| | Kawasaki Heavy Industries Ltd. | 2,032,666 | 77,827 |
| | TIS Inc. | 3,096,266 | 77,210 |
| | Sekisui Chemical Co. Ltd. | 5,470,019 | 77,198 |
| 1 | Kawasaki Kisen Kaisha Ltd. | 5,555,627 | 76,746 |
| | Nissin Foods Holdings Co. Ltd. | 2,811,741 | 75,712 |
| | AGC Inc. | 2,462,876 | 75,475 |
| | Sumitomo Forestry Co. Ltd. | 1,947,220 | 75,014 |
| | Daifuku Co. Ltd. | 3,963,914 | 74,509 |
| | Ono Pharmaceutical Co. Ltd. | 5,943,770 | 74,239 |
| | Concordia Financial Group Ltd. | 14,973,719 | 74,169 |
| | Toyo Suisan Kaisha Ltd. | 1,255,098 | 73,729 |
| | Yokogawa Electric Corp. | 3,291,578 | 72,980 |
| | SCREEN Holdings Co. Ltd. | 1,130,326 | 72,161 |
| | Isetan Mitsukoshi Holdings Ltd. | 4,802,537 | 71,463 |
| | Hikari Tsushin Inc. | 343,120 | 69,253 |
| | Niterra Co. Ltd. | 2,438,689 | 69,116 |
| | MatsukiyoCocokara & Co. | 5,047,757 | 68,724 |
| | Sanwa Holdings Corp. | 2,696,262 | 68,307 |
| | Chiba Bank Ltd. | 9,294,239 | 67,827 |
| | Japan Real Estate Investment Corp. | 18,626 | 67,751 |
| | Sanrio Co. Ltd. | 2,477,715 | 67,218 |
| | Aisin Corp. | 6,360,736 | 66,135 |
| | Kyushu Electric Power Co. Inc. | 5,876,570 | 65,810 |
| | Seiko Epson Corp. | 3,619,945 | 65,795 |
| | Tohoku Electric Power Co. Inc. | 6,585,652 | 64,598 |
| 1 | Nissan Motor Co. Ltd. | 24,246,850 | 64,595 |
Total International Stock Index Fund
| | | | | | Shares | Market
Value•
($000) |
| | Seibu Holdings Inc. | 2,891,357 | 64,560 |
| | Otsuka Corp. | 2,862,988 | 64,255 |
| | Brother Industries Ltd. | 3,239,176 | 63,090 |
| | MISUMI Group Inc. | 3,851,777 | 62,690 |
| | Zensho Holdings Co. Ltd. | 1,240,869 | 62,253 |
| | Rohto Pharmaceutical Co. Ltd. | 2,706,844 | 60,870 |
| | Sojitz Corp. | 2,976,776 | 60,836 |
| | BayCurrent Inc. | 1,870,160 | 60,778 |
| | M3 Inc. | 5,910,583 | 60,746 |
| | Nissan Chemical Corp. | 1,755,138 | 59,280 |
| | Nomura Real Estate Master Fund Inc. | 62,594 | 59,090 |
| | Resonac Holdings Corp. | 2,479,503 | 58,976 |
| | Suntory Beverage & Food Ltd. | 1,747,431 | 58,949 |
| | SG Holdings Co. Ltd. | 5,836,596 | 58,531 |
| | Kintetsu Group Holdings Co. Ltd. | 2,511,425 | 58,369 |
| | Japan Metropolitan Fund Investment Corp. | 94,793 | 58,180 |
| | Kyoto Financial Group Inc. | 3,938,332 | 57,800 |
| | Kuraray Co. Ltd. | 4,248,185 | 57,569 |
| | Toho Co. Ltd. | 1,506,880 | 57,545 |
| | Kurita Water Industries Ltd. | 1,528,108 | 57,311 |
| | GLP J-REIT | 64,597 | 56,802 |
| | Sumitomo Chemical Co. Ltd. | 21,087,468 | 56,298 |
| | Mazda Motor Corp. | 7,957,058 | 56,252 |
| | Kyowa Kirin Co. Ltd. | 3,408,046 | 56,171 |
| | TOTO Ltd. | 2,012,496 | 56,148 |
| | Nippon Prologis REIT Inc. | 34,389 | 55,328 |
| | Hoshizaki Corp. | 1,666,335 | 54,769 |
| | Ryohin Keikaku Co. Ltd. | 3,301,333 | 54,026 |
| | Mitsui Chemicals Inc. | 2,361,451 | 53,949 |
| | Azbil Corp. | 6,921,436 | 53,821 |
| | Hulic Co. Ltd. | 5,784,332 | 53,565 |
| 1 | KDX Realty Investment Corp. | 56,035 | 53,304 |
| | Kyushu Railway Co. | 2,008,790 | 52,852 |
| | Nikon Corp. | 4,251,852 | 52,673 |
| | Tokyu Fudosan Holdings Corp. | 8,371,590 | 52,242 |
| | Fukuoka Financial Group Inc. | 2,247,222 | 51,263 |
| | McDonald's Holdings Co. Japan Ltd. | 1,196,500 | 50,704 |
| | Fuji Soft Inc. | 827,654 | 50,677 |
| | Nippon Express Holdings Inc. | 1,022,731 | 50,423 |
| | Keisei Electric Railway Co. Ltd. | 1,914,017 | 49,799 |
| | Rohm Co. Ltd. | 4,514,112 | 49,767 |
| | Shizuoka Financial Group Inc. | 6,207,480 | 49,533 |
| | Kobe Steel Ltd. | 4,593,330 | 49,506 |
| | NOF Corp. | 3,035,646 | 49,319 |
| | MonotaRO Co. Ltd. | 3,264,200 | 49,245 |
| | Mebuki Financial Group Inc. | 13,091,820 | 48,969 |
| | ZOZO Inc. | 1,505,134 | 48,805 |
| | Tosoh Corp. | 3,891,394 | 48,353 |
| | Shimizu Corp. | 7,297,546 | 48,346 |
| | Santen Pharmaceutical Co. Ltd. | 4,041,167 | 48,328 |
| | Hirose Electric Co. Ltd. | 405,258 | 48,230 |
| 1 | Kobe Bussan Co. Ltd. | 1,964,862 | 48,197 |
| | NH Foods Ltd. | 1,376,615 | 47,686 |
| | Ibiden Co. Ltd. | 1,500,662 | 47,668 |
| | Skylark Holdings Co. Ltd. | 3,077,456 | 47,664 |
| | USS Co. Ltd. | 5,684,258 | 47,604 |
| | Credit Saison Co. Ltd. | 2,102,485 | 47,290 |
| | Daiwa House REIT Investment Corp. | 31,043 | 47,283 |
| | Hamamatsu Photonics KK | 3,566,832 | 47,163 |
| | Socionext Inc. | 2,492,645 | 46,406 |
| | Odakyu Electric Railway Co. Ltd. | 4,416,967 | 46,342 |
| | Tobu Railway Co. Ltd. | 2,811,679 | 45,500 |
| | Oji Holdings Corp. | 12,215,255 | 45,424 |
| | SUMCO Corp. | 4,678,026 | 44,729 |
| | Tokyo Tatemono Co. Ltd. | 2,725,639 | 44,509 |
| | Mitsubishi Gas Chemical Co. Inc. | 2,553,487 | 44,378 |
| | Amada Co. Ltd. | 4,454,090 | 43,895 |
| | Asahi Intecc Co. Ltd. | 2,728,908 | 43,727 |
| | Oracle Corp. Japan | 454,022 | 43,433 |
| | Yamaha Corp. | 5,373,287 | 43,391 |
Total International Stock Index Fund
| | | | | | Shares | Market
Value•
($000) |
| | Medipal Holdings Corp. | 2,737,970 | 43,380 |
| | Invincible Investment Corp. | 106,312 | 43,303 |
| | Japan Post Insurance Co. Ltd. | 2,623,965 | 43,238 |
| | ANA Holdings Inc. | 2,172,793 | 42,797 |
| | Cosmo Energy Holdings Co. Ltd. | 865,398 | 42,716 |
| | Lixil Corp. | 3,632,826 | 42,643 |
| | Haseko Corp. | 3,515,794 | 42,496 |
| | NGK Insulators Ltd. | 3,431,352 | 42,271 |
| | Square Enix Holdings Co. Ltd. | 1,082,123 | 42,264 |
| | Sapporo Holdings Ltd. | 871,248 | 41,820 |
| | Nisshin Seifun Group Inc. | 3,574,992 | 41,738 |
| | Persol Holdings Co. Ltd. | 24,480,400 | 41,116 |
| | Sega Sammy Holdings Inc. | 2,178,610 | 41,000 |
| | Yamato Holdings Co. Ltd. | 3,793,196 | 40,231 |
| | Nichirei Corp. | 1,423,293 | 39,774 |
| | Open House Group Co. Ltd. | 1,065,543 | 39,277 |
| | Marui Group Co. Ltd. | 2,490,996 | 39,114 |
| | Sohgo Security Services Co. Ltd. | 5,553,205 | 38,610 |
| | Electric Power Development Co. Ltd. | 2,294,900 | 38,351 |
| | CyberAgent Inc. | 5,836,817 | 38,101 |
| | SCSK Corp. | 2,024,496 | 37,776 |
| | Orix JREIT Inc. | 36,323 | 37,496 |
| | Fujitec Co. Ltd. | 1,040,719 | 37,447 |
| | Yokohama Rubber Co. Ltd. | 1,825,627 | 37,422 |
| | Advance Residence Investment Corp. | 18,481 | 37,138 |
| | United Urban Investment Corp. | 41,107 | 36,864 |
| | Nomura Real Estate Holdings Inc. | 1,496,576 | 36,845 |
| | Iwatani Corp. | 2,810,792 | 36,642 |
| | Lion Corp. | 3,318,684 | 36,611 |
| | Koito Manufacturing Co. Ltd. | 2,814,616 | 36,446 |
| | Yamazaki Baking Co. Ltd. | 1,788,114 | 36,314 |
| | Iyogin Holdings Inc. | 3,784,425 | 35,926 |
| | Keio Corp. | 1,606,206 | 35,921 |
| | Tokyo Century Corp. | 3,451,144 | 35,111 |
| | Kansai Paint Co. Ltd. | 2,154,192 | 35,085 |
| | Tokyo Ohka Kogyo Co. Ltd. | 1,522,073 | 35,030 |
| | Japan Airport Terminal Co. Ltd. | 953,194 | 34,918 |
| | Kinden Corp. | 1,681,305 | 34,847 |
| | Suzuken Co. Ltd. | 1,059,957 | 34,654 |
| | Taiheiyo Cement Corp. | 1,579,574 | 34,411 |
| | Sumitomo Heavy Industries Ltd. | 1,540,314 | 34,323 |
| | Kewpie Corp. | 1,444,505 | 34,160 |
| | J Front Retailing Co. Ltd. | 3,213,006 | 34,121 |
| | GMO Payment Gateway Inc. | 568,261 | 34,037 |
| | DMG Mori Co. Ltd. | 1,743,418 | 33,244 |
| | Aozora Bank Ltd. | 1,925,145 | 33,190 |
| | Dexerials Corp. | 2,170,328 | 33,136 |
| | Hachijuni Bank Ltd. | 6,037,787 | 33,134 |
| | Horiba Ltd. | 533,600 | 32,803 |
| * | Shinko Electric Industries Co. Ltd. | 915,285 | 32,732 |
| | Japan Airlines Co. Ltd. | 2,036,789 | 32,666 |
| | Tomy Co. Ltd. | 1,225,131 | 32,342 |
| | COMSYS Holdings Corp. | 1,535,876 | 32,224 |
| | Hitachi Construction Machinery Co. Ltd. | 1,472,880 | 31,957 |
| | Japan Hotel REIT Investment Corp. | 69,207 | 31,911 |
| | Toyo Seikan Group Holdings Ltd. | 2,129,720 | 31,793 |
| | Tsuruha Holdings Inc. | 568,057 | 31,775 |
| | Shimamura Co. Ltd. | 611,146 | 31,459 |
| | Ulvac Inc. | 668,824 | 31,272 |
| | Miura Co. Ltd. | 1,338,444 | 31,254 |
| | Air Water Inc. | 2,474,253 | 31,124 |
| | Rinnai Corp. | 1,416,214 | 31,025 |
| | Alfresa Holdings Corp. | 2,137,582 | 30,841 |
| | BIPROGY Inc. | 977,148 | 30,835 |
| | Maruwa Co. Ltd. | 111,593 | 30,785 |
| | Chugoku Electric Power Co. Inc. | 4,185,054 | 30,457 |
| | Nihon Kohden Corp. | 2,038,572 | 30,388 |
| | Nagoya Railroad Co. Ltd. | 2,731,233 | 30,271 |
| | Sankyo Co. Ltd. | 2,278,990 | 30,270 |
| | Toho Gas Co. Ltd. | 1,209,996 | 30,261 |
Total International Stock Index Fund
| | | | | | Shares | Market
Value•
($000) |
| | Kokusai Electric Corp. | 1,655,500 | 30,186 |
| | Food & Life Cos. Ltd. | 1,530,114 | 30,173 |
| | Kobayashi Pharmaceutical Co. Ltd. | 809,201 | 30,141 |
| | Taiyo Yuden Co. Ltd. | 1,710,445 | 29,915 |
| | Tsumura & Co. | 909,376 | 29,722 |
| | Japan Steel Works Ltd. | 874,828 | 29,673 |
| | Takashimaya Co. Ltd. | 3,738,318 | 29,598 |
| | Daicel Corp. | 3,325,525 | 29,351 |
| | Mitsubishi Logistics Corp. | 4,373,875 | 29,322 |
| | Nagase & Co. Ltd. | 1,405,236 | 29,162 |
| | Internet Initiative Japan Inc. | 1,492,051 | 28,649 |
| | Mitsubishi Materials Corp. | 1,724,932 | 28,301 |
| | Seino Holdings Co. Ltd. | 1,749,888 | 28,222 |
| | Hirogin Holdings Inc. | 3,847,743 | 28,105 |
| | Tokyo Seimitsu Co. Ltd. | 519,339 | 27,945 |
| | Iida Group Holdings Co. Ltd. | 1,921,204 | 27,852 |
| | Mitsui Fudosan Logistics Park Inc. | 41,668 | 27,743 |
| | EXEO Group Inc. | 2,700,960 | 27,644 |
| | THK Co. Ltd. | 1,671,108 | 27,589 |
| | Japan Prime Realty Investment Corp. | 12,557 | 27,588 |
| | Nichias Corp. | 764,985 | 27,397 |
| | Gunma Bank Ltd. | 4,846,158 | 27,292 |
| | Alps Alpine Co. Ltd. | 2,774,915 | 27,268 |
| 1 | Sekisui House REIT Inc. | 56,858 | 27,036 |
| | Keikyu Corp. | 3,437,829 | 26,917 |
| | NSK Ltd. | 5,900,863 | 26,906 |
| | Kadokawa Corp. | 1,228,840 | 26,748 |
| | TechnoPro Holdings Inc. | 1,485,861 | 26,520 |
| | Kamigumi Co. Ltd. | 1,260,124 | 26,301 |
| | NET One Systems Co. Ltd. | 1,082,726 | 26,287 |
| | Nifco Inc. | 1,127,505 | 26,193 |
| | Takasago Thermal Engineering Co. Ltd. | 816,683 | 26,190 |
| | Yamaguchi Financial Group Inc. | 2,667,558 | 26,120 |
| | Stanley Electric Co. Ltd. | 1,524,137 | 26,068 |
| | NHK Spring Co. Ltd. | 2,124,111 | 25,999 |
| | Mitsubishi Motors Corp. | 8,719,550 | 25,906 |
| | Konica Minolta Inc. | 6,192,388 | 25,850 |
| | Hakuhodo DY Holdings Inc. | 3,261,262 | 25,845 |
| | Amano Corp. | 895,982 | 25,842 |
| | Kose Corp. | 468,313 | 25,737 |
| | Nippon Accommodations Fund Inc. | 6,390 | 25,589 |
| | Sumitomo Rubber Industries Ltd. | 2,496,663 | 25,587 |
| | Nabtesco Corp. | 1,568,754 | 25,429 |
| | 77 Bank Ltd. | 987,716 | 25,428 |
| | JGC Holdings Corp. | 2,958,827 | 25,396 |
| | Goldwin Inc. | 488,098 | 25,315 |
| | Keihan Holdings Co. Ltd. | 1,350,549 | 25,211 |
| | Zenkoku Hosho Co. Ltd. | 691,957 | 25,003 |
| | Kagome Co. Ltd. | 1,256,974 | 24,900 |
| | ADEKA Corp. | 1,375,916 | 24,822 |
| | DIC Corp. | 1,138,810 | 24,793 |
| | Coca-Cola Bottlers Japan Holdings Inc. | 1,933,715 | 24,769 |
| | Hisamitsu Pharmaceutical Co. Inc. | 838,994 | 24,668 |
| | LaSalle Logiport REIT | 25,640 | 24,398 |
| * | Rakuten Bank Ltd. | 1,197,100 | 24,271 |
| | Kyudenko Corp. | 672,611 | 24,147 |
| | Sankyu Inc. | 694,699 | 24,130 |
| | Mitsui Mining & Smelting Co. Ltd. | 759,072 | 24,117 |
| | Industrial & Infrastructure Fund Investment Corp. | 31,874 | 24,073 |
| | Nankai Electric Railway Co. Ltd. | 1,520,012 | 23,890 |
| | Nippon Electric Glass Co. Ltd. | 1,049,726 | 23,888 |
| | Kakaku.com Inc. | 1,553,686 | 23,857 |
| | Cosmos Pharmaceutical Corp. | 487,346 | 23,423 |
| | Nissui Corp. | 3,842,895 | 23,343 |
| | Kyushu Financial Group Inc. | 5,153,486 | 23,339 |
| | Teijin Ltd. | 2,593,013 | 23,219 |
| | Sumitomo Bakelite Co. Ltd. | 886,914 | 23,161 |
| | Morinaga Milk Industry Co. Ltd. | 986,154 | 22,933 |
| | Toho Holdings Co. Ltd. | 769,651 | 22,909 |
| * | PeptiDream Inc. | 1,245,463 | 22,862 |
Total International Stock Index Fund
| | | | | | Shares | Market
Value•
($000) |
| | Yamada Holdings Co. Ltd. | 7,957,278 | 22,849 |
| * | Mercari Inc. | 1,629,987 | 22,802 |
| | Sundrug Co. Ltd. | 916,260 | 22,663 |
| | UBE Corp. | 1,362,345 | 22,409 |
| | NS Solutions Corp. | 881,812 | 22,312 |
| | Daiwabo Holdings Co. Ltd. | 1,227,283 | 22,093 |
| | Yamato Kogyo Co. Ltd. | 462,325 | 22,083 |
| | Bic Camera Inc. | 1,983,112 | 22,072 |
| | Park24 Co. Ltd. | 1,774,129 | 22,050 |
| | Japan Logistics Fund Inc. | 12,275 | 21,994 |
| | SHO-BOND Holdings Co. Ltd. | 620,695 | 21,835 |
| | Calbee Inc. | 975,051 | 21,802 |
| | Jeol Ltd. | 584,642 | 21,688 |
| | Chugin Financial Group Inc. | 2,278,779 | 21,653 |
| | GS Yuasa Corp. | 1,221,074 | 21,603 |
| | Dowa Holdings Co. Ltd. | 635,345 | 21,586 |
| | Macnica Holdings Inc. | 1,888,824 | 21,545 |
| | Yaoko Co. Ltd. | 353,500 | 21,488 |
| | Sawai Group Holdings Co. Ltd. | 1,603,221 | 21,476 |
| | JTEKT Corp. | 3,170,866 | 21,388 |
| | Koei Tecmo Holdings Co. Ltd. | 2,028,907 | 21,233 |
| | Kandenko Co. Ltd. | 1,447,195 | 21,178 |
| | Furukawa Electric Co. Ltd. | 859,180 | 21,131 |
| | ABC-Mart Inc. | 1,076,443 | 21,092 |
| | Sugi Holdings Co. Ltd. | 1,233,227 | 21,055 |
| | Kokuyo Co. Ltd. | 1,308,533 | 21,052 |
| | Nishi-Nippon Financial Holdings Inc. | 1,949,472 | 20,995 |
| | Toda Corp. | 3,438,257 | 20,811 |
| | NSD Co. Ltd. | 958,985 | 20,712 |
| | Activia Properties Inc. | 9,676 | 20,636 |
| | Nikkon Holdings Co. Ltd. | 1,608,352 | 20,591 |
| | Ezaki Glico Co. Ltd. | 698,472 | 20,579 |
| | Casio Computer Co. Ltd. | 2,814,815 | 20,517 |
| | Nippon Gas Co. Ltd. | 1,499,318 | 20,492 |
| * | Money Forward Inc. | 627,338 | 20,467 |
| | AEON REIT Investment Corp. | 24,425 | 20,413 |
| | NEC Networks & System Integration Corp. | 949,603 | 20,062 |
| | House Foods Group Inc. | 1,024,091 | 19,962 |
| | INFRONEER Holdings Inc. | 2,646,697 | 19,896 |
| | Toyo Tire Corp. | 1,401,605 | 19,886 |
| | Morinaga & Co. Ltd. | 1,058,744 | 19,803 |
| | NOK Corp. | 1,376,657 | 19,738 |
| | Rorze Corp. | 1,344,930 | 19,602 |
| | Mabuchi Motor Co. Ltd. | 1,357,036 | 19,419 |
| | K's Holdings Corp. | 2,022,764 | 19,343 |
| | Nippon Shinyaku Co. Ltd. | 715,913 | 19,207 |
| | Shikoku Electric Power Co. Inc. | 2,137,552 | 19,130 |
| | Canon Marketing Japan Inc. | 635,294 | 19,084 |
| | Daido Steel Co. Ltd. | 2,445,945 | 18,940 |
| | Mori Hills REIT Investment Corp. | 22,754 | 18,939 |
| | Seven Bank Ltd. | 8,906,993 | 18,799 |
| 1 | Hokuetsu Corp. | 1,880,292 | 18,750 |
| | Rengo Co. Ltd. | 3,086,871 | 18,697 |
| | Nippon Shokubai Co. Ltd. | 1,661,520 | 18,692 |
| | Takara Holdings Inc. | 2,374,843 | 18,667 |
| | Fuyo General Lease Co. Ltd. | 262,943 | 18,607 |
| | Frontier Real Estate Investment Corp. | 6,983 | 18,544 |
| | Comforia Residential REIT Inc. | 9,457 | 18,533 |
| | Daishi Hokuetsu Financial Group Inc. | 1,151,784 | 18,286 |
| | MEITEC Group Holdings Inc. | 951,715 | 18,238 |
| | Yoshinoya Holdings Co. Ltd. | 895,320 | 18,233 |
| | Zeon Corp. | 1,943,931 | 18,099 |
| | Relo Group Inc. | 1,484,155 | 18,054 |
| | Maruichi Steel Tube Ltd. | 827,756 | 17,838 |
| | Kotobuki Spirits Co. Ltd. | 1,310,315 | 17,693 |
| | Rakus Co. Ltd. | 1,322,391 | 17,682 |
| | Nippon Kayaku Co. Ltd. | 2,231,258 | 17,650 |
| 1 | Suruga Bank Ltd. | 2,477,331 | 17,644 |
| | Kanematsu Corp. | 1,157,261 | 17,617 |
| | OBIC Business Consultants Co. Ltd. | 397,395 | 17,567 |
Total International Stock Index Fund
| | | | | | Shares | Market
Value•
($000) |
| * | Sharp Corp. | 2,884,457 | 17,560 |
| | H2O Retailing Corp. | 1,305,925 | 17,476 |
| | Nitto Boseki Co. Ltd. | 362,566 | 17,375 |
| | Welcia Holdings Co. Ltd. | 1,385,574 | 17,297 |
| | Inaba Denki Sangyo Co. Ltd. | 689,079 | 17,283 |
| * | Visional Inc. | 322,635 | 17,264 |
| | Aeon Mall Co. Ltd. | 1,300,739 | 17,225 |
| 1 | Ito En Ltd. | 785,382 | 17,212 |
| | Tokuyama Corp. | 982,743 | 17,206 |
| | Wacoal Holdings Corp. | 551,929 | 17,183 |
| | Organo Corp. | 366,244 | 17,113 |
| | Sotetsu Holdings Inc. | 1,085,848 | 17,036 |
| | Citizen Watch Co. Ltd. | 2,860,246 | 17,005 |
| | Fuji Corp. | 1,154,426 | 16,987 |
| | Hanwa Co. Ltd. | 512,670 | 16,987 |
| | Ushio Inc. | 1,232,192 | 16,962 |
| | Denka Co. Ltd. | 1,188,511 | 16,797 |
| | San-In Godo Bank Ltd. | 2,089,043 | 16,767 |
| | MIRAIT ONE Corp. | 1,168,364 | 16,618 |
| | Nihon M&A Center Holdings Inc. | 3,815,335 | 16,516 |
| | Ship Healthcare Holdings Inc. | 1,085,288 | 16,503 |
| | Daiwa Securities Living Investments Corp. | 27,367 | 16,460 |
| | Mitsubishi Estate Logistics REIT Investment Corp. | 6,999 | 16,329 |
| | Resorttrust Inc. | 897,436 | 16,307 |
| | Hokuhoku Financial Group Inc. | 1,559,715 | 16,301 |
| | Hokuriku Electric Power Co. | 2,345,919 | 16,270 |
| | Nakanishi Inc. | 956,254 | 16,261 |
| | Kaneka Corp. | 660,164 | 16,181 |
| | Pigeon Corp. | 1,484,195 | 16,098 |
| | JVCKenwood Corp. | 2,022,956 | 15,910 |
| | Tsubakimoto Chain Co. | 1,262,718 | 15,899 |
| | Round One Corp. | 2,507,366 | 15,869 |
| | Hulic REIT Inc. | 18,316 | 15,862 |
| * | Sansan Inc. | 1,086,093 | 15,799 |
| | Japan Elevator Service Holdings Co. Ltd. | 824,704 | 15,791 |
| | Hokkaido Electric Power Co. Inc. | 2,446,329 | 15,737 |
| | Kanadevia Corp. | 2,299,226 | 15,716 |
| 1 | Toei Animation Co. Ltd. | 691,600 | 15,708 |
| | Hazama Ando Corp. | 2,125,961 | 15,703 |
| | Workman Co. Ltd. | 612,680 | 15,639 |
| | Aica Kogyo Co. Ltd. | 718,260 | 15,543 |
| | DCM Holdings Co. Ltd. | 1,650,982 | 15,453 |
| | Pilot Corp. | 494,213 | 15,362 |
| | Osaka Soda Co. Ltd. | 1,455,080 | 15,283 |
| | Toyoda Gosei Co. Ltd. | 899,403 | 15,281 |
| | Nishi-Nippon Railroad Co. Ltd. | 1,056,453 | 15,254 |
| | Tokai Carbon Co. Ltd. | 2,698,836 | 15,233 |
| 1 | Toridoll Holdings Corp. | 591,488 | 15,204 |
| | Penta-Ocean Construction Co. Ltd. | 3,652,819 | 15,173 |
| * | SHIFT Inc. | 150,818 | 15,157 |
| | As One Corp. | 808,574 | 15,121 |
| | Descente Ltd. | 532,032 | 15,070 |
| | Japan Petroleum Exploration Co. Ltd. | 1,994,055 | 14,995 |
| | Toei Co. Ltd. | 466,100 | 14,928 |
| | Nipro Corp. | 1,613,711 | 14,893 |
| | Duskin Co. Ltd. | 560,717 | 14,858 |
| | Takeuchi Manufacturing Co. Ltd. | 472,474 | 14,724 |
| | Seria Co. Ltd. | 700,450 | 14,634 |
| | Meidensha Corp. | 556,200 | 14,597 |
| | Topcon Corp. | 1,431,592 | 14,533 |
| | DeNA Co. Ltd. | 1,183,835 | 14,504 |
| | Senko Group Holdings Co. Ltd. | 1,541,721 | 14,494 |
| | Daiwa Office Investment Corp. | 7,294 | 14,405 |
| | Japan Securities Finance Co. Ltd. | 1,097,020 | 14,313 |
| | Daiseki Co. Ltd. | 559,414 | 14,283 |
| | Sangetsu Corp. | 772,888 | 14,150 |
| | Mori Trust REIT Inc. | 34,936 | 14,113 |
| | Toagosei Co. Ltd. | 1,381,786 | 14,098 |
| | Mitsui-Soko Holdings Co. Ltd. | 302,117 | 14,031 |
| 1 | NTT UD REIT Investment Corp. | 19,528 | 14,002 |
Total International Stock Index Fund
| | | | | | Shares | Market
Value•
($000) |
| | Okumura Corp. | 494,238 | 13,878 |
| | Lintec Corp. | 666,943 | 13,840 |
| | CKD Corp. | 821,816 | 13,833 |
| | Kusuri no Aoki Holdings Co. Ltd. | 664,447 | 13,829 |
| | Mizuho Leasing Co. Ltd. | 2,111,110 | 13,816 |
| | Anritsu Corp. | 1,825,371 | 13,747 |
| | OKUMA Corp. | 678,652 | 13,720 |
| | Modec Inc. | 628,662 | 13,689 |
| | SWCC Corp. | 390,028 | 13,678 |
| | Daiichikosho Co. Ltd. | 1,094,578 | 13,677 |
| | GungHo Online Entertainment Inc. | 611,153 | 13,613 |
| | Fuji Oil Holdings Inc. | 631,841 | 13,601 |
| | GMO internet group Inc. | 786,982 | 13,601 |
| | Mizuno Corp. | 256,226 | 13,600 |
| | OSG Corp. | 1,144,545 | 13,509 |
| | Riken Keiki Co. Ltd. | 473,782 | 13,423 |
| | Exedy Corp. | 486,184 | 13,374 |
| | Yodogawa Steel Works Ltd. | 374,759 | 13,244 |
| | Tokyu REIT Inc. | 13,022 | 13,219 |
| | Japan Excellent Inc. | 16,920 | 13,086 |
| | DTS Corp. | 502,573 | 13,017 |
| | Nishimatsu Construction Co. Ltd. | 384,858 | 12,910 |
| | Saizeriya Co. Ltd. | 348,935 | 12,880 |
| | Taikisha Ltd. | 404,695 | 12,873 |
| | Toyota Boshoku Corp. | 962,836 | 12,853 |
| | UACJ Corp. | 388,775 | 12,796 |
| 1 | Towa Corp. | 996,819 | 12,763 |
| | Ain Holdings Inc. | 385,270 | 12,723 |
| | Juroku Financial Group Inc. | 473,210 | 12,628 |
| | NIPPON REIT Investment Corp. | 6,102 | 12,624 |
| | AEON Financial Service Co. Ltd. | 1,564,005 | 12,594 |
| | Nojima Corp. | 896,968 | 12,580 |
| | TS Tech Co. Ltd. | 1,110,586 | 12,559 |
| | H.U. Group Holdings Inc. | 728,404 | 12,534 |
| | Fujimi Inc. | 811,578 | 12,486 |
| | EDION Corp. | 1,074,622 | 12,446 |
| | Tamron Co. Ltd. | 440,106 | 12,385 |
| | Financial Partners Group Co. Ltd. | 804,720 | 12,361 |
| | Sumitomo Warehouse Co. Ltd. | 706,216 | 12,357 |
| | Inabata & Co. Ltd. | 580,168 | 12,343 |
| | Paramount Bed Holdings Co. Ltd. | 709,486 | 12,261 |
| | ARE Holdings Inc. | 1,000,873 | 12,254 |
| | Acom Co. Ltd. | 5,206,931 | 12,235 |
| | Taiyo Holdings Co. Ltd. | 463,368 | 12,232 |
| | Harmonic Drive Systems Inc. | 672,135 | 12,214 |
| * | Appier Group Inc. | 1,130,600 | 12,124 |
| | Shiga Bank Ltd. | 564,032 | 12,110 |
| | Kureha Corp. | 651,955 | 12,040 |
| | Okamura Corp. | 957,673 | 12,035 |
| | PALTAC Corp. | 437,949 | 11,818 |
| | Kissei Pharmaceutical Co. Ltd. | 483,301 | 11,794 |
| | Nisshinbo Holdings Inc. | 1,855,670 | 11,783 |
| | SKY Perfect JSAT Holdings Inc. | 2,054,208 | 11,732 |
| | Izumi Co. Ltd. | 555,231 | 11,718 |
| | Kaken Pharmaceutical Co. Ltd. | 458,560 | 11,718 |
| | Artience Co. Ltd. | 488,352 | 11,705 |
| | Nippon Soda Co. Ltd. | 700,906 | 11,674 |
| | PAL GROUP Holdings Co. Ltd. | 579,682 | 11,661 |
| | JMDC Inc. | 416,189 | 11,598 |
| | Leopalace21 Corp. | 3,189,423 | 11,517 |
| 1 | Hoshino Resorts REIT Inc. | 7,574 | 11,497 |
| | Sinfonia Technology Co. Ltd. | 339,614 | 11,468 |
| | Daihen Corp. | 273,894 | 11,362 |
| | Dentsu Soken Inc. | 317,987 | 11,318 |
| | Micronics Japan Co. Ltd. | 453,660 | 11,303 |
| | Sumitomo Osaka Cement Co. Ltd. | 458,198 | 11,291 |
| | Monex Group Inc. | 2,405,173 | 11,286 |
| | Max Co. Ltd. | 488,367 | 11,264 |
| | TBS Holdings Inc. | 453,800 | 11,167 |
| | Create Restaurants Holdings Inc. | 1,400,470 | 11,157 |
Total International Stock Index Fund
| | | | | | Shares | Market
Value•
($000) |
| | Seiko Group Corp. | 439,603 | 11,081 |
| | Arcs Co. Ltd. | 663,854 | 11,015 |
| | Heiwa Real Estate REIT Inc. | 13,704 | 10,949 |
| | Simplex Holdings Inc. | 672,114 | 10,900 |
| | Kyoritsu Maintenance Co. Ltd. | 677,410 | 10,876 |
| | Tokyo Steel Manufacturing Co. Ltd. | 1,086,818 | 10,805 |
| | Nihon Parkerizing Co. Ltd. | 1,281,898 | 10,805 |
| | Ferrotec Holdings Corp. | 645,500 | 10,786 |
| | Glory Ltd. | 664,909 | 10,785 |
| * | Sanken Electric Co. Ltd. | 274,170 | 10,778 |
| | Hyakugo Bank Ltd. | 2,979,710 | 10,724 |
| | Colowide Co. Ltd. | 967,457 | 10,715 |
| | Okasan Securities Group Inc. | 2,689,521 | 10,679 |
| | Kumagai Gumi Co. Ltd. | 461,331 | 10,668 |
| | Nisshin Oillio Group Ltd. | 312,822 | 10,631 |
| | SAMTY HOLDINGS Co. Ltd. | 494,295 | 10,628 |
| | C Uyemura & Co. Ltd. | 152,836 | 10,622 |
| | Joyful Honda Co. Ltd. | 783,363 | 10,599 |
| | Takuma Co. Ltd. | 1,015,115 | 10,592 |
| | FP Corp. | 604,500 | 10,590 |
| | Meiko Electronics Co. Ltd. | 270,212 | 10,561 |
| | Makino Milling Machine Co. Ltd. | 281,129 | 10,554 |
| | Justsystems Corp. | 471,920 | 10,552 |
| | Open Up Group Inc. | 795,519 | 10,484 |
| | Heiwa Real Estate Co. Ltd. | 381,591 | 10,481 |
| | TOKAI Holdings Corp. | 1,695,119 | 10,398 |
| | Pola Orbis Holdings Inc. | 1,056,293 | 10,396 |
| | Shoei Co. Ltd. | 677,352 | 10,395 |
| | Hosiden Corp. | 693,826 | 10,393 |
| | Seiren Co. Ltd. | 613,183 | 10,318 |
| | Sakata Seed Corp. | 442,473 | 10,260 |
| | Star Asia Investment Corp. | 30,562 | 10,210 |
| | Mani Inc. | 854,686 | 10,197 |
| | Heiwa Corp. | 744,980 | 10,173 |
| | Nippn Corp. | 705,105 | 10,166 |
| | SBI Sumishin Net Bank Ltd. | 578,400 | 10,132 |
| | Fukuyama Transporting Co. Ltd. | 397,816 | 10,117 |
| | Tadano Ltd. | 1,583,230 | 10,079 |
| | Megmilk Snow Brand Co. Ltd. | 579,940 | 10,036 |
| | Shochiku Co. Ltd. | 138,208 | 9,995 |
| | Digital Garage Inc. | 483,428 | 9,976 |
| | TKC Corp. | 383,801 | 9,953 |
| | North Pacific Bank Ltd. | 3,807,257 | 9,882 |
| | NTN Corp. | 5,983,803 | 9,859 |
| | Sanki Engineering Co. Ltd. | 628,934 | 9,859 |
| | MIXI Inc. | 533,746 | 9,839 |
| 1 | Sakura Internet Inc. | 324,900 | 9,823 |
| | Fuji Seal International Inc. | 577,814 | 9,813 |
| | Fujitsu General Ltd. | 781,139 | 9,741 |
| | Kiyo Bank Ltd. | 826,372 | 9,679 |
| | Maruha Nichiro Corp. | 490,527 | 9,622 |
| | Daiei Kankyo Co. Ltd. | 466,000 | 9,612 |
| | Ryoyo Ryosan Holdings Inc. | 574,035 | 9,601 |
| | Aichi Financial Group Inc. | 643,033 | 9,594 |
| | Bunka Shutter Co. Ltd. | 790,683 | 9,514 |
| | Tokyo Kiraboshi Financial Group Inc. | 352,783 | 9,490 |
| | Global One Real Estate Investment Corp. | 14,716 | 9,481 |
| | Tokai Tokyo Financial Holdings Inc. | 3,088,104 | 9,456 |
| | Arata Corp. | 420,454 | 9,440 |
| | Itoham Yonekyu Holdings Inc. | 373,112 | 9,404 |
| | Sun Corp. | 179,500 | 9,394 |
| | Japan Material Co. Ltd. | 788,690 | 9,389 |
| | Fukuoka REIT Corp. | 9,976 | 9,307 |
| | JAFCO Group Co. Ltd. | 691,589 | 9,293 |
| | Kato Sangyo Co. Ltd. | 342,390 | 9,269 |
| | Mitsui E&S Co. Ltd. | 1,278,907 | 9,252 |
| | San-A Co. Ltd. | 492,000 | 9,216 |
| | Starts Corp. Inc. | 400,037 | 9,215 |
| | Mitsubishi Pencil Co. Ltd. | 568,529 | 9,171 |
| | Tokai Rika Co. Ltd. | 647,536 | 9,155 |
Total International Stock Index Fund
| | | | | | Shares | Market
Value•
($000) |
| | Noritake Co. Ltd. | 363,348 | 9,153 |
| | Nishimatsuya Chain Co. Ltd. | 618,501 | 9,132 |
| | Royal Holdings Co. Ltd. | 560,122 | 9,106 |
| * | Hino Motors Ltd. | 3,689,676 | 9,058 |
| | Ohsho Food Service Corp. | 460,569 | 9,047 |
| | Monogatari Corp. | 384,515 | 9,043 |
| | San-Ai Obbli Co. Ltd. | 735,284 | 8,977 |
| | Systena Corp. | 3,768,052 | 8,949 |
| *,1 | Nxera Pharma Co. Ltd. | 1,119,100 | 8,934 |
| | Nippon Light Metal Holdings Co. Ltd. | 833,115 | 8,904 |
| | Raito Kogyo Co. Ltd. | 602,404 | 8,789 |
| | Chugoku Marine Paints Ltd. | 606,882 | 8,669 |
| | Ariake Japan Co. Ltd. | 248,074 | 8,661 |
| | Nichiha Corp. | 383,476 | 8,660 |
| | Katitas Co. Ltd. | 680,354 | 8,626 |
| | ARCLANDS Corp. | 788,649 | 8,617 |
| | Toyo Construction Co. Ltd. | 1,005,428 | 8,602 |
| | Fuji Kyuko Co. Ltd. | 511,985 | 8,590 |
| | Adastria Co. Ltd. | 370,701 | 8,567 |
| | Kaga Electronics Co. Ltd. | 470,724 | 8,546 |
| | Iino Kaiun Kaisha Ltd. | 1,164,266 | 8,542 |
| | Okinawa Cellular Telephone Co. | 299,983 | 8,534 |
| | Jaccs Co. Ltd. | 341,337 | 8,514 |
| | MOS Food Services Inc. | 359,873 | 8,501 |
| | KYB Corp. | 270,163 | 8,487 |
| | Mitsui High-Tec Inc. | 1,584,705 | 8,433 |
| | Aiful Corp. | 4,008,861 | 8,424 |
| | Megachips Corp. | 234,667 | 8,369 |
| | Funai Soken Holdings Inc. | 521,700 | 8,304 |
| | Shibaura Mechatronics Corp. | 120,200 | 8,282 |
| | Fukuda Denshi Co. Ltd. | 164,054 | 8,263 |
| | Tocalo Co. Ltd. | 710,230 | 8,262 |
| | Hokkoku Financial Holdings Inc. | 289,392 | 8,262 |
| | KOMEDA Holdings Co. Ltd. | 435,094 | 8,234 |
| | Senshu Ikeda Holdings Inc. | 3,710,485 | 8,227 |
| | Maruzen Showa Unyu Co. Ltd. | 213,210 | 8,223 |
| | Wacom Co. Ltd. | 1,783,574 | 8,222 |
| | Ai Holdings Corp. | 539,550 | 8,222 |
| | Japan Aviation Electronics Industry Ltd. | 442,758 | 8,214 |
| | Komeri Co. Ltd. | 379,799 | 8,209 |
| | Toyobo Co. Ltd. | 1,272,586 | 8,113 |
| | Nanto Bank Ltd. | 415,362 | 8,109 |
| | Kasumigaseki Capital Co. Ltd. | 85,400 | 8,098 |
| | JINS Holdings Inc. | 197,193 | 8,037 |
| | Totetsu Kogyo Co. Ltd. | 372,794 | 8,031 |
| | Trusco Nakayama Corp. | 541,266 | 7,995 |
| * | Sumitomo Pharma Co. Ltd. | 2,326,307 | 7,980 |
| | Ichibanya Co. Ltd. | 1,163,585 | 7,979 |
| | Musashi Seimitsu Industry Co. Ltd. | 613,220 | 7,954 |
| | Autobacs Seven Co. Ltd. | 851,408 | 7,921 |
| | MCJ Co. Ltd. | 842,320 | 7,892 |
| | dip Corp. | 446,025 | 7,840 |
| | Yokogawa Bridge Holdings Corp. | 428,374 | 7,817 |
| 1 | Ichigo Office REIT Investment Corp. | 15,163 | 7,784 |
| | FCC Co. Ltd. | 499,353 | 7,766 |
| | Tsurumi Manufacturing Co. Ltd. | 277,178 | 7,739 |
| | Kohnan Shoji Co. Ltd. | 325,691 | 7,723 |
| | Menicon Co. Ltd. | 699,972 | 7,702 |
| | SMS Co. Ltd. | 685,190 | 7,681 |
| | Shibaura Machine Co. Ltd. | 315,122 | 7,671 |
| | Riso Kagaku Corp. | 332,072 | 7,653 |
| * | Medley Inc. | 312,100 | 7,615 |
| | Matsui Securities Co. Ltd. | 1,413,197 | 7,614 |
| | Namura Shipbuilding Co. Ltd. | 736,200 | 7,588 |
| | Nippon Paper Industries Co. Ltd. | 1,296,589 | 7,569 |
| | Musashino Bank Ltd. | 433,628 | 7,563 |
| | CRE Logistics REIT Inc. | 8,264 | 7,560 |
| | Oki Electric Industry Co. Ltd. | 1,154,383 | 7,546 |
| | Toshiba TEC Corp. | 329,787 | 7,500 |
| | Sanyo Denki Co. Ltd. | 128,509 | 7,461 |
Total International Stock Index Fund
| | | | | | Shares | Market
Value•
($000) |
| | ZERIA Pharmaceutical Co. Ltd. | 488,055 | 7,452 |
| | Eizo Corp. | 505,192 | 7,444 |
| | Towa Pharmaceutical Co. Ltd. | 363,182 | 7,443 |
| | Noritsu Koki Co. Ltd. | 287,703 | 7,440 |
| | Transcosmos Inc. | 340,758 | 7,438 |
| | Noevir Holdings Co. Ltd. | 220,752 | 7,427 |
| | Gunze Ltd. | 210,859 | 7,407 |
| | Valor Holdings Co. Ltd. | 536,047 | 7,386 |
| 1 | Kanamoto Co. Ltd. | 408,236 | 7,378 |
| | Ichigo Inc. | 2,814,902 | 7,375 |
| | Kitz Corp. | 1,064,554 | 7,344 |
| | Central Glass Co. Ltd. | 320,788 | 7,307 |
| | Hankyu Hanshin REIT Inc. | 9,211 | 7,290 |
| | Konishi Co. Ltd. | 846,872 | 7,279 |
| | Maeda Kosen Co. Ltd. | 628,210 | 7,271 |
| | Mitsubishi Shokuhin Co. Ltd. | 229,118 | 7,270 |
| | Bank of Nagoya Ltd. | 185,109 | 7,248 |
| | Premium Group Co. Ltd. | 466,263 | 7,248 |
| *,1 | Atom Corp. | 1,626,810 | 7,240 |
| | Mochida Pharmaceutical Co. Ltd. | 316,158 | 7,233 |
| | YAMABIKO Corp. | 444,748 | 7,225 |
| | Tri Chemical Laboratories Inc. | 362,126 | 7,205 |
| | Awa Bank Ltd. | 452,141 | 7,203 |
| | Hogy Medical Co. Ltd. | 241,175 | 7,202 |
| | Dai-Dan Co. Ltd. | 368,262 | 7,190 |
| | Token Corp. | 102,215 | 7,168 |
| | Mitsuboshi Belting Ltd. | 278,250 | 7,143 |
| 1 | Kura Sushi Inc. | 271,955 | 7,142 |
| | Yamazen Corp. | 812,918 | 7,061 |
| | Chudenko Corp. | 336,552 | 7,054 |
| | Morita Holdings Corp. | 527,438 | 7,039 |
| | Earth Corp. | 206,034 | 7,039 |
| | SOSiLA Logistics REIT Inc. | 9,732 | 7,020 |
| | Eiken Chemical Co. Ltd. | 432,147 | 6,994 |
| | Maxell Ltd. | 572,959 | 6,994 |
| | JCU Corp. | 302,028 | 6,962 |
| | Mitsubishi Logisnext Co. Ltd. | 933,589 | 6,943 |
| | U-Next Holdings Co. Ltd. | 216,442 | 6,904 |
| | ASKUL Corp. | 546,816 | 6,895 |
| | Tsuburaya Fields Holdings Inc. | 514,942 | 6,886 |
| | Infomart Corp. | 2,915,779 | 6,849 |
| | Zacros Corp. | 242,403 | 6,837 |
| | Sinko Industries Ltd. | 239,053 | 6,831 |
| | Yuasa Trading Co. Ltd. | 223,877 | 6,806 |
| 1 | Kumiai Chemical Industry Co. Ltd. | 1,277,356 | 6,799 |
| | Hiday Hidaka Corp. | 377,515 | 6,792 |
| 1 | Mirai Corp. | 25,903 | 6,790 |
| | Fuji Media Holdings Inc. | 599,245 | 6,774 |
| | Amvis Holdings Inc. | 521,400 | 6,768 |
| | Nitto Kogyo Corp. | 350,114 | 6,762 |
| | Shibuya Corp. | 279,822 | 6,740 |
| | Hamakyorex Co. Ltd. | 824,008 | 6,716 |
| | Toyo Tanso Co. Ltd. | 195,110 | 6,702 |
| | Takasago International Corp. | 197,491 | 6,699 |
| | Shinmaywa Industries Ltd. | 754,317 | 6,689 |
| | Argo Graphics Inc. | 194,382 | 6,684 |
| 1 | HIS Co. Ltd. | 581,678 | 6,666 |
| | Aeon Delight Co. Ltd. | 233,813 | 6,641 |
| | Nagawa Co. Ltd. | 149,105 | 6,629 |
| | KH Neochem Co. Ltd. | 491,350 | 6,625 |
| | Yellow Hat Ltd. | 405,602 | 6,611 |
| | Showa Sangyo Co. Ltd. | 348,247 | 6,601 |
| | Hioki EE Corp. | 122,836 | 6,597 |
| | Daio Paper Corp. | 1,162,774 | 6,593 |
| | Zojirushi Corp. | 629,599 | 6,587 |
| | Topre Corp. | 567,903 | 6,542 |
| | TOMONY Holdings Inc. | 2,514,670 | 6,511 |
| | Kurabo Industries Ltd. | 211,434 | 6,499 |
| | Sakata INX Corp. | 645,541 | 6,490 |
| | Takara Standard Co. Ltd. | 596,828 | 6,482 |
Total International Stock Index Fund
| | | | | | Shares | Market
Value•
($000) |
| | Nissha Co. Ltd. | 526,422 | 6,447 |
| | Create SD Holdings Co. Ltd. | 328,089 | 6,444 |
| | Itochu Enex Co. Ltd. | 613,942 | 6,426 |
| | Konoike Transport Co. Ltd. | 392,432 | 6,417 |
| | Yonex Co. Ltd. | 510,892 | 6,393 |
| | UT Group Co. Ltd. | 376,487 | 6,388 |
| | Mitsuuroko Group Holdings Co. Ltd. | 566,559 | 6,385 |
| | Okamoto Industries Inc. | 182,770 | 6,336 |
| | Sumitomo Densetsu Co. Ltd. | 196,768 | 6,319 |
| | Fuso Chemical Co. Ltd. | 259,029 | 6,318 |
| | Ricoh Leasing Co. Ltd. | 196,312 | 6,317 |
| | Keiyo Bank Ltd. | 1,403,966 | 6,292 |
| | Future Corp. | 490,051 | 6,275 |
| | Heiwado Co. Ltd. | 433,362 | 6,255 |
| | Fuji Co. Ltd. | 465,749 | 6,250 |
| * | Fujita Kanko Inc. | 102,408 | 6,246 |
| | Japan Wool Textile Co. Ltd. | 750,067 | 6,222 |
| | en Japan Inc. | 387,047 | 6,164 |
| | Furuya Metal Co. Ltd. | 235,500 | 6,115 |
| | PILLAR Corp. | 218,045 | 6,105 |
| | Kyokuto Kaihatsu Kogyo Co. Ltd. | 384,677 | 6,103 |
| | Ogaki Kyoritsu Bank Ltd. | 509,920 | 6,082 |
| | Taihei Dengyo Kaisha Ltd. | 180,302 | 6,063 |
| | Nitta Corp. | 250,509 | 6,059 |
| | Prima Meat Packers Ltd. | 411,317 | 6,054 |
| | T Hasegawa Co. Ltd. | 277,624 | 6,024 |
| | Union Tool Co. | 128,020 | 5,986 |
| | Life Corp. | 273,224 | 5,937 |
| | Sekisui Jushi Corp. | 400,035 | 5,933 |
| | Trancom Co. Ltd. | 87,878 | 5,933 |
| | Star Micronics Co. Ltd. | 462,815 | 5,928 |
| 1 | Anycolor Inc. | 418,400 | 5,908 |
| | Daiichi Jitsugyo Co. Ltd. | 375,103 | 5,892 |
| | Nohmi Bosai Ltd. | 298,172 | 5,887 |
| | Wakita & Co. Ltd. | 571,067 | 5,886 |
| 1 | Senshu Electric Co. Ltd. | 176,700 | 5,876 |
| | Idec Corp. | 357,247 | 5,759 |
| | Toa Corp. | 894,496 | 5,758 |
| | Nichireki Group Co. Ltd. | 364,042 | 5,758 |
| | Shikoku Kasei Holdings Corp. | 427,785 | 5,749 |
| | Tosei Corp. | 368,633 | 5,733 |
| | Optorun Co. Ltd. | 458,055 | 5,720 |
| | Hyakujushi Bank Ltd. | 341,846 | 5,673 |
| | Kyorin Pharmaceutical Co. Ltd. | 569,808 | 5,655 |
| | Restar Corp. | 328,708 | 5,651 |
| | Mitani Sekisan Co. Ltd. | 137,300 | 5,637 |
| | Nissan Shatai Co. Ltd. | 835,283 | 5,630 |
| | Totech Corp. | 327,200 | 5,606 |
| | Nippon Densetsu Kogyo Co. Ltd. | 458,418 | 5,600 |
| | Pacific Industrial Co. Ltd. | 625,172 | 5,597 |
| | Takara Leben Real Estate Investment Corp. | 10,006 | 5,575 |
| 1 | Nomura Micro Science Co. Ltd. | 403,600 | 5,571 |
| | Milbon Co. Ltd. | 262,615 | 5,551 |
| | Japan Lifeline Co. Ltd. | 705,964 | 5,546 |
| | Belc Co. Ltd. | 129,551 | 5,545 |
| | Nichiden Corp. | 268,838 | 5,537 |
| | Central Automotive Products Ltd. | 183,548 | 5,528 |
| *,1 | M&A Research Institute Holdings Inc. | 381,394 | 5,521 |
| | Kosaido Holdings Co. Ltd. | 1,582,300 | 5,515 |
| | Nomura Co. Ltd. | 1,087,887 | 5,512 |
| | Elecom Co. Ltd. | 582,185 | 5,488 |
| | Furuno Electric Co. Ltd. | 340,123 | 5,484 |
| | Fukushima Galilei Co. Ltd. | 151,509 | 5,471 |
| | Ringer Hut Co. Ltd. | 367,469 | 5,471 |
| | Nichicon Corp. | 836,848 | 5,466 |
| | Doutor Nichires Holdings Co. Ltd. | 372,086 | 5,456 |
| | Itoki Corp. | 573,000 | 5,455 |
| | Tokyotokeiba Co. Ltd. | 200,222 | 5,455 |
| | Happinet Corp. | 203,390 | 5,435 |
| | TPR Co. Ltd. | 360,784 | 5,431 |
Total International Stock Index Fund
| | | | | | Shares | Market
Value•
($000) |
| | Torishima Pump Manufacturing Co. Ltd. | 299,655 | 5,430 |
| 1 | Raksul Inc. | 642,158 | 5,410 |
| | Raysum Co. Ltd. | 140,100 | 5,375 |
| | Integrated Design & Engineering Holdings Co. Ltd. | 187,930 | 5,347 |
| | Tokyo Electron Device Ltd. | 241,552 | 5,346 |
| | First Bank of Toyama Ltd. | 736,362 | 5,332 |
| | Noritz Corp. | 455,270 | 5,275 |
| | Kameda Seika Co. Ltd. | 181,126 | 5,270 |
| | A&D HOLON Holdings Co. Ltd. | 367,600 | 5,260 |
| | Lifedrink Co. Inc. | 454,060 | 5,243 |
| | Kisoji Co. Ltd. | 344,989 | 5,240 |
| | Teikoku Sen-I Co. Ltd. | 287,303 | 5,240 |
| | One REIT Inc. | 3,404 | 5,228 |
| | Nishio Holdings Co. Ltd. | 214,682 | 5,226 |
| *,1 | PKSHA Technology Inc. | 227,154 | 5,225 |
| | Aoyama Trading Co. Ltd. | 608,837 | 5,221 |
| | Sumitomo Mitsui Construction Co. Ltd. | 2,054,018 | 5,221 |
| | Nagaileben Co. Ltd. | 347,988 | 5,221 |
| | I'll Inc. | 255,155 | 5,214 |
| 1 | Shoei Foods Corp. | 180,252 | 5,211 |
| | Nachi-Fujikoshi Corp. | 247,426 | 5,194 |
| | WingArc1st Inc. | 243,700 | 5,191 |
| | Sinanen Holdings Co. Ltd. | 122,269 | 5,187 |
| | Japan Pulp & Paper Co. Ltd. | 1,183,720 | 5,173 |
| | Vital KSK Holdings Inc. | 614,047 | 5,141 |
| | RS Technologies Co. Ltd. | 199,146 | 5,116 |
| 1 | TSI Holdings Co. Ltd. | 867,824 | 5,081 |
| | Shin-Etsu Polymer Co. Ltd. | 490,631 | 5,073 |
| | AZ-COM MARUWA Holdings Inc. | 751,879 | 5,073 |
| | JBCC Holdings Inc. | 175,900 | 5,073 |
| | United Arrows Ltd. | 355,625 | 5,067 |
| | TRE Holdings Corp. | 431,921 | 5,066 |
| | Prestige International Inc. | 1,126,177 | 5,034 |
| | Koshidaka Holdings Co. Ltd. | 641,231 | 5,030 |
| 1 | DyDo Group Holdings Inc. | 250,510 | 5,024 |
| | IDOM Inc. | 723,171 | 5,002 |
| | Sumitomo Riko Co. Ltd. | 490,850 | 4,998 |
| | Nippon Yakin Kogyo Co. Ltd. | 181,295 | 4,987 |
| | Onward Holdings Co. Ltd. | 1,459,325 | 4,983 |
| 1 | Nextage Co. Ltd. | 516,439 | 4,957 |
| | NPR-RIKEN Corp. | 322,578 | 4,953 |
| | Nippon Kanzai Holdings Co. Ltd. | 282,721 | 4,948 |
| | Shofu Inc. | 335,036 | 4,945 |
| | Uchida Yoko Co. Ltd. | 115,466 | 4,931 |
| | Hibiya Engineering Ltd. | 218,925 | 4,927 |
| | Bando Chemical Industries Ltd. | 414,307 | 4,910 |
| | Matsuyafoods Holdings Co. Ltd. | 110,743 | 4,909 |
| | Nippon Seiki Co. Ltd. | 626,626 | 4,900 |
| | Nikkiso Co. Ltd. | 726,592 | 4,884 |
| | Marusan Securities Co. Ltd. | 800,935 | 4,874 |
| | T-Gaia Corp. | 278,737 | 4,845 |
| | BML Inc. | 264,031 | 4,840 |
| | Anicom Holdings Inc. | 1,096,455 | 4,821 |
| | Daikokutenbussan Co. Ltd. | 69,433 | 4,811 |
| | Yurtec Corp. | 495,950 | 4,789 |
| | Tsugami Corp. | 515,590 | 4,776 |
| *,1 | RENOVA Inc. | 840,955 | 4,765 |
| | Genky DrugStores Co. Ltd. | 234,446 | 4,759 |
| | Mitsui DM Sugar Holdings Co. Ltd. | 222,854 | 4,751 |
| | Nittetsu Mining Co. Ltd. | 166,228 | 4,732 |
| | Cybozu Inc. | 344,317 | 4,728 |
| | Nippon Signal Co. Ltd. | 772,242 | 4,716 |
| *,1 | euglena Co. Ltd. | 1,726,458 | 4,702 |
| | Piolax Inc. | 295,519 | 4,684 |
| | Strike Co. Ltd. | 192,299 | 4,676 |
| | Plus Alpha Consulting Co. Ltd. | 334,274 | 4,673 |
| | Oiles Corp. | 356,539 | 4,640 |
| | SIGMAXYZ Holdings Inc. | 412,100 | 4,613 |
| | Joshin Denki Co. Ltd. | 274,014 | 4,610 |
| | Yamaichi Electronics Co. Ltd. | 275,899 | 4,609 |
Total International Stock Index Fund
| | | | | | Shares | Market
Value•
($000) |
| | Riken Vitamin Co. Ltd. | 261,901 | 4,585 |
| 1 | KeePer Technical Laboratory Co. Ltd. | 166,796 | 4,581 |
| 1 | Tama Home Co. Ltd. | 181,552 | 4,578 |
| | Iriso Electronics Co. Ltd. | 257,338 | 4,573 |
| | Meisei Industrial Co. Ltd. | 538,608 | 4,572 |
| | Aichi Steel Corp. | 162,100 | 4,570 |
| | Optex Group Co. Ltd. | 427,050 | 4,542 |
| | Sun Frontier Fudousan Co. Ltd. | 380,927 | 4,522 |
| | Roland Corp. | 176,739 | 4,521 |
| | Orient Corp. | 760,612 | 4,520 |
| 1 | United Super Markets Holdings Inc. | 825,506 | 4,520 |
| | Asahi Yukizai Corp. | 169,357 | 4,518 |
| | Toho Bank Ltd. | 2,631,323 | 4,514 |
| | Altech Corp. | 249,300 | 4,513 |
| | Ryobi Ltd. | 364,848 | 4,508 |
| | TechMatrix Corp. | 310,513 | 4,507 |
| 1 | Toyo Gosei Co. Ltd. | 96,534 | 4,500 |
| | Aeon Hokkaido Corp. | 763,846 | 4,496 |
| | S Foods Inc. | 245,839 | 4,488 |
| | Furukawa Co. Ltd. | 412,017 | 4,475 |
| | Ishihara Sangyo Kaisha Ltd. | 467,186 | 4,471 |
| | Comture Corp. | 295,468 | 4,463 |
| | Torii Pharmaceutical Co. Ltd. | 164,894 | 4,461 |
| 1 | West Holdings Corp. | 298,700 | 4,445 |
| | ESPEC Corp. | 254,346 | 4,433 |
| | Keihanshin Building Co. Ltd. | 453,767 | 4,424 |
| | Takara Bio Inc. | 662,320 | 4,414 |
| | Oyo Corp. | 263,920 | 4,399 |
| | Axial Retailing Inc. | 750,836 | 4,380 |
| 1 | Change Holdings Inc. | 555,689 | 4,368 |
| | Tachi-S Co. Ltd. | 377,270 | 4,356 |
| | eGuarantee Inc. | 439,084 | 4,351 |
| | Digital Arts Inc. | 127,478 | 4,339 |
| | Valqua Ltd. | 201,622 | 4,326 |
| | Transaction Co. Ltd. | 266,500 | 4,314 |
| | CTI Engineering Co. Ltd. | 145,400 | 4,294 |
| | Procrea Holdings Inc. | 372,683 | 4,292 |
| 1 | Hakuto Co. Ltd. | 144,959 | 4,264 |
| | Avex Inc. | 433,097 | 4,262 |
| | Okinawa Electric Power Co. Inc. | 624,420 | 4,247 |
| | Tenma Corp. | 221,244 | 4,232 |
| | Doshisha Co. Ltd. | 292,743 | 4,223 |
| | Tsukishima Holdings Co. Ltd. | 469,077 | 4,210 |
| | Curves Holdings Co. Ltd. | 794,530 | 4,205 |
| | Eagle Industry Co. Ltd. | 317,093 | 4,201 |
| | Oita Bank Ltd. | 206,082 | 4,184 |
| | Obara Group Inc. | 150,118 | 4,155 |
| | Komori Corp. | 574,194 | 4,153 |
| | Press Kogyo Co. Ltd. | 1,148,969 | 4,131 |
| | Avant Group Corp. | 293,200 | 4,130 |
| | Enplas Corp. | 92,893 | 4,122 |
| | Nippon Carbon Co. Ltd. | 140,561 | 4,121 |
| | Hosokawa Micron Corp. | 157,348 | 4,113 |
| * | Chiyoda Corp. | 2,139,983 | 4,111 |
| | Zuken Inc. | 173,465 | 4,110 |
| | Starzen Co. Ltd. | 211,706 | 4,104 |
| | MEC Co. Ltd. | 174,170 | 4,098 |
| | Japan Transcity Corp. | 678,586 | 4,091 |
| | Shin Nippon Air Technologies Co. Ltd. | 186,714 | 4,073 |
| | Osaka Organic Chemical Industry Ltd. | 212,655 | 4,073 |
| | Iwaki Co. Ltd. | 217,400 | 4,069 |
| | Riken Technos Corp. | 597,435 | 4,066 |
| | Nippon Ceramic Co. Ltd. | 240,256 | 4,060 |
| | Aisan Industry Co. Ltd. | 457,281 | 4,046 |
| | Aida Engineering Ltd. | 780,577 | 4,042 |
| | Sagami Holdings Corp. | 348,241 | 4,041 |
| | Mirai Industry Co. Ltd. | 172,546 | 4,039 |
| 1 | FP Partner Inc. | 211,034 | 4,037 |
| | Sakai Moving Service Co. Ltd. | 249,568 | 4,032 |
| | VT Holdings Co. Ltd. | 1,309,656 | 4,022 |
Total International Stock Index Fund
| | | | | | Shares | Market
Value•
($000) |
| | Bell System24 Holdings Inc. | 464,874 | 4,022 |
| | Septeni Holdings Co. Ltd. | 1,372,900 | 4,015 |
| | Kyokuyo Co. Ltd. | 147,068 | 3,984 |
| | Yamanashi Chuo Bank Ltd. | 373,210 | 3,979 |
| | Fujibo Holdings Inc. | 129,785 | 3,978 |
| | SBS Holdings Inc. | 242,031 | 3,976 |
| | Sato Holdings Corp. | 284,120 | 3,962 |
| | Canon Electronics Inc. | 250,032 | 3,947 |
| | Takamatsu Construction Group Co. Ltd. | 203,164 | 3,936 |
| | Broadleaf Co. Ltd. | 1,062,668 | 3,932 |
| | AOKI Holdings Inc. | 506,780 | 3,929 |
| | Sintokogio Ltd. | 599,753 | 3,928 |
| 1 | Starts Proceed Investment Corp. | 3,423 | 3,921 |
| 1 | Sumiseki Holdings Inc. | 636,400 | 3,913 |
| | Sala Corp. | 702,600 | 3,888 |
| | Shinagawa Refractories Co. Ltd. | 333,900 | 3,887 |
| | Chori Co. Ltd. | 144,547 | 3,874 |
| | Tachibana Eletech Co. Ltd. | 234,508 | 3,871 |
| | Sanyo Special Steel Co. Ltd. | 312,404 | 3,862 |
| | NS United Kaiun Kaisha Ltd. | 136,103 | 3,851 |
| | TOA Road Corp. | 466,735 | 3,851 |
| | Raiznext Corp. | 375,262 | 3,843 |
| | Tokyu Construction Co. Ltd. | 848,930 | 3,837 |
| 1 | Kappa Create Co. Ltd. | 359,761 | 3,836 |
| | TV Asahi Holdings Corp. | 294,509 | 3,833 |
| | Tamura Corp. | 1,057,588 | 3,832 |
| | Nissin Corp. | 136,769 | 3,825 |
| | Tokai Corp. | 268,257 | 3,821 |
| 1 | Yamae Group Holdings Co. Ltd. | 297,900 | 3,806 |
| | Anest Iwata Corp. | 411,358 | 3,789 |
| | Pack Corp. | 154,468 | 3,780 |
| | K&O Energy Group Inc. | 181,890 | 3,775 |
| | ASKA Pharmaceutical Holdings Co. Ltd. | 265,959 | 3,773 |
| | Retail Partners Co. Ltd. | 440,080 | 3,760 |
| | Asanuma Corp. | 866,300 | 3,758 |
| | Saibu Gas Holdings Co. Ltd. | 320,597 | 3,755 |
| | Okinawa Financial Group Inc. | 254,671 | 3,748 |
| | Hirata Corp. | 117,366 | 3,743 |
| | Mandom Corp. | 454,264 | 3,742 |
| | Computer Engineering & Consulting Ltd. | 316,464 | 3,728 |
| | JP-Holdings Inc. | 792,102 | 3,726 |
| | Hokuto Corp. | 311,814 | 3,723 |
| | Kamei Corp. | 288,856 | 3,719 |
| | Kanto Denka Kogyo Co. Ltd. | 580,202 | 3,690 |
| | Goldcrest Co. Ltd. | 189,188 | 3,687 |
| | Asahi Diamond Industrial Co. Ltd. | 661,745 | 3,679 |
| | Mirarth Holdings Inc. | 1,144,739 | 3,679 |
| | Miyaji Engineering Group Inc. | 279,310 | 3,649 |
| | Teikoku Electric Manufacturing Co. Ltd. | 196,895 | 3,647 |
| 1 | ESCON Japan REIT Investment Corp. | 4,790 | 3,647 |
| | Hokuetsu Industries Co. Ltd. | 295,700 | 3,647 |
| 1 | HI-LEX Corp. | 361,798 | 3,646 |
| | Unipres Corp. | 498,656 | 3,625 |
| 1 | Tosei REIT Investment Corp. | 4,381 | 3,625 |
| | Sanyo Chemical Industries Ltd. | 133,380 | 3,618 |
| | ES-Con Japan Ltd. | 560,865 | 3,614 |
| | Oriental Shiraishi Corp. | 1,441,915 | 3,614 |
| 1 | Komehyo Holdings Co. Ltd. | 145,700 | 3,610 |
| | Dainichiseika Color & Chemicals Manufacturing Co. Ltd. | 187,821 | 3,603 |
| | JAC Recruitment Co. Ltd. | 751,804 | 3,602 |
| | Arisawa Manufacturing Co. Ltd. | 393,200 | 3,591 |
| | Bank of the Ryukyus Ltd. | 549,753 | 3,586 |
| | Insource Co. Ltd. | 572,150 | 3,586 |
| | METAWATER Co. Ltd. | 309,443 | 3,580 |
| | Mars Group Holdings Corp. | 173,932 | 3,579 |
| | JCR Pharmaceuticals Co. Ltd. | 797,275 | 3,565 |
| | Samty Residential Investment Corp. | 5,772 | 3,564 |
| 1 | OSAKA Titanium Technologies Co. Ltd. | 253,808 | 3,558 |
| | JM Holdings Co. Ltd. | 181,368 | 3,539 |
| | Futaba Industrial Co. Ltd. | 827,593 | 3,531 |
Total International Stock Index Fund
| | | | | | Shares | Market
Value•
($000) |
| | GLOBERIDE Inc. | 271,498 | 3,523 |
| 1 | J Trust Co. Ltd. | 1,192,447 | 3,520 |
| | Health Care & Medical Investment Corp. | 4,907 | 3,520 |
| | Genki Global Dining Concepts Corp. | 135,783 | 3,517 |
| | Katakura Industries Co. Ltd. | 268,866 | 3,506 |
| | Halows Co. Ltd. | 125,293 | 3,503 |
| | Sumitomo Seika Chemicals Co. Ltd. | 105,456 | 3,501 |
| | gremz Inc. | 205,100 | 3,488 |
| | Tonami Holdings Co. Ltd. | 90,689 | 3,486 |
| | Krosaki Harima Corp. | 216,560 | 3,470 |
| | Shizuoka Gas Co. Ltd. | 515,873 | 3,460 |
| | Kurimoto Ltd. | 138,433 | 3,438 |
| | Vision Inc. | 497,285 | 3,420 |
| | Miyazaki Bank Ltd. | 195,822 | 3,393 |
| | Yamagata Bank Ltd. | 537,281 | 3,392 |
| | Pasona Group Inc. | 257,141 | 3,390 |
| | Seikitokyu Kogyo Co. Ltd. | 347,300 | 3,385 |
| | Denyo Co. Ltd. | 203,700 | 3,373 |
| | Kyoei Steel Ltd. | 296,935 | 3,367 |
| | Daiwa Industries Ltd. | 355,304 | 3,361 |
| | J-Oil Mills Inc. | 248,151 | 3,360 |
| | San ju San Financial Group Inc. | 304,746 | 3,353 |
| | Chubu Steel Plate Co. Ltd. | 213,200 | 3,350 |
| | Alconix Corp. | 371,518 | 3,337 |
| | Shinnihon Corp. | 332,280 | 3,334 |
| | Chofu Seisakusho Co. Ltd. | 259,286 | 3,329 |
| | Ehime Bank Ltd. | 488,379 | 3,315 |
| | Matsuda Sangyo Co. Ltd. | 159,251 | 3,305 |
| | Siix Corp. | 450,535 | 3,298 |
| | Yokorei Co. Ltd. | 544,764 | 3,295 |
| | Osaka Steel Co. Ltd. | 152,791 | 3,279 |
| | Sakai Chemical Industry Co. Ltd. | 183,348 | 3,269 |
| | Fukui Bank Ltd. | 281,055 | 3,263 |
| | Yahagi Construction Co. Ltd. | 330,067 | 3,259 |
| | Maezawa Kyuso Industries Co. Ltd. | 399,779 | 3,254 |
| | Sankei Real Estate Inc. | 6,258 | 3,252 |
| | Pressance Corp. | 262,631 | 3,251 |
| | Geo Holdings Corp. | 324,820 | 3,244 |
| | Yondoshi Holdings Inc. | 268,144 | 3,240 |
| | Fujicco Co. Ltd. | 285,097 | 3,214 |
| 1 | Ise Chemicals Corp. | 25,100 | 3,213 |
| | Aizawa Securities Group Co. Ltd. | 299,189 | 3,199 |
| | Santec Holdings Corp. | 87,806 | 3,186 |
| | Cosel Co. Ltd. | 395,024 | 3,177 |
| | Itochu-Shokuhin Co. Ltd. | 70,550 | 3,175 |
| | Elematec Corp. | 203,571 | 3,173 |
| * | eRex Co. Ltd. | 775,128 | 3,173 |
| *,1 | SRE Holdings Corp. | 127,269 | 3,171 |
| *,1 | Miyakoshi Holdings Inc. | 268,400 | 3,147 |
| | Stella Chemifa Corp. | 105,824 | 3,130 |
| | Bank of Iwate Ltd. | 208,363 | 3,125 |
| | SRA Holdings | 111,531 | 3,111 |
| | MARUKA FURUSATO Corp. | 216,253 | 3,111 |
| | Chubu Shiryo Co. Ltd. | 338,424 | 3,093 |
| | Nissei ASB Machine Co. Ltd. | 101,873 | 3,092 |
| * | Nippon Sheet Glass Co. Ltd. | 1,264,102 | 3,075 |
| | G-Tekt Corp. | 298,895 | 3,070 |
| | Daikyonishikawa Corp. | 735,638 | 3,066 |
| 1 | PHC Holdings Corp. | 470,689 | 3,066 |
| | Aiphone Co. Ltd. | 157,702 | 3,058 |
| | Marudai Food Co. Ltd. | 277,057 | 3,051 |
| | Chiyoda Integre Co. Ltd. | 138,244 | 3,044 |
| | Nippon Parking Development Co. Ltd. | 2,062,338 | 3,043 |
| | Godo Steel Ltd. | 119,185 | 3,036 |
| | Miroku Jyoho Service Co. Ltd. | 254,301 | 3,029 |
| | Sanyo Electric Railway Co. Ltd. | 227,920 | 3,026 |
| | Topy Industries Ltd. | 238,694 | 3,025 |
| | Toho Titanium Co. Ltd. | 456,586 | 3,019 |
| | World Co. Ltd. | 239,326 | 3,004 |
| | Yokowo Co. Ltd. | 300,479 | 2,997 |
Total International Stock Index Fund
| | | | | | Shares | Market
Value•
($000) |
| | Seika Corp. | 118,634 | 2,994 |
| | Nippon Fine Chemical Co. Ltd. | 191,500 | 2,992 |
| | Belluna Co. Ltd. | 640,497 | 2,983 |
| | France Bed Holdings Co. Ltd. | 361,484 | 2,980 |
| | Tanseisha Co. Ltd. | 563,532 | 2,975 |
| | Daito Pharmaceutical Co. Ltd. | 202,041 | 2,952 |
| | Shibusawa Warehouse Co. Ltd. | 142,681 | 2,936 |
| | Fukuda Corp. | 78,195 | 2,930 |
| | Japan Investment Adviser Co. Ltd. | 437,400 | 2,926 |
| | Seikagaku Corp. | 510,460 | 2,925 |
| | Shikoku Bank Ltd. | 477,185 | 2,921 |
| 1 | Rock Field Co. Ltd. | 304,960 | 2,912 |
| | Hoosiers Holdings Co. Ltd. | 439,608 | 2,911 |
| | Nafco Co. Ltd. | 214,500 | 2,898 |
| 1 | Weathernews Inc. | 73,472 | 2,896 |
| | Toyo Corp. | 280,950 | 2,895 |
| | Cawachi Ltd. | 173,762 | 2,879 |
| *,1 | Fujio Food Group Inc. | 315,780 | 2,876 |
| 1 | Daikoku Denki Co. Ltd. | 131,400 | 2,875 |
| | Akita Bank Ltd. | 210,349 | 2,872 |
| | Shima Seiki Manufacturing Ltd. | 385,864 | 2,872 |
| | Gakken Holdings Co. Ltd. | 440,173 | 2,868 |
| 1 | Key Coffee Inc. | 216,085 | 2,863 |
| | Toenec Corp. | 459,600 | 2,861 |
| | Matsuya Co. Ltd. | 525,337 | 2,860 |
| | Onoken Co. Ltd. | 291,155 | 2,853 |
| | BRONCO BILLY Co. Ltd. | 116,560 | 2,852 |
| | Hokkaido Gas Co. Ltd. | 741,725 | 2,848 |
| | Gree Inc. | 933,805 | 2,847 |
| | Toyo Kanetsu KK | 97,414 | 2,845 |
| | Neturen Co. Ltd. | 431,335 | 2,809 |
| | KAWADA TECHNOLOGIES Inc. | 179,833 | 2,804 |
| | Alpen Co. Ltd. | 208,002 | 2,791 |
| *,1 | Oisix ra daichi Inc. | 338,483 | 2,791 |
| | Xebio Holdings Co. Ltd. | 369,072 | 2,790 |
| | Koa Corp. | 420,898 | 2,787 |
| | ZIGExN Co. Ltd. | 736,800 | 2,778 |
| | LEC Inc. | 320,790 | 2,761 |
| | St. Marc Holdings Co. Ltd. | 180,878 | 2,752 |
| | Ki-Star Real Estate Co. Ltd. | 108,200 | 2,746 |
| | Shinwa Co. Ltd. | 155,776 | 2,735 |
| | Kenko Mayonnaise Co. Ltd. | 191,385 | 2,728 |
| | MTI Ltd. | 364,331 | 2,717 |
| | Sumida Corp. | 441,394 | 2,714 |
| | Daiki Aluminium Industry Co. Ltd. | 374,352 | 2,710 |
| | Chiyoda Co. Ltd. | 310,478 | 2,705 |
| | Honeys Holdings Co. Ltd. | 244,678 | 2,700 |
| | Osaki Electric Co. Ltd. | 520,309 | 2,692 |
| * | Istyle Inc. | 940,643 | 2,683 |
| | Tokushu Tokai Paper Co. Ltd. | 108,388 | 2,663 |
| | Nippon Road Co. Ltd. | 249,590 | 2,662 |
| | Softcreate Holdings Corp. | 187,626 | 2,659 |
| | Universal Entertainment Corp. | 311,400 | 2,653 |
| | Sodick Co. Ltd. | 525,743 | 2,650 |
| | Proto Corp. | 284,662 | 2,649 |
| 1 | JSB Co. Ltd. | 149,800 | 2,647 |
| | Ryoden Corp. | 166,000 | 2,639 |
| | Mitsuba Corp. | 462,915 | 2,637 |
| | FULLCAST Holdings Co. Ltd. | 261,365 | 2,629 |
| | Daiho Corp. | 114,849 | 2,626 |
| | Qol Holdings Co. Ltd. | 282,132 | 2,626 |
| | Okabe Co. Ltd. | 516,098 | 2,618 |
| | Fixstars Corp. | 278,115 | 2,606 |
| | KPP Group Holdings Co. Ltd. | 605,209 | 2,597 |
| | Ines Corp. | 255,765 | 2,595 |
| | Aichi Corp. | 332,120 | 2,592 |
| | Nippon Denko Co. Ltd. | 1,349,547 | 2,585 |
| * | Management Solutions Co. Ltd. | 208,738 | 2,584 |
| | m-up Holdings Inc. | 298,600 | 2,577 |
| | Wellneo Sugar Co. Ltd. | 174,161 | 2,544 |
Total International Stock Index Fund
| | | | | | Shares | Market
Value•
($000) |
| | Link & Motivation Inc. | 699,073 | 2,541 |
| | Hochiki Corp. | 182,621 | 2,539 |
| | Warabeya Nichiyo Holdings Co. Ltd. | 188,422 | 2,538 |
| | TOC Co. Ltd. | 636,591 | 2,537 |
| | Macromill Inc. | 474,748 | 2,509 |
| | Nippon Television Holdings Inc. | 162,500 | 2,496 |
| | Okuwa Co. Ltd. | 419,021 | 2,493 |
| | M&A Capital Partners Co. Ltd. | 175,182 | 2,485 |
| | NEC Capital Solutions Ltd. | 102,099 | 2,484 |
| | Shinko Shoji Co. Ltd. | 390,329 | 2,459 |
| | Kyokuto Securities Co. Ltd. | 295,695 | 2,451 |
| | Tsubaki Nakashima Co. Ltd. | 542,554 | 2,444 |
| | Rheon Automatic Machinery Co. Ltd. | 262,244 | 2,437 |
| | Base Co. Ltd. | 126,088 | 2,433 |
| | Fujiya Co. Ltd. | 138,283 | 2,411 |
| | GMO Financial Holdings Inc. | 574,900 | 2,402 |
| | Nippon Thompson Co. Ltd. | 765,699 | 2,397 |
| | Mie Kotsu Group Holdings Inc. | 717,819 | 2,374 |
| | Software Service Inc. | 28,500 | 2,369 |
| | Imperial Hotel Ltd. | 402,300 | 2,366 |
| | Nitto Kohki Co. Ltd. | 139,121 | 2,348 |
| | Carta Holdings Inc. | 248,600 | 2,339 |
| | Zenrin Co. Ltd. | 441,549 | 2,337 |
| | Dai Nippon Toryo Co. Ltd. | 349,371 | 2,332 |
| | Nihon Nohyaku Co. Ltd. | 531,073 | 2,315 |
| | Mitsubishi Research Institute Inc. | 83,124 | 2,297 |
| | Tayca Corp. | 213,480 | 2,286 |
| | Ichikoh Industries Ltd. | 765,374 | 2,275 |
| | Tochigi Bank Ltd. | 1,345,380 | 2,275 |
| | Sparx Group Co. Ltd. | 251,531 | 2,265 |
| | DKS Co. Ltd. | 101,388 | 2,260 |
| | Ichiyoshi Securities Co. Ltd. | 447,786 | 2,247 |
| | Moriroku Holdings Co. Ltd. | 145,690 | 2,236 |
| | Hodogaya Chemical Co. Ltd. | 79,084 | 2,232 |
| | Daido Metal Co. Ltd. | 688,152 | 2,228 |
| | Icom Inc. | 117,297 | 2,211 |
| | Nippon Beet Sugar Manufacturing Co. Ltd. | 132,766 | 2,203 |
| | Artnature Inc. | 404,295 | 2,201 |
| | CMK Corp. | 828,954 | 2,195 |
| | Komatsu Matere Co. Ltd. | 410,472 | 2,191 |
| | Taki Chemical Co. Ltd. | 90,555 | 2,191 |
| | Shinsho Corp. | 53,924 | 2,189 |
| | FIDEA Holdings Co. Ltd. | 236,338 | 2,180 |
| | Giken Ltd. | 190,321 | 2,178 |
| 1 | Elan Corp. | 380,580 | 2,165 |
| 1 | Shin Nippon Biomedical Laboratories Ltd. | 267,904 | 2,163 |
| 1 | Nittoku Co. Ltd. | 194,500 | 2,148 |
| | G-7 Holdings Inc. | 226,666 | 2,123 |
| | JSP Corp. | 165,438 | 2,115 |
| | Inageya Co. Ltd. | 278,851 | 2,106 |
| | Akatsuki Inc. | 152,017 | 2,104 |
| * | COLOPL Inc. | 605,174 | 2,101 |
| | Vector Inc. | 336,989 | 2,096 |
| | Pharma Foods International Co. Ltd. | 332,248 | 2,080 |
| * | Nippon Chemi-Con Corp. | 301,135 | 2,078 |
| | Feed One Co. Ltd. | 373,489 | 2,072 |
| | Kyosan Electric Manufacturing Co. Ltd. | 586,469 | 2,063 |
| | JDC Corp. | 611,309 | 2,063 |
| | Bank of Saga Ltd. | 153,167 | 2,062 |
| | Fudo Tetra Corp. | 148,629 | 2,060 |
| | Koatsu Gas Kogyo Co. Ltd. | 345,938 | 2,056 |
| | Marvelous Inc. | 537,089 | 2,055 |
| | Tekken Corp. | 128,646 | 2,013 |
| | Yorozu Corp. | 260,310 | 2,003 |
| | Rokko Butter Co. Ltd. | 213,888 | 1,990 |
| 1 | YA-MAN Ltd. | 359,168 | 1,982 |
| | Riso Kyoiku Co. Ltd. | 1,066,782 | 1,966 |
| | V Technology Co. Ltd. | 124,471 | 1,953 |
| 1 | Kojima Co. Ltd. | 273,792 | 1,898 |
| | Toa Corp. (XTKS) | 296,666 | 1,888 |
Total International Stock Index Fund
| | | | | | Shares | Market
Value•
($000) |
| | Tomoku Co. Ltd. | 123,590 | 1,872 |
| * | PIA Corp. | 91,311 | 1,871 |
| | CTS Co. Ltd. | 311,985 | 1,858 |
| | Okura Industrial Co. Ltd. | 104,658 | 1,854 |
| | YAKUODO Holdings Co. Ltd. | 132,538 | 1,843 |
| | Sankyo Tateyama Inc. | 377,679 | 1,841 |
| | Nichiban Co. Ltd. | 141,256 | 1,811 |
| | Solasto Corp. | 560,355 | 1,791 |
| | Alpha Systems Inc. | 85,528 | 1,789 |
| | Tokyo Energy & Systems Inc. | 241,520 | 1,789 |
| 1 | Ministop Co. Ltd. | 156,638 | 1,784 |
| * | Pacific Metals Co. Ltd. | 199,878 | 1,780 |
| | Chuo Spring Co. Ltd. | 221,225 | 1,777 |
| | S-Pool Inc. | 746,944 | 1,772 |
| | Kanaden Corp. | 184,843 | 1,766 |
| | DKK Co. Ltd. | 139,794 | 1,765 |
| | Midac Holdings Co. Ltd. | 146,190 | 1,763 |
| | Towa Bank Ltd. | 465,921 | 1,757 |
| 1 | Gamecard-Joyco Holdings Inc. | 135,500 | 1,755 |
| | Kanagawa Chuo Kotsu Co. Ltd. | 81,685 | 1,752 |
| | Intage Holdings Inc. | 165,401 | 1,726 |
| | Arakawa Chemical Industries Ltd. | 197,885 | 1,716 |
| | Central Security Patrols Co. Ltd. | 93,714 | 1,709 |
| | Takaoka Toko Co. Ltd. | 133,552 | 1,702 |
| 1 | LITALICO Inc. | 238,166 | 1,701 |
| | Hisaka Works Ltd. | 260,799 | 1,700 |
| | Shindengen Electric Manufacturing Co. Ltd. | 108,671 | 1,700 |
| | Fuji Pharma Co. Ltd. | 198,497 | 1,694 |
| *,1 | Kourakuen Corp. | 205,217 | 1,683 |
| | EM Systems Co. Ltd. | 479,491 | 1,678 |
| | Sankyo Seiko Co. Ltd. | 428,767 | 1,657 |
| | Tv Tokyo Holdings Corp. | 73,882 | 1,654 |
| *,1 | giftee Inc. | 269,200 | 1,644 |
| | Yukiguni Maitake Co. Ltd. | 239,044 | 1,640 |
| * | Gurunavi Inc. | 804,000 | 1,632 |
| | Kintetsu Department Store Co. Ltd. | 119,278 | 1,625 |
| | Advan Group Co. Ltd. | 263,772 | 1,623 |
| | WATAMI Co. Ltd. | 231,805 | 1,619 |
| | ST Corp. | 165,079 | 1,605 |
| | Kyodo Printing Co. Ltd. | 71,740 | 1,598 |
| *,1 | Sourcenext Corp. | 1,100,215 | 1,594 |
| | Fuso Pharmaceutical Industries Ltd. | 95,427 | 1,588 |
| | Maxvalu Tokai Co. Ltd. | 73,932 | 1,582 |
| | Furukawa Battery Co. Ltd. | 175,704 | 1,579 |
| | Fukui Computer Holdings Inc. | 89,428 | 1,577 |
| | Ebase Co. Ltd. | 373,436 | 1,576 |
| | Studio Alice Co. Ltd. | 115,687 | 1,552 |
| *,1 | W-Scope Corp. | 663,652 | 1,541 |
| | CAC Holdings Corp. | 134,644 | 1,532 |
| 1 | Aeon Fantasy Co. Ltd. | 87,424 | 1,527 |
| | Daisyo Corp. | 222,393 | 1,521 |
| *,1 | Demae-Can Co. Ltd. | 967,200 | 1,519 |
| *,1 | Remixpoint Inc. | 1,535,837 | 1,510 |
| | Sanoh Industrial Co. Ltd. | 317,394 | 1,507 |
| | Pronexus Inc. | 175,349 | 1,488 |
| | Yamashin-Filter Corp. | 484,996 | 1,477 |
| | ValueCommerce Co. Ltd. | 207,007 | 1,476 |
| | Nihon Tokushu Toryo Co. Ltd. | 194,725 | 1,471 |
| | Sanshin Electronics Co. Ltd. | 109,705 | 1,462 |
| | Hokkan Holdings Ltd. | 125,903 | 1,420 |
| | Achilles Corp. | 143,074 | 1,415 |
| | Futaba Corp. | 423,667 | 1,413 |
| | Nihon Chouzai Co. Ltd. | 153,962 | 1,407 |
| | World Holdings Co. Ltd. | 109,483 | 1,367 |
| | Digital Holdings Inc. | 205,480 | 1,344 |
| | Shimizu Bank Ltd. | 143,879 | 1,340 |
| | Nippon Coke & Engineering Co. Ltd. | 2,120,686 | 1,325 |
| * | Net Protections Holdings Inc. | 562,700 | 1,323 |
| | Nippon Sharyo Ltd. | 91,993 | 1,319 |
| | Asahi Co. Ltd. | 130,396 | 1,308 |
Total International Stock Index Fund
| | | | | | Shares | Market
Value•
($000) |
| | Oro Co. Ltd. | 83,683 | 1,306 |
| * | Jamco Corp. | 159,891 | 1,302 |
| | I-PEX Inc. | 126,550 | 1,301 |
| *,1 | Japan Display Inc. | 9,015,514 | 1,295 |
| 1 | Inaba Seisakusho Co. Ltd. | 110,342 | 1,284 |
| * | KNT-CT Holdings Co. Ltd. | 151,843 | 1,272 |
| 1 | Central Sports Co. Ltd. | 79,194 | 1,270 |
| | Mimasu Semiconductor Industry Co. Ltd. | 52,281 | 1,261 |
| | Kanamic Network Co. Ltd. | 351,700 | 1,252 |
| *,1 | TerraSky Co. Ltd. | 103,065 | 1,248 |
| | Nippon Rietec Co. Ltd. | 180,002 | 1,224 |
| | Nisso Holdings Co. Ltd. | 224,517 | 1,212 |
| | GMO GlobalSign Holdings KK | 66,142 | 1,209 |
| | Nihon Trim Co. Ltd. | 52,483 | 1,205 |
| | FAN Communications Inc. | 444,196 | 1,205 |
| 1 | Kitanotatsujin Corp. | 1,151,561 | 1,193 |
| | Taisei Lamick Co. Ltd. | 70,181 | 1,187 |
| | Nakayama Steel Works Ltd. | 234,714 | 1,157 |
| 1 | Ohara Inc. | 135,380 | 1,141 |
| | SBI ARUHI Corp. | 215,427 | 1,141 |
| | Iseki & Co. Ltd. | 176,526 | 1,139 |
| | Inui Global Logistics Co. Ltd. | 154,746 | 1,132 |
| 1 | Takatori Corp. | 72,000 | 1,124 |
| | Melco Holdings Inc. | 68,470 | 1,094 |
| | WDB Holdings Co. Ltd. | 97,499 | 1,094 |
| | Cleanup Corp. | 227,510 | 1,074 |
| | Yushin Precision Equipment Co. Ltd. | 243,860 | 1,061 |
| | Amuse Inc. | 117,922 | 1,049 |
| | Taiho Kogyo Co. Ltd. | 262,688 | 1,048 |
| *,1 | Airtrip Corp. | 153,912 | 1,040 |
| | Tsutsumi Jewelry Co. Ltd. | 73,899 | 1,025 |
| | Shimojima Co. Ltd. | 117,303 | 1,013 |
| | BrainPad Inc. | 190,223 | 1,003 |
| | Atrae Inc. | 190,634 | 968 |
| * | Gunosy Inc. | 205,307 | 945 |
| * | Optim Corp. | 237,769 | 923 |
| 1 | Abalance Corp. | 155,300 | 913 |
| | Airport Facilities Co. Ltd. | 239,260 | 911 |
| | Corona Corp. Class A | 146,695 | 902 |
| | Japan Medical Dynamic Marketing Inc. | 205,720 | 839 |
| 1 | CHIMNEY Co. Ltd. | 101,308 | 829 |
| | Medical Data Vision Co. Ltd. | 241,683 | 815 |
| * | LIFULL Co. Ltd. | 834,555 | 799 |
| | Tosho Co. Ltd. | 178,618 | 790 |
| | Tess Holdings Co. Ltd. | 409,800 | 753 |
| | Gecoss Corp. | 117,542 | 742 |
| | Sekisui Kasei Co. Ltd. | 293,806 | 714 |
| | Media Do Co. Ltd. | 80,500 | 706 |
| *,1 | Open Door Inc. | 155,953 | 700 |
| * | FDK Corp. | 159,222 | 664 |
| * | Shimadaya Corp. | 68,470 | 664 |
| 1 | Fibergate Inc. | 101,146 | 662 |
| | Takamiya Co. Ltd. | 210,661 | 610 |
| | IR Japan Holdings Ltd. | 110,950 | 610 |
| * | Tatsuta Electric Wire & Cable Co. Ltd. | 117,464 | 602 |
| | Tokyo Individualized Educational Institute Inc. | 213,449 | 560 |
| | | | | | | 67,128,956 |
| Kuwait (0.2%) |
| | Kuwait Finance House KSCP | 158,369,217 | 371,812 |
| | National Bank of Kuwait SAKP | 109,718,656 | 303,823 |
| | Mobile Telecommunications Co. KSCP | 31,179,946 | 46,385 |
| | Boubyan Bank KSCP | 19,216,087 | 34,939 |
| | Gulf Bank KSCP | 29,469,982 | 30,130 |
| | Mabanee Co. KPSC | 9,266,812 | 25,230 |
| | National Industries Group Holding SAK | 25,944,602 | 20,311 |
| | Agility Public Warehousing Co. KSC | 21,645,182 | 17,565 |
| | Al Ahli Bank of Kuwait KSCP | 14,400,173 | 13,146 |
| | Boubyan Petrochemicals Co. KSCP | 5,440,271 | 11,876 |
| | Humansoft Holding Co. KSC | 1,367,631 | 11,644 |
Total International Stock Index Fund
| | | | | | Shares | Market
Value•
($000) |
| * | Warba Bank KSCP | 16,308,600 | 10,137 |
| | Boursa Kuwait Securities Co. KPSC | 1,344,936 | 9,343 |
| | Commercial Real Estate Co. KSC | 19,337,057 | 9,267 |
| | Kuwait Real Estate Co. KSC | 11,402,140 | 8,879 |
| * | Kuwait Projects Co. Holding KSCP | 26,264,973 | 8,568 |
| | Salhia Real Estate Co. KSCP | 5,919,942 | 8,310 |
| | Kuwait Telecommunications Co. | 4,459,273 | 8,172 |
| | Burgan Bank SAK | 13,502,971 | 8,121 |
| | Kuwait International Bank KSCP | 12,882,880 | 8,007 |
| | Gulf Cables & Electrical Industries Group Co. KSCP | 1,399,443 | 7,587 |
| | Integrated Holding Co. KCSC | 2,410,865 | 4,007 |
| * | National Real Estate Co. KPSC | 15,422,762 | 3,908 |
| * | Jazeera Airways Co. KSCP | 1,136,931 | 3,821 |
| * | Alimtiaz Investment Group KSC | 14,456,879 | 2,270 |
| | | | | | | 987,258 |
| Malaysia (0.6%) |
| | Malayan Banking Bhd. | 105,785,768 | 253,337 |
| | CIMB Group Holdings Bhd. | 116,373,623 | 211,024 |
| | Public Bank Bhd. | 207,334,115 | 208,637 |
| | Tenaga Nasional Bhd. | 63,829,150 | 204,198 |
| | IHH Healthcare Bhd. | 42,328,102 | 70,050 |
| | Gamuda Bhd. | 34,765,712 | 67,493 |
| | Press Metal Aluminium Holdings Bhd. | 51,854,988 | 55,810 |
| | SD Guthrie Bhd. | 50,775,369 | 53,248 |
| | Petronas Gas Bhd. | 13,375,512 | 52,704 |
| | MISC Bhd. | 29,794,902 | 50,965 |
| | Petronas Chemicals Group Bhd. | 39,457,658 | 48,598 |
| | AMMB Holdings Bhd. | 38,280,720 | 44,441 |
| | Celcomdigi Bhd. | 55,405,880 | 42,970 |
| | RHB Bank Bhd. | 28,458,069 | 41,597 |
| | Hong Leong Bank Bhd. | 8,591,282 | 40,081 |
| | Kuala Lumpur Kepong Bhd. | 7,906,344 | 38,522 |
| | Malaysia Airports Holdings Bhd. | 15,557,235 | 35,990 |
| | IOI Corp. Bhd. | 41,599,038 | 35,732 |
| | Maxis Bhd. | 41,184,161 | 33,911 |
| | Axiata Group Bhd. | 62,962,135 | 32,377 |
| | IJM Corp. Bhd. | 45,594,121 | 31,267 |
| 2 | MR DIY Group M Bhd. | 62,650,600 | 31,222 |
| | PPB Group Bhd. | 9,737,045 | 30,948 |
| | YTL Corp. Bhd. | 68,786,200 | 30,750 |
| | Sime Darby Bhd. | 55,641,174 | 29,343 |
| | Inari Amertron Bhd. | 43,134,278 | 27,963 |
| | Sunway Bhd. | 27,661,100 | 27,478 |
| | Genting Bhd. | 30,077,918 | 27,021 |
| | Dialog Group Bhd. | 52,921,559 | 24,963 |
| | QL Resources Bhd. | 22,691,346 | 24,811 |
| | YTL Power International Bhd. | 35,405,200 | 24,662 |
| | Telekom Malaysia Bhd. | 16,046,498 | 23,756 |
| | Genting Malaysia Bhd. | 40,050,219 | 20,438 |
| | Nestle Malaysia Bhd. | 895,670 | 20,407 |
| | Petronas Dagangan Bhd. | 4,851,140 | 19,844 |
| | Bursa Malaysia Bhd. | 9,550,708 | 19,679 |
| | Yinson Holdings Bhd. | 29,944,204 | 18,462 |
| | Hartalega Holdings Bhd. | 25,209,494 | 18,156 |
| | TIME dotCom Bhd. | 16,172,385 | 17,962 |
| * | Top Glove Corp. Bhd. | 70,496,698 | 17,083 |
| | KPJ Healthcare Bhd. | 33,772,267 | 16,040 |
| | Frontken Corp. Bhd. | 17,900,750 | 15,534 |
| | Sime Darby Property Bhd. | 48,086,476 | 15,484 |
| | Fraser & Neave Holdings Bhd. | 2,191,108 | 15,446 |
| | Alliance Bank Malaysia Bhd. | 15,178,053 | 15,201 |
| | Hong Leong Financial Group Bhd. | 3,288,832 | 13,972 |
| | My EG Services Bhd. | 73,878,462 | 13,930 |
| | United Plantations Bhd. | 2,241,900 | 13,743 |
| | SP Setia Bhd. Group | 36,706,778 | 11,717 |
| | HAP Seng Consolidated Bhd. | 12,990,429 | 11,547 |
| | IOI Properties Group Bhd. | 21,513,200 | 11,129 |
| | Heineken Malaysia Bhd. | 2,028,984 | 10,512 |
| | Kossan Rubber Industries Bhd. | 21,281,386 | 10,147 |
Total International Stock Index Fund
| | | | | | Shares | Market
Value•
($000) |
| | Axis REIT | 22,543,801 | 9,199 |
| | Scientex Bhd. | 9,029,324 | 9,131 |
| | Bank Islam Malaysia Bhd. | 14,288,200 | 8,806 |
| | VS Industry Bhd. | 39,791,796 | 8,773 |
| | Mah Sing Group Bhd. | 21,736,800 | 8,460 |
| | IGB REIT | 17,840,800 | 8,457 |
| | Carlsberg Brewery Malaysia Bhd. | 1,595,000 | 7,060 |
| | CTOS Digital Bhd. | 25,856,900 | 6,801 |
| | Pentamaster Corp. Bhd. | 7,735,550 | 6,749 |
| * | Greatech Technology Bhd. | 13,275,600 | 6,601 |
| | Bermaz Auto Bhd. | 13,528,601 | 6,334 |
| | Malaysian Pacific Industries Bhd. | 1,060,800 | 6,237 |
| * | Bumi Armada Bhd. | 53,499,305 | 6,073 |
| | MBSB Bhd. | 34,198,984 | 5,744 |
| | UEM Sunrise Bhd. | 21,675,755 | 4,730 |
| | D&O Green Technologies Bhd. | 8,914,100 | 4,655 |
| * | Berjaya Corp. Bhd. | 58,528,190 | 4,242 |
| * | Chin Hin Group Bhd. | 7,013,247 | 4,168 |
| * | Supermax Corp. Bhd. | 21,678,543 | 3,997 |
| | Malaysian Resources Corp. Bhd. | 30,545,901 | 3,826 |
| | Padini Holdings Bhd. | 4,674,445 | 3,740 |
| | British American Tobacco Malaysia Bhd. | 2,123,069 | 3,493 |
| | Cahya Mata Sarawak Bhd. | 10,915,070 | 3,436 |
| | Sports Toto Bhd. | 9,749,179 | 3,371 |
| | Hibiscus Petroleum Bhd. | 6,965,940 | 3,183 |
| | Syarikat Takaful Malaysia Keluarga Bhd. | 3,497,100 | 3,154 |
| * | Dagang NeXchange Bhd. | 38,184,600 | 3,067 |
| * | WCT Holdings Bhd. | 14,807,777 | 3,035 |
| | Velesto Energy Bhd. | 68,803,212 | 2,966 |
| * | UWC Bhd. | 5,500,300 | 2,925 |
| | DRB-Hicom Bhd. | 10,988,917 | 2,621 |
| | FGV Holdings Bhd. | 8,165,200 | 2,083 |
| *,2 | Lotte Chemical Titan Holding Bhd. | 8,061,347 | 1,728 |
| * | Astro Malaysia Holdings Bhd. | 25,451,664 | 1,421 |
| * | PMB Technology Bhd. | 1,256,572 | 493 |
| | | | | | | 2,453,061 |
| Mexico (0.6%) |
| | Grupo Financiero Banorte SAB de CV | 40,235,874 | 280,170 |
| | America Movil SAB de CV Class B | 313,543,059 | 247,738 |
| | Fomento Economico Mexicano SAB de CV | 25,419,580 | 246,745 |
| | Grupo Mexico SAB de CV Class B | 44,018,186 | 230,304 |
| | Wal-Mart de Mexico SAB de CV | 71,761,100 | 197,321 |
| | Cemex SAB de CV | 192,558,800 | 101,430 |
| | Grupo Bimbo SAB de CV Class A | 30,276,200 | 94,054 |
| | Grupo Aeroportuario del Pacifico SAB de CV Class B | 4,874,173 | 84,517 |
| | Grupo Aeroportuario del Sureste SAB de CV Class B | 2,786,690 | 74,532 |
| * | Grupo Financiero Inbursa SAB de CV | 27,528,213 | 61,813 |
| | Coca-Cola Femsa SAB de CV | 7,332,554 | 61,022 |
| | Arca Continental SAB de CV | 6,005,368 | 51,414 |
| | Fibra Uno Administracion SA de CV | 39,832,049 | 45,865 |
| | Gruma SAB de CV Class B | 2,499,643 | 43,178 |
| | Alfa SAB de CV Class A | 57,964,156 | 42,004 |
| | Grupo Carso SAB de CV | 6,319,057 | 37,994 |
| | Prologis Property Mexico SA de CV | 11,231,588 | 37,591 |
| | Grupo Aeroportuario del Centro Norte SAB de CV Class B | 3,803,514 | 31,860 |
| | Corp. Inmobiliaria Vesta SAB de CV | 11,934,033 | 31,187 |
| * | Industrias Penoles SAB de CV | 1,729,787 | 27,171 |
| | Promotora y Operadora de Infraestructura SAB de CV | 2,859,360 | 24,940 |
| | Grupo Comercial Chedraui SA de CV | 3,556,671 | 22,505 |
| 2 | Banco del Bajio SA | 9,915,037 | 22,041 |
| | Regional SAB de CV | 3,320,266 | 21,085 |
| | GCC SAB de CV | 2,268,223 | 18,550 |
| 2 | FIBRA Macquarie Mexico | 10,929,070 | 18,090 |
| | Gentera SAB de CV | 13,863,128 | 17,695 |
| 3 | Grupo Elektra SAB de CV | 837,969 | 17,556 |
| | Alsea SAB de CV | 7,254,221 | 17,540 |
| | Kimberly-Clark de Mexico SAB de CV Class A | 11,655,741 | 16,735 |
| | Grupo Televisa SAB | 33,014,962 | 16,434 |
| | Qualitas Controladora SAB de CV | 2,319,812 | 16,230 |
Total International Stock Index Fund
| | | | | | Shares | Market
Value•
($000) |
| | Operadora De Sites Mexicanos SAB de CV | 17,150,704 | 15,025 |
| | El Puerto de Liverpool SAB de CV | 2,754,558 | 14,537 |
| | Genomma Lab Internacional SAB de CV Class B | 10,285,608 | 13,735 |
| | Orbia Advance Corp. SAB de CV | 13,093,397 | 12,014 |
| | La Comer SAB de CV | 6,557,756 | 11,861 |
| | Bolsa Mexicana de Valores SAB de CV | 6,437,641 | 10,527 |
| | Grupo Aeroportuario del Pacifico SAB de CV ADR | 58,499 | 10,184 |
| | Becle SAB de CV | 7,565,356 | 9,944 |
| * | Controladora Vuela Cia de Aviacion SAB de CV Class A | 12,997,312 | 9,672 |
| | Cemex SAB de CV ADR | 1,830,867 | 9,557 |
| | Megacable Holdings SAB de CV | 4,184,949 | 9,182 |
| *,2 | Grupo Traxion SAB de CV Class A | 5,392,524 | 5,870 |
| | TF Administradora Industrial S de RL de CV | 2,471,696 | 4,542 |
| | Concentradora Fibra Danhos SA de CV | 3,408,777 | 3,680 |
| | Alpek SAB de CV Class A | 4,988,817 | 3,239 |
| *,2 | Nemak SAB de CV | 29,415,715 | 3,102 |
| * | Grupo Rotoplas SAB de CV | 2,585,261 | 2,672 |
| * | Ollamani SAB | 1,432,983 | 2,435 |
| | Promotora y Operadora de Infraestructura SAB de CV (XMEX) | 274,087 | 1,842 |
| | Sempra | 2 | — |
| | | | | | | 2,410,931 |
| Netherlands (2.4%) |
| | ASML Holding NV | 5,490,464 | 3,695,805 |
| | ING Groep NV | 45,043,851 | 764,412 |
| | Prosus NV | 18,082,875 | 762,544 |
| *,2 | Adyen NV | 411,353 | 628,407 |
| | Wolters Kluwer NV | 3,355,530 | 564,010 |
| | Koninklijke Ahold Delhaize NV | 13,076,747 | 431,511 |
| | ASM International NV | 648,408 | 362,141 |
| | Heineken NV | 3,833,023 | 314,372 |
| * | Koninklijke Philips NV | 11,093,925 | 291,868 |
| | DSM-Firmenich AG | 2,410,644 | 285,862 |
| | Universal Music Group NV | 10,506,673 | 264,413 |
| | Koninklijke KPN NV | 52,780,862 | 206,356 |
| | NN Group NV | 3,817,803 | 187,425 |
| 1 | ArcelorMittal SA | 6,749,649 | 166,948 |
| | Akzo Nobel NV | 2,380,479 | 151,907 |
| | Exor NV | 1,392,588 | 147,084 |
| | IMCD NV | 795,427 | 126,466 |
| | Heineken Holding NV | 1,812,172 | 125,562 |
| 2 | Euronext NV | 1,102,150 | 121,605 |
| | BE Semiconductor Industries NV | 1,061,337 | 112,975 |
| 2 | ABN AMRO Bank NV | 6,204,513 | 102,534 |
| | ASR Nederland NV | 2,054,121 | 97,363 |
| | Aegon Ltd. | 15,118,997 | 95,428 |
| | Arcadis NV | 1,013,454 | 70,175 |
| | Randstad NV | 1,485,440 | 68,490 |
| * | InPost SA | 3,320,362 | 64,774 |
| | Aalberts NV | 1,340,942 | 48,388 |
| 2 | Signify NV | 1,761,969 | 43,141 |
| | Koninklijke Vopak NV | 904,984 | 41,719 |
| | SBM Offshore NV | 2,163,556 | 39,603 |
| | Fugro NV | 1,565,268 | 35,991 |
| | JDE Peet's NV | 1,378,377 | 31,119 |
| *,2 | Just Eat Takeaway.com NV | 2,645,838 | 30,236 |
| | Allfunds Group plc | 4,629,983 | 28,320 |
| 2 | CTP NV | 1,520,040 | 25,428 |
| | Van Lanschot Kempen NV | 530,218 | 24,235 |
| | TKH Group NV | 558,321 | 22,718 |
| | Corbion NV | 820,825 | 20,581 |
| * | Galapagos NV | 678,578 | 18,116 |
| *,1,2 | Basic-Fit NV | 730,758 | 18,095 |
| | Koninklijke BAM Groep NV | 3,761,806 | 17,362 |
| *,1 | OCI NV | 1,350,794 | 16,446 |
| 1 | APERAM SA | 597,958 | 16,275 |
| | Eurocommercial Properties NV | 618,177 | 15,731 |
| | Flow Traders Ltd. | 459,113 | 10,505 |
| | Wereldhave NV | 581,995 | 8,970 |
| | AMG Critical Materials NV | 447,537 | 7,635 |
Total International Stock Index Fund
| | | | | | Shares | Market
Value•
($000) |
| | Vastned Retail NV | 243,809 | 6,540 |
| | Sligro Food Group NV | 494,233 | 6,168 |
| 1 | PostNL NV | 4,911,412 | 5,907 |
| | NSI NV | 270,894 | 5,837 |
| *,1 | TomTom NV | 902,279 | 4,928 |
| *,1,2 | Alfen NV | 297,880 | 3,995 |
| | Brunel International NV | 301,735 | 2,919 |
| 2 | B&S Group Sarl | 343,131 | 1,733 |
| | | | | | | 10,769,078 |
| New Zealand (0.2%) |
| | Fisher & Paykel Healthcare Corp. Ltd. | 8,038,966 | 172,284 |
| | Infratil Ltd. | 13,398,291 | 100,587 |
| | Auckland International Airport Ltd. | 20,579,689 | 89,800 |
| | Meridian Energy Ltd. | 17,363,849 | 61,666 |
| | Contact Energy Ltd. | 11,078,800 | 56,892 |
| | Mainfreight Ltd. | 1,122,772 | 48,110 |
| | EBOS Group Ltd. | 2,190,298 | 47,756 |
| | Spark New Zealand Ltd. | 25,360,310 | 44,000 |
| | Mercury NZ Ltd. | 9,632,012 | 37,912 |
| * | a2 Milk Co. Ltd. | 10,019,173 | 37,899 |
| * | Ryman Healthcare Ltd. | 8,394,008 | 24,850 |
| | Summerset Group Holdings Ltd. | 3,234,391 | 23,884 |
| * | Fletcher Building Ltd. | 12,977,172 | 23,075 |
| | Goodman Property Trust | 14,767,294 | 18,615 |
| | Freightways Group Ltd. | 2,375,789 | 14,894 |
| | Precinct Properties Group | 18,073,484 | 13,611 |
| | Kiwi Property Group Ltd. | 21,603,271 | 12,067 |
| | Genesis Energy Ltd. | 7,756,492 | 9,887 |
| | SKYCITY Entertainment Group Ltd. | 10,411,860 | 8,524 |
| | Vector Ltd. | 3,430,488 | 7,856 |
| | Argosy Property Ltd. | 11,504,368 | 7,452 |
| | Air New Zealand Ltd. | 21,127,673 | 6,511 |
| | Stride Property Group | 7,771,212 | 6,433 |
| | Scales Corp. Ltd. | 1,457,698 | 3,489 |
| | SKY Network Television Ltd. | 1,833,530 | 3,001 |
| * | Fletcher Building Ltd. (XASX) | 312,070 | 556 |
| | | | | | | 881,611 |
| Norway (0.5%) |
| | DNB Bank ASA | 13,733,468 | 284,598 |
| | Equinor ASA | 11,405,647 | 271,023 |
| | Norsk Hydro ASA | 17,953,813 | 111,446 |
| | Kongsberg Gruppen ASA | 1,032,877 | 107,823 |
| | Mowi ASA | 6,172,110 | 106,407 |
| | Telenor ASA | 8,651,285 | 106,340 |
| | Orkla ASA | 10,639,942 | 98,298 |
| | Aker BP ASA | 4,272,323 | 91,418 |
| | Yara International ASA | 2,267,523 | 68,407 |
| | Storebrand ASA | 5,626,096 | 64,156 |
| | Subsea 7 SA | 3,289,941 | 50,566 |
| | TOMRA Systems ASA | 3,264,052 | 46,927 |
| | Schibsted ASA Class A | 1,344,216 | 45,426 |
| | Salmar ASA | 885,780 | 45,043 |
| | Bakkafrost P/F | 711,569 | 42,912 |
| | Gjensidige Forsikring ASA | 2,365,978 | 42,791 |
| | Var Energi ASA | 12,417,026 | 39,162 |
| | Frontline plc | 1,995,181 | 38,578 |
| | SpareBank 1 Sor-Norge ASA | 2,571,859 | 34,079 |
| | Schibsted ASA Class B | 1,022,754 | 32,075 |
| * | Nordic Semiconductor ASA | 2,644,234 | 26,278 |
| | SpareBank 1 SMN | 1,775,495 | 26,181 |
| | TGS ASA | 2,733,228 | 24,799 |
| | Borregaard ASA | 1,377,072 | 24,443 |
| | Hafnia Ltd. | 4,004,066 | 23,568 |
| | Protector Forsikring ASA | 902,562 | 23,492 |
| * | Cadeler A/S | 2,941,095 | 19,760 |
| * | DOF Group ASA | 2,424,648 | 19,360 |
| | Golden Ocean Group Ltd. | 1,684,296 | 18,220 |
| | Leroy Seafood Group ASA | 3,941,461 | 18,164 |
| | Aker ASA Class A | 335,216 | 17,528 |
Total International Stock Index Fund
| | | | | | Shares | Market
Value•
($000) |
| | Aker Solutions ASA | 3,673,354 | 17,406 |
| | Veidekke ASA | 1,513,584 | 17,291 |
| | Hoegh Autoliners ASA | 1,527,099 | 16,072 |
| 2 | BW LPG Ltd. | 1,161,201 | 14,976 |
| | Atea ASA | 1,159,089 | 14,894 |
| | Wallenius Wilhelmsen ASA | 1,408,011 | 13,999 |
| *,2 | AutoStore Holdings Ltd. | 14,966,764 | 13,840 |
| 2 | Europris ASA | 2,237,745 | 13,808 |
| 1 | Borr Drilling Ltd. | 3,271,816 | 13,675 |
| *,2 | Scatec ASA | 1,659,769 | 12,093 |
| | DNO ASA | 11,772,134 | 11,537 |
| *,2 | Crayon Group Holding ASA | 1,123,445 | 11,127 |
| *,2 | Entra ASA | 990,816 | 10,577 |
| | Austevoll Seafood ASA | 1,206,240 | 10,469 |
| | FLEX LNG Ltd. | 423,267 | 10,400 |
| | MPC Container Ships ASA | 5,229,350 | 10,307 |
| *,1 | NEL ASA | 23,362,994 | 9,038 |
| | Stolt-Nielsen Ltd. | 300,717 | 8,594 |
| * | Hexagon Composites ASA | 1,729,934 | 6,808 |
| | Bonheur ASA | 266,715 | 6,723 |
| *,2 | Elkem ASA | 4,076,978 | 6,665 |
| | Wilh Wilhelmsen Holding ASA Class A | 175,929 | 6,551 |
| 1 | Grieg Seafood ASA | 763,180 | 4,624 |
| | BW Offshore Ltd. | 1,174,994 | 3,193 |
| * | Aker Carbon Capture ASA | 4,850,220 | 2,708 |
| * | BW Energy Ltd. | 1,065,476 | 2,226 |
| *,1 | Cavendish Hydrogen ASA | 468,890 | 487 |
| | | | | | | 2,239,356 |
| Other (0.1%)4 |
| 5 | Vanguard FTSE Emerging Markets ETF | 12,737,296 | 593,176 |
| Pakistan (0.0%) |
| | Fauji Fertilizer Co. Ltd. | 4,861,766 | 4,928 |
| | Pakistan State Oil Co. Ltd. | 2,152,217 | 1,717 |
| | Millat Tractors Ltd. | 468,251 | 908 |
| | Engro Corp. Ltd. | 421,957 | 455 |
| | | | | | | 8,008 |
| Philippines (0.2%) |
| | International Container Terminal Services Inc. | 15,272,910 | 103,791 |
| | BDO Unibank Inc. | 32,907,553 | 86,125 |
| | SM Prime Holdings Inc. | 148,627,536 | 78,176 |
| | Bank of the Philippine Islands | 29,388,859 | 72,191 |
| | Ayala Land Inc. | 102,658,800 | 57,589 |
| | Ayala Corp. | 4,472,322 | 52,906 |
| | Metropolitan Bank & Trust Co. | 25,107,543 | 32,726 |
| | PLDT Inc. | 1,265,510 | 31,101 |
| | Manila Electric Co. | 3,604,375 | 30,370 |
| | Jollibee Foods Corp. | 6,244,710 | 28,451 |
| | Universal Robina Corp. | 12,170,560 | 20,414 |
| 2 | Monde Nissin Corp. | 99,987,770 | 18,711 |
| | JG Summit Holdings Inc. | 41,648,252 | 17,389 |
| | GT Capital Holdings Inc. | 1,391,212 | 17,189 |
| | Globe Telecom Inc. | 435,022 | 16,052 |
| | Century Pacific Food Inc. | 17,029,536 | 12,299 |
| | ACEN Corp. | 135,877,440 | 11,581 |
| | DMCI Holdings Inc. | 56,307,263 | 10,828 |
| | Converge Information & Communications Technology Solutions Inc. | 34,169,937 | 9,436 |
| | Semirara Mining & Power Corp. Class A | 16,188,762 | 9,043 |
| * | Bloomberry Resorts Corp. | 58,960,840 | 7,798 |
| | Puregold Price Club Inc. | 13,566,657 | 7,599 |
| | AREIT Inc. | 10,882,573 | 7,305 |
| | Robinsons Land Corp. | 25,294,033 | 6,680 |
| | LT Group Inc. | 36,528,300 | 6,466 |
| * | Megaworld Corp. | 149,636,399 | 5,937 |
| | Wilcon Depot Inc. | 19,558,408 | 5,414 |
| | D&L Industries Inc. | 35,282,810 | 3,794 |
| | First Gen Corp. | 5,589,768 | 1,732 |
| | Alliance Global Group Inc. | 10,752,160 | 1,705 |
| * | Cebu Air Inc. | 2,500,350 | 1,410 |
Total International Stock Index Fund
| | | | | | Shares | Market
Value•
($000) |
| | San Miguel Corp. | 434,113 | 663 |
| | | | | | | 772,871 |
| Poland (0.3%) |
| | Powszechna Kasa Oszczednosci Bank Polski SA | 11,883,762 | 165,116 |
| | ORLEN SA | 8,030,516 | 104,855 |
| | Powszechny Zaklad Ubezpieczen SA | 7,807,209 | 77,426 |
| | Bank Polska Kasa Opieki SA | 2,182,983 | 76,374 |
| | KGHM Polska Miedz SA | 1,904,335 | 71,275 |
| *,2 | Allegro.eu SA | 7,811,782 | 68,740 |
| | Santander Bank Polska SA | 538,642 | 60,402 |
| | LPP SA | 15,422 | 56,126 |
| *,2 | Dino Polska SA | 670,026 | 55,649 |
| 1 | CD Projekt SA | 905,806 | 36,470 |
| | Alior Bank SA | 1,291,518 | 28,222 |
| * | CCC SA | 638,649 | 28,211 |
| | KRUK SA | 242,024 | 25,930 |
| * | mBank SA | 179,460 | 25,237 |
| | Grupa Kety SA | 134,965 | 23,004 |
| | Budimex SA | 177,559 | 22,206 |
| * | PGE Polska Grupa Energetyczna SA | 12,272,120 | 21,216 |
| | Orange Polska SA | 9,189,142 | 17,898 |
| * | Bank Millennium SA | 8,497,299 | 17,695 |
| | Asseco Poland SA | 704,261 | 15,798 |
| | Benefit Systems SA | 23,476 | 14,104 |
| * | Tauron Polska Energia SA | 13,131,394 | 12,143 |
| | Bank Handlowy w Warszawie SA | 456,168 | 10,261 |
| * | Enea SA | 3,556,867 | 9,900 |
| *,1,2 | Pepco Group NV | 2,059,559 | 8,814 |
| 2 | XTB SA | 530,903 | 8,602 |
| * | Cyfrowy Polsat SA | 2,015,762 | 6,375 |
| * | AmRest Holdings SE | 991,451 | 5,175 |
| *,1 | Jastrzebska Spolka Weglowa SA | 707,989 | 4,756 |
| | Warsaw Stock Exchange | 422,061 | 4,480 |
| *,1 | Grupa Azoty SA | 650,504 | 3,364 |
| | | | | | | 1,085,824 |
| Portugal (0.1%) |
| | EDP SA | 41,938,637 | 165,108 |
| | Galp Energia SGPS SA | 6,009,231 | 102,709 |
| | Jeronimo Martins SGPS SA | 3,839,586 | 74,486 |
| | EDP Renovaveis SA | 4,172,507 | 56,553 |
| | Banco Comercial Portugues SA | 106,734,130 | 53,842 |
| | Navigator Co. SA | 3,489,832 | 13,461 |
| | REN - Redes Energeticas Nacionais SGPS SA | 5,192,674 | 12,968 |
| | Sonae SGPS SA | 12,634,714 | 12,486 |
| | NOS SGPS SA | 2,747,530 | 10,510 |
| | CTT-Correios de Portugal SA | 1,498,785 | 6,973 |
| | Altri SGPS SA | 1,011,853 | 5,472 |
| | Corticeira Amorim SGPS SA | 460,403 | 4,204 |
| *,1 | Greenvolt-Energias Renovaveis SA | 394,030 | 3,431 |
| | Semapa-Sociedade de Investimento e Gestao | 200,114 | 3,224 |
| 1 | Mota-Engil SGPS SA | 1,122,026 | 3,128 |
| | | | | | | 528,555 |
| Qatar (0.2%) |
| | Qatar National Bank QPSC | 61,882,629 | 294,534 |
| | Qatar Islamic Bank QPSC | 23,300,281 | 131,020 |
| | Industries Qatar QSC | 21,893,212 | 80,161 |
| | Masraf Al Rayan QSC | 86,580,681 | 56,336 |
| | Commercial Bank PSQC | 46,843,335 | 54,675 |
| | Qatar International Islamic Bank QSC | 16,269,431 | 46,838 |
| | Qatar Navigation QSC | 14,481,063 | 45,503 |
| | Qatar Gas Transport Co. Ltd. | 38,138,283 | 44,814 |
| | Mesaieed Petrochemical Holding Co. | 86,016,992 | 37,361 |
| | Ooredoo QPSC | 11,545,734 | 36,236 |
| | Qatar Fuel QSC | 8,175,276 | 34,405 |
| | Qatar Electricity & Water Co. QSC | 6,303,482 | 28,059 |
| | Dukhan Bank | 24,398,043 | 24,706 |
| | Barwa Real Estate Co. | 29,572,054 | 23,171 |
| | Doha Bank QPSC | 33,171,926 | 16,332 |
Total International Stock Index Fund
| | | | | | Shares | Market
Value•
($000) |
| | Qatar Aluminum Manufacturing Co. | 33,142,551 | 11,673 |
| | Vodafone Qatar QSC | 22,568,323 | 11,529 |
| | Gulf International Services QSC | 12,778,164 | 11,122 |
| | United Development Co. QSC | 23,971,493 | 7,522 |
| * | Ezdan Holding Group QSC | 21,784,843 | 7,210 |
| | Al Meera Consumer Goods Co. QSC | 1,402,560 | 5,700 |
| | | | | | | 1,008,907 |
| Romania (0.0%) |
| | Banca Transilvania SA | 11,295,285 | 69,760 |
| | OMV Petrom SA | 243,972,992 | 39,489 |
| | Societatea De Producere A Energiei Electrice in Hidrocentrale Hidroelectrica SA | 1,082,838 | 28,678 |
| | Societatea Nationala Nuclearelectrica SA | 728,437 | 6,869 |
| | Societatea Energetica Electrica SA | 2,362,221 | 6,583 |
| * | MED Life SA | 4,236,930 | 5,462 |
| | One United Properties SA | 34,266,903 | 3,725 |
| | TTS Transport Trade Services SA | 1,763,612 | 2,689 |
| * | Teraplast SA | 17,221,482 | 1,762 |
| | | | | | | 165,017 |
| Russia (0.0%) |
| *,3 | Sberbank of Russia PJSC | 131,579,417 | — |
| *,3 | Mechel PJSC ADR | 691,625 | — |
| *,3 | Surgutneftegas PJSC ADR | 626 | — |
| *,3 | Sistema AFK PAO GDR | 697 | — |
| *,3 | Novatek PJSC GDR | 7,017 | — |
| *,3 | Severstal PAO GDR | 543,443 | — |
| *,3 | Polyus PJSC | 50,544 | — |
| *,3 | Raspadskaya OJSC | 802,310 | — |
| *,3 | Mechel PJSC | 1,344,496 | — |
| *,3 | Rosneft Oil Co. PJSC | 15,028,017 | — |
| *,3 | Magnitogorsk Iron & Steel Works PJSC | 27,346,793 | — |
| *,3 | VTB Bank PJSC | 13,066,778 | — |
| *,3 | Sistema AFK PAO | 38,039,921 | — |
| *,3 | Severstal PAO | 1,964,967 | — |
| *,3 | Alrosa PJSC | 32,391,627 | — |
| *,3 | GMK Norilskiy Nickel PAO ADR | 366 | — |
| *,3 | Polyus PJSC GDR | 618,167 | — |
| *,3 | Credit Bank of Moscow PJSC | 170,771,500 | — |
| *,3 | Sovcomflot PJSC | 2,097,559 | — |
| *,3 | Bank St. Petersburg PJSC | 314,414 | — |
| *,2,3 | Segezha Group PJSC | 16,822,200 | — |
| *,3 | PhosAgro PJSC GDR | 8,608 | — |
| | | | | | | — |
| Saudi Arabia (1.1%) |
| | Al Rajhi Bank | 27,368,420 | 639,480 |
| 2 | Saudi Arabian Oil Co. | 62,606,992 | 449,710 |
| | ACWA Power Co. | 3,007,628 | 367,735 |
| | Saudi National Bank | 40,664,533 | 357,479 |
| | Saudi Telecom Co. | 25,005,580 | 280,644 |
| * | Saudi Arabian Mining Co. | 16,915,988 | 253,246 |
| | Saudi Basic Industries Corp. | 12,538,895 | 242,566 |
| | Riyad Bank | 20,531,965 | 140,341 |
| | Alinma Bank | 17,139,850 | 128,064 |
| | Saudi Awwal Bank | 13,262,152 | 119,377 |
| | SABIC Agri-Nutrients Co. | 3,251,270 | 98,336 |
| | Elm Co. | 357,606 | 97,141 |
| | Dr Sulaiman Al Habib Medical Services Group Co. | 1,179,663 | 89,860 |
| | Bank AlBilad | 8,541,351 | 83,557 |
| | Etihad Etisalat Co. | 5,265,610 | 72,500 |
| | Banque Saudi Fransi | 8,174,202 | 67,688 |
| | Arab National Bank | 12,377,994 | 62,252 |
| | Bupa Arabia for Cooperative Insurance Co. | 1,033,952 | 55,383 |
| * | Savola Group | 7,754,344 | 53,076 |
| | Almarai Co. JSC | 3,396,421 | 49,734 |
| | Saudi Electricity Co. | 10,866,930 | 47,347 |
| * | Saudi Research & Media Group | 547,107 | 43,382 |
| | Saudi Tadawul Group Holding Co. | 669,509 | 42,389 |
| | Yanbu National Petrochemical Co. | 3,852,439 | 40,744 |
| | Co. for Cooperative Insurance | 1,025,725 | 38,259 |
Total International Stock Index Fund
| | | | | | Shares | Market
Value•
($000) |
| | Sahara International Petrochemical Co. | 4,932,528 | 34,491 |
| | Mouwasat Medical Services Co. | 1,325,898 | 33,121 |
| * | Dar Al Arkan Real Estate Development Co. | 7,391,468 | 32,728 |
| * | Al Rajhi Co. for Co-operative Insurance | 683,817 | 32,560 |
| | Ades Holding Co. | 6,073,666 | 31,947 |
| * | Bank Al-Jazira | 7,019,605 | 30,644 |
| | Saudi Investment Bank | 8,483,115 | 29,735 |
| | Jarir Marketing Co. | 8,211,759 | 28,873 |
| | Aldrees Petroleum & Transport Services Co. | 685,331 | 25,205 |
| | SAL Saudi Logistics Services | 335,086 | 24,548 |
| | Saudi Industrial Investment Group | 5,176,894 | 24,525 |
| | Nahdi Medical Co. | 725,042 | 23,796 |
| | Arabian Internet & Communications Services Co. | 349,185 | 23,656 |
| | Riyadh Cables Group Co. | 844,526 | 22,919 |
| | Astra Industrial Group | 478,676 | 22,686 |
| | Dallah Healthcare Co. | 522,601 | 22,214 |
| | Saudi Aramco Base Oil Co. | 705,238 | 21,949 |
| * | Saudi Kayan Petrochemical Co. | 10,302,466 | 21,299 |
| | Saudia Dairy & Foodstuff Co. | 215,247 | 20,550 |
| | Abdullah Al Othaim Markets Co. | 6,177,120 | 19,402 |
| | Catrion Catering Holding Co. | 563,441 | 17,811 |
| | Leejam Sports Co. JSC | 352,143 | 17,791 |
| | Saudi Chemical Co. Holding | 5,743,289 | 17,773 |
| | Saudi Ground Services Co. | 1,249,660 | 17,585 |
| | Mobile Telecommunications Co. Saudi Arabia | 6,178,140 | 17,360 |
| | Jamjoom Pharmaceuticals Factory Co. | 379,587 | 17,090 |
| * | Advanced Petrochemical Co. | 1,764,923 | 17,080 |
| | Power & Water Utility Co. for Jubail & Yanbu | 1,050,879 | 16,408 |
| | National Medical Care Co. | 306,251 | 15,542 |
| | Electrical Industries Co. | 7,187,736 | 15,262 |
| | National Gas & Industrialization Co. | 515,778 | 14,903 |
| | United Electronics Co. | 550,829 | 14,760 |
| *,1 | National Agriculture Development Co. | 2,070,118 | 14,586 |
| 2 | Arabian Centres Co. | 2,539,903 | 13,902 |
| | National Co. for Learning & Education | 227,307 | 13,263 |
| * | National Industrialization Co. | 4,532,439 | 12,870 |
| * | Saudi Real Estate Co. | 1,866,414 | 12,750 |
| * | Rabigh Refining & Petrochemical Co. | 5,838,521 | 12,664 |
| * | Seera Group Holding | 2,038,588 | 12,437 |
| | Al Masane Al Kobra Mining Co. | 614,512 | 12,134 |
| | United International Transportation Co. | 518,118 | 11,868 |
| | Yamama Cement Co. | 1,385,281 | 11,793 |
| * | Emaar Economic City | 5,141,759 | 11,745 |
| | Al Hammadi Holding | 1,100,712 | 11,677 |
| * | Middle East Healthcare Co. | 583,477 | 11,201 |
| | Saudi Cement Co. | 1,025,260 | 10,964 |
| | Arabian Drilling Co. | 368,109 | 10,766 |
| | Qassim Cement Co. | 749,978 | 10,437 |
| | Saudi Automotive Services Co. | 480,477 | 10,338 |
| * | Al Moammar Information Systems Co. | 205,793 | 10,301 |
| * | Arabian Contracting Services Co. | 208,988 | 9,755 |
| | Arriyadh Development Co. | 1,195,226 | 9,558 |
| * | AlKhorayef Water & Power Technologies Co. | 213,406 | 9,137 |
| | Al-Dawaa Medical Services Co. | 386,380 | 9,060 |
| | East Pipes Integrated Co. for Industry | 198,843 | 8,782 |
| | Southern Province Cement Co. | 953,196 | 8,397 |
| | Retal Urban Development Co. Class A | 2,112,299 | 8,145 |
| * | Perfect Presentation For Commercial Services Co. | 2,054,031 | 8,115 |
| | Almunajem Foods Co. | 253,259 | 7,840 |
| | BinDawood Holding Co. | 4,058,215 | 7,675 |
| | Etihad Atheeb Telecommunication Co. | 234,995 | 7,279 |
| * | Saudi Pharmaceutical Industries & Medical Appliances Corp. | 816,576 | 7,266 |
| | Al Rajhi REIT | 3,026,187 | 6,889 |
| | Yanbu Cement Co. | 1,092,076 | 6,691 |
| * | Middle East Paper Co. | 595,715 | 6,317 |
| * | Saudi Ceramic Co. | 680,768 | 5,893 |
| | Eastern Province Cement Co. | 609,597 | 5,632 |
| * | Saudi Public Transport Co. | 881,268 | 5,163 |
| | Bawan Co. | 421,163 | 4,985 |
| | City Cement Co. | 975,941 | 4,553 |
Total International Stock Index Fund
| | | | | | Shares | Market
Value•
($000) |
| | Arabian Cement Co. | 664,126 | 4,450 |
| * | Sinad Holding Co. | 864,676 | 3,286 |
| * | Zamil Industrial Investment Co. | 412,084 | 3,042 |
| | Northern Region Cement Co. | 1,195,425 | 2,856 |
| * | Najran Cement Co. | 1,156,847 | 2,819 |
| * | Herfy Food Services Co. | 304,794 | 1,976 |
| | | | | | | 5,027,760 |
| Singapore (0.8%) |
| | DBS Group Holdings Ltd. | 28,110,987 | 815,073 |
| | Oversea-Chinese Banking Corp. Ltd. | 49,128,644 | 563,658 |
| | United Overseas Bank Ltd. | 16,930,493 | 411,564 |
| | Singapore Telecommunications Ltd. | 104,791,816 | 247,228 |
| | CapitaLand Integrated Commercial Trust | 74,362,273 | 112,977 |
| | CapitaLand Ascendas REIT | 49,923,627 | 101,171 |
| | Singapore Exchange Ltd. | 11,445,943 | 98,080 |
| | Singapore Airlines Ltd. | 19,248,256 | 93,895 |
| | Keppel Ltd. | 19,293,552 | 92,888 |
| | Singapore Technologies Engineering Ltd. | 21,253,303 | 72,867 |
| | CapitaLand Investment Ltd. | 31,965,325 | 67,530 |
| | Wilmar International Ltd. | 27,662,755 | 66,771 |
| | Genting Singapore Ltd. | 80,672,482 | 50,808 |
| | Mapletree Industrial Trust | 27,442,903 | 49,554 |
| | Sembcorp Industries Ltd. | 12,637,717 | 47,946 |
| | Mapletree Logistics Trust | 46,706,787 | 46,586 |
| | Thai Beverage PCL | 113,785,900 | 45,513 |
| * | Seatrium Ltd. | 28,281,465 | 40,313 |
| | SATS Ltd. | 12,453,761 | 36,948 |
| | Venture Corp. Ltd. | 3,662,161 | 36,731 |
| | Frasers Logistics & Commercial Trust | 39,965,128 | 32,207 |
| | ComfortDelGro Corp. Ltd. | 28,494,304 | 31,604 |
| | Mapletree Pan Asia Commercial Trust | 32,128,513 | 31,555 |
| | Keppel DC REIT | 17,981,388 | 30,972 |
| | UOL Group Ltd. | 6,890,359 | 27,842 |
| | NetLink NBN Trust | 41,101,229 | 27,792 |
| | Suntec REIT | 29,711,209 | 26,668 |
| | Frasers Centrepoint Trust | 15,580,831 | 26,290 |
| | City Developments Ltd. | 6,370,120 | 24,966 |
| | CapitaLand Ascott Trust | 34,278,786 | 23,389 |
| | Keppel REIT | 33,460,577 | 22,707 |
| | Jardine Cycle & Carriage Ltd. | 934,222 | 19,560 |
| | Golden Agri-Resources Ltd. | 86,451,695 | 18,976 |
| | Keppel Infrastructure Trust | 54,980,839 | 18,186 |
| | ESR-LOGOS REIT | 84,485,836 | 17,872 |
| 1 | Parkway Life REIT | 5,386,926 | 15,364 |
| | Olam Group Ltd. | 15,708,755 | 12,671 |
| | iFAST Corp. Ltd. | 2,227,431 | 12,602 |
| | Capitaland India Trust | 13,496,213 | 11,117 |
| | Hutchison Port Holdings Trust | 70,516,160 | 11,047 |
| | Sheng Siong Group Ltd. | 9,087,662 | 10,925 |
| | Lendlease Global Commercial REIT | 24,653,644 | 10,672 |
| | PARAGON REIT | 15,842,687 | 10,466 |
| | CapitaLand China Trust | 16,023,519 | 9,139 |
| | AIMS APAC REIT | 9,397,051 | 9,003 |
| | Raffles Medical Group Ltd. | 12,978,895 | 8,638 |
| | Singapore Post Ltd. | 20,826,794 | 8,550 |
| | CDL Hospitality Trusts | 12,499,868 | 8,474 |
| | Starhill Global REIT | 20,224,340 | 7,794 |
| | Cromwell European REIT | 4,431,069 | 7,769 |
| | First Resources Ltd. | 7,025,937 | 7,737 |
| | Digital Core REIT Management Pte. Ltd. | 12,294,167 | 7,637 |
| | StarHub Ltd. | 7,922,057 | 7,145 |
| | Far East Hospitality Trust | 14,040,138 | 6,565 |
| | UMS Integration Ltd. | 8,510,496 | 6,525 |
| | OUE REIT | 29,258,046 | 6,360 |
| | SIA Engineering Co. Ltd. | 3,243,241 | 5,929 |
| | Riverstone Holdings Ltd. | 7,785,299 | 5,330 |
| *,1 | AEM Holdings Ltd. | 3,953,607 | 3,855 |
| | First REIT | 15,850,033 | 3,191 |
| * | Keppel Pacific Oak US REIT | 11,275,906 | 2,765 |
Total International Stock Index Fund
| | | | | | Shares | Market
Value•
($000) |
| | Bumitama Agri Ltd. | 4,163,391 | 2,442 |
| * | Manulife US REIT | 20,600,361 | 2,273 |
| 1 | Nanofilm Technologies International Ltd. | 2,399,470 | 1,470 |
| * | COSCO SHIPPING International Singapore Co. Ltd. | 12,054,326 | 1,253 |
| *,1,3 | Ezra Holdings Ltd. | 20,096,532 | — |
| *,3 | Eagle Hospitality Trust | 11,225,800 | — |
| | | | | | | 3,703,395 |
| South Africa (0.9%) |
| | Naspers Ltd. | 2,448,584 | 578,717 |
| 1 | FirstRand Ltd. | 69,783,568 | 306,608 |
| | Standard Bank Group Ltd. | 18,443,274 | 253,918 |
| 1 | Capitec Bank Holdings Ltd. | 1,180,912 | 213,333 |
| | Gold Fields Ltd. | 12,294,626 | 202,752 |
| | Anglogold Ashanti plc | 5,856,416 | 163,389 |
| | MTN Group Ltd. | 25,153,932 | 124,928 |
| | Sanlam Ltd. | 24,596,099 | 122,555 |
| | Shoprite Holdings Ltd. | 6,615,811 | 114,258 |
| | Absa Group Ltd. | 11,571,474 | 110,897 |
| 1 | Nedbank Group Ltd. | 6,484,256 | 109,905 |
| | Bid Corp. Ltd. | 4,626,356 | 109,076 |
| | Harmony Gold Mining Co. Ltd. | 7,755,881 | 84,146 |
| | Bidvest Group Ltd. | 4,734,819 | 76,619 |
| | Discovery Ltd. | 7,286,141 | 74,715 |
| *,1 | Impala Platinum Holdings Ltd. | 11,168,879 | 73,721 |
| | Clicks Group Ltd. | 3,329,061 | 71,238 |
| | NEPI Rockcastle NV | 8,176,831 | 63,965 |
| | Remgro Ltd. | 6,904,912 | 60,154 |
| | Aspen Pharmacare Holdings Ltd. | 5,373,057 | 54,585 |
| | Reinet Investments SCA | 1,896,474 | 52,903 |
| | Vodacom Group Ltd. | 8,109,907 | 50,774 |
| | Mr Price Group Ltd. | 3,462,750 | 50,511 |
| 1 | Old Mutual Ltd. | 67,984,007 | 46,929 |
| 2 | Pepkor Holdings Ltd. | 35,853,194 | 46,540 |
| | Woolworths Holdings Ltd. | 12,411,372 | 46,018 |
| | Sasol Ltd. | 8,116,964 | 45,622 |
| *,1 | Sibanye Stillwater Ltd. | 39,038,904 | 45,513 |
| 1 | OUTsurance Group Ltd. | 11,738,481 | 40,183 |
| | Foschini Group Ltd. | 4,482,471 | 39,155 |
| 1 | Anglo American Platinum Ltd. | 979,362 | 38,496 |
| | Northam Platinum Holdings Ltd. | 4,938,857 | 36,540 |
| 1 | Growthpoint Properties Ltd. | 47,062,808 | 34,940 |
| 1 | Truworths International Ltd. | 4,987,271 | 31,757 |
| | Tiger Brands Ltd. | 2,289,849 | 30,831 |
| 1 | AVI Ltd. | 4,575,910 | 28,694 |
| | Momentum Group Ltd. | 17,253,621 | 28,144 |
| 1 | Investec Ltd. | 3,497,221 | 27,314 |
| 1 | Exxaro Resources Ltd. | 2,772,878 | 26,148 |
| * | MultiChoice Group | 3,710,578 | 23,408 |
| | Redefine Properties Ltd. | 79,979,796 | 22,174 |
| | Sappi Ltd. | 7,776,407 | 20,922 |
| * | SPAR Group Ltd. | 2,691,624 | 19,431 |
| | Life Healthcare Group Holdings Ltd. | 20,004,838 | 18,142 |
| 1 | Fortress Real Estate Investments Ltd. Class B | 16,434,434 | 17,541 |
| | Netcare Ltd. | 18,147,572 | 15,265 |
| 1 | African Rainbow Minerals Ltd. | 1,462,451 | 14,725 |
| | Vukile Property Fund Ltd. | 13,820,270 | 14,612 |
| 1 | Kumba Iron Ore Ltd. | 762,995 | 14,449 |
| 1 | Motus Holdings Ltd. | 1,977,799 | 13,244 |
| | Hyprop Investments Ltd. | 5,327,214 | 12,615 |
| | Resilient REIT Ltd. | 3,824,182 | 12,135 |
| | Pan African Resources plc | 26,516,557 | 12,108 |
| | Santam Ltd. | 568,666 | 11,999 |
| 2 | Dis-Chem Pharmacies Ltd. | 5,715,913 | 11,746 |
| | Barloworld Ltd. | 2,467,453 | 11,621 |
| | Thungela Resources Ltd. (XLON) | 1,545,439 | 11,020 |
| * | Pick n Pay Stores Ltd. | 7,322,007 | 10,564 |
| | Coronation Fund Managers Ltd. | 4,416,507 | 10,049 |
| | Reunert Ltd. | 2,115,080 | 9,664 |
| | Omnia Holdings Ltd. | 2,279,657 | 8,699 |
Total International Stock Index Fund
| | | | | | Shares | Market
Value•
($000) |
| 1 | Equites Property Fund Ltd. | 10,344,553 | 8,258 |
| | AECI Ltd. | 1,465,064 | 8,023 |
| | JSE Ltd. | 1,110,876 | 7,898 |
| * | MAS plc | 7,281,810 | 7,566 |
| | Attacq Ltd. | 9,548,223 | 7,103 |
| | DRDGOLD Ltd. | 5,761,587 | 7,034 |
| | Hosken Consolidated Investments Ltd. | 644,863 | 6,790 |
| | Ninety One Ltd. | 3,068,543 | 6,554 |
| * | KAP Ltd. | 33,457,192 | 6,249 |
| * | Telkom SA SOC Ltd. | 4,035,173 | 6,224 |
| | Grindrod Ltd. | 7,648,411 | 6,118 |
| * | We Buy Cars Pty Ltd. | 2,945,813 | 6,040 |
| | Sun International Ltd. | 2,314,168 | 5,967 |
| | Super Group Ltd. | 4,582,435 | 5,838 |
| | DataTec Ltd. | 2,508,512 | 5,737 |
| | Afrimat Ltd. | 1,491,356 | 5,632 |
| * | Astral Foods Ltd. | 504,273 | 4,948 |
| | Curro Holdings Ltd. | 6,747,022 | 4,876 |
| | Burstone Group Ltd. | 8,246,134 | 4,395 |
| | Thungela Resources Ltd. (XJSE) | 324,584 | 2,341 |
| | | | | | | 4,156,215 |
| South Korea (2.8%) |
| | Samsung Electronics Co. Ltd. | 66,427,040 | 2,820,558 |
| | SK Hynix Inc. | 7,517,151 | 984,099 |
| | KB Financial Group Inc. | 4,686,331 | 304,934 |
| | Hyundai Motor Co. | 1,901,768 | 292,930 |
| | Celltrion Inc. | 2,016,607 | 265,151 |
| | Shinhan Financial Group Co. Ltd. | 6,745,762 | 251,281 |
| | POSCO Holdings Inc. | 1,040,553 | 250,723 |
| | NAVER Corp. | 1,893,622 | 231,631 |
| | Kia Corp. | 3,459,578 | 228,778 |
| *,2 | Samsung Biologics Co. Ltd. | 246,211 | 178,070 |
| | Samsung SDI Co. Ltd. | 731,525 | 171,517 |
| | Hyundai Mobis Co. Ltd. | 938,364 | 168,655 |
| * | Alteogen Inc. | 587,583 | 159,084 |
| | Hana Financial Group Inc. | 3,656,441 | 157,755 |
| | LG Chem Ltd. | 657,723 | 147,885 |
| | Kakao Corp. | 4,622,016 | 123,018 |
| * | Krafton Inc. | 499,432 | 119,399 |
| | Hanwha Aerospace Co. Ltd. | 434,131 | 114,868 |
| * | LG Energy Solution Ltd. | 391,067 | 114,767 |
| | Samsung Fire & Marine Insurance Co. Ltd. | 456,890 | 110,769 |
| | KT&G Corp. | 1,388,257 | 110,275 |
| | Samsung C&T Corp. | 1,154,159 | 97,453 |
| | LG Electronics Inc. | 1,506,446 | 97,012 |
| | Meritz Financial Group Inc. | 1,275,387 | 94,391 |
| | Woori Financial Group Inc. | 8,297,897 | 92,381 |
| | Korea Zinc Co. Ltd. | 120,043 | 86,501 |
| * | Doosan Enerbility Co. Ltd. | 5,897,861 | 84,740 |
| * | HD Korea Shipbuilding & Offshore Engineering Co. Ltd. | 598,285 | 79,160 |
| * | HLB Inc. | 1,645,395 | 78,064 |
| * | SK Square Co. Ltd. | 1,285,258 | 77,617 |
| * | Ecopro BM Co. Ltd. | 635,532 | 77,557 |
| * | Ecopro Co. Ltd. | 1,361,863 | 77,203 |
| | Samsung Life Insurance Co. Ltd. | 1,030,803 | 75,428 |
| | Yuhan Corp. | 753,553 | 75,222 |
| | HD Hyundai Electric Co. Ltd. | 304,396 | 71,245 |
| * | SK Innovation Co. Ltd. | 826,952 | 69,878 |
| | LG Corp. | 1,218,015 | 66,559 |
| | Samsung Electro-Mechanics Co. Ltd. | 773,297 | 65,750 |
| | POSCO Future M Co. Ltd. | 395,144 | 63,461 |
| * | Samsung Heavy Industries Co. Ltd. | 9,038,822 | 62,348 |
| | Samsung SDS Co. Ltd. | 506,114 | 52,197 |
| | SK Inc. | 486,481 | 52,059 |
| * | Korea Electric Power Corp. | 3,043,357 | 50,881 |
| | HMM Co. Ltd. | 4,046,683 | 49,995 |
| | DB Insurance Co. Ltd. | 618,917 | 48,782 |
| | KakaoBank Corp. | 2,992,037 | 46,647 |
| | Hyundai Rotem Co. Ltd. | 1,007,056 | 45,193 |
Total International Stock Index Fund
| | | | | | Shares | Market
Value•
($000) |
| | Korean Air Lines Co. Ltd. | 2,574,286 | 44,437 |
| | Korea Aerospace Industries Ltd. | 978,134 | 41,253 |
| | Hanmi Semiconductor Co. Ltd. | 611,481 | 39,782 |
| * | HD Hyundai Heavy Industries Co. Ltd. | 298,966 | 39,366 |
| | HYBE Co. Ltd. | 290,443 | 38,906 |
| | Industrial Bank of Korea | 3,785,110 | 38,554 |
| * | Ecopro Materials Co. Ltd. | 468,671 | 37,603 |
| | Coway Co. Ltd. | 784,669 | 35,849 |
| | Amorepacific Corp. | 415,810 | 35,097 |
| | NCSoft Corp. | 219,590 | 34,474 |
| | HD Hyundai Co. Ltd. | 586,971 | 33,867 |
| * | SK Biopharmaceuticals Co. Ltd. | 391,411 | 33,244 |
| * | LigaChem Biosciences Inc. | 357,423 | 33,179 |
| * | LG Display Co. Ltd. | 4,342,300 | 33,167 |
| | LG H&H Co. Ltd. | 130,753 | 31,302 |
| | Korea Investment Holdings Co. Ltd. | 530,525 | 29,444 |
| * | L&F Co. Ltd. | 346,528 | 29,353 |
| | JB Financial Group Co. Ltd. | 2,246,803 | 29,148 |
| | Samsung Securities Co. Ltd. | 876,086 | 28,910 |
| * | Samsung E&A Co. Ltd. | 2,189,113 | 28,174 |
| * | SKC Co. Ltd. | 259,474 | 28,000 |
| | Hanjin Kal Corp. | 440,033 | 26,857 |
| | LIG Nex1 Co. Ltd. | 149,228 | 26,560 |
| | BNK Financial Group Inc. | 3,830,946 | 26,123 |
| | Hankook Tire & Technology Co. Ltd. | 1,022,747 | 26,048 |
| | Hyosung Heavy Industries Corp. | 89,959 | 25,872 |
| | LG Innotek Co. Ltd. | 195,767 | 24,851 |
| | Mirae Asset Securities Co. Ltd. | 3,707,939 | 24,176 |
| * | Hanwha Ocean Co. Ltd. | 1,249,862 | 24,057 |
| | Posco International Corp. | 635,413 | 23,844 |
| * | Enchem Co. Ltd. | 189,239 | 23,612 |
| | S-Oil Corp. | 568,845 | 23,596 |
| | Kumho Petrochemical Co. Ltd. | 227,341 | 23,410 |
| * | CosmoAM&T Co. Ltd. | 311,096 | 23,082 |
| | Orion Corp. | 311,087 | 22,420 |
| * | HD Hyundai MIPO | 282,711 | 22,362 |
| | LS Electric Co. Ltd. | 213,100 | 22,334 |
| | Hanwha Solutions Corp. | 1,438,068 | 22,083 |
| | CJ CheilJedang Corp. | 110,636 | 21,890 |
| | LG Uplus Corp. | 2,930,809 | 21,242 |
| | Hyundai Steel Co. | 1,161,371 | 21,229 |
| | Samyang Foods Co. Ltd. | 56,171 | 20,943 |
| | Fila Holdings Corp. | 711,837 | 20,545 |
| | Hanmi Pharm Co. Ltd. | 86,837 | 20,045 |
| | Hyundai Engineering & Construction Co. Ltd. | 995,153 | 20,043 |
| | Kangwon Land Inc. | 1,455,264 | 18,771 |
| * | Sam Chun Dang Pharm Co. Ltd. | 191,867 | 18,608 |
| | GS Holdings Corp. | 624,177 | 18,592 |
| | Doosan Bobcat Inc. | 684,004 | 18,417 |
| | Hyundai Glovis Co. Ltd. | 207,263 | 18,235 |
| | LS Corp. | 239,737 | 18,011 |
| | NH Investment & Securities Co. Ltd. | 1,868,562 | 17,993 |
| | Hyundai Marine & Fire Insurance Co. Ltd. | 811,396 | 17,803 |
| | KIWOOM Securities Co. Ltd. | 183,402 | 17,762 |
| | Lotte Chemical Corp. | 251,267 | 17,272 |
| | LEENO Industrial Inc. | 127,454 | 16,607 |
| | IsuPetasys Co. Ltd. | 647,549 | 16,497 |
| * | Hanall Biopharma Co. Ltd. | 510,565 | 16,186 |
| * | Peptron Inc. | 253,114 | 16,000 |
| * | Hugel Inc. | 80,212 | 15,778 |
| * | Hanwha Industrial Solutions Co. Ltd. | 480,870 | 14,740 |
| | Posco DX Co. Ltd. | 733,192 | 14,324 |
| | Hotel Shilla Co. Ltd. | 436,224 | 14,009 |
| | Eo Technics Co. Ltd. | 113,527 | 13,767 |
| | PharmaResearch Co. Ltd. | 84,123 | 13,661 |
| | CJ Corp. | 183,051 | 13,571 |
| * | Doosan Robotics Inc. | 269,282 | 13,542 |
| | TechWing Inc. | 428,679 | 13,439 |
| | JYP Entertainment Corp. | 380,030 | 13,367 |
| | Classys Inc. | 366,155 | 13,361 |
Total International Stock Index Fund
| | | | | | Shares | Market
Value•
($000) |
| | HPSP Co. Ltd. | 603,373 | 13,185 |
| *,1 | Pearl Abyss Corp. | 460,431 | 12,842 |
| | Poongsan Corp. | 256,651 | 12,837 |
| *,1 | SK Bioscience Co. Ltd. | 327,435 | 12,783 |
| | Cheil Worldwide Inc. | 958,335 | 12,781 |
| | E-MART Inc. | 268,949 | 12,658 |
| | Youngone Corp. | 414,689 | 12,645 |
| | DGB Financial Group Inc. | 2,127,810 | 12,555 |
| *,2 | Netmarble Corp. | 299,540 | 12,521 |
| | S-1 Corp. | 263,074 | 12,305 |
| | DB HiTek Co. Ltd. | 435,168 | 12,111 |
| | HL Mando Co. Ltd. | 462,210 | 12,074 |
| | NongShim Co. Ltd. | 44,605 | 12,072 |
| | Samsung Card Co. Ltd. | 413,658 | 12,053 |
| | CS Wind Corp. | 274,074 | 11,538 |
| * | APR Corp. | 320,700 | 11,498 |
| | Hanmi Science Co. Ltd. | 333,579 | 11,473 |
| * | Celltrion Pharm Inc. | 256,279 | 11,461 |
| | Doosan Co. Ltd. | 79,610 | 11,391 |
| | Cosmax Inc. | 104,382 | 11,365 |
| * | GS Engineering & Construction Corp. | 876,932 | 11,259 |
| | Hanwha Corp. | 550,236 | 11,126 |
| | Korean Reinsurance Co. | 1,614,536 | 11,010 |
| | Hanwha Systems Co. Ltd. | 829,140 | 10,892 |
| | KCC Corp. | 57,104 | 10,824 |
| | Hanwha Life Insurance Co. Ltd. | 5,014,696 | 10,699 |
| | OCI Holdings Co. Ltd. | 213,769 | 10,592 |
| * | Daejoo Electronic Materials Co. Ltd. | 135,444 | 10,501 |
| | Kolmar Korea Co. Ltd. | 203,632 | 10,354 |
| | Shinsegae Inc. | 92,768 | 10,305 |
| * | Naturecell Co. Ltd. | 652,747 | 10,294 |
| | Hansol Chemical Co. Ltd. | 113,265 | 10,269 |
| * | Korea Gas Corp. | 360,474 | 10,195 |
| | Jusung Engineering Co. Ltd. | 463,149 | 10,183 |
| | Douzone Bizon Co. Ltd. | 232,883 | 9,930 |
| | F&F Co. Ltd. | 219,134 | 9,870 |
| * | Silicon2 Co. Ltd. | 356,441 | 9,702 |
| | KEPCO Plant Service & Engineering Co. Ltd. | 298,781 | 9,654 |
| 1 | Hyundai Elevator Co. Ltd. | 280,094 | 9,575 |
| | Park Systems Corp. | 62,316 | 9,570 |
| * | People & Technology Inc. | 254,379 | 9,561 |
| *,1 | Rainbow Robotics | 108,902 | 9,545 |
| | GS Retail Co. Ltd. | 605,596 | 9,482 |
| * | ABLBio Inc. | 347,971 | 9,379 |
| | BGF retail Co. Ltd. | 111,006 | 9,288 |
| | Hyosung TNC Corp. | 41,437 | 9,221 |
| * | Oscotec Inc. | 451,772 | 9,186 |
| | HD Hyundai Infracore Co. Ltd. | 1,910,072 | 9,142 |
| * | WONIK IPS Co. Ltd. | 454,863 | 9,019 |
| | Hyundai Autoever Corp. | 92,729 | 8,971 |
| | ST Pharm Co. Ltd. | 124,061 | 8,951 |
| * | HLB Life Science Co. Ltd. | 1,380,265 | 8,794 |
| | Medytox Inc. | 70,959 | 8,780 |
| *,1,2 | SK IE Technology Co. Ltd. | 352,505 | 8,701 |
| * | Hanwha Engine | 841,467 | 8,635 |
| | Pan Ocean Co. Ltd. | 3,367,006 | 8,629 |
| | Green Cross Corp. | 72,719 | 8,524 |
| * | Lunit Inc. | 298,852 | 8,522 |
| | KEPCO Engineering & Construction Co. Inc. | 172,161 | 8,505 |
| | Soulbrain Co. Ltd. | 57,318 | 8,352 |
| | SK REITs Co. Ltd. | 2,478,030 | 8,314 |
| | HS Hyosung Advanced Materials Corp. | 43,025 | 8,254 |
| | DL E&C Co. Ltd. | 368,766 | 8,247 |
| * | Korea Electric Power Corp. ADR | 983,338 | 8,211 |
| | Lotte Energy Materials Corp. | 300,475 | 8,155 |
| | LX International Corp. | 369,454 | 8,113 |
| * | ISU Specialty Chemical | 278,455 | 8,108 |
| | Chong Kun Dang Pharmaceutical Corp. | 108,361 | 8,032 |
| | Dongjin Semichem Co. Ltd. | 408,372 | 7,872 |
| * | SOLUM Co. Ltd. | 564,763 | 7,797 |
Total International Stock Index Fund
| | | | | | Shares | Market
Value•
($000) |
| | SM Entertainment Co. Ltd. | 151,337 | 7,740 |
| | Dongsuh Cos. Inc. | 401,203 | 7,717 |
| * | Wemade Co. Ltd. | 276,331 | 7,697 |
| | Daewoong Pharmaceutical Co. Ltd. | 66,343 | 7,612 |
| * | Chabiotech Co. Ltd. | 607,434 | 7,549 |
| | SOOP Co. Ltd. | 108,097 | 7,488 |
| | Lotte Shopping Co. Ltd. | 156,025 | 7,434 |
| | TCC Steel | 235,069 | 7,355 |
| * | Seojin System Co. Ltd. | 357,534 | 7,314 |
| | CJ Logistics Corp. | 114,505 | 7,260 |
| | HDC Hyundai Development Co-Engineering & Construction | 506,020 | 7,254 |
| | Seegene Inc. | 416,379 | 7,225 |
| * | Daewoo Engineering & Construction Co. Ltd. | 2,803,353 | 7,148 |
| * | Kakao Games Corp. | 556,069 | 7,109 |
| * | VT Co. Ltd. | 290,764 | 7,092 |
| | HK inno N Corp. | 196,135 | 7,014 |
| * | Kakaopay Corp. | 389,740 | 6,873 |
| | Advanced Nano Products Co. Ltd. | 109,265 | 6,814 |
| | LOTTE Fine Chemical Co. Ltd. | 202,870 | 6,791 |
| | LX Semicon Co. Ltd. | 150,309 | 6,640 |
| | ISC Co. Ltd. | 141,624 | 6,563 |
| | Hyundai Wia Corp. | 217,875 | 6,544 |
| | Hyundai Department Store Co. Ltd. | 191,632 | 6,515 |
| | Lotte Corp. | 373,812 | 6,465 |
| | Hite Jinro Co. Ltd. | 420,250 | 6,444 |
| * | HLB Therapeutics Co. Ltd. | 966,531 | 6,440 |
| * | Taihan Electric Wire Co. Ltd. | 759,694 | 6,414 |
| | Hanon Systems | 2,244,323 | 6,408 |
| * | CJ ENM Co. Ltd. | 140,752 | 6,396 |
| | Shinsung Delta Tech Co. Ltd. | 198,634 | 6,357 |
| *,1 | Hyundai Bioscience Co. Ltd. | 505,912 | 6,334 |
| * | Joongang Advanced Materials Co. Ltd. | 755,973 | 6,228 |
| | ESR Kendall Square REIT Co. Ltd. | 1,707,631 | 6,167 |
| * | Fadu Inc. | 396,891 | 6,125 |
| | Ottogi Corp. | 19,970 | 6,084 |
| * | Kumho Tire Co. Inc. | 1,892,842 | 6,068 |
| | HD Hyundai Construction Equipment Co. Ltd. | 162,735 | 6,041 |
| * | Mezzion Pharma Co. Ltd. | 231,646 | 5,975 |
| | Kolon Industries Inc. | 254,865 | 5,974 |
| | Daeduck Electronics Co. Ltd. | 464,734 | 5,712 |
| | DoubleUGames Co. Ltd. | 148,089 | 5,694 |
| | Koh Young Technology Inc. | 718,239 | 5,645 |
| * | Cosmochemical Co. Ltd. | 365,530 | 5,619 |
| | AMOREPACIFIC Group | 347,154 | 5,594 |
| * | Kum Yang Co. Ltd. | 186,274 | 5,546 |
| | Sebang Global Battery Co. Ltd. | 106,708 | 5,452 |
| * | Synopex Inc. | 1,053,434 | 5,440 |
| | Hana Micron Inc. | 672,532 | 5,424 |
| * | Lake Materials Co. Ltd. | 509,386 | 5,413 |
| | Hana Tour Service Inc. | 150,542 | 5,341 |
| | Korea Electric Terminal Co. Ltd. | 94,568 | 5,216 |
| * | Bioneer Corp. | 302,594 | 5,200 |
| * | Doosan Fuel Cell Co. Ltd. | 414,220 | 5,191 |
| | SL Corp. | 217,375 | 5,168 |
| | Dentium Co. Ltd. | 89,983 | 5,109 |
| * | Eubiologics Co. Ltd. | 455,490 | 5,065 |
| | Shinhan Alpha REIT Co. Ltd. | 1,206,184 | 5,055 |
| | SK Networks Co. Ltd. | 1,323,628 | 5,018 |
| 1 | Ecopro HN Co. Ltd. | 148,834 | 4,998 |
| | Daewoong Co. Ltd. | 266,149 | 4,989 |
| | SK Gas Ltd. | 34,439 | 4,970 |
| * | GemVax & Kael Co. Ltd. | 497,093 | 4,943 |
| | Eugene Technology Co. Ltd. | 184,944 | 4,939 |
| | SK Chemicals Co. Ltd. | 136,172 | 4,912 |
| | Paradise Co. Ltd. | 631,993 | 4,825 |
| * | Binex Co. Ltd. | 326,041 | 4,759 |
| | Cheryong Electric Co. Ltd. | 124,992 | 4,720 |
| | NEXTIN Inc. | 101,297 | 4,702 |
| | Youngone Holdings Co. Ltd. | 71,784 | 4,591 |
| | DongKook Pharmaceutical Co. Ltd. | 344,168 | 4,466 |
Total International Stock Index Fund
| | | | | | Shares | Market
Value•
($000) |
| | DL Holdings Co. Ltd. | 150,843 | 4,465 |
| | Innocean Worldwide Inc. | 311,600 | 4,461 |
| | Daou Technology Inc. | 336,860 | 4,460 |
| | Daishin Securities Co. Ltd. | 358,521 | 4,457 |
| | Hankook & Co. Co. Ltd. | 360,899 | 4,365 |
| | Green Cross Holdings Corp. | 367,789 | 4,356 |
| | Lotte Chilsung Beverage Co. Ltd. | 49,006 | 4,330 |
| | YG Entertainment Inc. | 156,071 | 4,301 |
| * | Creative & Innovative System | 668,568 | 4,215 |
| 1 | TKG Huchems Co. Ltd. | 285,183 | 4,106 |
| | LOTTE REIT Co. Ltd. | 1,679,397 | 4,090 |
| | Daesang Corp. | 273,228 | 4,068 |
| | Hyosung Corp. | 113,059 | 4,066 |
| *,1 | Shin Poong Pharmaceutical Co. Ltd. | 458,971 | 4,043 |
| | Sam-A Aluminum Co. Ltd. | 110,003 | 4,022 |
| | BH Co. Ltd. | 334,697 | 4,000 |
| | PSK Inc. | 266,255 | 3,933 |
| | Com2uSCorp | 123,768 | 3,877 |
| | Hanwha General Insurance Co. Ltd. | 1,089,861 | 3,767 |
| * | Hanwha Investment & Securities Co. Ltd. | 1,464,075 | 3,746 |
| | Intellian Technologies Inc. | 100,227 | 3,733 |
| * | Foosung Co. Ltd. | 826,809 | 3,725 |
| | Hanssem Co. Ltd. | 96,886 | 3,718 |
| * | SK oceanplant Co. Ltd. | 384,178 | 3,708 |
| | S&S Tech Corp. | 222,518 | 3,705 |
| 1 | Taekwang Industrial Co. Ltd. | 7,847 | 3,701 |
| | NICE Information Service Co. Ltd. | 459,376 | 3,688 |
| * | W-Scope Chungju Plant Co. Ltd. | 298,196 | 3,684 |
| | Myoung Shin Industrial Co. Ltd. | 377,787 | 3,680 |
| | Youlchon Chemical Co. Ltd. | 176,193 | 3,635 |
| | Dong-A ST Co. Ltd. | 65,622 | 3,631 |
| | Dong-A Socio Holdings Co. Ltd. | 40,136 | 3,605 |
| | JW Pharmaceutical Corp. | 185,118 | 3,601 |
| | Tokai Carbon Korea Co. Ltd. | 58,572 | 3,589 |
| | Ahnlab Inc. | 82,956 | 3,561 |
| | KCC Glass Corp. | 125,315 | 3,555 |
| * | Asiana Airlines Inc. | 485,187 | 3,535 |
| | Seoul Semiconductor Co. Ltd. | 516,914 | 3,500 |
| | Han Kuk Carbon Co. Ltd. | 441,211 | 3,458 |
| * | CJ CGV Co. Ltd. | 850,375 | 3,457 |
| | LS Materials Ltd. | 309,920 | 3,446 |
| | JR Global REIT | 1,526,111 | 3,440 |
| | OCI Co. Ltd. | 65,556 | 3,406 |
| * | Lotte Tour Development Co. Ltd. | 484,248 | 3,388 |
| | i-SENS Inc. | 242,761 | 3,371 |
| | SFA Engineering Corp. | 221,721 | 3,368 |
| | Posco M-Tech Co. Ltd. | 291,182 | 3,356 |
| | KC Tech Co. Ltd. | 130,215 | 3,350 |
| | Binggrae Co. Ltd. | 73,007 | 3,323 |
| * | SD Biosensor Inc. | 504,960 | 3,313 |
| | Solus Advanced Materials Co. Ltd. | 367,388 | 3,303 |
| * | Cafe24 Corp. | 189,302 | 3,271 |
| * | Duk San Neolux Co. Ltd. | 165,599 | 3,266 |
| *,1 | Dawonsys Co. Ltd. | 404,881 | 3,246 |
| | Innox Advanced Materials Co. Ltd. | 183,395 | 3,242 |
| | SK Discovery Co. Ltd. | 130,275 | 3,184 |
| * | Nexon Games Co. Ltd. | 309,374 | 3,176 |
| | Orion Holdings Corp. | 260,501 | 3,166 |
| | Boryung | 391,611 | 3,143 |
| | HDC Holdings Co. Ltd. | 383,732 | 3,120 |
| | Lotte Wellfood Co. Ltd. | 32,583 | 3,079 |
| | Lotte Rental Co. Ltd. | 147,432 | 3,070 |
| * | Jeju Air Co. Ltd. | 443,764 | 3,056 |
| | Korea Petrochemical Ind Co. Ltd. | 39,287 | 3,054 |
| | Hancom Inc. | 221,156 | 3,014 |
| | SIMMTECH Co. Ltd. | 252,322 | 2,980 |
| | LX Holdings Corp. | 576,385 | 2,972 |
| | Partron Co. Ltd. | 564,076 | 2,904 |
| | Samyang Holdings Corp. | 56,501 | 2,903 |
| * | Korea Line Corp. | 2,217,284 | 2,900 |
Total International Stock Index Fund
| | | | | | Shares | Market
Value•
($000) |
| | HAESUNG DS Co. Ltd. | 151,328 | 2,894 |
| | MegaStudyEdu Co. Ltd. | 92,492 | 2,877 |
| | SNT Motiv Co. Ltd. | 86,528 | 2,857 |
| | Doosan Tesna Inc. | 133,533 | 2,857 |
| 1 | GC Cell Corp. | 111,875 | 2,809 |
| * | Pharmicell Co. Ltd. | 768,679 | 2,800 |
| * | Sungeel Hitech Co. Ltd. | 69,347 | 2,740 |
| | Sungwoo Hitech Co. Ltd. | 604,616 | 2,724 |
| * | PI Advanced Materials Co. Ltd. | 183,234 | 2,722 |
| | Dongkuk Steel Mill Co. Ltd. | 428,503 | 2,700 |
| * | SFA Semicon Co. Ltd. | 1,023,047 | 2,686 |
| * | Studio Dragon Corp. | 88,567 | 2,609 |
| * | BNC Korea Co. Ltd. | 751,861 | 2,604 |
| | IS Dongseo Co. Ltd. | 178,055 | 2,591 |
| | Unid Co. Ltd. | 51,320 | 2,591 |
| | Soulbrain Holdings Co. Ltd. | 73,177 | 2,560 |
| | LF Corp. | 232,869 | 2,520 |
| * | Genexine Inc. | 477,920 | 2,517 |
| | Caregen Co. Ltd. | 206,061 | 2,517 |
| | Zinus Inc. | 141,966 | 2,479 |
| | NHN Corp. | 198,411 | 2,413 |
| | Harim Holdings Co. Ltd. | 616,135 | 2,400 |
| * | Ananti Inc. | 648,243 | 2,392 |
| * | AbClon Inc. | 200,879 | 2,372 |
| | Hyundai Home Shopping Network Corp. | 68,059 | 2,345 |
| | InBody Co. Ltd. | 132,861 | 2,342 |
| | Neowiz | 155,511 | 2,338 |
| | LX Hausys Ltd. | 80,792 | 2,310 |
| | INTOPS Co. Ltd. | 158,857 | 2,303 |
| | Samwha Capacitor Co. Ltd. | 97,230 | 2,302 |
| | Namyang Dairy Products Co. Ltd. | 4,575 | 2,286 |
| | Webzen Inc. | 186,052 | 2,285 |
| * | Shinsung E&G Co. Ltd. | 2,166,956 | 2,275 |
| * | Amicogen Inc. | 667,408 | 2,271 |
| * | KMW Co. Ltd. | 393,194 | 2,252 |
| 1 | Grand Korea Leisure Co. Ltd. | 270,864 | 2,238 |
| | Yuanta Securities Korea Co. Ltd. | 1,077,671 | 2,224 |
| | Nexen Tire Corp. | 455,439 | 2,220 |
| * | Chunbo Co. Ltd. | 55,325 | 2,215 |
| | TES Co. Ltd. | 182,932 | 2,205 |
| | Sung Kwang Bend Co. Ltd. | 237,348 | 2,197 |
| | Solid Inc. | 662,209 | 2,186 |
| 1 | Advanced Process Systems Corp. | 170,112 | 2,174 |
| | Hanil Cement Co. Ltd. | 211,513 | 2,165 |
| | E1 Corp. | 40,080 | 2,158 |
| | Eugene Investment & Securities Co. Ltd. | 757,438 | 2,158 |
| *,1 | Humasis Co. Ltd. | 1,527,212 | 2,152 |
| | SeAH Besteel Holdings Corp. | 150,066 | 2,148 |
| | HL Holdings Corp. | 84,866 | 2,144 |
| | L&C Bio Co. Ltd. | 163,873 | 2,109 |
| * | Il Dong Pharmaceutical Co. Ltd. | 215,173 | 2,107 |
| * | CMG Pharmaceutical Co. Ltd. | 1,383,322 | 2,087 |
| | Handsome Co. Ltd. | 184,711 | 2,078 |
| | NICE Holdings Co. Ltd. | 254,663 | 2,077 |
| | Tongyang Life Insurance Co. Ltd. | 469,728 | 2,073 |
| | Hanjin Transportation Co. Ltd. | 149,541 | 2,070 |
| | Songwon Industrial Co. Ltd. | 209,953 | 2,070 |
| | RFHIC Corp. | 220,289 | 2,054 |
| | KISWIRE Ltd. | 146,537 | 2,035 |
| | Kwang Dong Pharmaceutical Co. Ltd. | 507,711 | 2,030 |
| | Mcnex Co. Ltd. | 162,393 | 2,030 |
| * | Yungjin Pharmaceutical Co. Ltd. | 1,145,473 | 1,992 |
| | Hansae Co. Ltd. | 175,738 | 1,950 |
| * | Bukwang Pharmaceutical Co. Ltd. | 545,704 | 1,916 |
| * | Vaxcell-Bio Therapeutics Co. Ltd. | 203,706 | 1,893 |
| | Huons Co. Ltd. | 94,688 | 1,875 |
| | KISCO Corp. | 287,978 | 1,856 |
| | Young Poong Corp. | 6,339 | 1,826 |
| | Samchully Co. Ltd. | 27,852 | 1,821 |
| | GOLFZON Co. Ltd. | 38,816 | 1,813 |
Total International Stock Index Fund
| | | | | | Shares | Market
Value•
($000) |
| | Dongwon F&B Co. Ltd. | 77,728 | 1,783 |
| | HS Industries Co. Ltd. | 577,669 | 1,779 |
| | Humedix Co. Ltd. | 80,799 | 1,778 |
| | Huons Global Co. Ltd. | 71,504 | 1,777 |
| * | DIO Corp. | 143,992 | 1,736 |
| | Korea United Pharm Inc. | 115,149 | 1,729 |
| | Yunsung F&C Co. Ltd. | 43,512 | 1,719 |
| | TK Corp. | 192,614 | 1,715 |
| * | GeneOne Life Science Inc. | 947,687 | 1,712 |
| | Seobu T&D | 381,892 | 1,707 |
| | Hyundai GF Holdings | 528,465 | 1,706 |
| *,1,3 | Cellivery Therapeutics Inc. | 348,823 | 1,688 |
| | UniTest Inc. | 228,447 | 1,680 |
| * | Danal Co. Ltd. | 729,057 | 1,658 |
| | SK Securities Co. Ltd. | 4,469,700 | 1,646 |
| | Dongwon Industries Co. Ltd. | 66,658 | 1,621 |
| | Hyundai Green Food | 191,261 | 1,613 |
| | Chongkundang Holdings Corp. | 39,812 | 1,604 |
| | Samyang Corp. | 44,771 | 1,603 |
| | Hankook Shell Oil Co. Ltd. | 6,713 | 1,574 |
| * | HLB Global Co. Ltd. | 538,895 | 1,566 |
| * | Daea TI Co. Ltd. | 800,898 | 1,541 |
| | Ilyang Pharmaceutical Co. Ltd. | 168,671 | 1,540 |
| | HYUNDAI Corp. | 109,431 | 1,522 |
| | ENF Technology Co. Ltd. | 131,062 | 1,517 |
| *,1 | Komipharm International Co. Ltd. | 474,283 | 1,478 |
| * | CrystalGenomics Invites Co. Ltd. | 815,512 | 1,471 |
| * | Insun ENT Co. Ltd. | 364,506 | 1,469 |
| | NHN KCP Corp. | 278,495 | 1,458 |
| | iMarketKorea Inc. | 239,457 | 1,457 |
| | Shinsegae International Inc. | 153,810 | 1,454 |
| * | Helixmith Co. Ltd. | 548,751 | 1,448 |
| | Vieworks Co. Ltd. | 83,129 | 1,435 |
| | KH Vatec Co. Ltd. | 215,093 | 1,434 |
| | iNtRON Biotechnology Inc. | 331,610 | 1,400 |
| | KC Co. Ltd. | 102,699 | 1,399 |
| | Korea Asset In Trust Co. Ltd. | 661,416 | 1,397 |
| | Korea Real Estate Investment & Trust Co. Ltd. | 1,850,286 | 1,396 |
| | Able C&C Co. Ltd. | 260,162 | 1,350 |
| *,1 | ITM Semiconductor Co. Ltd. | 100,548 | 1,341 |
| 1 | Modetour Network Inc. | 185,816 | 1,338 |
| * | NEPES Corp. | 235,118 | 1,326 |
| | Tongyang Inc. | 2,409,270 | 1,325 |
| | Aekyung Industrial Co. Ltd. | 114,520 | 1,316 |
| | Hansol Paper Co. Ltd. | 191,324 | 1,297 |
| | Namhae Chemical Corp. | 273,548 | 1,291 |
| 1 | Cuckoo Homesys Co. Ltd. | 80,217 | 1,288 |
| * | Samsung Pharmaceutical Co. Ltd. | 1,129,226 | 1,277 |
| | Daeduck Co. Ltd. | 282,865 | 1,271 |
| | Daol Investment & Securities Co. Ltd. | 612,327 | 1,239 |
| *,3 | NKMax Co. Ltd. | 844,504 | 1,236 |
| 1 | Gradiant Corp. | 141,434 | 1,230 |
| | Dongkuk CM Co. Ltd. | 261,366 | 1,210 |
| | Daehan Flour Mill Co. Ltd. | 12,382 | 1,191 |
| * | Namsun Aluminum Co. Ltd. | 1,204,132 | 1,190 |
| * | Hanwha Galleria Corp. | 1,246,685 | 1,153 |
| * | MedPacto Inc. | 295,500 | 1,131 |
| * | Wysiwyg Studios Co. Ltd. | 1,217,088 | 1,071 |
| | Hansol Technics Co. Ltd. | 330,902 | 1,040 |
| | SPC Samlip Co. Ltd. | 28,906 | 1,038 |
| | Toptec Co. Ltd. | 272,405 | 1,033 |
| * | Interflex Co. Ltd. | 140,528 | 1,027 |
| * | Enplus Co. Ltd. | 916,902 | 893 |
| * | Enzychem Lifesciences Corp. | 835,938 | 856 |
| * | Hyosung Chemical Corp. | 28,283 | 816 |
| * | Medipost Co. Ltd. | 161,161 | 769 |
| * | HS Hyosung Corp. | 22,136 | 639 |
| *,3 | Kuk-il Paper Manufacturing Co. Ltd. | 1,083,583 | 628 |
| | Maeil Dairies Co. Ltd. | 22,224 | 618 |
| | Jeil Pharmaceutical Co. Ltd. | 59,980 | 609 |
Total International Stock Index Fund
| | | | | | Shares | Market
Value•
($000) |
| | LOTTE Himart Co. Ltd. | 96,869 | 560 |
| * | KUMHOE&C Co. Ltd. | 254,188 | 531 |
| | Kolon Corp. | 46,488 | 485 |
| * | HJ Shipbuilding & Construction Co. Ltd. | 213,967 | 354 |
| * | Wonik Holdings Co. Ltd. | 176,935 | 284 |
| * | Sangsangin Co. Ltd. | 203,030 | 245 |
| | Eusu Holdings Co. Ltd. | 66,115 | 245 |
| | CJ Freshway Corp. | 17,567 | 225 |
| * | Com2uS Holdings Corp. | 12,171 | 205 |
| | Hansol Holdings Co. Ltd. | 38,167 | 64 |
| | Nature Holdings Co. Ltd. | 5,880 | 42 |
| | | | | | | 12,470,923 |
| Spain (1.7%) |
| | Iberdrola SA | 83,875,222 | 1,245,928 |
| | Banco Santander SA | 209,599,295 | 1,023,975 |
| | Industria de Diseno Textil SA | 14,643,636 | 834,902 |
| | Banco Bilbao Vizcaya Argentaria SA | 79,373,058 | 790,133 |
| | Amadeus IT Group SA | 6,074,624 | 440,370 |
| | CaixaBank SA | 55,149,119 | 336,066 |
| | Ferrovial SE | 7,219,808 | 289,751 |
| 2 | Cellnex Telecom SA | 7,808,418 | 286,770 |
| | Telefonica SA | 58,281,201 | 273,493 |
| 2 | Aena SME SA | 981,336 | 217,484 |
| | Repsol SA | 16,401,299 | 205,318 |
| | Banco de Sabadell SA | 73,240,397 | 142,847 |
| | ACS Actividades de Construccion y Servicios SA | 2,703,224 | 129,634 |
| | Redeia Corp. SA | 6,025,418 | 111,565 |
| | Endesa SA | 4,409,074 | 95,153 |
| | Bankinter SA | 8,983,834 | 73,294 |
| | Merlin Properties Socimi SA | 6,029,851 | 67,283 |
| | Enagas SA | 3,458,692 | 49,063 |
| | Naturgy Energy Group SA | 1,748,077 | 43,525 |
| * | Grifols SA | 3,667,432 | 41,168 |
| | Acciona SA | 318,869 | 40,921 |
| | Mapfre SA | 13,763,606 | 39,345 |
| | Viscofan SA | 516,792 | 34,561 |
| | Vidrala SA | 318,549 | 34,445 |
| | Fluidra SA | 1,256,007 | 33,948 |
| | Inmobiliaria Colonial Socimi SA | 4,991,034 | 30,251 |
| | Indra Sistemas SA | 1,698,460 | 29,943 |
| 2 | Unicaja Banco SA | 21,576,041 | 27,123 |
| | Logista Integral SA | 871,378 | 26,697 |
| | Acerinox SA | 2,718,611 | 24,911 |
| | Laboratorios Farmaceuticos Rovi SA | 288,623 | 24,518 |
| | Sacyr SA | 6,484,507 | 21,593 |
| | Faes Farma SA | 4,287,916 | 16,469 |
| | Corp. ACCIONA Energias Renovables SA | 780,268 | 16,153 |
| | CIE Automotive SA | 598,282 | 16,054 |
| | Construcciones y Auxiliar de Ferrocarriles SA | 354,951 | 14,041 |
| | Pharma Mar SA | 178,270 | 13,732 |
| | Linea Directa Aseguradora SA Cia de Seguros y Reaseguros | 9,481,721 | 11,989 |
| *,1 | Solaria Energia y Medio Ambiente SA | 1,138,364 | 11,940 |
| | Almirall SA | 1,194,289 | 11,664 |
| | Melia Hotels International SA | 1,473,548 | 10,968 |
| | Lar Espana Real Estate Socimi SA | 867,657 | 7,750 |
| * | Tecnicas Reunidas SA | 624,863 | 7,558 |
| | Fomento de Construcciones y Contratas SA | 480,544 | 6,723 |
| 2 | Gestamp Automocion SA | 2,153,914 | 6,326 |
| 2 | Neinor Homes SA | 370,853 | 6,087 |
| | Atresmedia Corp. de Medios de Comunicacion SA | 1,216,312 | 5,767 |
| | Ence Energia y Celulosa SA | 1,750,536 | 5,475 |
| 2 | Global Dominion Access SA | 1,527,311 | 4,330 |
| 1 | Prosegur Cia de Seguridad SA | 1,932,629 | 3,971 |
| 2 | Prosegur Cash SA | 4,353,063 | 2,545 |
| * | Distribuidora Internacional de Alimentacion SA | 182,943,725 | 2,492 |
| *,1 | Applus Services SA | 135,453 | 1,877 |
| | Banco Santander SA (XMEX) | 4 | — |
| | | | | | | 7,249,889 |
Total International Stock Index Fund
| | | | | | Shares | Market
Value•
($000) |
| Sweden (2.2%) |
| | Investor AB Class B | 23,758,622 | 672,466 |
| | Volvo AB Class B | 22,770,449 | 593,098 |
| | Atlas Copco AB Class A | 35,383,587 | 583,950 |
| | Assa Abloy AB Class B | 13,573,911 | 425,172 |
| | Telefonaktiebolaget LM Ericsson Class B | 38,665,018 | 324,172 |
| | Atlas Copco AB Class B | 20,960,965 | 304,766 |
| | Skandinaviska Enskilda Banken AB Class A | 21,228,099 | 299,810 |
| | Sandvik AB | 15,031,517 | 295,874 |
| | Hexagon AB Class B | 29,404,199 | 274,904 |
| | EQT AB | 8,781,210 | 254,769 |
| | Swedbank AB Class A | 12,023,408 | 243,961 |
| 2 | Evolution AB | 2,531,059 | 239,304 |
| | Essity AB Class B | 8,413,264 | 237,748 |
| | Investor AB Class A | 7,414,474 | 210,504 |
| | Svenska Handelsbanken AB Class A | 19,441,856 | 202,013 |
| | Alfa Laval AB | 4,309,667 | 190,788 |
| | Epiroc AB Class A | 8,716,133 | 170,229 |
| 1 | H & M Hennes & Mauritz AB Class B | 8,278,705 | 123,413 |
| | Boliden AB | 3,817,151 | 119,416 |
| | Svenska Cellulosa AB SCA Class B | 8,350,888 | 110,560 |
| | Indutrade AB | 3,721,881 | 101,275 |
| | Telia Co. AB | 34,499,238 | 100,335 |
| | Nibe Industrier AB Class B | 20,277,847 | 98,318 |
| | Trelleborg AB Class B | 2,937,088 | 97,703 |
| | Skanska AB Class B | 4,750,566 | 96,712 |
| | Lifco AB Class B | 3,168,705 | 94,548 |
| | Saab AB Class B | 4,483,706 | 92,090 |
| | Epiroc AB Class B | 5,225,018 | 90,012 |
| | SKF AB Class B | 4,710,221 | 89,343 |
| | AddTech AB Class B | 3,114,468 | 86,711 |
| | Beijer Ref AB Class B | 5,697,092 | 85,819 |
| | Industrivarden AB Class C | 2,449,960 | 84,210 |
| | Securitas AB Class B | 6,772,974 | 79,677 |
| * | Swedish Orphan Biovitrum AB | 2,551,268 | 79,595 |
| | Tele2 AB Class B | 7,327,726 | 76,891 |
| * | Castellum AB | 5,965,969 | 74,710 |
| | AAK AB | 2,432,453 | 69,828 |
| | Sagax AB Class B | 2,874,027 | 69,261 |
| * | Fastighets AB Balder Class B | 8,844,664 | 68,807 |
| * | Sectra AB Class B | 2,112,218 | 56,256 |
| | Getinge AB Class B | 3,111,972 | 55,053 |
| | Investment AB Latour Class B | 1,978,964 | 54,623 |
| | Lagercrantz Group AB Class B | 2,658,791 | 52,070 |
| | L E Lundbergforetagen AB Class B | 1,029,770 | 50,984 |
| | Nordnet AB publ | 2,397,393 | 49,884 |
| | Sweco AB Class B | 2,810,343 | 47,507 |
| | Industrivarden AB Class A | 1,362,563 | 46,996 |
| | Volvo AB Class A | 1,766,367 | 46,348 |
| 2 | Thule Group AB | 1,352,228 | 45,262 |
| | Holmen AB Class B | 1,081,593 | 42,742 |
| | Fortnox AB | 6,896,155 | 42,103 |
| | Mycronic AB | 1,048,556 | 40,849 |
| | Wihlborgs Fastigheter AB | 3,713,919 | 39,040 |
| | SSAB AB Class B | 7,775,382 | 36,678 |
| | Avanza Bank Holding AB | 1,752,563 | 36,506 |
| *,1 | Embracer Group AB Class B | 12,488,348 | 36,111 |
| | Hemnet Group AB | 1,108,058 | 34,925 |
| | Axfood AB | 1,506,391 | 33,633 |
| | Hexpol AB | 3,466,953 | 32,967 |
| 1 | Husqvarna AB Class B | 4,756,717 | 30,720 |
| | Loomis AB Class B | 957,342 | 29,993 |
| 2 | Munters Group AB | 1,821,616 | 29,509 |
| | Elekta AB Class B | 4,812,327 | 28,990 |
| | Fabege AB | 3,511,019 | 28,000 |
| *,2 | BoneSupport Holding AB | 863,487 | 27,189 |
| | Bure Equity AB | 755,278 | 27,051 |
| | Billerud Aktiebolag | 3,046,029 | 27,046 |
| *,2 | Sinch AB | 8,628,488 | 25,767 |
| * | Camurus AB | 445,435 | 25,049 |
Total International Stock Index Fund
| | | | | | Shares | Market
Value•
($000) |
| * | Electrolux AB Class B | 2,898,901 | 24,330 |
| 2 | Dometic Group AB | 4,469,135 | 24,269 |
| * | Kinnevik AB Class B | 3,386,180 | 24,098 |
| | Catena AB | 507,953 | 23,284 |
| | Nyfosa AB | 2,221,764 | 22,476 |
| | Wallenstam AB Class B | 4,622,003 | 21,861 |
| | Electrolux Professional AB Class B | 3,158,534 | 21,775 |
| * | Betsson AB Class B | 1,622,831 | 21,610 |
| | Pandox AB Class B | 1,229,088 | 21,372 |
| | Vitec Software Group AB Class B | 477,704 | 20,821 |
| 2 | Bravida Holding AB | 2,803,438 | 20,812 |
| | Peab AB Class B | 2,670,381 | 20,355 |
| | AFRY AB | 1,351,561 | 20,336 |
| | Vitrolife AB | 909,927 | 20,243 |
| | Lindab International AB | 954,563 | 20,012 |
| | AddLife AB Class B | 1,521,065 | 19,330 |
| *,1 | Volvo Car AB Class B | 8,855,312 | 19,134 |
| | MIPS AB | 366,862 | 17,994 |
| | Hufvudstaden AB Class A | 1,505,129 | 17,789 |
| | Granges AB | 1,468,883 | 17,355 |
| | NCC AB Class B | 1,156,142 | 17,209 |
| | Addnode Group AB Class B | 1,690,595 | 16,961 |
| | SSAB AB Class A | 3,396,369 | 16,341 |
| | Alleima AB | 2,611,900 | 15,961 |
| | Storskogen Group AB Class B | 19,183,151 | 15,924 |
| | HMS Networks AB | 418,235 | 15,562 |
| 1 | NCAB Group AB | 2,485,358 | 15,325 |
| | JM AB | 900,840 | 15,267 |
| | Bufab AB | 410,617 | 14,734 |
| | Nolato AB Class B | 2,434,964 | 12,792 |
| | Cibus Nordic Real Estate AB publ | 784,071 | 12,661 |
| | Atrium Ljungberg AB Class B | 619,281 | 12,423 |
| *,2 | Scandic Hotels Group AB | 1,838,763 | 11,881 |
| | Bilia AB Class A | 974,257 | 11,486 |
| | Biotage AB | 762,320 | 11,449 |
| | INVISIO AB | 448,267 | 11,335 |
| * | Sdiptech AB Class B | 495,648 | 11,192 |
| | Medicover AB Class B | 639,444 | 11,029 |
| | Troax Group AB | 535,750 | 10,887 |
| | Arjo AB Class B | 3,113,491 | 10,269 |
| | Truecaller AB Class B | 2,289,123 | 10,244 |
| * | Hexatronic Group AB | 2,497,550 | 10,230 |
| | Instalco AB | 3,326,778 | 10,139 |
| | Beijer Alma AB | 600,770 | 9,679 |
| | Dios Fastigheter AB | 1,217,096 | 9,078 |
| | SkiStar AB | 564,956 | 8,700 |
| * | Modern Times Group MTG AB Class B | 1,216,936 | 8,682 |
| | Ratos AB Class B | 2,706,287 | 8,649 |
| *,2 | Boozt AB | 772,158 | 8,633 |
| 1 | Samhallsbyggnadsbolaget i Norden AB Ordinary Shares | 16,119,435 | 8,569 |
| | Clas Ohlson AB Class B | 508,821 | 8,427 |
| | NP3 Fastigheter AB | 360,643 | 8,411 |
| | Sagax AB | 2,702,941 | 8,095 |
| | MEKO AB | 560,891 | 7,544 |
| | Cloetta AB Class B | 2,903,424 | 7,299 |
| * | Better Collective A/S | 542,499 | 7,129 |
| | Systemair AB | 928,879 | 7,105 |
| 2 | Attendo AB | 1,554,463 | 6,925 |
| *,1,2 | BioArctic AB Class B | 468,977 | 6,489 |
| | Platzer Fastigheter Holding AB Class B | 745,823 | 6,311 |
| 1 | Svenska Handelsbanken AB Class B | 428,485 | 5,774 |
| | Fagerhult Group AB | 943,656 | 5,327 |
| | Corem Property Group AB Class B | 7,399,555 | 4,997 |
| | Investment AB Oresund | 444,944 | 4,734 |
| * | Stillfront Group AB | 6,215,426 | 4,323 |
| * | Norion Bank AB | 1,108,383 | 4,322 |
| | Skandinaviska Enskilda Banken AB Class C | 241,960 | 3,470 |
| | Volati AB | 362,594 | 3,359 |
| * | Intrum AB | 625,702 | 2,028 |
| 1 | Samhallsbyggnadsbolaget i Norden AB | 2,076,635 | 1,806 |
Total International Stock Index Fund
| | | | | | Shares | Market
Value•
($000) |
| | NCC AB Class A | 33,477 | 498 |
| *,3 | OW Bunker A/S | 129,331 | — |
| | | | | | | 9,569,533 |
| Switzerland (5.5%) |
| | Nestle SA (Registered) | 35,888,312 | 3,391,181 |
| | Novartis AG (Registered) | 28,464,323 | 3,088,558 |
| | Roche Holding AG | 9,645,068 | 2,989,040 |
| | UBS Group AG (Registered) | 44,758,431 | 1,369,070 |
| | ABB Ltd. (Registered) | 22,121,023 | 1,229,290 |
| | Zurich Insurance Group AG | 2,009,232 | 1,184,654 |
| | Cie Financiere Richemont SA (Registered) Class A | 7,407,102 | 1,078,478 |
| | Holcim AG | 7,835,194 | 769,422 |
| | Alcon AG | 6,882,177 | 632,147 |
| | Lonza Group AG (Registered) | 975,927 | 600,515 |
| | Sika AG (Registered) | 2,117,207 | 589,679 |
| | Givaudan SA (Registered) | 110,830 | 526,160 |
| | Swiss Re AG | 4,049,024 | 517,009 |
| | Partners Group Holding AG | 307,960 | 423,700 |
| | Swiss Life Holding AG (Registered) | 400,148 | 325,841 |
| | Geberit AG (Registered) | 464,413 | 290,949 |
| | Sandoz Group AG | 5,999,129 | 273,490 |
| | Sonova Holding AG (Registered) | 680,898 | 249,166 |
| | SGS SA (Registered) | 2,075,276 | 219,703 |
| | Swisscom AG (Registered) | 354,481 | 215,979 |
| | Straumann Holding AG (Registered) | 1,490,505 | 196,507 |
| | Logitech International SA (Registered) | 2,158,085 | 176,708 |
| | Kuehne + Nagel International AG (Registered) | 706,050 | 176,258 |
| 1 | Roche Holding AG (Bearer) | 517,405 | 175,847 |
| | Julius Baer Group Ltd. | 2,835,745 | 172,900 |
| | Schindler Holding AG | 567,509 | 165,161 |
| | Chocoladefabriken Lindt & Spruengli AG (Registered) | 1,405 | 163,639 |
| | Chocoladefabriken Lindt & Spruengli AG | 13,528 | 159,579 |
| 2 | VAT Group AG | 358,500 | 149,277 |
| | Baloise Holding AG (Registered) | 631,773 | 120,908 |
| | Swiss Prime Site AG (Registered) | 1,067,790 | 115,836 |
| | SIG Group AG | 4,605,377 | 99,385 |
| | PSP Swiss Property AG (Registered) | 630,799 | 89,580 |
| | Barry Callebaut AG (Registered) | 49,659 | 87,096 |
| | Swatch Group AG | 423,313 | 86,865 |
| | Belimo Holding AG (Registered) | 129,427 | 85,737 |
| | Georg Fischer AG (Registered) | 1,146,208 | 83,169 |
| | Schindler Holding AG (Registered) | 289,724 | 82,598 |
| | Helvetia Holding AG (Registered) | 485,252 | 81,964 |
| | EMS-Chemie Holding AG (Registered) | 98,966 | 76,111 |
| * | Galderma Group AG | 805,332 | 75,452 |
| | Siegfried Holding AG (Registered) | 57,326 | 74,882 |
| | Accelleron Industries AG | 1,310,265 | 70,253 |
| | Adecco Group AG (Registered) | 2,229,481 | 69,742 |
| | Flughafen Zurich AG (Registered) | 264,271 | 62,300 |
| 2 | Galenica AG | 681,579 | 59,319 |
| | Avolta AG | 1,468,578 | 58,388 |
| | Temenos AG (Registered) | 822,916 | 56,999 |
| | Tecan Group AG (Registered) | 177,590 | 44,872 |
| | BKW AG | 251,958 | 44,269 |
| | Clariant AG (Registered) | 3,149,096 | 43,765 |
| | Swissquote Group Holding SA (Registered) | 121,101 | 41,195 |
| | Banque Cantonale Vaudoise (Registered) | 393,917 | 39,253 |
| | Sulzer AG (Registered) | 242,302 | 37,354 |
| | Cembra Money Bank AG | 406,325 | 36,591 |
| | Allreal Holding AG (Registered) | 203,125 | 36,142 |
| | DKSH Holding AG | 497,254 | 35,524 |
| | Bucher Industries AG (Registered) | 90,555 | 35,269 |
| | SFS Group AG | 244,893 | 35,041 |
| | Bachem Holding AG | 435,336 | 34,453 |
| | Comet Holding AG (Registered) | 103,639 | 34,384 |
| | dormakaba Holding AG | 42,850 | 32,675 |
| | Inficon Holding AG (Registered) | 27,116 | 32,489 |
| | Burckhardt Compression Holding AG | 43,652 | 32,092 |
| | Mobimo Holding AG (Registered) | 98,457 | 30,509 |
Total International Stock Index Fund
| | | | | | Shares | Market
Value•
($000) |
| | VZ Holding AG | 183,804 | 29,660 |
| | Emmi AG (Registered) | 29,250 | 27,801 |
| | Landis+Gyr Group AG | 326,037 | 26,264 |
| | Interroll Holding AG (Registered) | 9,719 | 25,559 |
| | Valiant Holding AG (Registered) | 217,031 | 25,294 |
| | Kardex Holding AG (Registered) | 81,611 | 24,896 |
| | Vontobel Holding AG (Registered) | 382,253 | 24,885 |
| * | Aryzta AG | 13,079,954 | 23,131 |
| | Swatch Group AG (Registered) | 555,741 | 22,517 |
| | Ypsomed Holding AG (Registered) | 50,277 | 22,300 |
| | Stadler Rail AG | 744,756 | 21,279 |
| | Huber + Suhner AG (Registered) | 223,529 | 21,156 |
| | ALSO Holding AG (Registered) | 79,128 | 21,046 |
| | St. Galler Kantonalbank AG (Registered) | 38,188 | 18,622 |
| | EFG International AG | 1,345,504 | 18,387 |
| | Bossard Holding AG (Registered) Class A | 73,723 | 17,713 |
| | Daetwyler Holding AG | 101,996 | 17,179 |
| | Softwareone Holding AG | 1,467,922 | 13,264 |
| | SKAN Group AG | 148,247 | 13,261 |
| * | ams-OSRAM AG | 1,363,376 | 13,216 |
| | Forbo Holding AG (Registered) | 13,129 | 12,907 |
| | OC Oerlikon Corp. AG Pfaffikon (Registered) | 2,604,178 | 11,924 |
| 2 | Medacta Group SA | 86,142 | 11,456 |
| | Intershop Holding AG | 75,414 | 10,608 |
| *,2 | Sensirion Holding AG | 144,452 | 10,531 |
| * | Arbonia AG | 729,132 | 10,265 |
| | COSMO Pharmaceuticals NV | 132,035 | 10,220 |
| | LEM Holding SA (Registered) | 6,617 | 8,822 |
| *,1 | Basilea Pharmaceutica AG Allschwil (Registered) | 170,422 | 8,459 |
| | Komax Holding AG (Registered) | 66,400 | 8,442 |
| | Bell Food Group AG (Registered) | 26,366 | 8,083 |
| | u-blox Holding AG | 97,720 | 7,479 |
| | Implenia AG (Registered) | 208,490 | 7,369 |
| | Zehnder Group AG | 126,749 | 7,078 |
| 1 | Autoneum Holding AG | 51,223 | 6,864 |
| *,2 | PolyPeptide Group AG | 203,477 | 6,788 |
| | Bystronic AG | 17,490 | 6,678 |
| *,1 | DocMorris AG | 160,932 | 6,327 |
| | Schweiter Technologies AG | 12,932 | 5,906 |
| | Vetropack Holding AG (Registered) Class A | 171,811 | 5,696 |
| *,2 | Montana Aerospace AG | 306,396 | 5,412 |
| | Investis Holding SA | 38,386 | 4,892 |
| | Rieter Holding AG (Registered) | 40,779 | 4,317 |
| | Leonteq AG | 139,666 | 4,086 |
| *,2 | Medartis Holding AG | 63,201 | 4,055 |
| 2 | Medmix AG | 328,784 | 3,774 |
| | VP Bank AG Class A | 39,659 | 3,347 |
| | APG SGA SA | 13,792 | 3,149 |
| *,1 | Idorsia Ltd. | 1,931,021 | 2,213 |
| 1 | PIERER Mobility AG | 124,607 | 1,715 |
| | | | | | | 24,298,660 |
| Taiwan (5.6%) |
| | Taiwan Semiconductor Manufacturing Co. Ltd. | 335,038,748 | 10,506,643 |
| | Hon Hai Precision Industry Co. Ltd. | 166,472,135 | 1,067,040 |
| | MediaTek Inc. | 20,663,239 | 804,383 |
| | Delta Electronics Inc. | 30,157,649 | 372,474 |
| | Quanta Computer Inc. | 37,049,648 | 336,460 |
| | Fubon Financial Holding Co. Ltd. | 113,475,910 | 316,990 |
| | Cathay Financial Holding Co. Ltd. | 128,489,646 | 271,363 |
| | CTBC Financial Holding Co. Ltd. | 228,603,922 | 253,425 |
| | United Microelectronics Corp. | 159,036,905 | 229,450 |
| | ASE Technology Holding Co. Ltd. | 47,109,461 | 222,159 |
| | Mega Financial Holding Co. Ltd. | 164,442,360 | 200,356 |
| | Chunghwa Telecom Co. Ltd. | 50,244,198 | 190,724 |
| | Uni-President Enterprises Corp. | 66,794,979 | 187,053 |
| | E.Sun Financial Holding Co. Ltd. | 212,075,701 | 180,335 |
| | Asustek Computer Inc. | 9,827,511 | 173,533 |
| | Yuanta Financial Holding Co. Ltd. | 172,709,790 | 173,222 |
| | First Financial Holding Co. Ltd. | 154,079,630 | 129,744 |
Total International Stock Index Fund
| | | | | | Shares | Market
Value•
($000) |
| | Wistron Corp. | 37,894,524 | 127,370 |
| | Accton Technology Corp. | 7,408,436 | 124,489 |
| 1 | Novatek Microelectronics Corp. | 7,974,121 | 123,211 |
| | Taiwan Cooperative Financial Holding Co. Ltd. | 152,856,545 | 119,514 |
| | SinoPac Financial Holdings Co. Ltd. | 164,563,382 | 116,820 |
| | KGI Financial Holding Co. Ltd. | 219,276,115 | 112,987 |
| | Hua Nan Financial Holdings Co. Ltd. | 143,011,201 | 112,771 |
| | China Steel Corp. | 157,577,247 | 110,210 |
| | Yageo Corp. | 6,476,025 | 110,147 |
| | E Ink Holdings Inc. | 11,019,378 | 103,133 |
| | Largan Precision Co. Ltd. | 1,421,346 | 99,552 |
| | Realtek Semiconductor Corp. | 6,627,988 | 97,249 |
| | Chailease Holding Co. Ltd. | 20,252,630 | 94,839 |
| | Nan Ya Plastics Corp. | 72,303,133 | 93,157 |
| | TCC Group Holdings Co. Ltd. | 92,515,758 | 91,907 |
| | Hotai Motor Co. Ltd. | 4,532,817 | 91,223 |
| | Evergreen Marine Corp. Taiwan Ltd. | 14,192,711 | 89,927 |
| | eMemory Technology Inc. | 924,253 | 89,870 |
| | Unimicron Technology Corp. | 18,107,661 | 88,434 |
| | Lite-On Technology Corp. | 27,780,809 | 87,087 |
| | Pegatron Corp. | 28,455,541 | 86,282 |
| 1 | International Games System Co. Ltd. | 2,729,052 | 86,108 |
| * | Shin Kong Financial Holding Co. Ltd. | 226,959,929 | 80,309 |
| | Formosa Plastics Corp. | 51,963,724 | 76,205 |
| | Asia Vital Components Co. Ltd. | 3,968,998 | 76,033 |
| | Taiwan Mobile Co. Ltd. | 20,680,541 | 72,888 |
| | President Chain Store Corp. | 7,822,379 | 71,824 |
| | Silergy Corp. | 4,584,644 | 71,128 |
| * | PharmaEssentia Corp. | 3,566,000 | 69,739 |
| | Chroma ATE Inc. | 5,510,121 | 69,647 |
| | Wiwynn Corp. | 1,208,000 | 68,678 |
| | Far EasTone Telecommunications Co. Ltd. | 24,622,569 | 67,992 |
| | Alchip Technologies Ltd. | 1,060,520 | 65,692 |
| | Shanghai Commercial & Savings Bank Ltd. | 52,027,048 | 64,630 |
| 1 | Jentech Precision Industrial Co. Ltd. | 1,417,802 | 63,669 |
| | Advantech Co. Ltd. | 6,378,803 | 62,513 |
| | Compal Electronics Inc. | 56,559,652 | 62,088 |
| | Catcher Technology Co. Ltd. | 8,431,062 | 61,363 |
| | Voltronic Power Technology Corp. | 911,425 | 59,939 |
| | King Yuan Electronics Co. Ltd. | 15,472,721 | 58,315 |
| | Formosa Chemicals & Fibre Corp. | 47,589,437 | 56,774 |
| 1 | Elite Material Co. Ltd. | 4,230,298 | 53,976 |
| 1 | Gigabyte Technology Co. Ltd. | 6,826,160 | 53,802 |
| | ASPEED Technology Inc. | 423,660 | 53,723 |
| | Chang Hwa Commercial Bank Ltd. | 97,691,126 | 53,681 |
| | Airtac International Group | 1,895,008 | 52,454 |
| | Lotes Co. Ltd. | 1,031,173 | 52,444 |
| | Micro-Star International Co. Ltd. | 9,511,460 | 52,029 |
| | Innolux Corp. | 103,813,241 | 50,048 |
| | Yang Ming Marine Transport Corp. | 24,342,962 | 49,977 |
| | Asia Cement Corp. | 34,165,955 | 49,647 |
| | Acer Inc. | 39,978,771 | 49,541 |
| 1 | Inventec Corp. | 35,793,836 | 49,504 |
| | Far Eastern New Century Corp. | 40,760,493 | 47,035 |
| | WPG Holdings Ltd. | 20,631,420 | 46,876 |
| | Eclat Textile Co. Ltd. | 2,764,128 | 46,203 |
| 1 | Globalwafers Co. Ltd. | 3,511,436 | 45,709 |
| | Global Unichip Corp. | 1,217,525 | 45,515 |
| | Eva Airways Corp. | 37,640,943 | 43,472 |
| | Synnex Technology International Corp. | 18,908,184 | 41,531 |
| | Chicony Electronics Co. Ltd. | 8,187,280 | 41,289 |
| | Taiwan Business Bank | 84,653,106 | 40,721 |
| | Tripod Technology Corp. | 6,882,270 | 40,623 |
| | Vanguard International Semiconductor Corp. | 13,726,369 | 40,516 |
| * | Tatung Co. Ltd. | 29,491,778 | 40,252 |
| | Radiant Opto-Electronics Corp. | 6,169,517 | 40,157 |
| | AUO Corp. | 77,582,699 | 39,970 |
| | Foxconn Technology Co. Ltd. | 15,411,233 | 38,118 |
| | Cheng Shin Rubber Industry Co. Ltd. | 25,580,063 | 36,739 |
| | Powertech Technology Inc. | 9,427,231 | 36,709 |
Total International Stock Index Fund
| | | | | | Shares | Market
Value•
($000) |
| | Pou Chen Corp. | 30,880,366 | 36,104 |
| | Walsin Lihwa Corp. | 37,737,022 | 34,586 |
| | Sino-American Silicon Products Inc. | 7,077,540 | 34,255 |
| | Wan Hai Lines Ltd. | 12,836,274 | 33,984 |
| | Phison Electronics Corp. | 2,316,894 | 33,251 |
| | King Slide Works Co. Ltd. | 879,930 | 33,057 |
| | Taishin Financial Holding Co. Ltd. | 61,702,573 | 32,784 |
| | Bizlink Holding Inc. | 2,226,425 | 32,095 |
| | Lien Hwa Industrial Holdings Corp. | 17,033,924 | 31,631 |
| | Makalot Industrial Co. Ltd. | 2,919,650 | 31,323 |
| | Ruentex Development Co. Ltd. | 21,558,196 | 30,949 |
| | Zhen Ding Technology Holding Ltd. | 8,785,214 | 30,294 |
| 1 | Feng TAY Enterprise Co. Ltd. | 6,866,817 | 30,186 |
| | Chung-Hsin Electric & Machinery Manufacturing Corp. | 6,139,593 | 29,880 |
| 1 | Fortune Electric Co. Ltd. | 1,784,100 | 29,863 |
| | Hiwin Technologies Corp. | 4,022,687 | 29,297 |
| | Taichung Commercial Bank Co. Ltd. | 52,879,533 | 29,095 |
| | Teco Electric & Machinery Co. Ltd. | 19,023,034 | 29,076 |
| | Compeq Manufacturing Co. Ltd. | 15,312,494 | 29,002 |
| | ASMedia Technology Inc. | 582,775 | 28,746 |
| | Nien Made Enterprise Co. Ltd. | 1,923,202 | 28,658 |
| | Formosa Petrochemical Corp. | 19,002,003 | 28,454 |
| | China Airlines Ltd. | 40,105,442 | 27,969 |
| | MPI Corp. | 1,121,000 | 27,610 |
| | WT Microelectronics Co. Ltd. | 8,047,360 | 27,082 |
| | Highwealth Construction Corp. | 21,068,799 | 26,465 |
| | Taiwan High Speed Rail Corp. | 29,012,487 | 26,313 |
| 1 | Goldsun Building Materials Co. Ltd. | 15,468,982 | 25,610 |
| | Simplo Technology Co. Ltd. | 2,415,139 | 25,460 |
| * | Winbond Electronics Corp. | 42,824,041 | 25,347 |
| | Shihlin Electric & Engineering Corp. | 3,940,293 | 24,649 |
| | Giant Manufacturing Co. Ltd. | 4,348,931 | 24,519 |
| | Gold Circuit Electronics Ltd. | 4,260,846 | 24,477 |
| 1 | Sinbon Electronics Co. Ltd. | 2,953,391 | 24,175 |
| * | Powerchip Semiconductor Manufacturing Corp. | 43,356,000 | 23,939 |
| 1 | United Integrated Services Co. Ltd. | 2,263,603 | 23,511 |
| | TA Chen Stainless Pipe | 23,222,994 | 23,390 |
| | Parade Technologies Ltd. | 1,046,732 | 22,787 |
| | Faraday Technology Corp. | 3,128,216 | 22,227 |
| | Tong Yang Industry Co. Ltd. | 6,610,142 | 21,858 |
| | Topco Scientific Co. Ltd. | 2,263,440 | 21,851 |
| | Qisda Corp. | 19,001,660 | 21,142 |
| | IBF Financial Holdings Co. Ltd. | 46,208,239 | 21,097 |
| * | Nanya Technology Corp. | 16,152,186 | 20,916 |
| * | Win Semiconductors Corp. | 5,625,163 | 20,829 |
| *,1 | Oneness Biotech Co. Ltd. | 5,146,407 | 20,248 |
| | King's Town Bank Co. Ltd. | 13,043,696 | 20,009 |
| 1 | AURAS Technology Co. Ltd. | 986,000 | 19,812 |
| | Wistron NeWeb Corp. | 5,173,441 | 19,331 |
| | Tung Ho Steel Enterprise Corp. | 8,401,069 | 19,205 |
| | Fositek Corp. | 738,683 | 19,013 |
| | Capital Securities Corp. | 27,687,508 | 18,990 |
| | Macronix International Co. Ltd. | 25,097,546 | 18,689 |
| | Taiwan Hon Chuan Enterprise Co. Ltd. | 3,921,575 | 18,633 |
| | Merida Industry Co. Ltd. | 3,421,004 | 18,633 |
| | Getac Holdings Corp. | 5,415,752 | 18,583 |
| | Taiwan Fertilizer Co. Ltd. | 10,303,225 | 18,261 |
| 1 | Sanyang Motor Co. Ltd. | 8,408,689 | 18,164 |
| | Ruentex Industries Ltd. | 7,651,322 | 18,055 |
| 1 | Jinan Acetate Chemical Co. Ltd. | 674,827 | 17,699 |
| 1 | Mitac Holdings Corp. | 12,645,570 | 17,645 |
| | Poya International Co. Ltd. | 1,126,137 | 17,503 |
| 1 | Run Long Construction Co. Ltd. | 11,563,729 | 17,285 |
| 1 | Taiwan Union Technology Corp. | 3,481,239 | 17,238 |
| | YFY Inc. | 17,916,047 | 17,010 |
| 1 | Bora Pharmaceuticals Co. Ltd. | 755,891 | 16,944 |
| 1 | AP Memory Technology Corp. | 1,834,146 | 16,886 |
| | Chipbond Technology Corp. | 8,531,255 | 16,658 |
| | Genius Electronic Optical Co. Ltd. | 1,173,565 | 16,174 |
| 1 | Century Iron & Steel Industrial Co. Ltd. | 2,505,000 | 15,930 |
Total International Stock Index Fund
| | | | | | Shares | Market
Value•
($000) |
| | Kinik Co. | 1,673,479 | 15,691 |
| | Fusheng Precision Co. Ltd. | 1,691,000 | 15,578 |
| 1 | Yulon Finance Corp. | 3,562,728 | 15,429 |
| | Elan Microelectronics Corp. | 3,430,344 | 15,412 |
| | Acter Group Corp. Ltd. | 1,409,168 | 15,407 |
| | Wisdom Marine Lines Co. Ltd. | 6,774,487 | 15,374 |
| 1 | L&K Engineering Co. Ltd. | 2,200,386 | 15,222 |
| | Taiwan Secom Co. Ltd. | 3,501,339 | 14,824 |
| | Everlight Electronics Co. Ltd. | 5,681,687 | 14,762 |
| | XinTec Inc. | 2,238,714 | 14,445 |
| 1 | Yulon Motor Co. Ltd. | 8,144,958 | 14,400 |
| | Lotus Pharmaceutical Co. Ltd. | 1,842,189 | 14,298 |
| *,1 | Nan Kang Rubber Tire Co. Ltd. | 9,708,745 | 14,292 |
| | Ennostar Inc. | 9,884,740 | 14,263 |
| | Gudeng Precision Industrial Co. Ltd. | 851,969 | 14,102 |
| | Feng Hsin Steel Co. Ltd. | 5,386,000 | 14,009 |
| | Depo Auto Parts Ind Co. Ltd. | 1,870,025 | 13,951 |
| * | HTC Corp. | 10,256,079 | 13,905 |
| | TXC Corp. | 3,824,090 | 13,858 |
| 1 | Walsin Technology Corp. | 4,469,615 | 13,734 |
| | Ta Ya Electric Wire & Cable | 9,701,828 | 13,658 |
| | Far Eastern International Bank | 33,184,424 | 13,569 |
| | Supreme Electronics Co. Ltd. | 6,661,396 | 13,540 |
| | Foxsemicon Integrated Technology Inc. | 1,286,131 | 13,514 |
| | Sigurd Microelectronics Corp. | 5,952,585 | 13,461 |
| 1 | Taiwan Surface Mounting Technology Corp. | 4,067,113 | 13,362 |
| 1 | Silicon Integrated Systems Corp. | 5,556,083 | 13,186 |
| * | Lumosa Therapeutics Co. Ltd. | 1,123,000 | 13,122 |
| | Huaku Development Co. Ltd. | 3,572,841 | 13,009 |
| 1 | EZconn Corp. | 917,000 | 12,920 |
| | Eternal Materials Co. Ltd. | 13,348,185 | 12,876 |
| | Sercomm Corp. | 3,773,250 | 12,854 |
| * | China Petrochemical Development Corp. | 51,616,204 | 12,807 |
| | Fitipower Integrated Technology Inc. | 1,655,121 | 12,604 |
| | All Ring Tech Co. Ltd. | 919,000 | 12,588 |
| 1 | momo.com Inc. | 1,077,432 | 12,502 |
| | Kinsus Interconnect Technology Corp. | 3,789,758 | 12,408 |
| | Grand Process Technology Corp. | 255,701 | 12,405 |
| | Kinpo Electronics | 16,378,193 | 12,283 |
| 1 | Solar Applied Materials Technology Corp. | 6,351,689 | 12,184 |
| | Great Wall Enterprise Co. Ltd. | 7,644,455 | 12,175 |
| | Pixart Imaging Inc. | 1,631,804 | 12,161 |
| | CTCI Corp. | 8,839,642 | 12,034 |
| | Far Eastern Department Stores Ltd. | 15,133,887 | 12,029 |
| * | Elite Advanced Laser Corp. | 1,836,862 | 11,924 |
| | AUO Corp. ADR | 2,315,860 | 11,869 |
| | VisEra Technologies Co. Ltd. | 1,392,000 | 11,859 |
| | Nan Ya Printed Circuit Board Corp. | 2,933,556 | 11,843 |
| 1 | Transcend Information Inc. | 3,939,325 | 11,740 |
| | Ennoconn Corp. | 1,306,996 | 11,726 |
| | Nan Pao Resins Chemical Co. Ltd. | 1,323,000 | 11,632 |
| | Shin Zu Shing Co. Ltd. | 2,173,082 | 11,625 |
| | Yungshin Construction & Development Co. Ltd. | 1,774,142 | 11,597 |
| | Systex Corp. | 2,820,140 | 11,541 |
| | Primax Electronics Ltd. | 4,619,882 | 11,531 |
| | Arcadyan Technology Corp. | 2,366,082 | 11,510 |
| *,1 | Taiwan Glass Industry Corp. | 18,594,615 | 11,190 |
| | Coretronic Corp. | 5,201,212 | 11,054 |
| | Center Laboratories Inc. | 7,244,352 | 11,050 |
| 1 | Visual Photonics Epitaxy Co. Ltd. | 2,561,609 | 11,032 |
| | Kaori Heat Treatment Co. Ltd. | 1,112,344 | 10,854 |
| | Airoha Technology Corp. | 568,000 | 10,774 |
| | Test Research Inc. | 2,631,878 | 10,765 |
| | Charoen Pokphand Enterprise | 3,518,374 | 10,669 |
| * | Mercuries Life Insurance Co. Ltd. | 49,411,350 | 10,512 |
| | President Securities Corp. | 13,206,690 | 10,502 |
| | Chunghwa Telecom Co. Ltd. ADR | 277,613 | 10,463 |
| | Wah Lee Industrial Corp. | 2,775,768 | 10,427 |
| | WinWay Technology Co. Ltd. | 256,387 | 10,277 |
| | Chicony Power Technology Co. Ltd. | 2,637,000 | 10,250 |
Total International Stock Index Fund
| | | | | | Shares | Market
Value•
($000) |
| | U-Ming Marine Transport Corp. | 5,933,610 | 10,230 |
| | Shinkong Insurance Co. Ltd. | 3,349,000 | 10,187 |
| | Allis Electric Co. Ltd. | 2,971,891 | 10,170 |
| | Tong Hsing Electronic Industries Ltd. | 2,562,494 | 10,142 |
| 1 | Via Technologies Inc. | 2,800,909 | 9,926 |
| | LandMark Optoelectronics Corp. | 991,155 | 9,758 |
| | I-Chiun Precision Industry Co. Ltd. | 2,553,016 | 9,641 |
| 1 | FLEXium Interconnect Inc. | 4,135,334 | 9,632 |
| 1 | Gloria Material Technology Corp. | 6,768,126 | 9,624 |
| 1 | ADATA Technology Co. Ltd. | 3,673,958 | 9,589 |
| | Shinkong Synthetic Fibers Corp. | 20,301,312 | 9,584 |
| | Sitronix Technology Corp. | 1,381,567 | 9,465 |
| | Ardentec Corp. | 5,645,391 | 9,447 |
| | Cheng Loong Corp. | 12,722,761 | 9,413 |
| | Merry Electronics Co. Ltd. | 2,860,590 | 9,340 |
| | Asia Optical Co. Inc. | 2,939,519 | 9,208 |
| 1 | EVERGREEN Steel Corp. | 2,910,000 | 9,200 |
| | Raydium Semiconductor Corp. | 874,000 | 9,166 |
| | Pan Jit International Inc. | 5,356,398 | 9,154 |
| | Scientech Corp. | 661,000 | 9,067 |
| | ChipMOS Technologies Inc. | 8,240,348 | 9,058 |
| 1 | AcBel Polytech Inc. | 9,142,328 | 9,017 |
| 1 | Sunonwealth Electric Machine Industry Co. Ltd. | 3,033,000 | 8,951 |
| 1 | C Sun Manufacturing Ltd. | 1,404,090 | 8,832 |
| | O-Bank Co. Ltd. | 28,145,547 | 8,594 |
| | Formosa Taffeta Co. Ltd. | 13,932,498 | 8,572 |
| | Yieh Phui Enterprise Co. Ltd. | 18,223,813 | 8,555 |
| * | Microbio Co. Ltd. | 7,114,733 | 8,379 |
| | Taiwan Paiho Ltd. | 3,352,592 | 8,367 |
| | Chang Wah Electromaterials Inc. | 4,974,000 | 8,361 |
| | Farglory Land Development Co. Ltd. | 3,968,158 | 8,297 |
| | Taiwan Cogeneration Corp. | 6,142,810 | 8,200 |
| *,1 | EirGenix Inc. | 2,830,277 | 8,143 |
| | Kenda Rubber Industrial Co. Ltd. | 8,798,097 | 8,133 |
| | SDI Corp. | 2,206,876 | 8,109 |
| 1 | Orient Semiconductor Electronics Ltd. | 6,850,208 | 8,102 |
| | CyberPower Systems Inc. | 840,000 | 8,016 |
| * | HannStar Display Corp. | 28,315,793 | 7,952 |
| 1 | Dynamic Holding Co. Ltd. | 3,888,365 | 7,952 |
| | M31 Technology Corp. | 348,276 | 7,896 |
| * | Unitech Printed Circuit Board Corp. | 8,461,218 | 7,822 |
| | Sakura Development Co. Ltd. | 4,983,360 | 7,804 |
| | China Motor Corp. | 3,602,222 | 7,641 |
| 1 | Chung Hung Steel Corp. | 11,952,000 | 7,620 |
| | Clevo Co. | 4,409,546 | 7,559 |
| | Allied Supreme Corp. | 735,000 | 7,545 |
| | Hotai Finance Co. Ltd. | 2,667,120 | 7,527 |
| 1 | Cheng Uei Precision Industry Co. Ltd. | 3,777,595 | 7,482 |
| | Tainan Spinning Co. Ltd. | 15,711,940 | 7,413 |
| | Grape King Bio Ltd. | 1,571,683 | 7,356 |
| | Chong Hong Construction Co. Ltd. | 2,717,790 | 7,346 |
| 1 | JPC connectivity Inc. | 1,338,887 | 7,327 |
| | Greatek Electronics Inc. | 4,086,961 | 7,314 |
| | Ambassador Hotel | 4,039,000 | 7,305 |
| | TSRC Corp. | 9,590,009 | 7,235 |
| | Shiny Chemical Industrial Co. Ltd. | 1,386,250 | 7,214 |
| 1 | Ability Opto-Electronics Technology Co. Ltd. | 1,061,703 | 7,190 |
| 1 | Yankey Engineering Co. Ltd. | 748,600 | 7,179 |
| | Universal Microwave Technology Inc. | 763,000 | 7,169 |
| *,1 | Episil Technologies Inc. | 4,212,233 | 7,154 |
| | Standard Foods Corp. | 6,061,849 | 7,100 |
| | Nuvoton Technology Corp. | 2,259,000 | 7,007 |
| 1 | FocalTech Systems Co. Ltd. | 2,696,403 | 6,992 |
| | Taiwan Sakura Corp. | 2,699,006 | 6,970 |
| | ITE Technology Inc. | 1,662,399 | 6,931 |
| 1 | United Microelectronics Corp. ADR | 1,006,015 | 6,881 |
| | Wowprime Corp. | 925,593 | 6,874 |
| 1 | Innodisk Corp. | 861,776 | 6,850 |
| | Pegavision Corp. | 587,542 | 6,810 |
| | Johnson Health Tech Co. Ltd. | 1,460,092 | 6,781 |
Total International Stock Index Fund
| | | | | | Shares | Market
Value•
($000) |
| 1 | Chenbro Micom Co. Ltd. | 782,000 | 6,730 |
| | Cathay Real Estate Development Co. Ltd. | 8,921,505 | 6,684 |
| | Kindom Development Co. Ltd. | 4,761,850 | 6,683 |
| | Elite Semiconductor Microelectronics Technology Inc. | 3,218,717 | 6,671 |
| | Hannstar Board Corp. | 3,864,604 | 6,645 |
| | Evergreen International Storage & Transport Corp. | 6,943,793 | 6,619 |
| | TTY Biopharm Co. Ltd. | 2,889,457 | 6,592 |
| *,1 | TaiMed Biologics Inc. | 2,605,263 | 6,544 |
| | Wafer Works Corp. | 7,249,312 | 6,538 |
| | China Steel Chemical Corp. | 2,165,245 | 6,533 |
| | Chief Telecom Inc. | 449,800 | 6,528 |
| | Sporton International Inc. | 996,138 | 6,500 |
| 1 | ITEQ Corp. | 2,744,177 | 6,477 |
| | Topkey Corp. | 904,000 | 6,457 |
| | G Shank Enterprise Co. Ltd. | 2,406,335 | 6,456 |
| | Kenmec Mechanical Engineering Co. Ltd. | 2,363,363 | 6,377 |
| | Cleanaway Co. Ltd. | 1,119,359 | 6,375 |
| | Sinon Corp. | 4,851,000 | 6,298 |
| | BES Engineering Corp. | 18,702,754 | 6,293 |
| * | United Renewable Energy Co. Ltd. | 18,199,408 | 6,293 |
| | Global Mixed Mode Technology Inc. | 904,342 | 6,290 |
| | Hsin Kuang Steel Co. Ltd. | 3,657,403 | 6,282 |
| *,1 | Andes Technology Corp. | 523,000 | 6,280 |
| | Dynapack International Technology Corp. | 1,876,479 | 6,268 |
| 1 | Quanta Storage Inc. | 2,115,136 | 6,220 |
| | UPI Semiconductor Corp. | 817,000 | 6,194 |
| 1 | LuxNet Corp. | 1,469,000 | 6,183 |
| | Pan-International Industrial Corp. | 5,297,613 | 6,124 |
| | Promate Electronic Co. Ltd. | 2,386,000 | 6,077 |
| | Hu Lane Associate Inc. | 1,162,944 | 6,069 |
| * | TPK Holding Co. Ltd. | 4,615,313 | 5,963 |
| | Taiwan-Asia Semiconductor Corp. | 5,509,266 | 5,893 |
| | Materials Analysis Technology Inc. | 709,000 | 5,890 |
| * | RichWave Technology Corp. | 1,130,337 | 5,814 |
| | Machvision Inc. | 528,775 | 5,809 |
| | Gemtek Technology Corp. | 5,280,668 | 5,762 |
| | Weikeng Industrial Co. Ltd. | 5,350,000 | 5,762 |
| | Continental Holdings Corp. | 6,581,000 | 5,723 |
| | Synmosa Biopharma Corp. | 5,051,307 | 5,693 |
| | Marketech International Corp. | 1,208,000 | 5,662 |
| 1 | Solomon Technology Corp. | 1,320,000 | 5,643 |
| 1 | Kuo Toong International Co. Ltd. | 2,996,809 | 5,624 |
| | AmTRAN Technology Co. Ltd. | 8,740,211 | 5,621 |
| 1 | Taiwan Semiconductor Co. Ltd. | 2,896,342 | 5,605 |
| *,1 | Taiwan TEA Corp. | 8,676,399 | 5,600 |
| | Chin-Poon Industrial Co. Ltd. | 4,752,799 | 5,582 |
| | Formosa International Hotels Corp. | 894,756 | 5,558 |
| | Advanced Wireless Semiconductor Co. | 1,950,030 | 5,509 |
| | Thinking Electronic Industrial Co. Ltd. | 1,087,000 | 5,476 |
| 1 | JSL Construction & Development Co. Ltd. | 2,028,500 | 5,468 |
| 1 | Co-Tech Development Corp. | 2,993,000 | 5,467 |
| | Global Brands Manufacture Ltd. | 3,011,799 | 5,425 |
| 1 | Hota Industrial Manufacturing Co. Ltd. | 3,152,801 | 5,410 |
| | Oriental Union Chemical Corp. | 9,872,474 | 5,406 |
| | Advanced Energy Solution Holding Co. Ltd. | 339,450 | 5,397 |
| | Delpha Construction Co. Ltd. | 4,445,000 | 5,391 |
| 1 | Nantex Industry Co. Ltd. | 4,996,409 | 5,377 |
| | Holy Stone Enterprise Co. Ltd. | 1,936,982 | 5,371 |
| *,1 | Egis Technology Inc. | 926,582 | 5,370 |
| * | International CSRC Investment Holdings Co. | 11,477,159 | 5,329 |
| | Syncmold Enterprise Corp. | 1,701,099 | 5,301 |
| | Chang Wah Technology Co. Ltd. | 4,694,000 | 5,273 |
| | Universal Cement Corp. | 5,611,240 | 5,270 |
| 1 | Forcecon Tech Co. Ltd. | 1,116,000 | 5,263 |
| * | Sunplus Technology Co. Ltd. | 5,845,752 | 5,261 |
| | Great Tree Pharmacy Co. Ltd. | 959,096 | 5,245 |
| | Posiflex Technology Inc. | 818,612 | 5,242 |
| * | CSBC Corp. Taiwan | 9,772,257 | 5,231 |
| | Universal Vision Biotechnology Co. Ltd. | 768,580 | 5,211 |
| | Brighton-Best International Taiwan Inc. | 4,985,367 | 5,209 |
Total International Stock Index Fund
| | | | | | Shares | Market
Value•
($000) |
| * | Grand Pacific Petrochemical | 13,858,951 | 5,192 |
| | Soft-World International Corp. | 1,221,372 | 5,181 |
| | Anpec Electronics Corp. | 906,000 | 5,176 |
| | Ton Yi Industrial Corp. | 10,059,324 | 5,123 |
| | YungShin Global Holding Corp. | 2,923,898 | 5,112 |
| | Fulgent Sun International Holding Co. Ltd. | 1,531,744 | 5,104 |
| *,1 | CyberTAN Technology Inc. | 4,608,006 | 5,099 |
| 1 | ASROCK Inc. | 823,000 | 5,083 |
| | CMC Magnetics Corp. | 14,021,253 | 5,054 |
| * | Longchen Paper & Packaging Co. Ltd. | 12,096,091 | 5,029 |
| * | General Interface Solution Holding Ltd. | 2,854,276 | 5,018 |
| | USI Corp. | 11,509,641 | 4,997 |
| | Nichidenbo Corp. | 2,661,000 | 4,989 |
| * | Phihong Technology Co. Ltd. | 4,237,768 | 4,939 |
| | TCI Co. Ltd. | 1,163,788 | 4,797 |
| | Evergreen Aviation Technologies Corp. | 1,644,000 | 4,723 |
| | Genesys Logic Inc. | 1,045,000 | 4,719 |
| 1 | Shinfox Energy Co. Ltd. | 1,307,000 | 4,706 |
| 1 | Zyxel Group Corp. | 3,625,952 | 4,669 |
| *,1 | OBI Pharma Inc. | 2,262,690 | 4,661 |
| | Chunghwa Precision Test Tech Co. Ltd. | 247,368 | 4,490 |
| 1 | Adlink Technology Inc. | 2,100,484 | 4,460 |
| | Darfon Electronics Corp. | 2,962,164 | 4,441 |
| | TYC Brother Industrial Co. Ltd. | 2,410,099 | 4,413 |
| | TaiDoc Technology Corp. | 894,645 | 4,382 |
| 1 | Channel Well Technology Co. Ltd. | 2,290,000 | 4,382 |
| * | Etron Technology Inc. | 3,806,767 | 4,369 |
| 1 | Actron Technology Corp. | 871,577 | 4,332 |
| | D-Link Corp. | 7,312,584 | 4,313 |
| 1 | Ability Enterprise Co. Ltd. | 3,016,904 | 4,312 |
| 1 | TSEC Corp. | 6,470,803 | 4,305 |
| * | Lung Yen Life Service Corp. | 2,968,221 | 4,257 |
| | Flytech Technology Co. Ltd. | 1,590,785 | 4,233 |
| 1 | Everlight Chemical Industrial Corp. | 5,648,329 | 4,208 |
| | Gamania Digital Entertainment Co. Ltd. | 1,716,424 | 4,188 |
| | PharmaEngine Inc. | 1,321,477 | 4,180 |
| | China Metal Products | 3,659,113 | 4,169 |
| | Hung Sheng Construction Ltd. | 5,152,107 | 4,168 |
| | Infortrend Technology Inc. | 3,725,873 | 4,165 |
| | Xxentria Technology Materials Corp. | 2,253,343 | 4,154 |
| * | Medigen Vaccine Biologics Corp. | 3,201,336 | 4,120 |
| * | Ritek Corp. | 9,200,658 | 4,043 |
| *,1 | Fittech Co. Ltd. | 802,890 | 4,019 |
| 1 | ZillTek Technology Corp. | 377,000 | 4,016 |
| | Sampo Corp. | 4,491,497 | 4,007 |
| | Kung Long Batteries Industrial Co. Ltd. | 866,599 | 3,982 |
| | YC INOX Co. Ltd. | 5,887,049 | 3,972 |
| | Huang Hsiang Construction Corp. | 2,243,571 | 3,968 |
| | St. Shine Optical Co. Ltd. | 602,727 | 3,947 |
| | Taiwan PCB Techvest Co. Ltd. | 3,381,549 | 3,947 |
| | Dimerco Express Corp. | 1,491,843 | 3,913 |
| | Brogent Technologies Inc. | 706,643 | 3,905 |
| | Sinyi Realty Inc. | 4,160,300 | 3,882 |
| 1 | Ichia Technologies Inc. | 3,123,439 | 3,870 |
| | Taiflex Scientific Co. Ltd. | 2,356,592 | 3,842 |
| 1 | Waffer Technology Corp. | 1,747,500 | 3,810 |
| 1 | Weltrend Semiconductor | 2,080,182 | 3,763 |
| | UPC Technology Corp. | 10,826,277 | 3,723 |
| 1 | Taiwan Mask Corp. | 2,181,000 | 3,680 |
| | T3EX Global Holdings Corp. | 1,389,000 | 3,678 |
| | Holtek Semiconductor Inc. | 2,150,952 | 3,676 |
| | IEI Integration Corp. | 1,549,669 | 3,654 |
| | Advanced International Multitech Co. Ltd. | 1,470,115 | 3,620 |
| | Cub Elecparts Inc. | 1,205,100 | 3,612 |
| * | RDC Semiconductor Co. Ltd. | 536,120 | 3,585 |
| * | Adimmune Corp. | 4,704,575 | 3,539 |
| | Bank of Kaohsiung Co. Ltd. | 9,730,292 | 3,522 |
| 1 | Alpha Networks Inc. | 3,288,750 | 3,509 |
| | Firich Enterprises Co. Ltd. | 3,544,652 | 3,496 |
| * | Apex International Co. Ltd. | 2,597,000 | 3,492 |
Total International Stock Index Fund
| | | | | | Shares | Market
Value•
($000) |
| | KMC Kuei Meng International Inc. | 816,000 | 3,451 |
| * | Career Technology MFG. Co. Ltd. | 5,731,270 | 3,443 |
| | Advanced Ceramic X Corp. | 682,971 | 3,395 |
| * | Chung Hwa Pulp Corp. | 5,781,818 | 3,313 |
| | Namchow Holdings Co. Ltd. | 1,909,971 | 3,260 |
| | Ho Tung Chemical Corp. | 12,421,141 | 3,251 |
| 1 | WUS Printed Circuit Co. Ltd. | 2,058,785 | 3,241 |
| 1 | Sincere Navigation Corp. | 4,024,309 | 3,240 |
| | Chlitina Holding Ltd. | 725,231 | 3,181 |
| 1 | Nidec Chaun-Choung Technology Corp. | 491,645 | 3,177 |
| | Chia Hsin Cement Corp. | 5,767,720 | 3,156 |
| * | Foresee Pharmaceuticals Co. Ltd. | 1,305,841 | 3,154 |
| * | Lealea Enterprise Co. Ltd. | 11,161,721 | 3,133 |
| | China Bills Finance Corp. | 6,748,028 | 3,125 |
| 1 | Formosa Sumco Technology Corp. | 849,000 | 3,109 |
| | Kuo Yang Construction Co. Ltd. | 4,785,000 | 3,106 |
| | Rechi Precision Co. Ltd. | 3,849,896 | 3,080 |
| 1 | Motech Industries Inc. | 4,135,988 | 3,074 |
| | Mercuries & Associates Holding Ltd. | 5,839,111 | 3,047 |
| * | China Man-Made Fiber Corp. | 12,691,236 | 3,046 |
| * | Polaris Group | 1,979,000 | 3,040 |
| * | Shining Building Business Co. Ltd. | 9,371,769 | 3,033 |
| | Chun Yuan Steel Industry Co. Ltd. | 5,365,000 | 3,024 |
| | Altek Corp. | 2,957,823 | 3,022 |
| | Sunny Friend Environmental Technology Co. Ltd. | 1,012,675 | 3,011 |
| 1 | Tong-Tai Machine & Tool Co. Ltd. | 3,070,126 | 2,995 |
| 1 | China General Plastics Corp. | 6,031,597 | 2,993 |
| | KEE TAI Properties Co. Ltd. | 6,022,988 | 2,987 |
| | Amazing Microelectronic Corp. | 993,526 | 2,969 |
| | Wei Chuan Foods Corp. | 5,320,507 | 2,967 |
| | Bioteque Corp. | 777,525 | 2,958 |
| | FSP Technology Inc. | 1,631,071 | 2,948 |
| | Rich Development Co. Ltd. | 9,359,885 | 2,889 |
| | Sonix Technology Co. Ltd. | 1,963,316 | 2,835 |
| | Tung Thih Electronic Co. Ltd. | 910,929 | 2,802 |
| 1 | Lingsen Precision Industries Ltd. | 4,740,421 | 2,795 |
| | Kaimei Electronic Corp. | 1,416,200 | 2,795 |
| | Ultra Chip Inc. | 1,008,000 | 2,791 |
| | Sensortek Technology Corp. | 348,000 | 2,776 |
| | Gourmet Master Co. Ltd. | 1,003,237 | 2,752 |
| | ScinoPharm Taiwan Ltd. | 3,679,946 | 2,750 |
| | Formosan Rubber Group Inc. | 3,475,375 | 2,746 |
| | Asia Polymer Corp. | 5,358,624 | 2,735 |
| | Swancor Holding Co. Ltd. | 852,426 | 2,731 |
| 1 | Darwin Precisions Corp. | 6,185,570 | 2,635 |
| | Tyntek Corp. | 3,883,095 | 2,626 |
| | Savior Lifetec Corp. | 3,838,851 | 2,618 |
| | Iron Force Industrial Co. Ltd. | 754,907 | 2,578 |
| * | Federal Corp. | 3,746,195 | 2,543 |
| 1 | Panion & BF Biotech Inc. | 957,163 | 2,541 |
| * | Taiwan Styrene Monomer | 6,733,977 | 2,524 |
| * | Gigastorage Corp. | 4,381,817 | 2,476 |
| | 91APP Inc. | 847,931 | 2,454 |
| | Hong Pu Real Estate Development Co. Ltd. | 2,652,931 | 2,378 |
| | Zeng Hsing Industrial Co. Ltd. | 710,774 | 2,360 |
| * | First Steamship Co. Ltd. | 9,563,441 | 2,321 |
| | Speed Tech Corp. | 1,513,000 | 2,303 |
| * | HannsTouch Holdings Co. | 6,761,304 | 2,300 |
| | Radium Life Tech Co. Ltd. | 7,636,336 | 2,271 |
| * | PChome Online Inc. | 1,485,259 | 2,233 |
| 1 | Elitegroup Computer Systems Co. Ltd. | 2,932,479 | 2,200 |
| | TA-I Technology Co. Ltd. | 1,490,535 | 2,155 |
| | China Electric Manufacturing Corp. | 4,291,227 | 2,155 |
| * | Li Peng Enterprise Co. Ltd. | 8,547,714 | 2,107 |
| | Rexon Industrial Corp. Ltd. | 1,880,000 | 2,010 |
| | AGV Products Corp. | 5,439,983 | 1,987 |
| 1 | CHC Healthcare Group | 1,529,222 | 1,972 |
| | Cenra Inc. | 1,615,883 | 1,942 |
| | Globe Union Industrial Corp. | 3,772,405 | 1,932 |
| | Senao International Co. Ltd. | 1,693,253 | 1,844 |
Total International Stock Index Fund
| | | | | | Shares | Market
Value•
($000) |
| * | Taigen Biopharmaceuticals Holdings Ltd. | 4,042,526 | 1,739 |
| * | Medigen Biotechnology Corp. | 1,500,797 | 1,694 |
| | VIA Labs Inc. | 348,000 | 1,627 |
| * | Yeong Guan Energy Technology Group Co. Ltd. | 1,309,515 | 1,573 |
| | Taiyen Biotech Co. Ltd. | 1,462,580 | 1,526 |
| | Cyberlink Corp. | 518,066 | 1,450 |
| * | Gigasolar Materials Corp. | 503,916 | 1,422 |
| | Basso Industry Corp. | 1,044,339 | 1,400 |
| * | ALI Corp. | 2,283,362 | 1,381 |
| * | Newmax Technology Co. Ltd. | 1,553,000 | 1,319 |
| * | Zinwell Corp. | 2,403,006 | 1,313 |
| | Nan Liu Enterprise Co. Ltd. | 582,000 | 1,276 |
| * | Shin Foong Specialty & Applied Materials Co. Ltd. | 660,361 | 1,204 |
| | Sheng Yu Steel Co. Ltd. | 1,463,000 | 1,191 |
| * | Dyaco International Inc. | 1,387,534 | 1,181 |
| | Yulon Nissan Motor Co. Ltd. | 301,842 | 1,020 |
| *,3 | Taiwan Land Development Corp. | 448,935 | — |
| *,3 | Pharmally International Holding Co. Ltd. | 868,039 | — |
| | | | | | | 24,569,546 |
| Thailand (0.6%) |
| | PTT PCL (Foreign) | 199,320,765 | 198,022 |
| | Delta Electronics Thailand PCL (Foreign) | 38,907,510 | 158,135 |
| | CP ALL PCL (Foreign) | 83,067,700 | 155,701 |
| | Advanced Info Service PCL (Foreign) | 15,600,925 | 126,991 |
| | Bangkok Dusit Medical Services PCL (Foreign) | 152,114,167 | 123,994 |
| | Airports of Thailand PCL (Foreign) | 59,828,164 | 108,493 |
| | Kasikornbank PCL (Foreign) | 24,459,929 | 106,014 |
| | Gulf Energy Development PCL (Foreign) | 41,952,203 | 82,731 |
| | Central Pattana PCL (Foreign) | 43,544,311 | 81,014 |
| | SCB X PCL (Foreign) | 23,529,353 | 79,131 |
| | PTT Exploration & Production PCL (Foreign) | 19,259,017 | 72,334 |
| | Bumrungrad Hospital PCL (Foreign) | 7,920,043 | 63,920 |
| | Siam Cement PCL (Foreign) | 10,152,747 | 63,203 |
| * | True Corp. PCL (Foreign) | 146,441,536 | 53,329 |
| | Krung Thai Bank PCL (Foreign) | 86,188,391 | 52,348 |
| | Charoen Pokphand Foods PCL (Foreign) | 61,811,412 | 45,495 |
| | Minor International PCL (Foreign) | 55,834,401 | 44,256 |
| | Intouch Holdings PCL (Foreign) | 12,101,267 | 38,367 |
| | Central Retail Corp. PCL (Foreign) | 38,591,522 | 36,566 |
| | Bangkok Bank PCL (Foreign) | 7,999,164 | 34,814 |
| | TMBThanachart Bank PCL (Foreign) | 606,703,774 | 32,012 |
| | Bangkok Expressway & Metro PCL (Foreign) | 110,963,786 | 25,914 |
| | Tisco Financial Group PCL (Foreign) | 8,119,109 | 23,216 |
| | Banpu PCL (Foreign) | 123,923,012 | 22,946 |
| | CP Axtra PCL (Foreign) | 21,911,788 | 22,077 |
| | Home Product Center PCL (Foreign) | 77,856,461 | 22,006 |
| | PTT Global Chemical PCL (Foreign) | 28,398,781 | 21,890 |
| * | BTS Group Holdings PCL (Foreign) | 144,488,234 | 21,198 |
| | Krungthai Card PCL (Foreign) | 14,565,539 | 20,567 |
| | Thai Union Group PCL (Foreign) | 46,128,960 | 20,496 |
| | Digital Telecommunications Infrastructure Fund | 72,334,089 | 20,028 |
| | Land & Houses PCL (Foreign) | 114,301,788 | 19,654 |
| | Indorama Ventures PCL (Foreign) | 25,003,783 | 19,184 |
| | Thai Oil PCL (Foreign) | 15,644,749 | 19,019 |
| | WHA Corp. PCL (Foreign) | 103,406,915 | 17,878 |
| | PTT Oil & Retail Business PCL (Foreign) | 38,368,283 | 17,509 |
| | Thanachart Capital PCL (Foreign) | 10,761,302 | 16,753 |
| | Srisawad Corp. PCL (Foreign) | 12,805,416 | 16,162 |
| | Ratch Group PCL (Foreign) | 16,091,654 | 15,373 |
| | KCE Electronics PCL (Foreign) | 13,941,175 | 14,749 |
| | Muangthai Capital PCL (Foreign) | 9,372,631 | 14,039 |
| | Com7 PCL (Foreign) | 16,834,714 | 13,936 |
| | Kiatnakin Phatra Bank PCL (Foreign) | 8,053,120 | 12,995 |
| 1 | SCG Packaging PCL (Foreign) | 16,769,109 | 12,645 |
| | Sansiri PCL (Foreign) | 222,212,921 | 12,023 |
| | Electricity Generating PCL (Foreign) | 3,373,038 | 11,990 |
| | Bangchak Corp. PCL (Foreign) | 11,829,550 | 11,988 |
| | Global Power Synergy PCL (Foreign) | 9,523,376 | 11,902 |
| | Osotspa PCL (Foreign) | 19,123,683 | 11,716 |
Total International Stock Index Fund
| | | | | | Shares | Market
Value•
($000) |
| | Thai Life Insurance PCL (Foreign) | 34,580,600 | 11,483 |
| | Carabao Group PCL (Foreign) | 4,733,106 | 11,175 |
| | Siam Global House PCL (Foreign) | 23,407,094 | 11,160 |
| | Asset World Corp. PCL (Foreign) | 98,531,098 | 10,803 |
| | Hana Microelectronics PCL (Foreign) | 9,173,853 | 10,327 |
| 1 | Berli Jucker PCL (Foreign) | 14,397,428 | 10,252 |
| | Supalai PCL (Foreign) | 17,521,763 | 10,175 |
| | Amata Corp. PCL (Foreign) | 11,735,975 | 10,162 |
| | Bangkok Airways PCL (Foreign) | 13,463,493 | 10,148 |
| | CPN Retail Growth Leasehold REIT | 27,487,300 | 9,847 |
| | 3BB Internet Infrastructure Fund | 51,290,168 | 9,501 |
| | Central Plaza Hotel PCL (Foreign) | 8,848,352 | 9,450 |
| | Ngern Tid Lor PCL (Foreign) | 17,944,919 | 9,393 |
| | AP Thailand PCL (Foreign) | 31,796,970 | 8,986 |
| * | Jasmine Technology Solution PCL (Foreign) | 3,903,801 | 8,237 |
| | CH Karnchang PCL (Foreign) | 14,337,448 | 8,166 |
| | Plan B Media PCL (Foreign) | 34,949,355 | 7,706 |
| 1 | Sri Trang Agro-Industry PCL (Foreign) | 12,537,871 | 7,700 |
| | B Grimm Power PCL (Foreign) | 11,684,752 | 7,669 |
| | Bangkok Chain Hospital PCL (Foreign) | 14,811,030 | 7,584 |
| | Chularat Hospital PCL (Foreign) | 79,372,652 | 6,830 |
| | I-TAIL Corp. PCL (Foreign) | 8,901,900 | 6,661 |
| | IRPC PCL (Foreign) | 142,880,724 | 6,514 |
| | Thonburi Healthcare Group PCL (Foreign) | 10,799,727 | 6,409 |
| | Betagro PCL (Foreign) | 10,196,700 | 6,405 |
| * | VGI PCL (Foreign) | 73,410,914 | 6,132 |
| | Bangkok Commercial Asset Management PCL (Foreign) | 24,436,590 | 6,005 |
| | Thailand Future Fund | 31,039,989 | 5,927 |
| | Mega Lifesciences PCL (Foreign) | 4,817,756 | 5,613 |
| | CK Power PCL (Foreign) | 50,179,219 | 5,437 |
| 1 | Energy Absolute PCL (Foreign) | 23,202,644 | 5,407 |
| | Jaymart Group Holdings PCL (Foreign) | 11,742,487 | 5,397 |
| | AEON Thana Sinsap Thailand PCL (Foreign) | 1,293,568 | 5,356 |
| | JMT Network Services PCL (Foreign) | 8,803,617 | 5,180 |
| | Tipco Asphalt PCL (Foreign) | 9,574,967 | 5,153 |
| | TTW PCL (Foreign) | 19,145,831 | 5,133 |
| | Dohome PCL (Foreign) | 16,132,593 | 4,966 |
| | Quality Houses PCL (Foreign) | 86,171,943 | 4,748 |
| | Thai Vegetable Oil PCL (Foreign) | 6,151,102 | 4,536 |
| | Gunkul Engineering PCL (Foreign) | 54,986,495 | 4,441 |
| | Dhipaya Group Holdings PCL (Foreign) | 5,480,972 | 4,412 |
| | Stecon Group PCL (Foreign) | 15,700,901 | 4,281 |
| | Star Petroleum Refining PCL (Foreign) | 20,698,132 | 4,114 |
| | Sri Trang Gloves Thailand PCL (Foreign) | 13,077,296 | 4,106 |
| | Thaicom PCL (Foreign) | 9,230,978 | 3,984 |
| | MBK PCL (Foreign) | 6,498,238 | 3,828 |
| | TOA Paint Thailand PCL (Foreign) | 7,041,960 | 3,757 |
| | Bangchak Sriracha PCL (Foreign) | 17,097,553 | 3,744 |
| | Thoresen Thai Agencies PCL (Foreign) | 21,934,991 | 3,582 |
| | Bangkok Life Assurance PCL (Foreign) | 4,576,915 | 3,422 |
| | TQM Alpha PCL (Foreign) | 4,353,553 | 3,386 |
| | Banpu Power PCL (Foreign) | 8,776,437 | 3,302 |
| | Jasmine International PCL (Foreign) | 48,124,318 | 3,297 |
| | Thaifoods Group PCL (Foreign) | 26,922,005 | 3,248 |
| | TPI Polene Power PCL (Foreign) | 35,880,912 | 3,235 |
| | Major Cineplex Group PCL (Foreign) | 7,053,479 | 3,096 |
| | Bangkok Land PCL (Foreign) | 168,784,895 | 3,091 |
| *,1 | Singer Thailand PCL (Foreign) | 8,473,740 | 2,759 |
| | Taokaenoi Food & Marketing PCL (Foreign) | 8,331,793 | 2,588 |
| | Precious Shipping PCL (Foreign) | 9,311,197 | 2,293 |
| | GFPT PCL (Foreign) | 6,682,095 | 2,192 |
| 1 | Forth Corp. PCL (Foreign) | 5,761,006 | 2,182 |
| | PTG Energy PCL (Foreign) | 7,206,677 | 2,058 |
| | North Bangkok Power Plant Block 1 Infrastructure Fund - EGAT | 11,107,510 | 2,007 |
| | Pruksa Holding PCL (Foreign) | 7,540,784 | 1,990 |
| | Ratchthani Leasing PCL (Foreign) | 31,521,893 | 1,816 |
| | BEC World PCL (Foreign) | 14,436,704 | 1,803 |
| | Bangkok Life Assurance PCL NVDR | 2,340,631 | 1,750 |
| | BCPG PCL (Foreign) | 8,426,674 | 1,696 |
| | LPN Development PCL (Foreign) | 17,519,589 | 1,547 |
Total International Stock Index Fund
| | | | | | Shares | Market
Value•
($000) |
| | MK Restaurants Group PCL (Foreign) | 1,876,940 | 1,530 |
| * | Beyond Securities PCL (Foreign) | 42,947,574 | 1,510 |
| | SPCG PCL (Foreign) | 5,675,234 | 1,472 |
| * | Super Energy Corp. PCL (Foreign) | 172,306,466 | 1,432 |
| | TPI Polene PCL (Foreign) | 32,037,808 | 1,111 |
| *,1,3 | Thai Airways International PCL (Foreign) | 13,550,615 | 1,022 |
| * | Pruksa Real Estate PCL (Foreign) | 7,721,100 | 1,018 |
| | Vibhavadi Medical Center PCL (Foreign) | 13,881,104 | 783 |
| | Ramkhamhaeng Hospital PCL (Foreign) | 714,757 | 504 |
| * | Italian-Thai Development PCL (Foreign) | 12,377,872 | 249 |
| | | | | | | 2,648,094 |
| Turkey (0.3%) |
| | BIM Birlesik Magazalar A/S | 6,132,814 | 83,680 |
| | Akbank TAS | 43,067,774 | 63,669 |
| * | Turk Hava Yollari AO | 7,682,544 | 61,103 |
| | KOC Holding A/S | 11,877,951 | 58,576 |
| | Turkiye Petrol Rafinerileri A/S | 12,285,671 | 51,912 |
| | Haci Omer Sabanci Holding A/S | 18,754,395 | 45,592 |
| | Turkcell Iletisim Hizmetleri A/S | 16,486,646 | 40,766 |
| | Turkiye Is Bankasi A/S Class C | 108,863,475 | 37,423 |
| | Enka Insaat ve Sanayi A/S | 24,495,547 | 33,634 |
| | Yapi ve Kredi Bankasi A/S | 45,831,962 | 32,780 |
| | Eregli Demir ve Celik Fabrikalari TAS | 23,298,390 | 32,374 |
| | Aselsan Elektronik Sanayi ve Ticaret A/S | 16,412,046 | 29,186 |
| | Turkiye Garanti Bankasi A/S | 8,240,174 | 25,762 |
| | Ford Otomotiv Sanayi A/S | 882,203 | 25,197 |
| | Turkiye Sise ve Cam Fabrikalari A/S | 19,752,745 | 22,588 |
| * | Pegasus Hava Tasimaciligi A/S | 2,770,225 | 18,763 |
| * | TAV Havalimanlari Holding A/S | 2,420,708 | 16,263 |
| * | Sasa Polyester Sanayi A/S | 142,980,697 | 16,060 |
| | Coca-Cola Icecek A/S | 10,077,214 | 14,966 |
| | Migros Ticaret A/S | 1,254,870 | 14,908 |
| | AG Anadolu Grubu Holding A/S | 1,561,948 | 13,225 |
| | Anadolu Efes Biracilik ve Malt Sanayii A/S Class B | 2,277,224 | 12,725 |
| * | Arcelik A/S | 3,033,674 | 11,387 |
| *,2 | MLP Saglik Hizmetleri A/S Class B | 1,067,009 | 10,778 |
| * | Turk Telekomunikasyon A/S | 7,311,737 | 10,082 |
| * | Petkim Petrokimya Holding A/S | 17,327,666 | 9,409 |
| | Tofas Turk Otomobil Fabrikasi A/S | 1,708,807 | 9,381 |
| | Kardemir Karabuk Demir Celik Sanayi ve Ticaret A/S | 12,882,116 | 9,273 |
| 2 | Mavi Giyim Sanayi ve Ticaret A/S Class B | 4,059,948 | 9,035 |
| | Astor Transformator Enerji Turizm Insaat ve Petrol Sanayi Ticaret A/S Class B | 3,903,634 | 8,908 |
| * | Ulker Biskuvi Sanayi A/S | 2,307,637 | 8,461 |
| * | Reysas Tasimacilik ve Lojistik Ticaret A/S | 19,678,824 | 8,148 |
| * | Emlak Konut Gayrimenkul Yatirim Ortakligi A/S | 26,626,439 | 7,840 |
| | Turk Traktor ve Ziraat Makineleri A/S | 370,774 | 7,816 |
| * | Koza Altin Isletmeleri A/S | 13,233,720 | 7,772 |
| * | Anadolu Anonim Turk Sigorta Sirketi | 3,021,139 | 7,579 |
| * | Borusan Birlesik Boru Fabrikalari Sanayi ve Ticaret A/S | 527,712 | 7,470 |
| | Nuh Cimento Sanayi A/S | 856,360 | 7,172 |
| | Is Yatirim Menkul Degerler A/S | 7,093,685 | 6,659 |
| * | Gubre Fabrikalari TAS | 1,131,844 | 6,635 |
| * | BatiSoke Soke Cimento Sanayii TAS | 4,331,696 | 6,605 |
| | Dogus Otomotiv Servis ve Ticaret A/S | 1,046,215 | 6,422 |
| | Otokar Otomotiv ve Savunma Sanayi A/S | 524,683 | 6,362 |
| * | Oyak Cimento Fabrikalari A/S | 3,448,648 | 5,770 |
| * | Turkiye Sinai Kalkinma Bankasi A/S | 16,037,539 | 5,666 |
| 2 | Enerjisa Enerji A/S | 3,426,412 | 5,521 |
| * | Tekfen Holding A/S | 2,463,567 | 5,416 |
| * | Turkiye Vakiflar Bankasi TAO | 8,785,591 | 5,269 |
| | Ahlatci Dogal Gaz Dagitim Enerji ve Yatirim A/S | 9,149,927 | 5,225 |
| | Alarko Holding A/S | 2,027,086 | 5,100 |
| | Turkiye Sigorta A/S | 13,536,391 | 5,099 |
| | EGE Endustri ve Ticaret A/S | 15,917 | 5,093 |
| | Sok Marketler Ticaret A/S | 4,349,969 | 5,000 |
| * | Baticim Bati Anadolu Cimento Sanayii A/S | 1,054,283 | 4,974 |
| * | Hektas Ticaret TAS | 47,201,793 | 4,891 |
| | Cimsa Cimento Sanayi ve Ticaret A/S | 4,798,276 | 4,885 |
| | Vakko Tekstil ve Hazir Giyim Sanayi Isletmeleri A/S | 2,005,800 | 4,768 |
Total International Stock Index Fund
| | | | | | Shares | Market
Value•
($000) |
| * | Koza Anadolu Metal Madencilik Isletmeleri A/S | 2,654,034 | 4,766 |
| | Dogan Sirketler Grubu Holding A/S | 12,493,093 | 4,733 |
| | Kontrolmatik Enerji ve Muhendislik A/S | 3,703,593 | 4,653 |
| * | Investco Holding A/S | 513,891 | 4,644 |
| | Aksa Akrilik Kimya Sanayii A/S | 18,980,160 | 4,629 |
| * | Ral Yatirim Holding A/S | 543,481 | 4,165 |
| | Ziraat Gayrimenkul Yatirim Ortakligi A/S | 12,170,629 | 4,065 |
| | Borusan Yatirim ve Pazarlama A/S | 67,182 | 3,821 |
| | Enerya Enerji A/S | 527,592 | 3,666 |
| | Sarkuysan Elektrolitik Bakir Sanayi ve Ticaret A/S | 5,719,168 | 3,572 |
| | Aksa Enerji Uretim A/S Class B | 3,665,540 | 3,530 |
| * | MIA Teknoloji A/S | 2,861,169 | 3,520 |
| * | Bera Holding A/S | 8,820,343 | 3,333 |
| * | NET Holding A/S | 2,660,790 | 3,192 |
| | Aygaz A/S | 715,859 | 3,151 |
| *,1 | Turkiye Halk Bankasi A/S | 7,344,874 | 3,112 |
| * | Albaraka Turk Katilim Bankasi A/S | 20,162,297 | 3,094 |
| * | Vestel Elektronik Sanayi ve Ticaret A/S | 1,826,477 | 3,041 |
| * | Reysas Gayrimenkul Yatirim Ortakligi A/S | 8,107,780 | 3,002 |
| | Global Yatirim Holding A/S | 6,111,788 | 2,942 |
| | Selcuk Ecza Deposu Ticaret ve Sanayi A/S | 1,524,878 | 2,877 |
| | TAB Gida Sanayi ve Ticaret A/S | 725,208 | 2,859 |
| * | Is Gayrimenkul Yatirim Ortakligi A/S | 5,666,425 | 2,816 |
| * | Zorlu Enerji Elektrik Uretim A/S | 23,174,631 | 2,815 |
| * | Kiler Holding A/S | 3,321,530 | 2,808 |
| * | YEO Teknoloji Enerji ve Endustri A/S | 503,029 | 2,776 |
| | Logo Yazilim Sanayi ve Ticaret A/S | 889,826 | 2,751 |
| * | ODAS Elektrik Uretim ve Sanayi Ticaret A/S | 16,083,607 | 2,743 |
| | Torunlar Gayrimenkul Yatirim Ortakligi A/S | 1,973,753 | 2,741 |
| | GEN Ilac ve Saglik Urunleri Sanayi ve Ticaret A/S | 1,127,974 | 2,721 |
| | AKIS Gayrimenkul Yatirimi A/S | 14,799,579 | 2,646 |
| | Akcansa Cimento A/S | 582,443 | 2,644 |
| * | Europower Enerji ve Otomasyon Teknolojileri Sanayi Ticaret A/S | 2,557,110 | 2,490 |
| | Anadolu Hayat Emeklilik A/S | 941,993 | 2,474 |
| | EIS Eczacibasi Ilac ve Sinai ve Finansal Yatirimlar Sanayi ve Ticaret A/S | 2,081,919 | 2,417 |
| * | Smart Gunes Enerjisi Teknolojileri ArGE Uretim Sanayi ve Ticaret A/S | 2,115,262 | 2,415 |
| * | Konya Cimento Sanayii A/S | 11,935 | 2,413 |
| * | Karsan Otomotiv Sanayii ve Ticaret A/S | 5,206,753 | 2,360 |
| * | Akfen Yenilenebilir Enerji A/S | 4,548,786 | 2,332 |
| * | Margun Enerji Uretim Sanayi ve Ticaret A/S | 3,869,756 | 2,316 |
| | Vestel Beyaz Esya Sanayi ve Ticaret A/S | 4,574,198 | 2,295 |
| | Yeni Gimat Gayrimenkul Ortakligi A/S | 1,465,411 | 2,271 |
| * | Kuyumcukent Gayrimenkul Yatirimlari A/S | 1,098,037 | 2,268 |
| | Escar Turizm Tasimacilik Ticaret A/S | 217,335 | 2,199 |
| * | Reeder Teknoloji Sanayi ve Ticaret A/S | 3,370,890 | 2,175 |
| | Sekerbank Turk A/S | 18,053,886 | 2,161 |
| | Kayseri Seker Fabrikasi A/S | 3,844,799 | 2,132 |
| | Iskenderun Demir ve Celik A/S | 2,043,156 | 2,127 |
| | Kocaer Celik Sanayi ve Ticaret A/S | 1,917,632 | 2,115 |
| | CW Enerji Muhendislik Ticaret ve Sanayi A/S | 390,833 | 2,101 |
| * | Sinpas Gayrimenkul Yatirim Ortakligi A/S | 9,677,278 | 2,099 |
| | Bursa Cimento Fabrikasi A/S | 10,863,079 | 2,028 |
| * | Girisim Elektrik Taahhut Ticaret ve Sanayi A/S | 1,563,827 | 1,986 |
| * | Lydia Yesil Enerji Kaynaklari Anonimsirketi | 6,963 | 1,953 |
| * | Politeknik Metal Sanayi ve Ticaret A/S | 9,847 | 1,875 |
| | Goltas Goller Bolgesi Cimento Sanayi ve Ticaret A/S | 152,024 | 1,858 |
| | Alfa Solar Enerji Sanayi ve Ticaret A/S | 1,179,425 | 1,855 |
| | Celebi Hava Servisi A/S | 35,088 | 1,852 |
| * | Link Bilgisayar Sistemleri Yazilimi ve Donanimi Sanayi ve Ticaret A/S | 125,789 | 1,839 |
| * | Tumosan Motor ve Traktor Sanayi A/S | 518,513 | 1,827 |
| * | Agrotech Yueksek Teknoloji ve Yatirim A/S | 4,253,460 | 1,824 |
| | LDR Turizm A/S | 621,325 | 1,722 |
| * | Can2 Termik A/S | 38,315,410 | 1,633 |
| * | Biotrend Cevre ve Enerji Yatirimlari A/S | 3,005,108 | 1,632 |
| | Kaleseramik Canakkale Kalebodur Seramik Sanayi A/S | 1,541,421 | 1,621 |
| * | Kordsa Teknik Tekstil A/S | 731,090 | 1,548 |
| | Galata Wind Enerji A/S | 2,077,818 | 1,509 |
| | Brisa Bridgestone Sabanci Sanayi ve Ticaret A/S | 608,681 | 1,470 |
| * | Aksigorta A/S | 8,479,628 | 1,469 |
| * | Izdemir Enerji Elektrik Uretim A/S | 2,194,291 | 1,453 |
Total International Stock Index Fund
| | | | | | Shares | Market
Value•
($000) |
| * | Vakif Gayrimenkul Yatirim Ortakligi A/S | 27,190,495 | 1,445 |
| | Eczacibasi Yatirim Holding Ortakligi A/S | 274,680 | 1,443 |
| | Baskent Dogalgaz Dagitim Gayrimenkul Yatirim Ortakligi A/S | 1,764,268 | 1,399 |
| | Aydem Yenilenebilir Enerji A/S | 1,902,238 | 1,388 |
| | Katilimevim Tasarruf Finansman A/S | 820,323 | 1,372 |
| *,1 | Ipek Dogal Enerji Kaynaklari Arastirma ve Uretim A/S | 1,320,007 | 1,347 |
| * | Ozak Gayrimenkul Yatirim Ortakligi | 4,953,234 | 1,344 |
| * | Tukas Gida Sanayi ve Ticaret A/S | 6,839,579 | 1,318 |
| * | Yatas Yatak ve Yorgan Sanayi ve Ticaret A/S | 1,849,225 | 1,311 |
| * | Fenerbahce Futbol A/S | 452,339 | 1,293 |
| | Anadolu Isuzu Otomotiv Sanayi ve Ticaret A/S Class C | 649,887 | 1,288 |
| * | Yayla Agro Gida Sanayi ve Nakliyat A/S | 4,486,738 | 1,282 |
| * | Kerevitas Gida Sanayi ve Ticaret A/S | 3,400,800 | 1,267 |
| * | Is Finansal Kiralama A/S | 3,871,593 | 1,254 |
| | Kervan Gida Sanayi ve Ticaret A/S Class B | 18,381,492 | 1,235 |
| | Ebebek Magazacilik A/S Class B | 911,273 | 1,235 |
| * | Oyak Yatirim Menkul Degerler A/S | 1,072,687 | 1,190 |
| * | Kizilbuk Gayrimenkul Yatirim Ortakligi A/S | 1,130,940 | 1,114 |
| | Suwen Tekstil Sanayi Pazarlama A/S | 1,267,005 | 1,088 |
| * | Penta Teknoloji Urunleri Dagitim Ticaret A/S | 2,633,906 | 1,085 |
| * | Izmir Demir Celik Sanayi A/S | 6,600,386 | 1,051 |
| * | Besiktas Futbol Yatirimlari Sanayi ve Ticaret A/S | 6,659,195 | 931 |
| * | Karel Elektronik Sanayi ve Ticaret A/S | 3,358,710 | 903 |
| * | Tat Gida Sanayi A/S | 1,244,468 | 896 |
| * | Europen Endustri Insaat Sanayi ve Ticaret A/S | 2,500,737 | 856 |
| | Kimteks Poliuretan Sanayi ve Ticaret A/S | 1,627,384 | 816 |
| | Polisan Holding A/S | 2,541,850 | 761 |
| * | Peker Gayrimenkul Yatirim Ortakligi A/S | 5,503,554 | 683 |
| * | Kartonsan Karton Sanayi ve Ticaret A/S | 262,763 | 660 |
| * | Qua Granite Hayal | 8,411,183 | 649 |
| * | Erciyas Celik Boru Sanayi A/S | 233,358 | 605 |
| | SUN Tekstil Sanayi ve Ticaret A/S | 992,533 | 586 |
| * | Bagfas Bandirma Gubre Fabrikalari A/S | 951,606 | 553 |
| * | Marti Otel Isletmeleri A/S | 5,601,357 | 540 |
| | Kardemir Karabuk Demir Celik Sanayi ve Ticaret A/S Class A | 839,081 | 495 |
| * | Imas Makina Sanayi A/S | 6,420,500 | 449 |
| | | | | | | 1,218,097 |
| United Arab Emirates (0.4%) |
| | Emirates Telecommunications Group Co. PJSC | 48,515,612 | 234,129 |
| | Emaar Properties PJSC | 93,600,892 | 221,304 |
| | First Abu Dhabi Bank PJSC | 61,756,669 | 220,698 |
| | Emirates NBD Bank PJSC | 25,299,320 | 130,766 |
| | Aldar Properties PJSC | 51,004,985 | 105,724 |
| | Abu Dhabi Commercial Bank PJSC | 40,696,723 | 98,923 |
| | Dubai Electricity & Water Authority PJSC | 120,604,203 | 81,711 |
| | Abu Dhabi Islamic Bank PJSC | 20,304,974 | 69,599 |
| | Dubai Islamic Bank PJSC | 40,471,143 | 68,772 |
| * | Alpha Dhabi Holding PJSC | 19,498,761 | 59,435 |
| | ADNOC Drilling Co. PJSC | 34,635,019 | 47,801 |
| * | Modon Holding PSC | 46,726,524 | 45,324 |
| * | Multiply Group PJSC | 66,029,770 | 40,729 |
| | Abu Dhabi National Oil Co. for Distribution PJSC | 40,213,442 | 39,466 |
| | Salik Co. PJSC | 26,146,067 | 34,149 |
| * | Pure Health Holding PJSC | 35,002,569 | 32,966 |
| | ADNOC Logistics & Services | 19,625,078 | 30,972 |
| | Emaar Development PJSC | 11,755,002 | 29,652 |
| | Borouge plc | 41,781,096 | 28,986 |
| | Air Arabia PJSC | 32,067,884 | 25,076 |
| | Americana Restaurants International plc - Foreign Co. (XADS) | 37,919,557 | 23,272 |
| | NMDC Group PJSC | 2,961,514 | 21,747 |
| * | Abu Dhabi Ports Co. PJSC | 12,226,826 | 17,811 |
| | Dubai Investments PJSC | 29,183,391 | 16,833 |
| | Agility Global plc | 43,611,143 | 14,815 |
| * | Dana Gas PJSC | 78,856,435 | 14,488 |
| | GFH Financial Group BSC | 40,390,962 | 13,630 |
| | Emirates Central Cooling Systems Corp. | 27,811,774 | 13,257 |
| | Parkin Co. PJSC | 10,180,673 | 11,806 |
| | Fertiglobe plc | 15,836,243 | 11,664 |
| | Agthia Group PJSC | 4,269,356 | 8,830 |
Total International Stock Index Fund
| | | | | | Shares | Market
Value•
($000) |
| * | Space42 plc | 13,687,454 | 7,817 |
| | Dubai Financial Market PJSC | 22,265,704 | 7,686 |
| * | Apex Investment Co. PSC | 7,071,182 | 7,586 |
| * | Ajman Bank PJSC | 15,048,066 | 7,125 |
| | Burjeel Holdings plc | 11,229,197 | 6,952 |
| | RAK Properties PJSC | 20,664,273 | 6,682 |
| * | Aramex PJSC | 10,277,089 | 6,407 |
| * | Phoenix Group plc | 14,029,872 | 5,069 |
| | Amanat Holdings PJSC | 15,202,933 | 4,588 |
| * | Ghitha Holding PJSC | 554,585 | 3,580 |
| * | AL Seer Marine Supplies & Equipment Co. LLC | 3,328,421 | 3,486 |
| | Americana Restaurants International plc - Foreign Co. | 2,199,713 | 1,332 |
| | Sharjah Islamic Bank | 1,205,081 | 754 |
| *,3 | Arabtec Holding PJSC | 11,126,461 | — |
| | | | | | | 1,883,399 |
| United Kingdom (9.4%) |
| | AstraZeneca plc | 20,903,519 | 2,974,437 |
| | Shell plc | 87,827,446 | 2,932,323 |
| | HSBC Holdings plc | 258,446,836 | 2,372,031 |
| | Unilever plc | 34,387,546 | 2,097,710 |
| | RELX plc | 26,074,477 | 1,195,768 |
| | BP plc | 230,120,004 | 1,125,475 |
| | GSK plc | 55,785,220 | 1,007,402 |
| | British American Tobacco plc | 27,855,127 | 974,069 |
| | Rio Tinto plc | 14,919,377 | 964,210 |
| | Diageo plc | 31,022,352 | 958,025 |
| | London Stock Exchange Group plc | 6,928,082 | 939,004 |
| | CRH plc | 9,570,238 | 912,358 |
| | Glencore plc | 169,643,721 | 889,720 |
| | National Grid plc | 68,150,875 | 855,713 |
| * | Rolls-Royce Holdings plc | 118,652,144 | 818,747 |
| | Compass Group plc | 23,751,805 | 771,374 |
| | BAE Systems plc | 42,344,212 | 682,475 |
| | Barclays plc | 205,360,736 | 629,534 |
| | Experian plc | 12,793,327 | 624,389 |
| | Lloyds Banking Group plc | 869,927,983 | 597,119 |
| | Reckitt Benckiser Group plc | 9,742,996 | 591,049 |
| * | Flutter Entertainment plc | 2,471,213 | 578,097 |
| | Anglo American plc | 17,362,625 | 538,249 |
| | 3i Group plc | 12,955,525 | 531,277 |
| | Haleon plc | 105,286,213 | 506,012 |
| | Ashtead Group plc | 6,089,787 | 455,563 |
| | NatWest Group plc | 92,718,066 | 439,321 |
| | Tesco plc | 96,501,889 | 426,121 |
| | Smurfit WestRock plc | 7,182,973 | 371,294 |
| | Imperial Brands plc | 11,909,922 | 359,418 |
| | SSE plc | 15,246,101 | 346,443 |
| | Standard Chartered plc | 29,316,784 | 339,969 |
| | Prudential plc | 38,420,461 | 319,845 |
| | Vodafone Group plc | 299,648,483 | 278,648 |
| | InterContinental Hotels Group plc | 2,240,124 | 247,080 |
| | Legal & General Group plc | 83,324,778 | 233,716 |
| | Aviva plc | 37,677,251 | 220,800 |
| | Next plc | 1,661,272 | 210,175 |
| | Bunzl plc | 4,715,207 | 207,585 |
| | Informa plc | 18,559,126 | 193,885 |
| | Segro plc | 18,808,974 | 190,580 |
| | Rentokil Initial plc | 35,174,060 | 176,425 |
| | Sage Group plc | 13,978,769 | 174,703 |
| | Halma plc | 5,288,069 | 168,931 |
| | WPP plc | 14,968,188 | 157,329 |
| 1 | BT Group plc | 88,098,466 | 157,308 |
| | Smith & Nephew plc | 12,198,034 | 151,656 |
| | Marks & Spencer Group plc | 28,453,079 | 138,051 |
| | Pearson plc | 9,324,347 | 136,922 |
| | DS Smith plc | 19,197,971 | 134,974 |
| | Intertek Group plc | 2,247,554 | 134,924 |
| | Admiral Group plc | 4,059,494 | 134,331 |
| 2 | Auto Trader Group plc | 12,439,989 | 134,321 |
Total International Stock Index Fund
| | | | | | Shares | Market
Value•
($000) |
| | Associated British Foods plc | 4,464,123 | 128,307 |
| | United Utilities Group plc | 9,529,833 | 125,769 |
| | Severn Trent plc | 3,687,635 | 121,995 |
| | Melrose Industries plc | 18,208,710 | 111,517 |
| | Centrica plc | 73,121,286 | 110,690 |
| | Barratt Redrow plc | 19,085,166 | 109,961 |
| | Antofagasta plc | 4,839,524 | 108,098 |
| | Diploma plc | 1,872,190 | 102,921 |
| | Coca-Cola HBC AG | 2,854,967 | 99,904 |
| | Mondi plc | 6,158,241 | 99,722 |
| | Intermediate Capital Group plc | 3,686,426 | 97,928 |
| | Weir Group plc | 3,625,760 | 97,642 |
| | Whitbread plc | 2,501,708 | 97,334 |
| | Kingfisher plc | 25,667,938 | 97,071 |
| | Smiths Group plc | 4,845,775 | 95,621 |
| * | Wise plc Class A | 10,462,367 | 95,429 |
| | Taylor Wimpey plc | 49,437,028 | 93,470 |
| | Croda International plc | 1,945,619 | 93,358 |
| | J Sainsbury plc | 26,525,473 | 91,322 |
| | International Consolidated Airlines Group SA | 32,595,165 | 88,783 |
| | Beazley plc | 9,028,975 | 88,017 |
| | DCC plc | 1,377,326 | 87,135 |
| | Spirax Group plc | 1,029,665 | 85,947 |
| | Persimmon plc | 4,465,960 | 84,636 |
| | Rightmove plc | 11,093,549 | 84,473 |
| | Howden Joinery Group plc | 7,677,184 | 83,529 |
| | Entain plc | 8,492,721 | 81,679 |
| | St. James's Place plc | 7,651,701 | 80,271 |
| | Land Securities Group plc | 10,322,787 | 80,174 |
| | Berkeley Group Holdings plc | 1,382,593 | 78,897 |
| | IMI plc | 3,642,458 | 77,582 |
| | M&G plc | 30,238,609 | 75,755 |
| | Hargreaves Lansdown plc | 5,300,804 | 74,391 |
| | British Land Co. plc | 13,956,646 | 71,820 |
| | Games Workshop Group plc | 462,875 | 71,550 |
| | LondonMetric Property plc | 27,533,372 | 68,825 |
| | Phoenix Group Holdings plc | 10,441,942 | 66,334 |
| | Investec plc | 8,578,362 | 66,048 |
| | B&M European Value Retail SA | 13,000,305 | 65,040 |
| | UNITE Group plc | 5,639,809 | 63,798 |
| 2 | ConvaTec Group plc | 23,056,090 | 63,599 |
| | Tritax Big Box REIT plc | 34,507,281 | 62,643 |
| | Endeavour Mining plc | 2,789,768 | 62,558 |
| | Hiscox Ltd. | 4,313,292 | 59,973 |
| | Bellway plc | 1,638,975 | 59,853 |
| | IG Group Holdings plc | 5,153,089 | 59,624 |
| | RS Group plc | 6,580,940 | 59,000 |
| | Britvic plc | 3,480,885 | 57,437 |
| | JD Sports Fashion plc | 34,837,931 | 55,862 |
| | Hikma Pharmaceuticals plc | 2,256,463 | 54,042 |
| | Tate & Lyle plc | 5,484,667 | 52,929 |
| | ITV plc | 55,345,829 | 52,706 |
| | Schroders plc | 11,755,061 | 52,085 |
| | Greggs plc | 1,426,519 | 50,576 |
| | Burberry Group plc | 4,957,680 | 50,394 |
| * | Vistry Group plc | 4,275,215 | 50,241 |
| | Johnson Matthey plc | 2,560,176 | 49,265 |
| | Cranswick plc | 740,892 | 48,536 |
| | Inchcape plc | 5,207,611 | 48,166 |
| | Rotork plc | 11,988,996 | 46,525 |
| | Spectris plc | 1,412,041 | 45,975 |
| | Derwent London plc | 1,566,972 | 44,332 |
| | Drax Group plc | 5,372,833 | 43,278 |
| | abrdn plc | 25,191,820 | 42,918 |
| | Man Group plc | 16,233,639 | 41,545 |
| | QinetiQ Group plc | 7,002,546 | 41,336 |
| | Balfour Beatty plc | 7,225,773 | 41,297 |
| | Big Yellow Group plc | 2,623,486 | 40,685 |
| * | Playtech plc | 4,304,451 | 40,284 |
| | International Distribution Services plc | 9,254,120 | 40,269 |
Total International Stock Index Fund
| | | | | | Shares | Market
Value•
($000) |
| * | Carnival plc | 2,005,907 | 40,058 |
| | Softcat plc | 1,819,117 | 39,882 |
| | Direct Line Insurance Group plc | 18,269,563 | 38,631 |
| * | Ocado Group plc | 8,301,544 | 37,392 |
| | Shaftesbury Capital plc | 20,757,205 | 36,427 |
| 2 | Quilter plc | 18,712,967 | 34,805 |
| | easyJet plc | 5,182,958 | 34,154 |
| | Serco Group plc | 14,911,422 | 33,693 |
| | Centamin plc | 15,918,198 | 32,658 |
| | Grafton Group plc | 2,503,506 | 32,381 |
| *,2 | Deliveroo plc | 17,973,218 | 32,004 |
| *,2 | Trainline plc | 6,400,030 | 31,800 |
| | TP ICAP Group plc | 10,767,088 | 31,319 |
| | WH Smith plc | 1,826,408 | 31,117 |
| | Safestore Holdings plc | 2,972,157 | 30,997 |
| | Travis Perkins plc | 2,951,036 | 30,728 |
| | Harbour Energy plc | 8,579,601 | 30,527 |
| | Grainger plc | 10,334,688 | 30,366 |
| | Plus500 Ltd. | 994,793 | 30,004 |
| | Hill & Smith plc | 1,113,895 | 29,134 |
| | Morgan Sindall Group plc | 594,643 | 28,729 |
| 2 | JTC plc | 2,136,626 | 28,230 |
| | Computacenter plc | 976,075 | 27,464 |
| | Lancashire Holdings Ltd. | 3,382,690 | 27,443 |
| | Mitie Group plc | 18,289,952 | 27,437 |
| | Coats Group plc | 22,183,683 | 27,223 |
| | Bank of Georgia Group plc | 490,674 | 26,382 |
| | Savills plc | 1,880,090 | 26,059 |
| | Paragon Banking Group plc | 2,937,195 | 25,809 |
| | AJ Bell plc | 4,483,663 | 25,754 |
| | Pennon Group plc | 3,659,792 | 25,661 |
| | 4imprint Group plc | 387,248 | 25,508 |
| | Dunelm Group plc | 1,745,883 | 25,018 |
| | Pets at Home Group plc | 6,540,980 | 24,965 |
| | Just Group plc | 14,406,914 | 24,852 |
| | Genus plc | 919,021 | 24,841 |
| | OSB Group plc | 5,442,104 | 24,634 |
| | Fresnillo plc | 2,572,644 | 24,480 |
| | Energean plc | 1,880,433 | 24,261 |
| | Hammerson plc | 6,456,397 | 23,999 |
| | Sirius Real Estate Ltd. | 20,167,630 | 23,356 |
| | SSP Group plc | 11,118,878 | 23,095 |
| | Primary Health Properties plc | 18,602,178 | 22,933 |
| | Oxford Instruments plc | 812,907 | 22,724 |
| | Breedon Group plc | 3,971,241 | 22,530 |
| | Baltic Classifieds Group plc | 5,511,114 | 22,483 |
| | Premier Foods plc | 9,120,630 | 22,073 |
| | Hays plc | 22,118,205 | 22,054 |
| | Assura plc | 42,277,178 | 22,040 |
| 2 | Airtel Africa plc | 16,633,120 | 21,858 |
| | Telecom Plus plc | 1,002,147 | 21,700 |
| | Domino's Pizza Group plc | 5,582,702 | 21,670 |
| | TBC Bank Group plc | 606,662 | 21,513 |
| | Babcock International Group plc | 3,530,579 | 21,511 |
| | Keller Group plc | 1,013,936 | 21,252 |
| | Genuit Group plc | 3,511,301 | 21,229 |
| | International Workplace Group plc | 10,268,919 | 21,223 |
| | Volution Group plc | 2,722,012 | 20,311 |
| | Pagegroup plc | 4,382,413 | 20,211 |
| | Great Portland Estates plc | 4,811,586 | 19,520 |
| | IntegraFin Holdings plc | 4,107,381 | 19,395 |
| | Renishaw plc | 475,899 | 19,273 |
| | Bytes Technology Group plc | 3,291,488 | 19,168 |
| | Rathbones Group plc | 889,878 | 19,131 |
| | Bodycote plc | 2,587,813 | 18,381 |
| | MONY Group plc | 7,525,688 | 18,226 |
| 2 | Bridgepoint Group plc | 4,441,860 | 17,969 |
| | Future plc | 1,584,567 | 17,941 |
| | Clarkson plc | 394,305 | 17,939 |
| | Chemring Group plc | 3,842,732 | 17,725 |
Total International Stock Index Fund
| | | | | | Shares | Market
Value•
($000) |
| * | Helios Towers plc | 12,725,509 | 17,358 |
| * | Spirent Communications plc | 7,987,151 | 17,274 |
| * | Greencore Group plc | 6,369,957 | 17,131 |
| *,2 | Watches of Switzerland Group plc | 3,208,360 | 16,867 |
| | Ashmore Group plc | 6,054,785 | 16,560 |
| *,2 | Trustpilot Group plc | 5,031,250 | 16,081 |
| | Supermarket Income REIT plc | 17,360,228 | 15,881 |
| * | John Wood Group plc | 9,655,246 | 15,777 |
| | Marshalls plc | 3,542,792 | 15,489 |
| * | Indivior plc | 1,738,244 | 15,418 |
| * | Moonpig Group plc | 4,690,362 | 15,168 |
| | Firstgroup plc | 8,656,682 | 14,905 |
| * | Oxford Nanopore Technologies plc | 8,524,707 | 14,857 |
| * | Currys plc | 13,698,144 | 14,588 |
| * | Frasers Group plc | 1,440,392 | 14,245 |
| 2 | Ibstock plc | 5,473,740 | 14,178 |
| | Elementis plc | 8,183,954 | 14,130 |
| | Zigup plc | 3,075,400 | 14,023 |
| | Kainos Group plc | 1,397,425 | 13,535 |
| | Workspace Group plc | 1,870,992 | 13,422 |
| | Vesuvius plc | 2,906,699 | 13,364 |
| | Victrex plc | 1,208,500 | 13,282 |
| | Hilton Food Group plc | 1,128,254 | 13,089 |
| * | Hochschild Mining plc | 4,369,227 | 12,905 |
| | Dowlais Group plc | 19,307,798 | 12,222 |
| | Morgan Advanced Materials plc | 3,926,235 | 12,179 |
| | AG Barr plc | 1,470,469 | 11,834 |
| * | Mitchells & Butlers plc | 3,561,200 | 11,515 |
| 2 | TI Fluid Systems plc | 5,041,080 | 11,087 |
| | RHI Magnesita NV | 268,154 | 11,074 |
| * | Molten Ventures plc | 2,423,932 | 10,646 |
| 2 | Spire Healthcare Group plc | 3,814,119 | 10,586 |
| | C&C Group plc | 5,328,201 | 10,115 |
| | Ninety One plc | 4,568,699 | 9,781 |
| 2 | Petershill Partners plc | 3,490,455 | 9,757 |
| | Senior plc | 5,670,449 | 9,604 |
| | J D Wetherspoon plc | 1,174,043 | 9,313 |
| | Balanced Commercial Property Trust Ltd. | 7,334,603 | 9,065 |
| | NCC Group plc | 4,279,976 | 8,517 |
| * | IP Group plc | 14,316,084 | 8,508 |
| | Crest Nicholson Holdings plc | 3,602,275 | 7,858 |
| | Essentra plc | 4,063,998 | 7,795 |
| 1 | Diversified Energy Co. plc | 643,701 | 7,771 |
| * | THG plc | 12,744,438 | 7,688 |
| * | Auction Technology Group plc | 1,317,038 | 7,648 |
| | Wickes Group plc | 3,405,852 | 7,055 |
| | Picton Property Income Ltd. | 7,601,027 | 6,798 |
| | Halfords Group plc | 3,005,887 | 6,475 |
| *,1 | Alphawave IP Group plc | 4,455,658 | 6,394 |
| * | Close Brothers Group plc | 2,095,310 | 6,173 |
| * | Mobico Group plc | 6,884,254 | 6,159 |
| | Jupiter Fund Management plc | 5,792,162 | 6,035 |
| * | PureTech Health plc | 3,053,739 | 6,028 |
| * | AO World plc | 4,288,894 | 5,989 |
| 2 | CMC Markets plc | 1,477,483 | 5,824 |
| | FDM Group Holdings plc | 1,274,557 | 5,808 |
| | Dr. Martens plc | 7,867,009 | 5,545 |
| | Liontrust Asset Management plc | 866,233 | 5,434 |
| * | Tullow Oil plc | 16,724,946 | 5,098 |
| *,1,2 | Aston Martin Lagonda Global Holdings plc | 3,240,591 | 4,780 |
| 2 | Bakkavor Group plc | 2,318,629 | 4,496 |
| | Helical plc | 1,603,208 | 4,127 |
| * | Evoke plc | 4,996,849 | 3,982 |
| *,1 | Synthomer plc | 1,672,717 | 3,867 |
| *,1 | ASOS plc | 801,405 | 3,678 |
| | PZ Cussons plc | 3,129,870 | 3,266 |
| | Rank Group plc | 2,499,075 | 2,823 |
| | CLS Holdings plc | 2,351,681 | 2,796 |
| *,3 | Home REIT plc | 10,689,921 | 2,622 |
| * | SIG plc | 8,764,625 | 2,595 |
Total International Stock Index Fund
| | | | | | Shares | Market
Value•
($000) |
| | Ithaca Energy plc | 1,624,408 | 2,132 |
| | Vanquis Banking Group plc | 1,212,498 | 706 |
| *,1,3 | NMC Health plc | 1,316,787 | — |
| *,3 | Intu Properties plc | 14,406,415 | — |
| *,3 | Evraz plc | 7,417,198 | — |
| *,2,3 | Finablr plc | 3,002,811 | — |
| | | | | | | 41,325,596 |
| Total Common Stocks (Cost $346,854,957) | 434,587,718 |
| Preferred Stocks (0.6%) |
| | Petroleo Brasileiro SA Preference Shares | 76,223,312 | 473,487 |
| | Itau Unibanco Holding SA Preference Shares | 66,633,789 | 403,660 |
| | Samsung Electronics Co. Ltd. Preference Shares | 11,482,573 | 395,004 |
| | Volkswagen AG Preference Shares | 2,550,333 | 247,543 |
| | Henkel AG & Co. KGaA Preference Shares | 2,267,873 | 196,382 |
| | Banco Bradesco SA Preference Shares | 72,252,270 | 179,603 |
| | Itausa SA Preference Shares | 75,071,027 | 137,782 |
| | Sartorius AG Preference Shares | 349,770 | 90,610 |
| | Sociedad Quimica y Minera de Chile SA Preference Shares Class B | 1,893,758 | 72,564 |
| | Hyundai Motor Co. Preference Shares (XKRX) | 506,880 | 58,563 |
| | Bayerische Motoren Werke AG Preference Shares | 793,479 | 58,390 |
| | Gerdau SA Preference Shares | 17,170,634 | 54,355 |
| | FUCHS SE Preference Shares | 943,903 | 44,054 |
| | Cia Energetica de Minas Gerais Preference Shares | 17,970,657 | 35,345 |
| | Hyundai Motor Co. Preference Shares | 282,974 | 31,957 |
| * | Grifols SA Preference Shares Class B | 3,562,674 | 31,069 |
| | Bancolombia SA Preference Shares | 3,359,283 | 26,888 |
| | Cia Paranaense de Energia - Copel Preference Shares Class B | 15,750,010 | 26,727 |
| | Centrais Eletricas Brasileiras SA Preference Shares Class B | 3,354,628 | 24,494 |
| | CTEEP-Cia de Transmissao de Energia Eletrica Paulista Preference Shares | 3,909,697 | 16,428 |
| | Metalurgica Gerdau SA Preference Shares | 9,131,418 | 16,222 |
| | LG Chem Ltd. Preference Shares | 107,213 | 16,142 |
| | Embotelladora Andina SA Preference Shares Class B | 5,183,699 | 15,377 |
| | Marcopolo SA Preference Shares | 9,712,253 | 14,213 |
| | Sixt SE Preference Shares | 203,139 | 12,702 |
| | Bradespar SA Preference Shares | 3,648,713 | 12,396 |
| | Usinas Siderurgicas de Minas Gerais SA Usiminas Preference Shares Class A | 7,084,795 | 8,101 |
| | Raizen SA Preference Shares | 16,539,154 | 8,011 |
| | Samsung Fire & Marine Insurance Co. Ltd. Preference Shares | 36,816 | 6,948 |
| | LG Electronics Inc. Preference Shares | 208,081 | 6,724 |
| * | Braskem SA Preference Shares Class A | 2,186,483 | 6,642 |
| | Draegerwerk AG & Co. KGaA Preference Shares | 123,018 | 5,982 |
| | Banco Pan SA Preference Shares | 3,989,000 | 5,865 |
| | Unipar Carbocloro SA Preference Shares Class B | 725,782 | 5,612 |
| | Banco do Estado do Rio Grande do Sul SA Preference Shares Class B | 2,849,074 | 5,544 |
| | Randon SA Implementos e Participacoes Preference Shares | 2,467,111 | 4,566 |
| * | Alpargatas SA Preference Shares | 3,239,950 | 4,019 |
| | Corem Property Group AB Preference Shares | 156,888 | 4,001 |
| * | Azul SA Preference Shares | 3,879,555 | 3,812 |
| | Daishin Securities Co. Ltd. Preference Shares | 298,023 | 3,374 |
| | Banco ABC Brasil SA Preference Shares | 918,900 | 3,325 |
| | LG H&H Co. Ltd. Preference Shares | 29,347 | 3,088 |
| | Samsung SDI Co. Ltd. Preference Shares | 20,400 | 2,948 |
| | Cia de Ferro Ligas da Bahia FERBASA Preference Shares | 2,118,208 | 2,770 |
| | Amorepacific Corp. Preference Shares | 81,119 | 1,943 |
| | Taurus Armas SA Preference Shares | 960,200 | 1,561 |
| | CJ CheilJedang Corp. Preference Shares | 10,946 | 1,047 |
| | Hanwha Corp. Preference Shares | 84,605 | 916 |
| | Hyundai Engineering & Construction Co. Ltd. Preference Shares | 15,112 | 532 |
| | Mirae Asset Securities Co. Ltd. Preference Shares | 36,379 | 106 |
| | Klabin SA Preference Shares | 1 | — |
| *,3 | Mechel PJSC Preference Shares | 1,017,064 | — |
| Total Preferred Stocks (Cost $2,863,916) | 2,789,394 |
| Rights (0.0%) |
| * | Peptron Inc. Exp. 11/14/24 | 31,490 | 751 |
| *,1 | Ecopro HN Co. Ltd. Exp. 12/5/24 | 44,280 | 162 |
| * | Shougang Fushan Resources Group Ltd. Exp. 11/5/24 | 814,607 | 20 |
| * | STCUBE Exp. 11/22/24 | 18,575 | 20 |
Total International Stock Index Fund
| | | | | | Shares | Market
Value•
($000) |
| * | PMB Technology Bhd. Exp. 11/8/24 | 206,559 | 19 |
| *,3 | LOTTE REIT Co. Ltd. Exp. 11/5/24 | 317,951 | 12 |
| * | Hidrovias do Brasil SA Exp. 11/18/24 | 3,201,851 | 11 |
| * | ESR-LOGOS REIT Exp. 11/1/24 | 3,379,433 | — |
| *,3 | Wafer Works Corp. Exp. 11/4/24 | 320,586 | — |
| *,3 | Lumosa Therapeutics Co. Ltd. Exp. 11/4/24 | 7,354 | — |
| *,3 | Apex International Co. Ltd. Exp. 11/1/24 | 369,167 | — |
| *,3 | Waffer Technology Corp. Exp. 12/2/24 | 41,794 | — |
| *,3 | OBI Pharma Inc. Exp. 11/5/24 | 266,663 | — |
| *,1 | Sesa SpA Exp. 11/28/24 | 102,681 | — |
| *,3 | Unitech Printed Circuit Board Corp. Exp. 12/2/24 | 404,475 | — |
| *,3 | Fittech Co. Ltd. Exp. 11/15/24 | 40,920 | — |
| * | Reply SpA Exp. 11/28/24 | 313,315 | — |
| Total Rights (Cost $—) | 995 |
| Warrants (0.0%) |
| *,1,3 | Webuild SpA Exp. 8/2/30 | 374,482 | 351 |
| * | VGI PCL (Foreign) Exp. 12/31/25 | 7,770,071 | 304 |
| * | Jasmine International PCL Exp. 10/10/31 | 9,166,459 | 82 |
| * | Malaysian Resources Corp. Bhd. Exp. 10/29/27 | 2,634,201 | 54 |
| * | VGI PCL Exp. 5/23/27 | 16,082,270 | 48 |
| *,3 | Serba Dinamik Holdings Bhd. Exp. 12/5/24 | 5,144,856 | — |
| *,3 | Constellation Software Inc. Exp. 3/31/40 | 256,880 | — |
| *,1 | Paradigm Biopharmaceuticals Ltd. Exp. 11/30/24 | 252,338 | — |
| Total Warrants (Cost $—) | 839 |
| Temporary Cash Investments (1.8%) |
| Money Market Fund (1.8%) |
| 6,7 | Vanguard Market Liquidity Fund, 4.834% (Cost $7,854,318) | 78,556,258 | 7,854,840 |
| Total Investments (100.8%) (Cost $357,573,191) | | 445,233,786 |
| Other Assets and Liabilities—Net (-0.8%) | | (3,542,904) |
| Net Assets (100%) | | 441,690,882 |
| • | See Note A in Notes to Financial Statements. |
| * | Non-income-producing security. |
| 1 | Includes partial security positions on loan to broker-dealers. The total value of securities on loan is $2,797,665,000. |
| 2 | Security exempt from registration under Rule 144A of the Securities Act of 1933. Such securities may be sold in transactions exempt from registration, normally to qualified institutional buyers. At October 31, 2024, the aggregate value was $12,115,038,000, representing 2.7% of net assets. |
| 3 | Security value determined using significant unobservable inputs. |
| 4 | “Other” represents securities that are not classified by the fund’s benchmark index. |
| 5 | Considered an affiliated company of the fund as the issuer is another member of The Vanguard Group. |
| 6 | Affiliated money market fund available only to Vanguard funds and certain trusts and accounts managed by Vanguard. Rate shown is the 7-day yield. |
| 7 | Collateral of $3,828,596,000 was received for securities on loan. |
| | ADR—American Depositary Receipt. |
| | GDR—Global Depositary Receipt. |
| | NVDR—Non-Voting Depositary Receipt. |
| | REIT—Real Estate Investment Trust. |
Derivative Financial Instruments Outstanding as of Period End
| Futures Contracts |
| | | | ($000) |
| | Expiration | Number of
Long (Short)
Contracts | Notional
Amount | Value and
Unrealized
Appreciation
(Depreciation) |
| Long Futures Contracts |
| E-mini S&P 500 Index | December 2024 | 500 | 143,462 | (1,714) |
| Euro Stoxx 50 Index | December 2024 | 14,772 | 776,739 | (11,870) |
| FTSE 100 Index | December 2024 | 6,287 | 658,837 | (16,946) |
| MSCI Emerging Markets Index | December 2024 | 12,788 | 720,284 | (5,318) |
| S&P ASX 200 Index | December 2024 | 2,151 | 289,131 | (1,456) |
Total International Stock Index Fund
| Futures Contracts (continued) |
| | | | ($000) |
| | Expiration | Number of
Long (Short)
Contracts | Notional
Amount | Value and
Unrealized
Appreciation
(Depreciation) |
| S&P TSX 60 Index | December 2024 | 1,319 | 274,211 | 5,720 |
| Topix Index | December 2024 | 3,725 | 660,591 | 27,194 |
| | | | | (4,390) |
| Forward Currency Contracts |
| | Contract
Settlement
Date | Contract Amount (000) | Unrealized
Appreciation
($000) | Unrealized
(Depreciation)
($000) |
| Counterparty | | Receive | | Deliver |
| Toronto-Dominion Bank | 12/18/24 | AUD | 277,952 | USD | 185,263 | — | (2,262) |
| JPMorgan Chase Bank, N.A. | 12/18/24 | AUD | 71,999 | USD | 47,778 | — | (374) |
| BNP Paribas | 12/18/24 | CAD | 417,952 | USD | 308,787 | — | (8,154) |
| Royal Bank of Canada | 12/18/24 | EUR | 323,943 | USD | 359,485 | — | (6,434) |
| Bank of America, N.A. | 12/18/24 | EUR | 107,981 | USD | 120,112 | — | (2,428) |
| HSBC Bank plc | 12/18/24 | GBP | 281,390 | USD | 368,292 | — | (5,487) |
| Royal Bank of Canada | 12/18/24 | GBP | 72,281 | USD | 93,798 | — | (604) |
| Citibank, N.A. | 12/18/24 | INR | 28,599,603 | USD | 339,180 | 323 | — |
| HSBC Bank plc | 12/18/24 | INR | 28,100,940 | USD | 333,438 | 145 | — |
| Royal Bank of Canada | 12/18/24 | INR | 24,607,654 | USD | 292,656 | — | (541) |
| State Street Bank & Trust Co. | 12/18/24 | INR | 21,876,112 | USD | 259,576 | 112 | — |
| State Street Bank & Trust Co. | 12/18/24 | INR | 21,287,431 | USD | 252,762 | — | (62) |
| Bank of America, N.A. | 12/18/24 | INR | 19,477,791 | USD | 231,108 | 111 | — |
| Morgan Stanley Capital Services LLC | 12/18/24 | INR | 9,983,901 | USD | 118,495 | 23 | — |
| BNP Paribas | 12/18/24 | INR | 6,464,443 | USD | 76,795 | — | (57) |
| Bank of America, N.A. | 12/18/24 | INR | 6,308,571 | USD | 74,971 | — | (82) |
| UBS AG | 12/18/24 | INR | 4,666,614 | USD | 55,418 | — | (21) |
| BNP Paribas | 12/18/24 | JPY | 64,599,212 | USD | 456,903 | — | (29,178) |
| JPMorgan Chase Bank, N.A. | 12/18/24 | JPY | 14,180,315 | USD | 100,362 | — | (6,471) |
| HSBC Bank plc | 12/18/24 | USD | 51,333 | AUD | 74,962 | 1,979 | — |
| Goldman Sachs International | 12/18/24 | USD | 104,287 | BRL | 595,457 | 1,816 | — |
| Royal Bank of Canada | 12/18/24 | USD | 104,700 | CAD | 141,721 | 2,760 | — |
| State Street Bank & Trust Co. | 12/18/24 | USD | 377,610 | CHF | 316,744 | 8,954 | — |
| HSBC Bank plc | 12/18/24 | USD | 107,501 | EUR | 97,208 | 1,558 | — |
| State Street Bank & Trust Co. | 12/18/24 | USD | 120,300 | HKD | 934,854 | — | (45) |
| UBS AG | 12/18/24 | USD | 482,550 | JPY | 69,165,103 | 24,594 | — |
| Royal Bank of Canada | 12/18/24 | USD | 113,162 | JPY | 16,462,860 | 4,158 | — |
| Bank of America, N.A. | 12/18/24 | USD | 19,173 | KRW | 25,601,213 | 583 | — |
| Bank of Montreal | 12/18/24 | USD | 53,253 | SEK | 549,934 | 1,513 | — |
| Citibank, N.A. | 12/18/24 | USD | 5,380 | TWD | 170,729 | 29 | — |
| | | | | | | 48,658 | (62,200) |
| AUD—Australian dollar. |
| BRL—Brazilian real. |
| CAD—Canadian dollar. |
| CHF—Swiss franc. |
| EUR—euro. |
| GBP—British pound. |
| HKD—Hong Kong dollar. |
| INR—Indian rupee. |
| JPY—Japanese yen. |
| KRW—Korean won. |
| SEK—Swedish krona. |
| TWD—Taiwanese dollar. |
| USD—U.S. dollar. |
Total International Stock Index Fund
| Over-the-Counter Total Return Swaps |
| Reference Entity | Termination
Date | Counterparty | Notional
Amount
($000) | Floating
Interest
Rate
Received
(Paid)1
(%) | Value and
Unrealized
Appreciation
($000) | Value and
Unrealized
(Depreciation)
($000) |
| Ambipar Participacoes e Empreendimentos SA Class B | 8/29/25 | BANA | 17,603 | 10.160 | — | (1,809) |
| Bank of Nanjing Co. Ltd. Class A | 3/26/25 | MSCS | 3,980 | 1.910 | — | (300) |
| Bank of Nanjing Co. Ltd. Class A | 3/26/25 | MSCS | 3,344 | 1.910 | — | (260) |
| Bank of Nanjing Co. Ltd. Class A | 3/26/25 | MSCS | 644 | 1.910 | — | (49) |
| China Tourism Group Duty Free Corp. Ltd. Class A | 3/26/25 | MSCS | 11,003 | 0.660 | — | (1,465) |
| FTSE China A Stock Connect CNY All Cap Index | 6/5/25 | GSI | 159,023 | (1.357) | 4,467 | — |
| FTSE China A Stock Connect CNY All Cap Index | 6/5/25 | MSCS | 169,284 | (1.410) | — | (5,898) |
| FTSE China A Stock Connect CNY All Cap Index | 6/20/25 | BANA | 224,697 | (1.340) | — | (8,089) |
| Hyundai Glovis Co. Ltd. | 1/31/25 | GSI | 13,137 | (0.756) | 585 | — |
| Hyundai Glovis Co. Ltd. | 1/31/25 | GSI | 13,137 | (0.756) | 585 | — |
| JA Solar Technology Co. Ltd. Class A | 1/27/25 | GSI | 4,102 | 0.213 | 1,600 | — |
| Kum Yang Co. Ltd. | 1/31/25 | GSI | 10,385 | (0.256) | — | (1,777) |
| LG Energy Solution Ltd. | 1/31/25 | GSI | 48,940 | (2.506) | — | (221) |
| Luxshare Precision Industry Co. Ltd. Class A | 1/24/25 | CITNA | 21,680 | (1.840) | — | (945) |
| Polaris Group | 3/26/25 | MSCS | 4,361 | 4.161 | — | (476) |
| RDC Semiconductor Co. Ltd. | 3/26/25 | MSCS | 2,171 | 2.661 | — | (59) |
| Shenzhen Transsion Holdings Co. Ltd. Class A | 3/26/25 | MSCS | 6,922 | 1.160 | — | (876) |
| Shenzhen Transsion Holdings Co. Ltd. Class A | 3/26/25 | MSCS | 2,769 | 1.160 | — | (351) |
| Sungrow Power Supply Co. Ltd. Class A | 3/26/25 | MSCS | 10,329 | 0.167 | — | (777) |
| Taishin Financial Holding Co. Ltd. | 3/26/25 | MSCS | 58,795 | (3.832) | — | (125) |
| | | | | | 7,237 | (23,477) |
| 1 | Based on Overnight Bank Funding Rate as of the most recent reset date. Floating interest payment received/paid monthly. |
| | BANA—Bank of America, N.A. |
| | CITNA—Citibank, N.A. |
| | GSI—Goldman Sachs International. |
| | MSCS—Morgan Stanley Capital Services LLC. |
At October 31, 2024, the counterparties had deposited in segregated accounts securities with a value of $47,305,000 and cash of $1,240,000 in connection with open forward currency contracts and over-the-counter swap contracts.
See accompanying Notes, which are an integral part of the Financial Statements.
Total International Stock Index Fund
Statement of Assets and Liabilities
|
| ($000s, except shares, footnotes, and per-share amounts) | Amount |
| Assets | |
| Investments in Securities, at Value1 | |
| Unaffiliated Issuers (Cost $349,220,826) | 436,785,770 |
| Affiliated Issuers (Cost $8,352,365) | 8,448,016 |
| Total Investments in Securities | 445,233,786 |
| Investment in Vanguard | 12,598 |
| Foreign Currency, at Value (Cost $427,673) | 422,447 |
| Cash Collateral Pledged—Futures Contracts | 193,238 |
| Cash Collateral Pledged—Over-the-Counter Swap Contracts and Forward Currency Contracts | 75,494 |
| Receivables for Investment Securities Sold | 476,461 |
| Receivables for Accrued Income | 1,671,403 |
| Receivables for Capital Shares Issued | 131,674 |
| Unrealized Appreciation—Forward Currency Contracts | 48,658 |
| Unrealized Appreciation—Over-the-Counter Swap Contracts | 7,237 |
| Total Assets | 448,272,996 |
| Liabilities | |
| Due to Custodian | 495,285 |
| Payables for Investment Securities Purchased | 69,808 |
| Collateral for Securities on Loan | 3,828,596 |
| Payables for Capital Shares Redeemed | 90,299 |
| Payables to Vanguard | 40,824 |
| Variation Margin Payable—Futures Contracts | 30,519 |
| Unrealized Depreciation—Forward Currency Contracts | 62,200 |
| Unrealized Depreciation—Over-the-Counter Swap Contracts | 23,477 |
| Deferred Foreign Capital Gains Taxes | 1,941,106 |
| Total Liabilities | 6,582,114 |
| Net Assets | 441,690,882 |
| 1 Includes $2,797,665,000 of securities on loan. | |
Total International Stock Index Fund
Statement of Assets and Liabilities (continued)
|
At October 31, 2024, net assets consisted of: |
|
| ($000s, except shares, footnotes, and per-share amounts) | Amount |
| Paid-in Capital | 388,877,637 |
| Total Distributable Earnings (Loss) | 52,813,245 |
| Net Assets | 441,690,882 |
| |
| Investor Shares—Net Assets | |
Applicable to 10,307,803,715 outstanding $.001 par value shares of
beneficial interest (unlimited authorization) | 204,358,331 |
| Net Asset Value Per Share—Investor Shares | $19.83 |
| |
| ETF Shares—Net Assets | |
Applicable to 1,247,631,996 outstanding $.001 par value shares of
beneficial interest (unlimited authorization) | 76,942,331 |
| Net Asset Value Per Share—ETF Shares | $61.67 |
| |
| Admiral™ Shares—Net Assets | |
Applicable to 2,279,879,946 outstanding $.001 par value shares of
beneficial interest (unlimited authorization) | 75,608,384 |
| Net Asset Value Per Share—Admiral Shares | $33.16 |
| |
| Institutional Shares—Net Assets | |
Applicable to 312,349,651 outstanding $.001 par value shares of
beneficial interest (unlimited authorization) | 41,423,739 |
| Net Asset Value Per Share—Institutional Shares | $132.62 |
| |
| Institutional Plus Shares—Net Assets | |
Applicable to 216,575,302 outstanding $.001 par value shares of
beneficial interest (unlimited authorization) | 28,729,310 |
| Net Asset Value Per Share—Institutional Plus Shares | $132.65 |
| |
| Institutional Select Shares—Net Assets | |
Applicable to 104,693,907 outstanding $.001 par value shares of
beneficial interest (unlimited authorization) | 14,628,787 |
| Net Asset Value Per Share—Institutional Select Shares | $139.73 |
See accompanying Notes, which are an integral part of the Financial Statements.
Total International Stock Index Fund
|
| | Year Ended
October 31, 2024 |
| | ($000) |
| Investment Income | |
| Income | |
| Dividends—Unaffiliated Issuers1 | 12,065,131 |
| Dividends—Affiliated Issuers | 15,389 |
| Interest—Unaffiliated Issuers | 10,155 |
| Interest—Affiliated Issuers | 178,126 |
| Securities Lending—Net | 129,052 |
| Total Income | 12,397,853 |
| Expenses | |
| The Vanguard Group—Note B | |
| Investment Advisory Services | 25,598 |
| Management and Administrative—Investor Shares | 288,897 |
| Management and Administrative—ETF Shares | 35,038 |
| Management and Administrative—Admiral Shares | 67,343 |
| Management and Administrative—Institutional Shares | 25,031 |
| Management and Administrative—Institutional Plus Shares | 16,456 |
| Management and Administrative—Institutional Select Shares | 3,908 |
| Marketing and Distribution—Investor Shares | 9,280 |
| Marketing and Distribution—ETF Shares | 2,140 |
| Marketing and Distribution—Admiral Shares | 3,165 |
| Marketing and Distribution—Institutional Shares | 1,243 |
| Marketing and Distribution—Institutional Plus Shares | 962 |
| Marketing and Distribution—Institutional Select Shares | 21 |
| Custodian Fees | 34,796 |
| Auditing Fees | 202 |
| Shareholders’ Reports and Proxy Fees—Investor Shares | 1,751 |
| Shareholders’ Reports and Proxy Fees—ETF Shares | 1,340 |
| Shareholders’ Reports and Proxy Fees—Admiral Shares | 947 |
| Shareholders’ Reports and Proxy Fees—Institutional Shares | 541 |
| Shareholders’ Reports and Proxy Fees—Institutional Plus Shares | 159 |
| Shareholders’ Reports and Proxy Fees—Institutional Select Shares | — |
| Trustees’ Fees and Expenses | 274 |
| Other Expenses | 6,233 |
| Total Expenses | 525,325 |
| Expenses Paid Indirectly | (5) |
| Net Expenses | 525,320 |
| Net Investment Income | 11,872,533 |
| Realized Net Gain (Loss) | |
| Capital Gain Distributions Received—Affiliated Issuers | 24 |
| Investment Securities Sold—Unaffiliated Issuers2,3 | (3,253,758) |
| Investment Securities Sold—Affiliated Issuers | (11,111) |
| Futures Contracts | 536,247 |
| Swap Contracts | 74,497 |
| Forward Currency Contracts | 49,555 |
| Foreign Currencies | 31,368 |
| Realized Net Gain (Loss) | (2,573,178) |
See accompanying Notes, which are an integral part of the Financial Statements.
Total International Stock Index Fund
Statement of Operations (continued)
|
| | Year Ended
October 31, 2024 |
| | ($000) |
| Change in Unrealized Appreciation (Depreciation) | |
| Investment Securities—Unaffiliated Issuers4 | 73,745,825 |
| Investment Securities—Affiliated Issuers | 128,167 |
| Futures Contracts | 170,928 |
| Swap Contracts | 3,220 |
| Forward Currency Contracts | 31,429 |
| Foreign Currencies | (41,037) |
| Change in Unrealized Appreciation (Depreciation) | 74,038,532 |
| Net Increase (Decrease) in Net Assets Resulting from Operations | 83,337,887 |
| 1 | Dividends are net of foreign withholding taxes of $1,109,844,000. |
| 2 | Realized Gain (Loss) is net of foreign capital gains taxes of $39,178,000. |
| 3 | Includes $1,650,551,000 of net gain (loss) resulting from in-kind redemptions. |
| 4 | The change in unrealized appreciation (depreciation) is net of the change in deferred foreign capital gains taxes of $1,166,878,000. |
See accompanying Notes, which are an integral part of the Financial Statements.
Total International Stock Index Fund
Statement of Changes in Net Assets
|
| | Year Ended October 31, |
| | 2024
($000) | 2023
($000) |
| Increase (Decrease) in Net Assets | | |
| Operations | | |
| Net Investment Income | 11,872,533 | 11,010,927 |
| Realized Net Gain (Loss) | (2,573,178) | (4,990,976) |
| Change in Unrealized Appreciation (Depreciation) | 74,038,532 | 33,277,762 |
| Net Increase (Decrease) in Net Assets Resulting from Operations | 83,337,887 | 39,297,713 |
| Distributions | | |
| Investor Shares | (5,687,946) | (4,978,504) |
| ETF Shares | (2,083,060) | (1,658,625) |
| Admiral Shares | (2,233,897) | (2,048,132) |
| Institutional Shares | (1,225,713) | (1,115,928) |
| Institutional Plus Shares | (959,063) | (876,306) |
| Institutional Select Shares | (372,948) | (285,539) |
| Total Distributions | (12,562,627) | (10,963,034) |
| Capital Share Transactions | | |
| Investor Shares | 8,106,229 | 1,468,985 |
| ETF Shares | 11,087,380 | 6,697,225 |
| Admiral Shares | (1,516,131) | (374,643) |
| Institutional Shares | (253,888) | (335,030) |
| Institutional Plus Shares | (4,588,003) | (326,813) |
| Institutional Select Shares | 3,641,495 | 62,813 |
| Net Increase (Decrease) from Capital Share Transactions | 16,477,082 | 7,192,537 |
| Total Increase (Decrease) | 87,252,342 | 35,527,216 |
| Net Assets | | |
| Beginning of Period | 354,438,540 | 318,911,324 |
| End of Period | 441,690,882 | 354,438,540 |
See accompanying Notes, which are an integral part of the Financial Statements.
Total International Stock Index Fund
| Investor Shares | | | | | |
For a Share Outstanding
Throughout Each Period | Year Ended October 31, |
| 2024 | 2023 | 2022 | 2021 | 2020 |
| Net Asset Value, Beginning of Period | $16.57 | $15.20 | $20.86 | $16.39 | $17.13 |
| Investment Operations | | | | | |
| Net Investment Income1 | .532 | .517 | .548 | .506 | .389 |
| Net Realized and Unrealized Gain (Loss) on Investments | 3.296 | 1.370 | (5.613) | 4.464 | (.718) |
| Total from Investment Operations | 3.828 | 1.887 | (5.065) | 4.970 | (.329) |
| Distributions | | | | | |
| Dividends from Net Investment Income | (.568) | (.517) | (.595) | (.500) | (.411) |
| Distributions from Realized Capital Gains | — | — | — | — | — |
| Total Distributions | (.568) | (.517) | (.595) | (.500) | (.411) |
| Net Asset Value, End of Period | $19.83 | $16.57 | $15.20 | $20.86 | $16.39 |
| Total Return2 | 23.32% | 12.29% | -24.70% | 30.45% | -1.93% |
| Ratios/Supplemental Data | | | | | |
| Net Assets, End of Period (Millions) | $204,358 | $163,566 | $148,776 | $199,230 | $155,670 |
| Ratio of Total Expenses to Average Net Assets | 0.17%3 | 0.18%3 | 0.17%3 | 0.17% | 0.17% |
| Ratio of Net Investment Income to Average Net Assets | 2.77% | 2.95% | 3.03% | 2.49% | 2.39% |
| Portfolio Turnover Rate4 | 3% | 4% | 5% | 8% | 7% |
| 1 | Calculated based on average shares outstanding. |
| 2 | Total returns do not include account service fees that may have applied in the periods shown. Fund prospectuses provide information about any applicable account service fees. |
| 3 | The ratio of expenses to average net assets for the period net of reduction from custody fee offset arrangements was 0.17%, 0.18% and 0.17%, respectively. |
| 4 | Excludes the value of portfolio securities received or delivered as a result of in-kind purchases or redemptions of the fund’s capital shares, including ETF Creation Units. |
See accompanying Notes, which are an integral part of the Financial Statements.
Total International Stock Index Fund
| ETF Shares | | | | | |
For a Share Outstanding
Throughout Each Period | Year Ended October 31, |
| 2024 | 2023 | 2022 | 2021 | 2020 |
| Net Asset Value, Beginning of Period | $51.56 | $47.28 | $64.90 | $50.97 | $53.30 |
| Investment Operations | | | | | |
| Net Investment Income1 | 1.721 | 1.669 | 1.777 | 1.677 | 1.251 |
| Net Realized and Unrealized Gain (Loss) on Investments | 10.215 | 4.274 | (17.486) | 13.870 | (2.256) |
| Total from Investment Operations | 11.936 | 5.943 | (15.709) | 15.547 | (1.005) |
| Distributions | | | | | |
| Dividends from Net Investment Income | (1.826) | (1.663) | (1.911) | (1.617) | (1.325) |
| Distributions from Realized Capital Gains | — | — | — | — | — |
| Total Distributions | (1.826) | (1.663) | (1.911) | (1.617) | (1.325) |
| Net Asset Value, End of Period | $61.67 | $51.56 | $47.28 | $64.90 | $50.97 |
| Total Return | 23.37% | 12.46% | -24.64% | 30.66% | -1.88% |
| Ratios/Supplemental Data | | | | | |
| Net Assets, End of Period (Millions) | $76,942 | $54,767 | $44,401 | $51,747 | $28,294 |
| Ratio of Total Expenses to Average Net Assets | 0.07%2 | 0.08%2 | 0.07%2 | 0.07% | 0.08% |
| Ratio of Net Investment Income to Average Net Assets | 2.88% | 3.06% | 3.16% | 2.64% | 2.46% |
| Portfolio Turnover Rate3 | 3% | 4% | 5% | 8% | 7% |
| 1 | Calculated based on average shares outstanding. |
| 2 | The ratio of expenses to average net assets for the period net of reduction from custody fee offset arrangements was 0.07%, 0.08% and 0.07%, respectively. |
| 3 | Excludes the value of portfolio securities received or delivered as a result of in-kind purchases or redemptions of the fund’s capital shares, including ETF Creation Units. |
See accompanying Notes, which are an integral part of the Financial Statements.
Total International Stock Index Fund
| Admiral Shares | | | | | |
For a Share Outstanding
Throughout Each Period | Year Ended October 31, |
| 2024 | 2023 | 2022 | 2021 | 2020 |
| Net Asset Value, Beginning of Period | $27.72 | $25.43 | $34.90 | $27.41 | $28.66 |
| Investment Operations | | | | | |
| Net Investment Income1 | .907 | .885 | .942 | .868 | .658 |
| Net Realized and Unrealized Gain (Loss) on Investments | 5.502 | 2.288 | (9.398) | 7.478 | (1.205) |
| Total from Investment Operations | 6.409 | 3.173 | (8.456) | 8.346 | (.547) |
| Distributions | | | | | |
| Dividends from Net Investment Income | (.969) | (.883) | (1.014) | (.856) | (.703) |
| Distributions from Realized Capital Gains | — | — | — | — | — |
| Total Distributions | (.969) | (.883) | (1.014) | (.856) | (.703) |
| Net Asset Value, End of Period | $33.16 | $27.72 | $25.43 | $34.90 | $27.41 |
| Total Return2 | 23.34% | 12.35% | -24.65% | 30.59% | -1.92% |
| Ratios/Supplemental Data | | | | | |
| Net Assets, End of Period (Millions) | $75,608 | $64,479 | $59,468 | $80,052 | $64,452 |
| Ratio of Total Expenses to Average Net Assets | 0.11%3 | 0.12%3 | 0.11%3 | 0.11% | 0.11% |
| Ratio of Net Investment Income to Average Net Assets | 2.83% | 3.02% | 3.11% | 2.55% | 2.40% |
| Portfolio Turnover Rate4 | 3% | 4% | 5% | 8% | 7% |
| 1 | Calculated based on average shares outstanding. |
| 2 | Total returns do not include account service fees that may have applied in the periods shown. Fund prospectuses provide information about any applicable account service fees. |
| 3 | The ratio of expenses to average net assets for the period net of reduction from custody fee offset arrangements was 0.11%, 0.12% and 0.11%, respectively. |
| 4 | Excludes the value of portfolio securities received or delivered as a result of in-kind purchases or redemptions of the fund’s capital shares, including ETF Creation Units. |
See accompanying Notes, which are an integral part of the Financial Statements.
Total International Stock Index Fund
| Institutional Shares | | | | | |
For a Share Outstanding
Throughout Each Period | Year Ended October 31, |
| 2024 | 2023 | 2022 | 2021 | 2020 |
| Net Asset Value, Beginning of Period | $110.87 | $101.68 | $139.55 | $109.61 | $114.61 |
| Investment Operations | | | | | |
| Net Investment Income1 | 3.663 | 3.572 | 3.806 | 3.519 | 2.670 |
| Net Realized and Unrealized Gain (Loss) on Investments | 22.001 | 9.182 | (37.582) | 29.888 | (4.826) |
| Total from Investment Operations | 25.664 | 12.754 | (33.776) | 33.407 | (2.156) |
| Distributions | | | | | |
| Dividends from Net Investment Income | (3.914) | (3.564) | (4.094) | (3.467) | (2.844) |
| Distributions from Realized Capital Gains | — | — | — | — | — |
| Total Distributions | (3.914) | (3.564) | (4.094) | (3.467) | (2.844) |
| Net Asset Value, End of Period | $132.62 | $110.87 | $101.68 | $139.55 | $109.61 |
| Total Return | 23.37% | 12.41% | -24.63% | 30.62% | -1.89% |
| Ratios/Supplemental Data | | | | | |
| Net Assets, End of Period (Millions) | $41,424 | $34,802 | $32,204 | $42,913 | $31,735 |
| Ratio of Total Expenses to Average Net Assets | 0.08%2 | 0.09%2 | 0.08%2 | 0.08% | 0.08% |
| Ratio of Net Investment Income to Average Net Assets | 2.86% | 3.05% | 3.14% | 2.58% | 2.44% |
| Portfolio Turnover Rate3 | 3% | 4% | 5% | 8% | 7% |
| 1 | Calculated based on average shares outstanding. |
| 2 | The ratio of expenses to average net assets for the period net of reduction from custody fee offset arrangements was 0.08%, 0.09% and 0.08%, respectively. |
| 3 | Excludes the value of portfolio securities received or delivered as a result of in-kind purchases or redemptions of the fund’s capital shares, including ETF Creation Units. |
See accompanying Notes, which are an integral part of the Financial Statements.
Total International Stock Index Fund
| Institutional Plus Shares | | | | | |
For a Share Outstanding
Throughout Each Period | Year Ended October 31, |
| 2024 | 2023 | 2022 | 2021 | 2020 |
| Net Asset Value, Beginning of Period | $110.90 | $101.70 | $139.59 | $109.63 | $114.63 |
| Investment Operations | | | | | |
| Net Investment Income1 | 3.690 | 3.584 | 3.815 | 2.900 | 2.726 |
| Net Realized and Unrealized Gain (Loss) on Investments | 21.987 | 9.192 | (37.597) | 30.529 | (4.871) |
| Total from Investment Operations | 25.677 | 12.776 | (33.782) | 33.429 | (2.145) |
| Distributions | | | | | |
| Dividends from Net Investment Income | (3.927) | (3.576) | (4.108) | (3.469) | (2.855) |
| Distributions from Realized Capital Gains | — | — | — | — | — |
| Total Distributions | (3.927) | (3.576) | (4.108) | (3.469) | (2.855) |
| Net Asset Value, End of Period | $132.65 | $110.90 | $101.70 | $139.59 | $109.63 |
| Total Return | 23.38% | 12.43% | -24.63% | 30.63% | -1.88% |
| Ratios/Supplemental Data | | | | | |
| Net Assets, End of Period (Millions) | $28,729 | $27,752 | $25,785 | $32,880 | $83,550 |
| Ratio of Total Expenses to Average Net Assets | 0.07%2 | 0.08%2 | 0.07%2 | 0.07% | 0.07% |
| Ratio of Net Investment Income to Average Net Assets | 2.88% | 3.06% | 3.15% | 2.18% | 2.50% |
| Portfolio Turnover Rate3 | 3% | 4% | 5% | 8% | 7% |
| 1 | Calculated based on average shares outstanding. |
| 2 | The ratio of expenses to average net assets for the period net of reduction from custody fee offset arrangements was 0.07%, 0.08% and 0.07%, respectively. |
| 3 | Excludes the value of portfolio securities received or delivered as a result of in-kind purchases or redemptions of the fund’s capital shares, including ETF Creation Units. |
See accompanying Notes, which are an integral part of the Financial Statements.
Total International Stock Index Fund
| Institutional Select Shares | | | | | |
For a Share Outstanding
Throughout Each Period | Year Ended October 31, |
| 2024 | 2023 | 2022 | 2021 | 2020 |
| Net Asset Value, Beginning of Period | $116.81 | $107.13 | $147.04 | $115.49 | $120.75 |
| Investment Operations | | | | | |
| Net Investment Income1 | 3.957 | 3.804 | 4.059 | 3.731 | 2.896 |
| Net Realized and Unrealized Gain (Loss) on Investments | 23.134 | 9.673 | (39.609) | 31.522 | (5.120) |
| Total from Investment Operations | 27.091 | 13.477 | (35.550) | 35.253 | (2.224) |
| Distributions | | | | | |
| Dividends from Net Investment Income | (4.171) | (3.797) | (4.360) | (3.703) | (3.036) |
| Distributions from Realized Capital Gains | — | — | — | — | — |
| Total Distributions | (4.171) | (3.797) | (4.360) | (3.703) | (3.036) |
| Net Asset Value, End of Period | $139.73 | $116.81 | $107.13 | $147.04 | $115.49 |
| Total Return | 23.42% | 12.45% | -24.61% | 30.66% | -1.85% |
| Ratios/Supplemental Data | | | | | |
| Net Assets, End of Period (Millions) | $14,629 | $9,072 | $8,277 | $10,014 | $8,045 |
| Ratio of Total Expenses to Average Net Assets | 0.047%2 | 0.050%2 | 0.047%2 | 0.045% | 0.045% |
| Ratio of Net Investment Income to Average Net Assets | 2.91% | 3.08% | 3.19% | 2.60% | 2.52% |
| Portfolio Turnover Rate3 | 3% | 4% | 5% | 8% | 7% |
| 1 | Calculated based on average shares outstanding. |
| 2 | The ratio of expenses to average net assets for the period net of reduction from custody fee offset arrangements was 0.047%, 0.050% and 0.047%, respectively. |
| 3 | Excludes the value of portfolio securities received or delivered as a result of in-kind purchases or redemptions of the fund’s capital shares, including ETF Creation Units. |
See accompanying Notes, which are an integral part of the Financial Statements.
Total International Stock Index Fund
Notes to Financial Statements
Vanguard Total International Stock Index Fund is registered under the Investment Company Act of 1940 as an open-end investment company, or mutual fund. The fund offers six classes of shares: Investor Shares, ETF Shares, Admiral Shares, Institutional Shares, Institutional Plus Shares, and Institutional Select Shares. Each of the share classes has different eligibility and minimum purchase requirements, and is designed for different types of investors. ETF Shares are listed for trading on Nasdaq; they can be purchased and sold through a broker.
A. The following significant accounting policies conform to generally accepted accounting principles for U.S. investment companies. The fund consistently follows such policies in preparing its financial statements.
1. Security Valuation: Securities are valued as of the close of trading on the New York Stock Exchange (generally 4 p.m., Eastern time) on the valuation date. Equity securities are valued at the latest quoted sales prices or official closing prices taken from the primary market in which each security trades; such securities not traded on the valuation date are valued at the mean of the latest quoted bid and asked prices. Securities for which market quotations are not readily available, or whose values have been affected by events occurring before the fund's pricing time but after the close of the securities’ primary markets, are valued by methods deemed by the valuation designee to represent fair value and subject to oversight by the board of trustees.
These procedures include obtaining quotations from an independent pricing service, monitoring news to identify significant market- or security-specific events, and evaluating changes in the values of foreign market proxies (for example, ADRs, futures contracts, or exchange-traded funds), between the time the foreign markets close and the fund’s pricing time. When fair-value pricing is employed, the prices of securities used by a fund to calculate its net asset value may differ from quoted or published prices for the same securities. Investments in Vanguard Market Liquidity Fund are valued at that fund's net asset value.
2. Foreign Currency: Securities and other assets and liabilities denominated in foreign currencies are translated into U.S. dollars using exchange rates obtained from an independent third party as of the fund’s pricing time on the valuation date. Realized gains (losses) and unrealized appreciation (depreciation) on investment securities include the effects of changes in exchange rates since the securities were purchased, combined with the effects of changes in security prices. Fluctuations in the value of other assets and liabilities resulting from changes in exchange rates are recorded as unrealized foreign currency gains (losses) until the assets or liabilities are settled in cash, at which time they are recorded as realized foreign currency gains (losses).
3. Futures Contracts: The fund uses index futures contracts to a limited extent, with the objectives of maintaining full exposure to the stock market, maintaining liquidity, and minimizing transaction costs. The fund may purchase futures contracts to immediately invest incoming cash in the market, or sell futures in response to cash outflows, thereby simulating a fully invested position in the underlying index while maintaining a cash balance for liquidity. The primary risks associated with the use of futures contracts are imperfect correlation between changes in market values of stocks held by the fund and the prices of futures contracts, and the possibility of an illiquid market. Counterparty risk involving futures is mitigated because a regulated clearinghouse is the counterparty instead of the clearing broker. To further mitigate counterparty risk, the fund trades futures contracts on an exchange, monitors the financial strength of its clearing brokers and clearinghouse, and has entered into clearing agreements with its clearing brokers. The clearinghouse imposes initial margin requirements to secure the fund’s performance and requires daily settlement of variation margin representing changes in the market value of each contract. Any securities pledged as initial margin for open contracts are noted in the Schedule of Investments.
Futures contracts are valued at their quoted daily settlement prices. The notional amounts of the contracts are not recorded in the Statement of Assets and Liabilities. Fluctuations in the value of the contracts are recorded in the Statement of Assets and Liabilities as an asset (liability) and in the Statement of Operations as unrealized appreciation (depreciation) until the contracts are closed, when they are recorded as realized gains (losses) on futures contracts.
During the year ended October 31, 2024, the fund’s average investments in long and short futures contracts represented 1% and 0% of net assets, respectively, based on the average of the notional amounts at each quarter-end during the period.
4. Forward Currency Contracts: The fund enters into forward currency contracts to protect the value of securities and related receivables and payables against changes in future foreign exchange rates. Risks associated with these types of forward currency contracts include movement in the values of the foreign currencies relative to the U.S. dollar and the ability of the counterparties to fulfill their obligations under the contracts. The fund mitigates its counterparty risk by entering into forward currency contracts only with a diverse group of prequalified counterparties, monitoring their financial strength, entering into master netting arrangements with its counterparties, and requiring its counterparties to transfer collateral as security for their performance. In the absence of a default, the collateral pledged or received by the fund cannot be repledged, resold, or rehypothecated. The master netting arrangements provide that, in the event of a counterparty’s default (including bankruptcy), the fund may terminate the forward currency contracts, determine the net amount owed by either party in accordance with its master netting arrangements, and sell or retain any collateral held up to the net amount owed to the fund under the master netting arrangements. The forward currency contracts contain provisions whereby a counterparty may terminate open contracts if the fund’s net assets decline below a certain level, triggering a payment by the fund if the fund is in a net liability position at the time of the termination. The payment amount would be reduced by any collateral the fund has pledged. Any securities pledged as collateral for open contracts are noted in the Schedule of Investments. The value of collateral received or pledged is compared daily to the value of the forward currency contracts exposure with each counterparty, and any difference, if in excess of a specified minimum transfer amount, is adjusted and settled within two business days.
Forward currency contracts are valued at their quoted daily prices obtained from an independent third party, adjusted for currency risk based on the expiration date of each contract. The notional amounts of the contracts are not recorded in the Statement of Assets and Liabilities. Fluctuations in the value of the contracts are recorded in the Statement of Assets and Liabilities as an asset (liability) and in the Statement of Operations as unrealized appreciation (depreciation) until the contracts are closed, when they are recorded as realized gains (losses) on forward currency contracts.
During the year ended October 31, 2024, the fund’s average investment in forward currency contracts represented 1% of net assets, based on the average of the notional amounts at each quarter-end during the period.
Total International Stock Index Fund
5. Swap Contracts: The fund has entered into equity swap contracts to earn the total return on selected reference stocks or indexes in the fund’s target index. Under the terms of the swaps, the fund receives the total return on the referenced stock (i.e., receiving the increase or paying the decrease in value of the selected reference stock and receiving the equivalent of any dividends in respect of the selected referenced stock) over a specified period of time, applied to a notional amount that represents the value of a designated number of shares of the selected reference stock at the beginning of the equity swap contract. The fund also pays a floating rate that is based on short-term interest rates, applied to the notional amount. At the same time, the fund generally invests an amount approximating the notional amount of the swap in high-quality temporary cash investments.
A risk associated with all types of swaps is the possibility that a counterparty may default on its obligation to pay net amounts due to the fund. The fund’s maximum amount subject to counterparty risk is the unrealized appreciation on the swap contract. The fund mitigates its counterparty risk by entering into swaps only with a diverse group of prequalified counterparties, monitoring their financial strength, entering into master netting arrangements with its counterparties, and requiring its counterparties to transfer collateral as security for their performance. In the absence of a default, the collateral pledged or received by the fund cannot be repledged, resold, or rehypothecated. In the event of a counterparty’s default (including bankruptcy), the fund may terminate any swap contracts with that counterparty, determine the net amount owed by either party in accordance with its master netting arrangements, and sell or retain any collateral held up to the net amount owed to the fund under the master netting arrangements. The swap contracts contain provisions whereby a counterparty may terminate open contracts if the fund's net assets decline below a certain level, triggering a payment by the fund if the fund is in a net liability position at the time of the termination. The payment amount would be reduced by any collateral the fund has pledged. Any securities pledged as collateral for open contracts are noted in the Schedule of Investments. The value of collateral received or pledged is compared daily to the value of the swap contracts exposure with each counterparty, and any difference, if in excess of a specified minimum transfer amount, is adjusted and settled within two business days.
The notional amounts of swap contracts are not recorded in the Statement of Assets and Liabilities. Swaps are valued daily based on market quotations received from independent pricing services or recognized dealers and the change in value is recorded in the Statement of Assets and Liabilities as an asset (liability) and in the Statement of Operations as unrealized appreciation (depreciation) until periodic payments are made or the termination of the swap, at which time realized gain (loss) is recorded.
During the year ended October 31, 2024, the fund’s average amounts of investments in total return swaps represented less than 1% of net assets, based on the average of notional amounts at each quarter-end during the period.
6. Federal Income Taxes: The fund intends to continue to qualify as a regulated investment company and distribute virtually all of its taxable income. The fund’s tax returns are open to examination by the relevant tax authorities until expiration of the applicable statute of limitations, which is generally three years after the filing of the tax return. Management has analyzed the fund’s tax positions taken for all open federal and state income tax years, and has concluded that no provision for income tax is required in the fund’s financial statements.
7. Distributions: Distributions to shareholders are recorded on the ex-dividend date. Distributions are determined on a tax basis at the fiscal year-end and may differ from net investment income and realized capital gains for financial reporting purposes.
8. Securities Lending: To earn additional income, the fund lends its securities to qualified institutional borrowers. Security loans are subject to termination by the fund at any time, and are required to be secured at all times by collateral in an amount at least equal to the market value of securities loaned. Daily market fluctuations could cause the value of loaned securities to be more or less than the value of the collateral received. When this occurs, the collateral is adjusted and settled before the opening of the market on the next business day. The fund further mitigates its counterparty risk by entering into securities lending transactions only with a diverse group of prequalified counterparties, monitoring their financial strength, and entering into master securities lending agreements with its counterparties. The master securities lending agreements provide that, in the event of a counterparty’s default (including bankruptcy), the fund may terminate any loans with that borrower, determine the net amount owed, and sell or retain the collateral up to the net amount owed to the fund; however, such actions may be subject to legal proceedings. While collateral mitigates counterparty risk, in the event of a default, the fund may experience delays and costs in recovering the securities loaned. The fund invests cash collateral received in Vanguard Market Liquidity Fund, and records a liability in the Statement of Assets and Liabilities for the return of the collateral, during the period the securities are on loan. Collateral investments in Vanguard Market Liquidity Fund are subject to market appreciation or depreciation. Securities lending income represents fees charged to borrowers plus income earned on invested cash collateral, less expenses associated with the loan. During the term of the loan, the fund is entitled to all distributions made on or in respect of the loaned securities.
9. Credit Facilities and Interfund Lending Program: The fund and certain other funds managed by The Vanguard Group ("Vanguard") participate in a $4.3 billion committed credit facility provided by a syndicate of lenders pursuant to a credit agreement and an uncommitted credit facility provided by Vanguard. Both facilities may be renewed annually. Each fund is individually liable for its borrowings, if any, under the credit facilities. Borrowings may be utilized for temporary or emergency purposes and are subject to the fund’s regulatory and contractual borrowing restrictions. With respect to the committed credit facility, the participating funds are charged administrative fees and an annual commitment fee of 0.10% of the undrawn committed amount of the facility, which are allocated to the funds based on a method approved by the fund’s board of trustees and included in Management and Administrative expenses on the fund’s Statement of Operations. Any borrowings under either facility bear interest at an agreed-upon spread plus the higher of the federal funds effective rate, the overnight bank funding rate, or the Daily Simple Secured Overnight Financing Rate inclusive of an additional agreed-upon spread. However, borrowings under the uncommitted credit facility may bear interest based upon an alternate rate agreed to by the fund and Vanguard.
In accordance with an exemptive order (the “Order”) from the SEC, the fund may participate in a joint lending and borrowing program that allows registered open-end Vanguard funds to borrow money from and lend money to each other for temporary or emergency purposes (the “Interfund Lending Program”), subject to compliance with the terms and conditions of the Order, and to the extent permitted by the fund’s investment objective and investment policies. Interfund loans and borrowings normally extend overnight but can have a maximum duration of seven days. Loans may be called on one business day’s notice. The interest rate to be charged is governed by the conditions of the Order and internal procedures adopted by the board of trustees. The board of trustees is responsible for overseeing the Interfund Lending Program.
Total International Stock Index Fund
For the year ended October 31, 2024, the fund did not utilize the credit facilities or the Interfund Lending Program.
10. Other: Dividend income is recorded on the ex-dividend date. Non-cash dividends included in income, if any, are recorded at the fair value of the securities received. Interest income includes income distributions received from Vanguard Market Liquidity Fund and is accrued daily. Security transactions are accounted for on the date securities are bought or sold. Costs used to determine realized gains (losses) on the sale of investment securities are those of the specific securities sold.
Taxes on foreign dividends and capital gains have been provided for in accordance with the applicable countries’ tax rules and rates. Deferred foreign capital gains tax, if any, is accrued daily based upon net unrealized gains. The fund has filed tax reclaims for previously withheld taxes on dividends earned in certain European Union countries. These filings are subject to various administrative and judicial proceedings within these countries. Amounts related to these reclaims are recorded when there are no significant uncertainties as to the ultimate resolution of proceedings, the likelihood of receipt of these reclaims, and the potential timing of payment. Such tax reclaims and related professional fees, if any, are included in dividend income and other expenses, respectively.
Each class of shares has equal rights as to assets and earnings, except that each class separately bears certain class-specific expenses related to maintenance of shareholder accounts (included in Management and Administrative expenses), shareholder reporting, and proxy fees. Marketing and distribution expenses are allocated to each class of shares based on a method approved by the board of trustees. Income, other non-class-specific expenses, and gains and losses on investments are allocated to each class of shares based on its relative net assets.
B. In accordance with the terms of a Funds’ Service Agreement (the “FSA”) between Vanguard and the fund, Vanguard furnishes to the fund investment advisory, corporate management, administrative, marketing, and distribution services at Vanguard’s cost of operations (as defined by the FSA). These costs of operations are allocated to the fund based on methods and guidelines approved by the board of trustees and are generally settled twice a month.
Upon the request of Vanguard, the fund may invest up to 0.40% of its net assets as capital in Vanguard. At October 31, 2024, the fund had contributed to Vanguard capital in the amount of $12,598,000, representing less than 0.01% of the fund’s net assets and 5.04% of Vanguard’s capital received pursuant to the FSA. The fund’s trustees and officers are also directors and employees, respectively, of Vanguard.
C. The fund’s custodian bank has agreed to reduce its fees when the fund maintains cash on deposit in the non-interest-bearing custody account. For the year ended October 31, 2024, custodian fee offset arrangements reduced the fund’s expenses by $5,000 (an annual rate of less than 0.01% of average net assets).
D. Various inputs may be used to determine the value of the fund’s investments and derivatives. These inputs are summarized in three broad levels for financial statement purposes. The inputs or methodologies used to value securities are not necessarily an indication of the risk associated with investing in those securities.
Level 1—Quoted prices in active markets for identical securities.
Level 2—Other significant observable inputs (including quoted prices for similar securities, interest rates, prepayment speeds, credit risk, etc.).
Level 3—Significant unobservable inputs (including the fund’s own assumptions used to determine the fair value of investments). Any investments and derivatives valued with significant unobservable inputs are noted on the Schedule of Investments.
Total International Stock Index Fund
The following table summarizes the market value of the fund's investments and derivatives as of October 31, 2024, based on the inputs used to value them:
| | Level 1
($000) | Level 2
($000) | Level 3
($000) | Total
($000) |
| Investments | | | | |
| Assets | | | | |
| Common Stocks | 42,209,736 | 392,282,392 | 95,590 | 434,587,718 |
| Preferred Stocks | 1,481,428 | 1,307,966 | — | 2,789,394 |
| Rights | 801 | 182 | 12 | 995 |
| Warrants | 184 | 304 | 351 | 839 |
| Temporary Cash Investments | 7,854,840 | — | — | 7,854,840 |
| Total | 51,546,989 | 393,590,844 | 95,953 | 445,233,786 |
| | | | |
| Derivative Financial Instruments | | | | |
| Assets | | | | |
| Futures Contracts1 | 32,914 | — | — | 32,914 |
| Forward Currency Contracts | — | 48,658 | — | 48,658 |
| Swap Contracts | — | 7,237 | — | 7,237 |
| Total | 32,914 | 55,895 | — | 88,809 |
| Liabilities | | | | |
| Futures Contracts1 | (37,304) | — | — | (37,304) |
| Forward Currency Contracts | — | (62,200) | — | (62,200) |
| Swap Contracts | — | (23,477) | — | (23,477) |
| Total | (37,304) | (85,677) | — | (122,981) |
| 1 | Includes cumulative appreciation (depreciation) on futures contracts and centrally cleared swaps, if any, as reported in the Schedule of Investments. Only current day’s variation margin is reported within the Statement of Assets and Liabilities. |
E. At October 31, 2024, the fair values of derivatives were reflected in the Statement of Assets and Liabilities as follows:
| Statement of Assets and Liabilities | Equity
Contracts
($000) | Foreign
Exchange
Contracts
($000) | Total
($000) |
| Unrealized Appreciation—Futures Contracts1 | 32,914 | — | 32,914 |
| Unrealized Appreciation—Forward Currency Contracts | — | 48,658 | 48,658 |
| Unrealized Appreciation—Over-the-Counter Swap Contracts | 7,237 | — | 7,237 |
| Total Assets | 40,151 | 48,658 | 88,809 |
| | | | |
| Unrealized Depreciation—Futures Contracts1 | (37,304) | — | (37,304) |
| Unrealized Depreciation—Forward Currency Contracts | — | (62,200) | (62,200) |
| Unrealized Depreciation—Over-the-Counter Swap Contracts | (23,477) | — | (23,477) |
| Total Liabilities | (60,781) | (62,200) | (122,981) |
| 1 | Includes cumulative appreciation (depreciation) on futures contracts and centrally cleared swaps, if any, as reported in the Schedule of Investments. Only current day’s variation margin is reported within the Statement of Assets and Liabilities. |
Realized net gain (loss) and the change in unrealized appreciation (depreciation) on derivatives for the year ended October 31, 2024, were:
| Realized Net Gain (Loss) on Derivatives | Equity
Contracts
($000) | Foreign
Exchange
Contracts
($000) | Total
($000) |
| Futures Contracts | 536,247 | — | 536,247 |
| Swap Contracts | 74,497 | — | 74,497 |
| Forward Currency Contracts | — | 49,555 | 49,555 |
| Realized Net Gain (Loss) on Derivatives | 610,744 | 49,555 | 660,299 |
| |
| Change in Unrealized Appreciation (Depreciation) on Derivatives | | | |
| Futures Contracts | 170,928 | — | 170,928 |
| Swap Contracts | 3,220 | — | 3,220 |
| Forward Currency Contracts | — | 31,429 | 31,429 |
| Change in Unrealized Appreciation (Depreciation) on Derivatives | 174,148 | 31,429 | 205,577 |
Total International Stock Index Fund
F. Permanent differences between book-basis and tax-basis components of net assets are reclassified among capital accounts in the financial statements to reflect their tax character. These reclassifications have no effect on net assets or net asset value per share. As of period end, permanent differences primarily attributable to the accounting for in-kind redemptions, foreign currency transactions, passive foreign investment companies, swap agreements, and tax expense on capital gains were reclassified between the following accounts:
| | Amount
($000) |
| Paid-in Capital | 1,616,363 |
| Total Distributable Earnings (Loss) | (1,616,363) |
Temporary differences between book-basis and tax-basis components of total distributable earnings (loss) arise when certain items of income, gain, or loss are recognized in different periods for financial statement and tax purposes; these differences will reverse at some time in the future. The differences are primarily related to capital loss carryforwards; the deferral of losses from wash sales; the recognition of unrealized gains or losses from certain derivative contracts; the recognition of unrealized gains from passive foreign investment companies; and the classification of securities for tax purposes. As of period end, the tax-basis components of total distributable earnings (loss) are detailed in the table as follows:
| | Amount
($000) |
| Undistributed Ordinary Income | 5,750,454 |
| Undistributed Long-Term Gains | — |
| Net Unrealized Gains (Losses) | 79,462,920 |
| Capital Loss Carryforwards | (32,549,128) |
| Qualified Late-Year Losses | — |
| Other Temporary Differences | 148,999 |
| Total | 52,813,245 |
The tax character of distributions paid was as follows:
| | Year Ended October 31, |
| | 2024
Amount
($000) | 2023
Amount
($000) |
| Ordinary Income* | 12,562,627 | 10,963,034 |
| Long-Term Capital Gains | — | — |
| Total | 12,562,627 | 10,963,034 |
| * | Includes short-term capital gains, if any. |
As of October 31, 2024, gross unrealized appreciation and depreciation for investments and derivatives based on cost for U.S. federal income tax purposes were as follows:
| | Amount
($000) |
| Tax Cost | 363,762,968 |
| Gross Unrealized Appreciation | 135,004,340 |
| Gross Unrealized Depreciation | (53,502,080) |
| Net Unrealized Appreciation (Depreciation) | 81,502,260 |
G. During the year ended October 31, 2024, the fund purchased $27,544,511,000 of investment securities and sold $14,234,728,000 of investment securities, other than temporary cash investments. In addition, the fund purchased and sold investment securities of $5,432,563,000 and $3,694,931,000, respectively, in connection with in-kind purchases and redemptions of the fund’s capital shares.
H. Capital share transactions for each class of shares were:
| | Year Ended October 31, |
| | 2024 | | 2023 |
| | Amount
($000) | Shares
(000) | | Amount
($000) | Shares
(000) |
| Investor Shares | | | | | |
| Issued | 14,270,647 | 752,214 | | 12,760,713 | 730,511 |
| Issued in Lieu of Cash Distributions | 5,687,946 | 301,828 | | 4,978,504 | 286,145 |
| Redeemed | (11,852,364) | (614,635) | | (16,270,232) | (935,786) |
| Net Increase (Decrease)—Investor Shares | 8,106,229 | 439,407 | | 1,468,985 | 80,870 |
Total International Stock Index Fund
| | Year Ended October 31, |
| | 2024 | | 2023 |
| | Amount
($000) | Shares
(000) | | Amount
($000) | Shares
(000) |
| ETF Shares | | | | | |
| Issued | 11,087,380 | 185,382 | | 6,753,255 | 124,195 |
| Issued in Lieu of Cash Distributions | — | — | | — | — |
| Redeemed | — | — | | (56,030) | (1,000) |
| Net Increase (Decrease)—ETF Shares | 11,087,380 | 185,382 | | 6,697,225 | 123,195 |
| Admiral Shares | | | | | |
| Issued | 8,606,353 | 269,615 | | 8,495,565 | 290,895 |
| Issued in Lieu of Cash Distributions | 1,878,818 | 59,644 | | 1,735,932 | 59,657 |
| Redeemed | (12,001,302) | (375,069) | | (10,606,140) | (363,701) |
| Net Increase (Decrease)—Admiral Shares | (1,516,131) | (45,810) | | (374,643) | (13,149) |
| Institutional Shares | | | | | |
| Issued | 7,408,994 | 57,989 | | 5,992,813 | 51,295 |
| Issued in Lieu of Cash Distributions | 1,125,597 | 8,931 | | 1,029,424 | 8,847 |
| Redeemed | (8,788,479) | (68,472) | | (7,357,267) | (62,968) |
| Net Increase (Decrease)—Institutional Shares | (253,888) | (1,552) | | (335,030) | (2,826) |
| Institutional Plus Shares | | | | | |
| Issued | 4,160,067 | 32,769 | | 3,910,173 | 33,454 |
| Issued in Lieu of Cash Distributions | 945,874 | 7,512 | | 857,516 | 7,364 |
| Redeemed | (9,693,944) | (73,957) | | (5,094,502) | (44,097) |
| Net Increase (Decrease)—Institutional Plus Shares | (4,588,003) | (33,676) | | (326,813) | (3,279) |
| Institutional Select Shares | | | | | |
| Issued | 4,507,999 | 33,174 | | 4,362,115 | 33,587 |
| Issued in Lieu of Cash Distributions | 372,948 | 2,794 | | 285,539 | 2,328 |
| Redeemed | (1,239,452) | (8,937) | | (4,584,841) | (35,516) |
| Net Increase (Decrease)—Institutional Select Shares | 3,641,495 | 27,031 | | 62,813 | 399 |
I. Transactions during the period in investments where the issuer is another member of The Vanguard Group were as follows:
| | | Current Period Transactions | |
| | Oct. 31, 2023
Market Value
($000) | Purchases
at Cost
($000) | Proceeds
from
Securities
Sold
($000) | Realized
Net Gain
(Loss)
($000) | Change in
Unrealized
App. (Dep.)
($000) | Income
($000) | Capital Gain
Distributions
Received
($000) | Oct. 31, 2024
Market Value
($000) |
| Vanguard FTSE Emerging Markets ETF | 597,074 | — | 121,721 | (11,710) | 129,533 | 15,389 | — | 593,176 |
| Vanguard Market Liquidity Fund | 7,823,775 | NA1 | NA1 | 599 | (1,366) | 178,126 | 24 | 7,854,840 |
| Total | 8,420,849 | — | 121,721 | (11,111) | 128,167 | 193,515 | 24 | 8,448,016 |
| 1 | Not applicable—purchases and sales are for temporary cash investment purposes. |
J. Significant market disruptions, such as those caused by pandemics, natural or environmental disasters, war, acts of terrorism, or other events, can adversely affect local and global markets and normal market operations. Any such disruptions could have an adverse impact on the value of the fund’s investments and fund performance.
To the extent the fund’s investment portfolio reflects concentration in a particular market, industry, sector, country or asset class, the fund may be adversely affected by the performance of these concentrations and may be subject to increased price volatility and other risks.
The use of derivatives may expose the fund to various risks. Derivatives can be highly volatile, and any initial investment is generally small relative to the notional amount so that transactions may be leveraged in terms of market exposure. A relatively small market movement may have a potentially larger impact on derivatives than on standard securities. Leveraged derivatives positions can, therefore, increase volatility. Additional information regarding the fund’s use of derivative(s) and the specific risks associated is described under significant accounting policies.
K. Management has determined that no events or transactions occurred subsequent to October 31, 2024, that would require recognition or disclosure in these financial statements.
Report of Independent Registered
Public Accounting Firm
To the Board of Trustees of Vanguard STAR Funds and Shareholders of Vanguard Total International Stock Index Fund
Opinion on the Financial Statements
We have audited the accompanying statement of assets and liabilities, including the schedule of investments, of Vanguard Total International Stock Index Fund (one of the funds constituting Vanguard STAR Funds, referred to hereafter as the "Fund") as of October 31, 2024, the related statement of operations for the year ended October 31, 2024, the statement of changes in net assets for each of the two years in the period ended October 31, 2024, including the related notes, and the financial highlights for each of the five years in the period ended October 31, 2024 (collectively referred to as the "financial statements"). In our opinion, the financial statements present fairly, in all material respects, the financial position of the Fund as of October 31, 2024, the results of its operations for the year then ended, the changes in its net assets for each of the two years in the period ended October 31, 2024 and the financial highlights for each of the five years in the period ended October 31, 2024 in conformity with accounting principles generally accepted in the United States of America.
Basis for Opinion
These financial statements are the responsibility of the Fund’s management. Our responsibility is to express an opinion on the Fund’s financial statements based on our audits. We are a public accounting firm registered with the Public Company Accounting Oversight Board (United States) (PCAOB) and are required to be independent with respect to the Fund in accordance with the U.S. federal securities laws and the applicable rules and regulations of the Securities and Exchange Commission and the PCAOB.
We conducted our audits of these financial statements in accordance with the standards of the PCAOB. Those standards require that we plan and perform the audit to obtain reasonable assurance about whether the financial statements are free of material misstatement, whether due to error or fraud.
Our audits included performing procedures to assess the risks of material misstatement of the financial statements, whether due to error or fraud, and performing procedures that respond to those risks. Such procedures included examining, on a test basis, evidence regarding the amounts and disclosures in the financial statements. Our audits also included evaluating the accounting principles used and significant estimates made by management, as well as evaluating the overall presentation of the financial statements. Our procedures included confirmation of securities owned as of October 31, 2024 by correspondence with the custodian, transfer agent and brokers; when replies were not received from brokers, we performed other auditing procedures. We believe that our audits provide a reasonable basis for our opinion.
/s/PricewaterhouseCoopers LLP
Philadelphia, Pennsylvania
December 20, 2024
We have served as the auditor of one or more investment companies in The Vanguard Group of Funds since 1975.
Tax information (unaudited)
The fund hereby designates $7,924,441,000, or if subsequently determined to be different, the maximum amount allowable by law, as qualified dividend income for purposes of the maximum rate under section 1(h)(11) for calendar year 2023. Shareholders will be notified in January 2025 via IRS Form 1099 of the amounts for use in preparing their 2024 income tax return.
The fund hereby designates for the fiscal year $69,164,000, or if subsequently determined to be different, the maximum amount allowable by law, of interest earned from obligations of the U.S. government which is generally exempt from state income tax.
The fund designates to shareholders foreign source income of $13,166,092,000 and foreign taxes paid of $1,001,640,000, or if subsequently determined to be different, the maximum amounts allowable by law. Form 1099-DIV reports calendar-year amounts that can be included on the income tax return of shareholders.
Q1130 122024
Item 8: Changes in and Disagreements with Accountants for Open-End Management Investment Companies.
Not applicable.
Item 9: Proxy Disclosures for Open-End Management Investment Companies.
Not applicable.
Item 10: Remuneration Paid to Directors, Officers, and Others of Open-End Management Investment Companies.
Not applicable. The Trustees’ Fees and Expenses for the Total International Stock Index Fund are included in the financial statements filed under Item 7 of this Form, and those of the STAR Fund and the LifeStrategy Funds are borne by the underlying Vanguard funds in which the funds of the Registrant invest.
Item 11: Statement Regarding Basis for Approval of Investment Advisory Contracts.
Not applicable.
Item 12: Disclosure of Proxy Voting Policies and Procedures for Closed-End Management Investment Companies.
Not applicable.
Item 13: Portfolio Managers of Closed-End Management Investment Companies.
Not applicable.
Item 14: Purchase of Equity Securities by Closed-End Management Investment Company and Affiliated Purchasers.
Not applicable.
Item 15: Submission of Matters to a Vote of Security Holders.
Not applicable.
Item 16: Controls and Procedures.
(a) Disclosure Controls and Procedures. The Principal Executive and Financial Officers concluded that the Registrant’s disclosure controls and procedures are effective based on their evaluation of the disclosure controls and procedures as of a date within 90 days of the filing date of this report.
(b) Internal Control Over Financial Reporting. In February 2024, a third-party service provider began performing security pricing services for the Registrant. There were no other changes in the Registrant’s internal control over financial reporting or in other factors that could significantly affect this control during the period covered by this report, including any corrective actions with regard to significant deficiencies and material weaknesses.
Item 17: Disclosure of Securities Lending Activities for Closed-End Management Investment Companies.
Not applicable.
Item 18: Recovery of Erroneously Awarded Compensation.
Not applicable.
Item 19: Exhibits.
Pursuant to the requirements of the Securities Exchange Act of 1934 and the Investment Company Act of 1940, the registrant has duly caused this report to be signed on its behalf by the undersigned, thereunto duly authorized.
| | VANGUARD STAR FUNDS | |
| | | |
| BY: | /s/ SALIM RAMJI* | |
| | SALIM RAMJI | |
| | CHIEF EXECUTIVE OFFICER | |
Date: December 23, 2024
Pursuant to the requirements of the Securities Exchange Act of 1934 and the Investment Company Act of 1940, this report has been signed below by the following persons on behalf of the registrant and in the capacities and on the dates indicated.
| | VANGUARD STAR FUNDS | |
| | | |
| BY: | /s/ SALIM RAMJI* | |
| | SALIM RAMJI | |
| | CHIEF EXECUTIVE OFFICER | |
| | | |
| Date: December 23, 2024 |
| | | |
| | VANGUARD STAR FUNDS | |
| | | |
| BY: | /s/ CHRISTINE BUCHANAN* | |
| | CHRISTINE BUCHANAN | |
| | CHIEF FINANCIAL OFFICER | |
Date: December 23, 2024
John E. Schadl, pursuant to a Power of Attorney filed on December 20, 2024 (see File Number 33-49023) and a Power of Attorney filed on July 25, 2024 (see File Number 33-48863), each Incorporated by Reference.