 Follow-on Offering of Common Shares $27,000,000 June 2010 NASDAQ: CCNE Filed pursuant to Rule 433 Registration Statement No. 333-166111 June 9, 2010 |
 Registration Statement and Prospectus The issuer has filed a registration statement (including a prospectus) with the SEC for the offering to which this communication relates. Before you invest, you should read the prospectus in that registration statement and other documents the issuer has filed with the SEC for more complete information about the issuer and this offering. You may obtain these documents for free by visiting EDGAR on the SEC Web site at www.sec.gov. Alternatively, the issuer, the underwriters or any dealer participating in the offering will arrange to send you the prospectus if you request it by calling RBC Capital Markets at (212) 428-6670. 2 |
 Forward Looking Statements 3 This presentation, the prospectus supplement, the prospectus in the registration statement and the documents incorporated by reference therein contain forward-looking statements, within the meaning of Section 27A of the Securities Act of 1933, as amended, which we refer to as the Securities Act, and Section 21E of the Securities Exchange Act of 1934, as amended, which we refer to as the Exchange Act, with respect to the financial condition, liquidity, results of operations, future performance and business of CNB Financial Corporation. These forward-looking statements are intended to be covered by the safe harbor for “forward-looking statements” provided by the Private Securities Litigation Reform Act of 1995. Forward-looking statements are those that are not historical facts. These forward-looking statements include statements with respect to our beliefs, plans, objectives, goals, expectations, anticipations, estimates and intentions that are subject to significant risks and uncertainties and are subject to change based on various factors (some of which are beyond our control). The words “may,” “could,” “should,” “would,” “believe,” “anticipate,” “estimate,” “expect,” “intend,” “plan” and similar expressions are intended to identify forward-looking statements. While we believe our plans, objectives, goals, expectations, anticipations, estimates and intentions as reflected in these forward-looking statements are reasonable, we can give no assurance that any of them will be achieved. You should understand that various factors, in addition to those discussed elsewhere in this presentation, the prospectus supplement, the prospectus in the registration statement and the documents incorporated by reference in this presentation, the prospectus supplement and the prospectus in the registration statement, could affect our future results and could cause results to differ materially from those expressed in these forward-looking statements, including: • changes in general business, industry or economic conditions or competition; • changes in any applicable law, rule, regulation, policy, guideline or practice governing or affecting financial holding companies and their subsidiaries or with respect to tax or accounting principals or otherwise; • adverse changes or conditions in capital and financial markets; • changes in interest rates; • higher than expected costs or other difficulties related to integration of combined or merged businesses; • the inability to realize expected cost savings or achieve other anticipated benefits in connection with business combinations and other acquisitions; • changes in the quality or composition of our loan and investment portfolios; • adequacy of loan loss reserves; • increased competition; • loss of certain key officers; • continued relationships with major customers; • deposit attrition; • rapidly changing technology; • unanticipated regulatory or judicial proceedings and liabilities and other costs; • changes in the cost of funds, demand for loan products or demand for financial services; and • other economic, competitive, governmental or technological factors affecting our operations, markets, products, services and prices. Because such forward-looking statements are subject to risks and uncertainties, actual results may differ materially from those expressed or implied by such statements. The foregoing list of important factors is not exclusive and you are cautioned not to place undue reliance on these factors or any of our forward-looking statements, which speak only as of the date of this document or, in the case of documents incorporated by reference, the dates of those documents. We do not undertake to update any forward-looking statements, whether written or oral, that may be made from time to time by or on behalf of us except as required by applicable law. |
 Offering Summary Issuer: CNB Financial Corporation Offering: Follow-on common stock Gross Amount Offered: $27 million Over-Allotment Option: 15% ($4.1 million) Exchange / Symbol: NASDAQ / CCNE Market Capitalization (1) : $101 million (pre-offering) Current Quarterly Dividend: $0.165 per share (2) Dividend Yield (1) : 5.76% Use of Proceeds: General corporate purposes, which may include business expansion and regulatory capital to fund growth, among others Bookrunner: RBC Capital Markets Co-Manager: Boenning & Scattergood, Inc. (1) As of June 8, 2010. (2) Payable on June 15, 2010 to shareholders of record on June 1, 2010. 4 |
 Offering Highlights • Regional community bank with 26 branches and one loan production office in western central PA • Balance sheet growth opportunity through continued new hires and branch openings • Earnings growth through prudent deployment of deposits into attractive loan opportunities – Management expects increasing loan-to-deposit ratio as economy improves • Superior core deposit franchise • Diversified loan portfolio and strong credit quality • Experienced management team focused on shareholder value • Strong competitive dynamics in many of the counties in which we operate 5 |
 Experienced Management Team 6 6 Treasurer and Chief Financial Officer Charles R. Guarino 26 5 President of ERIEBANK David J. Zimmer 37 1 SVP of Operations Vincent C. Turiano 17 1 SVP of Wealth & Asset Management Services Todd M. Abrams 12 12 Secretary and VP/Administration Richard L. Greslick Jr. 37 12 EVP & Chief Lending Officer Richard L. Sloppy 25 19 EVP & Chief Credit Officer Mark D. Breakey 17 13 President & Chief Executive Officer Joseph B. Bower Jr. Industry CCNE Title Executive Years in Years at 6 |
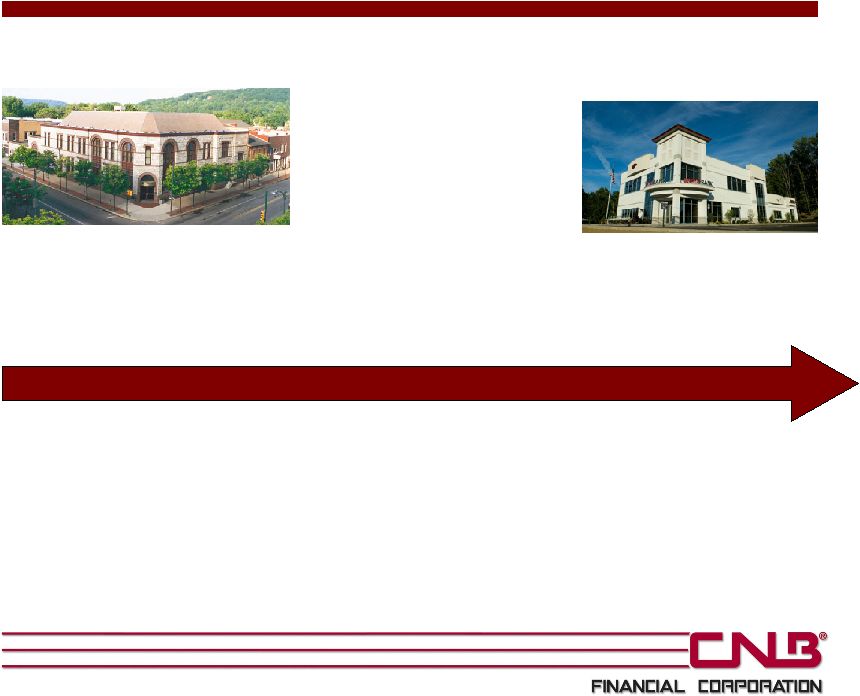 History of CNB Financial 7 1865 1934 1984 … 2005 2006 2008 2009 1865: County National Bank of Clearfield established 1934: Reorganizes through a stock offering to existing depositors 1984: Forms CNB Financial Corporation holding company 2005: ERIEBANK is formed 2005: Purchases assets of Holiday Consumer Discount Company and forms Holiday Financial Services Corporation 2006: Conversion to a state banking charter 2009: Forms Wealth & Asset Management Services Division 2010: Joseph Bower becomes CEO after retirement of William Falger 2008-2009: Receives approval to raise $21 million via TARP; CNB chooses not to participate |
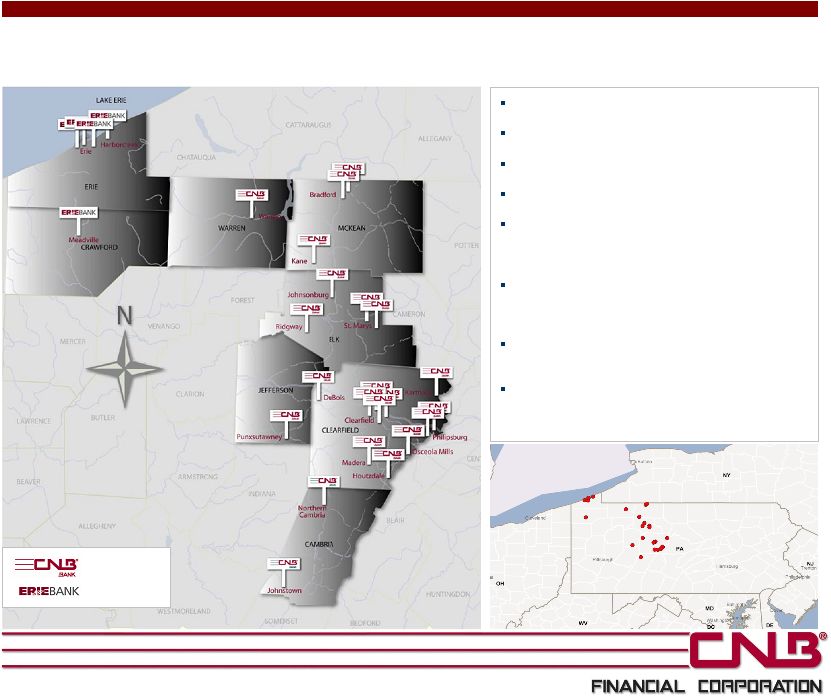 CNB Financial Overview Headquarters: Clearfield, PA Branches: 26 Assets: $1.2 billion Loans: $711 million Deposits: $1.0 billion Primary Subsidiaries CNB Bank: 21 full-service branches, 1 loan production office, telephone & internet banking, centralized customer service center ERIEBANK: Division of CNB Bank with five full- service branches, headquartered in Erie, PA Holiday Financial Services: Consumer loan company with eight offices 8 CNB Bank ERIEBANK As of March 31, 2010. |
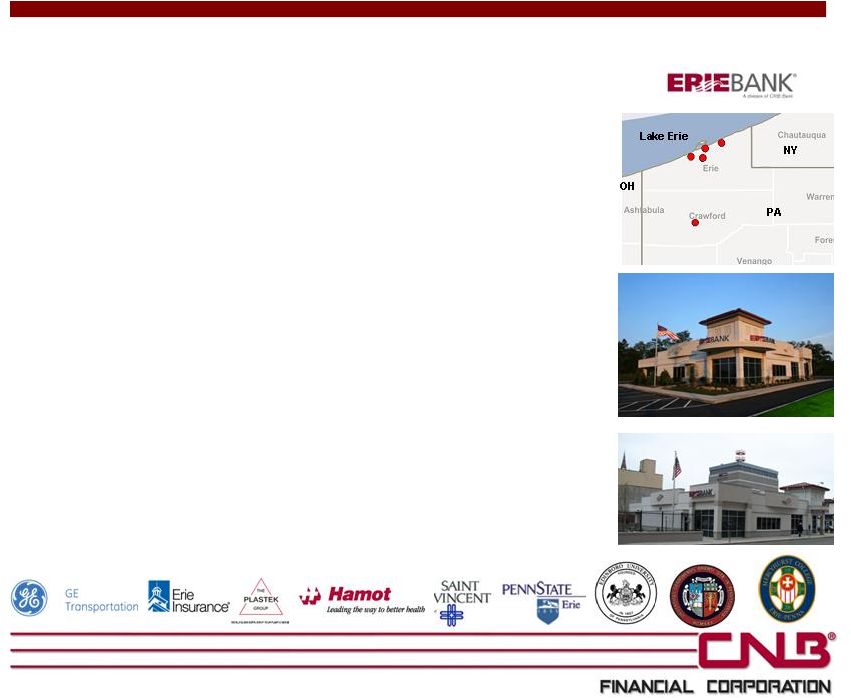 Expansion into Erie 9 • Created bank division with "blank sheet of paper" – Opportunity to build commercial based service model • Market not overbanked, yet dominated by larger players – PNC, Citizens – Opportunity magnified through NCC acquisition and entry of First Niagara – Smaller customers being neglected by larger institutions • Significantly greater population than our home markets – Erie is fourth largest city in Pennsylvania • Central location between Buffalo-Cleveland-Pittsburgh • Approximately 13,000 businesses in Erie county • Historically manufacturing economy making transition to service industries • Major employers: GE Transportation, Erie Insurance, Plastek Group, Hamot • Strong health care component • Four universities |
 Market Share & Demographics Source: Company data and SNL Financial. (1) Includes: PNC, Citizens (Royal Bank of Scotland), First Niagara, and Huntington. Source of Growth 10 Source of Growth As of 6/30/09 As of 3/31/10 County Number of CNB Branches CNB Deposits ($M) % of CNB Franchise (%) CNB Market Share (%) CNB Market Rank Total Deposits in Market ($M) Large Bank (1) Market Share (%) Population 2009 CNB Deposits ($M) Clearfield 10 $386 45.7 28.9 1 $1,338 6.5 83,103 $410 Erie 4 135 15.9 4.0 7 3,396 50.3 281,420 249 Elk 4 95 11.3 14.5 4 657 26.6 32,882 98 Mc Kean 3 71 8.4 10.1 3 698 9.7 43,781 73 Centre 1 58 6.9 2.7 10 2,138 27.4 146,233 61 Cambria 1 41 4.8 1.6 10 2,581 0.0 145,753 38 Jefferson 1 32 3.8 3.7 6 857 11.5 45,456 34 Warren 1 28 3.3 4.0 4 708 44.3 40,850 43 Crawford 1 0 0.0 0.0 8 1,088 41.8 89,901 27 Totals 26 $845 100.0 $13,462 909,379 $1,032 |
 Balance Sheet • Deposits of $1.0 billion, growth of 25% over March 31, 2009 – Transaction, money market and savings deposits equal 66% of total • Loans of $711 million, growth of 5% over March 31, 2009 Profitability • Net income for the quarter of $2.2 million, or $0.25 per share • Return on assets of 0.72% and return on equity of 12.0% for first quarter 2010 • Net interest margin of 3.57% for first quarter 2010 Asset Quality • Ratio of NPAs / Loans + OREO of 2.11% • Net charge-offs to average loans of 0.26% of average loans • Allowance for loan losses to loans of 1.39% Capital • Tangible common equity to tangible assets of 5.0% (1) • Leverage ratio of 7.1% • Tier 1 Risk Based Ratio of 10.8% • Total Risk Based Capital Ratio of 12.1% First Quarter 2010 Highlights 11 Financial data at or for the quarter ended March 31, 2010. (1) Please see the Appendix for a reconciliation of non-GAAP financial information. |
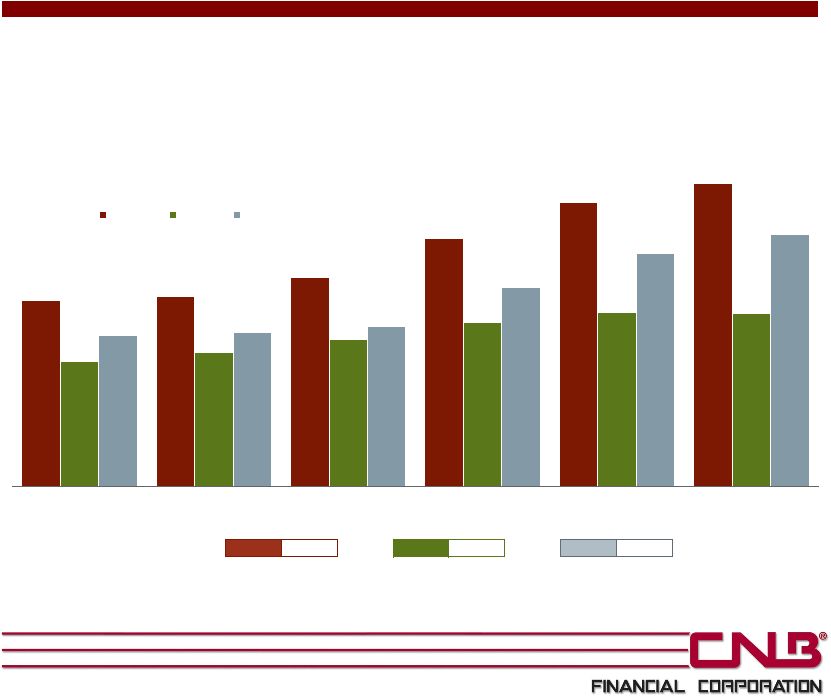 Track Record of Growth $ in millions * Compound annual growth rate from 2005-March 2010. 12 Average Annual Increase: * Assets 12% Loans 7% Deposits 13% $764 $781 $859 $1,017 $1,162 $1,240 $511 $547 $600 $672 $715 $711 $619 $631 $659 $815 $957 $1,032 2005 2006 2007 2008 2009 Mar 31, 2010 Assets Loans Deposits |
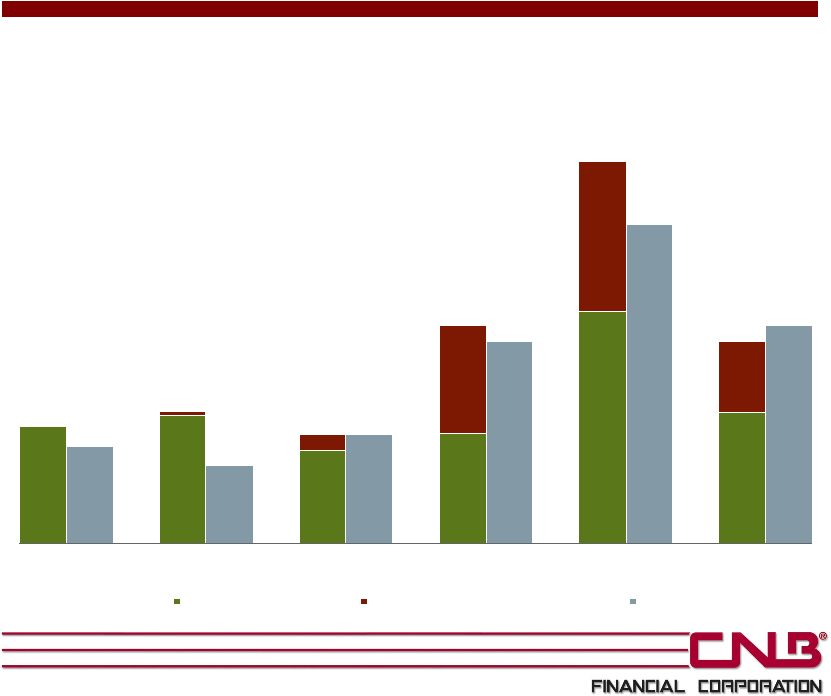
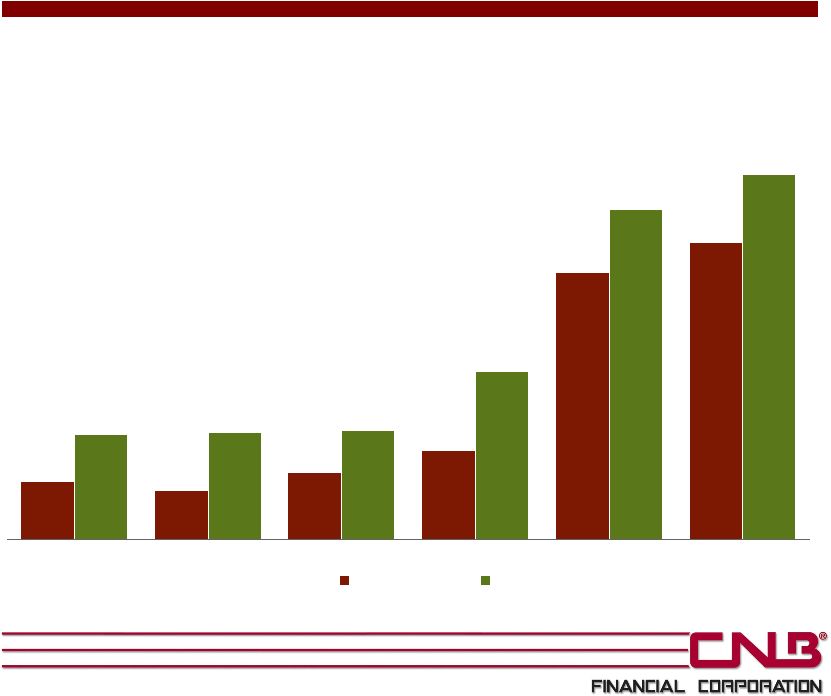
 Earnings Per Share & Dividends * Compound annual growth rate from 1999-2009. 13 Average Annual Increase: * EPS 7.0% Div. 7.5% $0.50 $0.59 $0.71 $0.95 $0.99 $0.86 $1.01 $1.08 $1.05 $0.61 $0.98 $0.26 $0.25 $0.32 $0.34 $0.37 $0.47 $0.47 $0.52 $0.55 $0.57 $0.62 $0.65 $0.66 $0.17 $0.17 1999 2000 2001 2002 2003 2004 2005 2006 2007 2008 2009 Q1 2009 Q1 2010 |
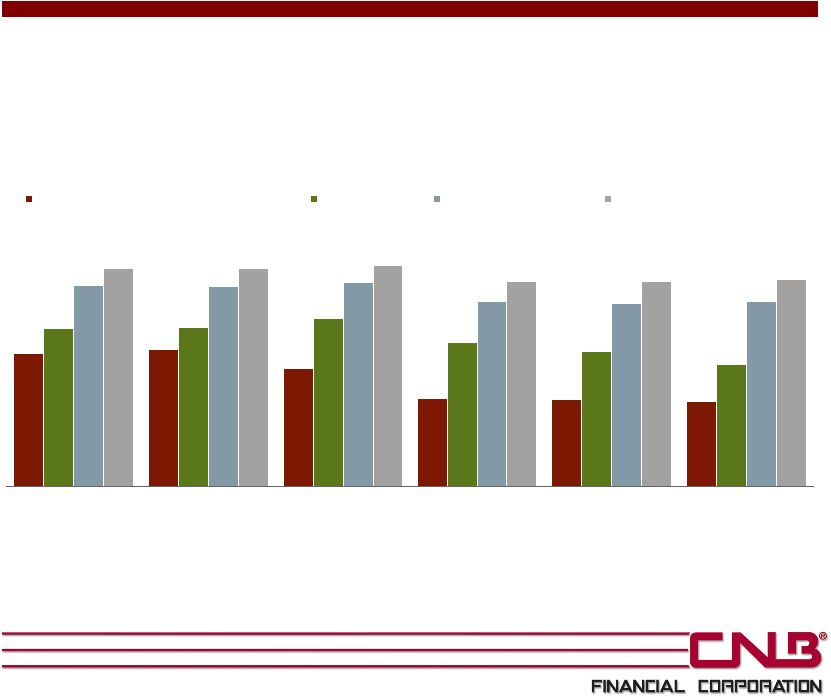 Capital Ratios Source: Company documents and SNL Financial. 14 7.8% 7.9% 6.9% 5.1% 5.1% 5.0% 9.2% 9.2% 9.7% 8.4% 7.9% 7.1% 11.7% 11.7% 11.9% 10.8% 10.7% 10.8% 12.8% 12.8% 12.9% 12.0% 12.0% 12.1% 2005 2006 2007 2008 2009 Mar 31, 2010 Tangible Common Equity to Tangible Assets Leverage Ratio Tier 1 Risk Based Ratio Total Risk Based Capital Ratio |
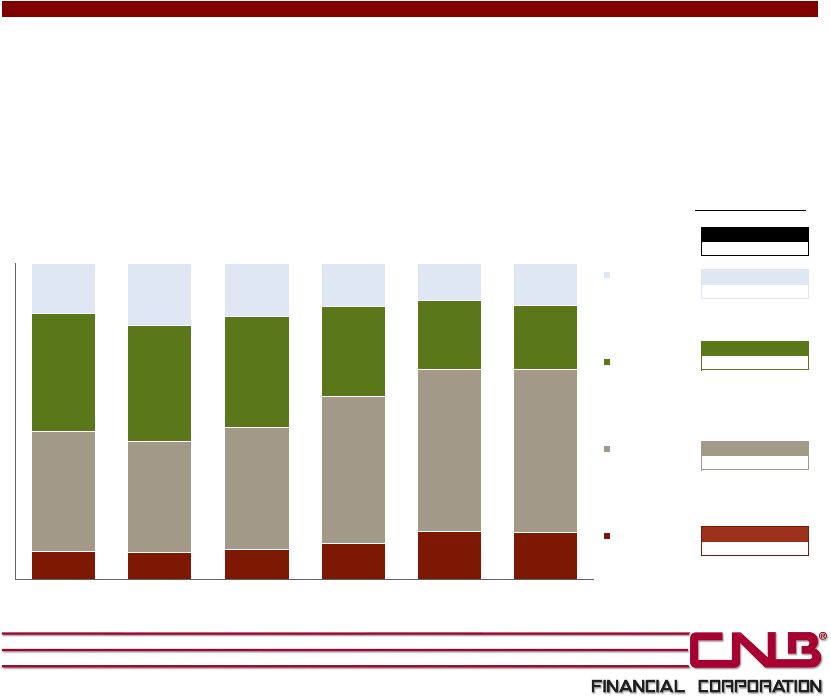 Deposit Composition 15 • 23% annual compound growth since 2005 in transaction, money market and savings accounts; 1% in CDs • Interest-bearing deposit cost of 1.56% (or total deposit cost of 1.38%) for the quarter ended March 31, 2010 Source: SNL Financial and Company documents. Deposit classifications based on regulatory data. * Compound annual growth rate from 2005-March 2010. Avg Annual Increase* Total Deposits 13% Jumbo CDs 8% Retail CDs -2% MMDA & Savings 21% Trans Accts 28% 9% 9% 9% 11% 15% 15% 38% 35% 39% 47% 51% 51% 37% 37% 35% 29% 22% 20% 16% 20% 17% 14% 12% 13% 0% 20% 40% 60% 80% 100% 2005 2006 2007 2008 2009 Mar 31, 2010 Jumbo CDs Retail CDs MMDA & Savings Trans Accts $619 $631 $659 $815 $957 $1,032 $ in millions |
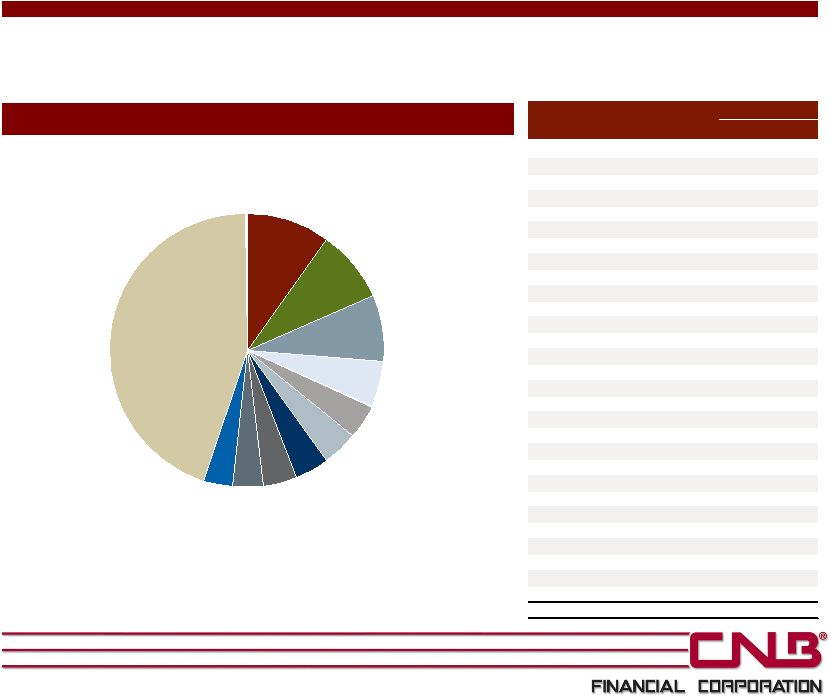
 Investment Portfolio Other U.S. Gov’t sponsored securities 35% U.S. Gov't sponsored mortgage & asset backed 39% Corporate notes & bonds 4% Other securities 0% Pooled trust preferred 1% U.S. Treasury 3% Pooled SBA 3% State & Municipal 15% 16 Amortized Cost: $394 million Fair Value: $390 million AA 4% BBB 2% BB 1% C 1% AAA 86% NR 5% A 1% Investments by Security Type Investments by S&P Rating As of March 31, 2010. Note: Investment portfolio excludes $1.0 million of trading equity securities resident at the holding company. |
 Conservative Lending Philosophy • Strong commercial lender with deep customer relationships – Seek to hire top lenders who are long-time residents in each region; understand customers better than competitors – Average lender has 20+ years of experience – In 20+ years, CNB has not lost a loan officer to a competing bank – Strong corporate culture based on decentralized decision making • Approximately 87% of loans in footprint (97% in state of PA) as of March 31, 2010 • Compete primarily with service and responsiveness, as opposed to price • Diversification of loan portfolio largely a function of markets in which we are located • No real estate bubble in western central PA – real estate values have generally remained stable • Conservative credit limits in place – Loans greater than $500 thousand require Loan Committee approval – Loans relationships greater than $1.5 million require full Board approval 17 |
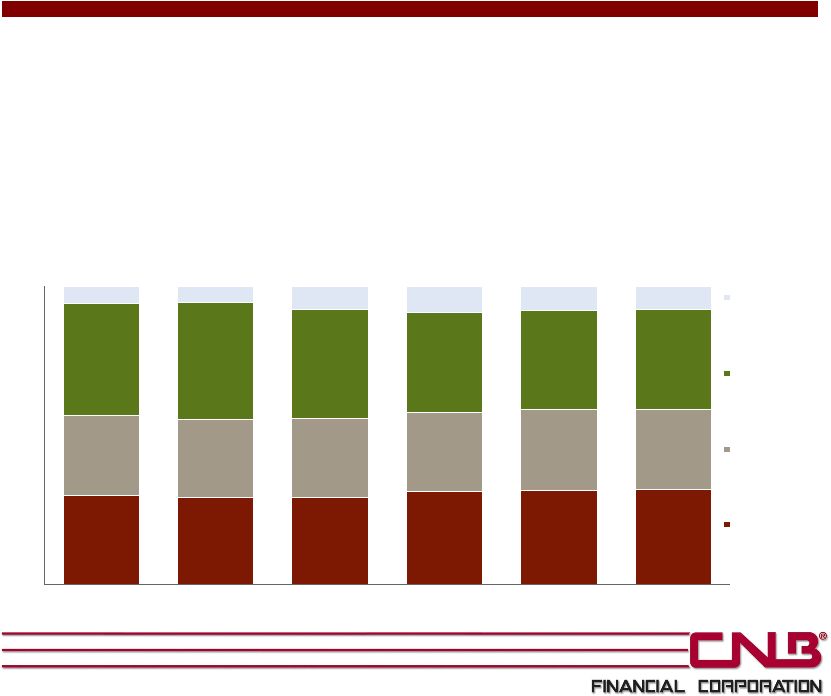 Loan Portfolio Overview 30% 29% 29% 31% 31% 32% 26% 26% 27% 27% 27% 27% 38% 39% 36% 34% 33% 34% 6% 5% 8% 9% 8% 8% 0% 20% 40% 60% 80% 100% 2005 2006 2007 2008 2009 Mar 31, 2010 Consumer and other Commercial, industrial, and agricultural Commercial mortgage Residential mortgage $511 $547 $600 $672 $715 $711 $ in millions 18 • C&I loans represent 34% of our loan portfolio vs. 12% for our peers (1) • Construction loans represent 2% vs. 7% for our peers (1)(2) • Commercial real estate loans represent 27% vs. 37% for our peers (1) • Loan yield of 6.46% for quarter ended March 31, 2010 vs. 5.68% for our peers (1) (1) Peers include banks with assets between $750 million to $2 billion with headquarters in PA, OH or Upstate NY. See Appendix for full list. Loan composition based on regulatory data. (2) Construction loans split between commercial mortgage and residential mortgage in the chart. |
 Loan Portfolio Overview Commercial & Industrial Breakdown by Industry (1) 19 Total C&I: $240 million % of Total Loans: 34% Note: As of 3/31/10. Loan classifications based on most recent 10-Q; total gross loans of $714 million. (1) Industry classifications based on NAICS codes. All Other Industries 46% Oil & Gas Wells & Drilling 10% Hospitals 8% Social Services 5% Trucking 4% Powdered Metals 4% Welding & Fabricating / Tool & Die 4% Restaurants/Fast Food 4% Schools/ Townships/ Boroughs 3% General Manufacturing 8% Building Supply & Hardware Stores 4% Total C&I Industry (1) $M % Oil & Gas Wells & Drilling $24.0 10.0% General Manufacturing 20.4 8.5% Hospitals 18.8 7.8% Social Services 12.7 5.3% Welding & Fabricating / Tool & Die 10.4 4.3% Restaurants/Fast Food 9.7 4.0% Building Supply & Hardware Stores 9.7 4.0% Powdered Metals 9.7 4.0% Trucking 8.8 3.7% Schools / Townships / Boroughs 8.0 3.3% Coal Mining 6.1 2.5% Airports 6.1 2.5% Sewer & Water / Excavators 6.0 2.5% Financial Institutions 5.5 2.3% Sand & Gravel 5.4 2.2% Construction Equipment / Contractors 4.6 1.9% Oil Distribution 3.9 1.6% Doctors 3.8 1.6% Auto Body / Auto Parts 3.0 1.2% New & Used Autos 2.9 1.2% Car Washes 2.6 1.1% Recycling 2.5 1.0% Saw mills / Timber 2.2 0.9% Hotels/Motels 2.1 0.9% Grocery / Convenience Stores 1.9 0.8% Insurance Agencies 1.6 0.7% Funeral Homes 1.0 0.4% Real Estate Developers 0.1 0.1% All Other Industries 47.0 19.6% Total $240.5 100.0% |
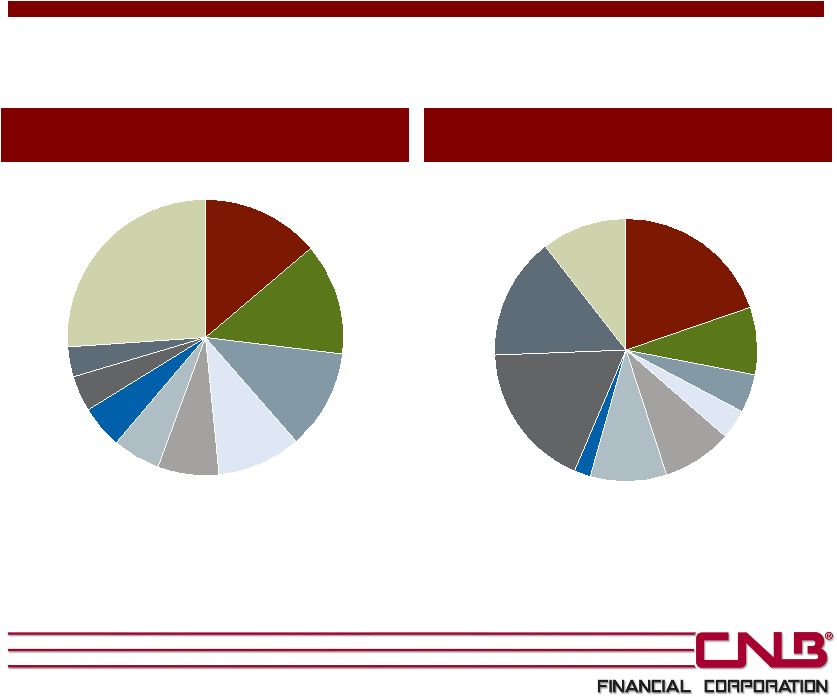 Loan Portfolio Overview Non-Owner Occupied Commercial Real Estate by Industry (1) Note: As of 3/31/10. Loan classifications based on most recent 10-Q; total gross loans of $714 million. (1) Industry classifications based on NAICS codes. Malls & Plazas 19% Industrial 4% Storage Units 2% Hotels/Motels 18% Real Estate Developers 15% 1-4 Family Rental 11% Other Commercial 9% Office 8% Multifamily 9% Retail 5% Social Services 14% Powdered Metals 10% Car Washes 7% Doctors 5% Trucking 4% Other Industries 25% Oil Distribution 4% Restaurants/ Fast Food 12% Welding & Fabricating / Tool & Die 6% General Manufacturing 13% Total Owner Occupied: $45 million % of Commercial Real Estate Loans: % of Total Loans: Owner Occupied Commercial Real Estate by Industry (1) Total Non-Owner Occupied: $148 million % of Commercial Real Estate Loans: % of Total Loans: 20 23% 6% 77% 21% |
 ($ in '000s) For the Year Ending For the Quarter Ending 12/31/05 12/31/06 12/31/07 12/31/08 03/31/09 06/30/09 09/30/09 12/31/09 03/31/10 Nonaccrual $1,561 $1,619 $1,979 $3,046 $3,445 $5,772 $13,447 $12,757 $12,841 90+ Days Past Due 462 128 395 533 732 762 710 584 1,727 Total Non-Performing Loans 2,023 1,747 2,374 3,579 4,177 6,534 14,157 13,341 14,568 Other Real Estate Owned 85 181 516 671 685 651 243 252 478 Total Non-Performing Assets 2,108 1,928 2,890 4,250 4,862 7,185 14,400 13,593 15,046 Non-Performing Loans / Loans 0.40% 0.32% 0.40% 0.53% 0.62% 0.97% 2.04% 1.87% 2.05% Non-Performing Assets / Loans + OREO 0.41% 0.35% 0.48% 0.63% 0.72% 1.06% 2.08% 1.90% 2.11% Loan Loss Reserves $5,603 $6,086 $6,773 $8,719 $9,024 $9,230 $9,465 $9,795 $9,914 Reserves / Loans 1.10% 1.11% 1.13% 1.30% 1.33% 1.37% 1.37% 1.37% 1.39% Reserves / Non-Performing Loans 277% 348% 285% 244% 216% 141% 67% 73% 68% Net Charge-Offs (NCOs) $765 $888 $825 $1,841 $557 $802 $859 $1,171 $466 NCOs / Average Loans 0.15% 0.17% 0.14% 0.28% 0.33% 0.47% 0.50% 0.66% 0.26% Asset Quality Summary 21 |
 NCOs / Average Loans 22 Source: Company documents and SNL Financial. (1) Peers include banks with assets between $750 million to $2 billion with headquarters in PA, OH or Upstate NY. See Appendix for full list. (1) Q1 2010 0.15% 0.16% 0.12% 0.14% 0.30% 0.17% 0.02% 0.14% 0.19% 0.09% 0.13% 0.10% 0.14% 0.26% 0.41% 0.28% 0.01% 2005 2006 2007 2008 2009 CCNE - CNB Bank CCNE - Holiday Financial Services Peers |
 NPAs / Loans + OREO 23 0.41% 0.35% 0.48% 0.63% 1.90% 2.11% 0.75% 0.77% 0.78% 1.20% 2.35% 2.60% 2005 2006 2007 2008 2009 Mar 31, 2010 CCNE Peers (1) Source: Company documents and SNL Financial. (1) Peers include banks with assets between $750 million to $2 billion with headquarters in PA, OH or Upstate NY. See Appendix for full list. |
 2010 Goals • Prudent loan deployment throughout our core counties • Continued expansion in Erie market – Growth primarily via market share capture • Continue build out of wealth management business • Assess next area of geographic expansion – Expand with people before locations – Expect not to expand to over-banked regions 24 |
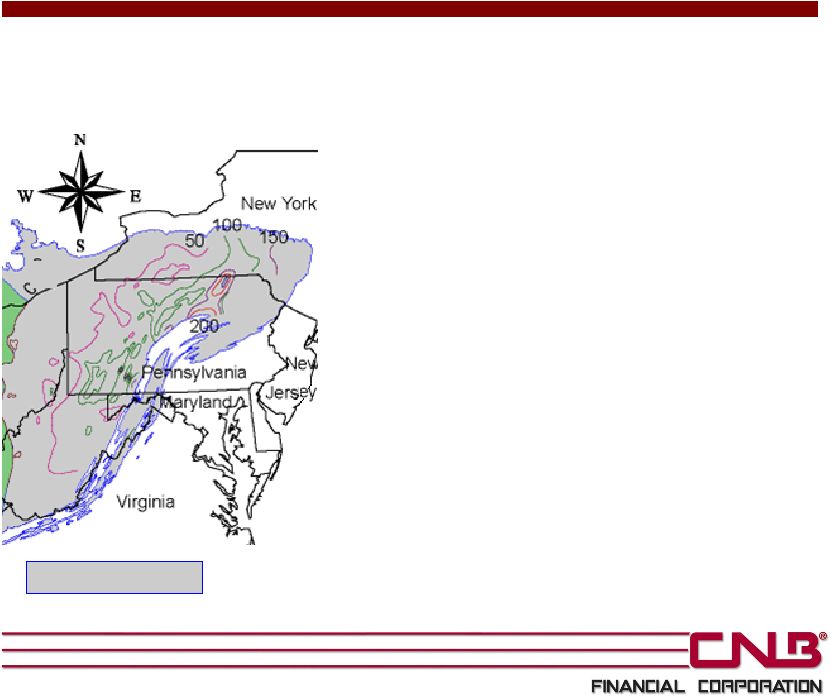 Marcellus Shale Natural Gas Marcellus Shale Formation • Natural gas development stimulates the economy – Natural gas ancillary businesses – Payments to land owners • Although in early stages, Marcellus gas producers spent $4.5 billion to develop shale gas reserves in 2009, up from $3.2 billion in 2008 – Estimated to have created 44,000 jobs state-wide – Employment opportunities could expand to 111,000 jobs by the end of 2011 • Companies plan to increase spending to $8.8 billion for 2010 and over $11 billion for 2011 • Projects are likely 2-4 years away from completion and management believes that these projects could represent an economic opportunity to western central PA 25 Source: Penn State, “The Economic Impacts of the Pennsylvania Marcellus Shale Natural Gas Play: An Update”, May 24, 2010. Note that Marcellus Shale estimates are not particular to the Company’s markets. Map Source: U.S. Geological Survey Open-File Report 2005-1268. |
 Investment Highlights • Strong deposit franchise – 25% deposit growth in last year (1) – 88% of deposits are core deposits (1) • Favorable competitive dynamics and growth prospects – Strong market position; larger regional banks have largely ignored western central PA – Local economies improving – Development of Marcellus Shale natural gas reserves could provide additional economic boost over the next decade • Diversified loan portfolio and strong asset quality • Experienced management team • Attractive dividend yield 26 (1) Deposit growth from March 31, 2009 to March 31, 2010; core deposits as of March 31, 2010 and exclude jumbo CDs. |
 APPENDIX |
 Summary Financial Highlights Source: Company documents and SNL Financial. 28 ($ in millions, except per share data) Quarter Ended 2005 2006 2007 2008 2009 03/31/2009 03/31/2010 BALANCE SHEET Assets $764 $781 $859 $1,017 $1,162 $1,027 $1,240 Loans $511 $547 $600 $672 $715 $677 $711 Deposits $619 $631 $659 $815 $957 $825 $1,032 Shareholders' Equity $70 $72 $69 $62 $69 $62 $72 PROFITABILITY Net Income $9.1 $9.6 $9.1 $5.2 $8.5 $2.2 $2.2 EPS $1.01 $1.08 $1.05 $0.61 $0.98 $0.26 $0.25 Return on Average Assets 1.23% 1.26% 1.12% 0.55% 0.79% 0.88% 0.72% Return on Average Equity 13.4% 13.5% 12.8% 7.9% 12.9% 14.2% 12.0% Net Interest Margin 3.97% 4.17% 4.27% 4.33% 4.00% 4.07% 3.57% Efficiency Ratio 57.3% 57.7% 61.8% 65.1% 59.9% 63.6% 65.9% Noninterest Expense/ Avg Assets 2.70% 2.87% 3.09% 3.03% 2.73% 2.88% 2.69% CAPITAL Tang. Common Equity / Tang. Assets 7.8% 7.9% 6.9% 5.1% 5.1% 5.1% 5.0% Leverage Ratio 9.2% 9.2% 9.7% 8.4% 7.9% 7.9% 7.1% Tier 1 Risk Based Ratio 11.7% 11.7% 11.9% 10.8% 10.7% 11.0% 10.8% Total Risk Based Capital Ratio 12.8% 12.8% 12.9% 12.0% 12.0% 12.3% 12.1% ASSET QUALITY NPAs/ Assets 0.28% 0.25% 0.34% 0.42% 1.17% 0.47% 1.21% NPAs/Loans+OREO 0.41% 0.35% 0.48% 0.63% 1.90% 0.72% 2.11% NCOs / Average Loans 0.15% 0.17% 0.14% 0.28% 0.49% 0.33% 0.26% Reserves/ Loans 1.10% 1.11% 1.13% 1.30% 1.37% 1.33% 1.39% |
 Peer Analysis Balance Sheet Profitability (MRQ) Asset Quality Valuation * Yields & Costs* Company Name State Ticker Assets ($M) Deposits ($M) Loans ($M) TCE / TA (%) Total RBC Ratio (%) ROAA (%) ROAE (%) NIM (%) Eff Ratio (%) Nonint Inc/ Rev (%) Texas Ratio (%) Res./ NPAs (%) NCOs/ Avg Loans (%) NPAs/ Assets (%) Market Cap ($M) Div. Yield (%) Loan Yield (%) Dep Cost (%) Arrow Financial Corp. NY AROW 1,861 1,470 1,121 7.0 15.4 1.17 15.0 3.81 55.7 20.4 3.5 381.2 0.07 0.20 269 4.1 5.92 1.15 Canandaigua National Corp. NY CNND 1,613 1,428 1,143 6.1 NA 0.89 12.5 4.17 60.5 30.7 24.8 52.2 0.75 1.65 142 3.4 5.62 0.92 Tower Bancorp PA TOBC 1,542 1,277 1,162 9.8 15.4 0.51 4.6 3.62 67.9 14.1 4.9 83.5 0.09 0.85 155 5.2 5.82 1.48 Alliance Financial Corp. NY ALNC 1,445 1,130 905 6.1 13.7 0.77 8.9 3.61 66.0 29.1 9.9 97.1 0.35 0.69 131 4.0 5.30 1.08 First National Community Bancorp PA FNCB 1,376 1,053 944 6.1 12.6 0.57 8.5 3.58 57.6 14.6 51.3 42.6 0.87 4.00 73 0.0 5.33 1.52 Citizens & Northern Corp. PA CZNC 1,347 952 720 8.8 18.4 1.34 11.5 3.79 55.2 22.3 7.0 80.3 0.03 0.72 140 3.1 6.50 1.36 VIST Financial Corp. PA VIST 1,339 1,062 905 4.5 12.1 0.21 2.3 3.40 71.2 32.0 39.6 40.8 0.56 2.78 44 2.7 5.57 1.72 Orrstown Financial Services PA ORRF 1,316 998 898 10.1 15.4 1.08 10.4 3.76 58.3 28.0 22.9 50.3 0.21 1.82 176 4.0 5.38 1.12 Royal Bancshares of Pennsylvania PA RBPAA 1,222 826 659 6.1 17.0 -0.20 -2.4 2.79 86.2 14.1 81.2 26.2 2.11 8.96 35 0.0 6.65 2.34 Bryn Mawr Bank Corp. PA BMTC 1,221 914 893 7.8 12.8 0.74 8.5 4.06 66.5 34.2 8.4 141.3 1.70 0.56 172 3.4 5.76 0.60 LNB Bancorp OH LNBB 1,159 979 793 5.1 13.8 0.46 5.1 3.69 69.1 20.4 44.1 43.2 0.86 3.83 36 0.8 5.41 1.22 First Citizens Banc Corp OH FCZA 1,106 882 784 4.5 14.3 0.01 0.2 3.95 69.3 18.3 49.3 36.6 1.20 3.79 36 0.0 5.64 0.92 Farmers National Banc Corp. OH FMNB 1,040 777 609 7.3 12.2 0.34 4.1 4.01 63.6 21.0 16.4 76.0 1.31 1.04 56 2.9 6.30 1.42 Chemung Financial Corp. NY CHMG 1,008 833 586 7.7 13.7 0.81 8.7 3.83 70.9 33.3 14.6 79.9 0.12 1.25 71 5.0 6.08 0.82 ACNB Corp. PA ACNB 979 734 658 8.3 13.4 1.00 10.8 3.97 64.1 24.9 22.6 66.0 0.04 1.98 83 5.4 5.40 0.91 Franklin Financial Services Corp. PA FRAF 974 727 750 7.2 11.1 0.81 9.9 3.46 63.9 24.1 24.9 48.1 0.11 2.00 71 5.9 5.18 1.29 Republic First Bancorp PA FRBK 968 846 679 6.7 11.9 -1.59 -22.4 3.38 87.0 5.4 60.5 28.7 2.70 4.94 22 0.0 5.19 1.20 AmeriServ Financial PA ASRV 961 802 712 7.7 15.5 -0.38 -3.4 3.78 85.9 28.5 17.7 105.9 0.68 2.12 37 0.0 5.36 1.49 Wilber Corp. NY GIW 938 787 577 7.5 13.3 0.76 9.6 3.90 71.9 14.4 19.9 56.8 0.38 1.66 64 4.0 5.71 1.13 Codorus Valley Bancorp PA CVLY 893 737 649 6.5 13.2 0.77 9.4 3.69 67.3 18.9 44.3 27.3 0.11 3.91 30 3.3 5.77 1.55 Penseco Financial Services Corp. PA PFNS 883 649 605 10.7 17.2 1.35 10.0 4.19 62.1 24.3 6.8 202.7 0.08 0.36 109 5.1 5.75 0.88 Farmers & Merchants Bancorp OH FMAO 871 683 556 10.3 14.7 0.58 5.4 3.59 65.9 17.3 16.4 38.8 0.16 1.81 92 3.7 6.03 1.44 Adirondack Trust Company NY ADKT 857 754 428 8.3 17.3 1.15 11.1 4.09 66.4 32.1 7.3 157.9 0.00 0.64 103 3.1 5.55 0.54 Camco Financial Corp. OH CAFI 851 649 700 7.2 11.1 0.06 0.9 3.25 86.1 21.6 93.3 29.5 0.72 8.27 21 0.0 5.65 1.80 Ohio Valley Banc Corp. OH OVBC 836 679 652 7.9 13.7 0.93 11.4 4.34 65.0 18.7 47.4 24.7 0.21 1.61 71 4.7 7.02 1.75 Bank of Utica NY BKUT 812 684 51 13.1 16.2 1.54 12.3 3.25 24.5 2.1 1.2 168.6 -0.12 0.17 60 3.3 5.44 1.70 First Keystone Corp. PA FKYS 789 605 405 7.3 11.9 1.11 11.3 3.56 57.1 16.0 7.1 122.3 0.19 0.55 86 5.8 5.93 1.66 QNB Corp. PA QNBC 771 662 456 7.6 11.5 0.97 13.1 3.64 55.2 14.2 7.8 91.7 0.50 0.90 62 4.8 5.84 1.52 High 1,861 1,470 1,162 13.1 18.4 1.54 15.0 4.34 87.0 34.2 93.3 381.2 2.70 8.96 269 5.9 7.02 2.34 Median 994 814 690 7.4 13.7 0.77 9.2 3.73 65.9 20.7 18.8 61.4 0.28 1.66 71 3.4 5.68 1.33 Low 771 605 51 4.5 11.1 -1.59 -22.4 2.79 24.5 2.1 1.2 24.7 -0.12 0.17 21 0.0 5.18 0.54 CNB Financial Corp. PA CCNE 1,240 1,032 711 5.0 12.1 0.72 12.0 3.57 65.9 20.2 20.5 65.9 0.26 1.21 101 5.8 6.46 1.38 29 Source: Company documents and SNL Financial. Financial Data as of 3/31/10 (or most recent quarter when 3/31/10 data unavailable). * As of 6/8/10. Note: Includes public commercial banks with assets between $750M and $2.0Bn headquartered in PA, OH and Upstate NY. |
 Stock Performance Dec-08 Feb-09 Apr-09 Jun-09 Aug-09 Oct-09 Dec-09 Feb-10 Apr-10 Jun-10 40% 60% 80% 100% 120% 140% 160% 180% CCNE S&P 500 NASDAQ Bank CCNE Peers CCNE 2.6% S&P 500 17.6% NASDAQ Bank (14.9%) CCNE Peers (13.8%) 06/29/09 - CCNE added to the Russell 3000 Index and Russell 2000 Index Note: As of 06/08/10. CCNE Peers include banks with assets between $750 million to $2 billion with headquarters in PA, OH or Upstate NY. See Appendix for full list. 30 |
 Non- GAAP Financial Reconciliation 31 Quarter Ended ($ in thousands) 2005 2006 2007 2008 2009 03/31/2009 03/31/2010 Total Shareholders' Equity $69,968 $72,279 $69,283 $62,467 $69,409 $62,462 $71,884 Less Goodwill 10,821 10,821 10,821 10,821 10,821 10,821 10,821 Less Other Intangible Assets 800 385 285 185 85 160 60 Tangible Common Equity $58,347 $61,073 $58,177 $51,461 $58,503 $51,481 $61,003 Total Assets $764,018 $780,850 $858,700 $1,016,518 $1,161,591 $1,027,241 $1,239,814 Less Goodwill 10,821 10,821 10,821 10,821 10,821 10,821 10,821 Less Other Intangible Assets 800 385 285 185 85 160 60 Tangible Assets $752,397 $769,644 $847,594 $1,005,512 $1,150,685 $1,016,260 $1,228,933 Total Shareholders' Equity / Total Assets 9.16% 9.26% 8.07% 6.15% 5.98% 6.08% 5.80% Tangible Common Equity / Tangible Assets 7.75% 7.94% 6.86% 5.12% 5.08% 5.07% 4.96% Tangible common equity to tangible assets is a non-GAAP financial measure calculated using GAAP amounts. Tangible common equity is calculated by excluding the balance of goodwill and other intangible assets from the calculation of stockholders’ equity. Tangible assets is calculated by excluding the balance of goodwill and other intangible assets from the calculation of total assets. CNB believes that this non-GAAP financial measure provides information to investors that is useful in understanding our financial condition. Because not all companies use the same calculation of tangible common equity and tangible assets, this presentation may not be comparable to other similarly titled measures calculated by other companies. A reconciliation of this non-GAAP financial measure is provided below. |
 Follow-on Offering of Common Shares $27,000,000 June 2010 NASDAQ: CCNE |