Exhibit 99.1

Financial Highlights As of and for the six months ended June 30, 2012
NASDAQ: CCNE
October 12, 2012
Forward-Looking Statements
This presentation includes forward-looking statements within the meaning of Section 27A of the Securities Act of 1933, as amended, and Section 21E of the Securities Exchange Act of 1934, as amended, with respect to the financial condition, liquidity, results of operations, future performance and business of CNB Financial Corporation. These forward-looking statements are intended to be covered by the safe harbor for “forward-looking statements” provided by the Private Securities Litigation Reform Act of 1995. Forward- looking statements are those that are not historical facts. Forward-looking statements include statements with respect to beliefs, plans, objectives, goals, expectations, anticipations, estimates and intentions that are subject to significant risks and uncertainties and are subject to change based on various factors (some of which are beyond our control). Forward-looking statements often include the words “believes,” “expects,” “anticipates,” “estimates,” “forecasts,” “intends,” “plans,” “targets,” “potentially,” “probably,” “projects,” “outlook” or similar expressions or future conditional verbs such as “may,” “will,” “should,” “would” and “could.” Such known and unknown risks, uncertainties and other factors that could cause the actual results to differ materially from the statements, include, but are not limited to: (i) changes in general business, industry or economic conditions or competition; (ii) changes in any applicable law, rule, regulation, policy, guideline or practice governing or affecting financial holding companies and their subsidiaries or with respect to tax or accounting principles or otherwise; (iii) adverse changes or conditions in capital and financial markets; (iv) changes in interest rates; (v) changes in the quality or composition of our loan and investment portfolios; (vi) adequacy of loan loss reserves; (vii) increased competition; (viii) loss of certain key officers; (ix) continued relationships with major customers; (x) deposit attrition; (xi) rapidly changing technology; (xii) unanticipated regulatory or judicial proceedings and liabilities and other costs; (xiii) changes in the cost of funds, demand for loan products or demand for financial services; and (xiv) other economic, competitive, governmental or technological factors affecting our operations, markets, products, services and prices. Such developments could have an adverse impact on our financial position and our results of operations.
The forward-looking statements are based upon management’s beliefs and assumptions. Any forward- looking statement made herein speaks only as of the date of this presentation. Factors or events that could cause our actual results to differ may emerge from time to time, and it is not possible for us to predict all of them. We undertake no obligation to publicly update any forward-looking statement, whether as a result of new information, future developments or otherwise, except as may be required by law.
2
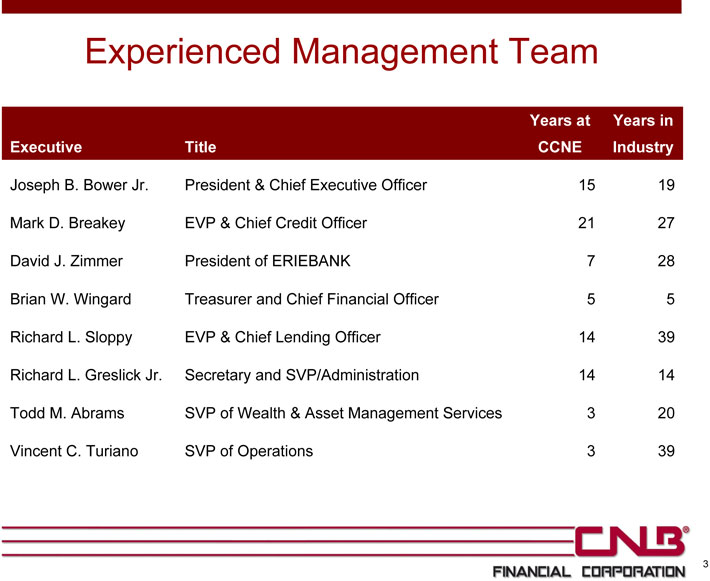
Experienced Management Team
Years at Years in
Executive Title CCNE Industry
Joseph B. Bower Jr. President & Chief Executive Officer 15 19
Mark D. Breakey EVP & Chief Credit Officer 21 27
David J. Zimmer President of ERIEBANK 7 28
Brian W. Wingard Treasurer and Chief Financial Officer 5 5
Richard L. Sloppy EVP & Chief Lending Officer 14 39
Richard L. Greslick Jr. Secretary and SVP/Administration 14 14
Todd M. Abrams SVP of Wealth & Asset Management Services 3 20
Vincent C. Turiano SVP of Operations 3 39
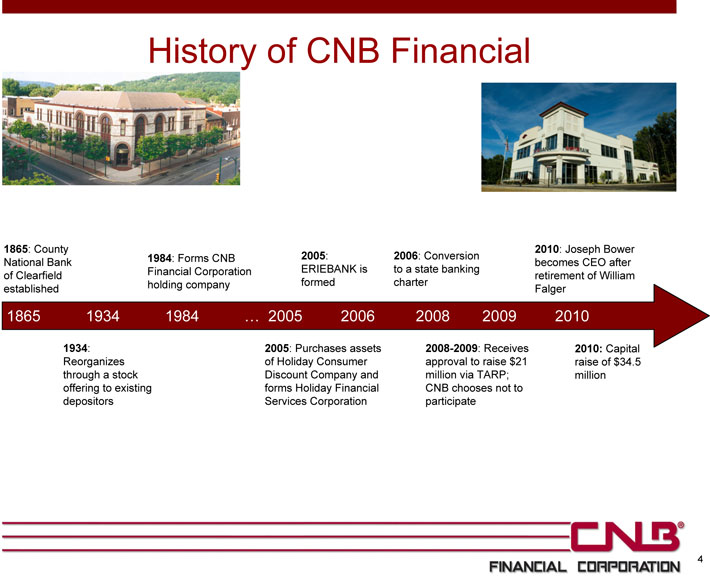
History of CNB Financial
1865: County 2010: Joseph Bower
National Bank 1984: Forms CNB 2005: 2006: Conversion becomes CEO after
of Clearfield Financial Corporation ERIEBANK is to a state banking retirement of William
established holding company formed charter Falger
1865 1934 1984 … 2005 2006 2008 2009 2010
1934: 2005: Purchases assets 2008-2009: Receives 2010: Capital
Reorganizes of Holiday Consumer approval to raise $21 raise of $34.5
through a stock Discount Company and million via TARP; million
offering to existing forms Holiday Financial CNB chooses not to
depositors Services Corporation participate
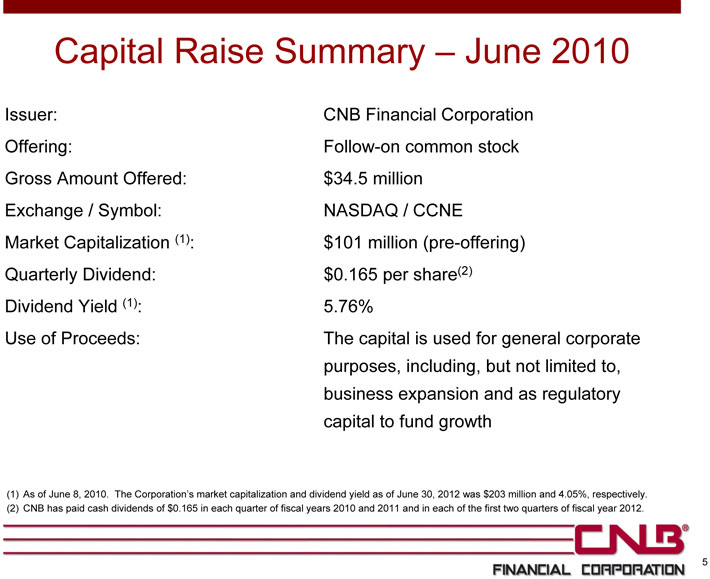
Capital Raise Summary – June 2010
Issuer: CNB Financial Corporation Offering: Follow-on common stock Gross Amount Offered: $34.5 million Exchange / Symbol: NASDAQ / CCNE
Market Capitalization (1): $101 million (pre-offering) Quarterly Dividend: $0.165 per share(2) Dividend Yield (1): 5.76%
Use of Proceeds: The capital is used for general corporate purposes, including, but not limited to, business expansion and as regulatory capital to fund growth
(1) As of June 8, 2010. The Corporation’s market capitalization and dividend yield as of June 30, 2012 was $203 million and 4.05%, respectively. (2) CNB has paid cash dividends of $0.165 in each quarter of fiscal years 2010 and 2011 and in each of the first two quarters of fiscal year 2012.
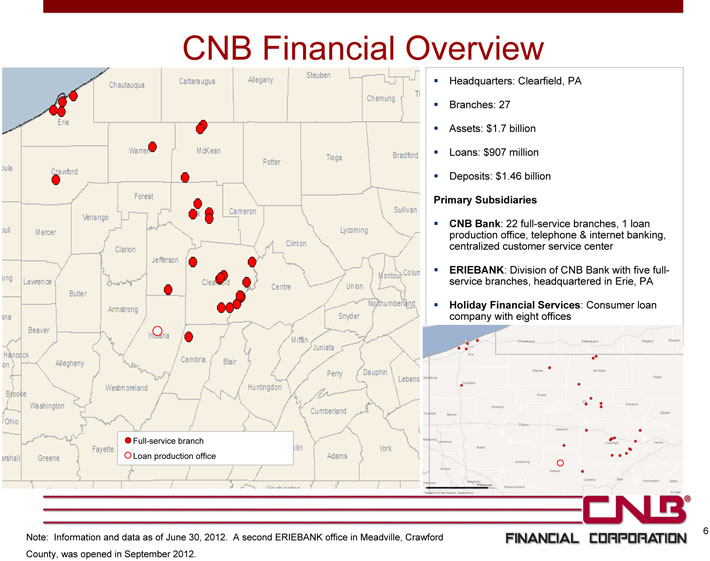
CNB Financial Overview
Headquarters: Clearfield, PA
Branches: 27
Assets: $1.7 billion
Loans: $907 million
Deposits: $1.46 billion
Primary Subsidiaries
CNB Bank: 22 full-service branches, 1 loan production office, telephone & internet banking, centralized customer service center
ERIEBANK: Division of CNB Bank with five full-service branches, headquartered in Erie, PA
Holiday Financial Services: Consumer loan company with eight offices
Full-service branch Loan production office
6 Note: Information and data as of June 30, 2012. A second ERIEBANK office in Meadville, Crawford County, was opened in September 2012.
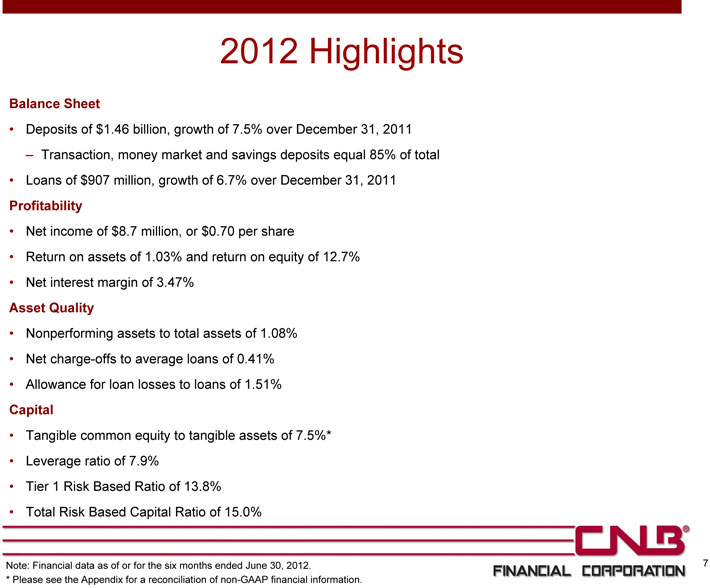
2012 Highlights
Balance Sheet
• Deposits of $1.46 billion, growth of 7.5% over December 31, 2011
– Transaction, money market and savings deposits equal 85% of total
• Loans of $907 million, growth of 6.7% over December 31, 2011
Profitability
• Net income of $8.7 million, or $0.70 per share
• Return on assets of 1.03% and return on equity of 12.7%
• Net interest margin of 3.47%
Asset Quality
• Nonperforming assets to total assets of 1.08%
• Net charge-offs to average loans of 0.41%
• Allowance for loan losses to loans of 1.51%
Capital
• Tangible common equity to tangible assets of 7.5%*
• Leverage ratio of 7.9%
• Tier 1 Risk Based Ratio of 13.8%
• Total Risk Based Capital Ratio of 15.0%
Note: Financial data as of or for the six months ended June 30, 2012. 7
* Please see the Appendix for a reconciliation of non-GAAP financial information.
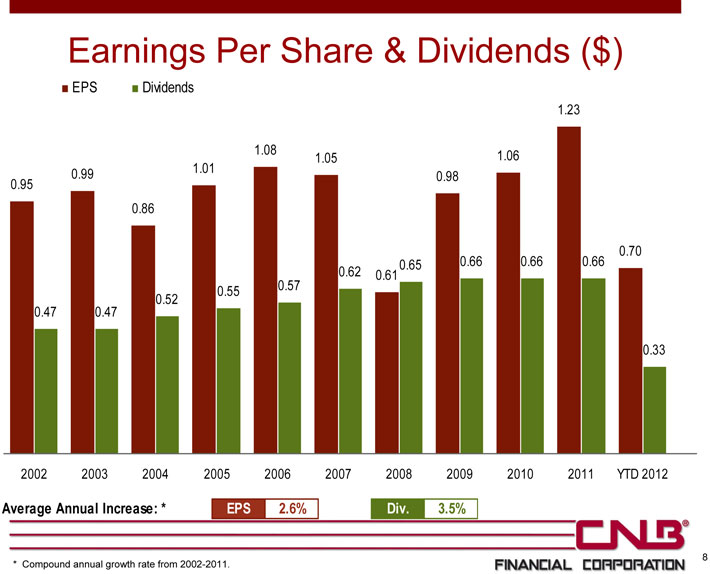
Earnings Per Share & Dividends ($)
EPS Dividends
1.23
1.08 1.06
1.05
0.99 1.01
0.98
0.95
0.86
0.70
0.65 0.66 0.66 0.66
0.62 0.61
0.55 0.57
0.47 0.47 0.52
0.33
2002 2003 2004 2005 2006 2007 2008 2009 2010 2011 YTD 2012
Average Annual Increase: * EPS 2.6% Div. 3.5%
8 * Compound annual growth rate from 2002-2011.
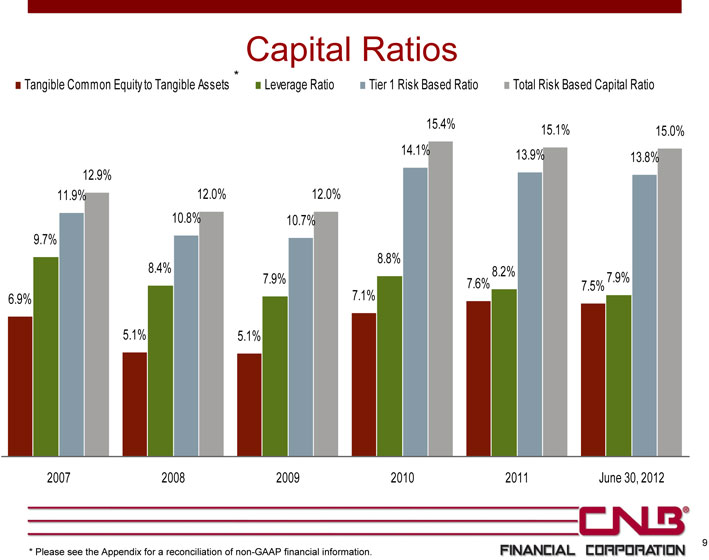
Capital Ratios
*
Tangible Common Equity to Tangible Assets Leverage Ratio Tier 1 Risk Based Ratio Total Risk Based Capital Ratio
15.4% 15.1%
15.0%
14.1% 13.9%
13.8%
12.9%
11.9% 12.0% 12.0%
10.8% 10.7%
9.7%
8.8%
8.4% 8.2%
7.9% 7.6% 7.9%
7.5%
6.9% 7.1%
5.1% 5.1%
2007 2008 2009 2010 2011 June 30, 2012
* Please see the Appendix for a reconciliation of non-GAAP financial information. 9
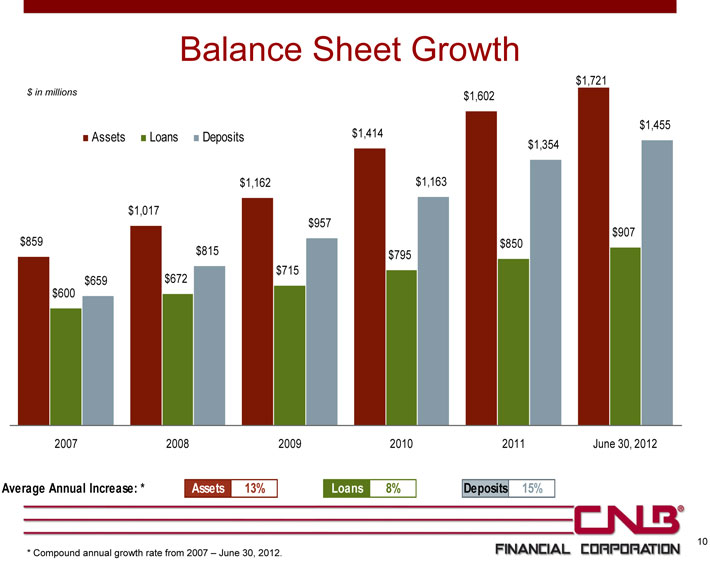
Balance Sheet Growth
$1,721 $ in millions $1,602
$1,455
Assets Loans Deposits $1,414 $1,354 $1,162 $1,163
$1,017 $957 $907 $859 $850 $815 $795 $715 $659 $672 $600
2007 2008 2009 2010 2011 June 30, 2012
Average Annual Increase: * Assets 13% Loans 8% Deposits 15%
10
* Compound annual growth rate from 2007 – June 30, 2012.
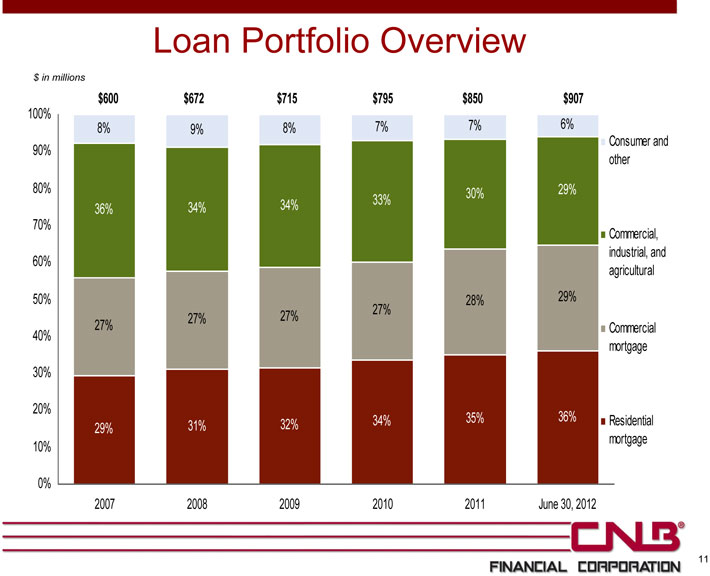
Loan Portfolio Overview
$ in millions $600 $672 $715 $795 $850 $907
100%
8% 9% 8% 7% 7% 6%
Consumer and 90% other 80% 30% 29% 34% 33% 36% 34% 70% Commercial, industrial, and 60% agricultural 50% 27% 28% 29% 27% 27% 27% Commercial 40% mortgage 30%
20%
34% 35% 36% Residential 29% 31% 32% mortgage 10%
0%
2007 2008 2009 2010 2011 June 30, 2012
11
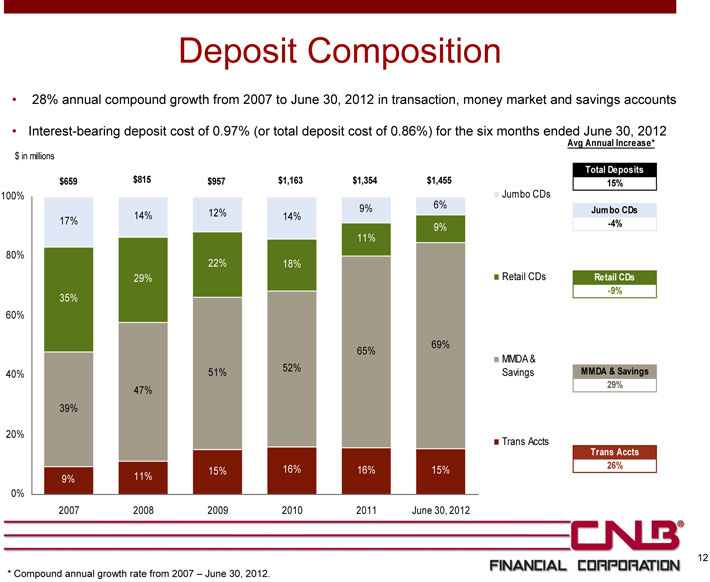
Deposit Composition
• 28% annual compound growth from 2007 to June 30, 2012 in transaction, money market and savings accounts
• Interest-bearing deposit cost of 0.97% (or total deposit cost of 0.86%) for the six months ended June 30, 2012
Avg Annual Increase* $ in millions
Total Deposits $659 $815 $957 $1,163 $1,354 $1,455 15%
100% Jumbo CDs
9% 6%
12% Jumbo CDs
14% 14%
17% -4% 9% 11% 80% 22% 18% 29% Retail CDs Retail CDs -9%
35% 60%
69% 65%
MMDA &
51% 52% Savings MMDA & Savings
40%
29%
47% 39%
20%
Trans Accts
Trans Accts
16% 16% 15% 26% 15%
9% 11% 0%
2007 2008 2009 2010 2011 June 30, 2012
12
* Compound annual growth rate from 2007 – June 30, 2012.
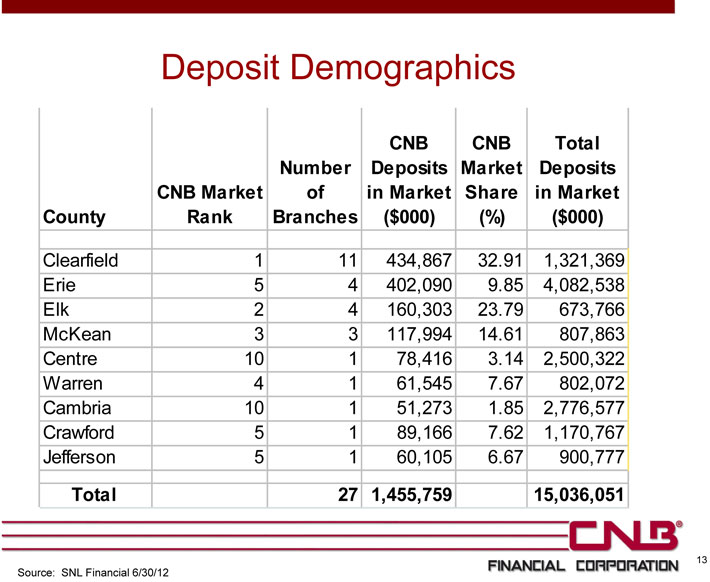
Deposit Demographics
CNB CNB Total Number Deposits Market Deposits CNB Market of in Market Share in Market County Rank Branches ($000) (%) ($000)
Clearfield 1 11 434,867 32.91 1,321,369 Erie 5 4 402,090 9.85 4,082,538 Elk 2 4 160,303 23.79 673,766 McKean 3 3 117,994 14.61 807,863 Centre 10 1 78,416 3.14 2,500,322 Warren 4 1 61,545 7.67 802,072 Cambria 10 1 51,273 1.85 2,776,577 Crawford 5 1 89,166 7.62 1,170,767 Jefferson 5 1 60,105 6.67 900,777
Total 27 1,455,759 15,036,051
13
Source: SNL Financial 6/30/12
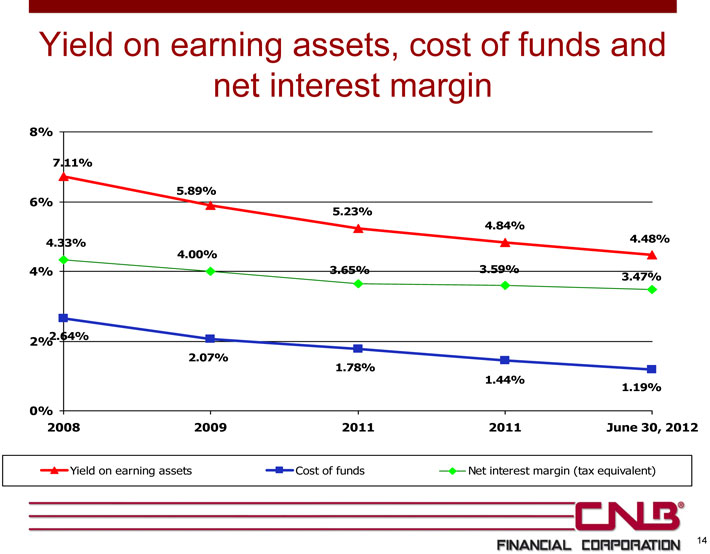
Yield on earning assets, cost of funds and net interest margin
8%
7.11%
6% 5.89%
5.23%
4.84%
4.33% 4.48%
4.00%
4% 3.65% 3.59%
3.47%
2% 2.64%
2.07%
1.78%
1.44%
1.19%
0%
2008 2009 2011 2011 June 30, 2012
Yield on earning assets Cost of funds Net interest margin (tax equivalent)
14
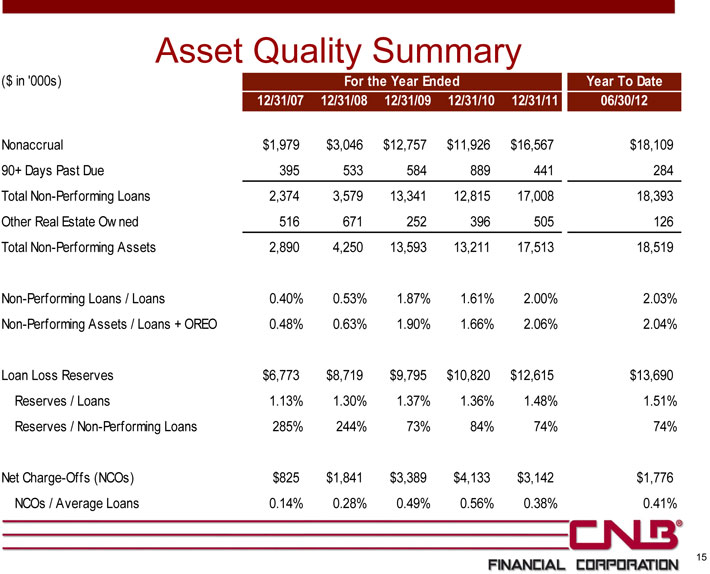
Asset Quality Summary
($ in ‘000s) For the Year Ended Year To Date 12/31/07 12/31/08 12/31/09 12/31/10 12/31/11 06/30/12
Nonaccrual $1,979 $3,046 $12,757 $11,926 $16,567 $18,109 90+ Days Past Due 395 533 584 889 441 284 Total Non-Performing Loans 2,374 3,579 13,341 12,815 17,008 18,393 Other Real Estate Ow ned 516 671 252 396 505 126 Total Non-Performing Assets 2,890 4,250 13,593 13,211 17,513 18,519
Non-Performing Loans / Loans 0.40% 0.53% 1.87% 1.61% 2.00% 2.03% Non-Performing Assets / Loans + OREO 0.48% 0.63% 1.90% 1.66% 2.06% 2.04%
Loan Loss Reserves $6,773 $8,719 $9,795 $10,820 $12,615 $13,690 Reserves / Loans 1.13% 1.30% 1.37% 1.36% 1.48% 1.51% Reserves / Non-Performing Loans 285% 244% 73% 84% 74% 74%
Net Charge-Offs (NCOs) $825 $1,841 $3,389 $4,133 $3,142 $1,776 NCOs / Average Loans 0.14% 0.28% 0.49% 0.56% 0.38% 0.41%
15
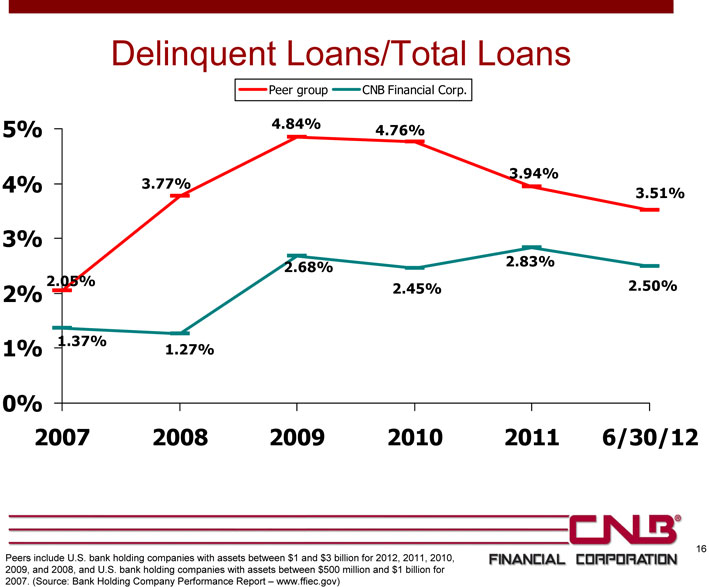
Delinquent Loans/Total Loans
Peer group CNB Financial Corp.
5% 4.84% 4.76%
3.94%
4% 3.77%
3.51%
3%
2.68% 2.83%
2.05% 2.50%
2% 2.45%
1.37%
1% 1.27%
0%
2007 2008 2009 2010 2011 6/30/12
Peers include U.S. bank holding companies with assets between $1 and $3 billion for 2012, 2011, 2010, 16 2009, and 2008, and U.S. bank holding companies with assets between $500 million and $1 billion for 2007. (Source: Bank Holding Company Performance Report – www.ffiec.gov)
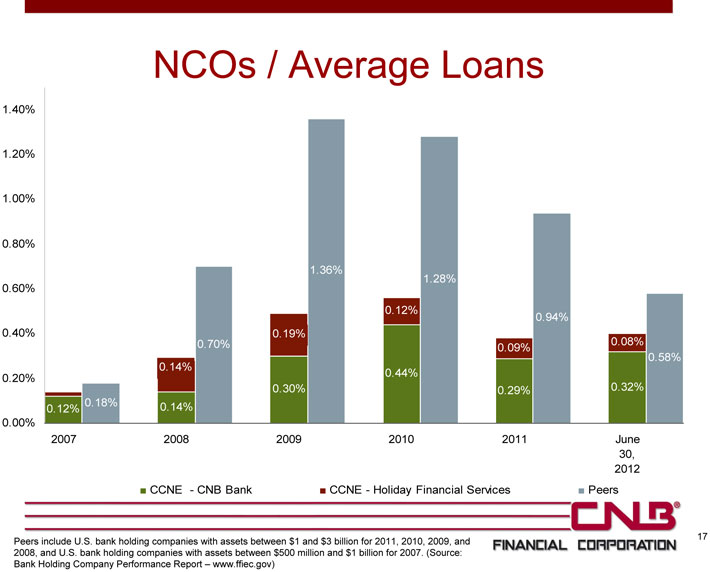
NCOs / Average Loans
1.40%
1.20%
1.00%
0.80%
1.36%
1.28%
0.60%
0.12%
0.94%
0.40% 0.19%
0.70% 0.08%
0.09%
0.58%
0.14%
0.44%
0.20%
0.30% 0.29% 0.32%
0.18% 0.14%
0.12%
0.00%
2007 2008 2009 2010 2011 June 30, 2012 CCNE —CNB Bank CCNE—Holiday Financial Services Peers
17 Peers include U.S. bank holding companies with assets between $1 and $3 billion for 2011, 2010, 2009, and 2008, and U.S. bank holding companies with assets between $500 million and $1 billion for 2007. (Source: Bank Holding Company Performance Report – www.ffiec.gov)
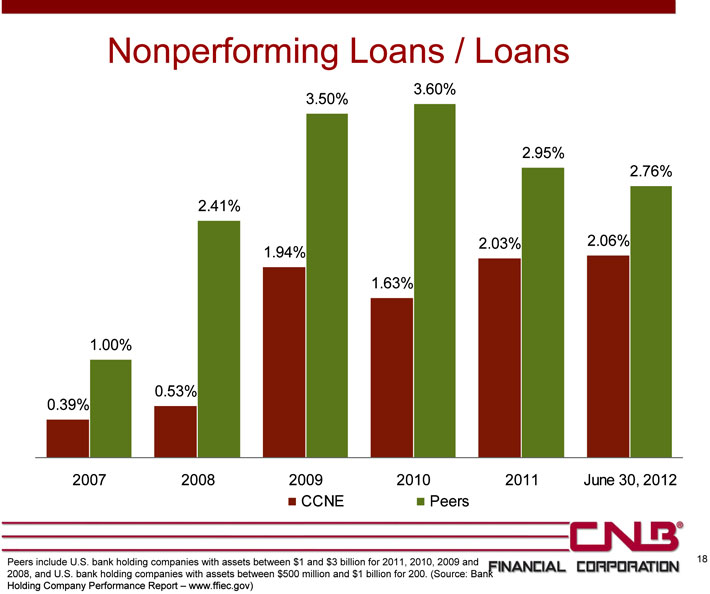
Nonperforming Loans / Loans
3.60%
3.50%
2.95%
2.76%
2.41%
2.03% 2.06%
1.94%
1.63%
1.00%
0.39% 0.53%
2007 2008 2009 2010 2011 June 30, 2012 CCNE Peers
Peers include U.S. bank holding companies with assets between $1 and $3 billion for 2011, 2010, 2009 and 18 2008, and U.S. bank holding companies with assets between $500 million and $1 billion for 200. (Source: Bank Holding Company Performance Report – www.ffiec.gov)
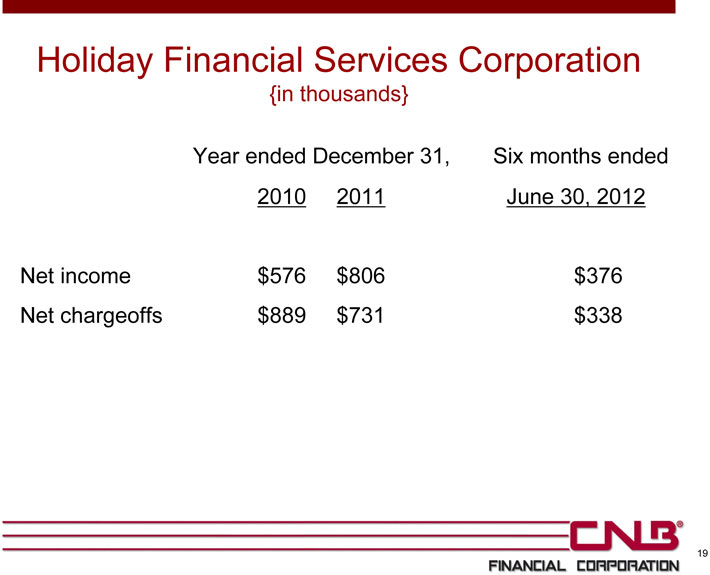
Holiday Financial Services Corporation
{in thousands}
Year ended December 31, Six months ended 2010 2011 June 30, 2012
Net income $576 $806 $376 Net chargeoffs $889 $731 $338
19
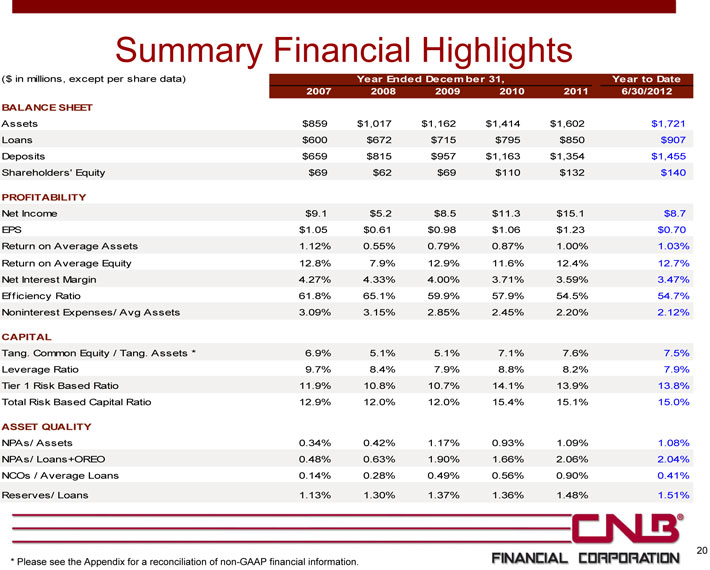
Summary Financial Highlights
($ in millions, except per share data) Year Ended December 31, Year to Date 2007 2008 2009 2010 2011 6/30/2012 BALANCE SHEET
Assets $859 $1,017 $1,162 $1,414 $1,602 $1,721 Loans $600 $672 $715 $795 $850 $907 Deposits $659 $815 $957 $1,163 $1,354 $1,455 Shareholders’ Equity $69 $62 $69 $110 $132 $140
PROFITABILITY
Net Income $9.1 $5.2 $8.5 $11.3 $15.1 $8.7 EPS $1.05 $0.61 $0.98 $1.06 $1.23 $0.70 Return on Average Assets 1.12% 0.55% 0.79% 0.87% 1.00% 1.03% Return on Average Equity 12.8% 7.9% 12.9% 11.6% 12.4% 12.7% Net Interest Margin 4.27% 4.33% 4.00% 3.71% 3.59% 3.47% Efficiency Ratio 61.8% 65.1% 59.9% 57.9% 54.5% 54.7% Noninterest Expenses/ Avg Assets 3.09% 3.15% 2.85% 2.45% 2.20% 2.12%
CAPITAL
Tang. Common Equity / Tang. Assets * 6.9% 5.1% 5.1% 7.1% 7.6% 7.5% Leverage Ratio 9.7% 8.4% 7.9% 8.8% 8.2% 7.9% Tier 1 Risk Based Ratio 11.9% 10.8% 10.7% 14.1% 13.9% 13.8% Total Risk Based Capital Ratio 12.9% 12.0% 12.0% 15.4% 15.1% 15.0%
ASSET QUALITY
NPAs/ Assets 0.34% 0.42% 1.17% 0.93% 1.09% 1.08% NPAs/ Loans+OREO 0.48% 0.63% 1.90% 1.66% 2.06% 2.04% NCOs / Average Loans 0.14% 0.28% 0.49% 0.56% 0.90% 0.41%
Reserves/ Loans 1.13% 1.30% 1.37% 1.36% 1.48% 1.51%
20
* Please see the Appendix for a reconciliation of non-GAAP financial information.
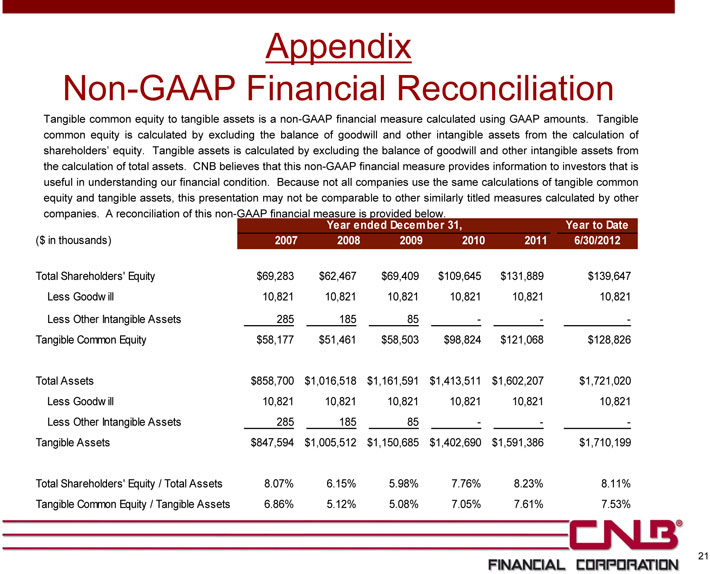
Appendix
Non-GAAP Financial Reconciliation
Tangible common equity to tangible assets is a non-GAAP financial measure calculated using GAAP amounts. Tangible common equity is calculated by excluding the balance of goodwill and other intangible assets from the calculation of shareholders’ equity. Tangible assets is calculated by excluding the balance of goodwill and other intangible assets from the calculation of total assets. CNB believes that this non-GAAP financial measure provides information to investors that is useful in understanding our financial condition. Because not all companies use the same calculations of tangible common equity and tangible assets, this presentation may not be comparable to other similarly titled measures calculated by other companies. A reconciliation of this non-GAAP financial measure is provided below.
Year ended December 31, Year to Date ($ in thousands) 2007 2008 2009 2010 2011 6/30/2012
Total Shareholders’ Equity $69,283 $62,467 $69,409 $109,645 $131,889 $139,647 Less Goodw ill 10,821 10,821 10,821 10,821 10,821 10,821 Less Other Intangible Assets 285 185 85 — — -Tangible Common Equity $58,177 $51,461 $58,503 $98,824 $121,068 $128,826
Total Assets $858,700 $1,016,518 $1,161,591 $1,413,511 $1,602,207 $1,721,020 Less Goodw ill 10,821 10,821 10,821 10,821 10,821 10,821 Less Other Intangible Assets 285 185 85 — — -Tangible Assets $847,594 $1,005,512 $1,150,685 $1,402,690 $1,591,386 $1,710,199
Total Shareholders’ Equity / Total Assets 8.07% 6.15% 5.98% 7.76% 8.23% 8.11% Tangible Common Equity / Tangible Assets 6.86% 5.12% 5.08% 7.05% 7.61% 7.53%
21
Financial Highlights As of and for the six months ended June 30, 2012
NASDAQ: CCNE
October 12, 2012