Investor Presentation July 2017 Exhibit 99.1
Forward-Looking Statements This presentation includes forward-looking statements within the meaning of Section 27A of the Securities Act of 1933, as amended, and Section 21E of the Securities Exchange Act of 1934, as amended, with respect to the financial condition, liquidity, results of operations, future performance, and business of CNB Financial Corporation. These forward-looking statements are intended to be covered by the safe harbor for “forward-looking statements” provided by the Private Securities Litigation Reform Act of 1995. Forward-looking statements are those that are not historical facts. Forward-looking statements include statements with respect to beliefs, plans, objectives, goals, expectations, anticipations, estimates, and intentions that are subject to significant risks and uncertainties, and are subject to change based on various factors (some of which are beyond our control). Forward-looking statements often include the words “believes,” “expects,” “anticipates,” “estimates,” “forecasts,” “intends,” “plans,” “targets,” “potentially,” “probably,” “projects,” “outlook,” or similar expressions, or future conditional verbs such as “may,” “will,” “should,” “would,” and “could.” Such known and unknown risks, uncertainties and other factors that could cause the actual results to differ materially from the statements include, but are not limited to: (i) changes in general business, industry or economic conditions, or competition; (ii) changes in any applicable law, rule, regulation, policy, guideline, or practice governing or affecting financial holding companies and their subsidiaries or with respect to tax or accounting principles or otherwise; (iii) adverse changes or conditions in capital and financial markets; (iv) changes in interest rates; (v) higher-than-expected costs or other difficulties related to integration of combined or merged businesses; (vi) the inability to realize expected cost savings or achieve other anticipated benefits in connection with business combinations and other acquisitions; (vii) changes in the quality or composition of our loan and investment portfolios; (viii) adequacy of loan loss reserves; (ix) increased competition; (x) loss of certain key officers; (xi) continued relationships with major customers; (xii) deposit attrition; (xiii) rapidly changing technology; (xiv) unanticipated regulatory or judicial proceedings and liabilities and other costs; (xv) changes in the cost of funds, demand for loan products, or demand for financial services; (xvi) other economic, competitive, governmental, or technological factors affecting our operations, markets, products, services, and prices; and (xvii) our success at managing the foregoing items. Such developments could have an adverse impact on our financial position and our results of operations. The forward-looking statements are based upon management’s beliefs and assumptions. Any forward-looking statement made herein speaks only as of the date of this presentation. Factors or events that could cause our actual results to differ may emerge from time to time, and it is not possible for us to predict all of them. We undertake no obligation to publicly update any forward-looking statement, whether as a result of new information, future developments, or otherwise, except as may be required by law.
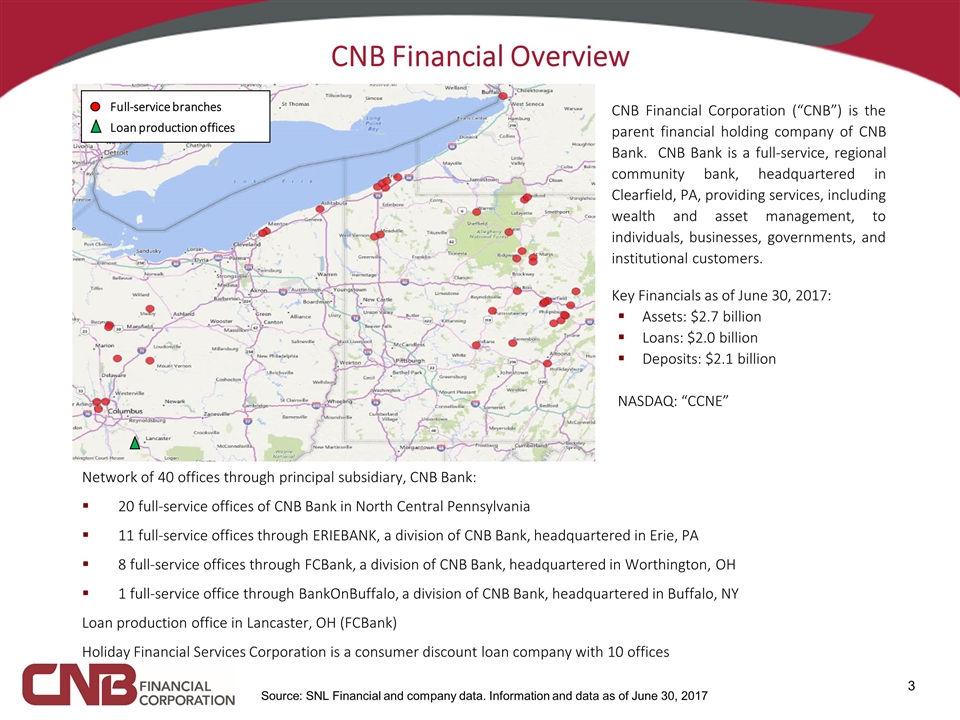
CNB Financial Overview Network of 40 offices through principal subsidiary, CNB Bank: 20 full-service offices of CNB Bank in North Central Pennsylvania 11 full-service offices through ERIEBANK, a division of CNB Bank, headquartered in Erie, PA 8 full-service offices through FCBank, a division of CNB Bank, headquartered in Worthington, OH 1 full-service office through BankOnBuffalo, a division of CNB Bank, headquartered in Buffalo, NY Loan production office in Lancaster, OH (FCBank) Holiday Financial Services Corporation is a consumer discount loan company with 10 offices CNB Financial Corporation (“CNB”) is the parent financial holding company of CNB Bank. CNB Bank is a full-service, regional community bank, headquartered in Clearfield, PA, providing services, including wealth and asset management, to individuals, businesses, governments, and institutional customers. Key Financials as of June 30, 2017: Assets: $2.7 billion Loans: $2.0 billion Deposits: $2.1 billion NASDAQ: “CCNE” Source: SNL Financial and company data. Information and data as of June 30, 2017 Full-service branches Loan production offices
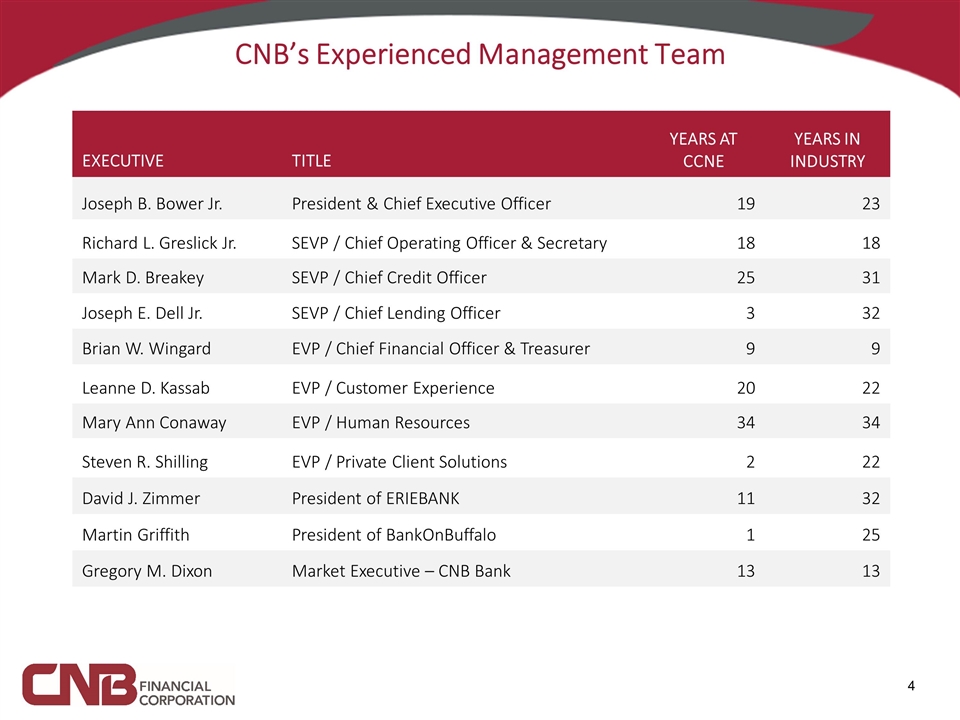
CNB’s Experienced Management Team YEARS AT CCNE YEARS IN INDUSTRY EXECUTIVE TITLE Joseph B. Bower Jr. President & Chief Executive Officer 19 23 Richard L. Greslick Jr. SEVP / Chief Operating Officer & Secretary 18 18 Mark D. Breakey SEVP / Chief Credit Officer 25 31 Joseph E. Dell Jr. SEVP / Chief Lending Officer 3 32 Brian W. Wingard EVP / Chief Financial Officer & Treasurer 9 9 Leanne D. Kassab EVP / Customer Experience 20 22 Mary Ann Conaway EVP / Human Resources 34 34 Steven R. Shilling EVP / Private Client Solutions 2 22 David J. Zimmer President of ERIEBANK 11 32 Martin Griffith President of BankOnBuffalo 1 25 Gregory M. Dixon Market Executive – CNB Bank 13 13
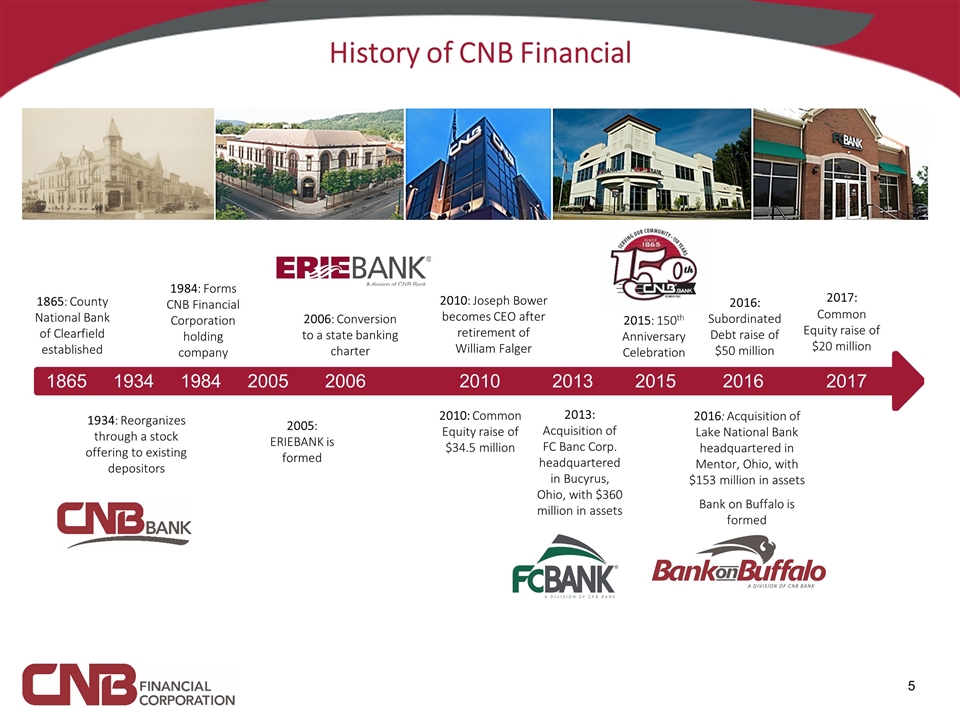
History of CNB Financial 1865: County National Bank of Clearfield established 1934: Reorganizes through a stock offering to existing depositors 1984: Forms CNB Financial Corporation holding company 2005: ERIEBANK is formed 2006: Conversion to a state banking charter 2010: Joseph Bower becomes CEO after retirement of William Falger 2010: Common Equity raise of $34.5 million 2013: Acquisition of FC Banc Corp. headquartered in Bucyrus, Ohio, with $360 million in assets 2015: 150th Anniversary Celebration 2016: Acquisition of Lake National Bank headquartered in Mentor, Ohio, with $153 million in assets Bank on Buffalo is formed 1865 1934 1984 2005 2006 2010 2013 2015 2016 2017 2016: Subordinated Debt raise of $50 million 2017: Common Equity raise of $20 million
CNB’s Growth Model CNB’s strong growth, both organic and by M&A, is the result of identifying the right market in which to operate based on market demographics that fit CNB’s lending expertise (small and mid-sized commercial and industrial lending) and then finding the right local management with the market experience to deliver the CNB product set and the sophistication of services to grow organically in the market CNB created the ERIEBANK franchise using this model and has grown to over $700 million in loans in twelve years In Ohio, CNB entered the greater Columbus market through the acquisition of FCBank, and has since executed this same strategy to grow organically in the FCBank market through opening new offices and hiring additional lenders A similar opportunity exists in the greater Cleveland, OH, market with CNB’s acquisition of Lake National Bank in 2016 CNB hired a local banker in 2016 to oversee the entrance into Buffalo, New York, with BankOnBuffalo M&A is not a priority in CNB’s growth strategy; however, CNB will consider opportunities that meet the financial criteria, expand CNB’s presence into markets that fit the business model (e.g., FCBank, Lake National), bring significant talent, and/or fill in existing markets CNB raised $50 million of BBB- Kroll-rated subordinated debt during the third quarter of 2016 and $20 million of common stock during the first quarter of 2017 to support its organic growth strategy
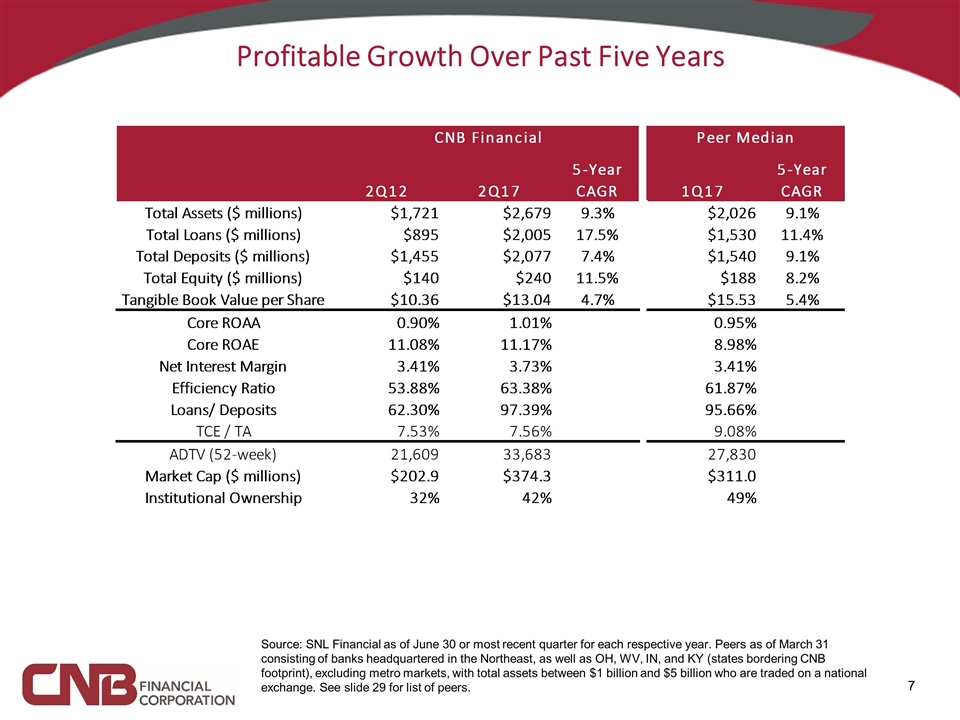
Profitable Growth Over Past Five Years Source: SNL Financial as of June 30 or most recent quarter for each respective year. Peers as of March 31 consisting of banks headquartered in the Northeast, as well as OH, WV, IN, and KY (states bordering CNB footprint), excluding metro markets, with total assets between $1 billion and $5 billion who are traded on a national exchange. See slide 29 for list of peers.

Greater Presence in Metropolitan Markets (% of loan portfolio) 12/31/09 12/31/12 6/30/17 * Source: Company data
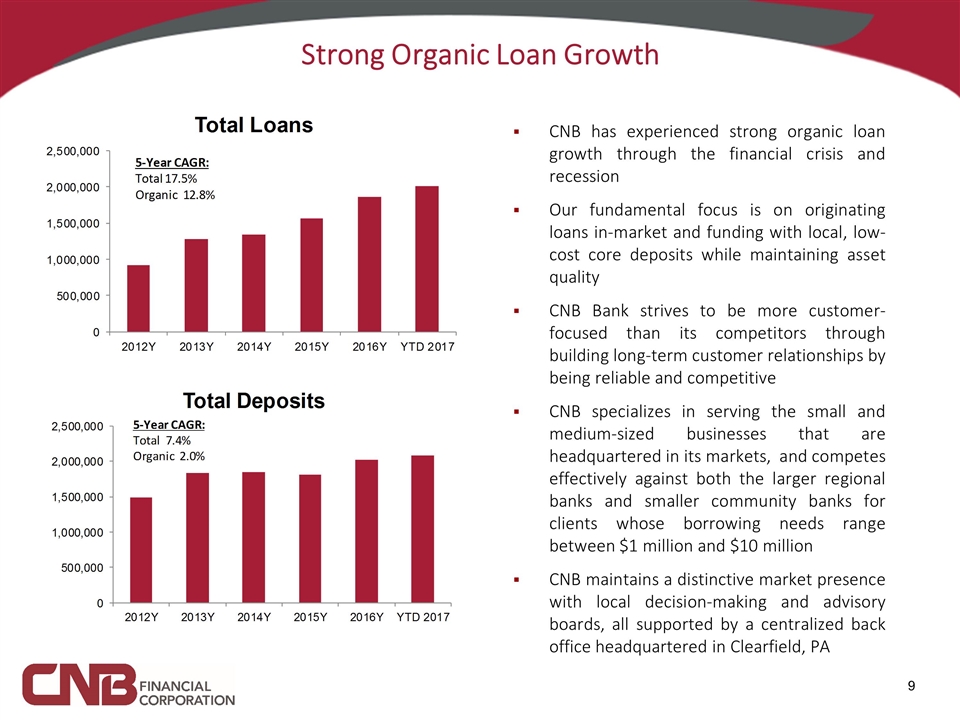
Strong Organic Loan Growth CNB has experienced strong organic loan growth through the financial crisis and recession Our fundamental focus is on originating loans in-market and funding with local, low-cost core deposits while maintaining asset quality CNB Bank strives to be more customer-focused than its competitors through building long-term customer relationships by being reliable and competitive CNB specializes in serving the small and medium-sized businesses that are headquartered in its markets, and competes effectively against both the larger regional banks and smaller community banks for clients whose borrowing needs range between $1 million and $10 million CNB maintains a distinctive market presence with local decision-making and advisory boards, all supported by a centralized back office headquartered in Clearfield, PA
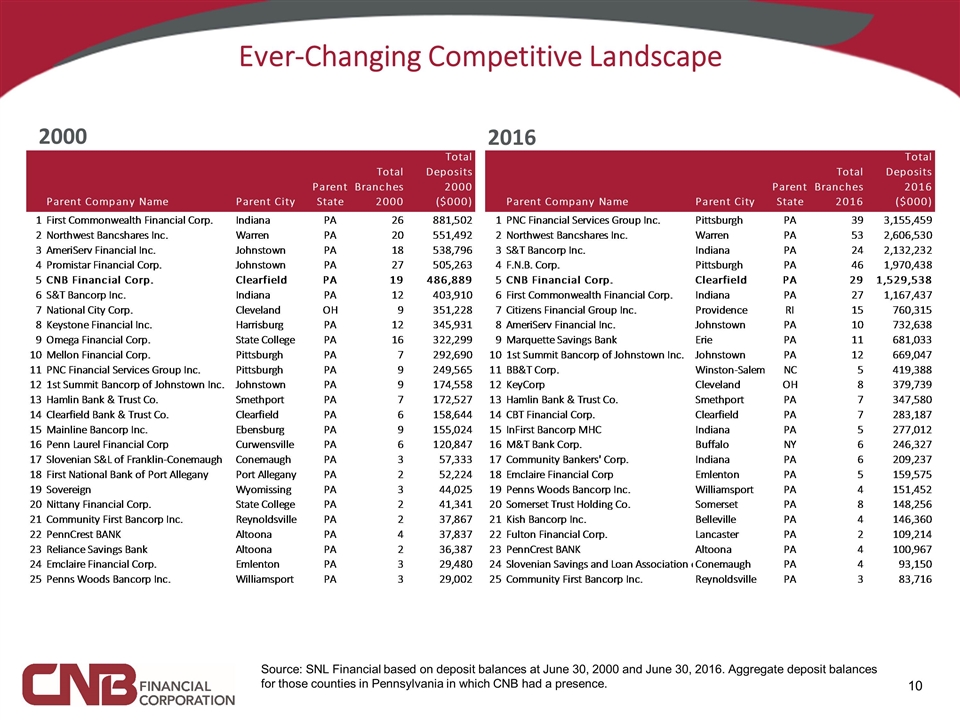
Ever-Changing Competitive Landscape Source: SNL Financial based on deposit balances at June 30, 2000 and June 30, 2016. Aggregate deposit balances for those counties in Pennsylvania in which CNB had a presence. 2000 2016
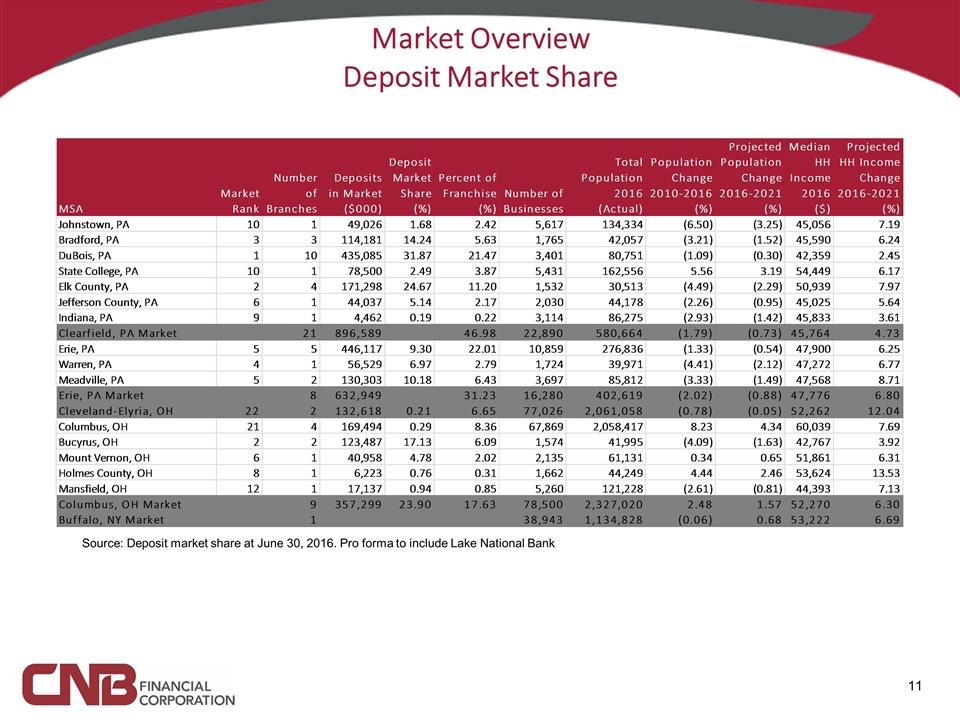
Market Overview Deposit Market Share Source: Deposit market share at June 30, 2016. Pro forma to include Lake National Bank
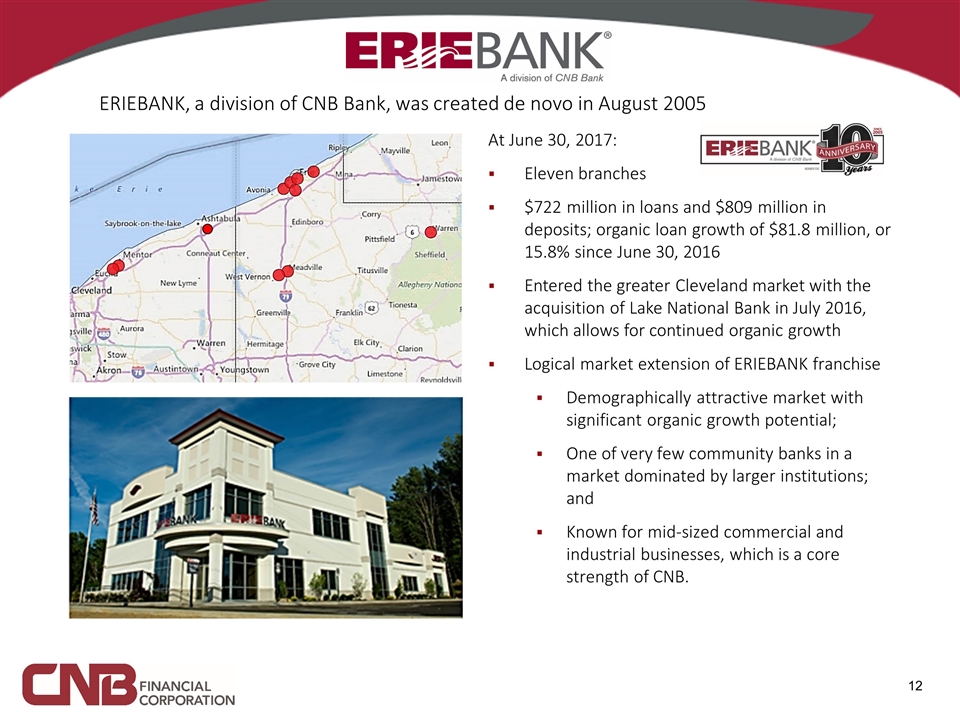
At June 30, 2017: Eleven branches $722 million in loans and $809 million in deposits; organic loan growth of $81.8 million, or 15.8% since June 30, 2016 Entered the greater Cleveland market with the acquisition of Lake National Bank in July 2016, which allows for continued organic growth Logical market extension of ERIEBANK franchise Demographically attractive market with significant organic growth potential; One of very few community banks in a market dominated by larger institutions; and Known for mid-sized commercial and industrial businesses, which is a core strength of CNB. ERIEBANK, a division of CNB Bank, was created de novo in August 2005
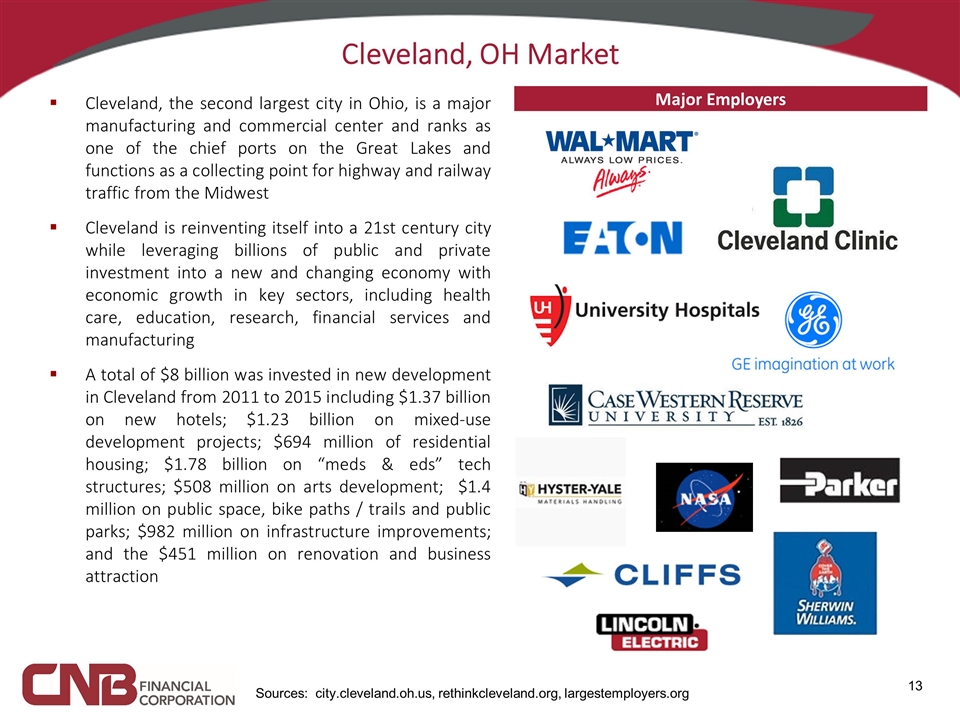
Cleveland, OH Market Sources: city.cleveland.oh.us, rethinkcleveland.org, largestemployers.org Cleveland, the second largest city in Ohio, is a major manufacturing and commercial center and ranks as one of the chief ports on the Great Lakes and functions as a collecting point for highway and railway traffic from the Midwest Cleveland is reinventing itself into a 21st century city while leveraging billions of public and private investment into a new and changing economy with economic growth in key sectors, including health care, education, research, financial services and manufacturing A total of $8 billion was invested in new development in Cleveland from 2011 to 2015 including $1.37 billion on new hotels; $1.23 billion on mixed-use development projects; $694 million of residential housing; $1.78 billion on “meds & eds” tech structures; $508 million on arts development; $1.4 million on public space, bike paths / trails and public parks; $982 million on infrastructure improvements; and the $451 million on renovation and business attraction Major Employers
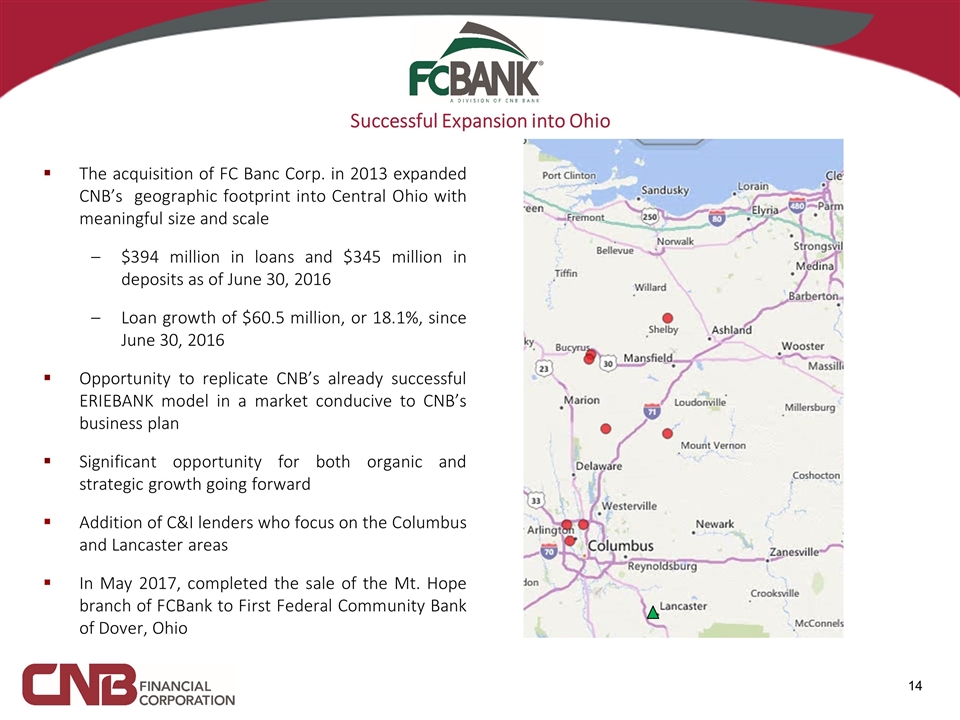
The acquisition of FC Banc Corp. in 2013 expanded CNB’s geographic footprint into Central Ohio with meaningful size and scale $394 million in loans and $345 million in deposits as of June 30, 2016 Loan growth of $60.5 million, or 18.1%, since June 30, 2016 Opportunity to replicate CNB’s already successful ERIEBANK model in a market conducive to CNB’s business plan Significant opportunity for both organic and strategic growth going forward Addition of C&I lenders who focus on the Columbus and Lancaster areas In May 2017, completed the sale of the Mt. Hope branch of FCBank to First Federal Community Bank of Dover, Ohio Successful Expansion into Ohio
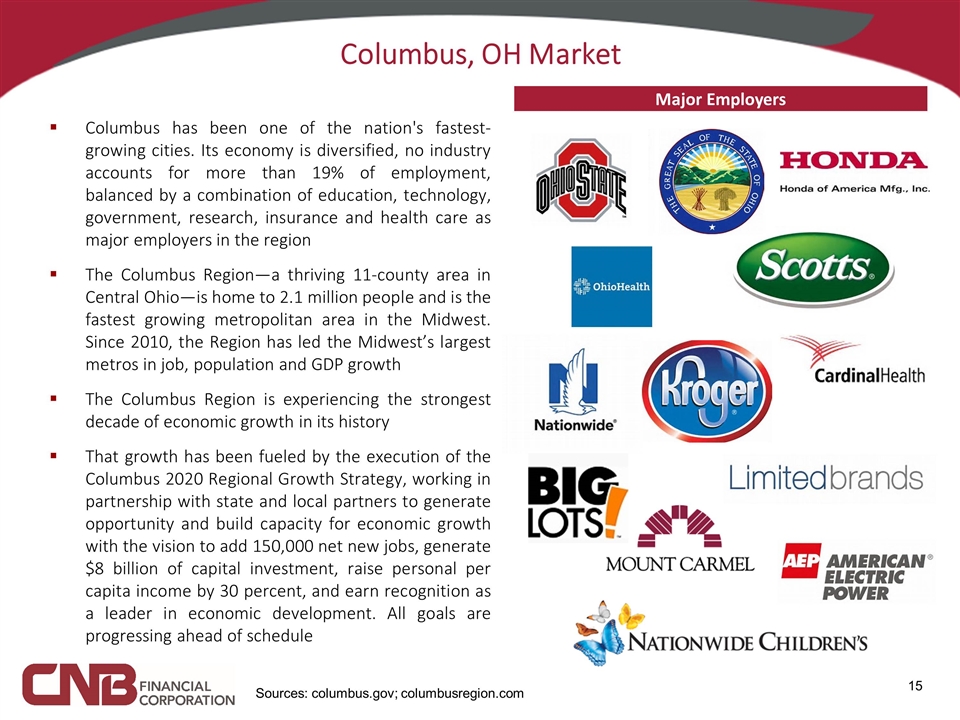
Columbus, OH Market Sources: columbus.gov; columbusregion.com Columbus has been one of the nation's fastest-growing cities. Its economy is diversified, no industry accounts for more than 19% of employment, balanced by a combination of education, technology, government, research, insurance and health care as major employers in the region The Columbus Region—a thriving 11-county area in Central Ohio—is home to 2.1 million people and is the fastest growing metropolitan area in the Midwest. Since 2010, the Region has led the Midwest’s largest metros in job, population and GDP growth The Columbus Region is experiencing the strongest decade of economic growth in its history That growth has been fueled by the execution of the Columbus 2020 Regional Growth Strategy, working in partnership with state and local partners to generate opportunity and build capacity for economic growth with the vision to add 150,000 net new jobs, generate $8 billion of capital investment, raise personal per capita income by 30 percent, and earn recognition as a leader in economic development. All goals are progressing ahead of schedule Major Employers

Bank on Buffalo, a division of CNB Bank formed in 2016, is primarily focused on the large number of commercial and industrial businesses that operate in the market The decision to move into this region with a de novo operation came after an extensive evaluation of the market and the competition, as well as a search for the key executive from the area to spearhead the market’s development Bank on Buffalo entered the market with a loan production office which was opened in the Electric Tower building in downtown Buffalo, New York in November 2016. This loan production office was converted to a full-service office in February 2017, and two additional Bank on Buffalo full-service offices will be opened in 2017 in Williamsville and Orchard Park, New York $52 million in loans and $10 million in deposits as of June 30, 2017
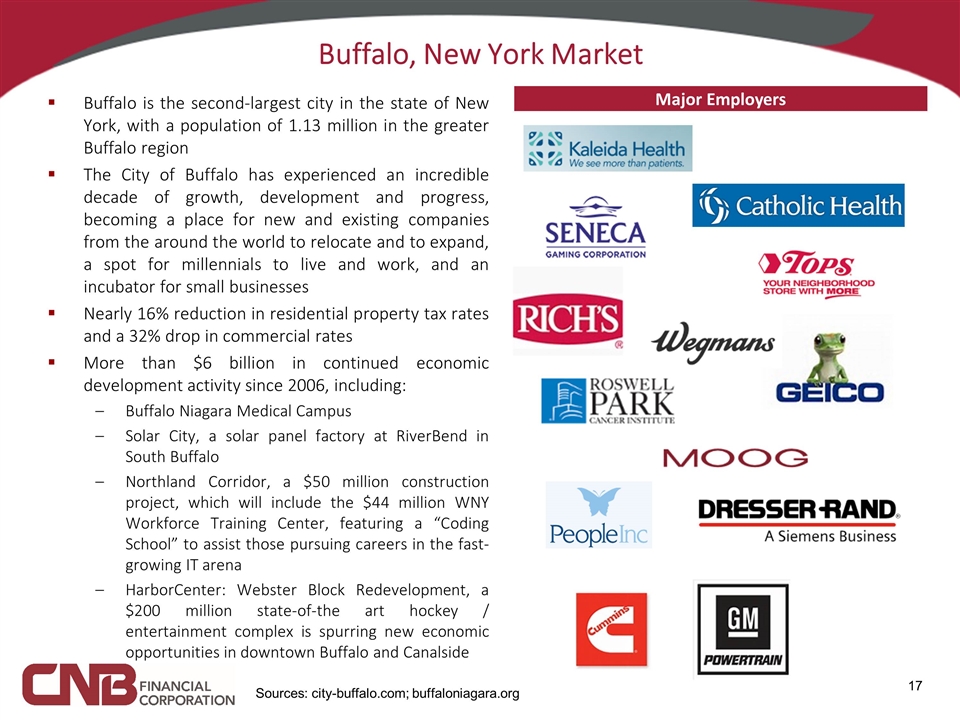
Buffalo, New York Market Sources: city-buffalo.com; buffaloniagara.org Buffalo is the second-largest city in the state of New York, with a population of 1.13 million in the greater Buffalo region The City of Buffalo has experienced an incredible decade of growth, development and progress, becoming a place for new and existing companies from the around the world to relocate and to expand, a spot for millennials to live and work, and an incubator for small businesses Nearly 16% reduction in residential property tax rates and a 32% drop in commercial rates More than $6 billion in continued economic development activity since 2006, including: Buffalo Niagara Medical Campus Solar City, a solar panel factory at RiverBend in South Buffalo Northland Corridor, a $50 million construction project, which will include the $44 million WNY Workforce Training Center, featuring a “Coding School” to assist those pursuing careers in the fast-growing IT arena HarborCenter: Webster Block Redevelopment, a $200 million state-of-the art hockey / entertainment complex is spurring new economic opportunities in downtown Buffalo and Canalside Major Employers
Building Infrastructure to Support Future Growth CNB has experienced significant growth, doubling its size since December 31, 2009; assets have grown from $1.2 billion to $2.7 billion between December 31, 2009 and June 30, 2017 The rapid increase in assets through the growth in number of customers led management to analyze its infrastructure and staffing needs As a result, CNB made numerous investments in infrastructure and personnel during 2015 and early 2016 to facilitate its continued growth: Approximately 15,000 square feet of space to the existing headquarters was added to better leverage facilities, technology, and personnel. This new, modern facility allows CNB to house our back-office staff to operate into the foreseeable future; CNB added staff, which included both customer-facing personnel, such as business development, treasury management, and wealth management officers, as well as support department personnel; Upgraded its core processing system, which involved non-recurring costs in 2015 ($108 thousand) and 2016 ($1.7 million); and Developed several career-based training programs that are offered internally, including our own leadership program. With these investments, CNB now has the infrastructure in place to support continued growth

Customer-Efficient, Cost-Effective Retail Delivery CNB’s office network has been redesigned to be more customer-friendly and provide customers with a one-on-one experience Offices are staffed with an on-site, well-trained team that can handle all of a customer’s needs, from account openings to customer service CNB recently completed an upgrade of its core processing system, along with most of its other electronic offerings, including enhancements to mobile and eBanking solutions to provide the most up-to-date services to its customers

Financial Information
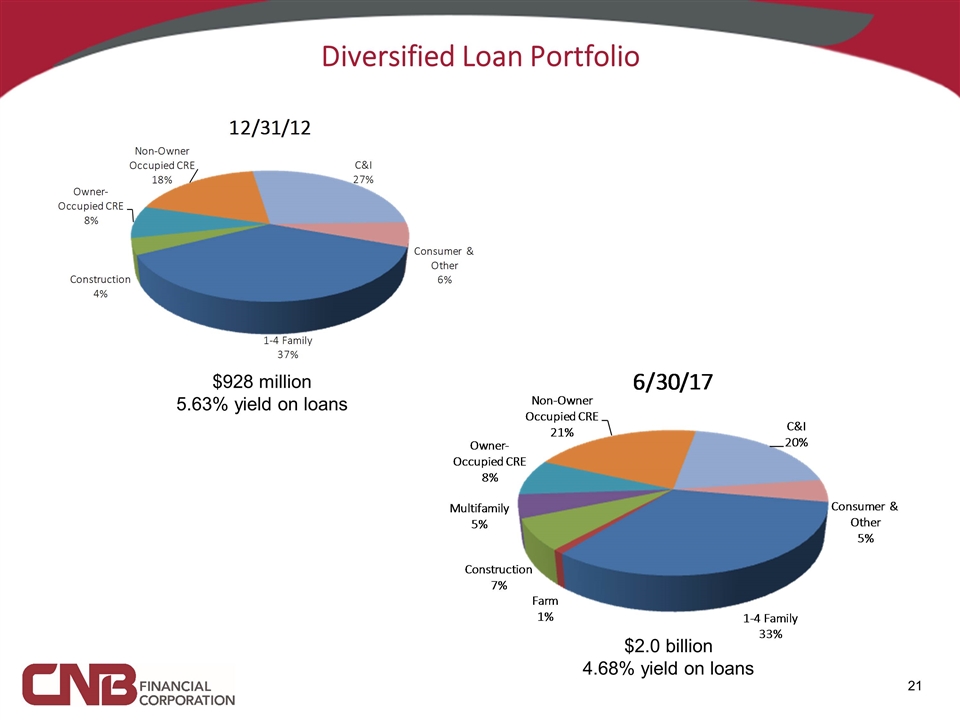
Diversified Loan Portfolio $928 million 5.63% yield on loans $2.0 billion 4.68% yield on loans
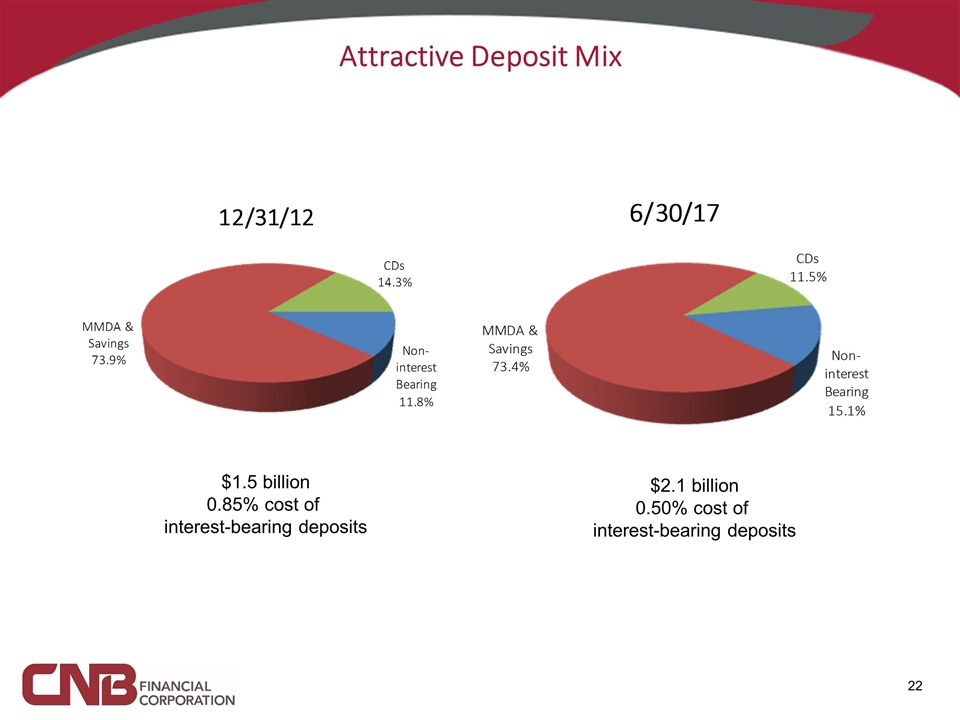
Attractive Deposit Mix $1.5 billion 0.85% cost of interest-bearing deposits $2.1 billion 0.50% cost of interest-bearing deposits
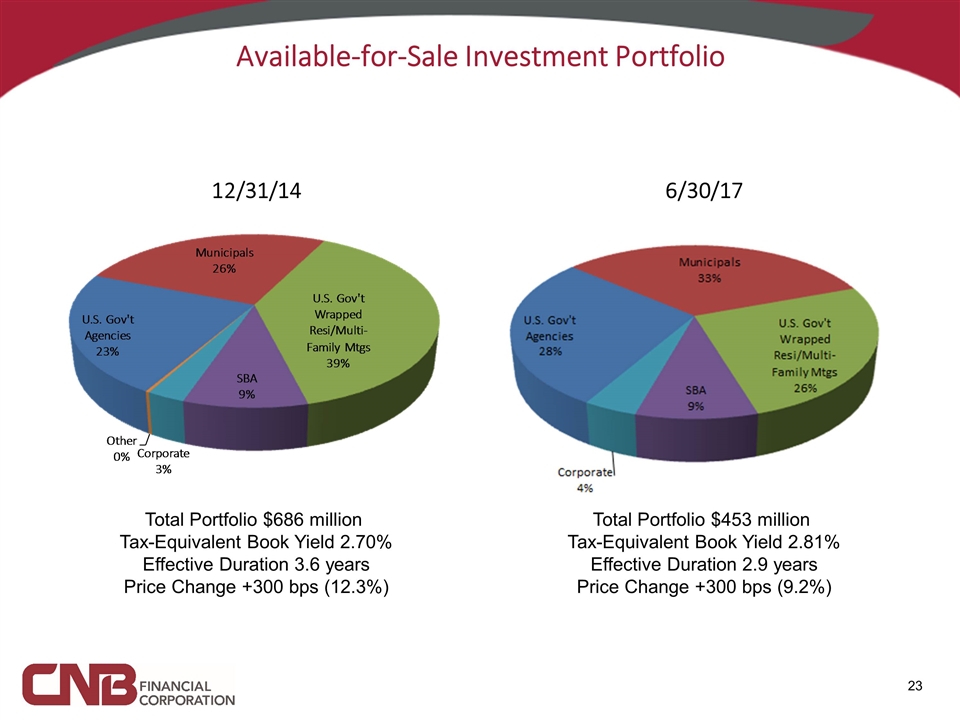
Total Portfolio $453 million Tax-Equivalent Book Yield 2.81% Effective Duration 2.9 years Price Change +300 bps (9.2%) Available-for-Sale Investment Portfolio 6/30/17 Total Portfolio $686 million Tax-Equivalent Book Yield 2.70% Effective Duration 3.6 years Price Change +300 bps (12.3%) 12/31/14
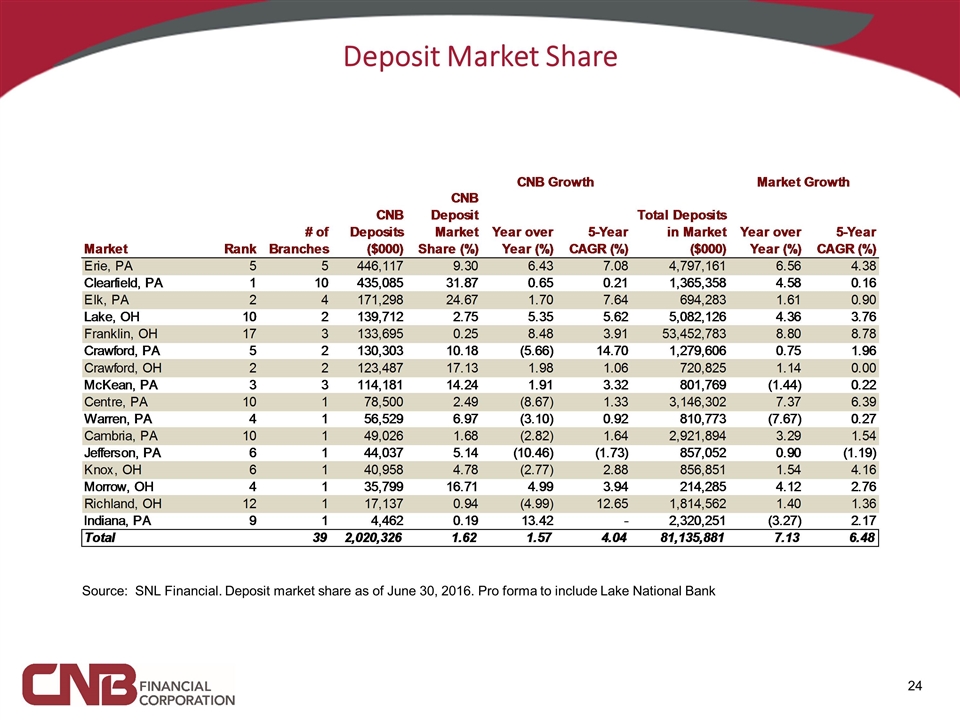
Deposit Market Share Source: SNL Financial. Deposit market share as of June 30, 2016. Pro forma to include Lake National Bank
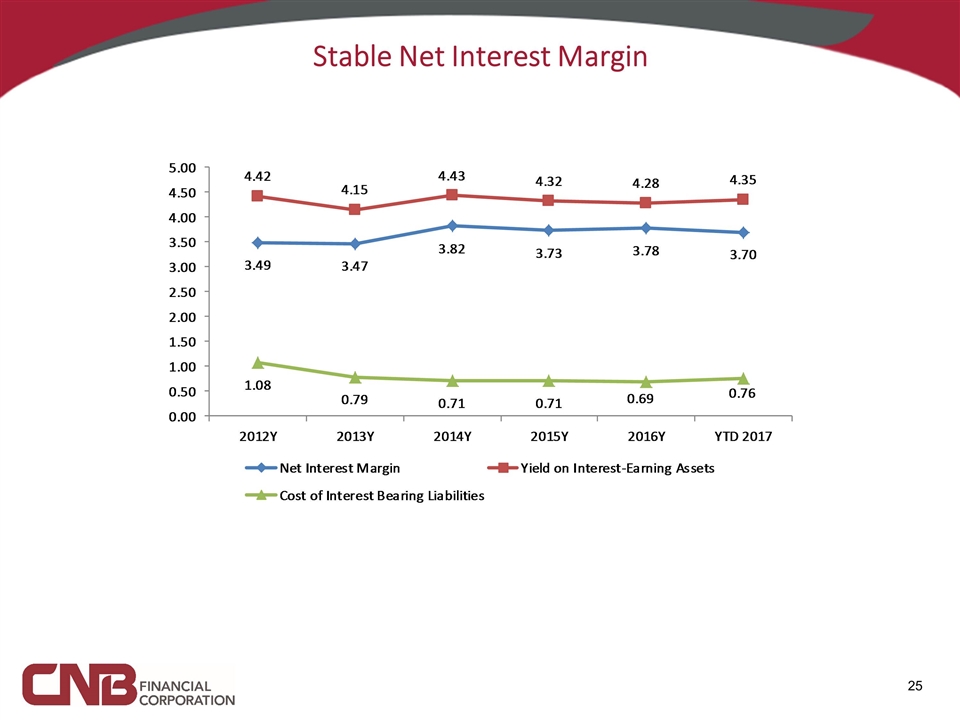
Stable Net Interest Margin

Superior Asset Quality Source: SNL Financial. NPAs excluded restructured loans. NCOs / Average Loans by Channel Texas ratio defined as NPA & Loans 90+/ Tangible Common Equity* + Allowance for Loan Losses. * Please see slide 27 for a reconciliation of non-GAAP financial information.
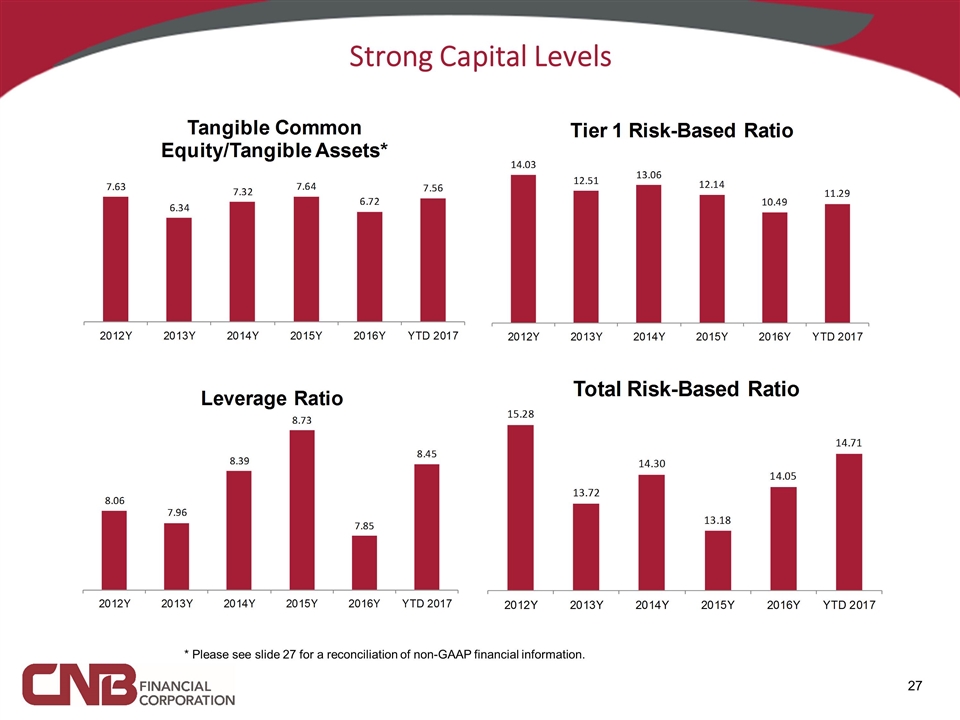
Strong Capital Levels * Please see slide 27 for a reconciliation of non-GAAP financial information.
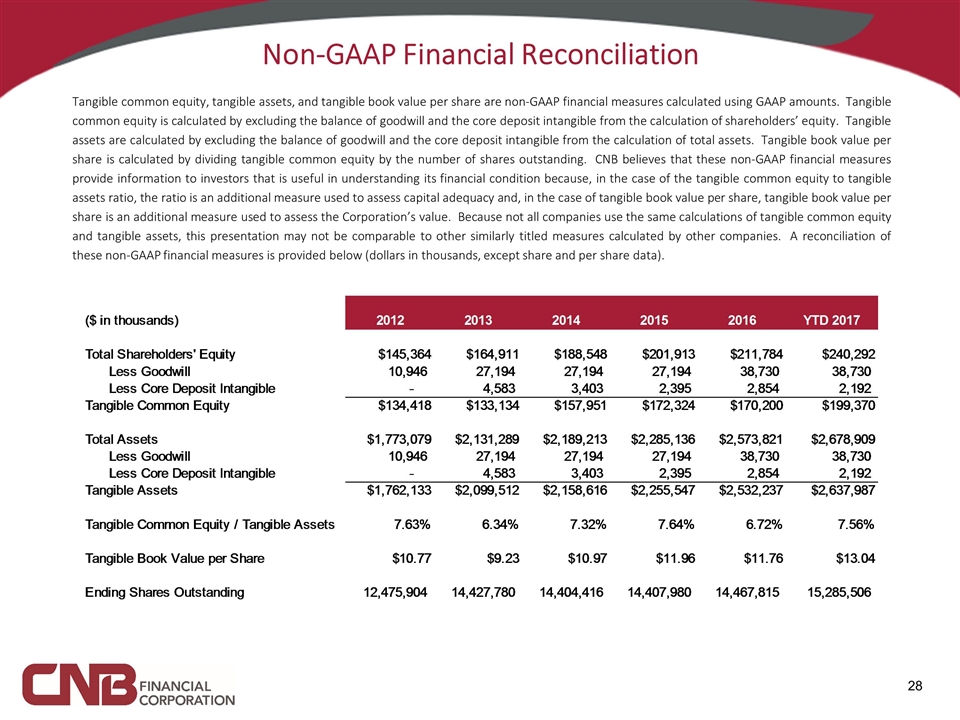
Non-GAAP Financial Reconciliation Tangible common equity, tangible assets, and tangible book value per share are non-GAAP financial measures calculated using GAAP amounts. Tangible common equity is calculated by excluding the balance of goodwill and the core deposit intangible from the calculation of shareholders’ equity. Tangible assets are calculated by excluding the balance of goodwill and the core deposit intangible from the calculation of total assets. Tangible book value per share is calculated by dividing tangible common equity by the number of shares outstanding. CNB believes that these non-GAAP financial measures provide information to investors that is useful in understanding its financial condition because, in the case of the tangible common equity to tangible assets ratio, the ratio is an additional measure used to assess capital adequacy and, in the case of tangible book value per share, tangible book value per share is an additional measure used to assess the Corporation’s value. Because not all companies use the same calculations of tangible common equity and tangible assets, this presentation may not be comparable to other similarly titled measures calculated by other companies. A reconciliation of these non-GAAP financial measures is provided below (dollars in thousands, except share and per share data).
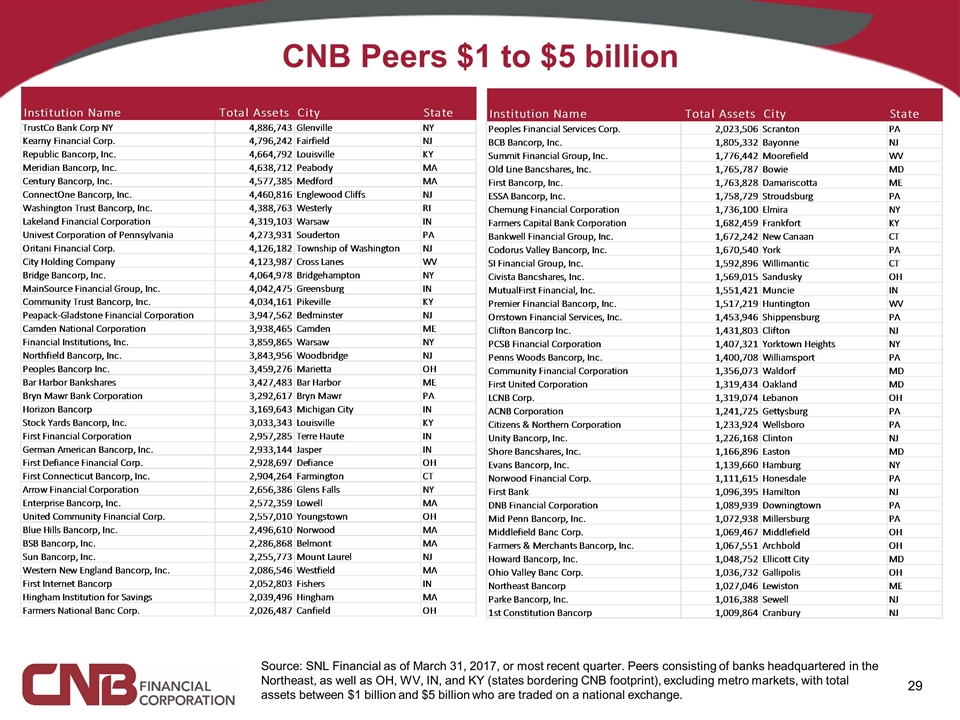
CNB Peers $1 to $5 billion Source: SNL Financial as of March 31, 2017, or most recent quarter. Peers consisting of banks headquartered in the Northeast, as well as OH, WV, IN, and KY (states bordering CNB footprint), excluding metro markets, with total assets between $1 billion and $5 billion who are traded on a national exchange.


