
Annual Shareholder Meeting April 16, 2019 Exhibit 99.1
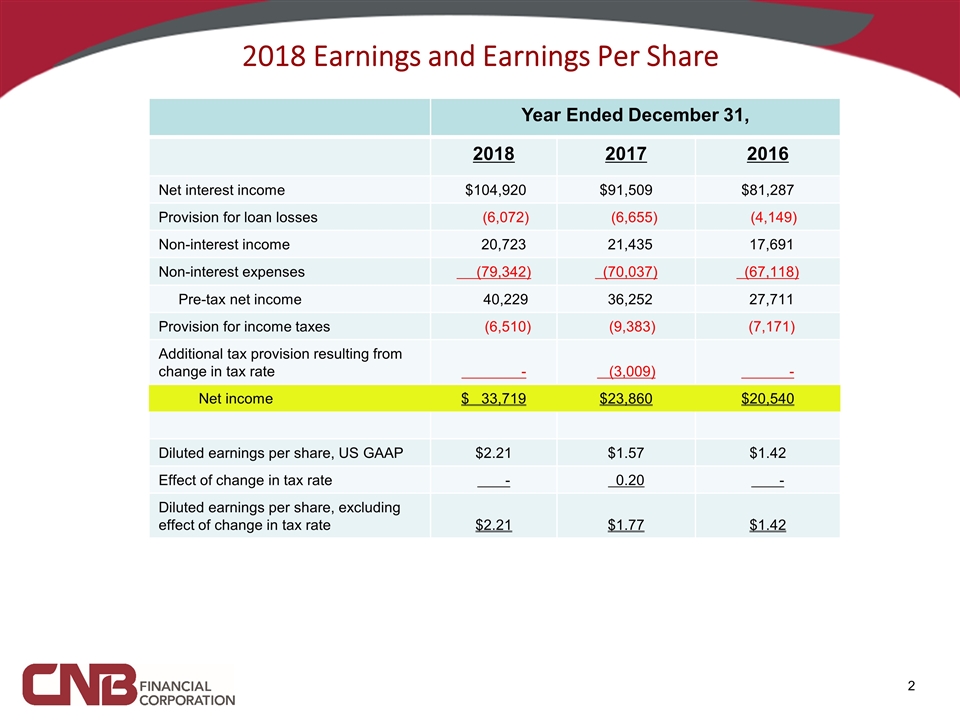
2018 Earnings and Earnings Per Share Year Ended December 31, 2018 2017 2016 Net interest income $104,920 $91,509 $81,287 Provision for loan losses (6,072) (6,655) (4,149) Non-interest income 20,723 21,435 17,691 Non-interest expenses (79,342) (70,037) (67,118) Pre-tax net income 40,229 36,252 27,711 Provision for income taxes (6,510) (9,383) (7,171) Additional tax provision resulting from change in tax rate - (3,009) - Net income $ 33,719 $23,860 $20,540 Diluted earnings per share, US GAAP $2.21 $1.57 $1.42 Effect of change in tax rate - 0.20 - Diluted earnings per share, excluding effect of change in tax rate $2.21 $1.77 $1.42
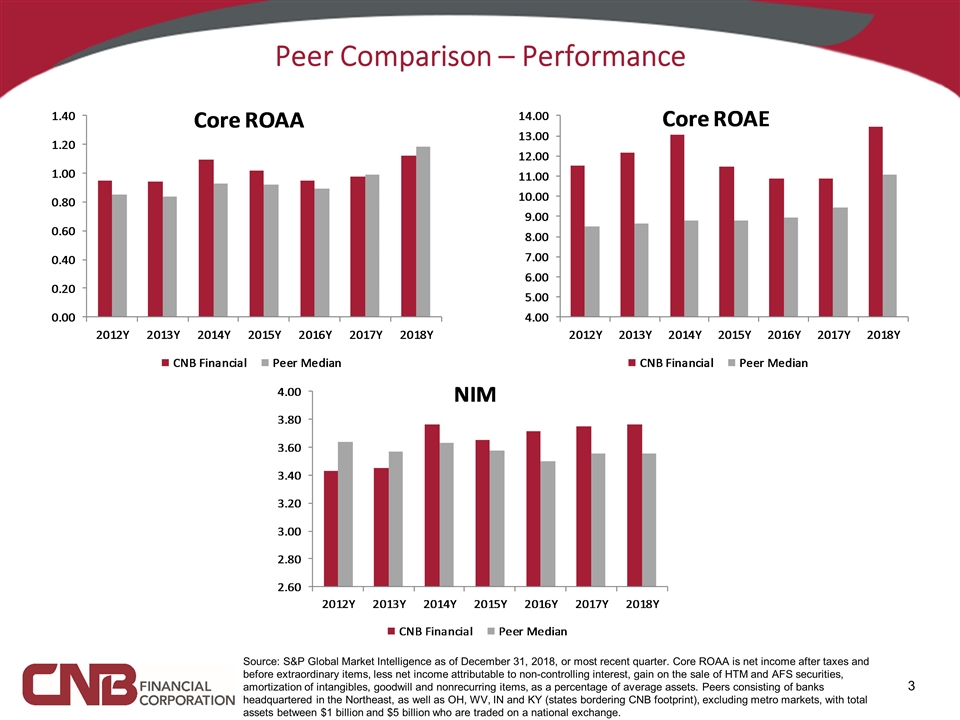
Peer Comparison – Performance Source: S&P Global Market Intelligence as of December 31, 2018, or most recent quarter. Core ROAA is net income after taxes and before extraordinary items, less net income attributable to non-controlling interest, gain on the sale of HTM and AFS securities, amortization of intangibles, goodwill and nonrecurring items, as a percentage of average assets. Peers consisting of banks headquartered in the Northeast, as well as OH, WV, IN and KY (states bordering CNB footprint), excluding metro markets, with total assets between $1 billion and $5 billion who are traded on a national exchange.
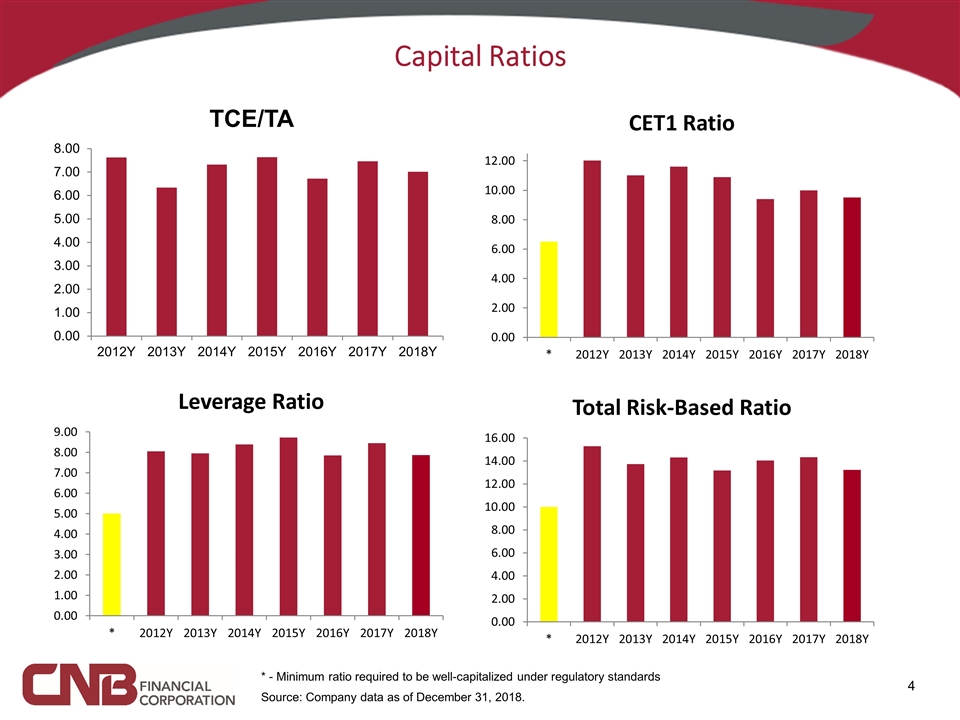
Capital Ratios Source: Company data as of December 31, 2018. * - Minimum ratio required to be well-capitalized under regulatory standards

Our Vision Look for a way to say yes to our customers, co-workers and communities, every time.
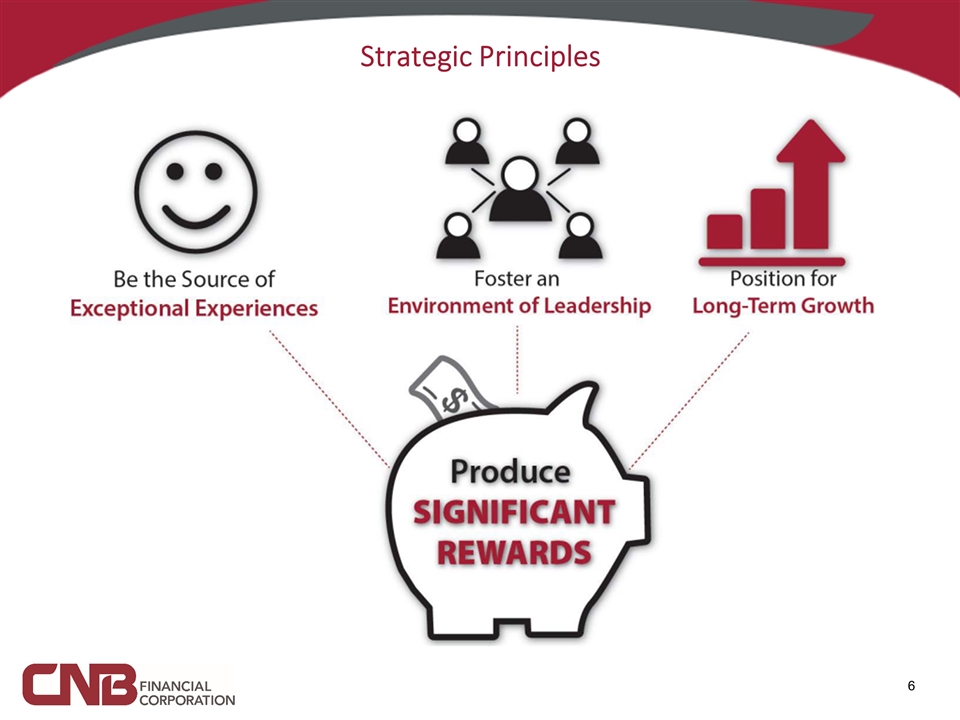
Strategic Principles
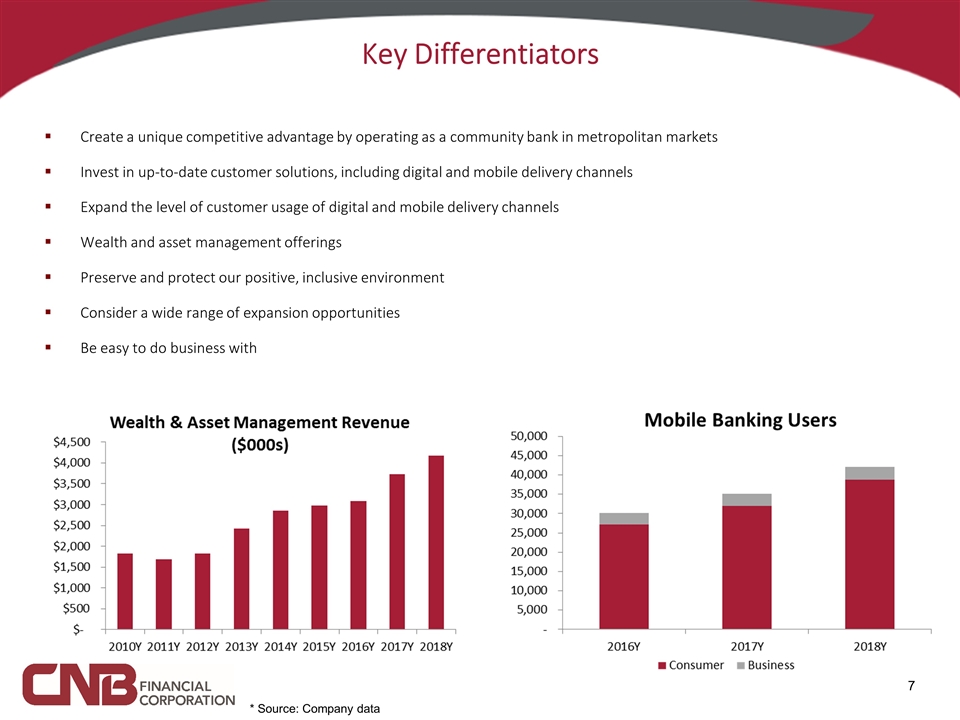
Key Differentiators Create a unique competitive advantage by operating as a community bank in metropolitan markets Invest in up-to-date customer solutions, including digital and mobile delivery channels Expand the level of customer usage of digital and mobile delivery channels Wealth and asset management offerings Preserve and protect our positive, inclusive environment Consider a wide range of expansion opportunities Be easy to do business with * Source: Company data
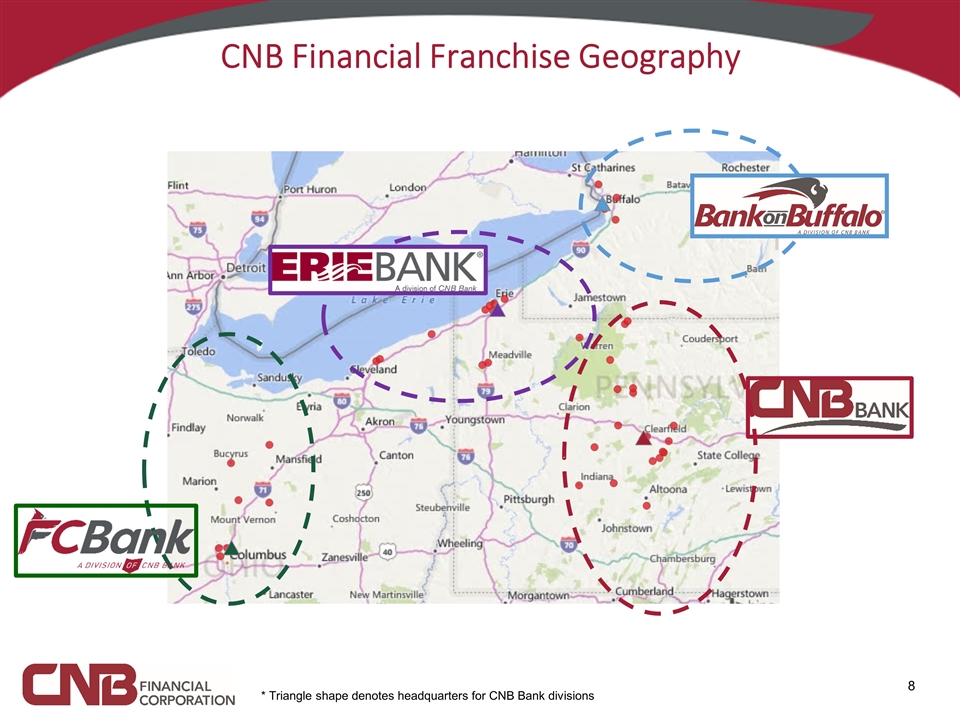
CNB Financial Franchise Geography * Triangle shape denotes headquarters for CNB Bank divisions
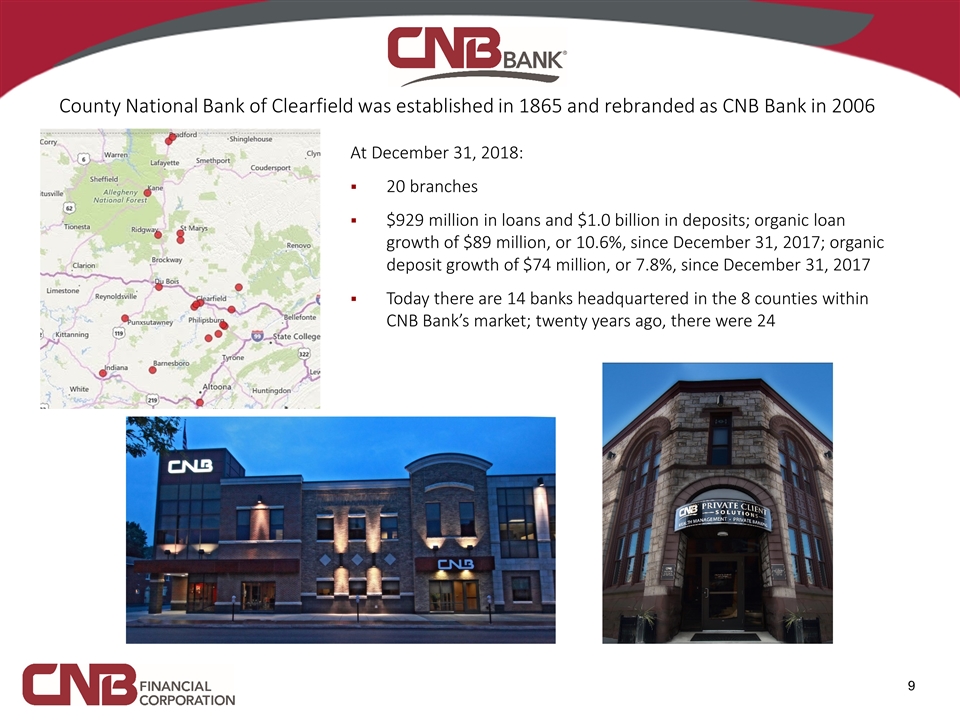
At December 31, 2018: 20 branches $929 million in loans and $1.0 billion in deposits; organic loan growth of $89 million, or 10.6%, since December 31, 2017; organic deposit growth of $74 million, or 7.8%, since December 31, 2017 Today there are 14 banks headquartered in the 8 counties within CNB Bank’s market; twenty years ago, there were 24 County National Bank of Clearfield was established in 1865 and rebranded as CNB Bank in 2006
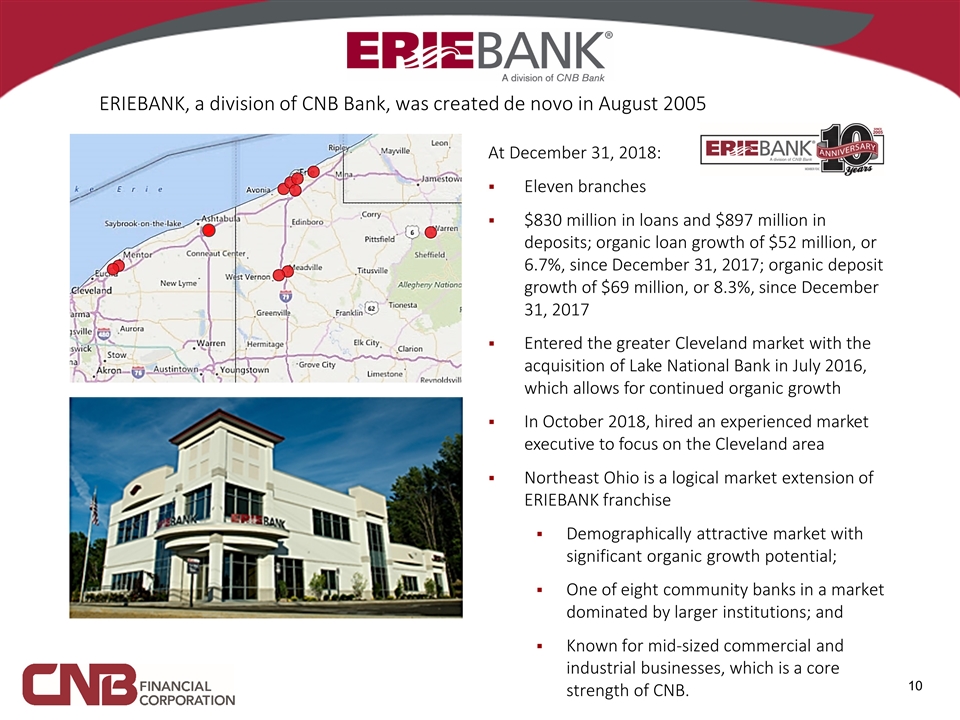
At December 31, 2018: Eleven branches $830 million in loans and $897 million in deposits; organic loan growth of $52 million, or 6.7%, since December 31, 2017; organic deposit growth of $69 million, or 8.3%, since December 31, 2017 Entered the greater Cleveland market with the acquisition of Lake National Bank in July 2016, which allows for continued organic growth In October 2018, hired an experienced market executive to focus on the Cleveland area Northeast Ohio is a logical market extension of ERIEBANK franchise Demographically attractive market with significant organic growth potential; One of eight community banks in a market dominated by larger institutions; and Known for mid-sized commercial and industrial businesses, which is a core strength of CNB. ERIEBANK, a division of CNB Bank, was created de novo in August 2005
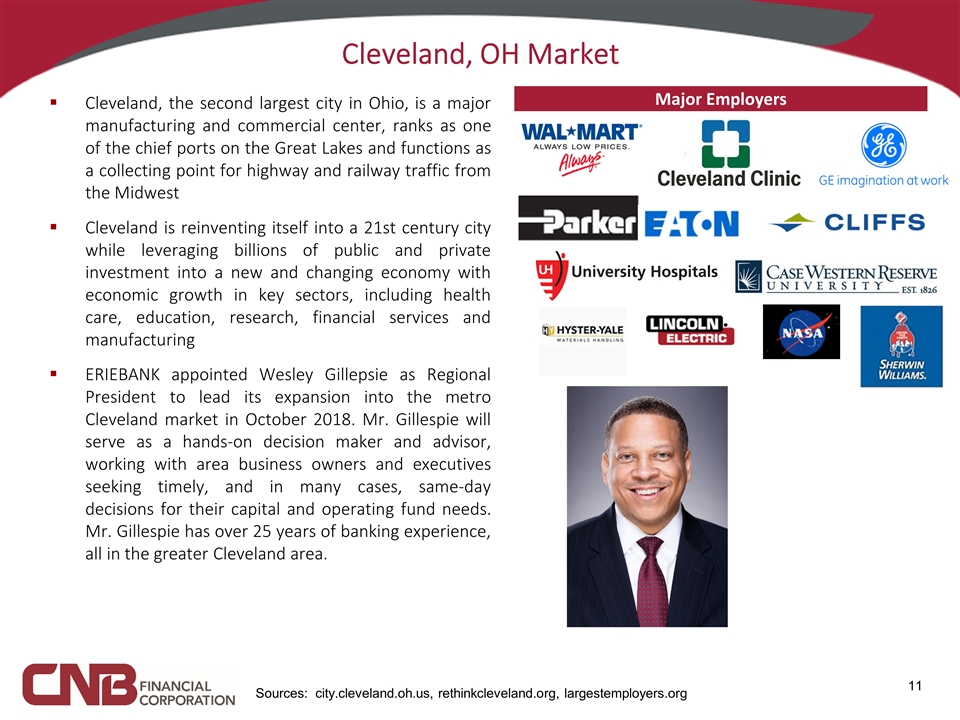
Cleveland, OH Market Sources: city.cleveland.oh.us, rethinkcleveland.org, largestemployers.org Cleveland, the second largest city in Ohio, is a major manufacturing and commercial center, ranks as one of the chief ports on the Great Lakes and functions as a collecting point for highway and railway traffic from the Midwest Cleveland is reinventing itself into a 21st century city while leveraging billions of public and private investment into a new and changing economy with economic growth in key sectors, including health care, education, research, financial services and manufacturing ERIEBANK appointed Wesley Gillepsie as Regional President to lead its expansion into the metro Cleveland market in October 2018. Mr. Gillespie will serve as a hands-on decision maker and advisor, working with area business owners and executives seeking timely, and in many cases, same-day decisions for their capital and operating fund needs. Mr. Gillespie has over 25 years of banking experience, all in the greater Cleveland area. Major Employers
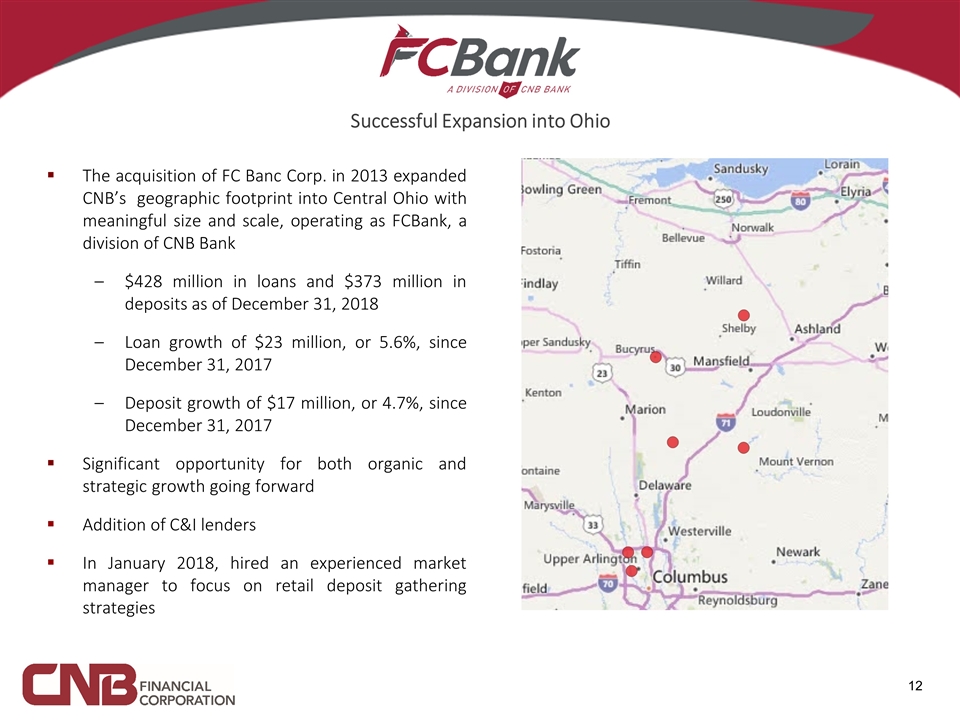
The acquisition of FC Banc Corp. in 2013 expanded CNB’s geographic footprint into Central Ohio with meaningful size and scale, operating as FCBank, a division of CNB Bank $428 million in loans and $373 million in deposits as of December 31, 2018 Loan growth of $23 million, or 5.6%, since December 31, 2017 Deposit growth of $17 million, or 4.7%, since December 31, 2017 Significant opportunity for both organic and strategic growth going forward Addition of C&I lenders In January 2018, hired an experienced market manager to focus on retail deposit gathering strategies Successful Expansion into Ohio
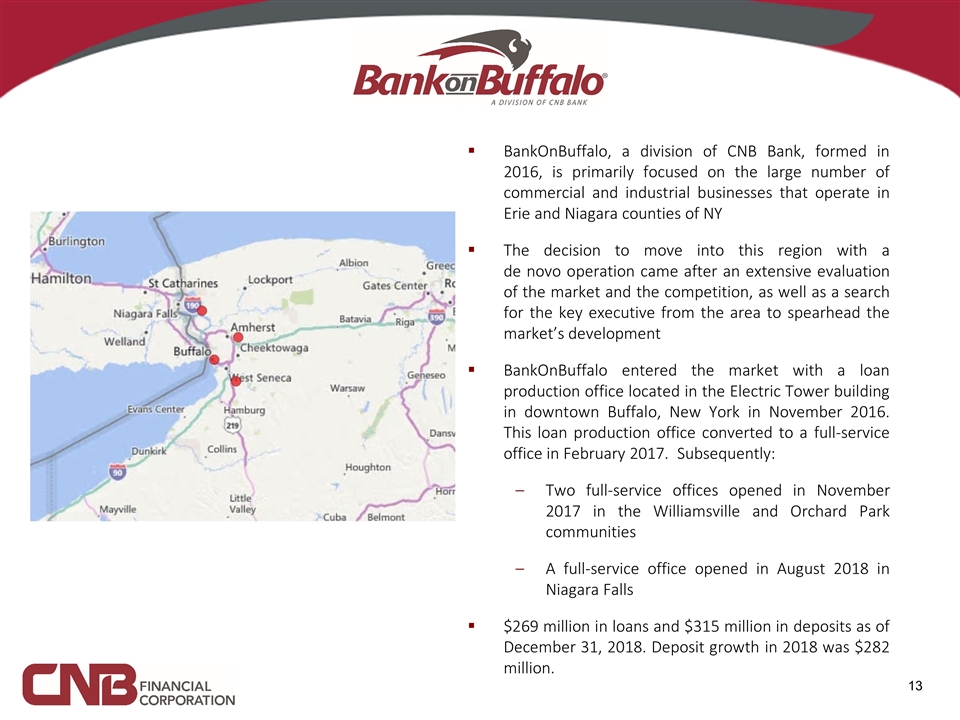
BankOnBuffalo, a division of CNB Bank, formed in 2016, is primarily focused on the large number of commercial and industrial businesses that operate in Erie and Niagara counties of NY The decision to move into this region with a de novo operation came after an extensive evaluation of the market and the competition, as well as a search for the key executive from the area to spearhead the market’s development BankOnBuffalo entered the market with a loan production office located in the Electric Tower building in downtown Buffalo, New York in November 2016. This loan production office converted to a full-service office in February 2017. Subsequently: Two full-service offices opened in November 2017 in the Williamsville and Orchard Park communities A full-service office opened in August 2018 in Niagara Falls $269 million in loans and $315 million in deposits as of December 31, 2018. Deposit growth in 2018 was $282 million.
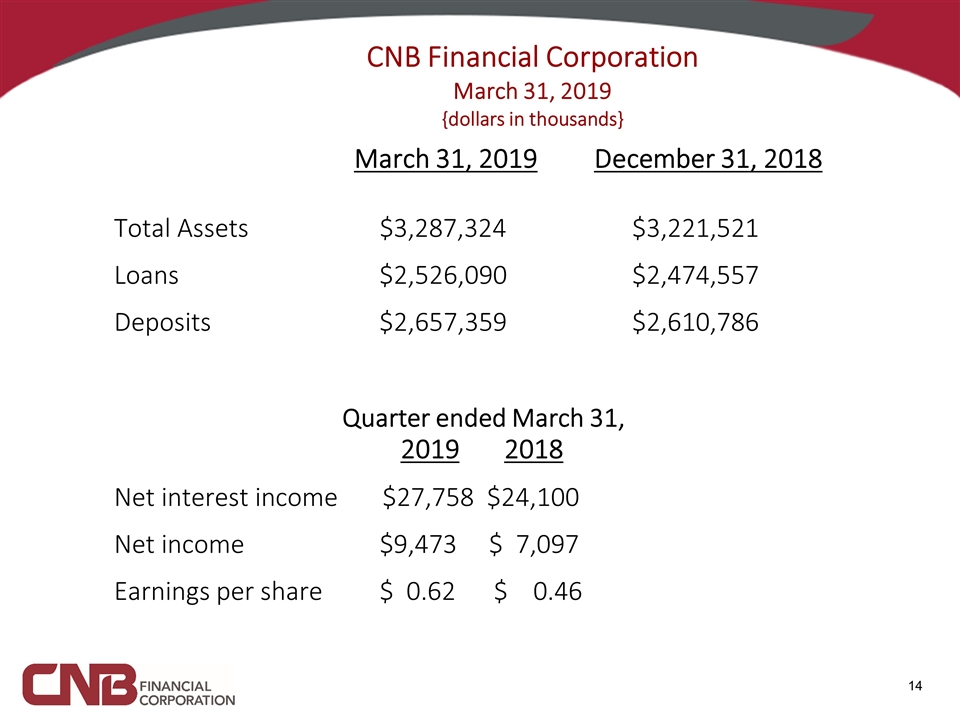
CNB Financial Corporation March 31, 2019 {dollars in thousands} March 31, 2019 December 31, 2018 Total Assets $3,287,324 $3,221,521 Loans $2,526,090 $2,474,557 Deposits $2,657,359 $2,610,786 Quarter ended March 31, 2019 2018 Net interest income $27,758 $24,100 Net income $9,473 $ 7,097 Earnings per share $ 0.62 $ 0.46

Annual Shareholder Meeting April 16, 2019


