
Annual Shareholder Meeting April 21, 2020 CNB Financial Corporation Financial Presentation & COVID-19 Pandemic Response April 21, 2020 Exhibit 99.1
Forward Looking Statements This press release includes forward-looking statements within the meaning of Section 27A of the Securities Act of 1933, as amended, and Section 21E of the Securities Exchange Act of 1934, as amended, with respect to CNB’s financial condition, liquidity, results of operations, future performance and business. These forward-looking statements are intended to be covered by the safe harbor for “forward-looking statements” provided by the Private Securities Litigation Reform Act of 1995. Forward-looking statements are those that are not historical facts. Forward-looking statements include statements with respect to beliefs, plans, objectives, goals, expectations, anticipations, estimates and intentions that are subject to significant risks and uncertainties and are subject to change based on various factors (some of which are beyond CNB’s control). Forward-looking statements often include the words “believes,” “expects,” “anticipates,” “estimates,” “forecasts,” “intends,” “plans,” “targets,” “potentially,” “probably,” “projects,” “outlook” or similar expressions or future conditional verbs such as “may,” “will,” “should,” “would” and “could.” CNB’s actual results may differ materially from those contemplated by the forward-looking statements, which are neither statements of historical fact nor guarantees or assurances of future performance. Such known and unknown risks, uncertainties and other factors that could cause the actual results to differ materially from the statements, include, but are not limited to, (i) the duration and scope of the COVID-19 pandemic and the local, national and global impact of COVID-19, (ii) actions governments, businesses and individuals take in response to the pandemic, (iii) the pace of recovery when the COVID-19 pandemic subsides, (iv) changes in general business, industry or economic conditions or competition; (v) changes in any applicable law, rule, regulation, policy, guideline or practice governing or affecting financial holding companies and their subsidiaries or with respect to tax or accounting principles or otherwise; (vi) adverse changes or conditions in capital and financial markets; (vii) changes in interest rates; (viii) higher than expected costs or other difficulties related to integration of combined or merged businesses; (ix) the effects of business combinations and other acquisition transactions, including the inability to realize our loan and investment portfolios; (x) changes in the quality or composition of our loan and investment portfolios; (xi) adequacy of loan loss reserves; (xii) increased competition; (xiii) loss of certain key officers; (xiv) deposit attrition; (xv) rapidly changing technology; (xvi) unanticipated regulatory or judicial proceedings and liabilities and other costs; (xvii) changes in the cost of funds, demand for loan products or demand for financial services; and (xviii) other economic, competitive, governmental or technological factors affecting our operations, markets, products, services and prices. Such developments could have an adverse impact on CNB's financial position and results of operations. For more information about factors that could cause actual results to differ from those discussed in the forward-looking statements, please refer to the “Risk Factors” and “Management’s Discussion and Analysis of Financial Condition and Results of Operations” sections of and the forward-looking statement disclaimers in CNB’s annual and quarterly reports. The forward-looking statements are based upon management’s beliefs and assumptions and are made as of the date of this press release. CNB undertakes no obligation to publicly update or revise any forward-looking statements included in this press release or to update the reasons why actual results could differ from those contained in such statements, whether as a result of new information, future events or otherwise, except to the extent required by law. In light of these risks, uncertainties and assumptions, the forward-looking events discussed in this press release might not occur and you should not put undue reliance on any forward-looking statements.
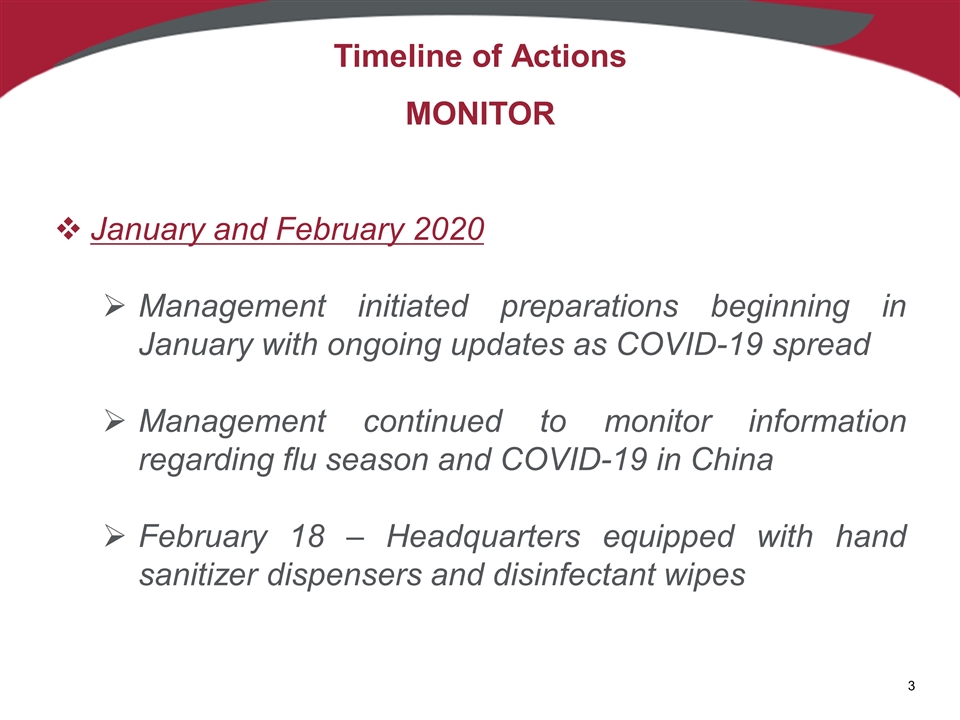
Timeline of Actions MONITOR January and February 2020 Management initiated preparations beginning in January with ongoing updates as COVID-19 spread Management continued to monitor information regarding flu season and COVID-19 in China February 18 – Headquarters equipped with hand sanitizer dispensers and disinfectant wipes
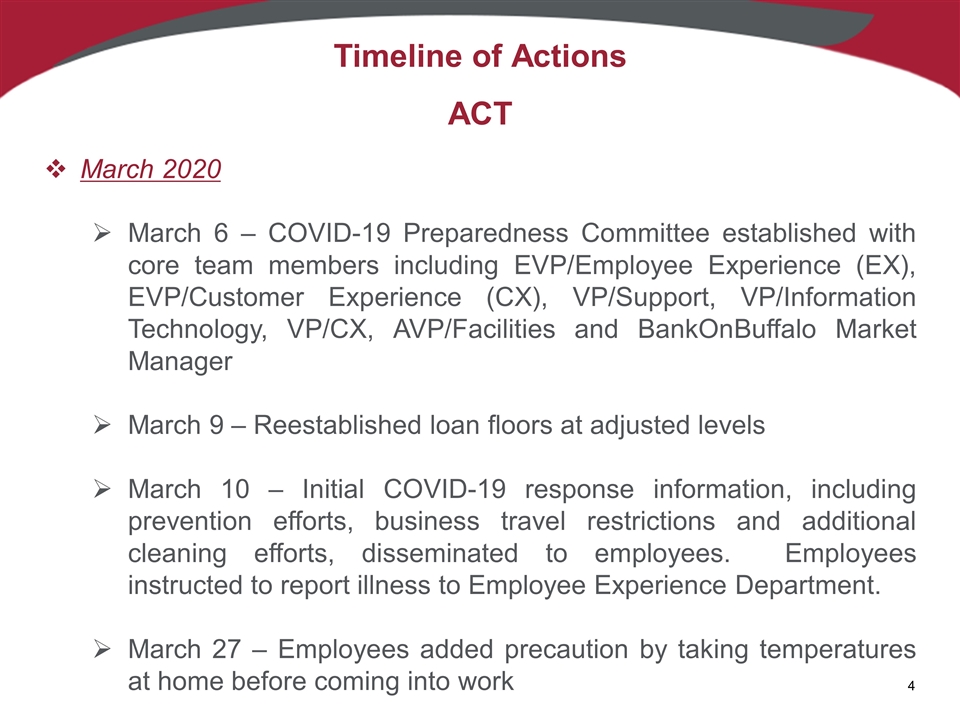
Timeline of Actions ACT March 2020 March 6 – COVID-19 Preparedness Committee established with core team members including EVP/Employee Experience (EX), EVP/Customer Experience (CX), VP/Support, VP/Information Technology, VP/CX, AVP/Facilities and BankOnBuffalo Market Manager March 9 – Reestablished loan floors at adjusted levels March 10 – Initial COVID-19 response information, including prevention efforts, business travel restrictions and additional cleaning efforts, disseminated to employees. Employees instructed to report illness to Employee Experience Department. March 27 – Employees added precaution by taking temperatures at home before coming into work
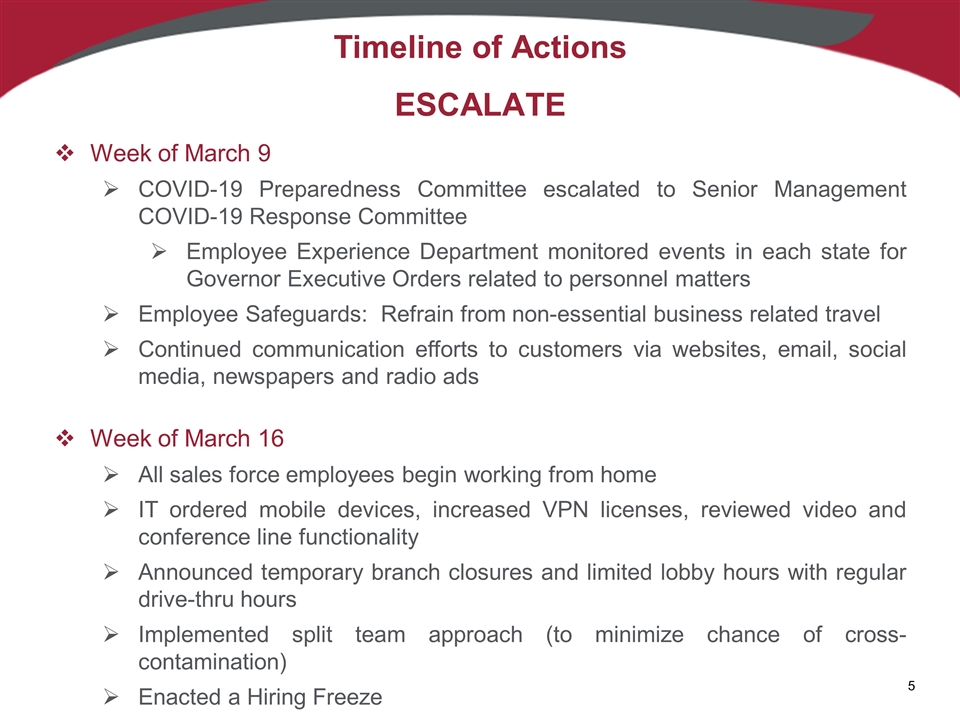
Timeline of Actions ESCALATE Week of March 9 COVID-19 Preparedness Committee escalated to Senior Management COVID-19 Response Committee Employee Experience Department monitored events in each state for Governor Executive Orders related to personnel matters Employee Safeguards: Refrain from non-essential business related travel Continued communication efforts to customers via websites, email, social media, newspapers and radio ads Week of March 16 All sales force employees begin working from home IT ordered mobile devices, increased VPN licenses, reviewed video and conference line functionality Announced temporary branch closures and limited lobby hours with regular drive-thru hours Implemented split team approach (to minimize chance of cross-contamination) Enacted a Hiring Freeze
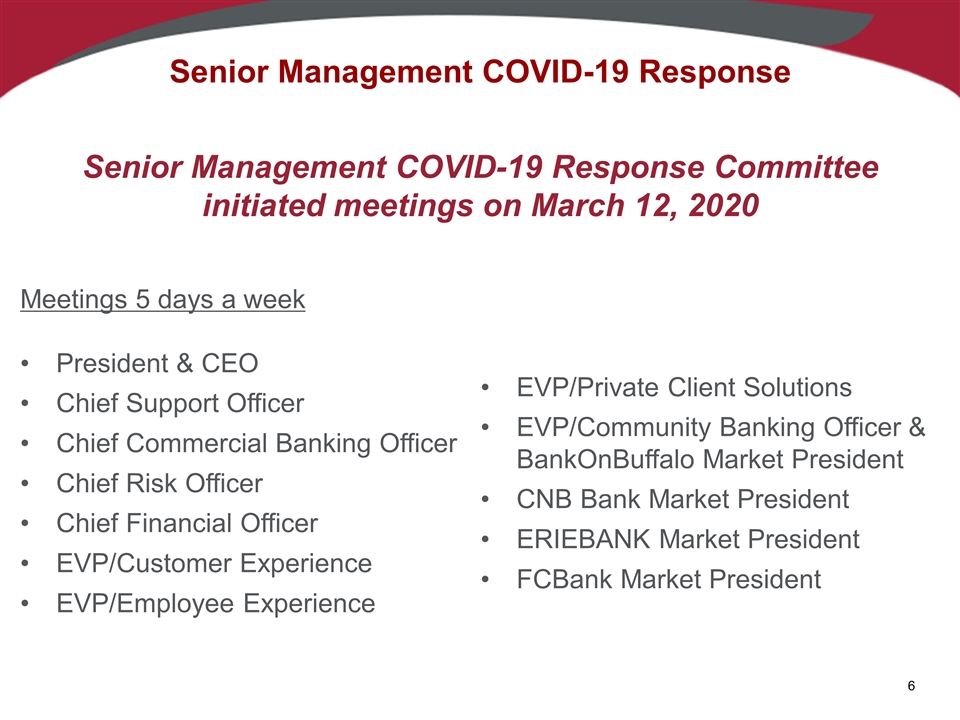
Senior Management COVID-19 Response Meetings 5 days a week President & CEO Chief Support Officer Chief Commercial Banking Officer Chief Risk Officer Chief Financial Officer EVP/Customer Experience EVP/Employee Experience EVP/Private Client Solutions EVP/Community Banking Officer & BankOnBuffalo Market President CNB Bank Market President ERIEBANK Market President FCBank Market President Senior Management COVID-19 Response Committee initiated meetings on March 12, 2020
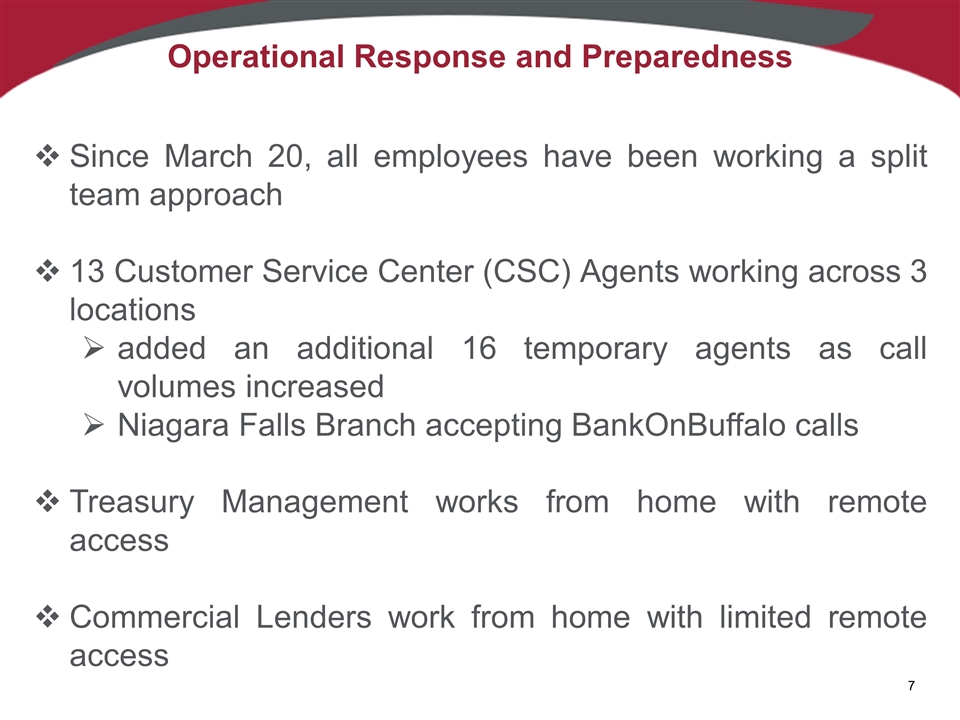
Operational Response and Preparedness Since March 20, all employees have been working a split team approach 13 Customer Service Center (CSC) Agents working across 3 locations added an additional 16 temporary agents as call volumes increased Niagara Falls Branch accepting BankOnBuffalo calls Treasury Management works from home with remote access Commercial Lenders work from home with limited remote access
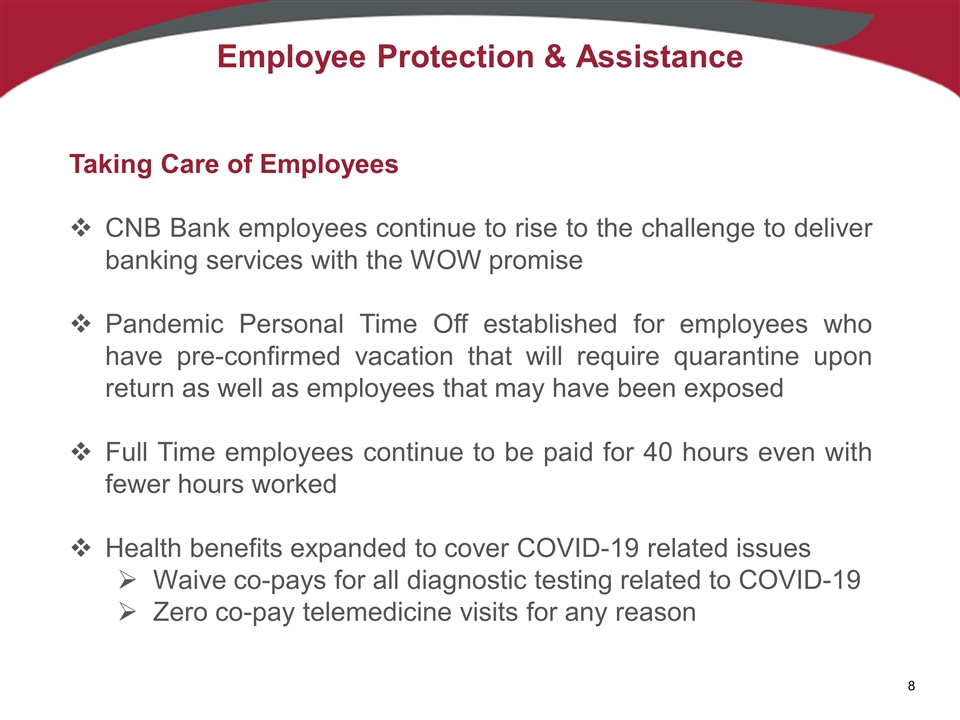
Employee Protection & Assistance Taking Care of Employees CNB Bank employees continue to rise to the challenge to deliver banking services with the WOW promise Pandemic Personal Time Off established for employees who have pre-confirmed vacation that will require quarantine upon return as well as employees that may have been exposed Full Time employees continue to be paid for 40 hours even with fewer hours worked Health benefits expanded to cover COVID-19 related issues Waive co-pays for all diagnostic testing related to COVID-19 Zero co-pay telemedicine visits for any reason
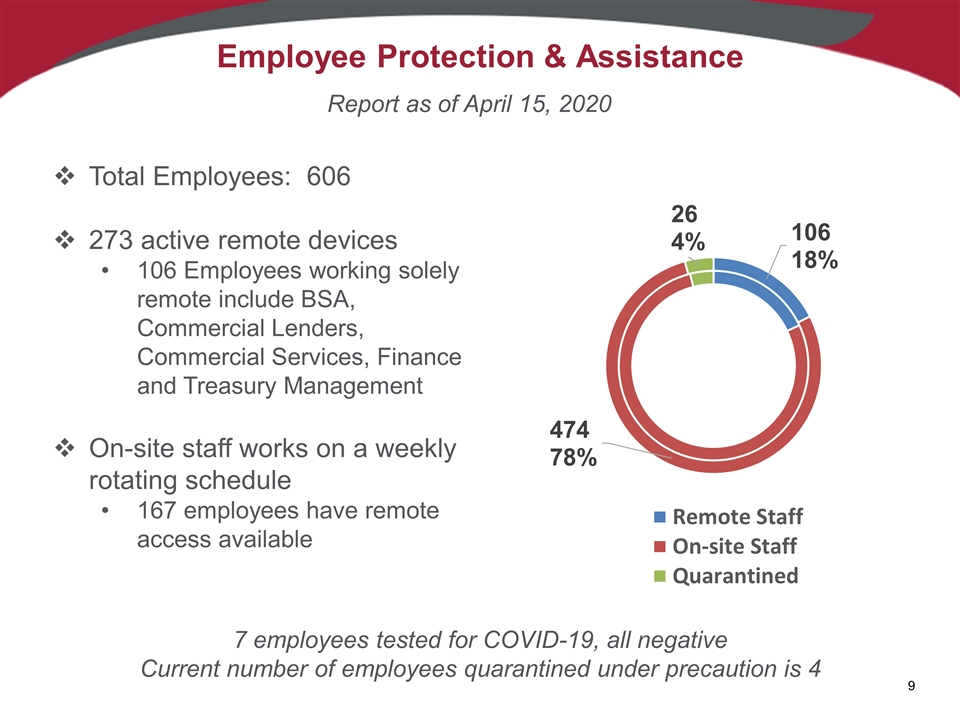
Employee Protection & Assistance Total Employees: 606 273 active remote devices 106 Employees working solely remote include BSA, Commercial Lenders, Commercial Services, Finance and Treasury Management On-site staff works on a weekly rotating schedule 167 employees have remote access available Report as of April 15, 2020 7 employees tested for COVID-19, all negative Current number of employees quarantined under precaution is 4
Employee Reaction to Pandemic Response Employee reaction has been positive to Management’s leadership through the COVID-19 Pandemic: “CNB has been taking care of its employees in an amazing way. Thanks for all you are doing.” “Thank you Senior Management and EX for everything you have been doing to keep us working. It is a serious relief knowing I will still be paid. The rotating schedule is brilliant.” “I wanted to thank the entire Management Team for your hard work and commitment to your employees. Continuing to work has provided a sense of normalcy in our lives, as well as relieving the potential stress of financial burdens.” “Thank you for the leadership through these times and everything Management does to keep our employees safe and working. There is no better team to work for, and I am very proud to be part of this great team.”
Programs to Support Clients and Communities In March, CNB Bank established Borrower Relief Programs to provide relief for our business clients and mortgage customers. These programs require Bank approval and must be requested by the customer.* Commercial businesses impacted due to COVID-19 Full deferral of loan payments for up to 6 months Interest-only loan payments for up to 6 months Residential and consumer loan customers impacted by COVID-19 Deferral of loan payments for up to 3 months without a fee Credit Cards Full deferral of payments on a month to month basis *CNB proactively reached out to the Hospitality Industry as soon as the shut down occurred.
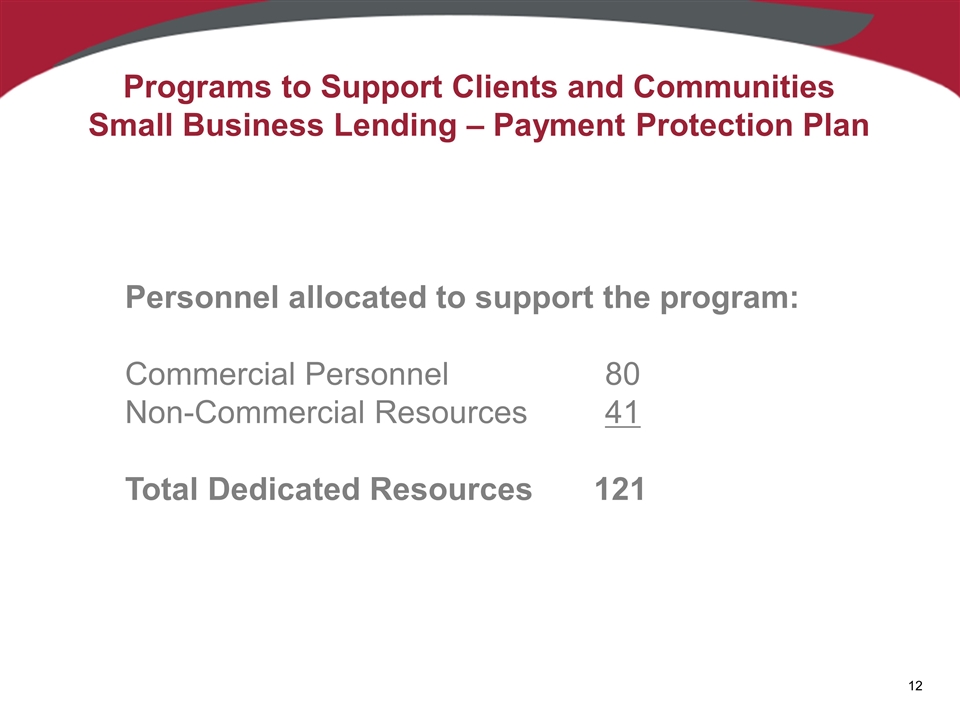
Programs to Support Clients and Communities Small Business Lending – Payment Protection Plan Personnel allocated to support the program: Commercial Personnel80 Non-Commercial Resources 41 Total Dedicated Resources121
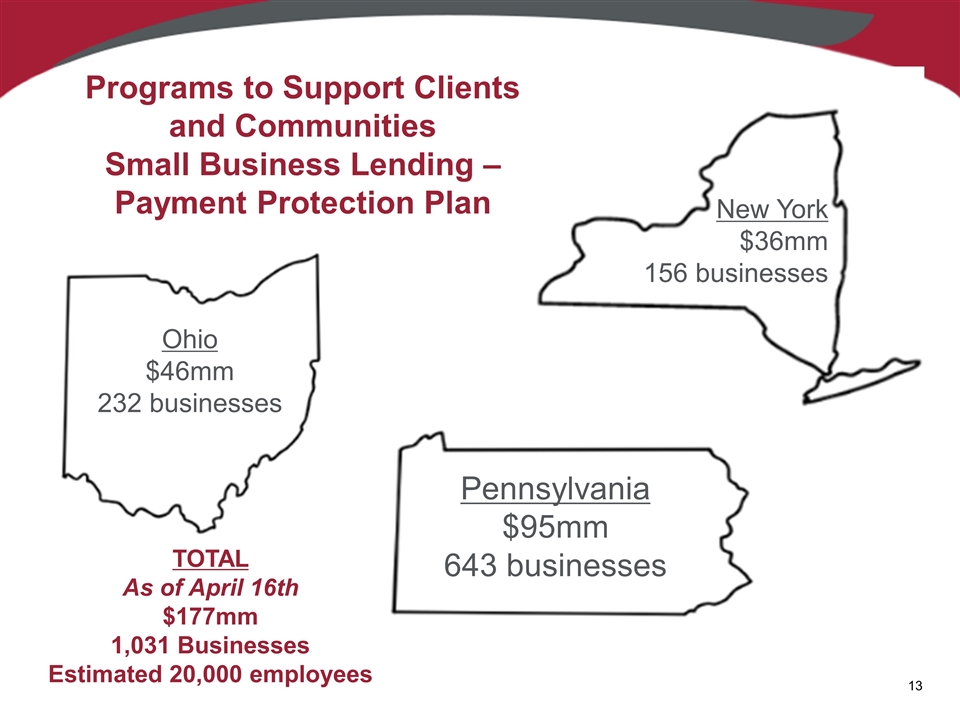
Programs to Support Clients and Communities Small Business Lending – Payment Protection Plan Ohio $46mm 232 businesses Pennsylvania $95mm 643 businesses New York $36mm 156 businesses TOTAL As of April 16th $177mm 1,031 Businesses Estimated 20,000 employees
Branch Delivery Changes Effective March 21 Lobby by appointment only Drive-thru hours remain intact and fully operational Branch staff divided 50/50 to limit exposure Temporarily closed five offices and directed customers to nearby branches Effective March 23 - Emergency Cash Protocol Increased physical cash inventory at select strategic locations and ATMs Daily monitoring of cash activities and vault balances to maintain sufficient supply Managed overall liquidity at a more robust level, as a result of successful growth at year-end 2019 Implemented daily tracking of overall Bank excess liquidity
Branch Delivery Changes Effective April 8 Transaction counts decline and Customer Service Call Center activity significantly increases Temporarily closed three additional offices to deploy staff to assist as Call Center resources
Additional Customer Considerations Foreign ATM cash withdrawal fees are waived Waive fees for customers directly impacted by COVID-19 related financial hardship, upon request Late payment fees Overdraft fees Early CD withdrawal penalties Increased credit card, line of credit, remote deposit and mobile deposit limits upon request
Community Outreach Efforts BankOnBuffalo Community Niagara Falls, NY employees reach out to senior customers as someone to talk to, show kindness and compassion. $7,500 donation to FeedMore WNY - local Foodbank and Meals on Wheels Organization that supports 4 counties of Western New York $2,500 donation to Akron, NY/Newstead Food Pantry - services over 120 underprivileged rural families each month with food and groceries ERIEBANK Community $5,000 donation to Erie Community Foundation’s COVID-19 Rapid Response Fund in Pennsylvania $1,500 donation to Shoes and Clothes for Kids in Cleveland, OH ERIEBANK employees contributed lunch to the employees of the Meadville Medical Center and Crawford County Government in Pennsylvania
Community Outreach Efforts FCBank Community FCBank President, Jenny Saunders, and experts from Private Banking, Treasury Services and Commercial Banking partnered and hosted Zoom meetings with Old Worthington Partnership, Morrow County Chamber of Commerce and Worthington Chamber of Commerce to provide education to the community on Business Relief Strategies enabled by the CARES Act, including PPP and EIDL, available Remote Business Services, Mortgage refinance options and FDIC Insurance.
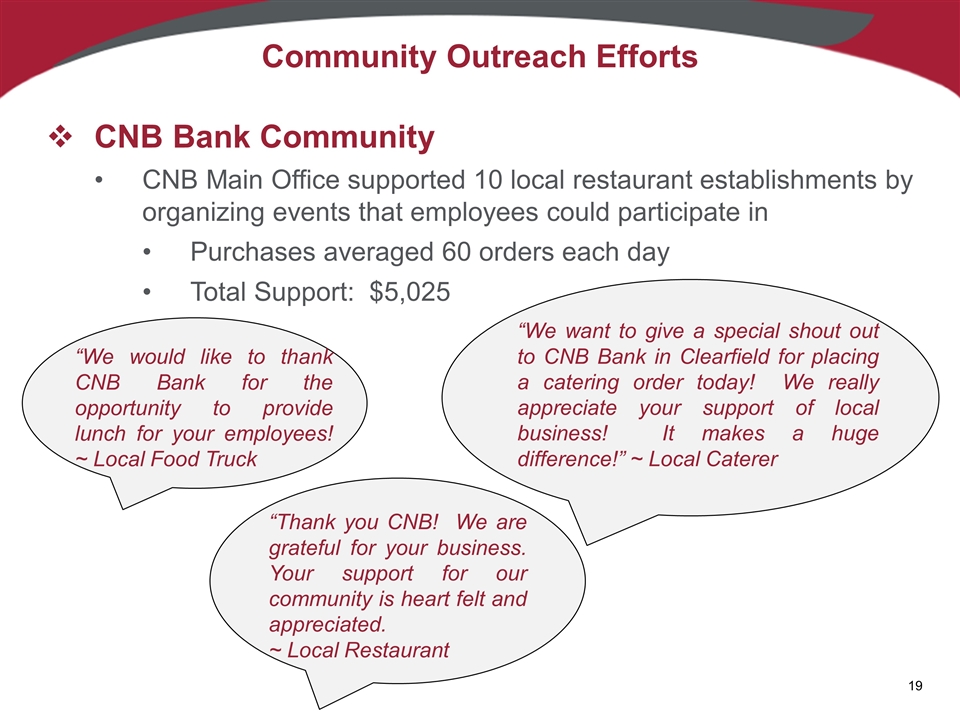
Community Outreach Efforts CNB Bank Community CNB Main Office supported 10 local restaurant establishments by organizing events that employees could participate in Purchases averaged 60 orders each day Total Support: $5,025 “We want to give a special shout out to CNB Bank in Clearfield for placing a catering order today! We really appreciate your support of local business! It makes a huge difference!” ~ Local Caterer “We would like to thank CNB Bank for the opportunity to provide lunch for your employees! ~ Local Food Truck “Thank you CNB! We are grateful for your business. Your support for our community is heart felt and appreciated. ~ Local Restaurant
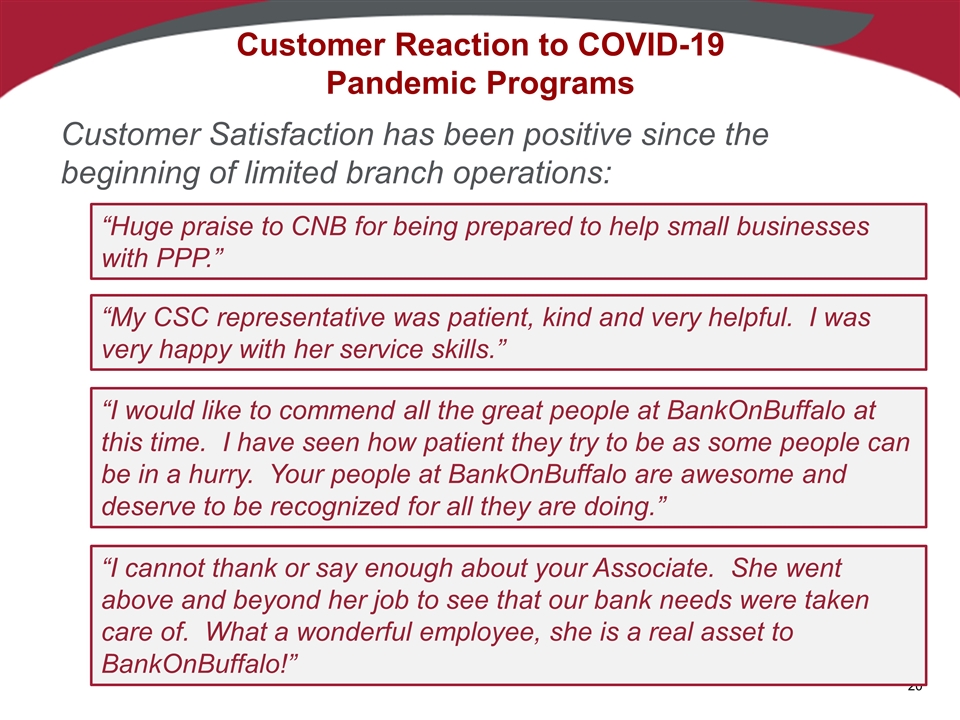
Customer Reaction to COVID-19 Pandemic Programs Customer Satisfaction has been positive since the beginning of limited branch operations: “Huge praise to CNB for being prepared to help small businesses with PPP.” “My CSC representative was patient, kind and very helpful. I was very happy with her service skills.” “I would like to commend all the great people at BankOnBuffalo at this time. I have seen how patient they try to be as some people can be in a hurry. Your people at BankOnBuffalo are awesome and deserve to be recognized for all they are doing.” “I cannot thank or say enough about your Associate. She went above and beyond her job to see that our bank needs were taken care of. What a wonderful employee, she is a real asset to BankOnBuffalo!”
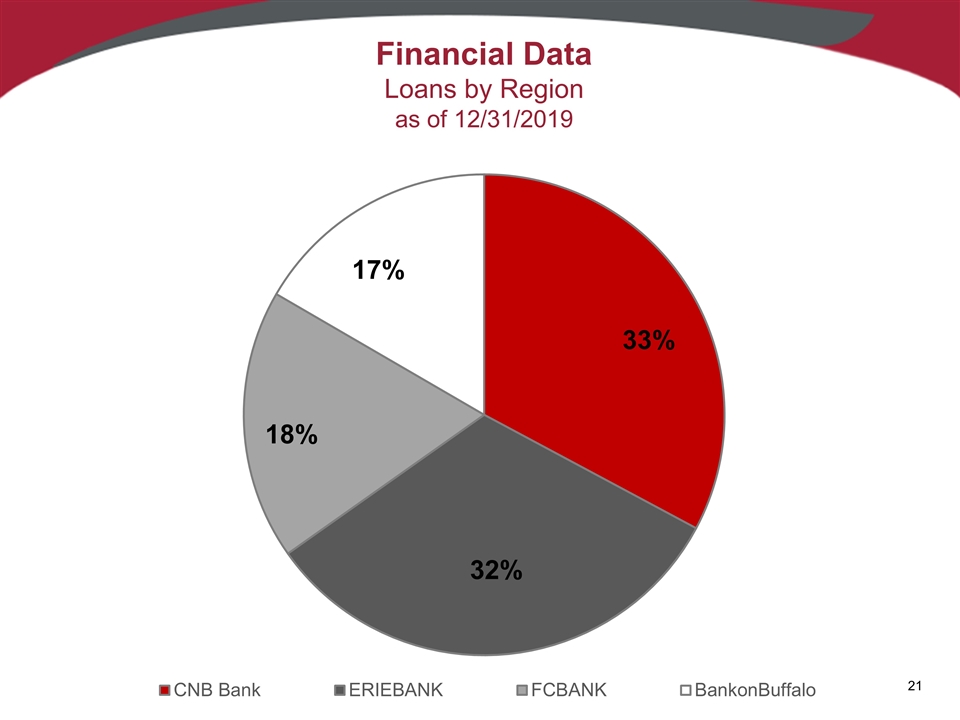
Financial Data Loans by Region as of 12/31/2019
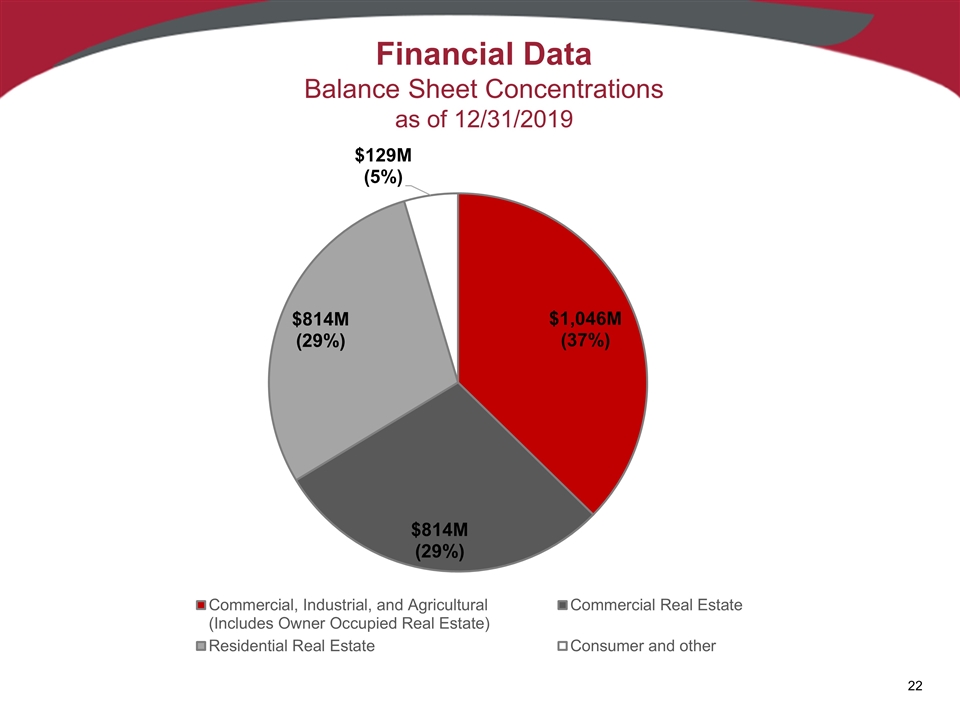
Financial Data Balance Sheet Concentrations as of 12/31/2019
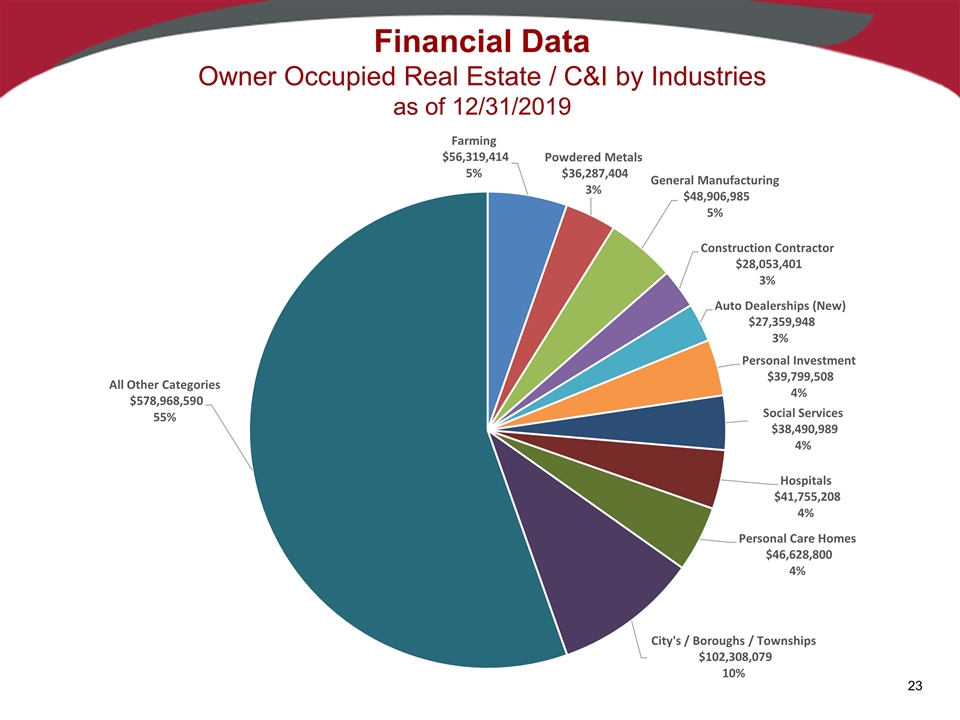
Financial Data Owner Occupied Real Estate / C&I by Industries as of 12/31/2019
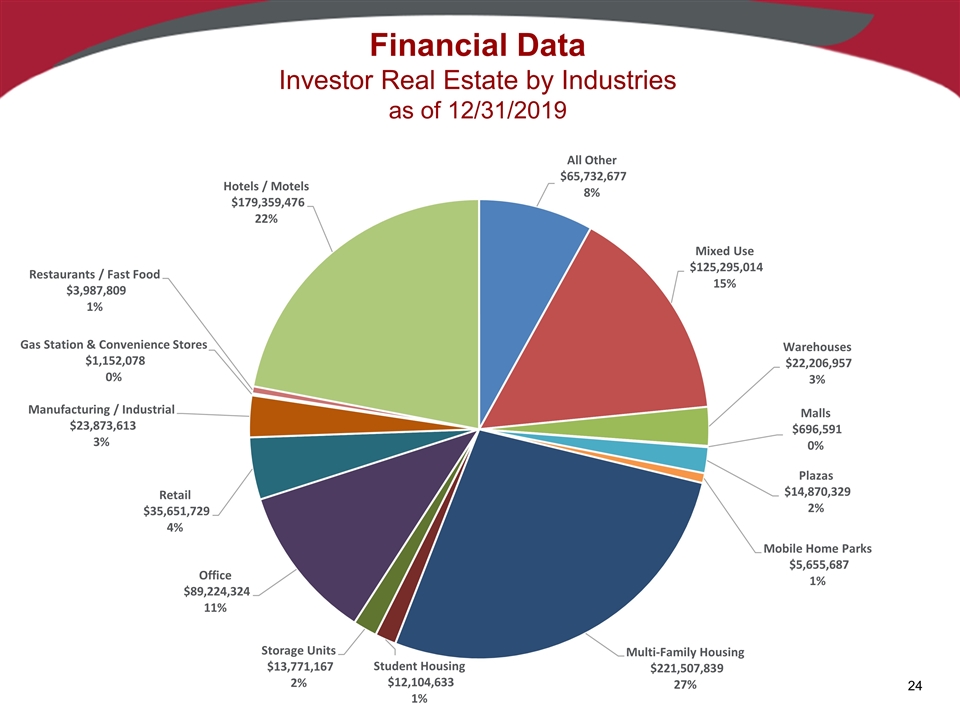
Financial Data Investor Real Estate by Industries as of 12/31/2019
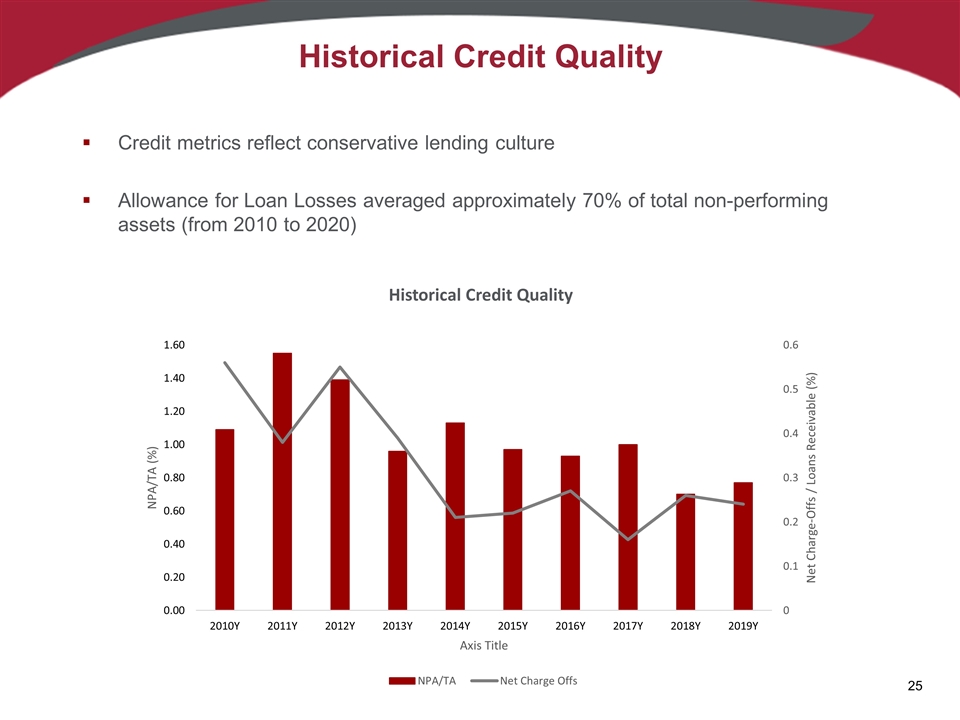
Historical Credit Quality Credit metrics reflect conservative lending culture Allowance for Loan Losses averaged approximately 70% of total non-performing assets (from 2010 to 2020)
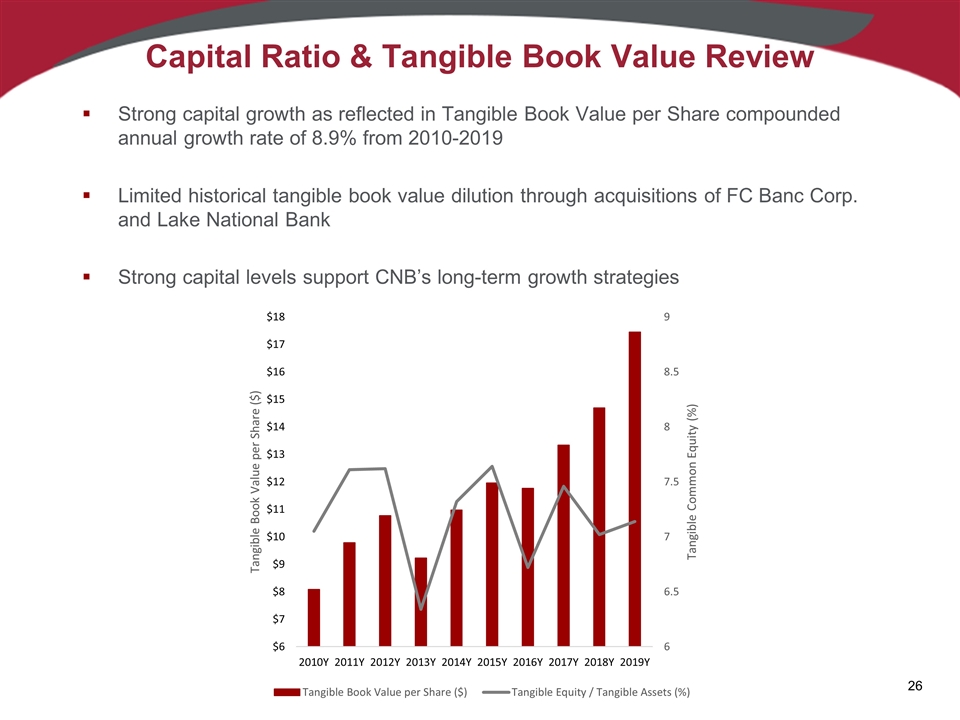
Capital Ratio & Tangible Book Value Review Strong capital growth as reflected in Tangible Book Value per Share compounded annual growth rate of 8.9% from 2010-2019 Limited historical tangible book value dilution through acquisitions of FC Banc Corp. and Lake National Bank Strong capital levels support CNB’s long-term growth strategies
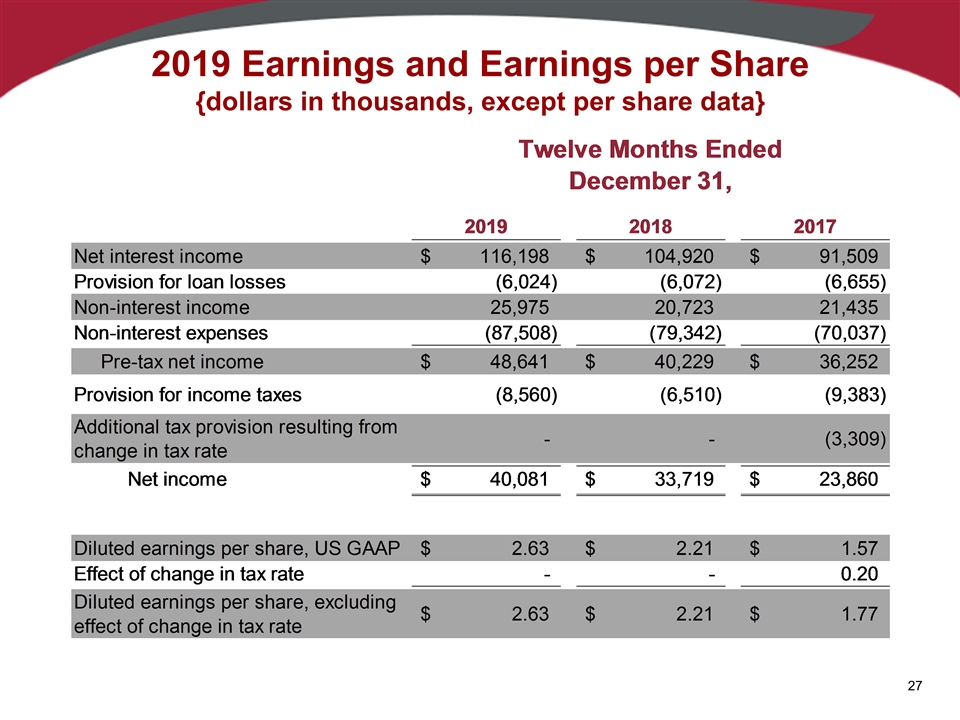
2019 Earnings and Earnings per Share {dollars in thousands, except per share data} 2019 Earnings and Earnings Per Share Twelve Months Ended December 31, 2019 2018 2017 2019 2018 2017 Net interest income $,116,198 $,104,920 $91,509 Net interest income 116198 104920 91509 Provision for loan losses -6,024 -6,072 -6,655 Provision for loan losses -6024 -6072 -6655 Non-interest income 25,975 20,723 21,435 Non-interest income 25975 20723 21435 Non-interest expenses ,-87,508 ,-79,342 ,-70,037 Non-interest expense -87508 -79342 -70037 Pre-tax net income $48,641 $40,229 $36,252 Pre-tax net income 48641 40229 36252 Provision for income taxes -8,560 -6,510 -9,383 Provision for income taxes -8560 -6510 -9383 Additional tax provision resulting from change in tax rate 0 0 -3,309 Additional tax provision resulting from Net income $40,081 $33,719 $23,860 change in tax rate 0 0 -3009 Net Income 40081 33719 23860 Diluted earnings per share, US GAAP $2.63 $2.21 $1.57 Effect of change in tax rate 0 0 0.2 Diluted earnings per share, US GAAP 2.63 2.21 1.57 Diluted earnings per share, excluding effect of change in tax rate $2.63 $2.21 $1.77 Effect of change in tax rate . Diluted earnings per share, excluding 0 0 0.2 Effect of change in tax rate 2.63 2.21 1.77 CNB Financial Corporation (dollars in thousands) $43,921 $43,830 Total Assets $3,779,138 $3,763,659 Loans 2,850,660 2,804,035 Deposits 3,100,216 3,102,327 Quarter Ended March 31, 2020 2019 Net interest income $29,994 $27,758 Net income 8,813 9,473 Earnings per share $0.56999999999999995 $0.62 Wealth and Asset Management Income 2019 4579 (in thousands) Ratios 2019 CET1 Ratio 9.32 Leverage Ratio 7.86 Total Risk-based ratio 12.51
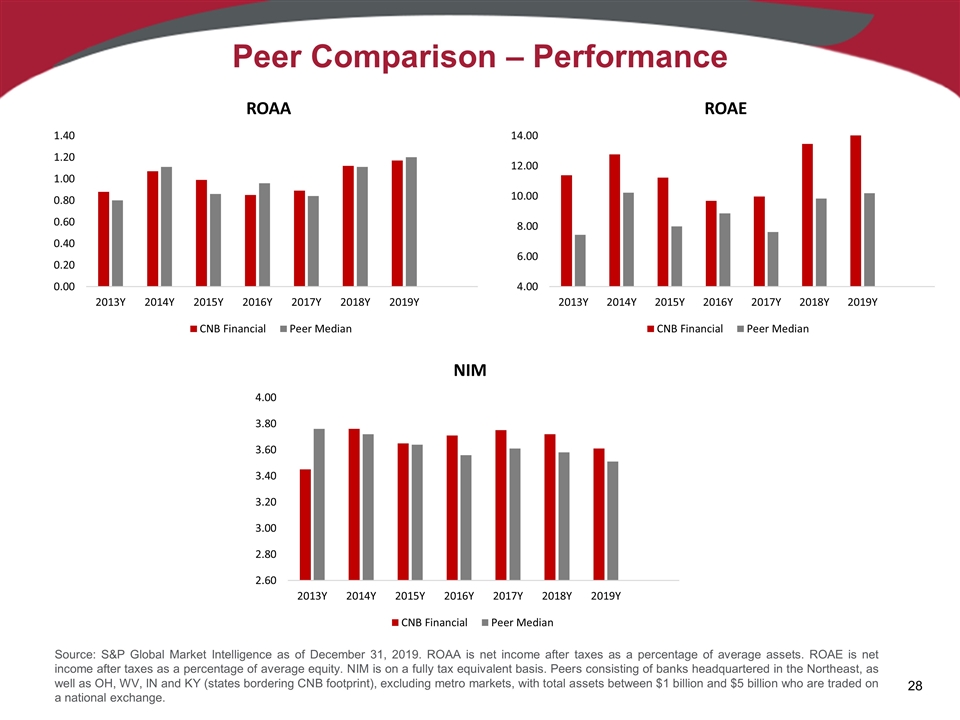
Peer Comparison – Performance Source: S&P Global Market Intelligence as of December 31, 2019. ROAA is net income after taxes as a percentage of average assets. ROAE is net income after taxes as a percentage of average equity. NIM is on a fully tax equivalent basis. Peers consisting of banks headquartered in the Northeast, as well as OH, WV, IN and KY (states bordering CNB footprint), excluding metro markets, with total assets between $1 billion and $5 billion who are traded on a national exchange.
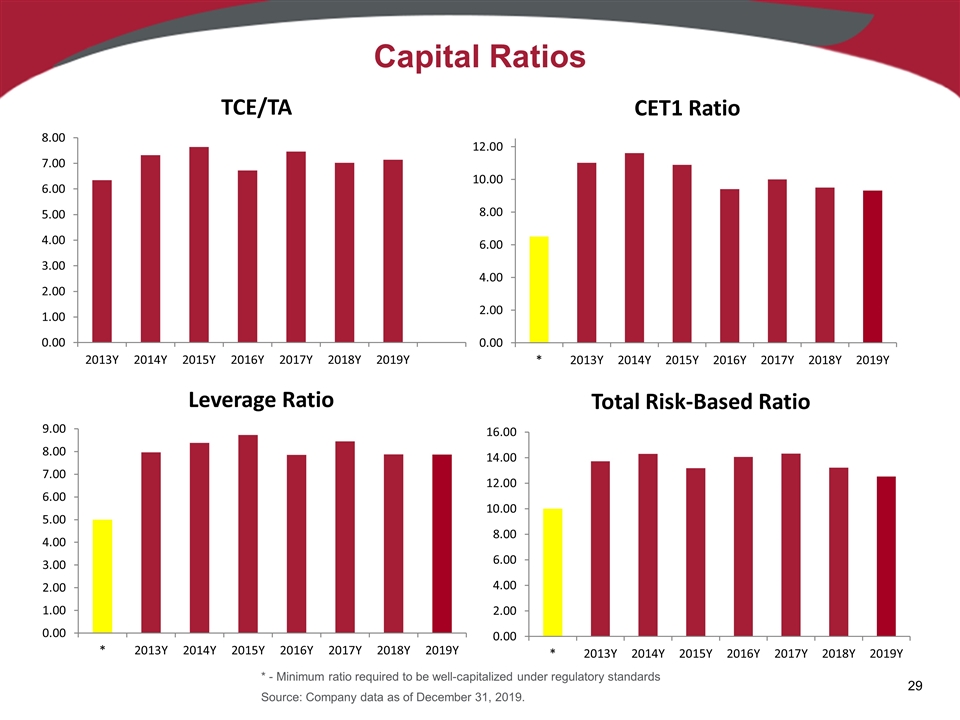
Capital Ratios Source: Company data as of December 31, 2019. * - Minimum ratio required to be well-capitalized under regulatory standards
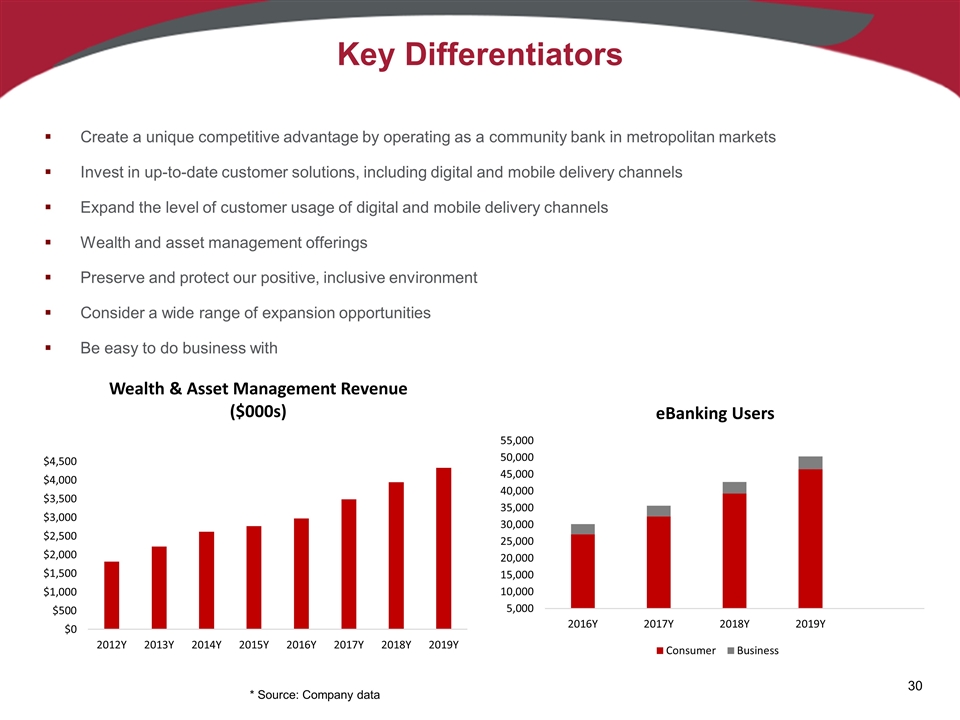
Key Differentiators Create a unique competitive advantage by operating as a community bank in metropolitan markets Invest in up-to-date customer solutions, including digital and mobile delivery channels Expand the level of customer usage of digital and mobile delivery channels Wealth and asset management offerings Preserve and protect our positive, inclusive environment Consider a wide range of expansion opportunities Be easy to do business with * Source: Company data
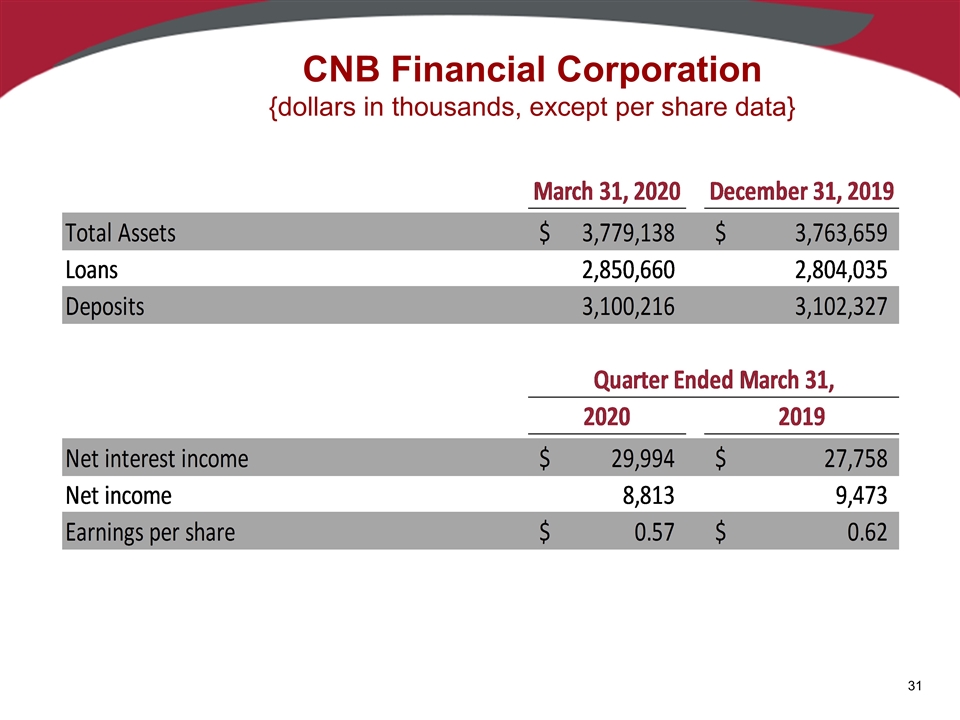
CNB Financial Corporation {dollars in thousands, except per share data} 2019 Earnings and Earnings Per Share Year Ended December 31, 2019 2018 2017 2019 2018 2017 Net interest income $,116,198 $,104,920 $91,509 Net interest income 116198 104920 91509 Provision for loan losses -6024 -6072 -6655 Provision for loan losses -6024 -6072 -6655 Non-interest income 25975 20723 21435 Non-interest income 25975 20723 21435 Non-interest expenses -87508 -79342 -70037 Non-interest expense -87508 -79342 -70037 Pre-tax net income 48641 40229 36252 Pre-tax net income 48641 40229 36252 Provision for income taxes -8560 -6510 -9383 Provision for income taxes -8560 -6510 -9383 Additional tax provision resulting from change in tax rate 0 0 -3309 Additional tax provision resulting from Net income $40,081 $33,719 $23,860 change in tax rate 0 0 -3009 Net Income 40081 33719 23860 Diluted earnings per share, US GAAP $2.63 $2.21 $1.57 Effect of change in tax rate 0 0 0.2 Diluted earnings per share, US GAAP 2.63 2.21 1.57 Diluted earnings per share, excluding effect of change in tax rate $2.63 $2.21 $1.77 Effect of change in tax rate . Diluted earnings per share, excluding 0 0 0.2 Effect of change in tax rate 2.63 2.21 1.77 CNB Financial Corporation (dollars in thousands) $43,921 $43,830 Total Assets $3,779,138 $3,763,659 Loans 2,850,660 2,804,035 Deposits 3,100,216 3,102,327 Quarter Ended March 31, 2020 2019 Net interest income $29,994 $27,758 Net income 8,813 9,473 Earnings per share $0.56999999999999995 $0.62 Wealth and Asset Management Income 2019 4579 (in thousands) Ratios 2019 CET1 Ratio 9.32 Leverage Ratio 7.86 Total Risk-based ratio 12.51
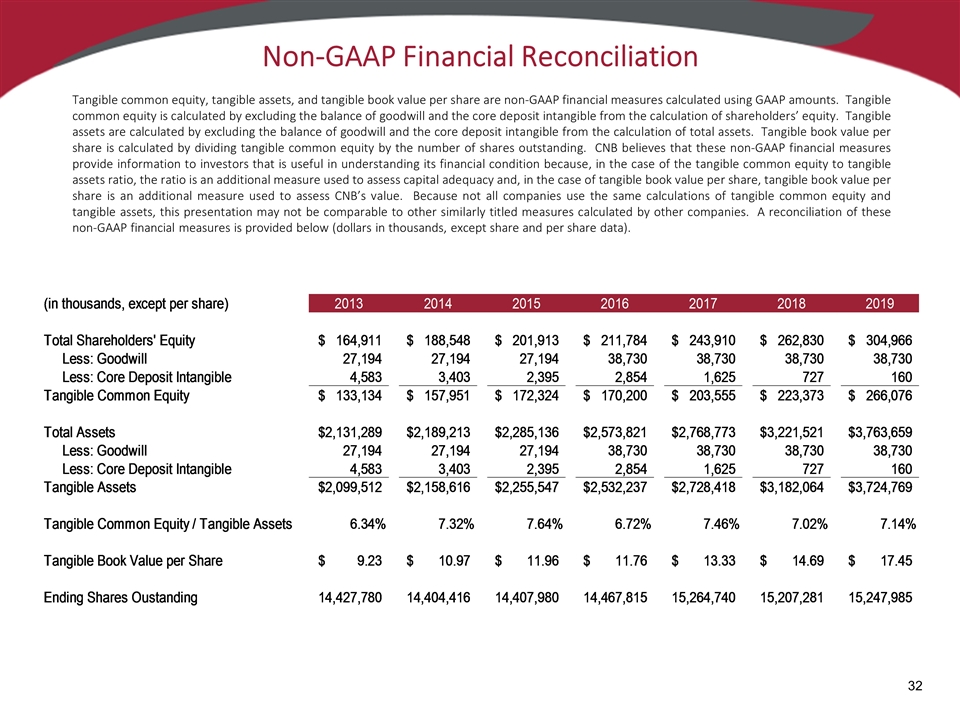
Non-GAAP Financial Reconciliation Tangible common equity, tangible assets, and tangible book value per share are non-GAAP financial measures calculated using GAAP amounts. Tangible common equity is calculated by excluding the balance of goodwill and the core deposit intangible from the calculation of shareholders’ equity. Tangible assets are calculated by excluding the balance of goodwill and the core deposit intangible from the calculation of total assets. Tangible book value per share is calculated by dividing tangible common equity by the number of shares outstanding. CNB believes that these non-GAAP financial measures provide information to investors that is useful in understanding its financial condition because, in the case of the tangible common equity to tangible assets ratio, the ratio is an additional measure used to assess capital adequacy and, in the case of tangible book value per share, tangible book value per share is an additional measure used to assess CNB’s value. Because not all companies use the same calculations of tangible common equity and tangible assets, this presentation may not be comparable to other similarly titled measures calculated by other companies. A reconciliation of these non-GAAP financial measures is provided below (dollars in thousands, except share and per share data). (in thousands, except per share) 2013 2014 2015 2016 2017 2018 2019 Total Shareholders' Equity $,164,911 $,188,548 $,201,913 $,211,784 $,243,910 $,262,830 $,304,966 Less: Goodwill 27194 27194 27194 38730 38730 38730 38730 Less: Core Deposit Intangible 4583 3403 2395 2854 1625 727 160 Tangible Common Equity $,133,134 $,157,951 $,172,324 $,170,200 $,203,555 $,223,373 $,266,076 Total Assets $2,131,289 $2,189,213 $2,285,136 $2,573,821 $2,768,773 $3,221,521 $3,763,659 Less: Goodwill 27194 27194 27194 38730 38730 38730 38730 Less: Core Deposit Intangible 4583 3403 2395 2854 1625 727 160 Tangible Assets $2,099,512 $2,158,616 $2,255,547 $2,532,237 $2,728,418 $3,182,064 $3,724,769 Tangible Common Equity / Tangible Assets 6.3411878569877192E-2 7.3172347467080762E-2 7.6400092749120282E-2 6.721329796539581E-2 7.4605503995355552E-2 7.0197519597343105E-2 7.1434228538736225E-2 Tangible Book Value per Share $9.2276150592814705 $10.965456704388432 $11.960316435752965 $11.764043153717408 $13.334979829332173 $14.688556093623836 $17.449912234305057 Ending Shares Oustanding 14427780 14404416 14407980 14467815 15264740 15207281 15247985

April 21, 2020


