
84 87 90 164 30 52 230 228 229 Discussion Materials Investor Presentation DECEMBER 3, 2020 164 30 52 164 30 52 164 30 52 Exhibit 99.1
Certain Important information CAUTION REGARDING FORWARD LOOKING STATEMENTS This presentation contains forward-looking statements within the meaning of the Private Securities Litigation Reform Act of 1995 that relate to future events or the future performance of CNB Financial Corporation (the “Company”). Forward-looking statements are not guarantees of performance or results. These forward-looking statements are based on the current beliefs and expectations of the respective management of the Company and are inherently subject to significant business, economic and competitive uncertainties and contingencies, many of which are beyond their respective control and which may be heightened by the novel coronavirus, or COVID-19 pandemic. In addition, these forward-looking statements are subject to assumptions with respect to future business strategies and decisions that are subject to change. Actual results may differ materially from the anticipated results discussed or implied in these forward-looking statements because of numerous possible uncertainties. Words like "may," "plan," "contemplate," "anticipate," "believe," "intend," "continue," "expect," "project," "predict," "estimate," "could," "should," "would," "will," and similar expressions, should be considered as identifying forward-looking statements, although other phrasing may be used. Such forward-looking statements involve risks and uncertainties and may not be realized due to a variety of factors. Additional factors that could cause actual results to differ materially from those expressed in the forward-looking statements are discussed in the reports (such as Annual Reports on Form 10-K, Quarterly Reports on Form 10-Q) filed by the Company with the SEC. You should consider such factors and not place undue reliance on such forward-looking statements. No obligation is undertaken by the Company to update such forward-looking statements to reflect events or circumstances occurring after the issuance of this presentation. NON-GAAP FINANCIAL MEASURES This presentation contains references to financial measures that are not defined in GAAP. Management uses non-GAAP financial information in its analysis of the Corporation’s performance. Management believes that these non-GAAP measures provide a greater understanding of ongoing operations, enhance comparability of results of operations with prior periods and show the effects of significant gains and charges in the periods presented. The Corporation’s management believes that investors may use these non-GAAP measures to analyze the Corporation’s financial performance without the impact of unusual items or events that may obscure trends in the Corporation’s underlying performance. This non-GAAP data should be considered in addition to results prepared in accordance with GAAP, and is not a substitute for, or superior to, GAAP results. Limitations associated with non-GAAP financial measures include the risks that persons might disagree as to the appropriateness of items included in these measures and that different companies might calculate these measures differently. Non-GAAP measures reflected within the presentation include evaluations on the impact of PPP-related assets, merger costs, branch closure costs and FHLB prepayment penalties on various metrics of the Corporation’s financial performance, including calculations related to: (1) Tangible common equity/tangible assets, (2) Average loans and average earning assets utilized in the calculation of yield on loans, yield on earning assets and net interest margin, (3) Return on average assets and return on average tangible common equity, (4) Efficiency ratio, and (5) Non-performing assets/total assets and allowance for loan losses/loans.

Corporate Overview
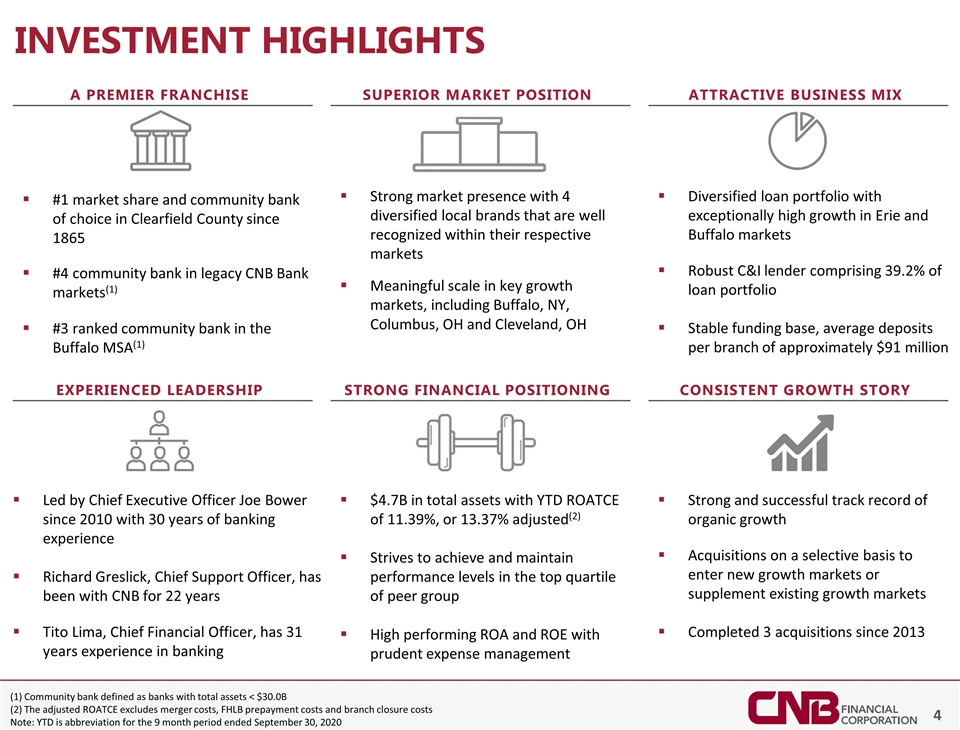
Investment highlights A Premier Franchise Superior market position Attractive business mix Experienced Leadership Strong financial positioning Consistent Growth Story #1 market share and community bank of choice in Clearfield County since 1865 #4 community bank in legacy CNB Bank markets(1) #3 ranked community bank in the Buffalo MSA(1) Strong market presence with 4 diversified local brands that are well recognized within their respective markets Meaningful scale in key growth markets, including Buffalo, NY, Columbus, OH and Cleveland, OH Diversified loan portfolio with exceptionally high growth in Erie and Buffalo markets Robust C&I lender comprising 39.2% of loan portfolio Stable funding base, average deposits per branch of approximately $91 million Led by Chief Executive Officer Joe Bower since 2010 with 30 years of banking experience Richard Greslick, Chief Support Officer, has been with CNB for 22 years Tito Lima, Chief Financial Officer, has 31 years experience in banking $4.7B in total assets with YTD ROATCE of 11.39%, or 13.37% adjusted(2) Strives to achieve and maintain performance levels in the top quartile of peer group High performing ROA and ROE with prudent expense management Strong and successful track record of organic growth Acquisitions on a selective basis to enter new growth markets or supplement existing growth markets Completed 3 acquisitions since 2013 (1) Community bank defined as banks with total assets < $30.0B (2) The adjusted ROATCE excludes merger costs, FHLB prepayment costs and branch closure costs Note: YTD is abbreviation for the 9 month period ended September 30, 2020
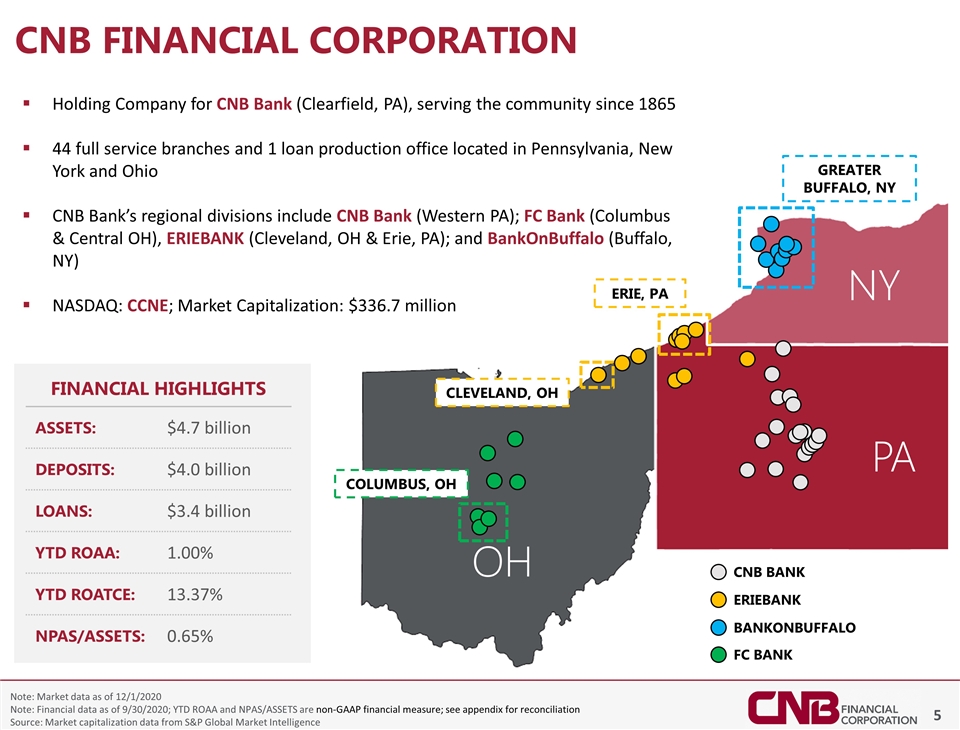
CNB Financial Corporation Note: Market data as of 12/1/2020 Note: Financial data as of 9/30/2020; YTD ROAA and NPAS/ASSETS are non-GAAP financial measure; see appendix for reconciliation Source: Market capitalization data from S&P Global Market Intelligence NY PA OH ERIEBANK BANKONBUFFALO FC BANK CNB BANK COLUMBUS, OH GREATER BUFFALO, NY CLEVELAND, OH ERIE, PA Holding Company for CNB Bank (Clearfield, PA), serving the community since 1865 44 full service branches and 1 loan production office located in Pennsylvania, New York and Ohio CNB Bank’s regional divisions include CNB Bank (Western PA); FC Bank (Columbus & Central OH), ERIEBANK (Cleveland, OH & Erie, PA); and BankOnBuffalo (Buffalo, NY) NASDAQ: CCNE; Market Capitalization: $336.7 million FINANCIAL HIGHLIGHTS Assets: $4.7 billion Deposits: $4.0 billion Loans: $3.4 billion YTD ROAA: 1.00% YTD ROATCE: 13.37% NPAs/Assets: 0.65%
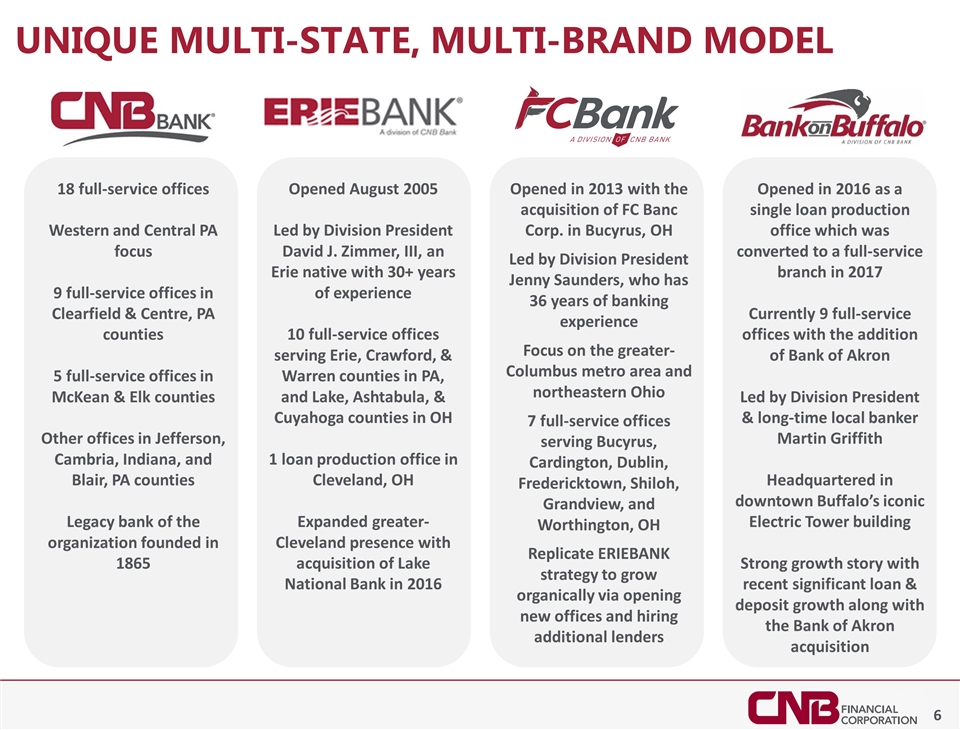
Unique Multi-state, multi-brand model 18 full-service offices Western and Central PA focus 9 full-service offices in Clearfield & Centre, PA counties 5 full-service offices in McKean & Elk counties Other offices in Jefferson, Cambria, Indiana, and Blair, PA counties Legacy bank of the organization founded in 1865 Opened August 2005 Led by Division President David J. Zimmer, III, an Erie native with 30+ years of experience 10 full-service offices serving Erie, Crawford, & Warren counties in PA, and Lake, Ashtabula, & Cuyahoga counties in OH 1 loan production office in Cleveland, OH Expanded greater-Cleveland presence with acquisition of Lake National Bank in 2016 Opened in 2013 with the acquisition of FC Banc Corp. in Bucyrus, OH Led by Division President Jenny Saunders, who has 36 years of banking experience Focus on the greater-Columbus metro area and northeastern Ohio 7 full-service offices serving Bucyrus, Cardington, Dublin, Fredericktown, Shiloh, Grandview, and Worthington, OH Replicate ERIEBANK strategy to grow organically via opening new offices and hiring additional lenders Opened in 2016 as a single loan production office which was converted to a full-service branch in 2017 Currently 9 full-service offices with the addition of Bank of Akron Led by Division President & long-time local banker Martin Griffith Headquartered in downtown Buffalo’s iconic Electric Tower building Strong growth story with recent significant loan & deposit growth along with the Bank of Akron acquisition

Source: city-buffalo.com; buffaloniagara.com; columbus.gov; columbusregion.com; city.cleveland.oh.us; rethinkcleveland.org Key growth markets 2nd largest city in the state of New York High growth market due to several development activities worth over $6B enacted since 2006: Wider development of the Buffalo Niagara Medical Campus Solar City, a solar panel factory in South Buffalo Northland Corridor, the home of a $44 million WNY Workforce Training Center HarborCenter, a $200M state-of-the art hockey / entertainment complex located in the downtown Buffalo / Canalside area One of the nation’s fastest growing cities Growth fueled by a diversified economy with 19% of employment coming from education, tech, government, research, insurance and healthcare With a regional population of 2.1 million people, this growth can be attributed to the OneColumbus Strategy, formerly known as the Columbus 2020 Regional Growth Strategy: Catalyst for over 150,000 net new jobs and over $8B of capital investment Since implementing this strategy, the population has seen a 30% increase in person per capita income Cleveland is the 2nd largest city in the state of Ohio Major manufacturing and commercial hub Ranks as one of the chief ports on the Great Lakes Experienced significant recent public and private investment in the last decade Economy focused on healthcare, education, research, financial services and manufacturing Buffalo, NY Columbus, oh Cleveland, oh / Erie, PA
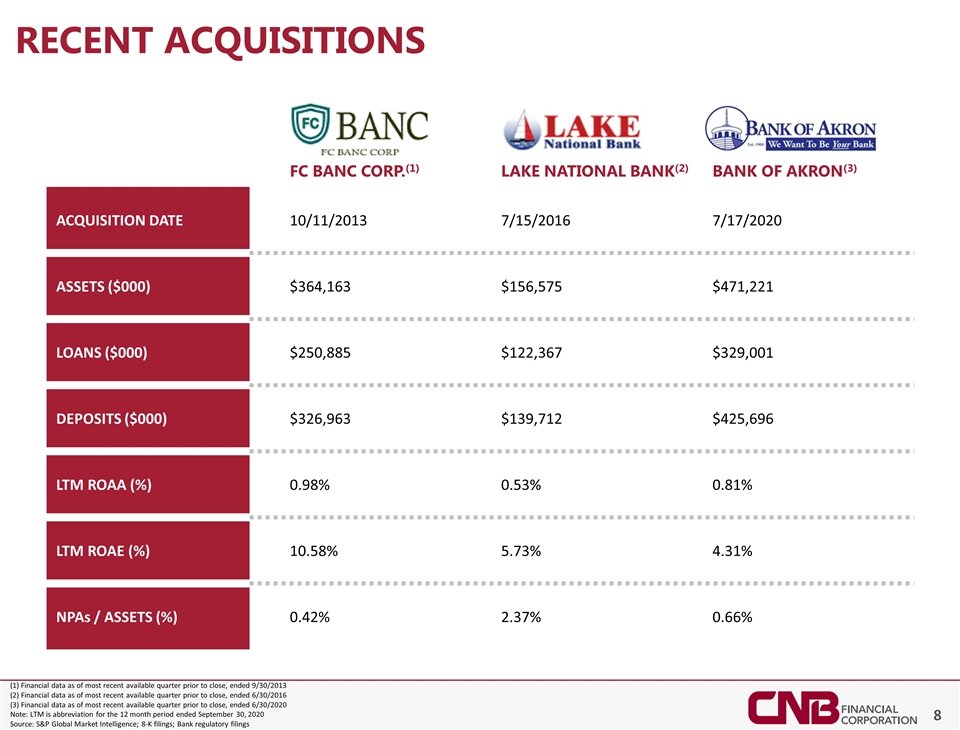
(1) Financial data as of most recent available quarter prior to close, ended 9/30/2013 (2) Financial data as of most recent available quarter prior to close, ended 6/30/2016 (3) Financial data as of most recent available quarter prior to close, ended 6/30/2020 Note: LTM is abbreviation for the 12 month period ended September 30, 2020 Source: S&P Global Market Intelligence; 8-K filings; Bank regulatory filings Recent Acquisitions FC BANC CORP.(1) LAKE NATIONAL BANK(2) BANK OF AKRON(3) ACQUISITION DATE 10/11/2013 7/15/2016 7/17/2020 ASSETS ($000) $364,163 $156,575 $471,221 LOANS ($000) $250,885 $122,367 $329,001 DEPOSITS ($000) $326,963 $139,712 $425,696 LTM ROAA (%) 0.98% 0.53% 0.81% LTM ROAE (%) 10.58% 5.73% 4.31% NPAs / ASSETS (%) 0.42% 2.37% 0.66%
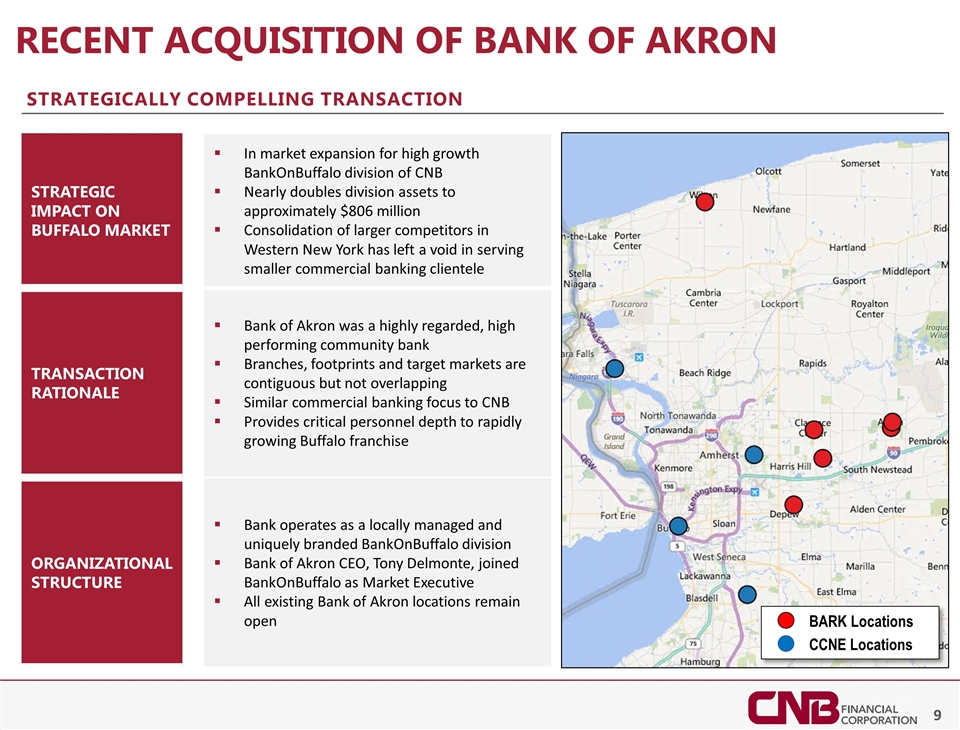
Recent acquisition of Bank of Akron STRATEGIC IMPACT ON BUFFALO MARKET In market expansion for high growth BankOnBuffalo division of CNB Nearly doubles division assets to approximately $806 million Consolidation of larger competitors in Western New York has left a void in serving smaller commercial banking clientele TRANSACTION RATIONALE Bank of Akron was a highly regarded, high performing community bank Branches, footprints and target markets are contiguous but not overlapping Similar commercial banking focus to CNB Provides critical personnel depth to rapidly growing Buffalo franchise ORGANIZATIONAL STRUCTURE Bank operates as a locally managed and uniquely branded BankOnBuffalo division Bank of Akron CEO, Tony Delmonte, joined BankOnBuffalo as Market Executive All existing Bank of Akron locations remain open Strategically Compelling Transaction BARK Locations CCNE Locations
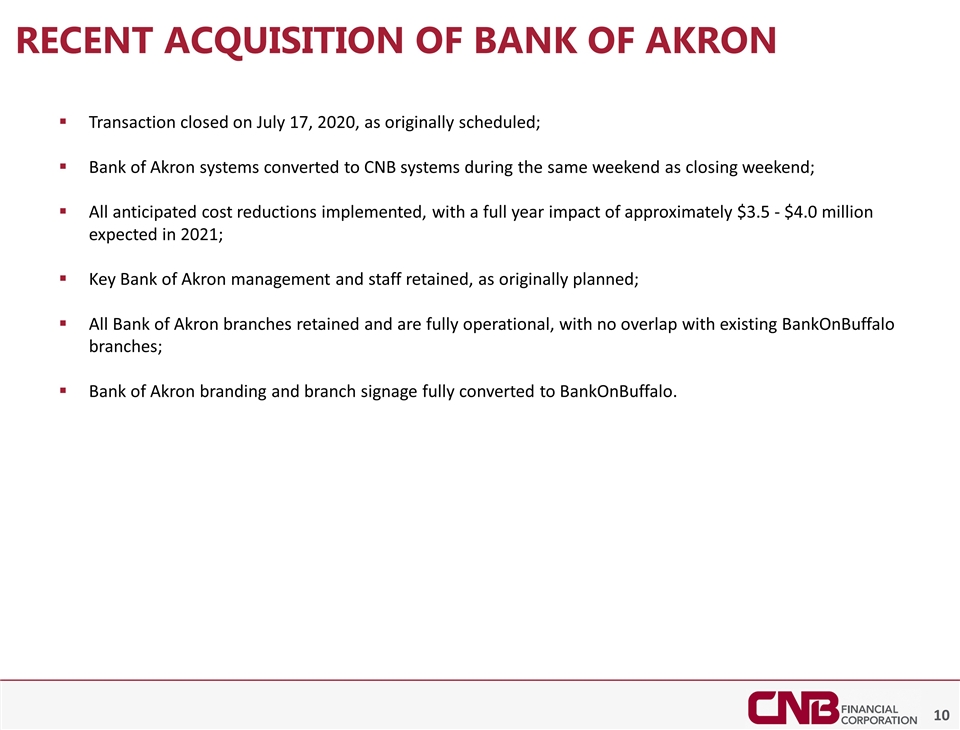
Recent acquisition of Bank of Akron Transaction closed on July 17, 2020, as originally scheduled; Bank of Akron systems converted to CNB systems during the same weekend as closing weekend; All anticipated cost reductions implemented, with a full year impact of approximately $3.5 - $4.0 million expected in 2021; Key Bank of Akron management and staff retained, as originally planned; All Bank of Akron branches retained and are fully operational, with no overlap with existing BankOnBuffalo branches; Bank of Akron branding and branch signage fully converted to BankOnBuffalo.

Business Highlights
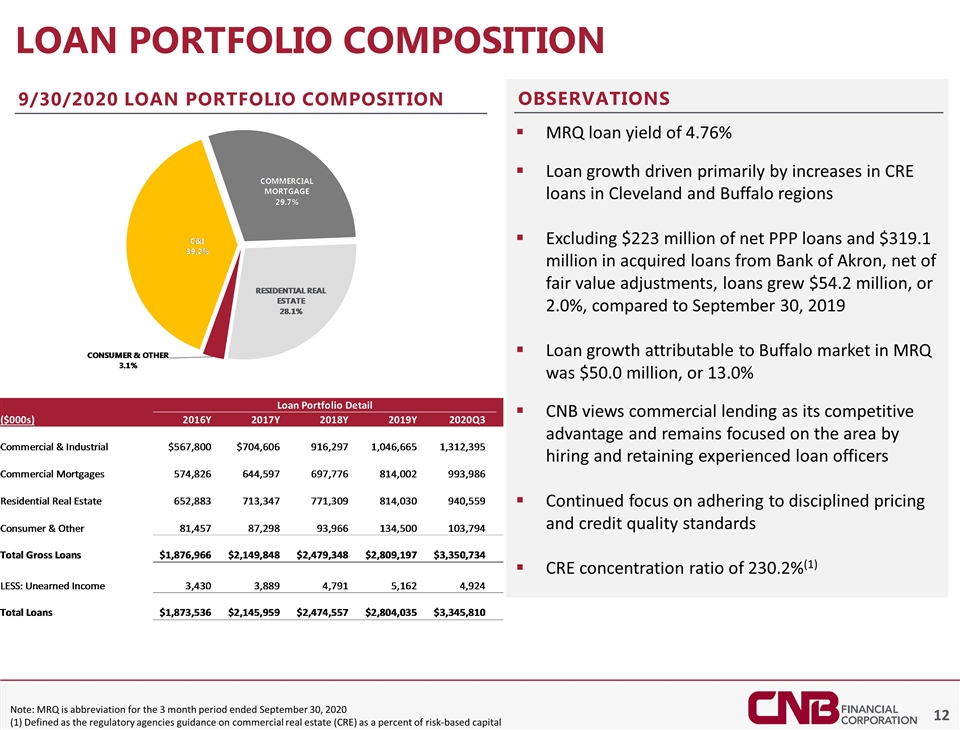
MRQ loan yield of 4.76% Loan growth driven primarily by increases in CRE loans in Cleveland and Buffalo regions Excluding $223 million of net PPP loans and $319.1 million in acquired loans from Bank of Akron, net of fair value adjustments, loans grew $54.2 million, or 2.0%, compared to September 30, 2019 Loan growth attributable to Buffalo market in MRQ was $50.0 million, or 13.0% CNB views commercial lending as its competitive advantage and remains focused on the area by hiring and retaining experienced loan officers Continued focus on adhering to disciplined pricing and credit quality standards CRE concentration ratio of 230.2%(1) Loan portfolio composition 9/30/2020 Loan portfolio Composition Observations Note: MRQ is abbreviation for the 3 month period ended September 30, 2020 (1) Defined as the regulatory agencies guidance on commercial real estate (CRE) as a percent of risk-based capital
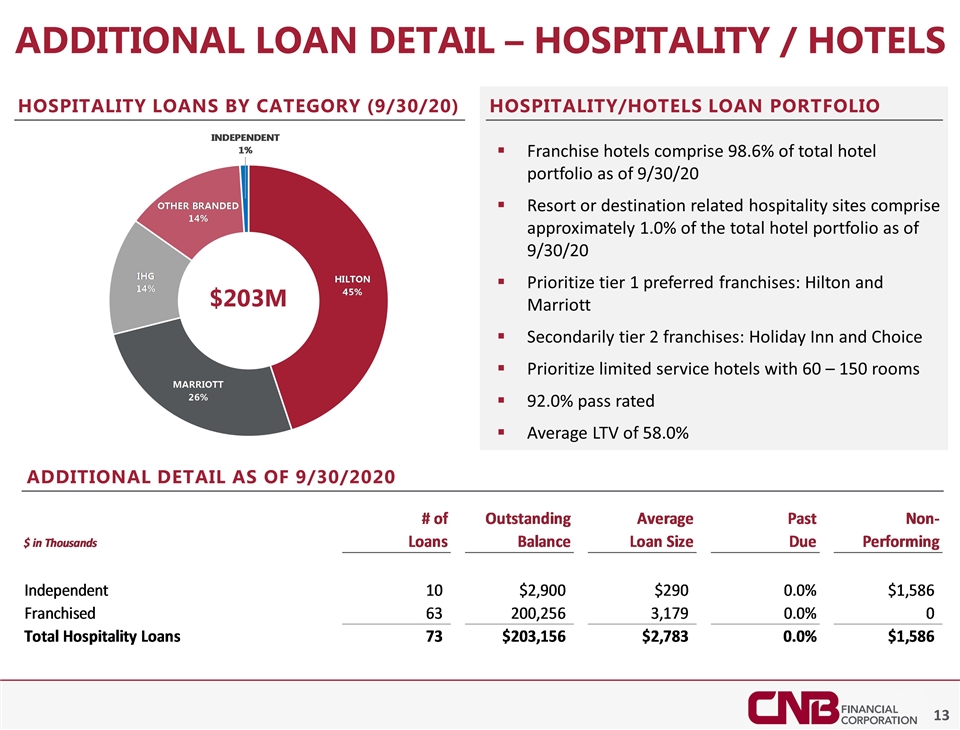
Additional Loan Detail – Hospitality / Hotels Hospitality/Hotels Loan Portfolio Franchise hotels comprise 98.6% of total hotel portfolio as of 9/30/20 Resort or destination related hospitality sites comprise approximately 1.0% of the total hotel portfolio as of 9/30/20 Prioritize tier 1 preferred franchises: Hilton and Marriott Secondarily tier 2 franchises: Holiday Inn and Choice Prioritize limited service hotels with 60 – 150 rooms 92.0% pass rated Average LTV of 58.0% Hospitality Loans by category (9/30/20) Additional Detail As of 9/30/2020 $203M
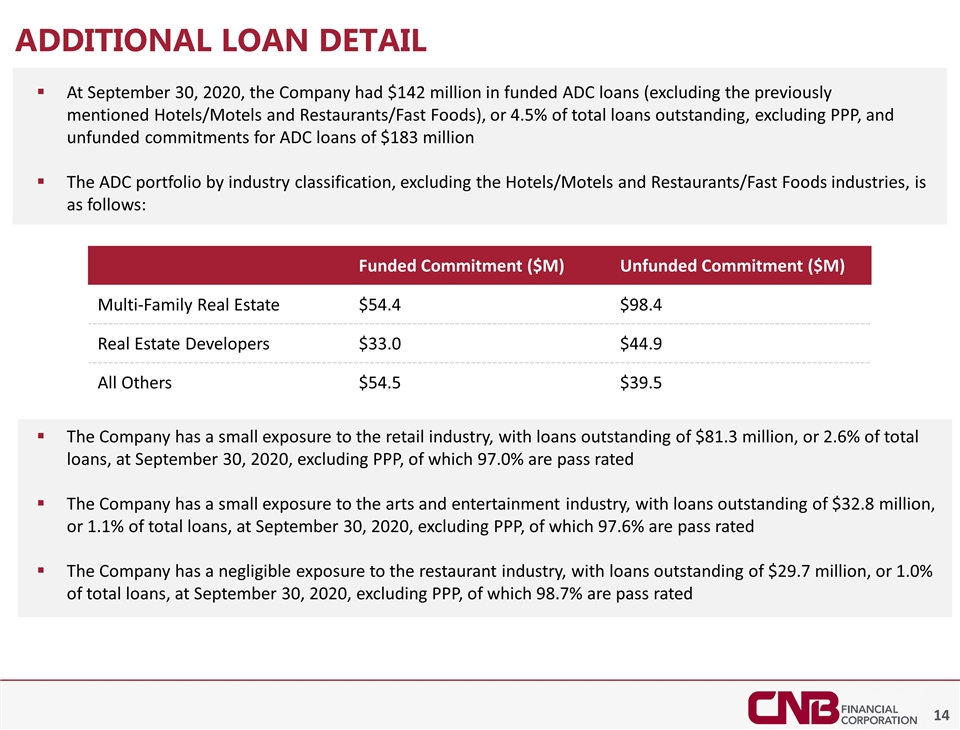
Additional Loan Detail At September 30, 2020, the Company had $142 million in funded ADC loans (excluding the previously mentioned Hotels/Motels and Restaurants/Fast Foods), or 4.5% of total loans outstanding, excluding PPP, and unfunded commitments for ADC loans of $183 million The ADC portfolio by industry classification, excluding the Hotels/Motels and Restaurants/Fast Foods industries, is as follows: The Company has a small exposure to the retail industry, with loans outstanding of $81.3 million, or 2.6% of total loans, at September 30, 2020, excluding PPP, of which 97.0% are pass rated The Company has a small exposure to the arts and entertainment industry, with loans outstanding of $32.8 million, or 1.1% of total loans, at September 30, 2020, excluding PPP, of which 97.6% are pass rated The Company has a negligible exposure to the restaurant industry, with loans outstanding of $29.7 million, or 1.0% of total loans, at September 30, 2020, excluding PPP, of which 98.7% are pass rated Funded Commitment ($M) Unfunded Commitment ($M) Multi-Family Real Estate $54.4 $98.4 Real Estate Developers $33.0 $44.9 All Others $54.5 $39.5
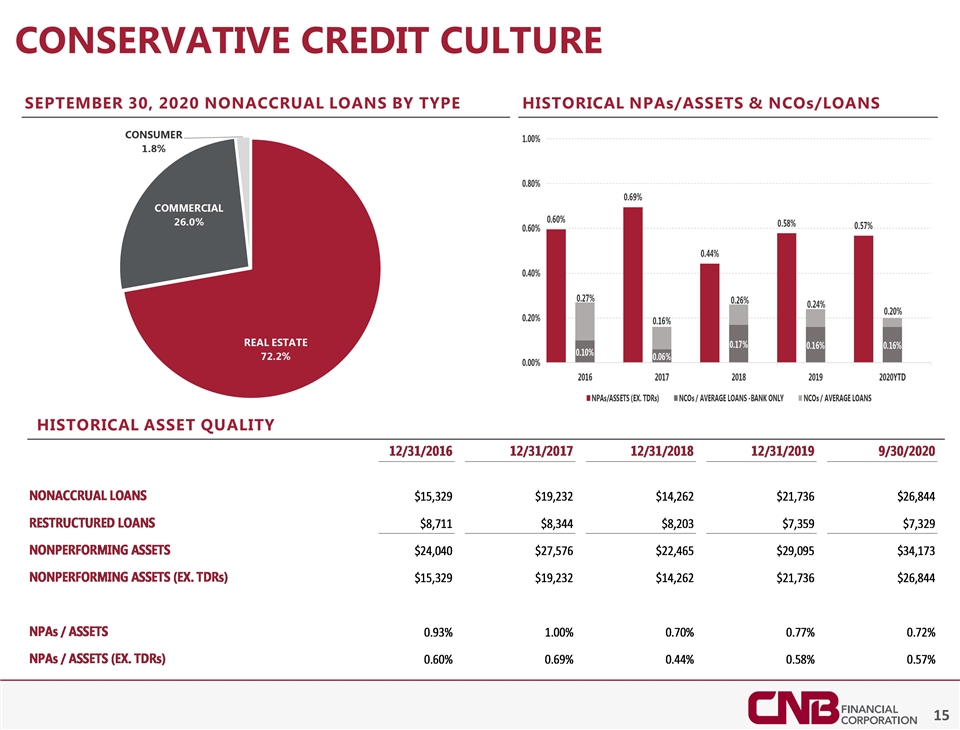
Conservative credit culture September 30, 2020 nonaccrual loans by type Historical asset quality Historical NPAs/Assets & Ncos/Loans
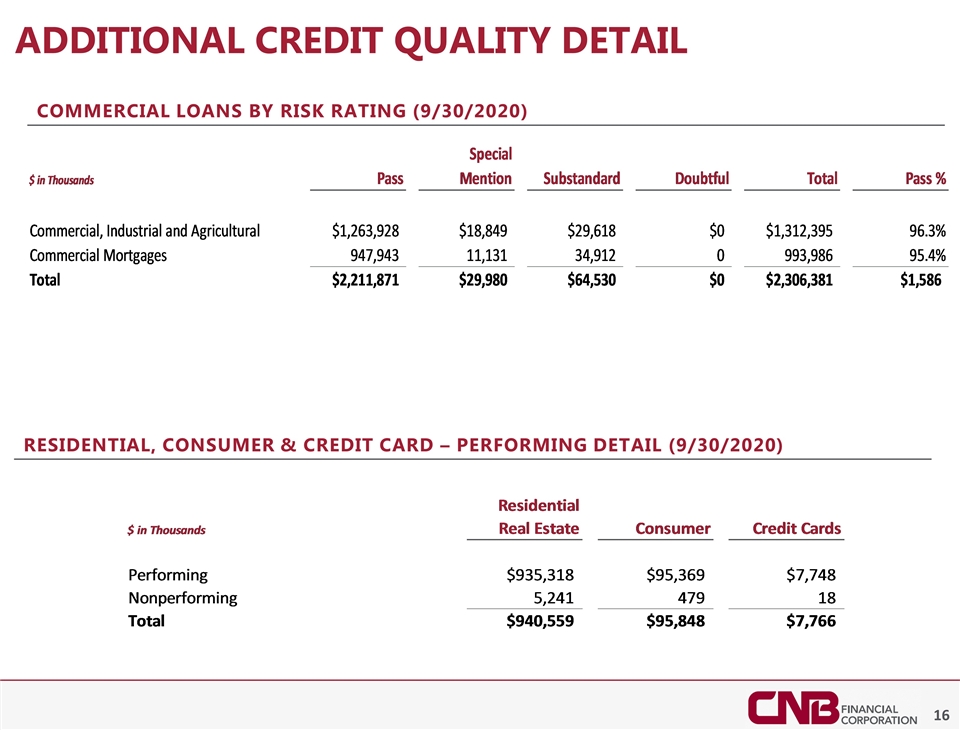
Additional credit quality detail Commercial Loans by Risk Rating (9/30/2020) Residential, Consumer & Credit card – performing detail (9/30/2020)
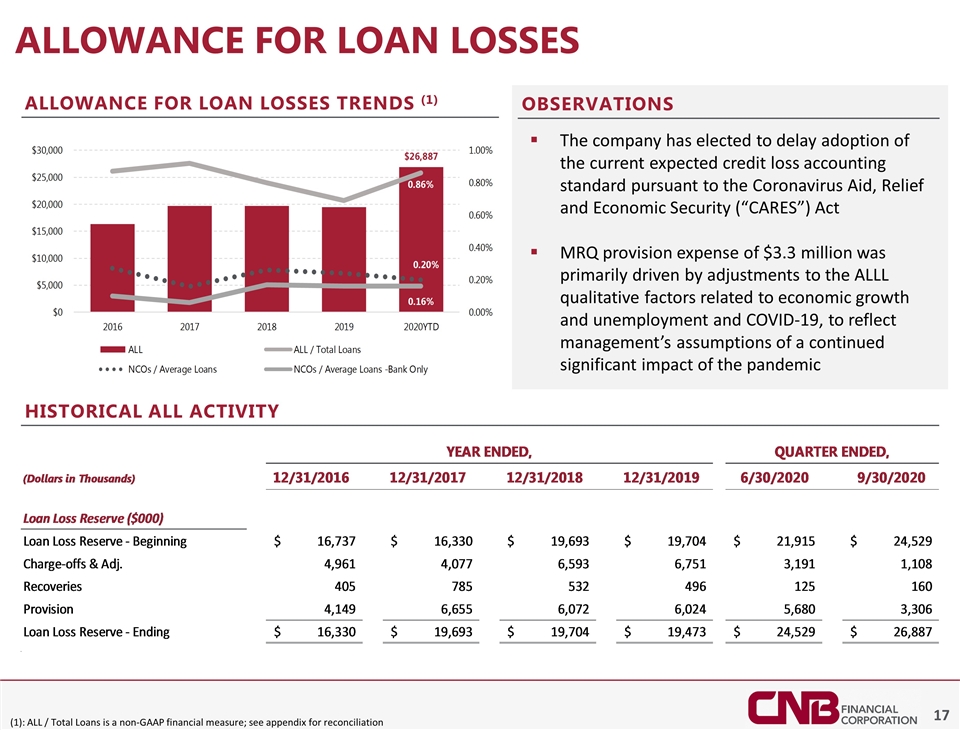
Allowance for loan losses The company has elected to delay adoption of the current expected credit loss accounting standard pursuant to the Coronavirus Aid, Relief and Economic Security (“CARES”) Act MRQ provision expense of $3.3 million was primarily driven by adjustments to the ALLL qualitative factors related to economic growth and unemployment and COVID-19, to reflect management’s assumptions of a continued significant impact of the pandemic Allowance for Loan Losses Trends (1) Historical ALL Activity Observations (1): ALL / Total Loans is a non-GAAP financial measure; see appendix for reconciliation
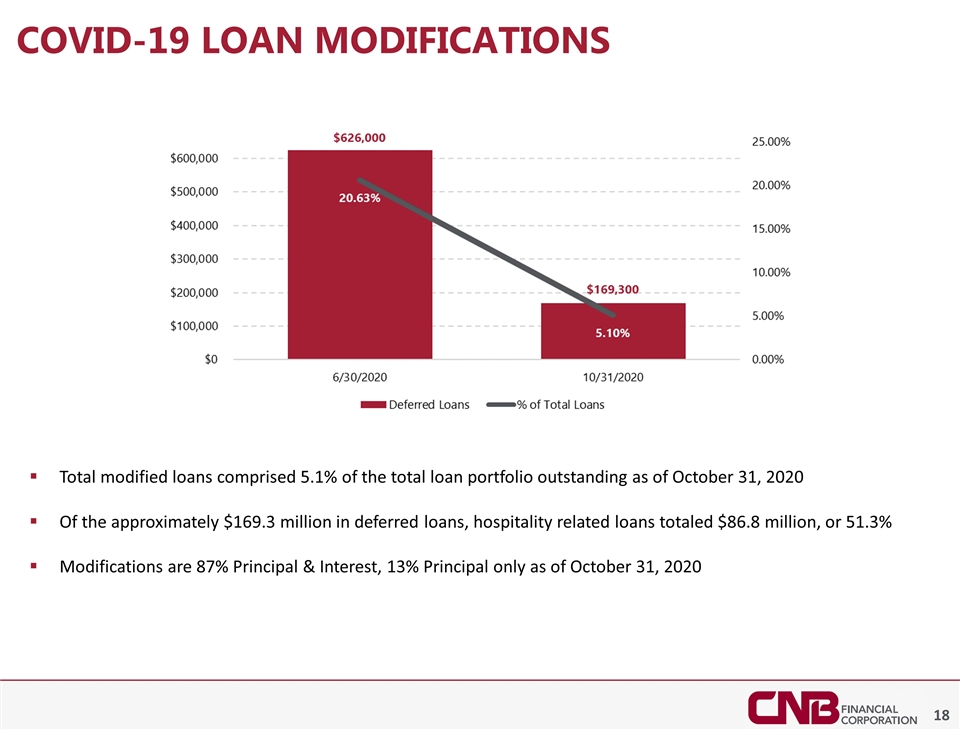
Covid-19 loan modifications Total modified loans comprised 5.1% of the total loan portfolio outstanding as of October 31, 2020 Of the approximately $169.3 million in deferred loans, hospitality related loans totaled $86.8 million, or 51.3% Modifications are 87% Principal & Interest, 13% Principal only as of October 31, 2020
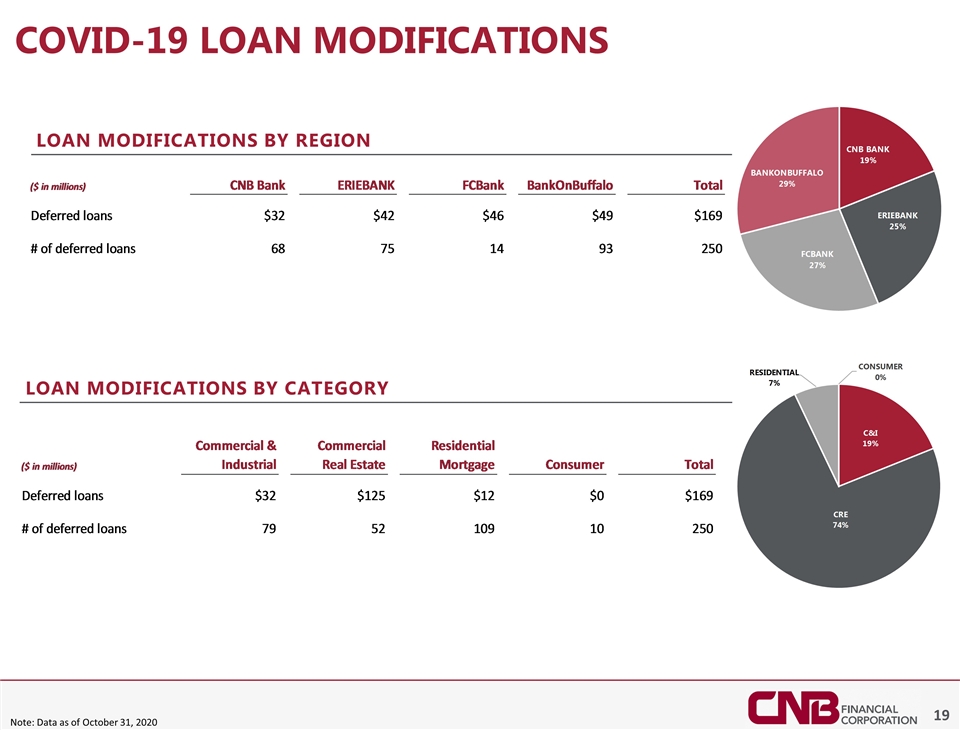
Note: Data as of October 31, 2020 Covid-19 loan modifications Loan Modifications by region Loan Modifications by Category
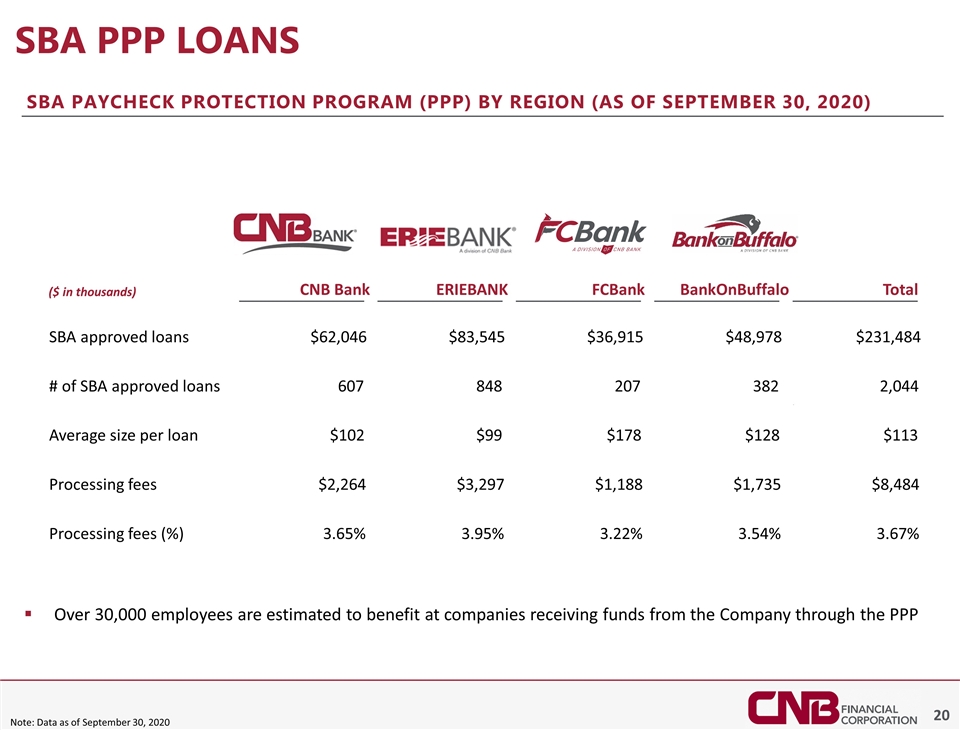
SBA PPP Loans SBA Paycheck protection program (PPP) by region (as of September 30, 2020) Over 30,000 employees are estimated to benefit at companies receiving funds from the Company through the PPP Note: Data as of September 30, 2020 ($ in thousands) CNB Bank ERIEBANK FCBank BankOnBuffalo Total SBA approved loans $62,046 $83,545 $36,915 $48,978 $231,484 # of SBA approved loans 607 848 207 382 2,044 Average size per loan $102 $99 $178 $128 $113 Processing fees $2,264 $3,297 $1,188 $1,735 $8,484 Processing fees (%) 3.65% 3.95% 3.22% 3.54% 3.67%

Deposit mix 9/30/2020 deposit mix Observations Total deposits of $4.0 billion include an estimated $231 million in estimated PPP deposits and $419.5 million in acquired deposits from Bank of Akron, net of fair value adjustments. Excluding estimated PPP deposits and Bank of Akron acquired deposits, deposits grew 17.3%, compared to September 30, 2019 Overall increase in deposits driven by increases across all our regions, as well as in our Private Banking division MRQ cost of deposits of 0.66% Average Deposits Per Branch
Branch Network restructure During the third quarter of 2020 the Corporation closed three branches located within its ERIEBANK and CNB Bank regions; During the third quarter of 2020, the Corporation recorded related branch closing costs totaling approximately $751 thousand, including costs associated with employee departures, lease terminations and write-off of related branch assets; The Corporation expects ongoing cost reductions to be fully realized in 2021; The Corporation will continue to evaluate its branch footprint, based on economic conditions and customer interaction preferences.
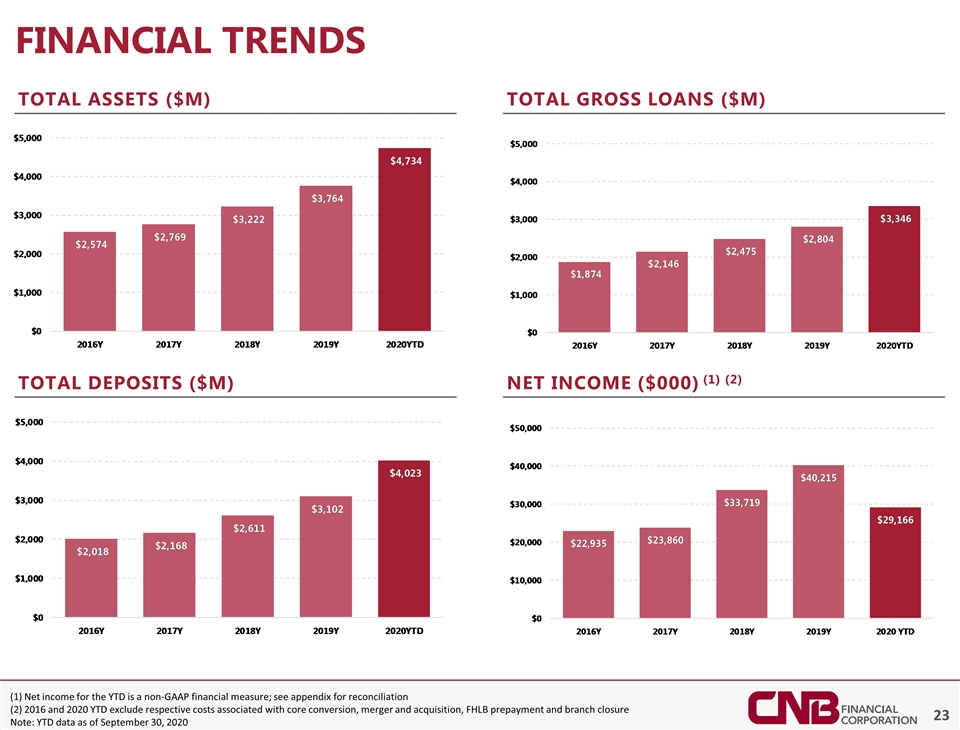
(1) Net income for the YTD is a non-GAAP financial measure; see appendix for reconciliation (2) 2016 and 2020 YTD exclude respective costs associated with core conversion, merger and acquisition, FHLB prepayment and branch closure Note: YTD data as of September 30, 2020 Financial trends Total Assets ($M) Total Gross Loans ($M) Total Deposits ($M) Net Income ($000) (1) (2)
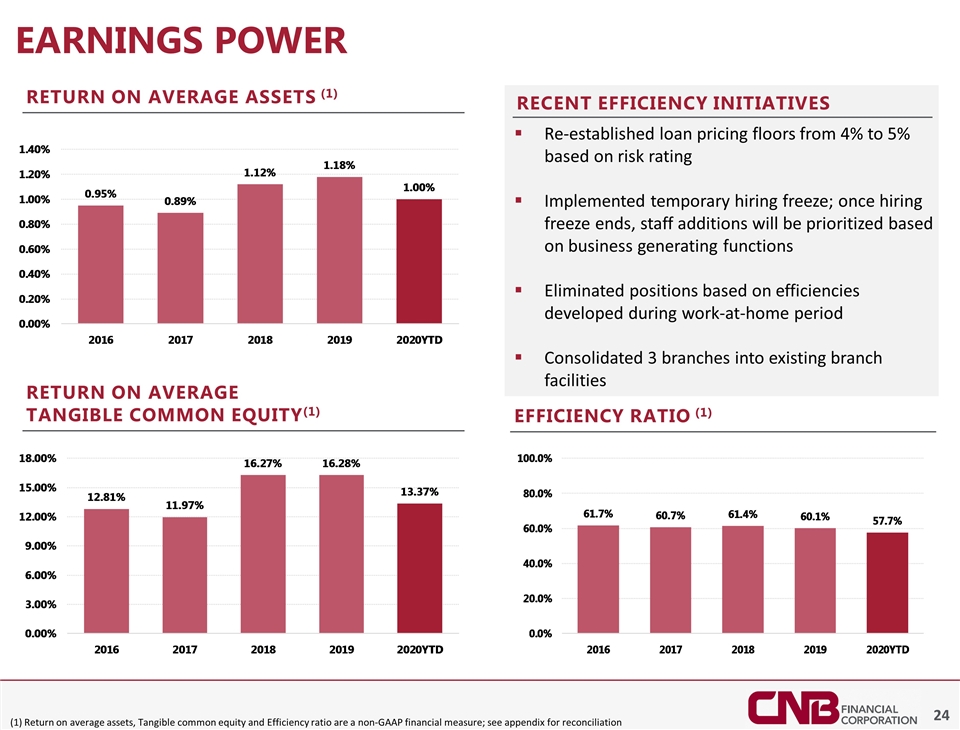
Re-established loan pricing floors from 4% to 5% based on risk rating Implemented temporary hiring freeze; once hiring freeze ends, staff additions will be prioritized based on business generating functions Eliminated positions based on efficiencies developed during work-at-home period Consolidated 3 branches into existing branch facilities (1) Return on average assets, Tangible common equity and Efficiency ratio are a non-GAAP financial measure; see appendix for reconciliation Earnings power Return on Average Tangible Common Equity(1) Return on Average Assets (1) Recent Efficiency initiatives Efficiency Ratio (1)
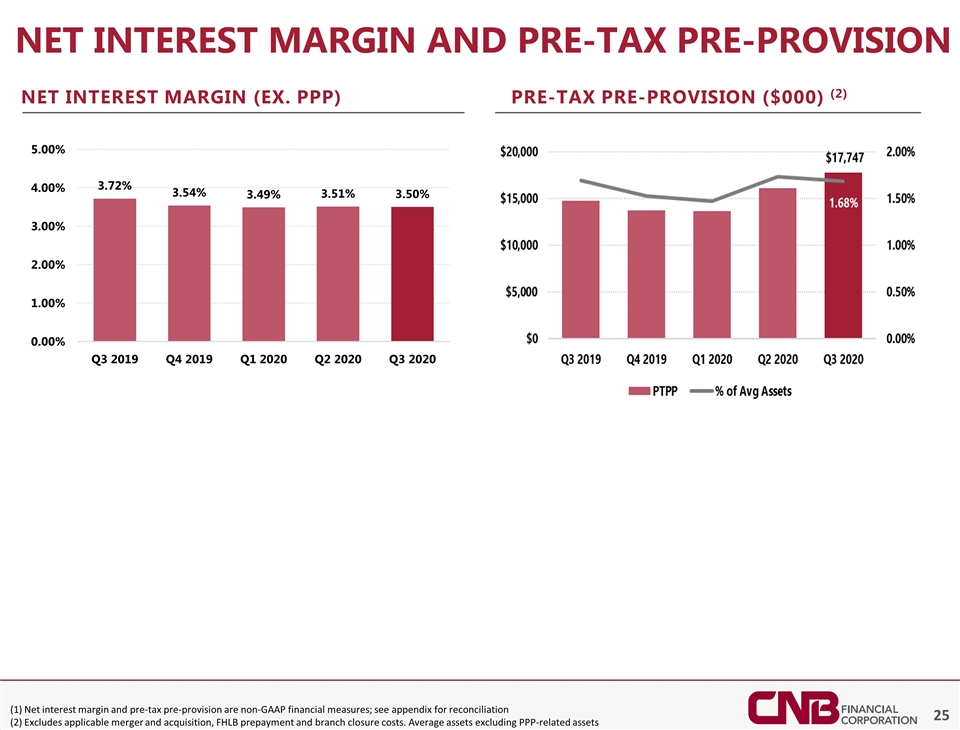
(1) Net interest margin and pre-tax pre-provision are non-GAAP financial measures; see appendix for reconciliation (2) Excludes applicable merger and acquisition, FHLB prepayment and branch closure costs. Average assets excluding PPP-related assets Net Interest margin and pre-tax pre-provision Net Interest margin (ex. Ppp) Pre-Tax Pre-Provision ($000) (2)
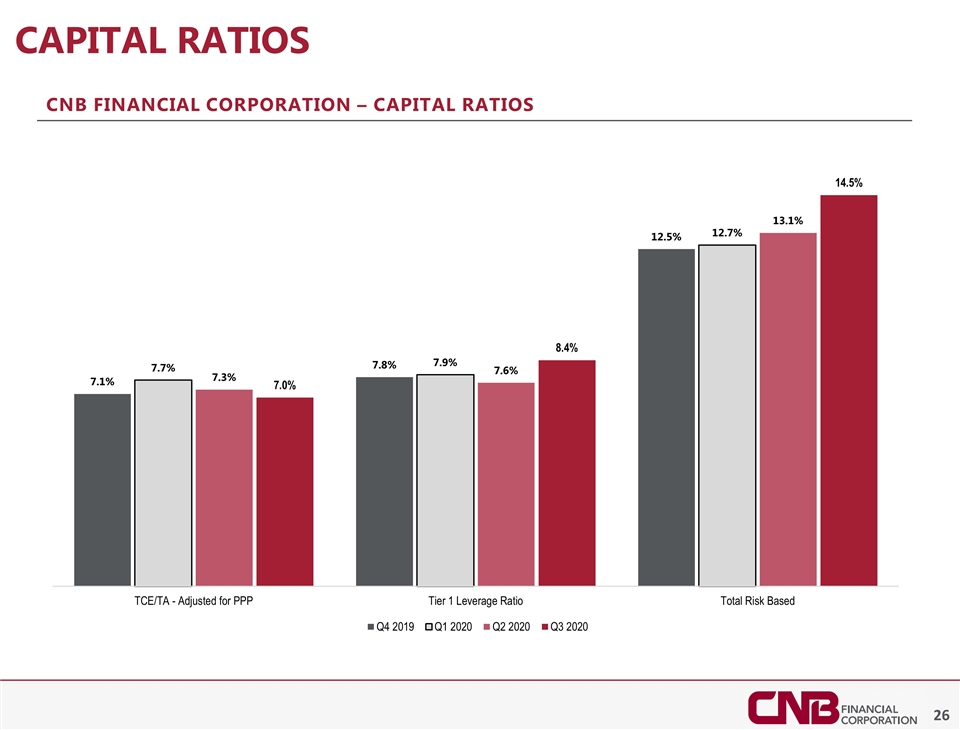
Capital ratios CNB Financial Corporation – Capital Ratios (1)
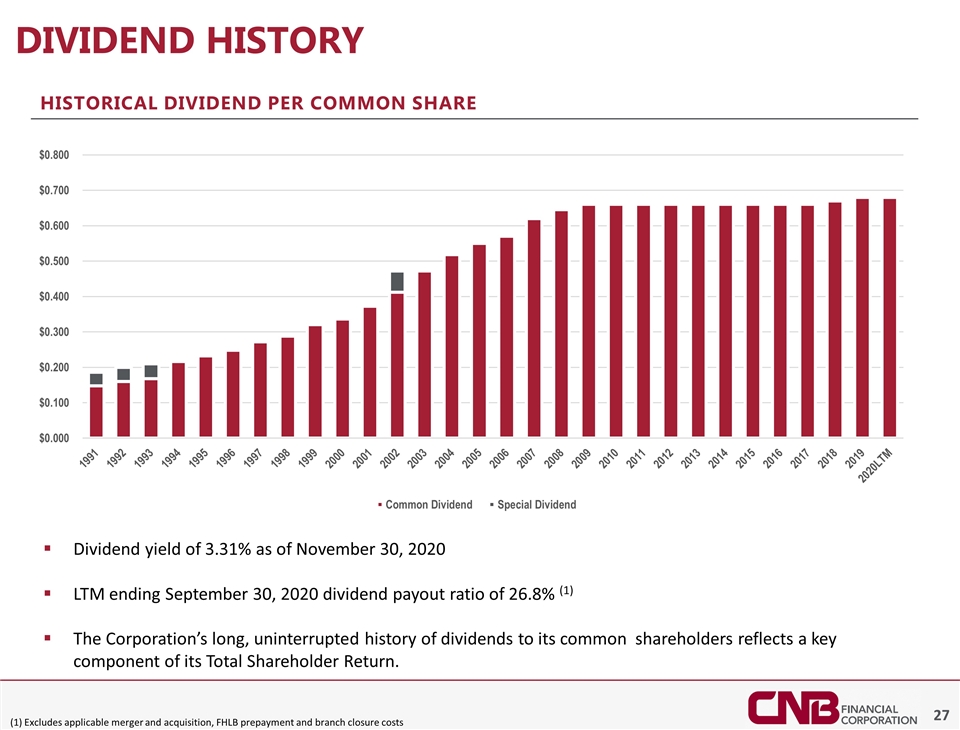
Dividend History Historical dividend per common share Dividend yield of 3.31% as of November 30, 2020 LTM ending September 30, 2020 dividend payout ratio of 26.8% (1) The Corporation’s long, uninterrupted history of dividends to its common shareholders reflects a key component of its Total Shareholder Return. (1) Excludes applicable merger and acquisition, FHLB prepayment and branch closure costs

Appendix
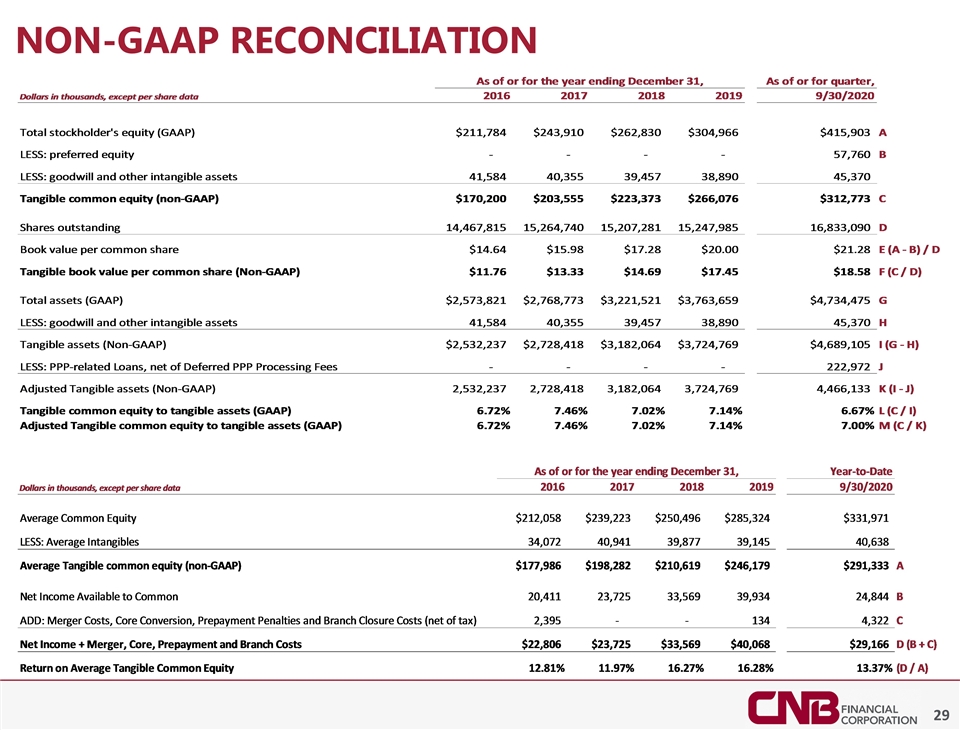
Non-gaap reconciliation
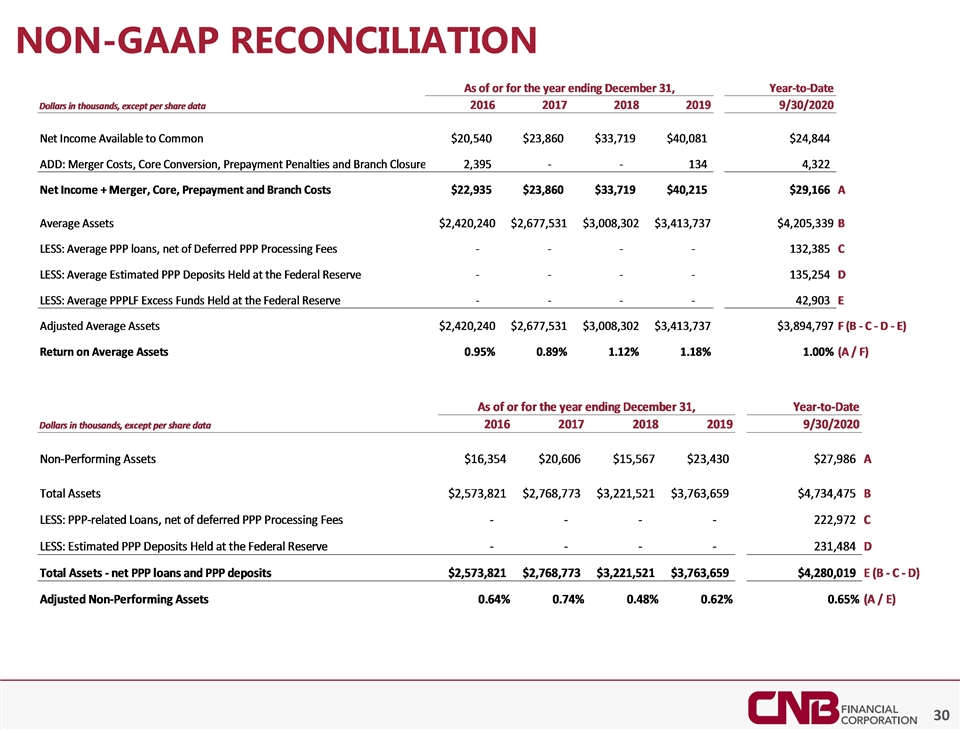
Non-gaap reconciliation
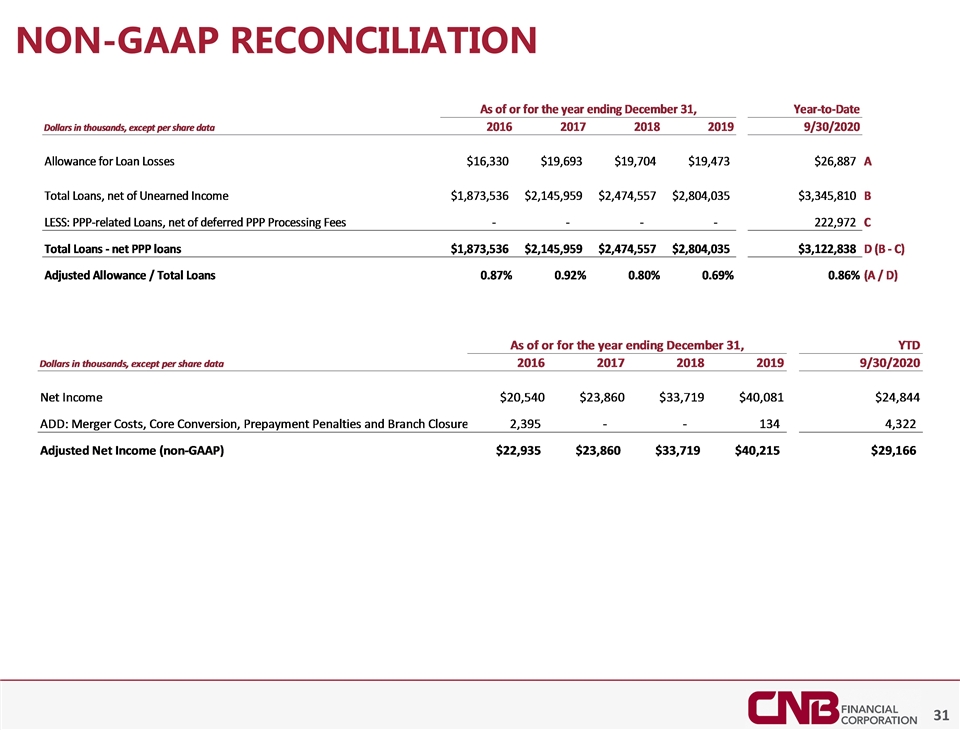
Non-gaap reconciliation
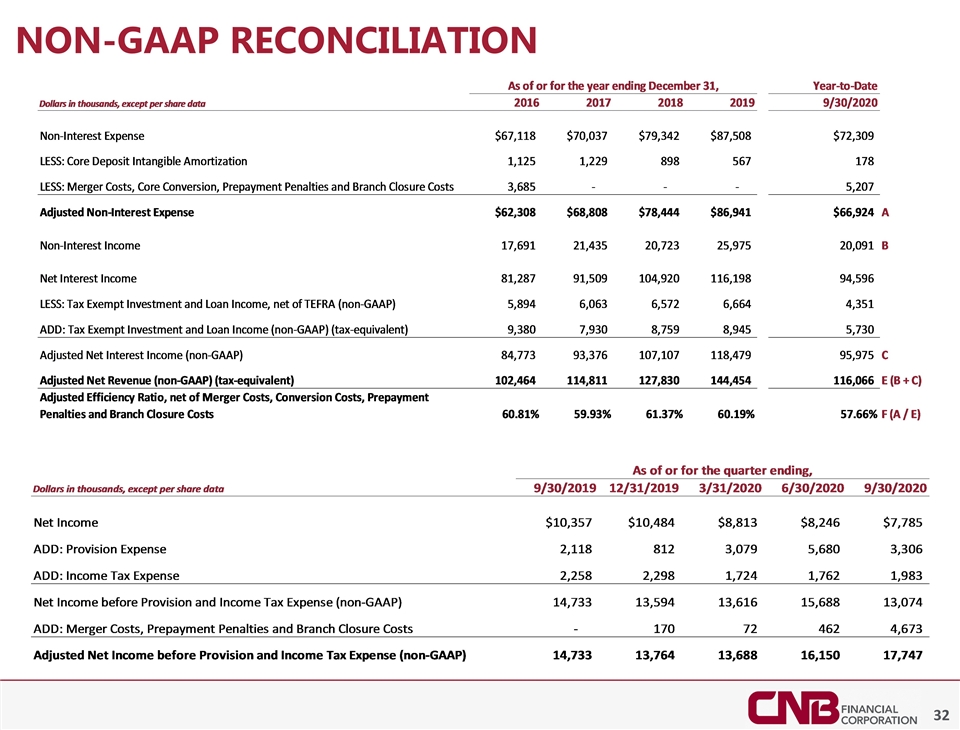
Non-gaap reconciliation
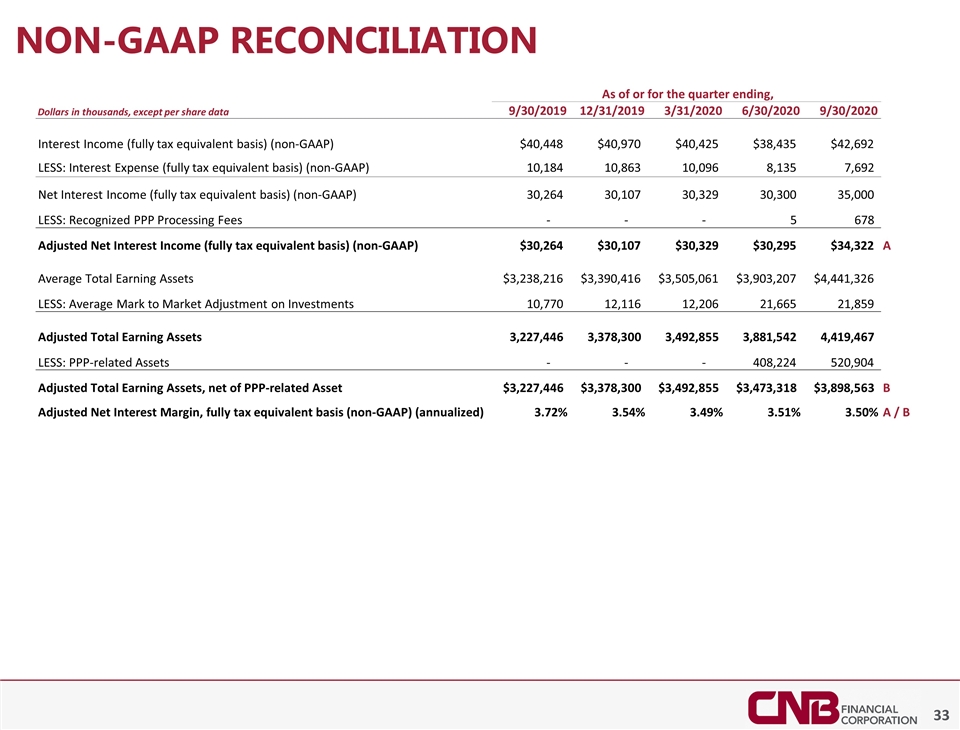
Non-gaap reconciliation Dollars in thousands, except per share data 9/30/2019 12/31/2019 3/31/2020 6/30/2020 9/30/2020 Interest Income (fully tax equivalent basis) (non-GAAP) $40,448 $40,970 $40,425 $38,435 $42,692 LESS: Interest Expense (fully tax equivalent basis) (non-GAAP) 10,184 10,863 10,096 8,135 7,692 Net Interest Income (fully tax equivalent basis) (non-GAAP) 30,264 30,107 30,329 30,300 35,000 LESS: Recognized PPP Processing Fees - - - 5 678 Adjusted Net Interest Income (fully tax equivalent basis) (non-GAAP) $30,264 $30,107 $30,329 $30,295 $34,322 A Average Total Earning Assets $3,238,216 $3,390,416 $3,505,061 $3,903,207 $4,441,326 LESS: Average Mark to Market Adjustment on Investments 10,770 12,116 12,206 21,665 21,859 Adjusted Total Earning Assets 3,227,446 3,378,300 3,492,855 3,881,542 4,419,467 LESS: PPP-related Assets - - - 408,224 520,904 Adjusted Total Earning Assets, net of PPP-related Asset $3,227,446 $3,378,300 $3,492,855 $3,473,318 $3,898,563 B Adjusted Net Interest Margin, fully tax equivalent basis (non-GAAP) (annualized) 3.72% 3.54% 3.49% 3.51% 3.50% A / B As of or for the quarter ending,


