
Exhibit 99.1 DISCUSSIONMATERIALS INVESTOR PRESENTATION NOVEMBER 2021
CERTAIN IMPORTANT INFORMATION CAUTION REGARDING FORWARD LOOKING STATEMENTS This presentation includes forward-looking statements within the meaning of Section 27A of the Securities Act and Section 21E of the Exchange Act with respect to CNB’s financial condition, liquidity, results of operations, future performance and business. These forward-looking statements are intended to be covered by the safe harbor for “forward-looking statements” provided by the Private Securities Litigation Reform Act of 1995. Forward-looking statements are those that are not historical facts. Forward-looking statements include statements with respect to beliefs, plans, objectives, goals, expectations, anticipations, estimates and intentions that are subject to significant risks and uncertainties and are subject to change based on various factors (some of which are beyond CNB’s control). Forward- looking statements often include the words “believes,” “expects,” “anticipates,” “estimates,” “forecasts,” “intends,” “plans,” “targets,” “potentially,” “probably,” “projects,” “outlook” or similar expressions or future conditional verbs such as “may,” “will,” “should,” “would” and “could.” CNB’s actual results may differ materially from those contemplated by the forward-looking statements, which are neither statements of historical fact nor guarantees or assurances of future performance. Such known and unknown risks, uncertainties and other factors that could cause the actual results to differ materially from the statements, include, but are not limited to, (i) the duration and scope of the COVID-19 pandemic and the local, national and global impact of COVID-19; (ii) actions governments, businesses and individuals take in response to the pandemic; (iii) the speed and effectiveness of vaccine and treatment developments and deployment; (iv) variations of COVID-19, such as the Delta variant, and the response thereto, (v) the pace of recovery when the COVID-19 pandemic subsides; (vi) changes in general business, industry or economic conditions or competition; (vii) changes in any applicable law, rule, regulation, policy, guideline or practice governing or affecting financial holding companies and their subsidiaries or with respect to tax or accounting principles or otherwise; (viii) adverse changes or conditions in capital and financial markets; (ix) changes in interest rates; (x) higher than expected costs or other difficulties related to integration of combined or merged businesses; (xi) the effects of business combinations and other acquisition transactions, including the inability to realize our loan and investment portfolios; (xii) changes in the quality or composition of our loan and investment portfolios; (xiii) adequacy of loan loss reserves; (xiv) increased competition; (xv) loss of certain key officers; (xvi) deposit attrition; (xvii) rapidly changing technology; (xviii) unanticipated regulatory or judicial proceedings and liabilities and other costs; (xix) changes in the cost of funds, demand for loan products or demand for financial services; and (xx) other economic, competitive, governmental or technological factors affecting our operations, markets, products, services and prices. Such developments could have an adverse impact on CNB's financial position and results of operations. For more information about factors that could cause actual results to differ from those discussed in the forward-looking statements, please refer to the “Risk Factors” and “Management’s Discussion and Analysis of Financial Condition and Results of Operations” sections of and the forward-looking statement disclaimers in CNB’s annual and quarterly reports filed with the SEC. The forward-looking statements are based upon management’s beliefs and assumptions and are made as of the date of this presentation. CNB undertakes no obligation to publicly update or revise any forward-looking statements included in this presentation or to update the reasons why actual results could differ from those contained in such statements, whether as a result of new information, future events or otherwise, except to the extent required by law. In light of these risks, uncertainties and assumptions, the forward-looking events discussed in this presentation might not occur and you should not put undue reliance on any forward-looking statements. NON-GAAP FINANCIAL MEASURES This presentation contains references to financial measures that are not defined in GAAP. Management uses non-GAAP financial information in its analysis of the Company’s performance. Management believes that these non-GAAP measures provide a greater understanding of ongoing operations, enhance comparability of results of operations with prior periods and show the effects of significant gains and charges in the periods presented. The Company’s management believes that investors may use these non-GAAP measures to analyze the Company’s financial performance without the impact of unusual items or events that may obscure trends in the Company’s underlying performance. This non-GAAP data should be considered in addition to results prepared in accordance with GAAP, and is not a substitute for, or superior to, GAAP results. Limitations associated with non-GAAP financial measures include the risks that persons might disagree as to the appropriateness of items included in these measures and that different companies might calculate these measures differently. Non-GAAP measures reflected within the presentation include evaluations on the impact of merger costs, branch closure costs and FHLB prepayment penalties on various metrics of the Company’s financial performance. 2

CORPORATE OVERVIEW
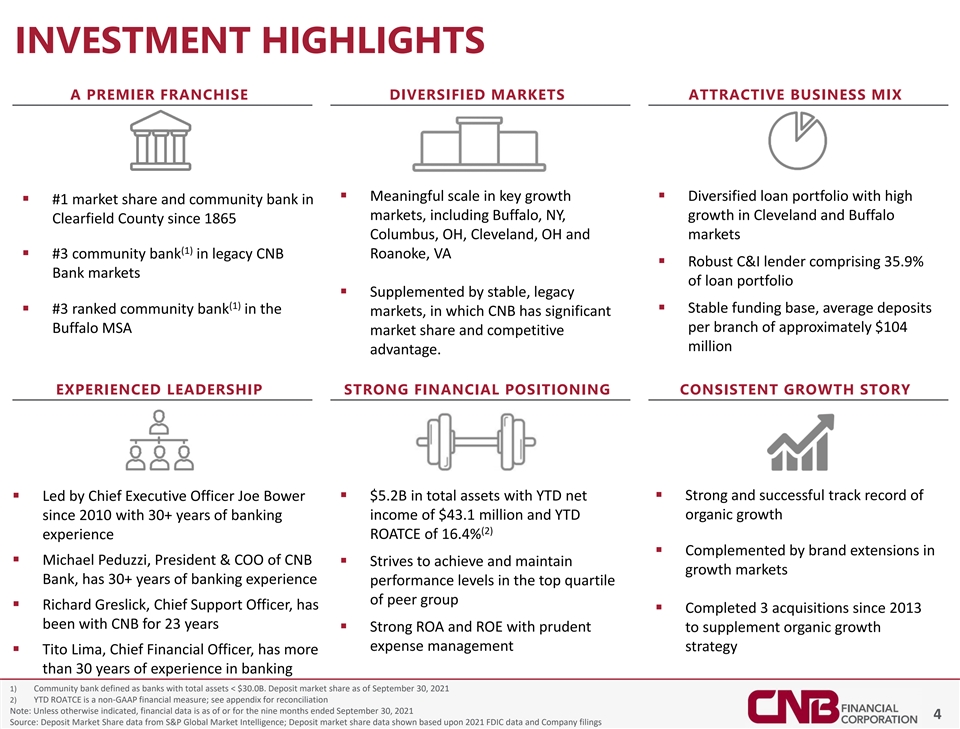
INVESTMENT HIGHLIGHTS A PREMIER FRANCHISE DIVERSIFIED MARKETS ATTRACTIVE BUSINESS MIX ▪ Meaningful scale in key growth ▪ Diversified loan portfolio with high ▪ #1 market share and community bank in markets, including Buffalo, NY, growth in Cleveland and Buffalo Clearfield County since 1865 Columbus, OH, Cleveland, OH and markets (1) ▪ #3 community bank in legacy CNB Roanoke, VA ▪ Robust C&I lender comprising 35.9% Bank markets of loan portfolio ▪ Supplemented by stable, legacy (1) ▪ #3 ranked community bank in the ▪ Stable funding base, average deposits markets, in which CNB has significant per branch of approximately $104 Buffalo MSA market share and competitive million advantage. EXPERIENCED LEADERSHIP STRONG FINANCIAL POSITIONING CONSISTENT GROWTH STORY ▪ Strong and successful track record of ▪ Led by Chief Executive Officer Joe Bower ▪ $5.2B in total assets with YTD net since 2010 with 30+ years of banking income of $43.1 million and YTD organic growth (2) ROATCE of 16.4% experience ▪ Complemented by brand extensions in ▪ Michael Peduzzi, President & COO of CNB ▪ Strives to achieve and maintain growth markets Bank, has 30+ years of banking experience performance levels in the top quartile of peer group ▪ Richard Greslick, Chief Support Officer, has ▪ Completed 3 acquisitions since 2013 been with CNB for 23 years ▪ Strong ROA and ROE with prudent to supplement organic growth expense management strategy ▪ Tito Lima, Chief Financial Officer, has more than 30 years of experience in banking 1) Community bank defined as banks with total assets < $30.0B. Deposit market share as of September 30, 2021 2) YTD ROATCE is a non-GAAP financial measure; see appendix for reconciliation Note: Unless otherwise indicated, financial data is as of or for the nine months ended September 30, 2021 4 Source: Deposit Market Share data from S&P Global Market Intelligence; Deposit market share data shown based upon 2021 FDIC data and Company filings
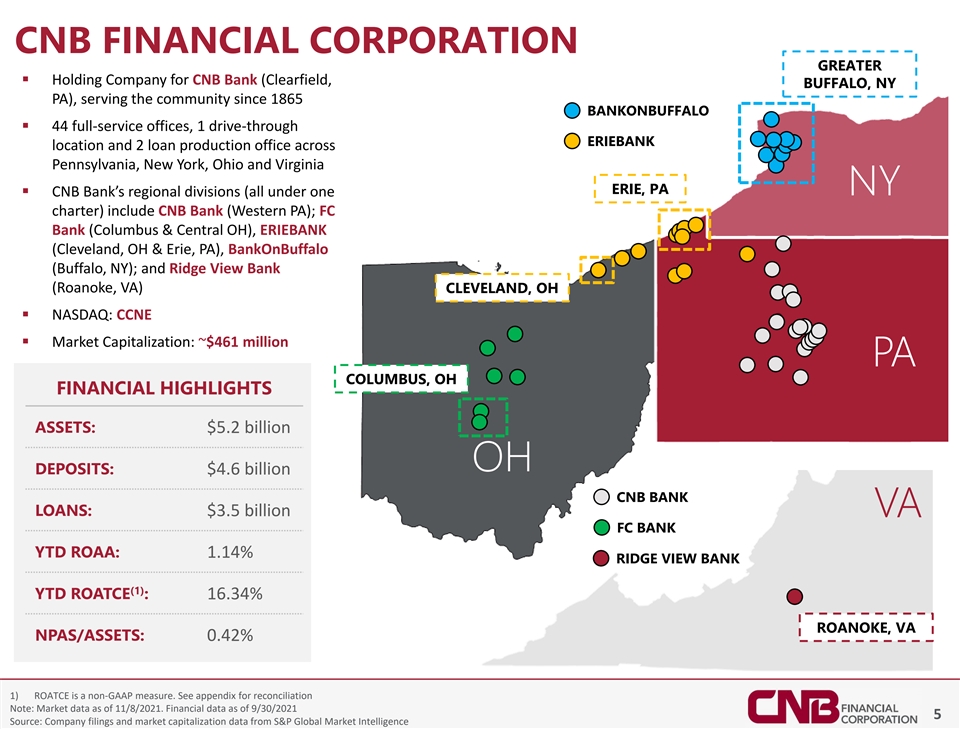
CNB FINANCIAL CORPORATION GREATER ▪ Holding Company for CNB Bank (Clearfield, BUFFALO, NY PA), serving the community since 1865 BANKONBUFFALO ▪ 44 full-service offices, 1 drive-through ERIEBANK location and 2 loan production office across Pennsylvania, New York, Ohio and Virginia ERIE, PA ▪ CNB Bank’s regional divisions (all under one NY charter) include CNB Bank (Western PA); FC Bank (Columbus & Central OH), ERIEBANK (Cleveland, OH & Erie, PA), BankOnBuffalo (Buffalo, NY); and Ridge View Bank (Roanoke, VA) CLEVELAND, OH ▪ NASDAQ: CCNE ▪ Market Capitalization: ~$461 million PA COLUMBUS, OH FINANCIAL HIGHLIGHTS ASSETS: $5.2 billion OH DEPOSITS: $4.6 billion CNB BANK LOANS: $3.5 billion VA FC BANK YTD ROAA: 1.14% RIDGE VIEW BANK (1) YTD ROATCE : 16.34% ROANOKE, VA NPAS/ASSETS: 0.42% 1) ROATCE is a non-GAAP measure. See appendix for reconciliation Note: Market data as of 11/8/2021. Financial data as of 9/30/2021 5 Source: Company filings and market capitalization data from S&P Global Market Intelligence
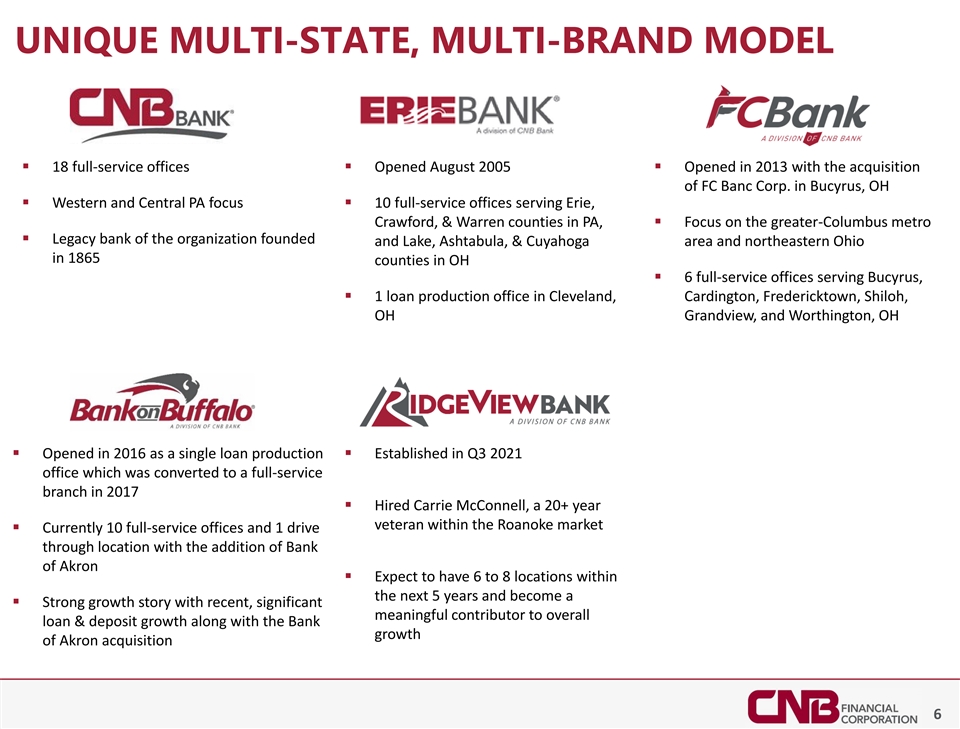
UNIQUE MULTI-STATE, MULTI-BRAND MODEL ▪ 18 full-service offices▪ Opened August 2005▪ Opened in 2013 with the acquisition of FC Banc Corp. in Bucyrus, OH ▪ Western and Central PA focus▪ 10 full-service offices serving Erie, Crawford, & Warren counties in PA, ▪ Focus on the greater-Columbus metro ▪ Legacy bank of the organization founded and Lake, Ashtabula, & Cuyahoga area and northeastern Ohio in 1865 counties in OH ▪ 6 full-service offices serving Bucyrus, ▪ 1 loan production office in Cleveland, Cardington, Fredericktown, Shiloh, OH Grandview, and Worthington, OH ▪ Opened in 2016 as a single loan production ▪ Established in Q3 2021 office which was converted to a full-service branch in 2017 ▪ Hired Carrie McConnell, a 20+ year veteran within the Roanoke market ▪ Currently 10 full-service offices and 1 drive through location with the addition of Bank of Akron ▪ Expect to have 6 to 8 locations within the next 5 years and become a ▪ Strong growth story with recent, significant meaningful contributor to overall loan & deposit growth along with the Bank growth of Akron acquisition 6
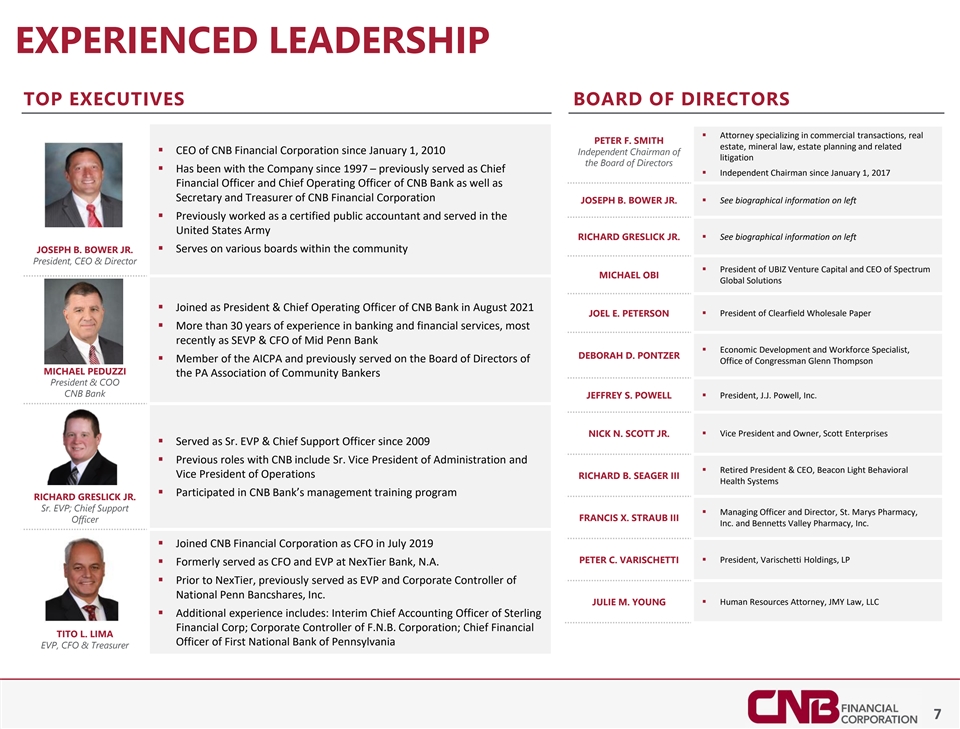
EXPERIENCED LEADERSHIP TOP EXECUTIVES BOARD OF DIRECTORS ▪ Attorney specializing in commercial transactions, real PETER F. SMITH estate, mineral law, estate planning and related ▪ CEO of CNB Financial Corporation since January 1, 2010 Independent Chairman of litigation the Board of Directors ▪ Has been with the Company since 1997 – previously served as Chief ▪ Independent Chairman since January 1, 2017 Financial Officer and Chief Operating Officer of CNB Bank as well as Secretary and Treasurer of CNB Financial Corporation JOSEPH B. BOWER JR.▪ See biographical information on left ▪ Previously worked as a certified public accountant and served in the United States Army RICHARD GRESLICK JR.▪ See biographical information on left ▪ Serves on various boards within the community JOSEPH B. BOWER JR. President, CEO & Director ▪ President of UBIZ Venture Capital and CEO of Spectrum MICHAEL OBI Global Solutions ▪ Joined as President & Chief Operating Officer of CNB Bank in August 2021 ▪ President of Clearfield Wholesale Paper JOEL E. PETERSON ▪ More than 30 years of experience in banking and financial services, most recently as SEVP & CFO of Mid Penn Bank ▪ Economic Development and Workforce Specialist, DEBORAH D. PONTZER ▪ Member of the AICPA and previously served on the Board of Directors of Office of Congressman Glenn Thompson MICHAEL PEDUZZI the PA Association of Community Bankers President & COO CNB Bank JEFFREY S. POWELL▪ President, J.J. Powell, Inc. NICK N. SCOTT JR.▪ Vice President and Owner, Scott Enterprises ▪ Served as Sr. EVP & Chief Support Officer since 2009 ▪ Previous roles with CNB include Sr. Vice President of Administration and ▪ Retired President & CEO, Beacon Light Behavioral Vice President of Operations RICHARD B. SEAGER III Health Systems ▪ Participated in CNB Bank’s management training program RICHARD GRESLICK JR. Sr. EVP; Chief Support ▪ Managing Officer and Director, St. Marys Pharmacy, FRANCIS X. STRAUB III Officer Inc. and Bennetts Valley Pharmacy, Inc. ▪ Joined CNB Financial Corporation as CFO in July 2019 ▪ President, Varischetti Holdings, LP PETER C. VARISCHETTI ▪ Formerly served as CFO and EVP at NexTier Bank, N.A. ▪ Prior to NexTier, previously served as EVP and Corporate Controller of National Penn Bancshares, Inc. JULIE M. YOUNG▪ Human Resources Attorney, JMY Law, LLC ▪ Additional experience includes: Interim Chief Accounting Officer of Sterling Financial Corp; Corporate Controller of F.N.B. Corporation; Chief Financial TITO L. LIMA Officer of First National Bank of Pennsylvania EVP, CFO & Treasurer 7
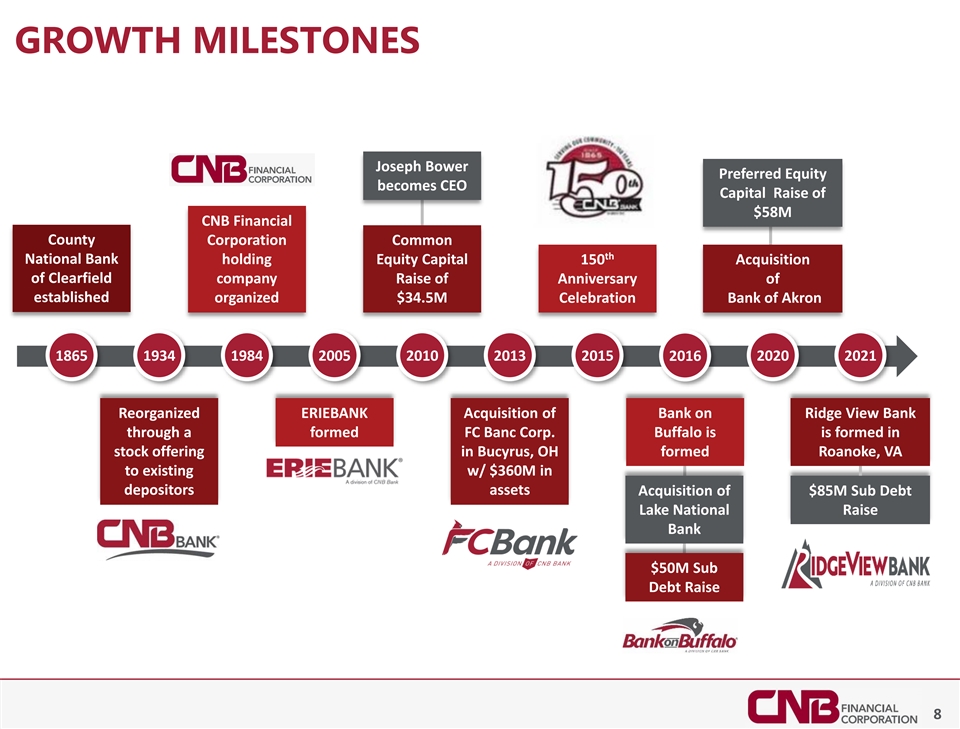
GROWTH MILESTONES Joseph Bower Preferred Equity becomes CEO Capital Raise of $58M CNB Financial County Corporation Common th National Bank holding Equity Capital 150 Acquisition of Clearfield company Raise of Anniversary of established organized $34.5M Celebration Bank of Akron 1865 1934 1984 2005 2010 2013 2015 2016 2020 2021 Reorganized ERIEBANK Acquisition of Bank on Ridge View Bank through a formed FC Banc Corp. Buffalo is is formed in stock offering in Bucyrus, OH formed Roanoke, VA to existing w/ $360M in depositors assets Acquisition of $85M Sub Debt Lake National Raise Bank $50M Sub Debt Raise 8
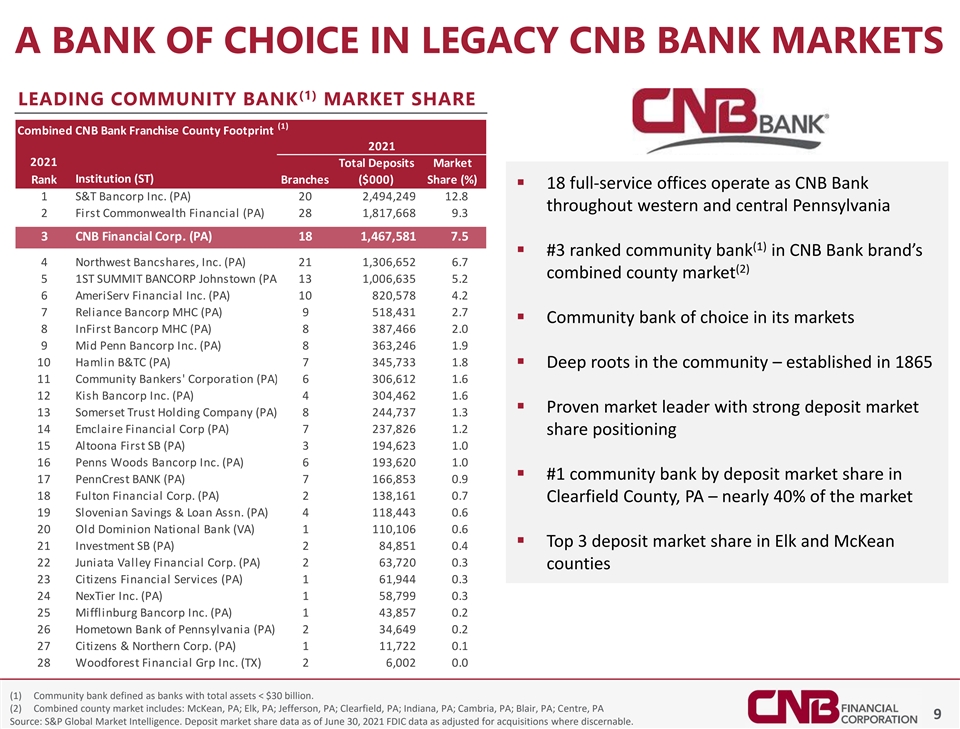
A BANK OF CHOICE IN LEGACY CNB BANK MARKETS (1) LEADING COMMUNITY BANK MARKET SHARE (1) Combined CNB Bank Franchise County Footprint (2) 2021 2021 Total Deposits Market Institution (ST) Rank Branches ($000) Share (%) ▪ 18 full-service offices operate as CNB Bank 1 S&T Bancorp Inc. (PA) 20 2,494,249 12.8 throughout western and central Pennsylvania 2 First Commonwealth Financial (PA) 28 1,817,668 9.3 3 CNB Financial Corp. (PA) 18 1,467,581 7.5 (1) ▪ #3 ranked community bank in CNB Bank brand’s 4 Northwest Bancshares, Inc. (PA) 21 1,306,652 6.7 (2) combined county market 5 1ST SUMMIT BANCORP Johnstown (PA) 13 1,006,635 5.2 6 AmeriServ Financial Inc. (PA) 10 820,578 4.2 7 Reliance Bancorp MHC (PA) 9 518,431 2.7 ▪ Community bank of choice in its markets 8 InFirst Bancorp MHC (PA) 8 387,466 2.0 9 Mid Penn Bancorp Inc. (PA) 8 363,246 1.9 10 Hamlin B&TC (PA) 7 345,733 1.8 ▪ Deep roots in the community – established in 1865 11 Community Bankers' Corporation (PA) 6 306,612 1.6 12 Kish Bancorp Inc. (PA) 4 304,462 1.6 ▪ Proven market leader with strong deposit market 13 Somerset Trust Holding Company (PA) 8 244,737 1.3 14 Emclaire Financial Corp (PA) 7 237,826 1.2 share positioning 15 Altoona First SB (PA) 3 194,623 1.0 16 Penns Woods Bancorp Inc. (PA) 6 193,620 1.0 ▪ #1 community bank by deposit market share in 17 PennCrest BANK (PA) 7 166,853 0.9 18 Fulton Financial Corp. (PA) 2 138,161 0.7 Clearfield County, PA – nearly 40% of the market 19 Slovenian Savings & Loan Assn. (PA) 4 118,443 0.6 20 Old Dominion National Bank (VA) 1 110,106 0.6 ▪ Top 3 deposit market share in Elk and McKean 21 Investment SB (PA) 2 84,851 0.4 22 Juniata Valley Financial Corp. (PA) 2 63,720 0.3 counties 23 Citizens Financial Services (PA) 1 61,944 0.3 24 NexTier Inc. (PA) 1 58,799 0.3 25 Mifflinburg Bancorp Inc. (PA) 1 43,857 0.2 26 Hometown Bank of Pennsylvania (PA) 2 34,649 0.2 27 Citizens & Northern Corp. (PA) 1 11,722 0.1 28 Woodforest Financial Grp Inc. (TX) 2 6,002 0.0 (1) Community bank defined as banks with total assets < $30 billion. (2) Combined county market includes: McKean, PA; Elk, PA; Jefferson, PA; Clearfield, PA; Indiana, PA; Cambria, PA; Blair, PA; Centre, PA 9 Source: S&P Global Market Intelligence. Deposit market share data as of June 30, 2021 FDIC data as adjusted for acquisitions where discernable.
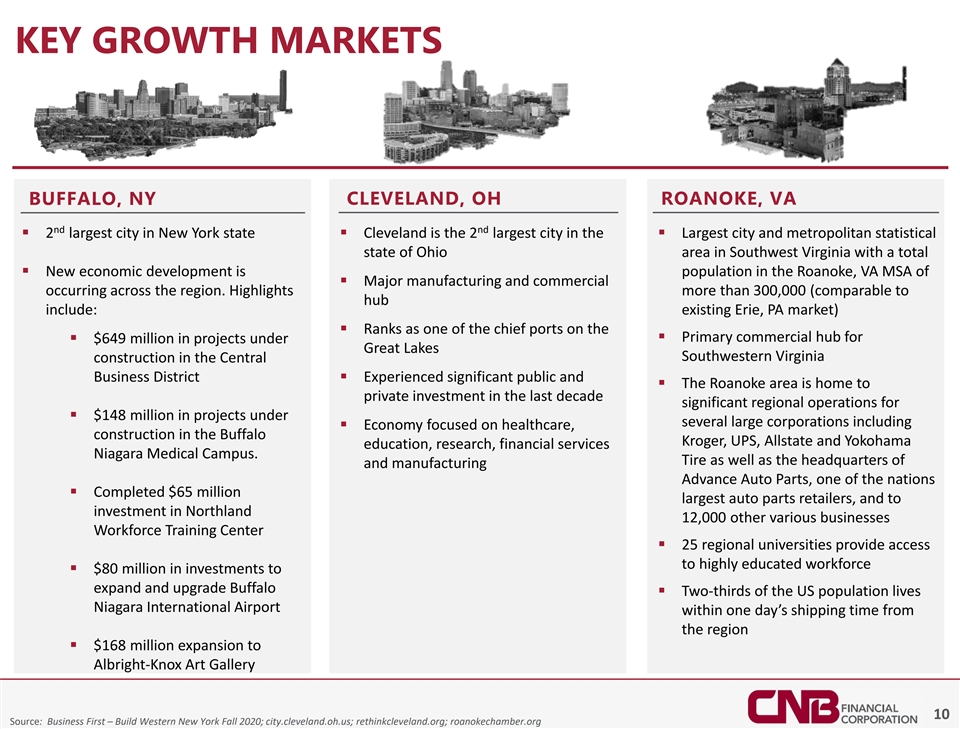
KEY GROWTH MARKETS BUFFALO, NY CLEVELAND, OH ROANOKE, VA nd nd ▪ 2 largest city in New York state▪ Cleveland is the 2 largest city in the ▪ Largest city and metropolitan statistical state of Ohio area in Southwest Virginia with a total ▪ New economic development is population in the Roanoke, VA MSA of ▪ Major manufacturing and commercial occurring across the region. Highlights more than 300,000 (comparable to hub include: existing Erie, PA market) ▪ Ranks as one of the chief ports on the ▪ Primary commercial hub for ▪ $649 million in projects under Great Lakes Southwestern Virginia construction in the Central Business District▪ Experienced significant public and ▪ The Roanoke area is home to private investment in the last decade significant regional operations for ▪ $148 million in projects under several large corporations including ▪ Economy focused on healthcare, construction in the Buffalo Kroger, UPS, Allstate and Yokohama education, research, financial services Niagara Medical Campus. Tire as well as the headquarters of and manufacturing Advance Auto Parts, one of the nations ▪ Completed $65 million largest auto parts retailers, and to investment in Northland 12,000 other various businesses Workforce Training Center ▪ 25 regional universities provide access to highly educated workforce ▪ $80 million in investments to expand and upgrade Buffalo ▪ Two-thirds of the US population lives Niagara International Airport within one day’s shipping time from the region ▪ $168 million expansion to Albright-Knox Art Gallery 10 Source: Business First – Build Western New York Fall 2020; city.cleveland.oh.us; rethinkcleveland.org; roanokechamber.org
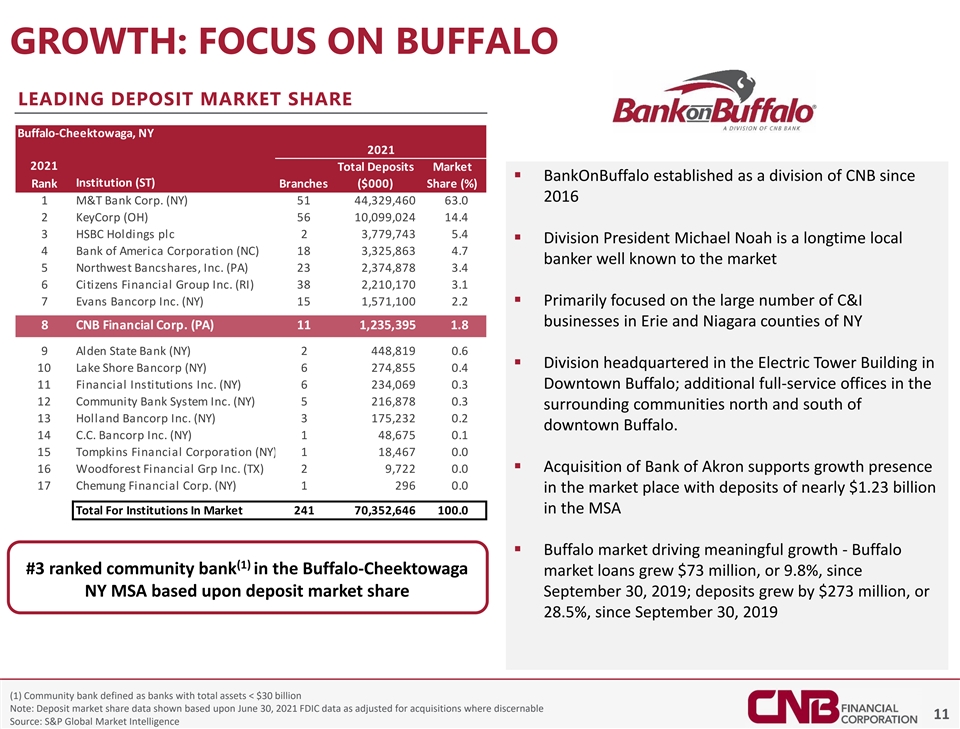
GROWTH: FOCUS ON BUFFALO LEADING DEPOSIT MARKET SHARE Buffalo-Cheektowaga, NY 2021 2021 Total Deposits Market ▪ BankOnBuffalo established as a division of CNB since Institution (ST) Rank Branches ($000) Share (%) 2016 1 M&T Bank Corp. (NY) 51 44,329,460 63.0 2 KeyCorp (OH) 56 10,099,024 14.4 3 HSBC Holdings plc 2 3,779,743 5.4 ▪ Division President Michael Noah is a longtime local 4 Bank of America Corporation (NC) 18 3,325,863 4.7 banker well known to the market 5 Northwest Bancshares, Inc. (PA) 23 2,374,878 3.4 6 Citizens Financial Group Inc. (RI) 38 2,210,170 3.1 7 Evans Bancorp Inc. (NY) 15 1,571,100 2.2▪ Primarily focused on the large number of C&I businesses in Erie and Niagara counties of NY 8 CNB Financial Corp. (PA) 11 1,235,395 1.8 9 Alden State Bank (NY) 2 448,819 0.6 ▪ Division headquartered in the Electric Tower Building in 10 Lake Shore Bancorp (NY) 6 274,855 0.4 11 Financial Institutions Inc. (NY) 6 234,069 0.3 Downtown Buffalo; additional full-service offices in the 12 Community Bank System Inc. (NY) 5 216,878 0.3 surrounding communities north and south of 13 Holland Bancorp Inc. (NY) 3 175,232 0.2 downtown Buffalo. 14 C.C. Bancorp Inc. (NY) 1 48,675 0.1 15 Tompkins Financial Corporation (NY) 1 18,467 0.0 ▪ Acquisition of Bank of Akron supports growth presence 16 Woodforest Financial Grp Inc. (TX) 2 9,722 0.0 17 Chemung Financial Corp. (NY) 1 296 0.0 in the market place with deposits of nearly $1.23 billion in the MSA Total For Institutions In Market 241 70,352,646 100.0 ▪ Buffalo market driving meaningful growth - Buffalo (1) #3 ranked community bank in the Buffalo-Cheektowaga market loans grew $73 million, or 9.8%, since NY MSA based upon deposit market share September 30, 2019; deposits grew by $273 million, or 28.5%, since September 30, 2019 (1) Community bank defined as banks with total assets < $30 billion Note: Deposit market share data shown based upon June 30, 2021 FDIC data as adjusted for acquisitions where discernable 11 Source: S&P Global Market Intelligence
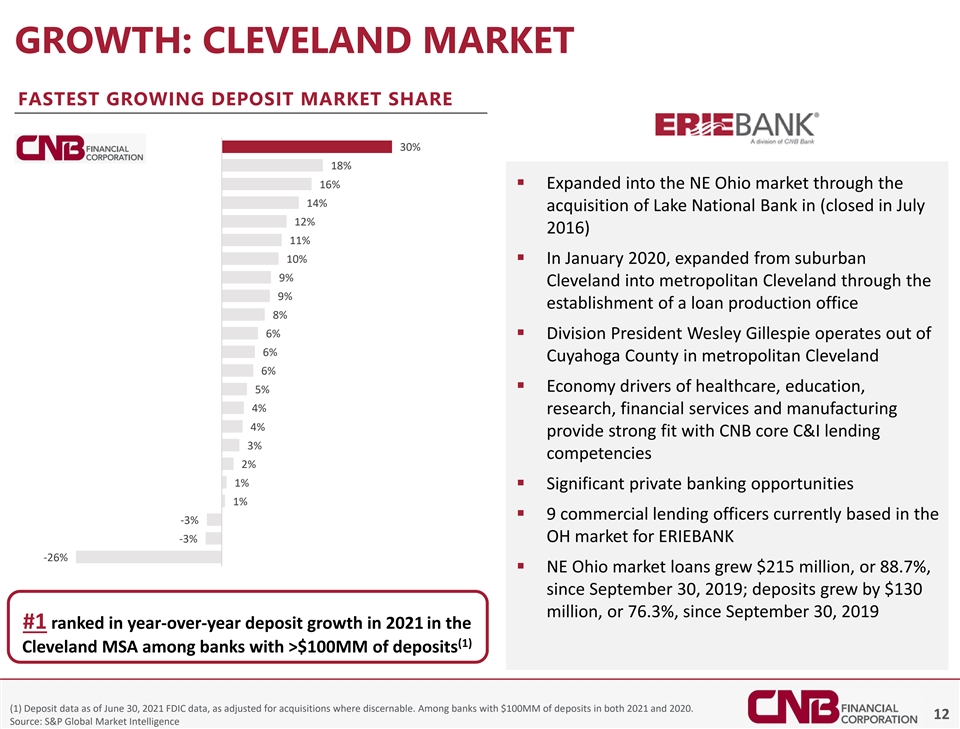
GROWTH: CLEVELAND MARKET FASTEST GROWING DEPOSIT MARKET SHARE 30% 18% 16% ▪ Expanded into the NE Ohio market through the 14% acquisition of Lake National Bank in (closed in July 12% 2016) 11% 10% ▪ In January 2020, expanded from suburban 9% Cleveland into metropolitan Cleveland through the 9% establishment of a loan production office 8% 6% ▪ Division President Wesley Gillespie operates out of 6% Cuyahoga County in metropolitan Cleveland 6% ▪ Economy drivers of healthcare, education, 5% 4% research, financial services and manufacturing 4% provide strong fit with CNB core C&I lending 3% competencies 2% 1% ▪ Significant private banking opportunities 1% ▪ 9 commercial lending officers currently based in the -3% -3% OH market for ERIEBANK -26% ▪ NE Ohio market loans grew $215 million, or 88.7%, since September 30, 2019; deposits grew by $130 million, or 76.3%, since September 30, 2019 #1 ranked in year-over-year deposit growth in 2021 in the (1) Cleveland MSA among banks with >$100MM of deposits (1) Deposit data as of June 30, 2021 FDIC data, as adjusted for acquisitions where discernable. Among banks with $100MM of deposits in both 2021 and 2020. 12 Source: S&P Global Market Intelligence

BUSINESS HIGHLIGHTS
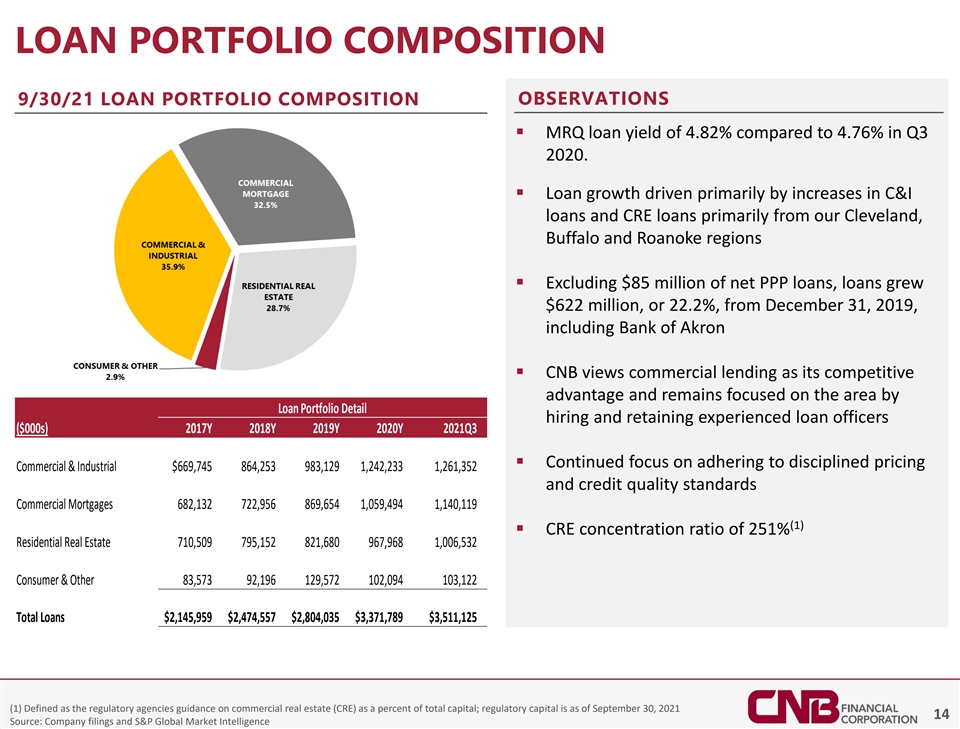
LOAN PORTFOLIO COMPOSITION 9/30/21 LOAN PORTFOLIO COMPOSITION OBSERVATIONS ▪ MRQ loan yield of 4.82% compared to 4.76% in Q3 2020. ▪ Loan growth driven primarily by increases in C&I loans and CRE loans primarily from our Cleveland, Buffalo and Roanoke regions ▪ Excluding $85 million of net PPP loans, loans grew $622 million, or 22.2%, from December 31, 2019, including Bank of Akron ▪ CNB views commercial lending as its competitive advantage and remains focused on the area by Loan Portfolio Detail hiring and retaining experienced loan officers ($000s) 2017Y 2018Y 2019Y 2020Y 2021Q3 ▪ Continued focus on adhering to disciplined pricing Commercial & Industrial $669,745 864,253 983,129 1,242,233 1,261,352 and credit quality standards Commercial Mortgages 682,132 722,956 869,654 1,059,494 1,140,119 (1) ▪ CRE concentration ratio of 251% Residential Real Estate 710,509 795,152 821,680 967,968 1,006,532 Consumer & Other 83,573 92,196 129,572 102,094 103,122 Total Loans $2,145,959 $2,474,557 $2,804,035 $3,371,789 $3,511,125 (1) Defined as the regulatory agencies guidance on commercial real estate (CRE) as a percent of total capital; regulatory capital is as of September 30, 2021 14 Source: Company filings and S&P Global Market Intelligence
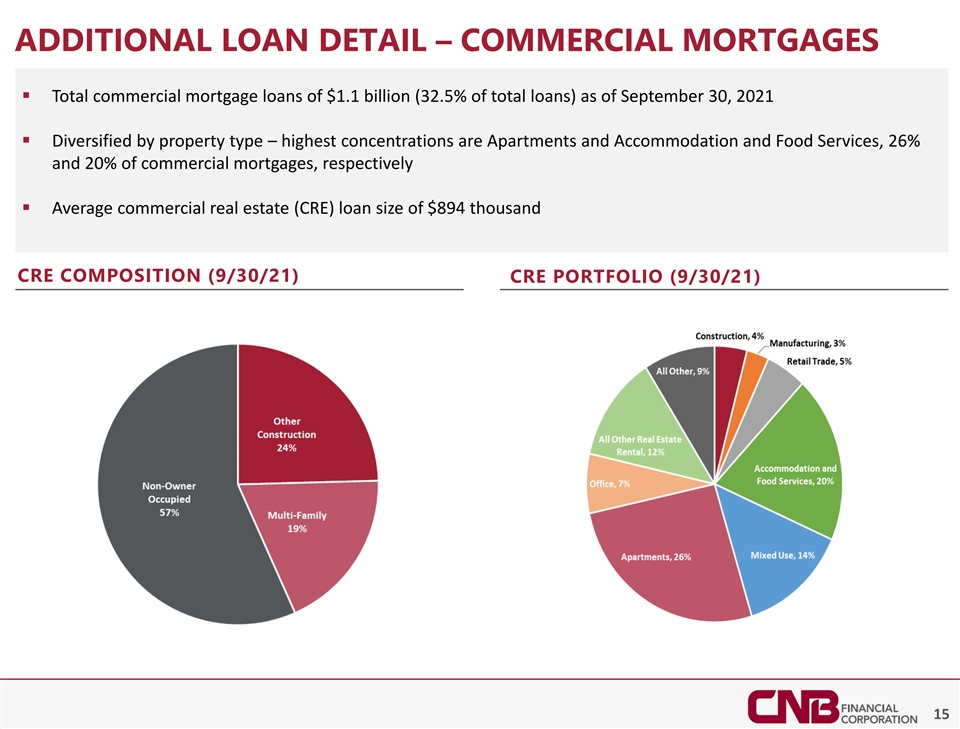
ADDITIONAL LOAN DETAIL – COMMERCIAL MORTGAGES ▪ Total commercial mortgage loans of $1.1 billion (32.5% of total loans) as of September 30, 2021 ▪ Diversified by property type – highest concentrations are Apartments and Accommodation and Food Services, 26% and 20% of commercial mortgages, respectively ▪ Average commercial real estate (CRE) loan size of $894 thousand CRE COMPOSITION (9/30/21) CRE PORTFOLIO (9/30/21) 15
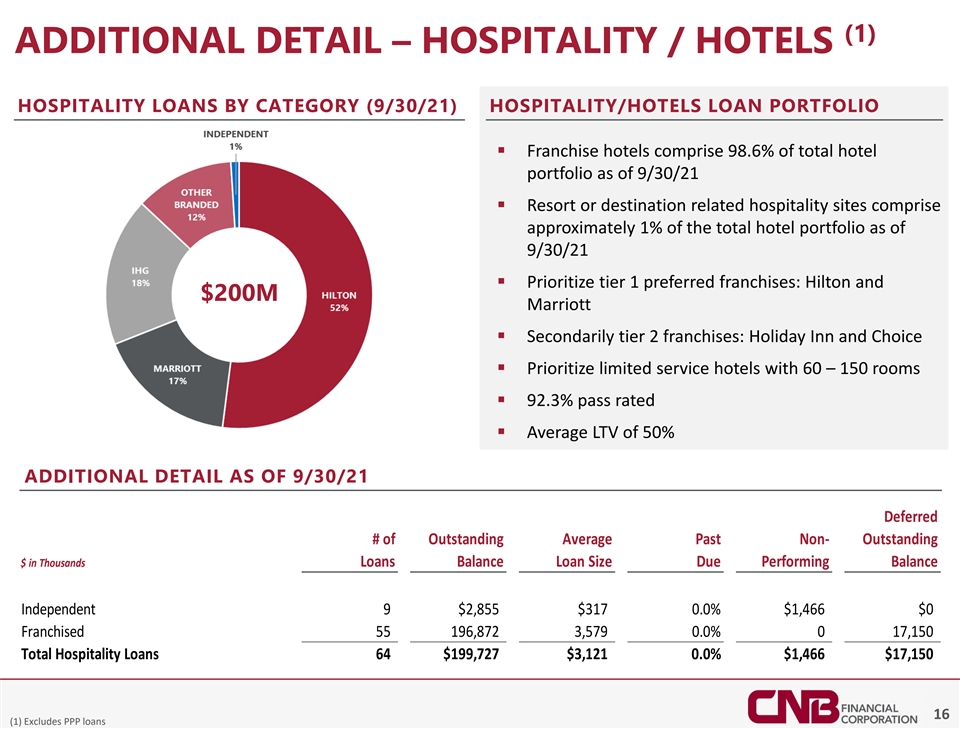
(1) ADDITIONAL DETAIL – HOSPITALITY / HOTELS HOSPITALITY LOANS BY CATEGORY (9/30/21) HOSPITALITY/HOTELS LOAN PORTFOLIO ▪ Franchise hotels comprise 98.6% of total hotel portfolio as of 9/30/21 ▪ Resort or destination related hospitality sites comprise approximately 1% of the total hotel portfolio as of 9/30/21 ▪ Prioritize tier 1 preferred franchises: Hilton and $200M Marriott ▪ Secondarily tier 2 franchises: Holiday Inn and Choice ▪ Prioritize limited service hotels with 60 – 150 rooms ▪ 92.3% pass rated ▪ Average LTV of 50% ADDITIONAL DETAIL AS OF 9/30/21 Deferred # of Outstanding Average Past Non- Outstanding $ in Thousands Loans Balance Loan Size Due Performing Balance Independent 9 $2,855 $317 0.0% $1,466 $0 Franchised 55 196,872 3,579 0.0% 0 17,150 Total Hospitality Loans 64 $199,727 $3,121 0.0% $1,466 $17,150 16 (1) Excludes PPP loans
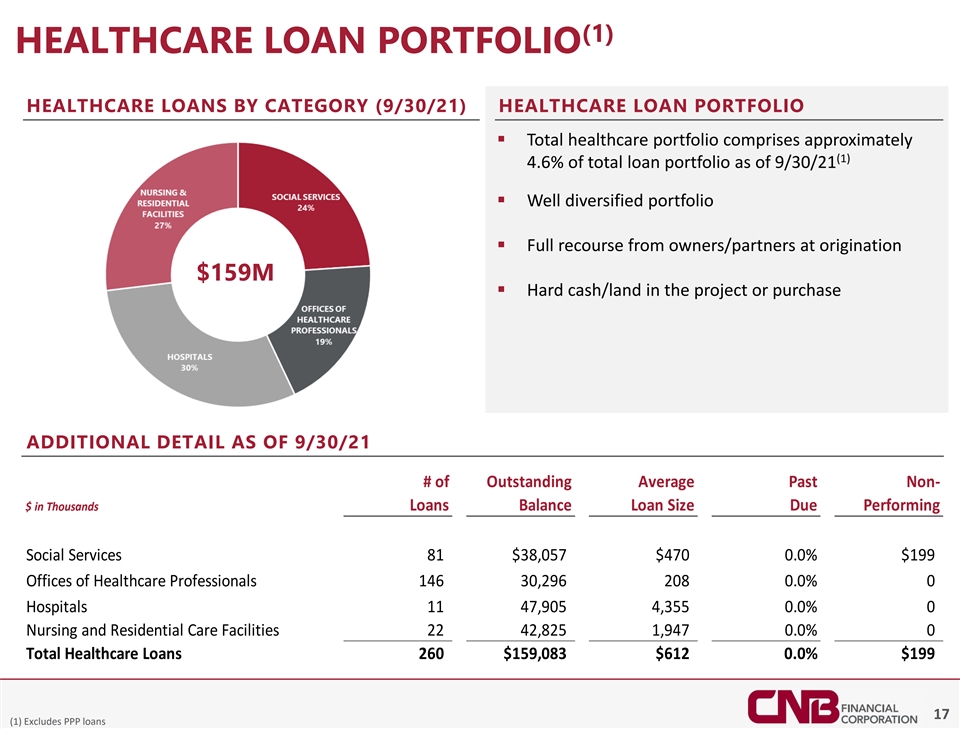
(1) HEALTHCARE LOAN PORTFOLIO HEALTHCARE LOANS BY CATEGORY (9/30/21) HEALTHCARE LOAN PORTFOLIO ▪ Total healthcare portfolio comprises approximately (1) 4.6% of total loan portfolio as of 9/30/21 ▪ Well diversified portfolio ▪ Full recourse from owners/partners at origination $159M ▪ Hard cash/land in the project or purchase ADDITIONAL DETAIL AS OF 9/30/21 # of Outstanding Average Past Non- $ in Thousands Loans Balance Loan Size Due Performing Social Services 81 $38,057 $470 0.0% $199 Offices of Healthcare Professionals 146 30,296 208 0.0% 0 Hospitals 11 47,905 4,355 0.0% 0 Nursing and Residential Care Facilities 22 42,825 1,947 0.0% 0 Total Healthcare Loans 260 $159,083 $612 0.0% $199 17 (1) Excludes PPP loans
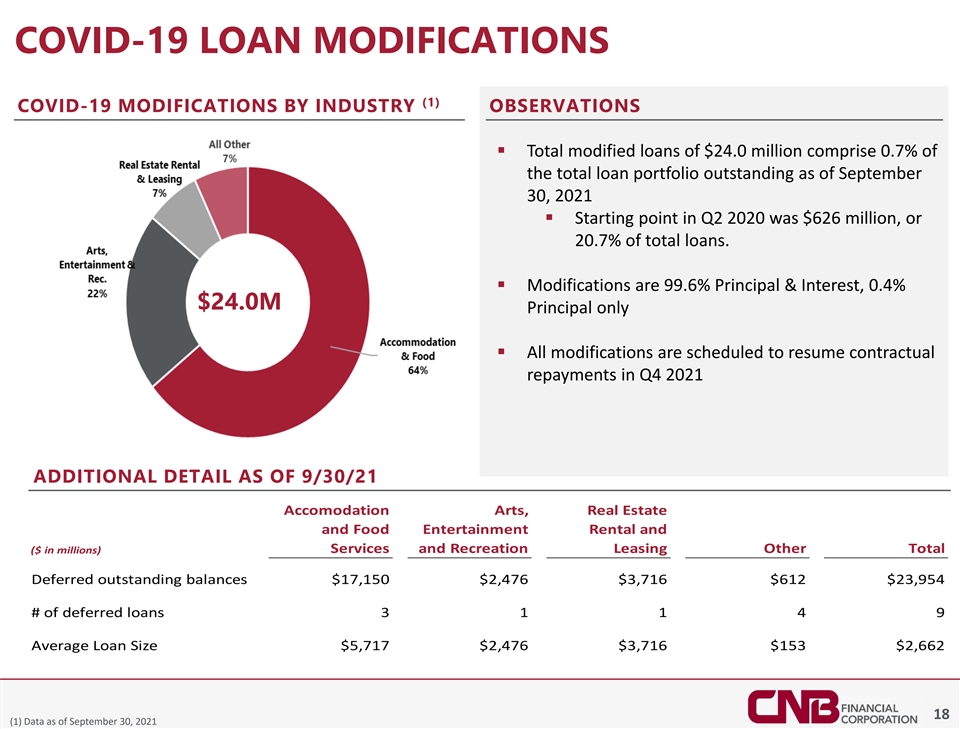
COVID-19 LOAN MODIFICATIONS (1) COVID-19 MODIFICATIONS BY INDUSTRY OBSERVATIONS ▪ Total modified loans of $24.0 million comprise 0.7% of the total loan portfolio outstanding as of September 30, 2021 ▪ Starting point in Q2 2020 was $626 million, or 20.7% of total loans. ▪ Modifications are 99.6% Principal & Interest, 0.4% $24.0M Principal only ▪ All modifications are scheduled to resume contractual repayments in Q4 2021 ADDITIONAL DETAIL AS OF 9/30/21 Accomodation Arts, Real Estate and Food Entertainment Rental and ($ in millions) Services and Recreation Leasing Other Total Deferred outstanding balances $17,150 $2,476 $3,716 $612 $23,954 # of deferred loans 3 1 1 4 9 Average Loan Size $5,717 $2,476 $3,716 $153 $2,662 18 (1) Data as of September 30, 2021
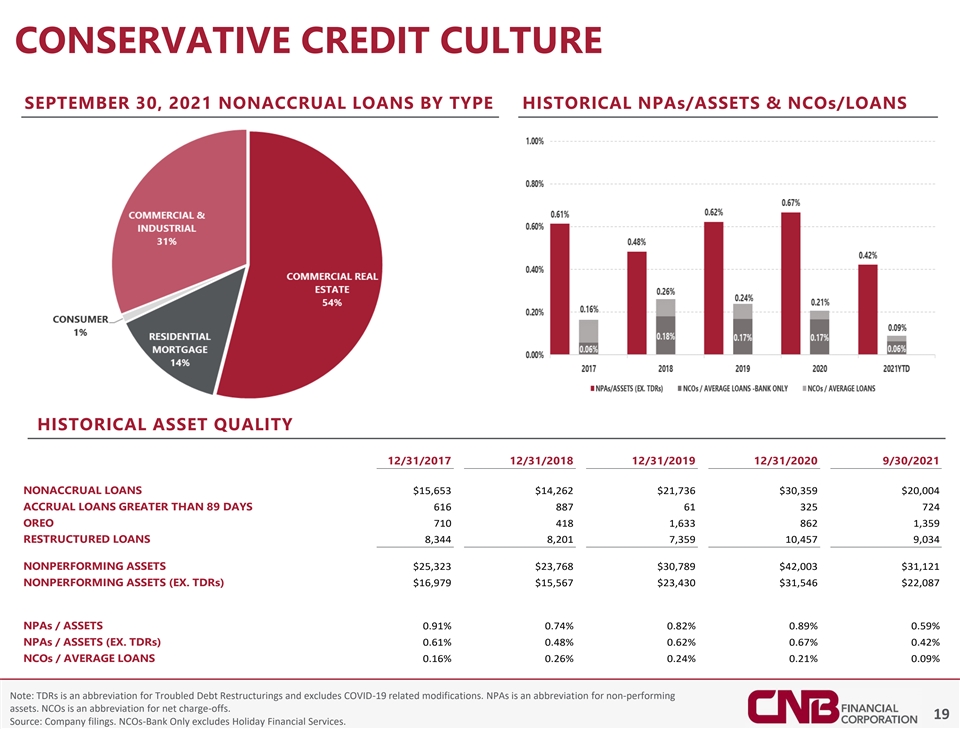
CONSERVATIVE CREDIT CULTURE SEPTEMBER 30, 2021 NONACCRUAL LOANS BY TYPE HISTORICAL NPAs/ASSETS & NCOs/LOANS HISTORICAL ASSET QUALITY 12/31/2017 12/31/2018 12/31/2019 12/31/2020 9/30/2021 NONACCRUAL LOANS $15,653 $14,262 $21,736 $30,359 $20,004 ACCRUAL LOANS GREATER THAN 89 DAYS 616 887 61 325 724 OREO 710 418 1,633 862 1,359 RESTRUCTURED LOANS 8,344 8,201 7,359 10,457 9,034 NONPERFORMING ASSETS $25,323 $23,768 $30,789 $42,003 $31,121 NONPERFORMING ASSETS (EX. TDRs) $16,979 $15,567 $23,430 $31,546 $22,087 NPAs / ASSETS 0.91% 0.74% 0.82% 0.89% 0.59% NPAs / ASSETS (EX. TDRs) 0.61% 0.48% 0.62% 0.67% 0.42% NCOs / AVERAGE LOANS 0.16% 0.26% 0.24% 0.21% 0.09% Note: TDRs is an abbreviation for Troubled Debt Restructurings and excludes COVID-19 related modifications. NPAs is an abbreviation for non-performing assets. NCOs is an abbreviation for net charge-offs. 19 Source: Company filings. NCOs-Bank Only excludes Holiday Financial Services.
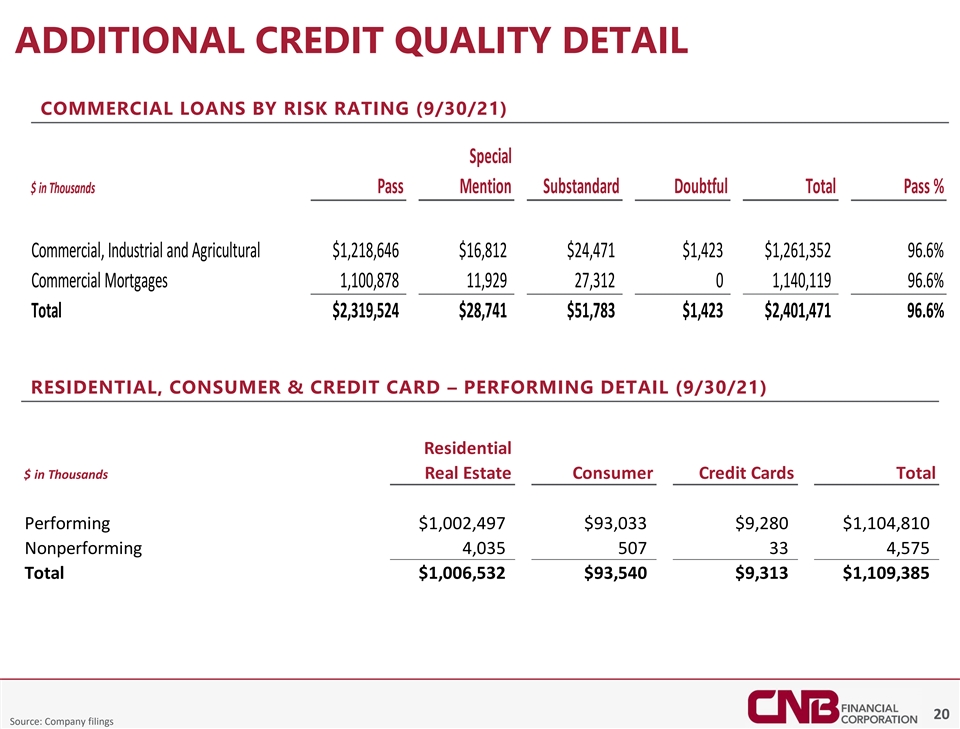
ADDITIONAL CREDIT QUALITY DETAIL COMMERCIAL LOANS BY RISK RATING (9/30/21) Special $ in Thousands Pass Mention Substandard Doubtful Total Pass % Commercial, Industrial and Agricultural $1,218,646 $16,812 $24,471 $1,423 $1,261,352 96.6% Commercial Mortgages 1,100,878 11,929 27,312 0 1,140,119 96.6% Total $2,319,524 $28,741 $51,783 $1,423 $2,401,471 96.6% RESIDENTIAL, CONSUMER & CREDIT CARD – PERFORMING DETAIL (9/30/21) Residential $ in Thousands Real Estate Consumer Credit Cards Total Performing $1,002,497 $93,033 $9,280 $1,104,810 Nonperforming 4,035 507 33 4,575 Total $1,006,532 $93,540 $9,313 $1,109,385 20 Source: Company filings
SBA PPP LOANS SBA PAYCHECK PROTECTION PROGRAM (PPP) (AS OF SEPTEMBER 30, 2021) ▪ PPP Round 1 has $522 thousand loan outstandings as of September 30, 2021, with $8 thousand in deferred processing fees ▪ Initial PPP Round 1 as of June 30, 2020, had $226 million loan outstandings with $8.8 million in deferred processing fees ▪ PPP Round 2 has loan outstandings of $88.6 million with $3.8 million in deferred processing fees as of September 30, 2021 ▪ Over 30,000 employees are estimated to benefit at companies receiving funds from the Corporation through the PPP ▪ Focused on supporting business and communities 21 Note: Data as of September 30, 2021
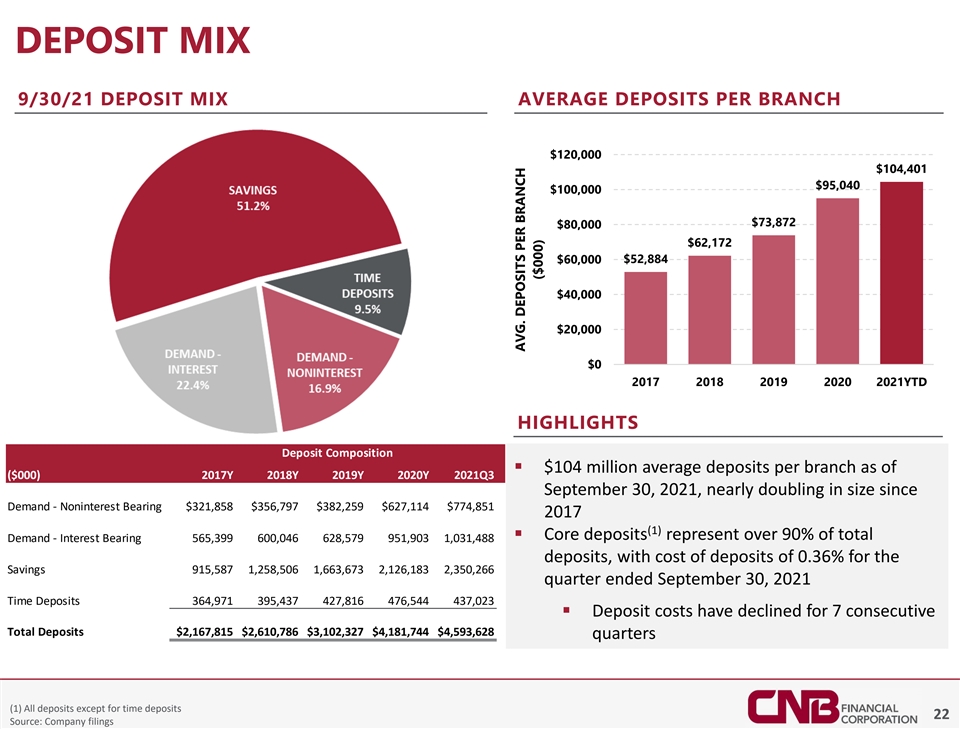
DEPOSIT MIX 9/30/21 DEPOSIT MIX AVERAGE DEPOSITS PER BRANCH $120,000 $104,401 $95,040 $100,000 $73,872 $80,000 $62,172 $52,884 $60,000 $40,000 $20,000 $0 2017 2018 2019 2020 2021YTD HIGHLIGHTS Deposit Composition ▪ $104 million average deposits per branch as of ($000) 2017Y 2018Y 2019Y 2020Y 2021Q3 September 30, 2021, nearly doubling in size since Demand - Noninterest Bearing $321,858 $356,797 $382,259 $627,114 $774,851 2017 (1) ▪ Core deposits represent over 90% of total Demand - Interest Bearing 565,399 600,046 628,579 951,903 1,031,488 deposits, with cost of deposits of 0.36% for the Savings 915,587 1,258,506 1,663,673 2,126,183 2,350,266 quarter ended September 30, 2021 Time Deposits 364,971 395,437 427,816 476,544 437,023 ▪ Deposit costs have declined for 7 consecutive Total Deposits $2,167,815 $2,610,786 $3,102,327 $4,181,744 $4,593,628 quarters (1) All deposits except for time deposits 22 Source: Company filings AVG. DEPOSITS PER BRANCH ($000)

FINANCIAL HIGHLIGHTS
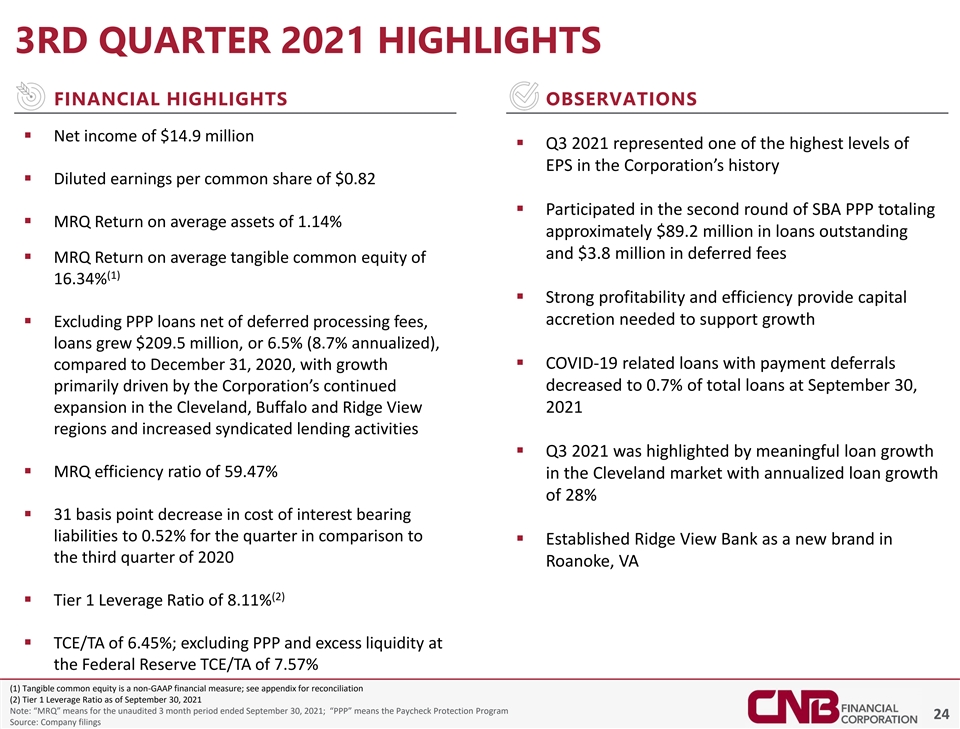
3RD QUARTER 2021 HIGHLIGHTS FINANCIAL HIGHLIGHTS OBSERVATIONS ▪ Net income of $14.9 million ▪ Q3 2021 represented one of the highest levels of EPS in the Corporation’s history ▪ Diluted earnings per common share of $0.82 ▪ Participated in the second round of SBA PPP totaling ▪ MRQ Return on average assets of 1.14% approximately $89.2 million in loans outstanding and $3.8 million in deferred fees ▪ MRQ Return on average tangible common equity of (1) 16.34% ▪ Strong profitability and efficiency provide capital accretion needed to support growth ▪ Excluding PPP loans net of deferred processing fees, loans grew $209.5 million, or 6.5% (8.7% annualized), ▪ COVID-19 related loans with payment deferrals compared to December 31, 2020, with growth decreased to 0.7% of total loans at September 30, primarily driven by the Corporation’s continued expansion in the Cleveland, Buffalo and Ridge View 2021 regions and increased syndicated lending activities ▪ Q3 2021 was highlighted by meaningful loan growth ▪ MRQ efficiency ratio of 59.47% in the Cleveland market with annualized loan growth of 28% ▪ 31 basis point decrease in cost of interest bearing liabilities to 0.52% for the quarter in comparison to ▪ Established Ridge View Bank as a new brand in the third quarter of 2020 Roanoke, VA (2) ▪ Tier 1 Leverage Ratio of 8.11% ▪ TCE/TA of 6.45%; excluding PPP and excess liquidity at the Federal Reserve TCE/TA of 7.57% (1) Tangible common equity is a non-GAAP financial measure; see appendix for reconciliation (2) Tier 1 Leverage Ratio as of September 30, 2021 Note: “MRQ” means for the unaudited 3 month period ended September 30, 2021; “PPP” means the Paycheck Protection Program 24 Source: Company filings
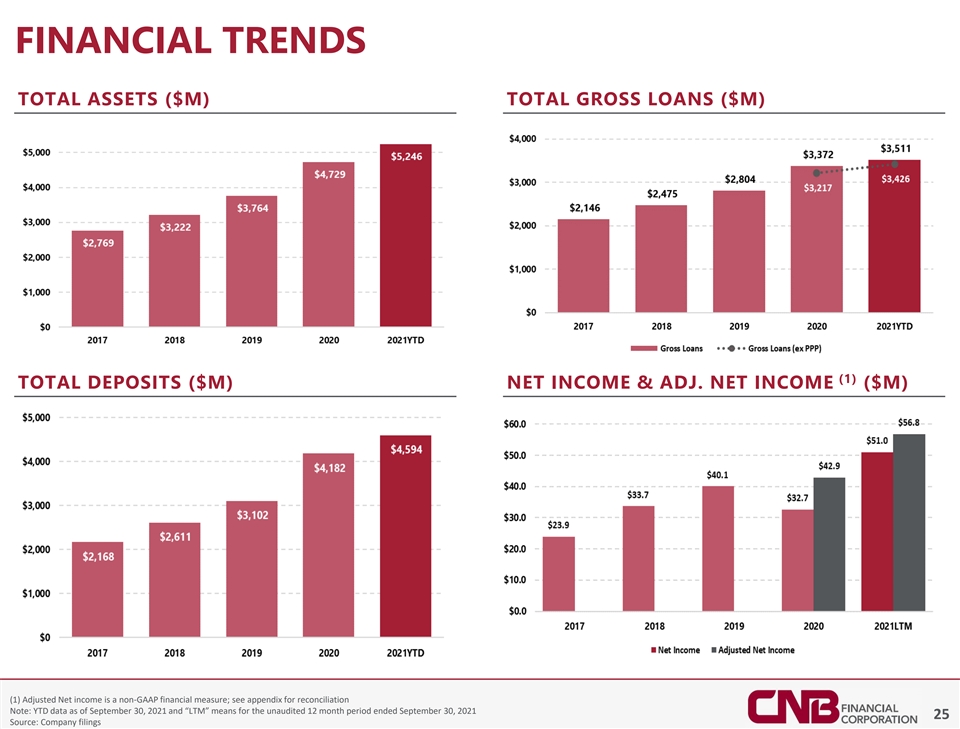
FINANCIAL TRENDS TOTAL ASSETS ($M) TOTAL GROSS LOANS ($M) (1) TOTAL DEPOSITS ($M) NET INCOME & ADJ. NET INCOME ($M) (1) Adjusted Net income is a non-GAAP financial measure; see appendix for reconciliation Note: YTD data as of September 30, 2021 and “LTM” means for the unaudited 12 month period ended September 30, 2021 25 Source: Company filings
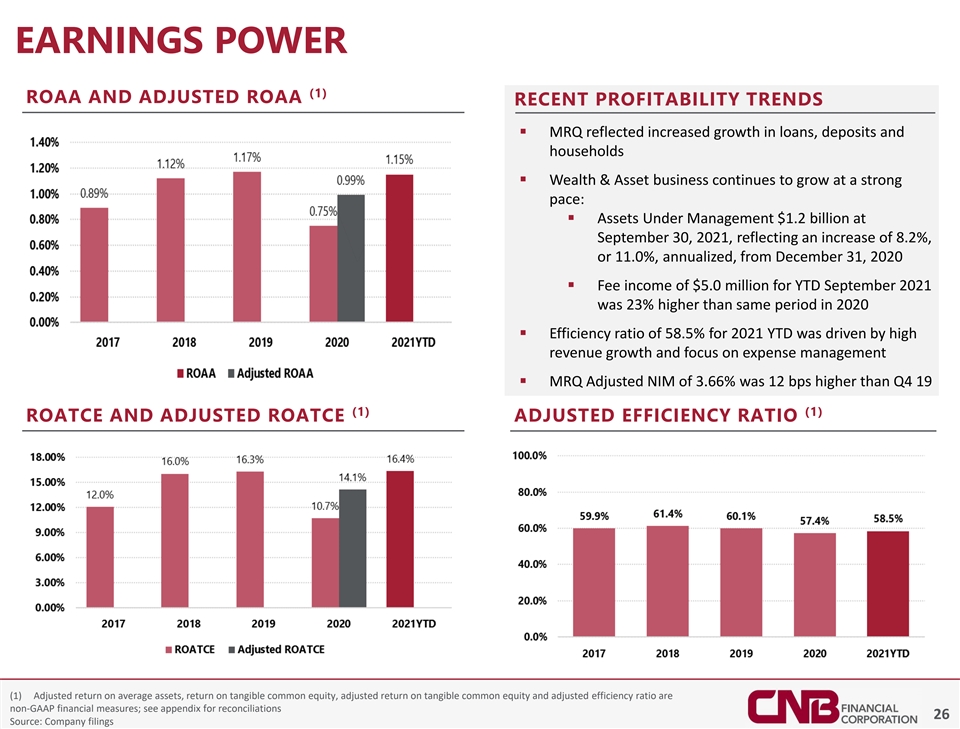
EARNINGS POWER (1) ROAA AND ADJUSTED ROAA RECENT PROFITABILITY TRENDS ▪ MRQ reflected increased growth in loans, deposits and households ▪ Wealth & Asset business continues to grow at a strong pace: ▪ Assets Under Management $1.2 billion at September 30, 2021, reflecting an increase of 8.2%, or 11.0%, annualized, from December 31, 2020 ▪ Fee income of $5.0 million for YTD September 2021 was 23% higher than same period in 2020 ▪ Efficiency ratio of 58.5% for 2021 YTD was driven by high revenue growth and focus on expense management ▪ MRQ Adjusted NIM of 3.66% was 12 bps higher than Q4 19 (1) (1) ROATCE AND ADJUSTED ROATCE ADJUSTED EFFICIENCY RATIO (1) Adjusted return on average assets, return on tangible common equity, adjusted return on tangible common equity and adjusted efficiency ratio are non-GAAP financial measures; see appendix for reconciliations 26 Source: Company filings

NET INTEREST MARGIN & PRE-PROVISION NET REVENUE (1) (2) NIM & ADJUSTED NIM (1)(3) PPNR AND ADJUSTED PPNR ($000) ($M) (1) Net interest margin and pre-tax pre-provision are non-GAAP financial measures; see appendix for reconciliation (2) Excludes PPP-related income (fees and interest income) and PPP-related assets and Federal Reserve excess liquidity and income (3) Excludes applicable merger and acquisition, FHLB prepayment and branch closure costs. 27 Source: Company filings
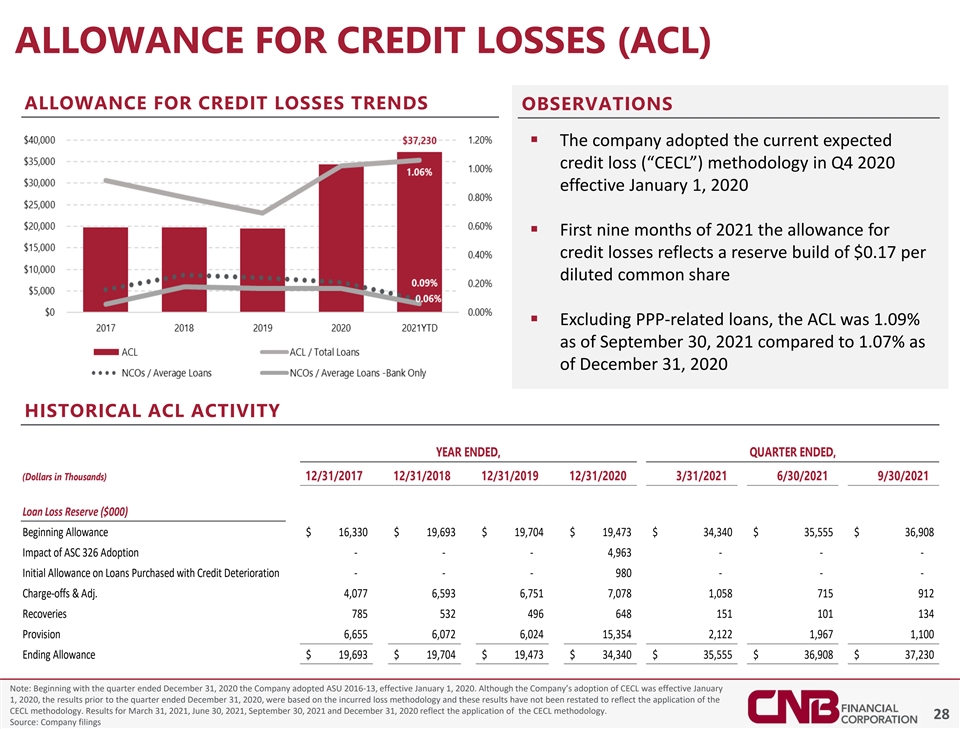
ALLOWANCE FOR CREDIT LOSSES (ACL) ALLOWANCE FOR CREDIT LOSSES TRENDS OBSERVATIONS ▪ The company adopted the current expected credit loss (“CECL”) methodology in Q4 2020 effective January 1, 2020 ▪ First nine months of 2021 the allowance for credit losses reflects a reserve build of $0.17 per diluted common share ▪ Excluding PPP-related loans, the ACL was 1.09% as of September 30, 2021 compared to 1.07% as of December 31, 2020 HISTORICAL ACL ACTIVITY YEAR ENDED, QUARTER ENDED, (Dollars in Thousands) 12/31/2017 12/31/2018 12/31/2019 12/31/2020 3/31/2021 6/30/2021 9/30/2021 Loan Loss Reserve ($000) Beginning Allowance $ 16,330 $ 1 9,693 $ 19,704 $ 1 9,473 $ 3 4,340 $ 3 5,555 $ 3 6,908 Impact of ASC 326 Adoption - - - 4,963 - - - Initial Allowance on Loans Purchased with Credit Deterioration - - - 980 - - - Charge-offs & Adj. 4,077 6 ,593 6,751 7,078 1,058 715 912 Recoveries 785 532 496 648 151 101 134 Provision 6 ,655 6 ,072 6,024 1 5,354 2,122 1 ,967 1,100 Ending Allowance $ 1 9,693 $ 19,704 $ 19,473 $ 3 4,340 $ 35,555 $ 3 6,908 $ 3 7,230 Note: Beginning with the quarter ended December 31, 2020 the Company adopted ASU 2016-13, effective January 1, 2020. Although the Company’s adoption of CECL was effective January 1, 2020, the results prior to the quarter ended December 31, 2020, were based on the incurred loss methodology and these results have not been restated to reflect the application of the CECL methodology. Results for March 31, 2021, June 30, 2021, September 30, 2021 and December 31, 2020 reflect the application of the CECL methodology. 28 Source: Company filings
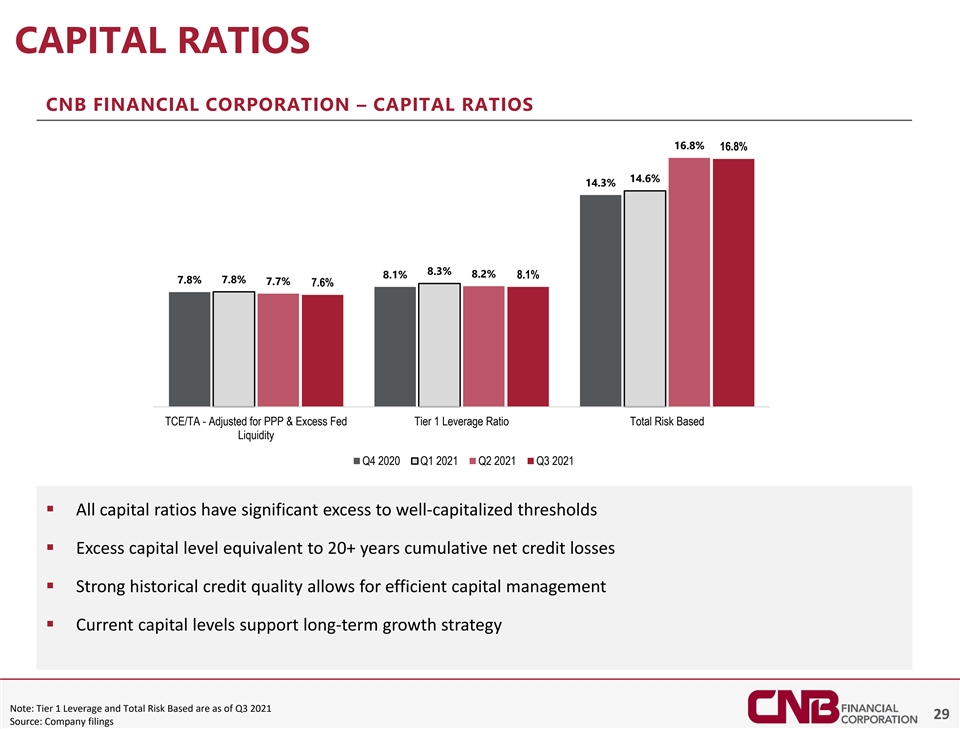
CAPITAL RATIOS CNB FINANCIAL CORPORATION – CAPITAL RATIOS 16.8% 16.8% 14.6% 14.3% 8.3% 8.2% 8.1% 8.1% 7.8% 7.8% 7.7% 7.6% TCE/TA - Adjusted for PPP & Excess Fed Tier 1 Leverage Ratio Total Risk Based Liquidity Q4 2020 Q1 2021 Q2 2021 Q3 2021 ▪ All capital ratios have significant excess to well-capitalized thresholds ▪ Excess capital level equivalent to 20+ years cumulative net credit losses ▪ Strong historical credit quality allows for efficient capital management ▪ Current capital levels support long-term growth strategy Note: Tier 1 Leverage and Total Risk Based are as of Q3 2021 29 Source: Company filings
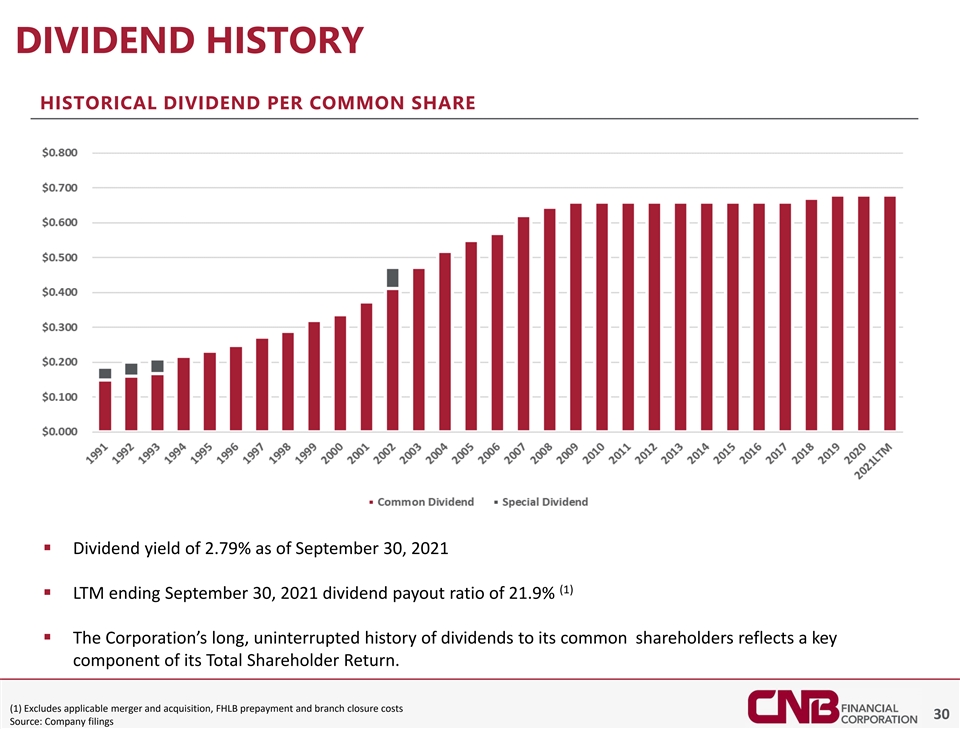
DIVIDEND HISTORY HISTORICAL DIVIDEND PER COMMON SHARE ▪ Dividend yield of 2.79% as of September 30, 2021 (1) ▪ LTM ending September 30, 2021 dividend payout ratio of 21.9% ▪ The Corporation’s long, uninterrupted history of dividends to its common shareholders reflects a key component of its Total Shareholder Return. (1) Excludes applicable merger and acquisition, FHLB prepayment and branch closure costs 30 Source: Company filings
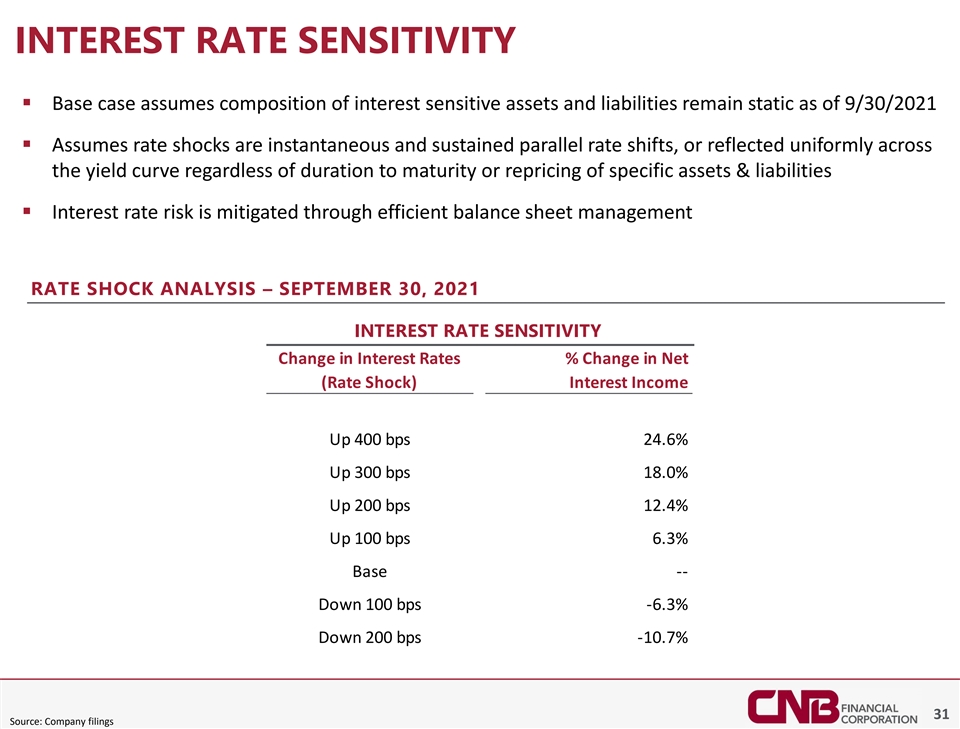
INTEREST RATE SENSITIVITY ▪ Base case assumes composition of interest sensitive assets and liabilities remain static as of 9/30/2021 ▪ Assumes rate shocks are instantaneous and sustained parallel rate shifts, or reflected uniformly across the yield curve regardless of duration to maturity or repricing of specific assets & liabilities ▪ Interest rate risk is mitigated through efficient balance sheet management RATE SHOCK ANALYSIS – SEPTEMBER 30, 2021 INTEREST RATE SENSITIVITY Change in Interest Rates % Change in Net (Rate Shock) Interest Income Up 400 bps 24.6% Up 300 bps 18.0% Up 200 bps 12.4% Up 100 bps 6.3% Base -- Down 100 bps -6.3% Down 200 bps -10.7% 31 Source: Company filings

APPENDIX MERGERS & ACQUISITIONS
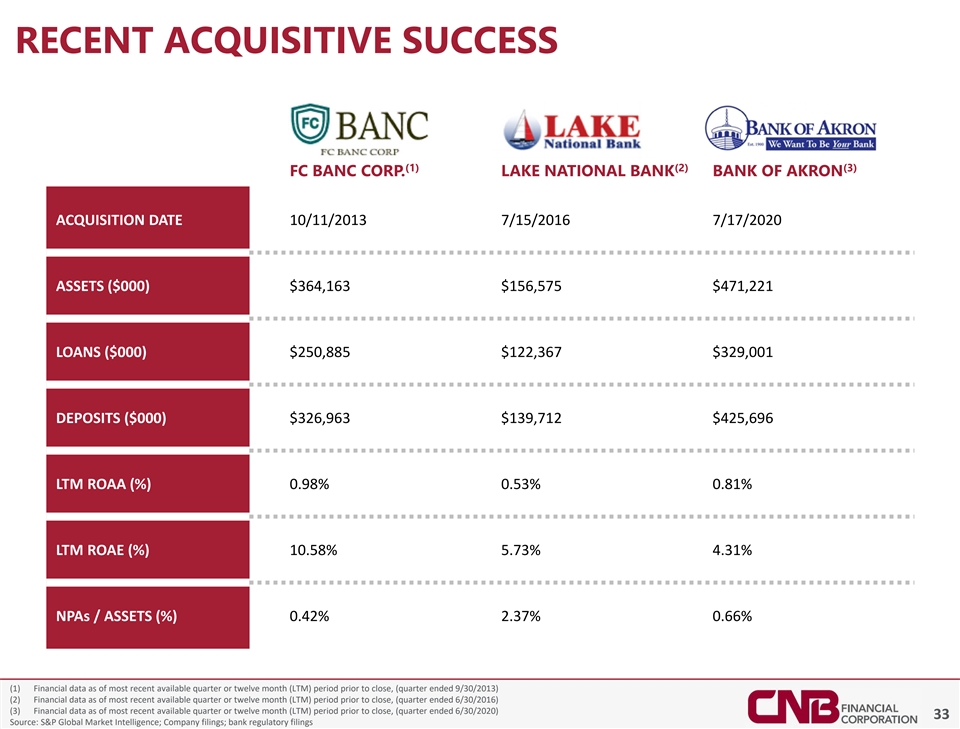
RECENT ACQUISITIVE SUCCESS (1) (2) (3) FC BANC CORP. LAKE NATIONAL BANK BANK OF AKRON ACQUISITION DATE 10/11/2013 7/15/2016 7/17/2020 ASSETS ($000) $364,163 $156,575 $471,221 LOANS ($000) $250,885 $122,367 $329,001 DEPOSITS ($000) $326,963 $139,712 $425,696 LTM ROAA (%) 0.98% 0.53% 0.81% LTM ROAE (%) 10.58% 5.73% 4.31% NPAs / ASSETS (%) 0.42% 2.37% 0.66% (1) Financial data as of most recent available quarter or twelve month (LTM) period prior to close, (quarter ended 9/30/2013) (2) Financial data as of most recent available quarter or twelve month (LTM) period prior to close, (quarter ended 6/30/2016) (3) Financial data as of most recent available quarter or twelve month (LTM) period prior to close, (quarter ended 6/30/2020) 33 Source: S&P Global Market Intelligence; Company filings; bank regulatory filings
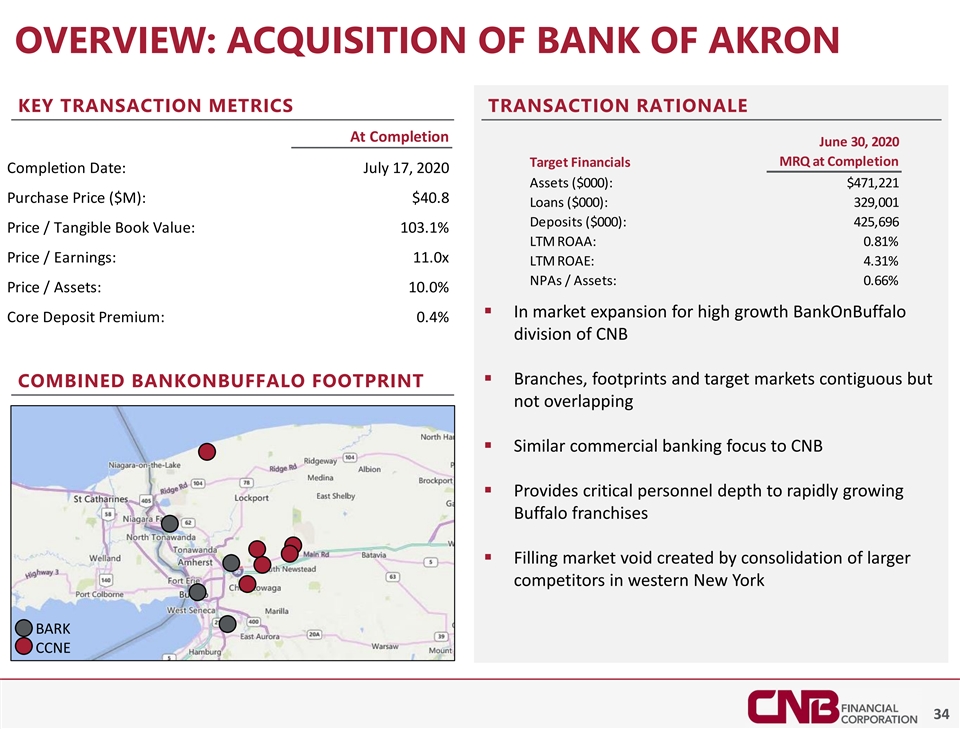
OVERVIEW: ACQUISITION OF BANK OF AKRON KEY TRANSACTION METRICS TRANSACTION RATIONALE At Completion June 30, 2020 MRQ at Completion Target Financials Completion Date: July 17, 2020 Assets ($000): $471,221 Purchase Price ($M): $40.8 Loans ($000): 329,001 Deposits ($000): 425,696 Price / Tangible Book Value: 103.1% LTM ROAA: 0.81% Price / Earnings: 11.0x LTM ROAE: 4.31% NPAs / Assets: 0.66% Price / Assets: 10.0% ▪ In market expansion for high growth BankOnBuffalo Core Deposit Premium: 0.4% division of CNB Consideration: 60% ▪ Branches, footprints and target markets contiguous but COMBINED BANKONBUFFALO FOOTPRINT not overlapping ▪ Similar commercial banking focus to CNB ▪ Provides critical personnel depth to rapidly growing Buffalo franchises ▪ Filling market void created by consolidation of larger competitors in western New York BARK CCNE 34

APPENDIX OTHER RELEVANT INFORMATION
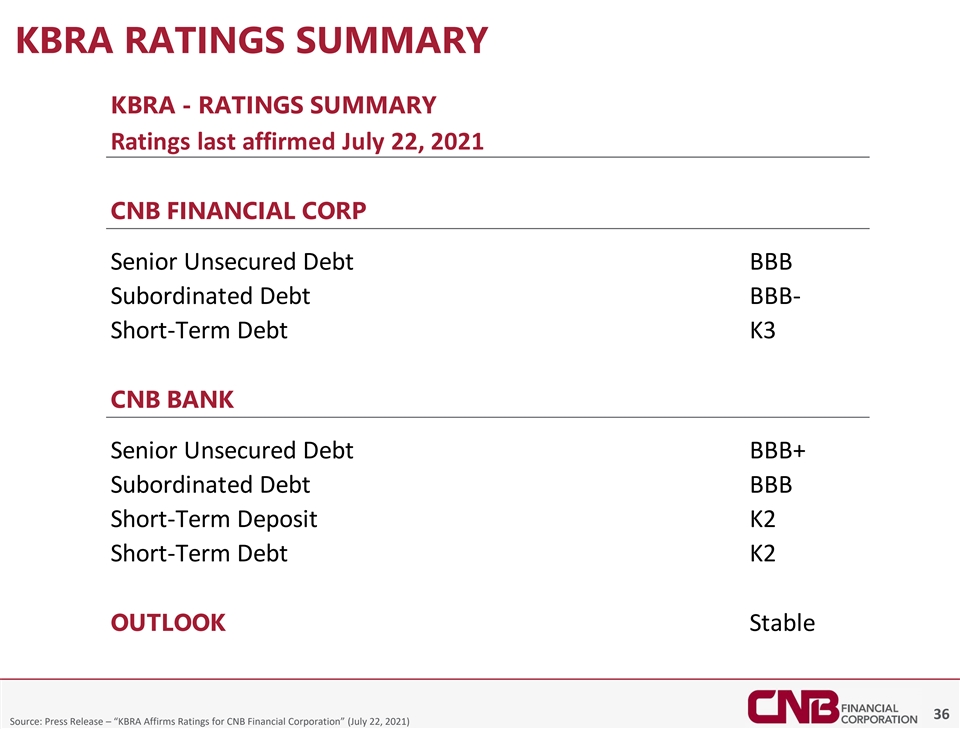
KBRA RATINGS SUMMARY KBRA - RATINGS SUMMARY Ratings last affirmed July 22, 2021 CNB FINANCIAL CORP Senior Unsecured Debt BBB Subordinated Debt BBB- Short-Term Debt K3 CNB BANK Senior Unsecured Debt BBB+ Subordinated Debt BBB Short-Term Deposit K2 Short-Term Debt K2 OUTLOOK Stable 36 Source: Press Release – “KBRA Affirms Ratings for CNB Financial Corporation” (July 22, 2021)
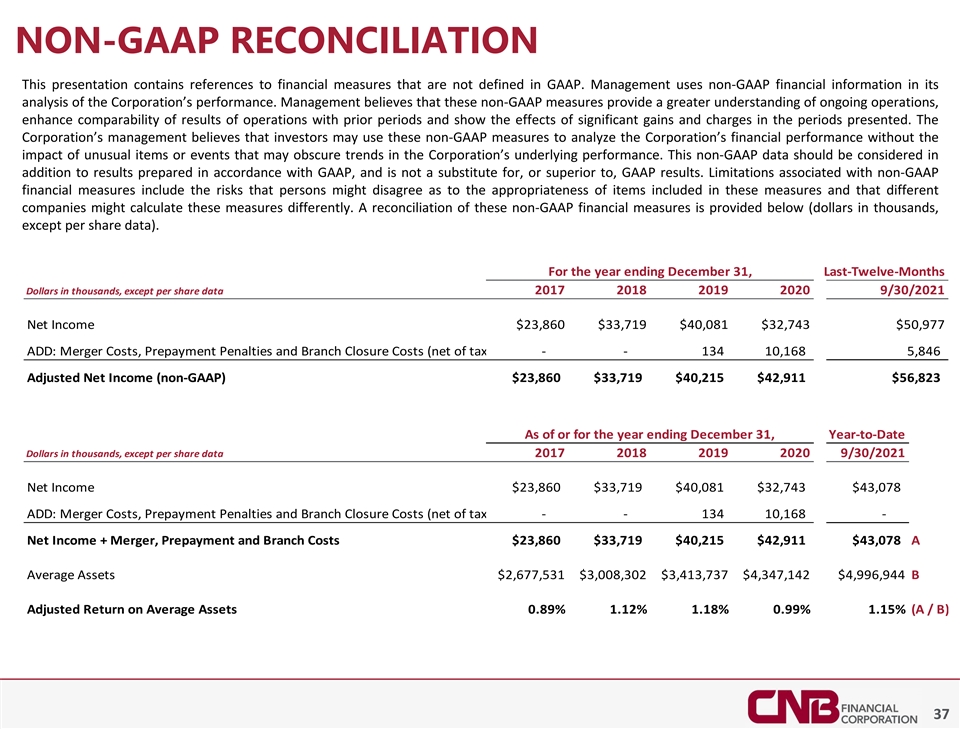
NON-GAAP RECONCILIATION This presentation contains references to financial measures that are not defined in GAAP. Management uses non-GAAP financial information in its analysis of the Corporation’s performance. Management believes that these non-GAAP measures provide a greater understanding of ongoing operations, enhance comparability of results of operations with prior periods and show the effects of significant gains and charges in the periods presented. The Corporation’s management believes that investors may use these non-GAAP measures to analyze the Corporation’s financial performance without the impact of unusual items or events that may obscure trends in the Corporation’s underlying performance. This non-GAAP data should be considered in addition to results prepared in accordance with GAAP, and is not a substitute for, or superior to, GAAP results. Limitations associated with non-GAAP financial measures include the risks that persons might disagree as to the appropriateness of items included in these measures and that different companies might calculate these measures differently. A reconciliation of these non-GAAP financial measures is provided below (dollars in thousands, except per share data). For the year ending December 31, Last-Twelve-Months Dollars in thousands, except per share data 2017 2018 2019 2020 9/30/2021 Net Income $23,860 $33,719 $40,081 $32,743 $50,977 ADD: Merger Costs, Prepayment Penalties and Branch Closure Costs (net of tax) - - 134 10,168 5,846 Adjusted Net Income (non-GAAP) $23,860 $33,719 $40,215 $42,911 $56,823 As of or for the year ending December 31, Year-to-Date Dollars in thousands, except per share data 2017 2018 2019 2020 9/30/2021 Net Income $23,860 $33,719 $40,081 $32,743 $43,078 ADD: Merger Costs, Prepayment Penalties and Branch Closure Costs (net of tax) - - 134 10,168 - Net Income + Merger, Prepayment and Branch Costs $23,860 $33,719 $40,215 $42,911 $43,078 A Average Assets $2,677,531 $3,008,302 $3,413,737 $4,347,142 $4,996,944 B Adjusted Return on Average Assets 0.89% 1.12% 1.18% 0.99% 1.15% (A / B) 37
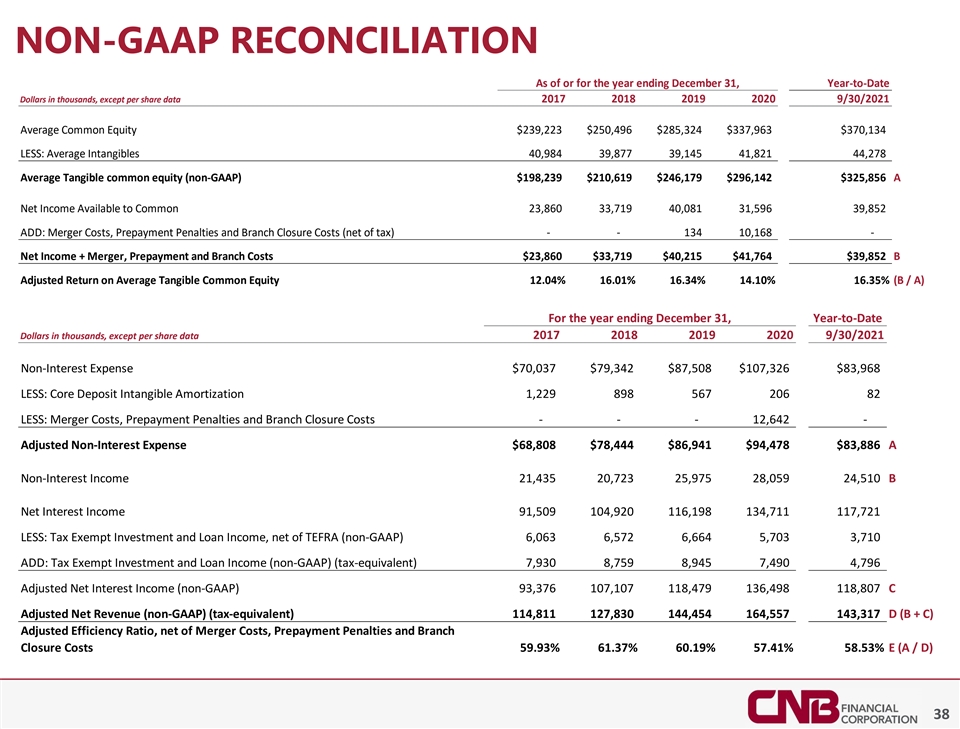
NON-GAAP RECONCILIATION As of or for the year ending December 31, Year-to-Date Dollars in thousands, except per share data 2017 2018 2019 2020 9/30/2021 Average Common Equity $239,223 $250,496 $285,324 $337,963 $370,134 LESS: Average Intangibles 40,984 3 9,877 3 9,145 4 1,821 44,278 Average Tangible common equity (non-GAAP) $198,239 $210,619 $246,179 $296,142 $325,856 A Net Income Available to Common 23,860 3 3,719 4 0,081 31,596 39,852 ADD: Merger Costs, Prepayment Penalties and Branch Closure Costs (net of tax) - - 134 1 0,168 - Net Income + Merger, Prepayment and Branch Costs $23,860 $33,719 $40,215 $41,764 $39,852 B Adjusted Return on Average Tangible Common Equity 12.04% 16.01% 16.34% 14.10% 16.35% (B / A) For the year ending December 31, Year-to-Date Dollars in thousands, except per share data 2017 2018 2019 2020 9/30/2021 Non-Interest Expense $70,037 $79,342 $87,508 $107,326 $83,968 LESS: Core Deposit Intangible Amortization 1,229 898 567 206 82 LESS: Merger Costs, Prepayment Penalties and Branch Closure Costs - - - 12,642 - Adjusted Non-Interest Expense $68,808 $78,444 $86,941 $94,478 $83,886 A Non-Interest Income 21,435 2 0,723 2 5,975 2 8,059 2 4,510 B Net Interest Income 91,509 104,920 116,198 134,711 117,721 LESS: Tax Exempt Investment and Loan Income, net of TEFRA (non-GAAP) 6,063 6,572 6,664 5,703 3,710 ADD: Tax Exempt Investment and Loan Income (non-GAAP) (tax-equivalent) 7,930 8,759 8,945 7,490 4,796 Adjusted Net Interest Income (non-GAAP) 9 3,376 107,107 118,479 136,498 118,807 C Adjusted Net Revenue (non-GAAP) (tax-equivalent) 114,811 127,830 144,454 164,557 143,317 D (B + C) Adjusted Efficiency Ratio, net of Merger Costs, Prepayment Penalties and Branch Closure Costs 59.93% 61.37% 60.19% 57.41% 58.53% E (A / D) 38
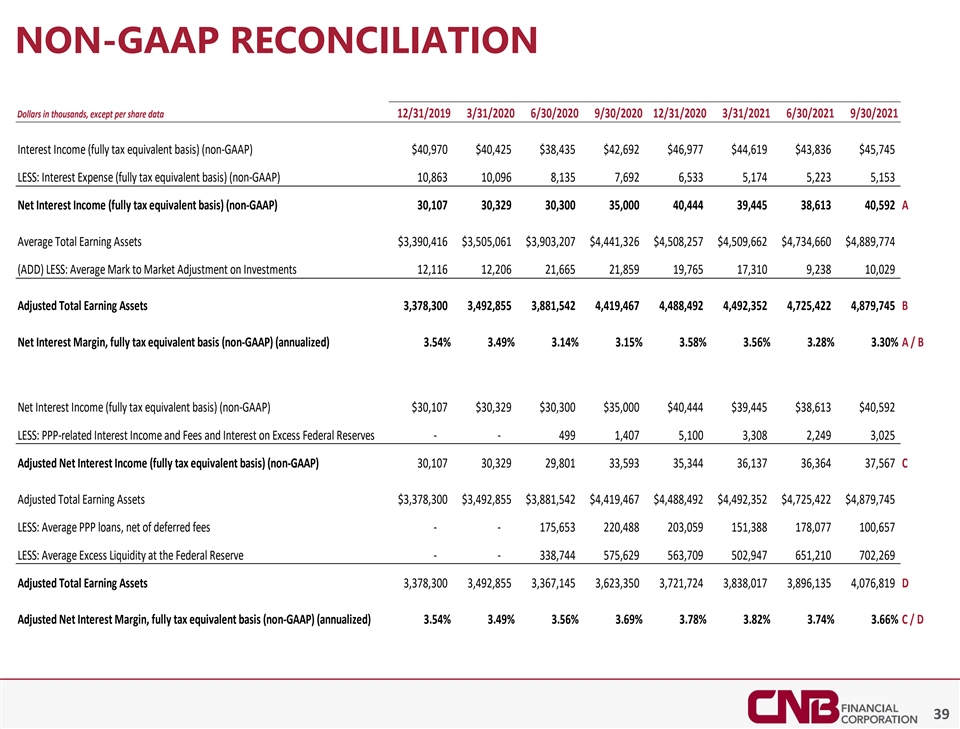
NON-GAAP RECONCILIATION Dollars in thousands, except per share data 12/31/2019 3/31/2020 6/30/2020 9/30/2020 12/31/2020 3/31/2021 6/30/2021 9/30/2021 Interest Income (fully tax equivalent basis) (non-GAAP) $40,970 $40,425 $38,435 $42,692 $46,977 $44,619 $43,836 $45,745 LESS: Interest Expense (fully tax equivalent basis) (non-GAAP) 1 0,863 1 0,096 8,135 7,692 6 ,533 5,174 5 ,223 5 ,153 Net Interest Income (fully tax equivalent basis) (non-GAAP) 3 0,107 3 0,329 3 0,300 3 5,000 40,444 3 9,445 3 8,613 4 0,592 A Average Total Earning Assets $3,390,416 $3,505,061 $3,903,207 $4,441,326 $4,508,257 $4,509,662 $4,734,660 $4,889,774 (ADD) LESS: Average Mark to Market Adjustment on Investments 1 2,116 12,206 21,665 2 1,859 19,765 17,310 9,238 1 0,029 Adjusted Total Earning Assets 3,378,300 3,492,855 3 ,881,542 4,419,467 4 ,488,492 4 ,492,352 4,725,422 4,879,745 B Net Interest Margin, fully tax equivalent basis (non-GAAP) (annualized) 3.54% 3.49% 3.14% 3.15% 3.58% 3.56% 3.28% 3.30% A / B Net Interest Income (fully tax equivalent basis) (non-GAAP) $30,107 $30,329 $30,300 $35,000 $40,444 $39,445 $38,613 $40,592 LESS: PPP-related Interest Income and Fees and Interest on Excess Federal Reserves - - 499 1 ,407 5 ,100 3,308 2,249 3,025 Adjusted Net Interest Income (fully tax equivalent basis) (non-GAAP) 3 0,107 30,329 2 9,801 33,593 35,344 36,137 3 6,364 37,567 C Adjusted Total Earning Assets $3,378,300 $3,492,855 $3,881,542 $4,419,467 $4,488,492 $4,492,352 $4,725,422 $4,879,745 LESS: Average PPP loans, net of deferred fees - - 1 75,653 220,488 2 03,059 1 51,388 178,077 100,657 LESS: Average Excess Liquidity at the Federal Reserve - - 338,744 575,629 563,709 5 02,947 651,210 7 02,269 Adjusted Total Earning Assets 3,378,300 3,492,855 3,367,145 3 ,623,350 3,721,724 3,838,017 3 ,896,135 4,076,819 D Adjusted Net Interest Margin, fully tax equivalent basis (non-GAAP) (annualized) 3.54% 3.49% 3.56% 3.69% 3.78% 3.82% 3.74% 3.66% C / D 39
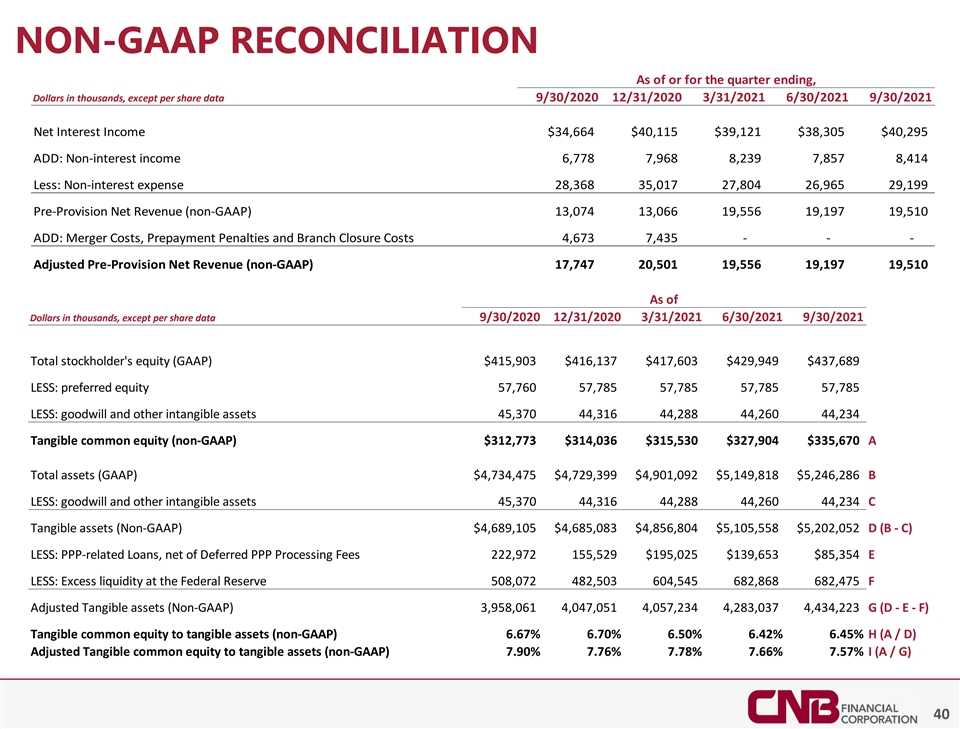
NON-GAAP RECONCILIATION As of or for the quarter ending, Dollars in thousands, except per share data 9/30/2020 12/31/2020 3/31/2021 6/30/2021 9/30/2021 Net Interest Income $34,664 $40,115 $39,121 $38,305 $40,295 ADD: Non-interest income 6 ,778 7 ,968 8,239 7,857 8,414 Less: Non-interest expense 28,368 35,017 27,804 26,965 29,199 Pre-Provision Net Revenue (non-GAAP) 13,074 1 3,066 1 9,556 1 9,197 1 9,510 ADD: Merger Costs, Prepayment Penalties and Branch Closure Costs 4,673 7 ,435 - - - Adjusted Pre-Provision Net Revenue (non-GAAP) 1 7,747 20,501 19,556 1 9,197 1 9,510 As of Dollars in thousands, except per share data 9/30/2020 12/31/2020 3/31/2021 6/30/2021 9/30/2021 Total stockholder's equity (GAAP) $415,903 $416,137 $417,603 $429,949 $437,689 LESS: preferred equity 5 7,760 5 7,785 57,785 5 7,785 57,785 LESS: goodwill and other intangible assets 45,370 4 4,316 4 4,288 4 4,260 4 4,234 Tangible common equity (non-GAAP) $312,773 $314,036 $315,530 $327,904 $335,670 A Total assets (GAAP) $4,734,475 $4,729,399 $4,901,092 $5,149,818 $5,246,286 B LESS: goodwill and other intangible assets 4 5,370 4 4,316 4 4,288 4 4,260 4 4,234 C Tangible assets (Non-GAAP) $4,689,105 $4,685,083 $4,856,804 $5,105,558 $5,202,052 D (B - C) LESS: PPP-related Loans, net of Deferred PPP Processing Fees 222,972 155,529 $195,025 $139,653 $85,354 E LESS: Excess liquidity at the Federal Reserve 508,072 482,503 604,545 682,868 682,475 F Adjusted Tangible assets (Non-GAAP) 3,958,061 4,047,051 4,057,234 4,283,037 4,434,223 G (D - E - F) Tangible common equity to tangible assets (non-GAAP) 6.67% 6.70% 6.50% 6.42% 6.45% H (A / D) Adjusted Tangible common equity to tangible assets (non-GAAP) 7.90% 7.76% 7.78% 7.66% 7.57% I (A / G) 40
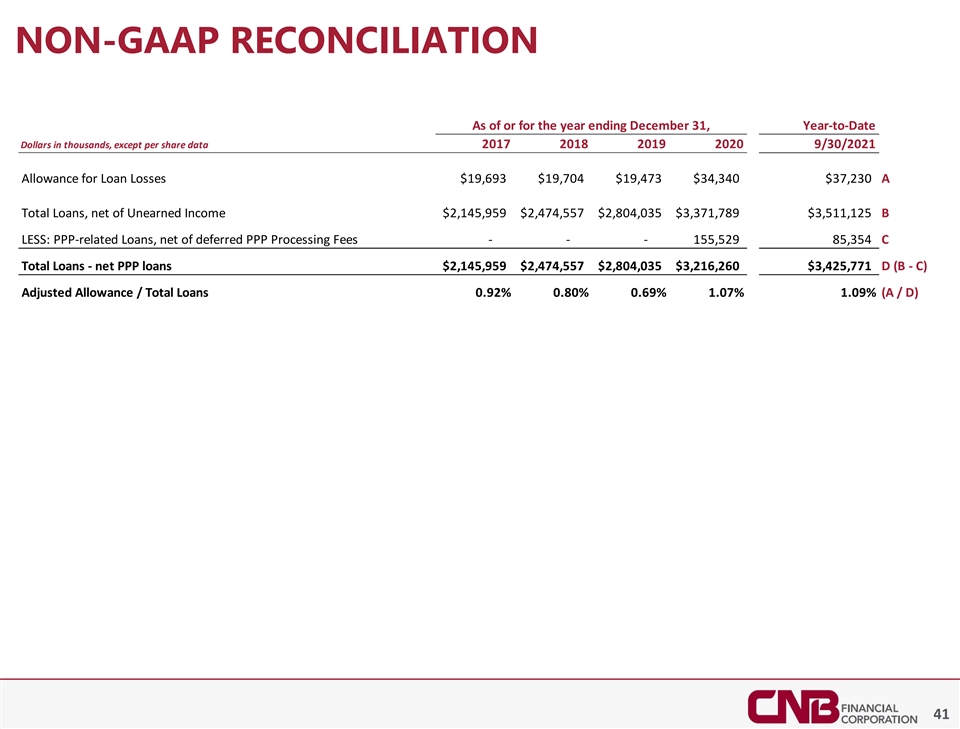
NON-GAAP RECONCILIATION As of or for the year ending December 31, Year-to-Date Dollars in thousands, except per share data 2017 2018 2019 2020 9/30/2021 Allowance for Loan Losses $19,693 $19,704 $19,473 $34,340 $37,230 A Total Loans, net of Unearned Income $2,145,959 $2,474,557 $2,804,035 $3,371,789 $3,511,125 B LESS: PPP-related Loans, net of deferred PPP Processing Fees - - - 155,529 85,354 C Total Loans - net PPP loans $2,145,959 $2,474,557 $2,804,035 $3,216,260 $3,425,771 D (B - C) Adjusted Allowance / Total Loans 0.92% 0.80% 0.69% 1.07% 1.09% (A / D) 41