Exhibit 99.1 STRATEGIC MERGER CNB | ESSA January 10, 2025 O U R F A M I L Y O F B A N K S
Disclaimer & Forward-Looking Statements Forward-Looking Statements This communication contains forward-looking statements as defined in the Private Securities Litigation Reform Act of 1995. Such forward-looking statements about CNB and ESSA and their industry involve substantial risks and uncertainties. Statements other than statements of current or historical fact, including statements regarding CNB’s or ESSA’s future financial condition, results of operations, business plans, liquidity, cash flows, projected costs, and the impact of any laws or regulations applicable to CNB or ESSA, are forward-looking statements. Words such as “anticipates,” “believes,” “estimates,” “expects,” “forecasts,” “intends,” “plans,” “projects,” “may,” “will,” “should” and other similar expressions are intended to identify these forward-looking statements. Such statements are subject to factors that could cause actual results to differ materially from anticipated results. Among the risks and uncertainties that could cause actual results to differ from those described in the forward-looking statements include, but are not limited to the following: (i) CNB’s and ESSA’s ability to complete the proposed transaction on the proposed terms or on the anticipated timeline, or at all, including the risk that governmental approvals of the merger may not be obtained, or adverse regulatory conditions may be imposed in connection with governmental approvals of the merger and risks and uncertainties related to securing the necessary shareholder approvals and satisfaction of other closing conditions to consummate the proposed transaction; (ii) the occurrence of any event, change or other circumstance that could give rise to the termination of the merger agreement relating to the proposed transaction; (iii) risks related to diverting the attention of ESSA and CNB management from ongoing business operations; (iv) failure to realize the expected benefits of the proposed transaction; (v) significant transaction costs and/or unknown or inestimable liabilities; (vi) the risk of shareholder litigation in connection with the proposed transaction, including resulting expense or delay; (vii) the risk that ESSA’s business will not be integrated successfully or that such integration may be more difficult, time-consuming or costly than expected; (viii) risks related to future opportunities and plans for the combined company, including the uncertainty of expected future financial performance and results of the combined company following completion of the proposed transaction; (ix) the effect of the announcement of the proposed transaction on the ability of ESSA and CNB to operate their respective businesses and retain and hire key personnel and to maintain favorable business relationships; (x) risks related to the market value of the CNB common stock to be issued in the proposed transaction; (xi) other risks related to the completion of the proposed transaction and actions related thereto; (xii) the dilution caused by CNB’s issuance of additional shares of its capital stock in connection with the proposed transaction; (xiii) national, international, regional and local economic and political climates and conditions; (xiv) changes in general economic conditions, including changes in market interest rates and changes in monetary and fiscal policies of the federal government; and (xv) legislative and regulatory changes. Further information about these and other relevant risks and uncertainties may be found in CNB’s Annual Report on Form 10-K for the fiscal year ended December 31, 2023, in ESSA’s Annual Report on Form 10-K for the fiscal year ended September 30, 2024 and in subsequent filings CNB and ESSA make with the Securities and Exchange Commission (“SEC”). Forward-looking statements speak only as of the date they are made. CNB and ESSA do not undertake, and specifically disclaim any obligation, to publicly release the result of any revisions which may be made to any forward- looking statements to reflect the occurrence of anticipated or unanticipated events or circumstances after the date of such statements. You are cautioned not to place undue reliance on these forward-looking statements. Non-GAAP Financial Measures This presentation contains references to financial measures that are not defined in GAAP. CNB and ESSA management use non-GAAP financial information in their analysis of CNB’s and ESSA’s respective performance. CNB and ESSA management believe that these non-GAAP measures provide a greater understanding of ongoing operations, enhance comparability of results of operations with prior periods and show the effects of significant gains and charges in the periods presented. CNB and ESSA management believe that investors may use these non-GAAP measures to analyze CNB’s and ESSA’s respective financial performance without the impact of unusual items or events that may obscure trends in their underlying performance. This non-GAAP data should be considered in addition to results prepared in accordance with GAAP, and is not a substitute for, or superior to, GAAP results. Limitations associated with non-GAAP financial measures include the risks that persons might disagree as to the appropriateness of items included in these measures and that different companies might calculate these measures differently. Non-GAAP measures reflected within the presentation include: Tangible common equity/tangible assets, Return on average tangible common equity, and Tangible book value per share. Additional Information and Where to Find It In connection with the proposed transaction, CNB expects to file with the SEC a registration statement on Form S-4 that will include a document that serves as a prospectus of CNB and a joint proxy statement of CNB and ESSA (the “joint proxy statement/prospectus”), which joint proxy statement/prospectus will be mailed or otherwise disseminated to CNB’s and ESSA’s shareholders when it becomes available. CNB and ESSA also plan to file other relevant documents with the SEC regarding the proposed transaction. INVESTORS AND SECURITY HOLDERS ARE URGED TO READ THE REGISTRATION STATEMENT ON FORM S-4, THE JOINT PROXY STATEMENT/PROSPECTUS TO BE INCLUDED WITHIN THE REGISTRATION STATEMENT ON FORM S-4, AND ANY OTHER RELEVANT DOCUMENTS FILED OR TO BE FILED WITH THE SEC WHEN THEY BECOME AVAILABLE, AS WELL AS ANY AMENDMENTS OR SUPPLEMENTS TO THOSE DOCUMENTS, BECAUSE THEY WILL CONTAIN IMPORTANT INFORMATION ABOUT CNB, ESSA AND THE PROPOSED TRANSACTION. You may obtain a free copy of the registration statement, including the proxy statement/prospectus (when it becomes available) and other relevant documents filed by CNB and ESSA with the SEC, without charge, at the SEC’s website at www.sec.gov. Copies of the documents filed by CNB with the SEC will be available free of charge on CNB’s website at www.cnbbank.bank or by directing a request to CNB Financial Corporation, 1 South Second Street, PO Box 42, Clearfield, PA, attention: Treasurer, telephone (814) 765-9621. Copies of the documents filed by ESSA with the SEC will be available free of charge on ESSA’s website at www.essabank.com or by directing a request to ESSA Bancorp, Inc., 200 Palmer Street, Stroudsburg, PA 18360, attention: Stephanie Lefferson, telephone (570) 422-0182. No Offer This communication does not constitute an offer to sell or the solicitation of an offer to buy any securities. No offering of securities shall be made except by means of a prospectus meeting the requirements of Section 10 of the Securities Act of 1933, as amended, and otherwise in accordance with applicable law. Participants in the Solicitation CNB and ESSA and their respective directors and executive officers and other members of management and employees may be deemed to be participants in the solicitation of proxies in respect of the proposed transaction. You can find information about CNB’s executive officers and directors in CNB’s definitive proxy statement filed with the SEC on March 8, 2024. You can find information about ESSA’s executive officers and directors in ESSA’s definitive proxy statement filed with the SEC on January 25, 2024. Additional information regarding the interests of such potential participants will be included in the joint proxy statement/prospectus and other relevant documents filed with the SEC when they become available. You may obtain free copies of these documents from CNB or ESSA using the sources indicated above. 2
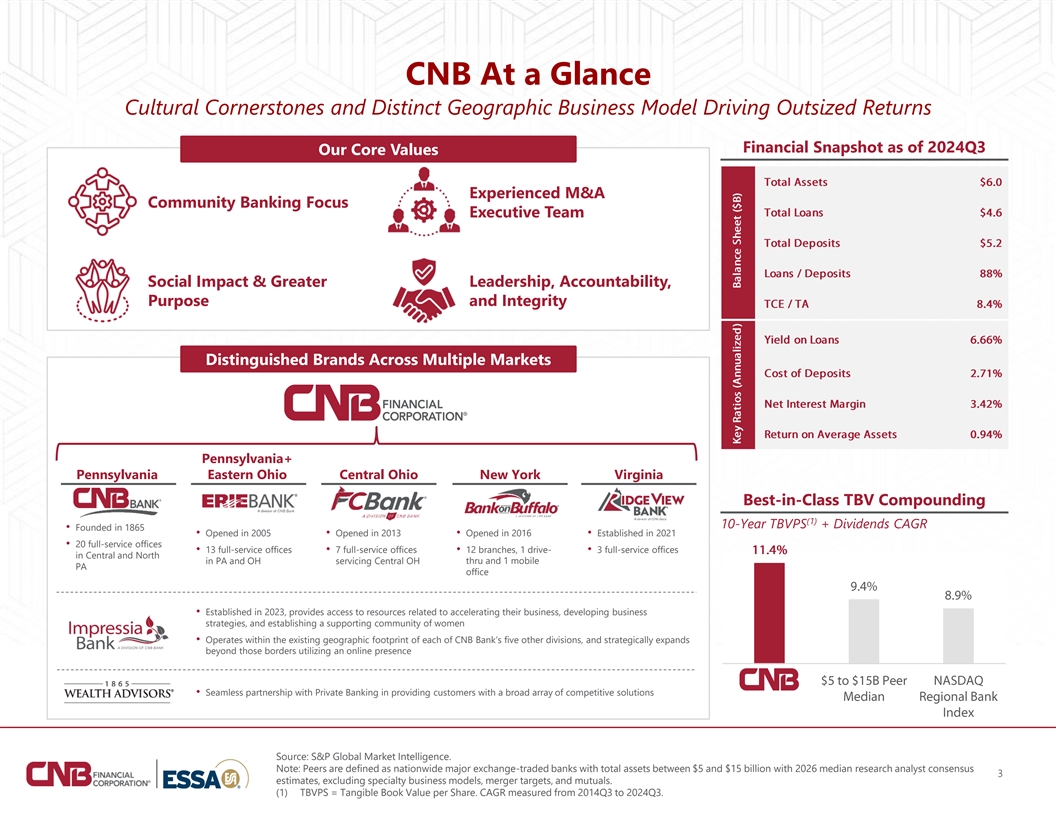
CNB At a Glance Cultural Cornerstones and Distinct Geographic Business Model Driving Outsized Returns Financial Snapshot as of 2024Q3 Our Core Values Experienced M&A Community Banking Focus Executive Team Social Impact & Greater Leadership, Accountability, Purpose and Integrity Distinguished Brands Across Multiple Markets Pennsylvania+ Pennsylvania Eastern Ohio Central Ohio New York Virginia Best-in-Class TBV Compounding (1) 10-Year TBVPS + Dividends CAGR • Founded in 1865 • Opened in 2005• Opened in 2013• Opened in 2016• Established in 2021 • 20 full-service offices • 13 full-service offices • 7 full-service offices • 12 branches, 1 drive-• 3 full-service offices in Central and North in PA and OH servicing Central OH thru and 1 mobile PA office • Established in 2023, provides access to resources related to accelerating their business, developing business strategies, and establishing a supporting community of women • Operates within the existing geographic footprint of each of CNB Bank’s five other divisions, and strategically expands beyond those borders utilizing an online presence • Seamless partnership with Private Banking in providing customers with a broad array of competitive solutions Source: S&P Global Market Intelligence. Note: Peers are defined as nationwide major exchange-traded banks with total assets between $5 and $15 billion with 2026 median research analyst consensus 3 estimates, excluding specialty business models, merger targets, and mutuals. (1) TBVPS = Tangible Book Value per Share. CAGR measured from 2014Q3 to 2024Q3.
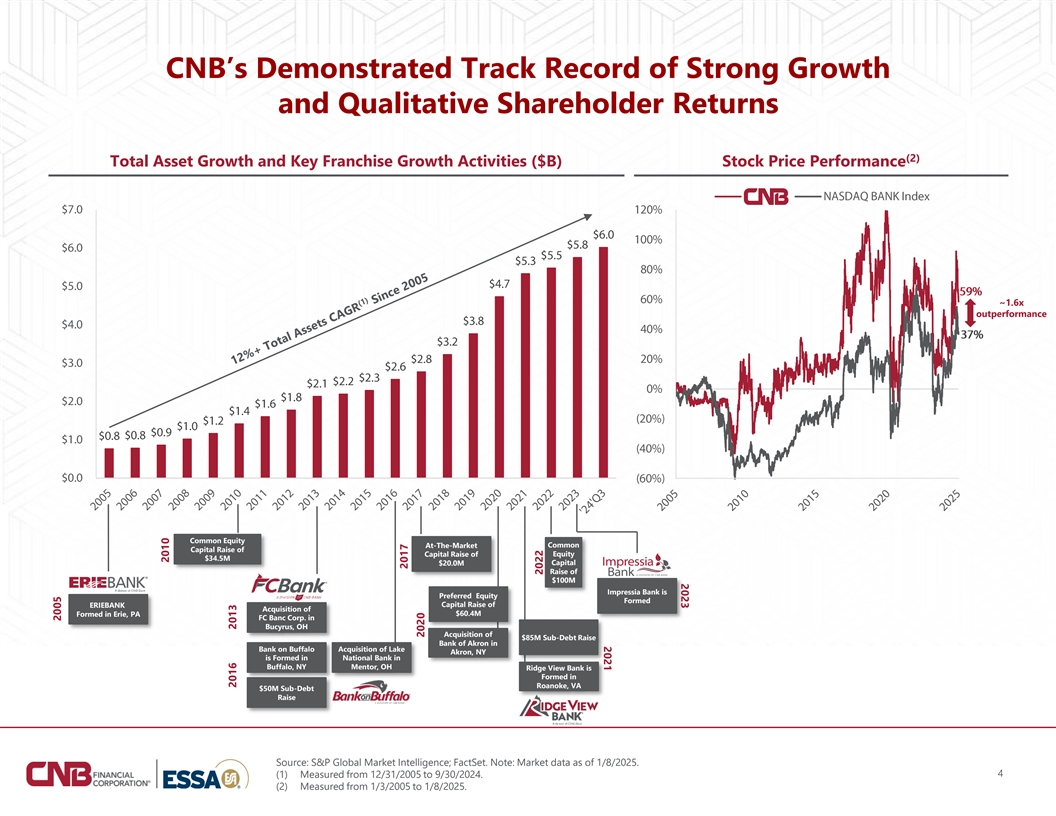
2023 2021 CNB’s Demonstrated Track Record of Strong Growth and Qualitative Shareholder Returns (2) Total Asset Growth and Key Franchise Growth Activities ($B) Stock Price Performance ~1.6x outperformance Common Equity At-The-Market Common Capital Raise of Capital Raise of Equity $34.5M $20.0M Capital Raise of $100M Impressia Bank is Preferred Equity Formed ERIEBANK Capital Raise of Acquisition of $60.4M Formed in Erie, PA FC Banc Corp. in Bucyrus, OH Acquisition of $85M Sub-Debt Raise Bank of Akron in Bank on Buffalo Acquisition of Lake Akron, NY is Formed in National Bank in Buffalo, NY Mentor, OH Ridge View Bank is Formed in Roanoke, VA $50M Sub-Debt Raise Source: S&P Global Market Intelligence; FactSet. Note: Market data as of 1/8/2025. 4 (1) Measured from 12/31/2005 to 9/30/2024. (2) Measured from 1/3/2005 to 1/8/2025. 2005 2010 2016 2013 2017 2020 2022
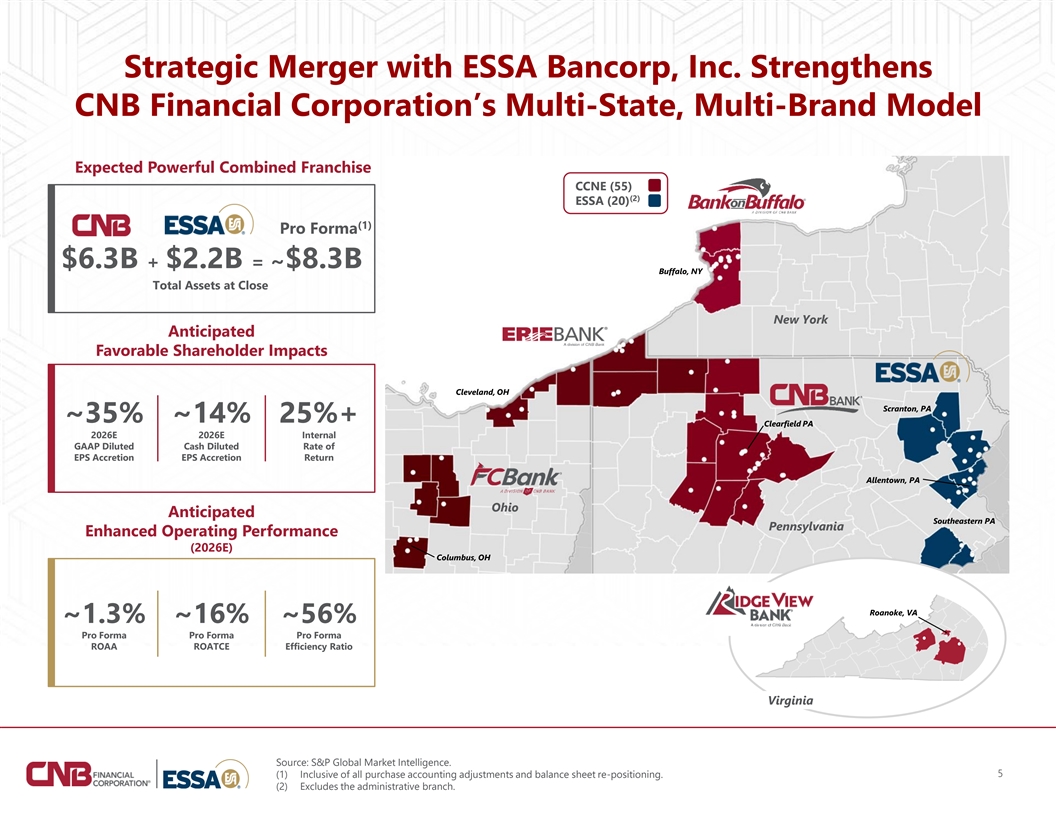
Strategic Merger with ESSA Bancorp, Inc. Strengthens CNB Financial Corporation’s Multi-State, Multi-Brand Model Expected Powerful Combined Franchise CCNE (55) (2) ESSA (20) (1) Pro Forma $6.3B + $2.2B = ~$8.3B Buffalo, NY Total Assets at Close New York Anticipated Favorable Shareholder Impacts Cleveland, OH Scranton, PA ~35% ~14% 25%+ Clearfield PA 2026E 2026E Internal GAAP Diluted Cash Diluted Rate of EPS Accretion EPS Accretion Return Allentown, PA Ohio Anticipated Southeastern PA Pennsylvania Enhanced Operating Performance (2026E) Columbus, OH Roanoke, VA ~1.3% ~16% ~56% Pro Forma Pro Forma Pro Forma ROAA ROATCE Efficiency Ratio Virginia Source: S&P Global Market Intelligence. 5 (1) Inclusive of all purchase accounting adjustments and balance sheet re-positioning. (2) Excludes the administrative branch.
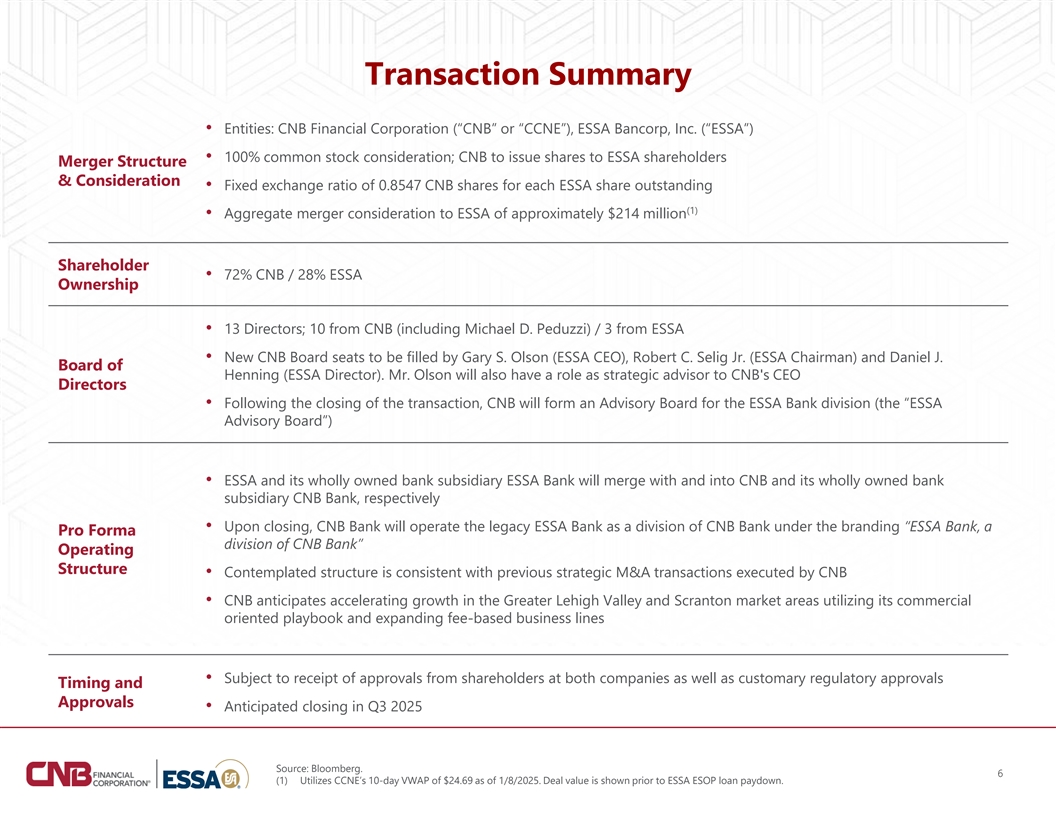
Transaction Summary • Entities: CNB Financial Corporation (“CNB” or “CCNE”), ESSA Bancorp, Inc. (“ESSA”) • 100% common stock consideration; CNB to issue shares to ESSA shareholders Merger Structure & Consideration • Fixed exchange ratio of 0.8547 CNB shares for each ESSA share outstanding (1) • Aggregate merger consideration to ESSA of approximately $214 million Shareholder • 72% CNB / 28% ESSA Ownership • 13 Directors; 10 from CNB (including Michael D. Peduzzi) / 3 from ESSA • New CNB Board seats to be filled by Gary S. Olson (ESSA CEO), Robert C. Selig Jr. (ESSA Chairman) and Daniel J. Board of Henning (ESSA Director). Mr. Olson will also have a role as strategic advisor to CNB's CEO Directors • Following the closing of the transaction, CNB will form an Advisory Board for the ESSA Bank division (the “ESSA Advisory Board”) • ESSA and its wholly owned bank subsidiary ESSA Bank will merge with and into CNB and its wholly owned bank subsidiary CNB Bank, respectively • Upon closing, CNB Bank will operate the legacy ESSA Bank as a division of CNB Bank under the branding “ESSA Bank, a Pro Forma division of CNB Bank” Operating Structure • Contemplated structure is consistent with previous strategic M&A transactions executed by CNB • CNB anticipates accelerating growth in the Greater Lehigh Valley and Scranton market areas utilizing its commercial oriented playbook and expanding fee-based business lines • Subject to receipt of approvals from shareholders at both companies as well as customary regulatory approvals Timing and Approvals • Anticipated closing in Q3 2025 Source: Bloomberg. 6 (1) Utilizes CCNE’s 10-day VWAP of $24.69 as of 1/8/2025. Deal value is shown prior to ESSA ESOP loan paydown.
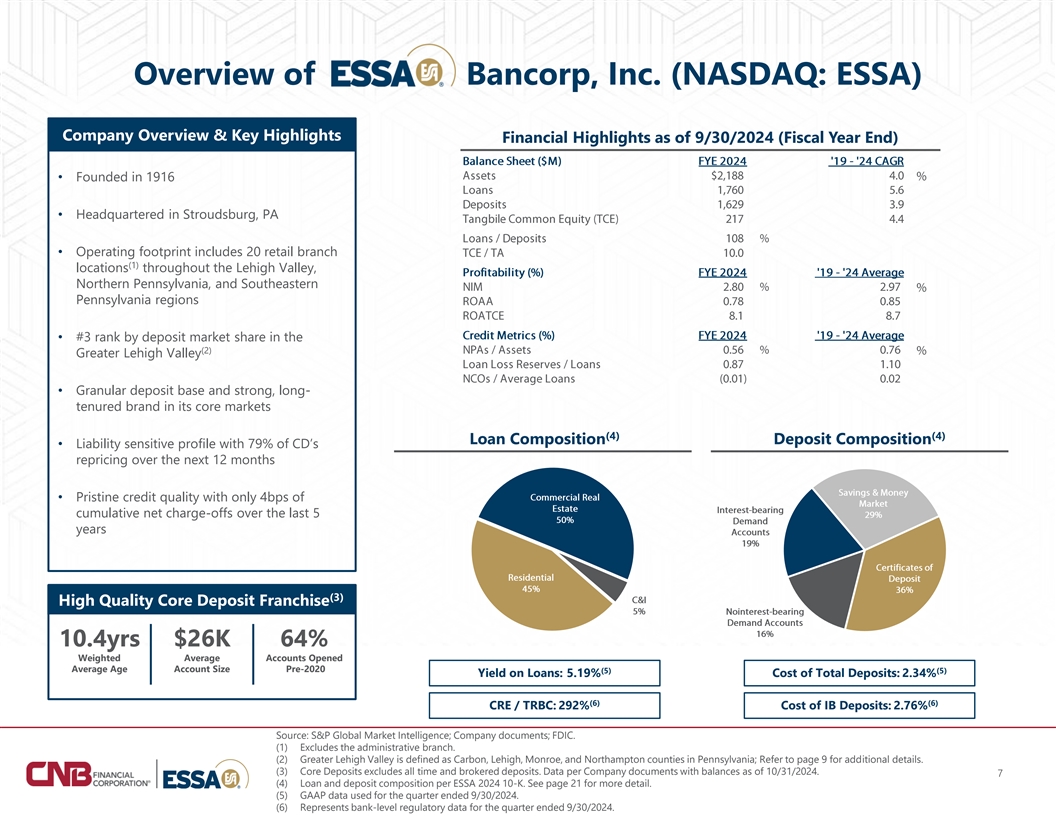
Overview of Bancorp, Inc. (NASDAQ: ESSA) Company Overview & Key Highlights Financial Highlights as of 9/30/2024 (Fiscal Year End) • Founded in 1916 • Headquartered in Stroudsburg, PA • Operating footprint includes 20 retail branch (1) locations throughout the Lehigh Valley, Northern Pennsylvania, and Southeastern Pennsylvania regions • #3 rank by deposit market share in the (2) Greater Lehigh Valley • Granular deposit base and strong, long- tenured brand in its core markets (4) (4) Loan Composition Deposit Composition • Liability sensitive profile with 79% of CD’s repricing over the next 12 months • Pristine credit quality with only 4bps of cumulative net charge-offs over the last 5 years (3) High Quality Core Deposit Franchise 10.4yrs $26K 64% Weighted Average Accounts Opened Average Age Account Size Pre-2020 (5) (5) Yield on Loans: 5.19% Cost of Total Deposits: 2.34% (6) (6) CRE / TRBC: 292% Cost of IB Deposits: 2.76% Source: S&P Global Market Intelligence; Company documents; FDIC. (1) Excludes the administrative branch. (2) Greater Lehigh Valley is defined as Carbon, Lehigh, Monroe, and Northampton counties in Pennsylvania; Refer to page 9 for additional details. (3) Core Deposits excludes all time and brokered deposits. Data per Company documents with balances as of 10/31/2024. 7 (4) Loan and deposit composition per ESSA 2024 10-K. See page 21 for more detail. (5) GAAP data used for the quarter ended 9/30/2024. (6) Represents bank-level regulatory data for the quarter ended 9/30/2024.
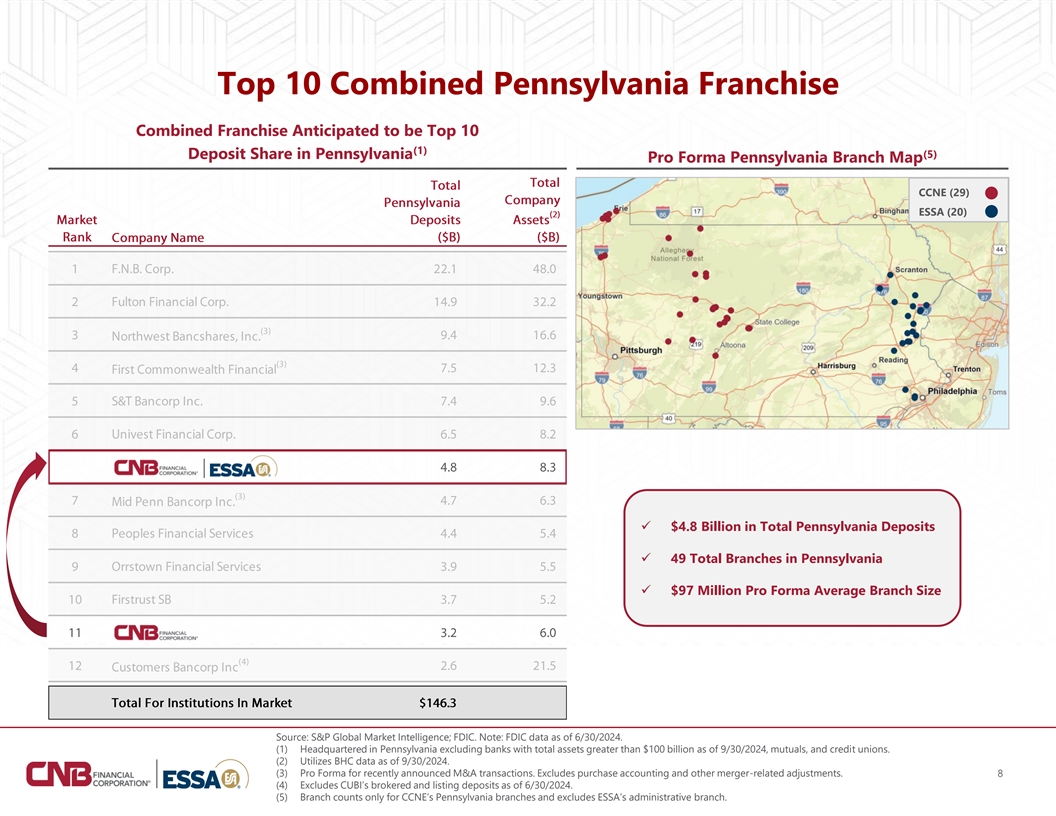
Top 10 Combined Pennsylvania Franchise Combined Franchise Anticipated to be Top 10 (1) Deposit Share in Pennsylvania (5) Pro Forma Pennsylvania Branch Map CCNE (29) ESSA (20) ✓ $4.8 Billion in Total Pennsylvania Deposits ✓ 49 Total Branches in Pennsylvania ✓ $97 Million Pro Forma Average Branch Size Source: S&P Global Market Intelligence; FDIC. Note: FDIC data as of 6/30/2024. (1) Headquartered in Pennsylvania excluding banks with total assets greater than $100 billion as of 9/30/2024, mutuals, and credit unions. (2) Utilizes BHC data as of 9/30/2024. (3) Pro Forma for recently announced M&A transactions. Excludes purchase accounting and other merger-related adjustments. 8 (4) Excludes CUBI’s brokered and listing deposits as of 6/30/2024. (5) Branch counts only for CCNE’s Pennsylvania branches and excludes ESSA’s administrative branch.
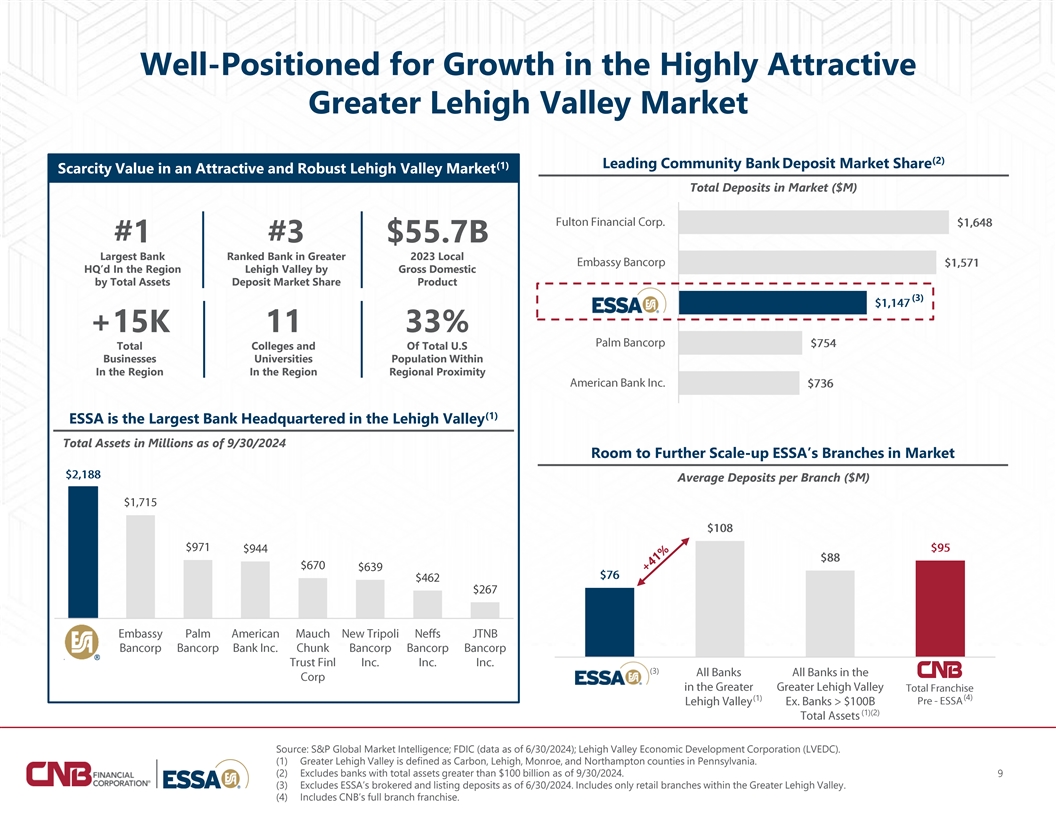
Well-Positioned for Growth in the Highly Attractive Greater Lehigh Valley Market (2) Leading Community Bank Deposit Market Share (1) Scarcity Value in an Attractive and Robust Lehigh Valley Market Total Deposits in Market ($M) #1 #3 $55.7B Largest Bank Ranked Bank in Greater 2023 Local HQ’d In the Region Lehigh Valley by Gross Domestic by Total Assets Deposit Market Share Product (3) +15K 11 33% Total Colleges and Of Total U.S Businesses Universities Population Within In the Region In the Region Regional Proximity (1) ESSA is the Largest Bank Headquartered in the Lehigh Valley Total Assets in Millions as of 9/30/2024 Room to Further Scale-up ESSA’s Branches in Market Average Deposits per Branch ($M) (3) (4) (1) (1)(2) Source: S&P Global Market Intelligence; FDIC (data as of 6/30/2024); Lehigh Valley Economic Development Corporation (LVEDC). (1) Greater Lehigh Valley is defined as Carbon, Lehigh, Monroe, and Northampton counties in Pennsylvania. (2) Excludes banks with total assets greater than $100 billion as of 9/30/2024. 9 (3) Excludes ESSA’s brokered and listing deposits as of 6/30/2024. Includes only retail branches within the Greater Lehigh Valley. (4) Includes CNB’s full branch franchise.
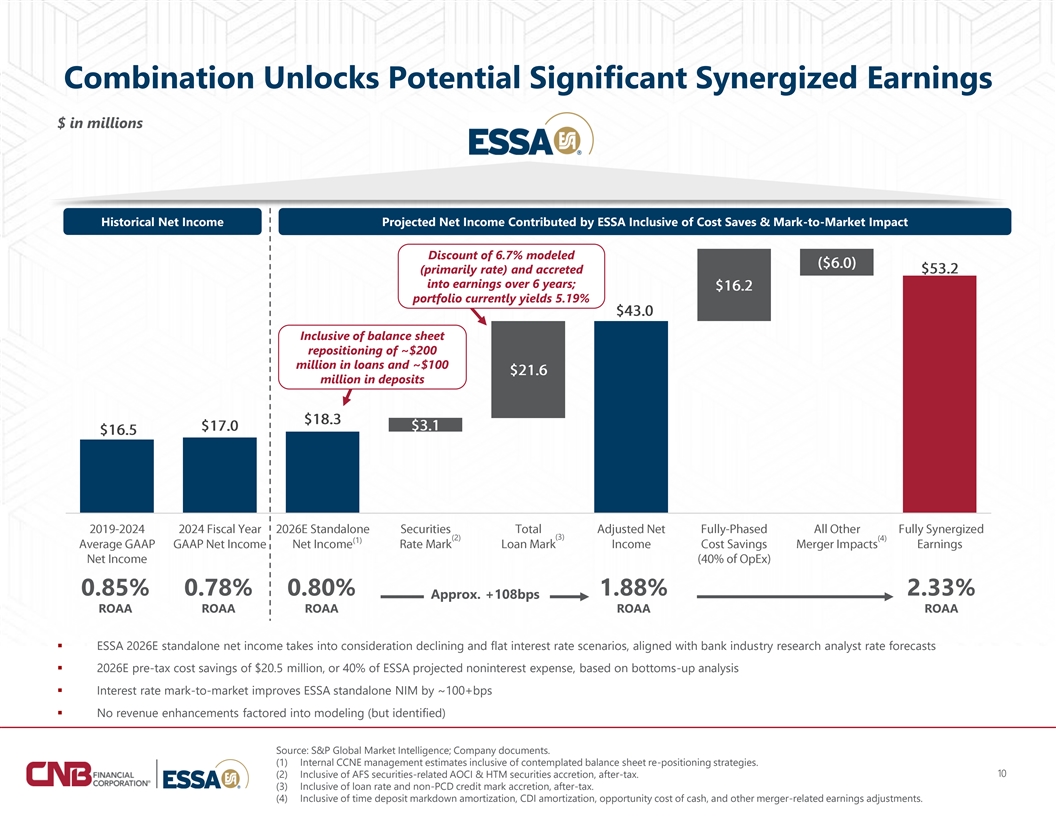
Combination Unlocks Potential Significant Synergized Earnings $ in millions Historical Net Income Projected Net Income Contributed by ESSA Inclusive of Cost Saves & Mark-to-Market Impact Discount of 6.7% modeled (primarily rate) and accreted into earnings over 6 years; portfolio currently yields 5.19% Inclusive of balance sheet repositioning of ~$200 million in loans and ~$100 million in deposits (2) (3) (4) (1) 0.85% 0.78% 0.80% 1.88% 2.33% Approx. +108bps ROAA ROAA ROAA ROAA ROAA ▪ ESSA 2026E standalone net income takes into consideration declining and flat interest rate scenarios, aligned with bank industry research analyst rate forecasts ▪ 2026E pre-tax cost savings of $20.5 million, or 40% of ESSA projected noninterest expense, based on bottoms-up analysis ▪ Interest rate mark-to-market improves ESSA standalone NIM by ~100+bps ▪ No revenue enhancements factored into modeling (but identified) Source: S&P Global Market Intelligence; Company documents. (1) Internal CCNE management estimates inclusive of contemplated balance sheet re-positioning strategies. 10 (2) Inclusive of AFS securities-related AOCI & HTM securities accretion, after-tax. (3) Inclusive of loan rate and non-PCD credit mark accretion, after-tax. (4) Inclusive of time deposit markdown amortization, CDI amortization, opportunity cost of cash, and other merger-related earnings adjustments.
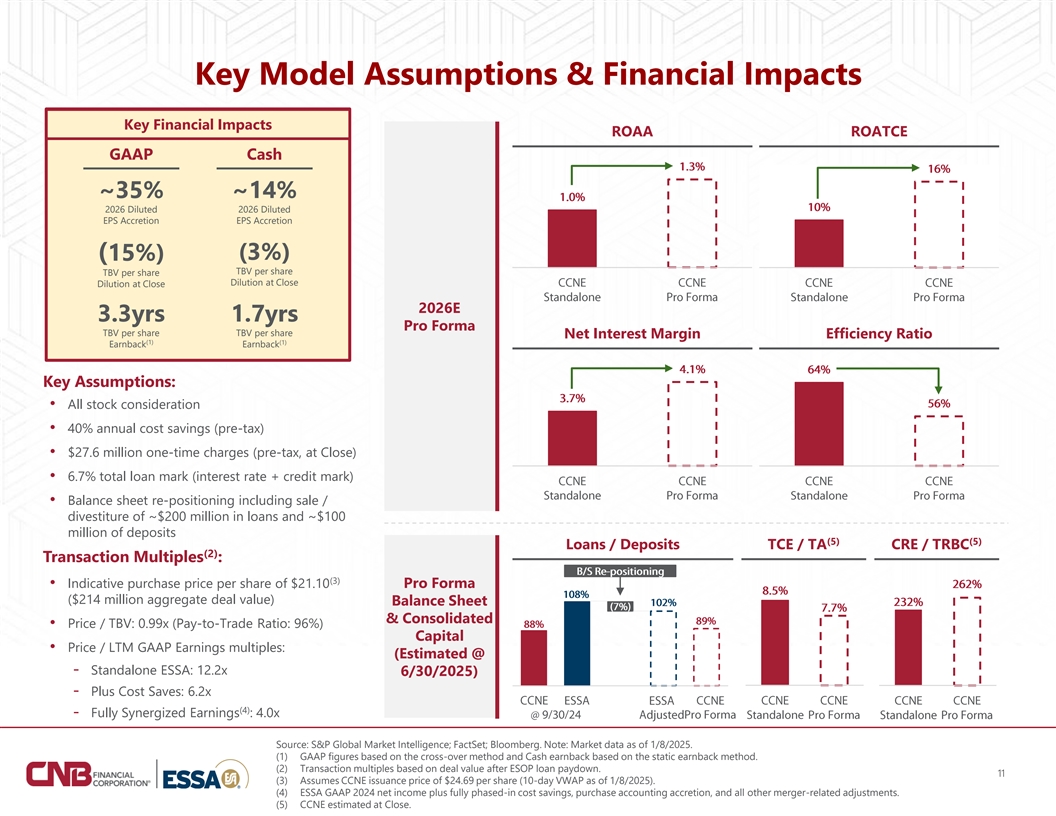
Key Model Assumptions & Financial Impacts Key Financial Impacts ROAA ROATCE GAAP Cash ~35% ~14% 2026 Diluted 2026 Diluted EPS Accretion EPS Accretion (3%) (15%) TBV per share TBV per share Dilution at Close Dilution at Close 2026E 3.3yrs 1.7yrs Pro Forma TBV per share TBV per share Net Interest Margin Efficiency Ratio (1) (1) Earnback Earnback Key Assumptions: • All stock consideration • 40% annual cost savings (pre-tax) • $27.6 million one-time charges (pre-tax, at Close) • 6.7% total loan mark (interest rate + credit mark) • Balance sheet re-positioning including sale / divestiture of ~$200 million in loans and ~$100 million of deposits (5) (5) Loans / Deposits TCE / TA CRE / TRBC (2) Transaction Multiples : (3) • Indicative purchase price per share of $21.10 Pro Forma ($214 million aggregate deal value) Balance Sheet & Consolidated • Price / TBV: 0.99x (Pay-to-Trade Ratio: 96%) Capital • Price / LTM GAAP Earnings multiples: (Estimated @ - Standalone ESSA: 12.2x 6/30/2025) - Plus Cost Saves: 6.2x (4) - Fully Synergized Earnings : 4.0x Source: S&P Global Market Intelligence; FactSet; Bloomberg. Note: Market data as of 1/8/2025. (1) GAAP figures based on the cross-over method and Cash earnback based on the static earnback method. (2) Transaction multiples based on deal value after ESOP loan paydown. 11 (3) Assumes CCNE issuance price of $24.69 per share (10-day VWAP as of 1/8/2025). (4) ESSA GAAP 2024 net income plus fully phased-in cost savings, purchase accounting accretion, and all other merger-related adjustments. (5) CCNE estimated at Close.
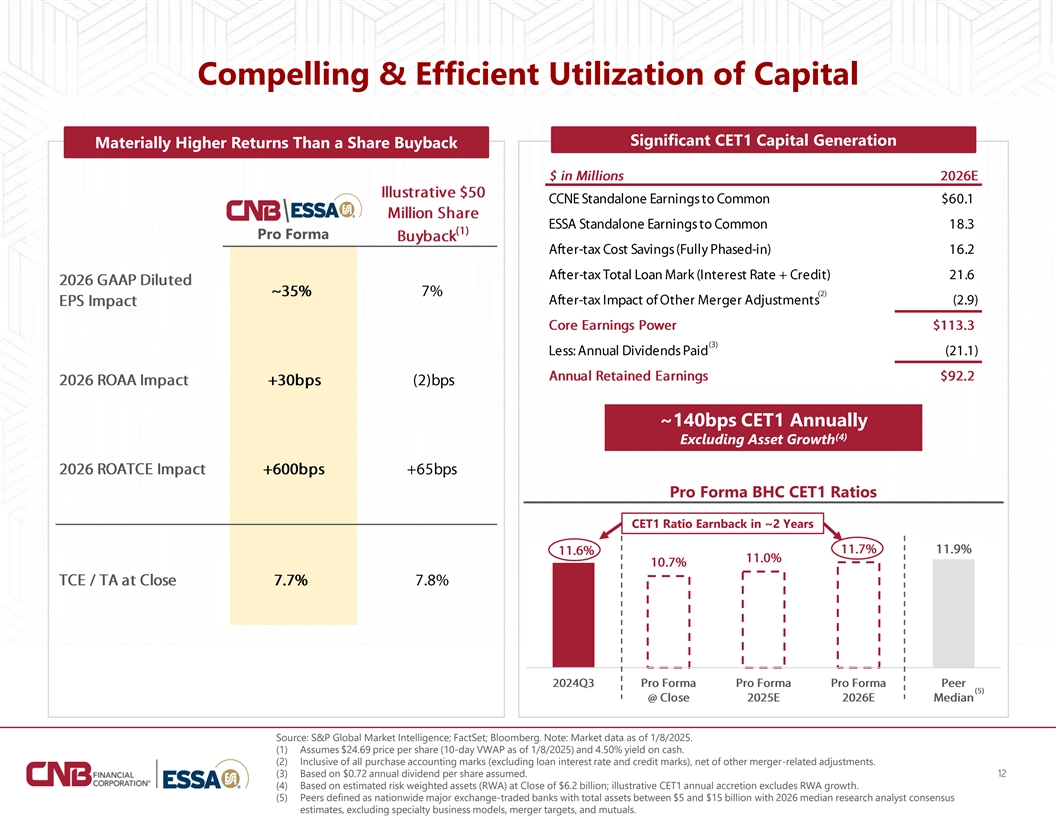
Compelling & Efficient Utilization of Capital Significant CET1 Capital Generation Materially Higher Returns Than a Share Buyback Pro Forma (3) ~140bps CET1 Annually (4) Excluding Asset Growth Pro Forma BHC CET1 Ratios CET1 Ratio Earnback in ~2 Years Source: S&P Global Market Intelligence; FactSet; Bloomberg. Note: Market data as of 1/8/2025. (1) Assumes $24.69 price per share (10-day VWAP as of 1/8/2025) and 4.50% yield on cash. (2) Inclusive of all purchase accounting marks (excluding loan interest rate and credit marks), net of other merger-related adjustments. (3) Based on $0.72 annual dividend per share assumed. 12 (4) Based on estimated risk weighted assets (RWA) at Close of $6.2 billion; illustrative CET1 annual accretion excludes RWA growth. (5) Peers defined as nationwide major exchange-traded banks with total assets between $5 and $15 billion with 2026 median research analyst consensus estimates, excluding specialty business models, merger targets, and mutuals.
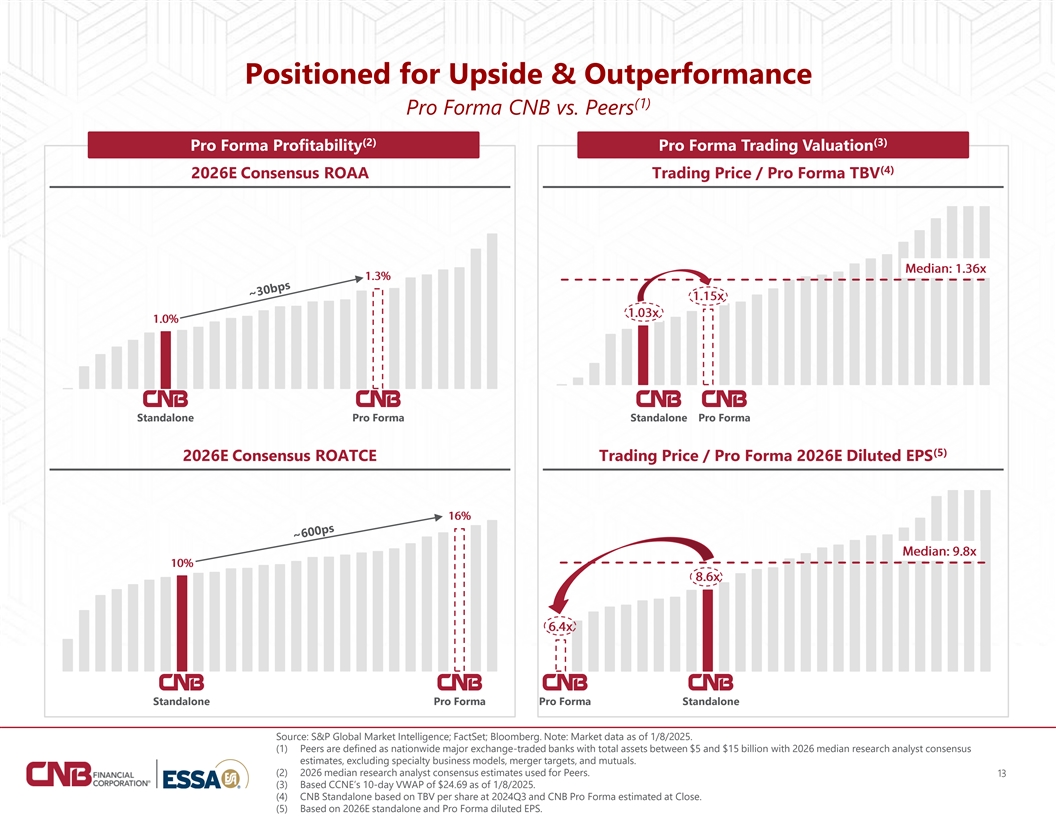
Positioned for Upside & Outperformance (1) Pro Forma CNB vs. Peers (2) (3) Pro Forma Profitability Pro Forma Trading Valuation (4) 2026E Consensus ROAA Trading Price / Pro Forma TBV Standalone Pro Forma Standalone Pro Forma (5) 2026E Consensus ROATCE Trading Price / Pro Forma 2026E Diluted EPS Standalone Pro Forma Pro Forma Standalone Source: S&P Global Market Intelligence; FactSet; Bloomberg. Note: Market data as of 1/8/2025. (1) Peers are defined as nationwide major exchange-traded banks with total assets between $5 and $15 billion with 2026 median research analyst consensus estimates, excluding specialty business models, merger targets, and mutuals. (2) 2026 median research analyst consensus estimates used for Peers. 13 (3) Based CCNE’s 10-day VWAP of $24.69 as of 1/8/2025. (4) CNB Standalone based on TBV per share at 2024Q3 and CNB Pro Forma estimated at Close. (5) Based on 2026E standalone and Pro Forma diluted EPS.
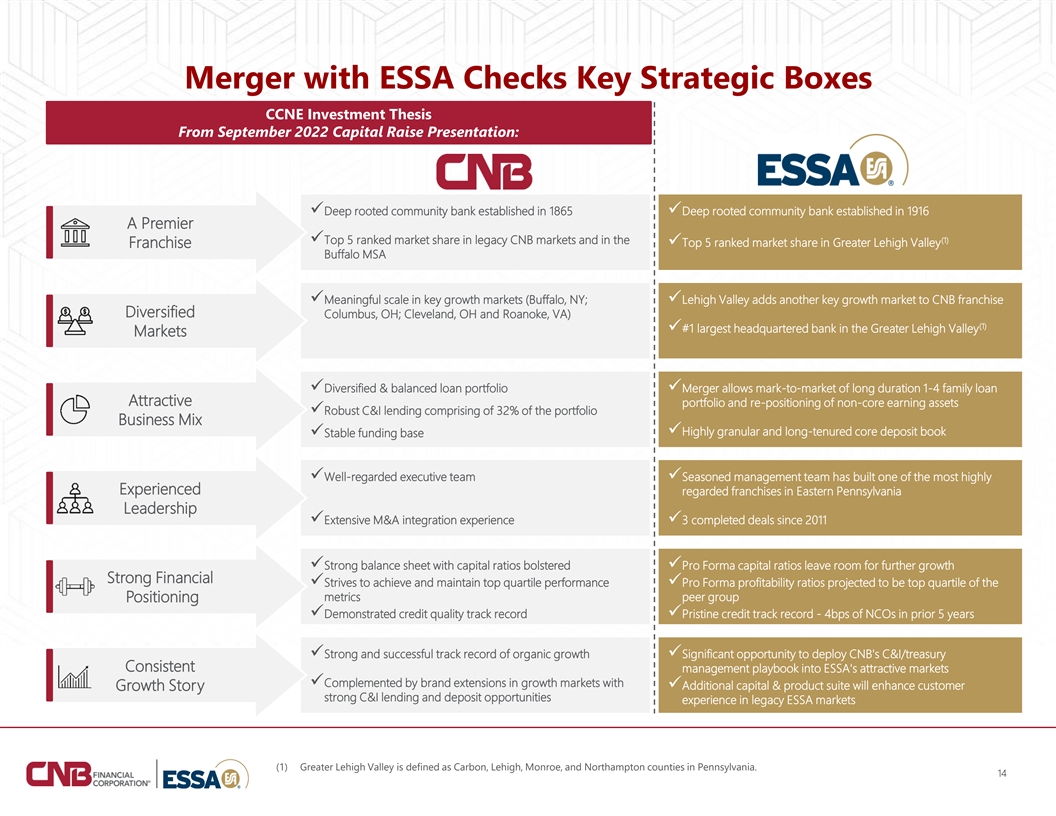
Merger with ESSA Checks Key Strategic Boxes CCNE Investment Thesis From September 2022 Capital Raise Presentation: ✓Deep rooted community bank established in 1865✓Deep rooted community bank established in 1916 A Premier (1) ✓Top 5 ranked market share in legacy CNB markets and in the ✓Top 5 ranked market share in Greater Lehigh Valley Franchise Buffalo MSA ✓Meaningful scale in key growth markets (Buffalo, NY; ✓Lehigh Valley adds another key growth market to CNB franchise Diversified Columbus, OH; Cleveland, OH and Roanoke, VA) (1) ✓#1 largest headquartered bank in the Greater Lehigh Valley Markets ✓Diversified & balanced loan portfolio ✓Merger allows mark-to-market of long duration 1-4 family loan Attractive portfolio and re-positioning of non-core earning assets ✓Robust C&I lending comprising of 32% of the portfolio Business Mix ✓Highly granular and long-tenured core deposit book ✓Stable funding base ✓Well-regarded executive team✓Seasoned management team has built one of the most highly Experienced regarded franchises in Eastern Pennsylvania Leadership ✓Extensive M&A integration experience✓3 completed deals since 2011 ✓Strong balance sheet with capital ratios bolstered✓Pro Forma capital ratios leave room for further growth Strong Financial ✓Strives to achieve and maintain top quartile performance ✓Pro Forma profitability ratios projected to be top quartile of the metrics peer group Positioning ✓Demonstrated credit quality track record✓Pristine credit track record - 4bps of NCOs in prior 5 years ✓Strong and successful track record of organic growth ✓Significant opportunity to deploy CNB's C&I/treasury Consistent management playbook into ESSA's attractive markets ✓Complemented by brand extensions in growth markets with ✓Additional capital & product suite will enhance customer Growth Story strong C&I lending and deposit opportunities experience in legacy ESSA markets (1) Greater Lehigh Valley is defined as Carbon, Lehigh, Monroe, and Northampton counties in Pennsylvania. 14

Model Assumptions & Diligence
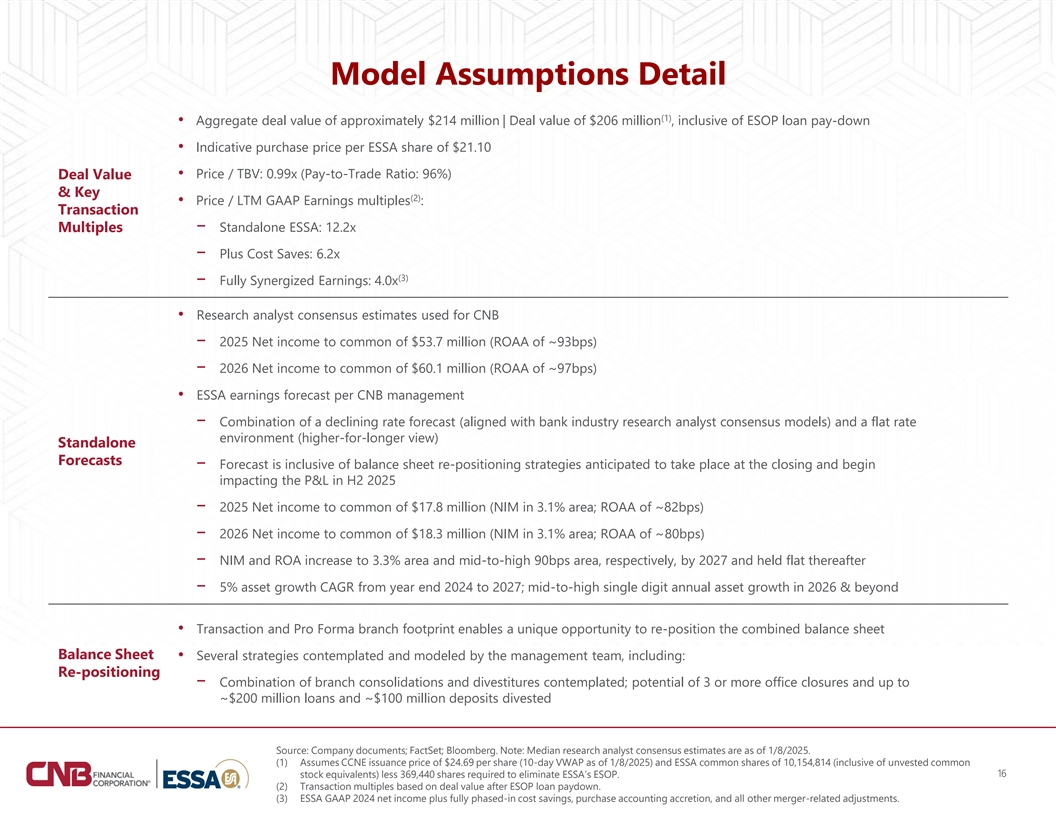
Model Assumptions Detail (1) • Aggregate deal value of approximately $214 million | Deal value of $206 million , inclusive of ESOP loan pay-down • Indicative purchase price per ESSA share of $21.10 • Price / TBV: 0.99x (Pay-to-Trade Ratio: 96%) Deal Value & Key (2) • Price / LTM GAAP Earnings multiples : Transaction Multiples− Standalone ESSA: 12.2x − Plus Cost Saves: 6.2x (3) − Fully Synergized Earnings: 4.0x • Research analyst consensus estimates used for CNB − 2025 Net income to common of $53.7 million (ROAA of ~93bps) − 2026 Net income to common of $60.1 million (ROAA of ~97bps) • ESSA earnings forecast per CNB management − Combination of a declining rate forecast (aligned with bank industry research analyst consensus models) and a flat rate environment (higher-for-longer view) Standalone Forecasts − Forecast is inclusive of balance sheet re-positioning strategies anticipated to take place at the closing and begin impacting the P&L in H2 2025 − 2025 Net income to common of $17.8 million (NIM in 3.1% area; ROAA of ~82bps) − 2026 Net income to common of $18.3 million (NIM in 3.1% area; ROAA of ~80bps) − NIM and ROA increase to 3.3% area and mid-to-high 90bps area, respectively, by 2027 and held flat thereafter − 5% asset growth CAGR from year end 2024 to 2027; mid-to-high single digit annual asset growth in 2026 & beyond • Transaction and Pro Forma branch footprint enables a unique opportunity to re-position the combined balance sheet Balance Sheet • Several strategies contemplated and modeled by the management team, including: Re-positioning − Combination of branch consolidations and divestitures contemplated; potential of 3 or more office closures and up to ~$200 million loans and ~$100 million deposits divested Source: Company documents; FactSet; Bloomberg. Note: Median research analyst consensus estimates are as of 1/8/2025. (1) Assumes CCNE issuance price of $24.69 per share (10-day VWAP as of 1/8/2025) and ESSA common shares of 10,154,814 (inclusive of unvested common 16 stock equivalents) less 369,440 shares required to eliminate ESSA’s ESOP. (2) Transaction multiples based on deal value after ESOP loan paydown. (3) ESSA GAAP 2024 net income plus fully phased-in cost savings, purchase accounting accretion, and all other merger-related adjustments.

Model Assumptions Detail (Cont.) (1) • Gross credit markdown of $23.5 million (excluding CECL Double Count of $15.3 million) or 1.3% of ESSA’s HFI loans , and 154% of ESSA’s loan loss reserves − $8.2 million (35%) allocated to purchase credit deteriorated (PCD) loans Credit Mark − $15.3 million (65%) allocated to Non-PCD loans (accreted into earnings over 6 years, sum-of-years digits) • Day-two estimated CECL reserve of $15.3 million (CECL Double Count) (1) • Total credit mark inclusive of CECL Double Count of $38.8 million ($23.5 million plus $15.3 million) or 2.2% of ESSA’s HFI loans (1) • $94.2 million pre-tax markdown, or 5.4% of ESSA’s HFI loans (accreted over 6 years, sum-of-years digits) • $5.9 million pre-tax markdown on HTM securities (accreted over 4 years, straight-line) Interest Rate Marks (2) • ESSA's AFS securities-related AOCI of ($7.7) million after-tax, accreted through Pro Forma earnings over 4 years (straight-line) • $0.4 million pre-tax markdown on time deposits (amortized over 1 year, straight-line) Core Deposit • $31.4 million core deposit intangible (CDI) created, or 3.0% of ESSA’s non-time deposits Intangibles • Amortized over 10 years, sum-of-years digits methodology Created • Estimated pre-tax cost savings of $19.7 million (fully-phased in) / $15.6 million after-tax, based on ESSA 2025E operating expenses Cost Savings & Merger • Approximately 40% of ESSA's operating expenses (50% expected to be realized in 2025 and 100% thereafter) Charges • Pre-tax merger-related charges of $27.6 million (fully reflected in Pro Forma TBV dilution at closing) Source: Company documents; FactSet; Bloomberg. 17 (1) HFI is held for investment loans as of 9/30/2024. (2) Accumulated Other Comprehensive Income (AOCI) as of 9/30/2024.
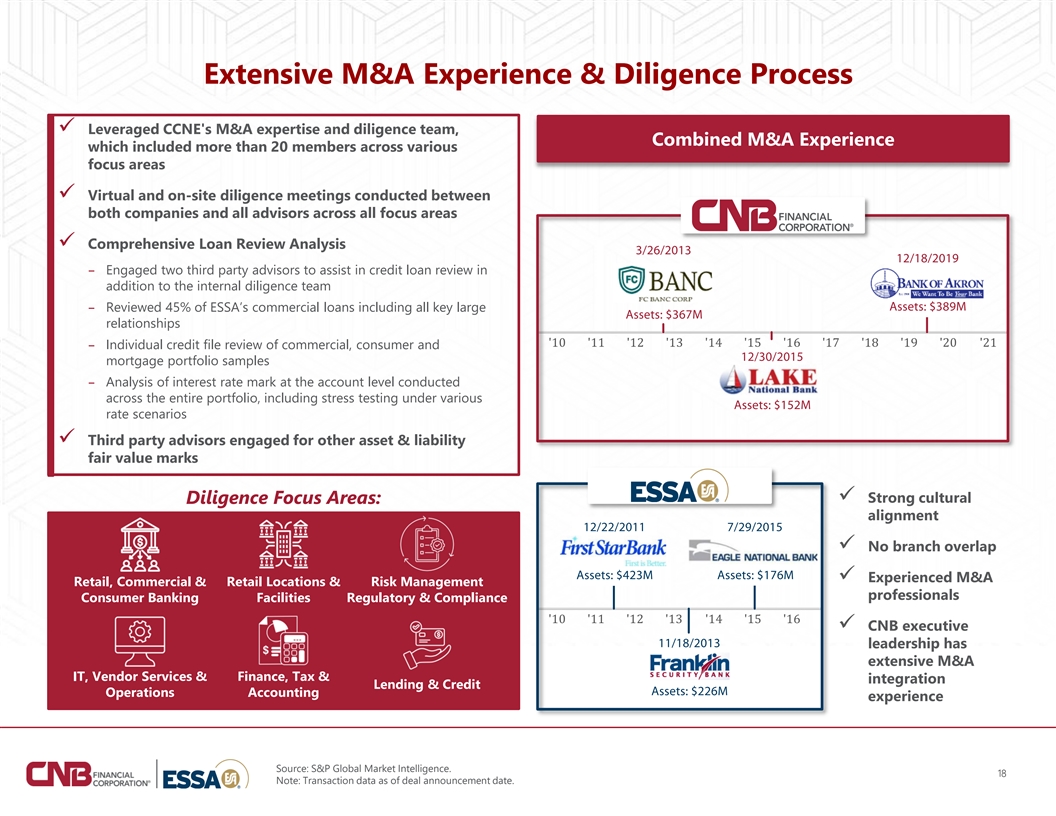
Extensive M&A Experience & Diligence Process ✓ Leveraged CCNE's M&A expertise and diligence team, Combined M&A Experience which included more than 20 members across various focus areas ✓ Virtual and on-site diligence meetings conducted between both companies and all advisors across all focus areas ✓ Comprehensive Loan Review Analysis – Engaged two third party advisors to assist in credit loan review in addition to the internal diligence team – Reviewed 45% of ESSA’s commercial loans including all key large relationships – Individual credit file review of commercial, consumer and mortgage portfolio samples – Analysis of interest rate mark at the account level conducted across the entire portfolio, including stress testing under various rate scenarios ✓ Third party advisors engaged for other asset & liability fair value marks ✓ Strong cultural Diligence Focus Areas: alignment ✓ No branch overlap ✓ Experienced M&A Retail, Commercial & Retail Locations & Risk Management professionals Consumer Banking Facilities Regulatory & Compliance ✓ CNB executive leadership has extensive M&A IT, Vendor Services & Finance, Tax & integration Lending & Credit Operations Accounting experience Source: S&P Global Market Intelligence. 18 Note: Transaction data as of deal announcement date.
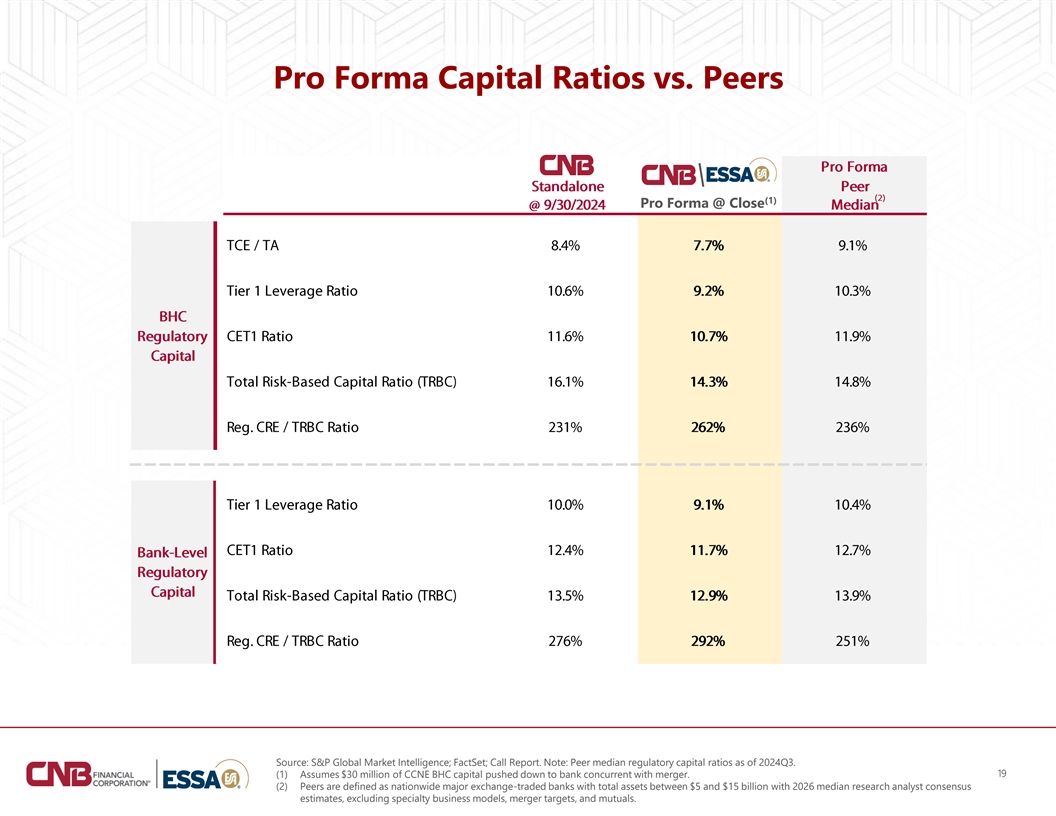
Pro Forma Capital Ratios vs. Peers (1) Pro Forma @ Close Source: S&P Global Market Intelligence; FactSet; Call Report. Note: Peer median regulatory capital ratios as of 2024Q3. 19 (1) Assumes $30 million of CCNE BHC capital pushed down to bank concurrent with merger. (2) Peers are defined as nationwide major exchange-traded banks with total assets between $5 and $15 billion with 2026 median research analyst consensus estimates, excluding specialty business models, merger targets, and mutuals.
Appendix
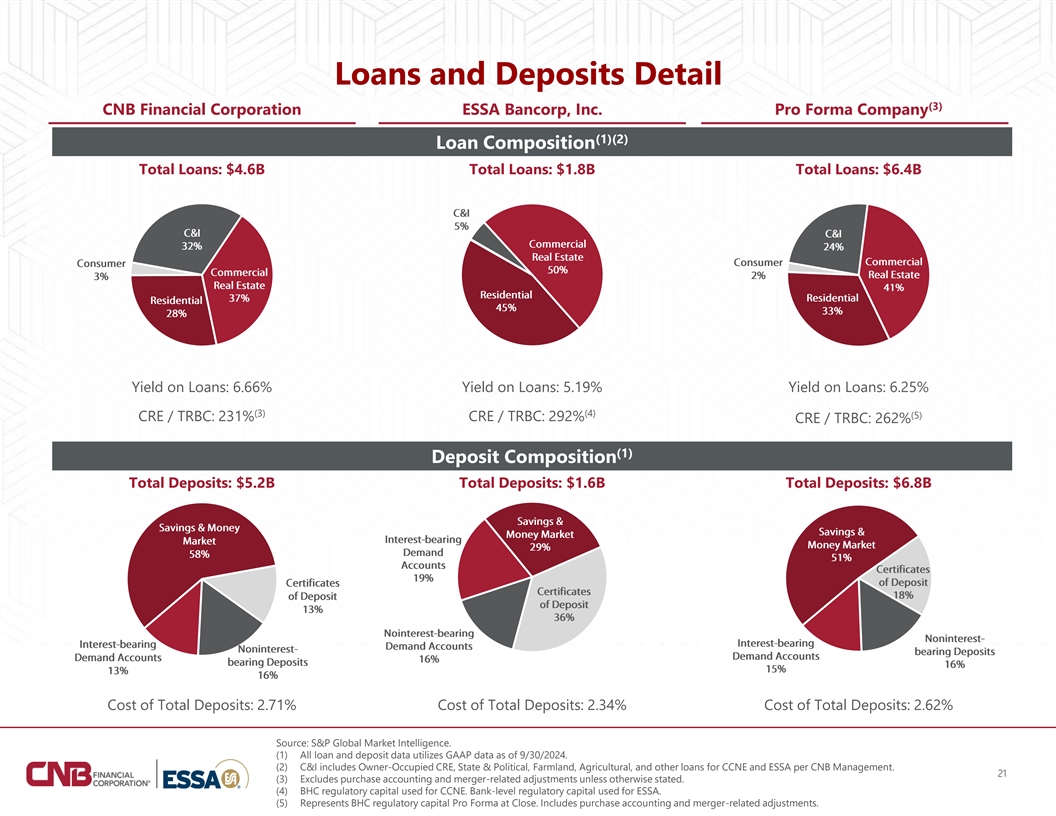
Loans and Deposits Detail (3) CNB Financial Corporation ESSA Bancorp, Inc. Pro Forma Company (1)(2) Loan Composition Total Loans: $4.6B Total Loans: $1.8B Total Loans: $6.4B Yield on Loans: 6.66% Yield on Loans: 5.19% Yield on Loans: 6.25% (3) (4) (5) CRE / TRBC: 231% CRE / TRBC: 292% CRE / TRBC: 262% (1) Deposit Composition Total Deposits: $5.2B Total Deposits: $1.6B Total Deposits: $6.8B Cost of Total Deposits: 2.71% Cost of Total Deposits: 2.34% Cost of Total Deposits: 2.62% Source: S&P Global Market Intelligence. (1) All loan and deposit data utilizes GAAP data as of 9/30/2024. (2) C&I includes Owner-Occupied CRE, State & Political, Farmland, Agricultural, and other loans for CCNE and ESSA per CNB Management. 21 (3) Excludes purchase accounting and merger-related adjustments unless otherwise stated. (4) BHC regulatory capital used for CCNE. Bank-level regulatory capital used for ESSA. (5) Represents BHC regulatory capital Pro Forma at Close. Includes purchase accounting and merger-related adjustments.
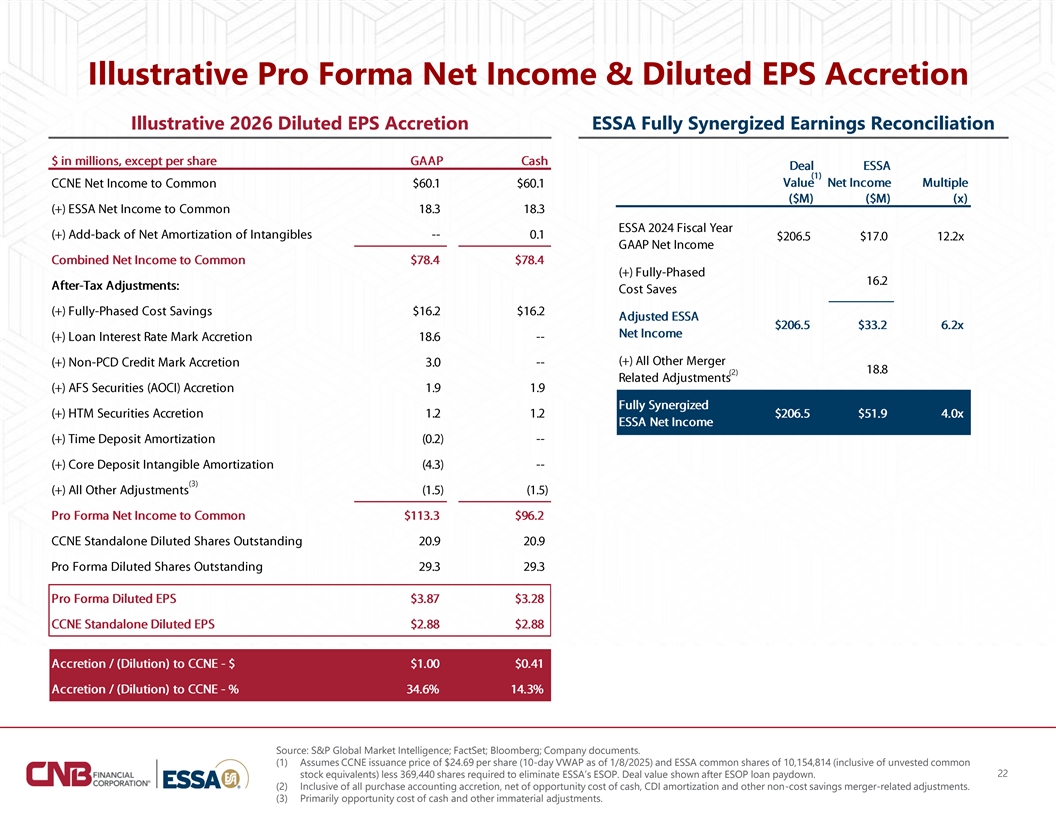
Illustrative Pro Forma Net Income & Diluted EPS Accretion Illustrative 2026 Diluted EPS Accretion ESSA Fully Synergized Earnings Reconciliation (2) (3) Source: S&P Global Market Intelligence; FactSet; Bloomberg; Company documents. (1) Assumes CCNE issuance price of $24.69 per share (10-day VWAP as of 1/8/2025) and ESSA common shares of 10,154,814 (inclusive of unvested common 22 stock equivalents) less 369,440 shares required to eliminate ESSA’s ESOP. Deal value shown after ESOP loan paydown. (2) Inclusive of all purchase accounting accretion, net of opportunity cost of cash, CDI amortization and other non-cost savings merger-related adjustments. (3) Primarily opportunity cost of cash and other immaterial adjustments.
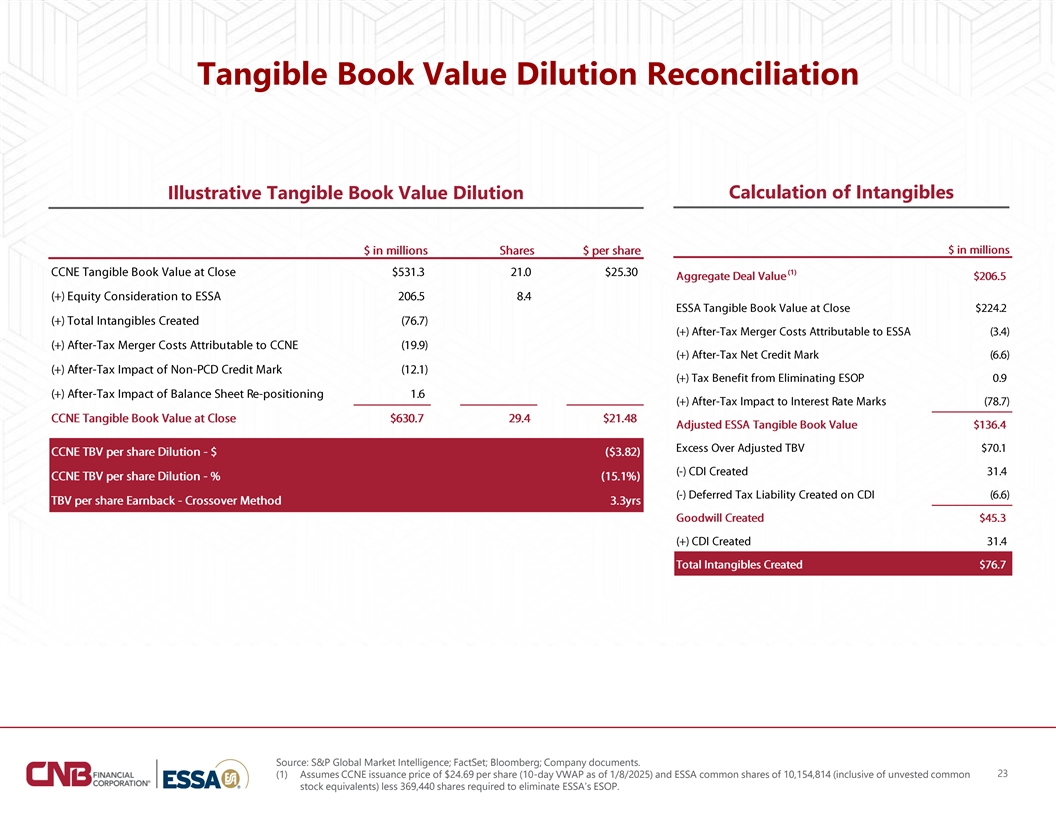
Tangible Book Value Dilution Reconciliation Calculation of Intangibles Illustrative Tangible Book Value Dilution (1) (1) Source: S&P Global Market Intelligence; FactSet; Bloomberg; Company documents. 23 (1) Assumes CCNE issuance price of $24.69 per share (10-day VWAP as of 1/8/2025) and ESSA common shares of 10,154,814 (inclusive of unvested common stock equivalents) less 369,440 shares required to eliminate ESSA’s ESOP.
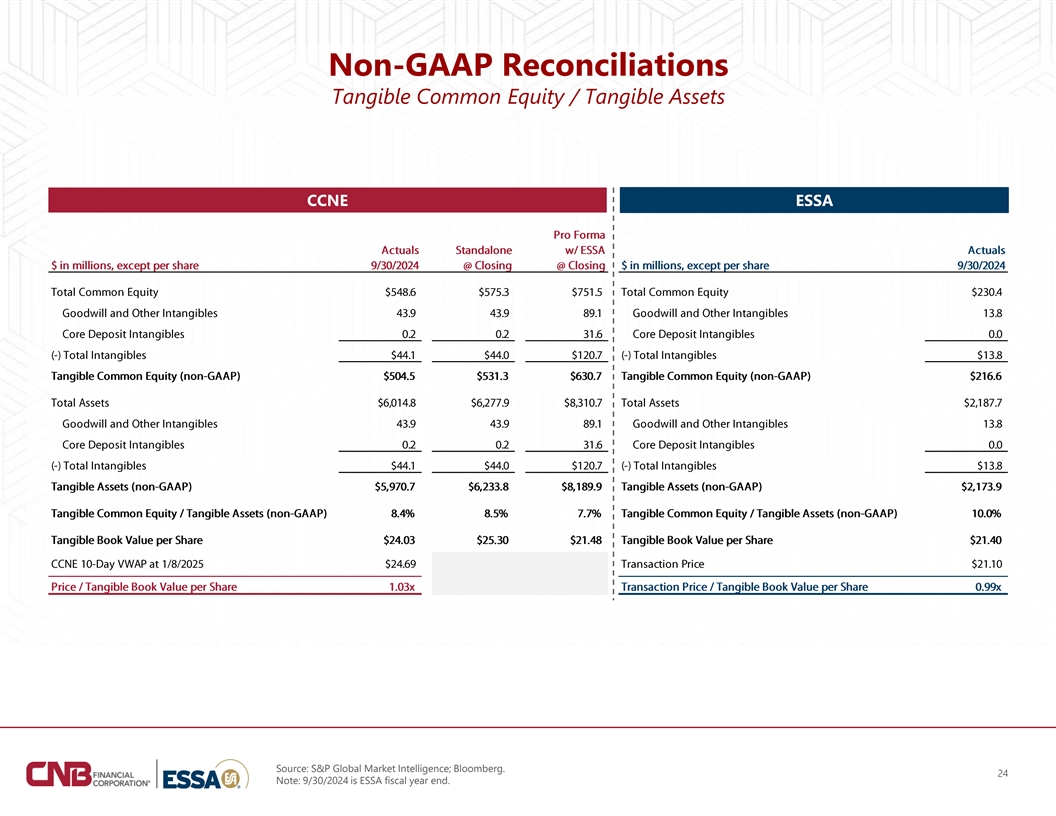
Non-GAAP Reconciliations Tangible Common Equity / Tangible Assets CCNE CCNE ESSA Source: S&P Global Market Intelligence; Bloomberg. 24 Note: 9/30/2024 is ESSA fiscal year end.
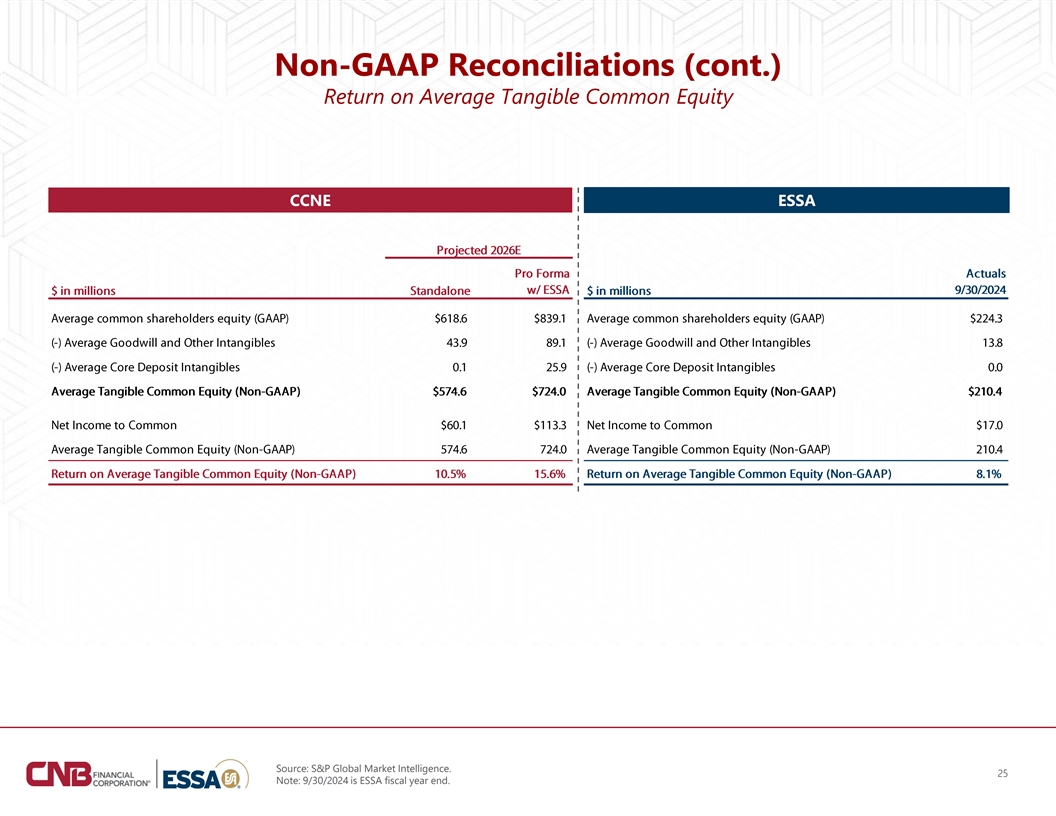
Non-GAAP Reconciliations (cont.) Return on Average Tangible Common Equity CCNE ESSA Source: S&P Global Market Intelligence. 25 Note: 9/30/2024 is ESSA fiscal year end.