
INVESTOR PRESENTATION Jan 28-30, 2025 O U R F A M I L Y O F B A N K S
CERTAIN IMPORTANT INFORMATION CAUTION REGARDING FORWARD LOOKING STATEMENTS This presentation includes forward-looking statements within the meaning of Section 27A of the Securities Act of 1933, as amended, and Section 21E of the Securities Exchange Act of 1934, as amended, with respect to the Corporation’s financial condition, liquidity, results of operations, future performance and business. These forward-looking statements are intended to be covered by the safe harbor for “forward-looking statements” provided by the Private Securities Litigation Reform Act of 1995. Forward-looking statements are those that are not historical facts. Forward-looking statements include statements with respect to beliefs, plans, objectives, goals, expectations, anticipations, estimates and intentions that are subject to significant risks and uncertainties and are subject to change based on various factors (some of which are beyond the Corporation’s control). Forward-looking statements often include the words “believes,” “expects,” “anticipates,” “estimates,” “forecasts,”“intends,”“plans,”“targets,”“potentially,” “probably,” “projects,” “outlook” or similar expressions or future conditional verbs such as “may,” “will,” “should,” “would” and “could.” The Corporation’s actual results may differ materially from those contemplated by the forward-looking statements, which are neither statements of historical fact nor guarantees or assurances of future performance. Such known and unknown risks, uncertainties and other factors that could cause the actual results to differ materially from the statements, include, but are not limited to, (i) adverse changes or conditions in capital and financial markets, including actual or potential stresses in the banking industry; (ii) changes in interest rates; (iii) the credit risks of lending activities, including our ability to estimate credit losses and the allowance for credit losses, as well as the effects of changes in the level of, and trends in, loan delinquencies and write-offs; (iv) effectiveness of our data security controls in the face of cyber attacks and any reputational risks following a cybersecurity incident; (v) changes in general business, industry or economic conditions or competition; (vi) changes in any applicable law, rule, regulation, policy, guideline or practice governing or affecting financial holding companies and their subsidiaries or with respect to tax or accounting principles or otherwise; (vii) governmental approvals of the Corporation's pending merger with ESSA may not be obtained, or adverse regulatory conditions may be imposed in connection with governmental approvals of the merger; (viii) the Corporation's shareholders and/or the shareholders of ESSA may fail to approve the merger; (ix) higher than expected costs or other difficulties related to integration of combined or merged businesses; (x) the effects of business combinations and other acquisition transactions, including the inability to realize our loan and investment portfolios; (xi) changes in the quality or composition of our loan and investment portfolios; (xii) adequacy of loan loss reserves; (xiii) increased competition; (xiv) loss of certain key officers; (xv) deposit attrition; (xvi) rapidly changing technology; (xvii) unanticipated regulatory or judicial proceedings and liabilities and other costs; (xviii) changes in the cost of funds, demand for loan products or demand for financial services; and (xix) other economic, competitive, governmental or technological factors affecting our operations, markets, products, services and prices. Such developments could have an adverse impact on the Corporation's financial position and results of operations. For more information about factors that could cause actual results to differ from those discussed in the forward-looking statements, please refer to the “Risk Factors” and “Management’s Discussion and Analysis of Financial Condition and Results of Operations” sections of and the forward-looking statement disclaimers in the Corporation’s annual and quarterly reports filed with the Securities and Exchange Commission. The forward-looking statements are based upon management’s beliefs and assumptions and are made as of the date of this presentation. Factors or events that could cause the Corporation’s actual results to differ may emerge from time to time, and it is not possible for the Corporation to predict all of them. The Corporation undertakes no obligation to publicly update or revise any forward-looking statements included in this presentation or to update the reasons why actual results could differ from those contained in such statements, whether as a result of new information, future events or otherwise, except to the extent required by law. In light of these risks, uncertainties and assumptions, the forward-looking events discussed in this presentation might not occur and you should not put undue reliance on any forward-looking statements. NON-GAAP FINANCIAL MEASURES This report contains references to financial measures that are not defined in GAAP. Management uses non-GAAP financial information in its analysis of the Corporation’s performance. Management believes that these non-GAAP measures provide a greater understanding of ongoing operations, enhance comparability of results of operations with prior periods and show the effects of significant gains and charges in the periods presented. The Corporation’s management believes that investors may use these non- GAAP measures to analyze the Corporation’s financial performance without the impact of unusual items or events that may obscure trends in the Corporation’s underlying performance. This non-GAAP data should be considered in addition to results prepared in accordance with GAAP, and is not a substitute for, or superior to, GAAP results. Limitations associated with non-GAAP financial measures include the risks that persons might disagree as to the appropriateness of items included in these measures and that different companies might calculate these measures differently. Non-GAAP measures reflected within the presentation include: Tangible common equity/tangible assets, Return on average tangible common equity, Net interest margin (fully tax equivalent basis), Efficiency ratio (fully tax equivalent) and Tangible book value per share. 2

CNB FINANCIAL CORPORATION § Holding Company for CNB Bank (Clearfield, PA), serving the community since 1865 § 55 full-service offices, 1 drive-through location and 1 mobile office across Pennsylvania, New York, Ohio and Virginia § CNB Bank’s regional divisions (all under one charter) include CNB Bank (Central and North Central PA); FCBank (Central OH), ERIEBANK (Northeast OH & Northwest PA), BankOnBuffalo (Western NY), Ridge View Bank (Southwest, VA), and Impressia Bank, which operates across our entire footprint § Nasdaq: CCNE & CCNEP (1) § Market Capitalization: ~$526 million FINANCIAL HIGHLIGHTS (As of 12/31/24) ASSETS: $6.2 billion DEPOSITS: $5.4 billion LOANS: $4.6 billion (2) 2024 ROAA : 0.93% (3) 2024 ROATCE : 10.25% (4) NPAs/ASSETS : 0.96% (1) Based on 20,987,992 share count reported as of December 31, 2024, in January 28, 2025 Earnings Release and the January 23, 2025 closing stock price ($25.07) (2) “ROAA” means Return on Average Assets 3 (3) “ROATCE” means Return on Average Tangible Common Equity and is a non-GAAP financial measure - see Appendix for reconciliation. Return on Average Equity for twelve months ended December 31, 2024 was 9.21% (4) “NPAs” means Nonperforming Assets

INVESTMENT ACCRETION AND RETURNS (1) (1) TANGIBLE BOOK VALUE PER SHARE RETURN ON AVERAGE TANGIBLE COMMON EQUITY $30.00 BV / Share $26.34 TBV / Share $24.57 $25.00 ROATCE ROAE 18.00% $22.85 $22.39 $24.24 $21.29 $22.46 $20.00 $20.00 $20.30 $20.22 $17.28 16.00% $18.66 $15.98 $17.45 $14.64 $14.01 $15.00 $13.09 $14.69 $13.33 14.00% $11.96 $11.76 $10.00 $10.97 12.00% $5.00 $- 10.00% 2014 2015 2016 2017 2018 2019 2020 2021 2022 2023 2024 (2) DILUTED EARNINGS PER COMMON SHARE 8.00% $3.50 $3.26 $3.16 $3.00 $2.63 6.00% $2.55 $2.39 $2.50 $2.21 $1.97 $2.00 4.00% $1.60 $1.57 $1.54 2007 2008 2009 2010 2011 2012 2013 2014 2015 2016 2017 2018 2019 2020 2021 2022 2023 2024 $1.42 $1.50 $1.00 $0.50 $- 2014 2015 2016 2017 2018 2019 2020 2021 2022 2023 2024 (1) Return on average tangible common equity and tangible book value per share are non-GAAP financial measures – see Appendix for reconciliations; Average equity includes both common and preferred equity in periods following the 2020 preferred equity issuance 4 (2) Diluted earnings per share includes merger costs in 2019 and merger costs, FHLB prepayment penalties and branch closure costs in 2020. Note: “CAGR” means Compound Annual Growth Rate.
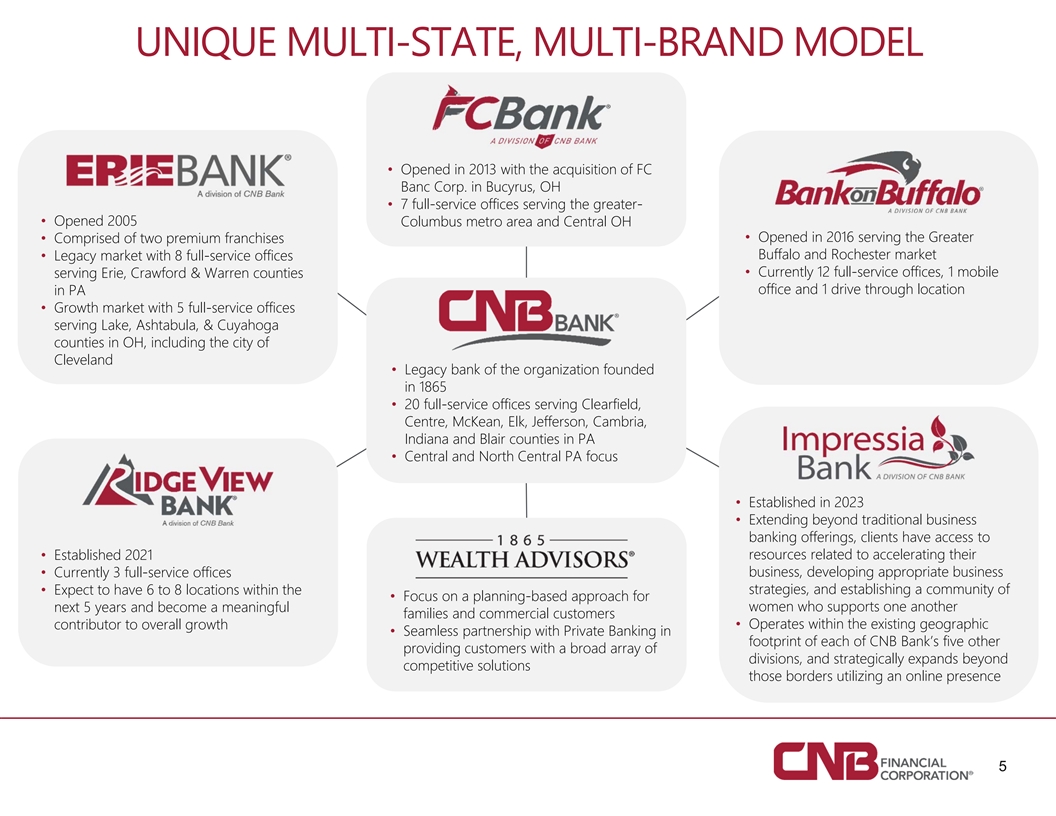
UNIQUE MULTI-STATE, MULTI-BRAND MODEL • Opened in 2013 with the acquisition of FC Banc Corp. in Bucyrus, OH • 7 full-service offices serving the greater- • Opened 2005 Columbus metro area and Central OH • Comprised of two premium franchises• Opened in 2016 serving the Greater Buffalo and Rochester market • Legacy market with 8 full-service offices • Currently 12 full-service offices, 1 mobile serving Erie, Crawford & Warren counties office and 1 drive through location in PA • Growth market with 5 full-service offices serving Lake, Ashtabula, & Cuyahoga counties in OH, including the city of Cleveland • Legacy bank of the organization founded in 1865 • 20 full-service offices serving Clearfield, Centre, McKean, Elk, Jefferson, Cambria, Indiana and Blair counties in PA • Central and North Central PA focus • Established in 2023 • Extending beyond traditional business banking offerings, clients have access to • Established 2021 resources related to accelerating their • Currently 3 full-service offices business, developing appropriate business • Expect to have 6 to 8 locations within the strategies, and establishing a community of • Focus on a planning-based approach for next 5 years and become a meaningful women who supports one another families and commercial customers contributor to overall growth• Operates within the existing geographic • Seamless partnership with Private Banking in footprint of each of CNB Bank’s five other providing customers with a broad array of divisions, and strategically expands beyond competitive solutions those borders utilizing an online presence 5
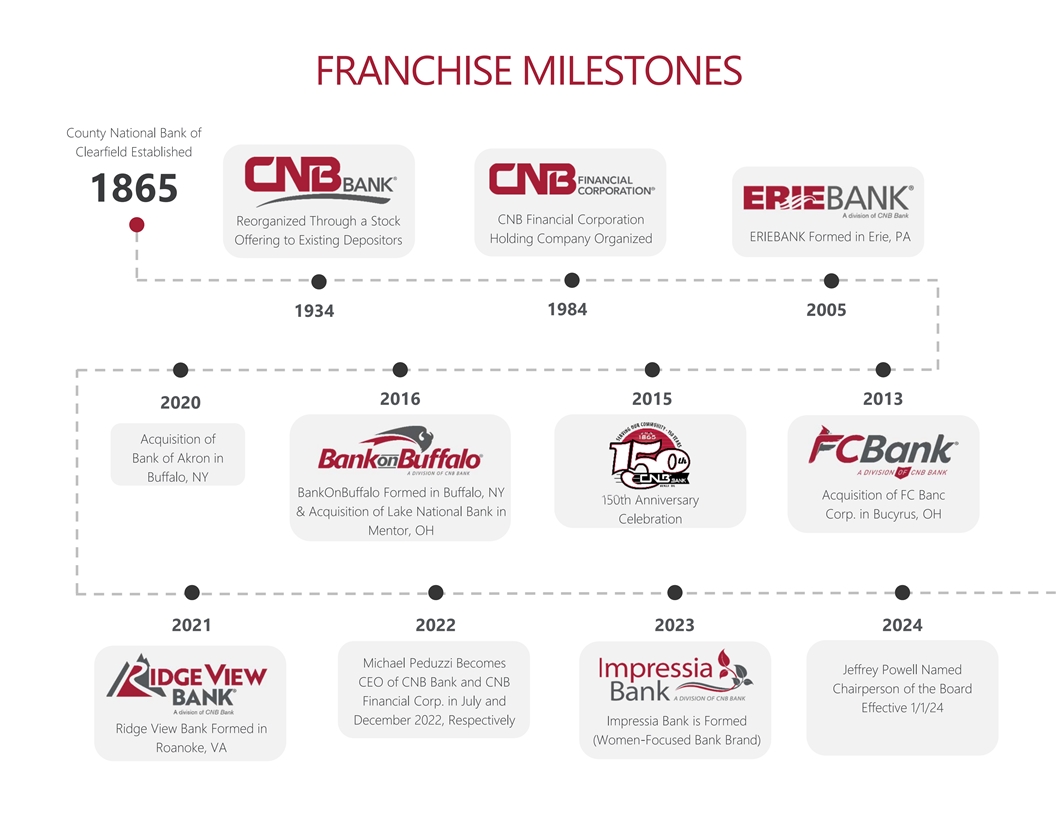
FRANCHISE MILESTONES County National Bank of Clearfield Established 1865 CNB Financial Corporation Reorganized Through a Stock ERIEBANK Formed in Erie, PA Holding Company Organized Offering to Existing Depositors 1984 2005 1934 2016 2015 2013 2020 Acquisition of Bank of Akron in Buffalo, NY BankOnBuffalo Formed in Buffalo, NY Acquisition of FC Banc 150th Anniversary & Acquisition of Lake National Bank in Corp. in Bucyrus, OH Celebration Mentor, OH 2021 2022 2023 2024 Michael Peduzzi Becomes Jeffrey Powell Named CEO of CNB Bank and CNB Chairperson of the Board Financial Corp. in July and Effective 1/1/24 December 2022, Respectively Impressia Bank is Formed Ridge View Bank Formed in (Women-Focused Bank Brand) Roanoke, VA

ASSET GROWTH AND KEY CAPITAL ACTIVITIES $7.0 $6.2 $6.0 $5.8 $5.5 $5.3 $5.0 $4.7 $4.0 $3.8 $3.2 $2.8 $3.0 $2.6 $2.3 $2.2 $2.1 $1.8 $2.0 $1.6 $1.4 $1.2 $1.0 $0.9 $0.8 $1.0 $0.8 $0.0 2005 2006 2007 2008 2009 2010 2011 2012 2013 2014 2015 2016 2017 2018 2019 2020 2021 2022 2023 2024 Common Equity Common Equity C Capital apital At At-The -The- - Pref Preferred erred R Ra ai is se e o of f $34.5M $34.5M Common Common Market Market Equity Equity C Capital apital $85.0M $85.0M S Su ub b- - Eq Equity uity Capital Capital Rais Raise e of of Acquisition of Acquisition of L Lake ake De Debt bt R Rais aise e Capital Capital Raise Raise Rais Raise e of of $60.4M $60.4M National National B Bank ank o of f $100.0M $100.0M $20.0M $20.0M Acquisition of Acquisition of F FC C Banc Banc C Corp. orp. Acquisition of Acquisition of $50.0M $50.0M S Sub ub- - Bank Bank o of f A Ak kron ron Debt Debt R Ra ai ise se 7 Note: CAGR based on the period from December 31, 2005, through December 31, 2024 $ in Billions 2010 2013 2016 2017 2020 2021 2022
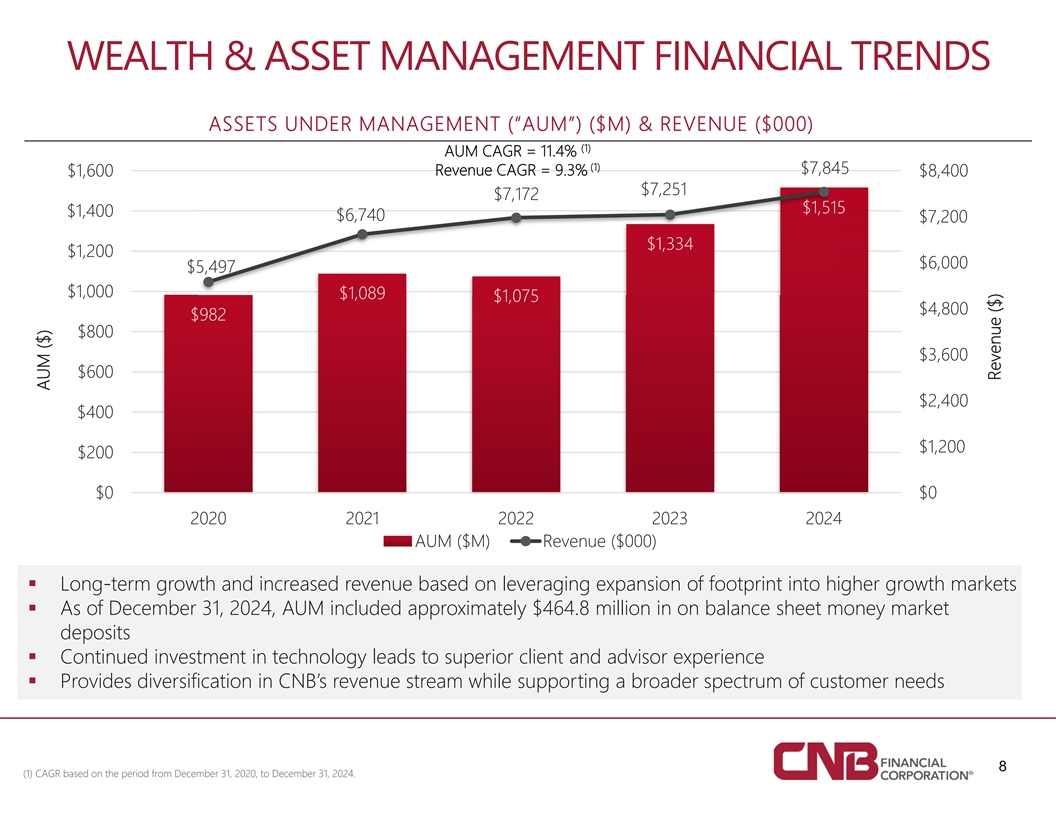
WEALTH & ASSET MANAGEMENT FINANCIAL TRENDS ASSETS UNDER MANAGEMENT (“AUM”) ($M) & REVENUE ($000) (1) AUM CAGR = 11.4% (1) $7,845 Revenue CAGR = 9.3% $1,600 $8,400 $7,251 $7,172 $1,515 $1,400 $6,740 $7,200 $1,334 $1,200 $6,000 $5,497 $1,000 $1,089 $1,075 $4,800 $982 $800 $3,600 $600 $2,400 $400 $1,200 $200 $0 $0 2020 2021 2022 2023 2024 AUM ($M) Revenue ($000) § Long-term growth and increased revenue based on leveraging expansion of footprint into higher growth markets § As of December 31, 2024, AUM included approximately $464.8 million in on balance sheet money market deposits § Continued investment in technology leads to superior client and advisor experience § Provides diversification in CNB’s revenue stream while supporting a broader spectrum of customer needs 8 (1) CAGR based on the period from December 31, 2020, to December 31, 2024. AUM ($) Revenue ($)

CONSOLIDATED CAPITAL POSITION (1)(2) (3) ACTUAL (12/31/24) PROFORMA AOCI IMPACT (12/31/24) 20% 20% 15% 16.16% 15% 14.91% 8.93% 11.76% 10% 10% 8.59% 10.51% 8.28% 7.93% 5% 5% 0% 0% Common equity / Total assets Common equity / Total assets Total Risk Based Capital Ratio Total Risk Based Capital Ratio Common Equity Tier 1 Ratio Common Equity Tier 1 Ratio Tangible common equity / Tangible assets Tangible common equity / Tangible assets § Capital levels remain strong on an actual and proforma basis § The Corporation repurchased 23,988 shares of common stock at a weighted average price of $18.38 per share during the twelve months ended December 31, 2024; remaining capacity under the current program was 149,553 shares / $8.0 million as of December 31, 2024 (1) Capital as of December 31, 2024. (2) Tangible common equity / Tangible assets is a non-GAAP financial measure - see Appendix for reconciliation 9 (3) Proforma adjustments include adjustments for pre-tax and after-tax unrealized losses on the available-for-sale and held-to-maturity securities portfolios as of December 31, 2024. Note: “AOCI” means Accumulated Other Comprehensive Income.
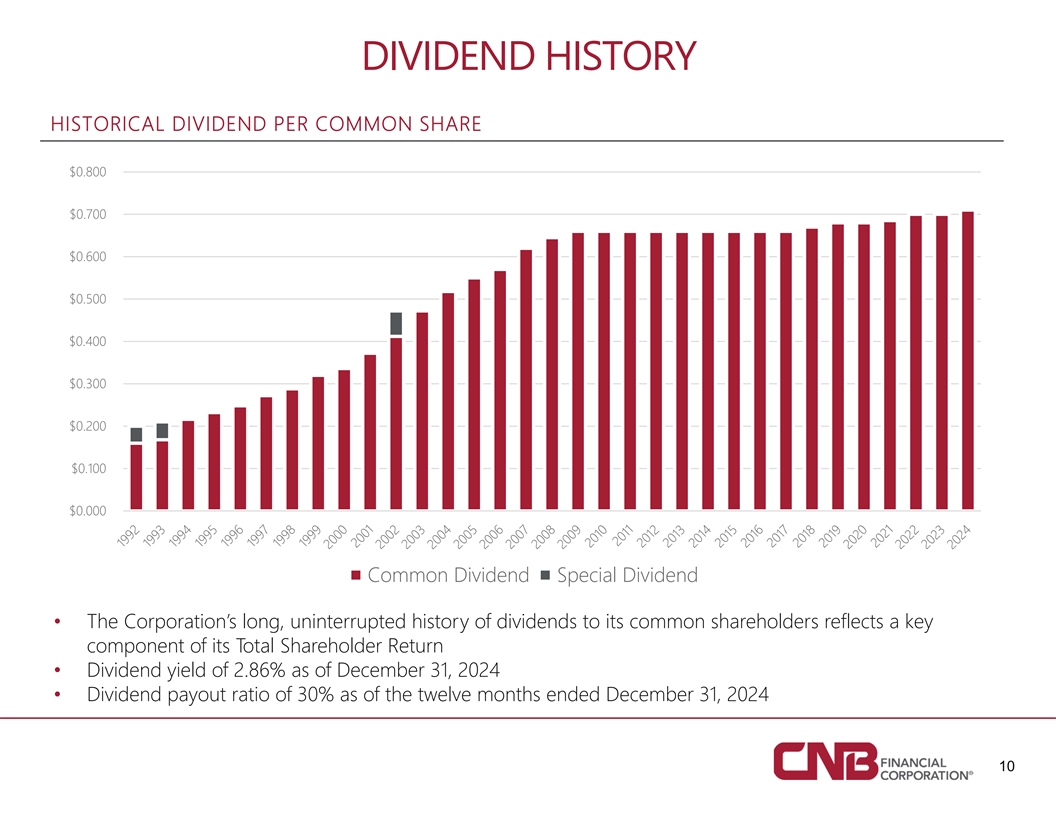
DIVIDEND HISTORY HISTORICAL DIVIDEND PER COMMON SHARE $0.800 $0.700 $0.600 $0.500 $0.400 $0.300 $0.200 $0.100 $0.000 Common Dividend Special Dividend • The Corporation’s long, uninterrupted history of dividends to its common shareholders reflects a key component of its Total Shareholder Return • Dividend yield of 2.86% as of December 31, 2024 • Dividend payout ratio of 30% as of the twelve months ended December 31, 2024 10
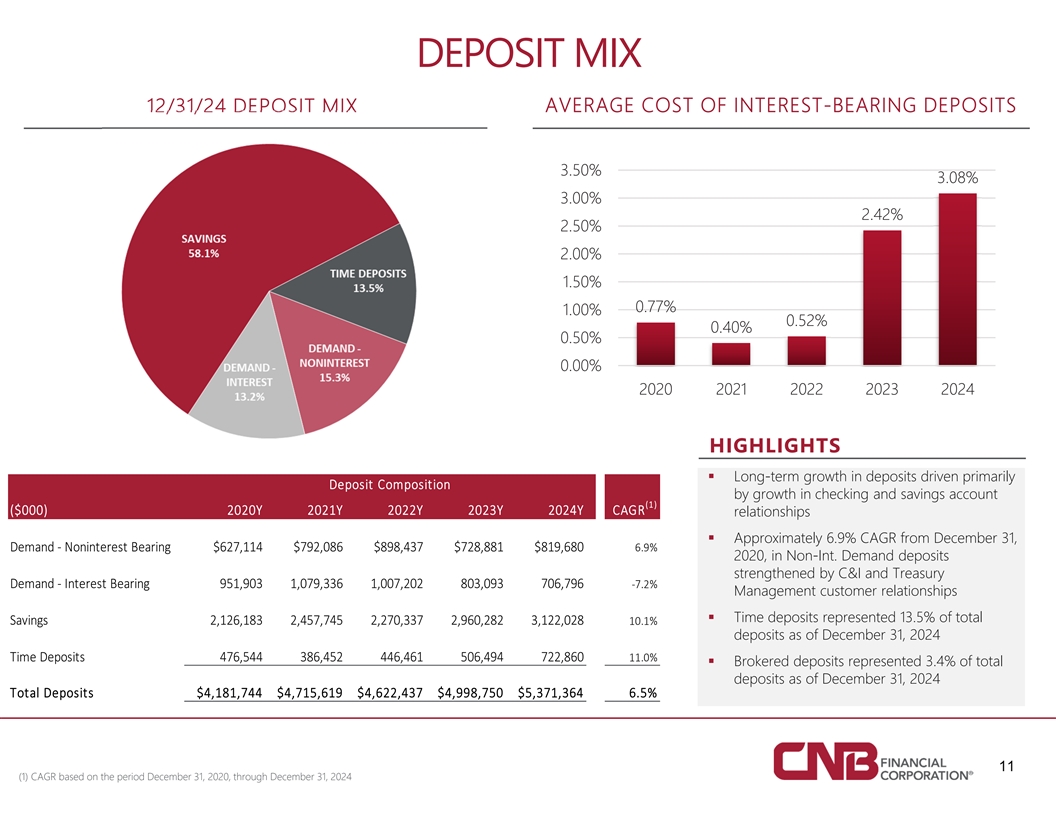
DEPOSIT MIX AVERAGE COST OF INTEREST-BEARING DEPOSITS 12/31/24 DEPOSIT MIX 3.50% 3.08% 3.00% 2.42% 2.50% 2.00% 1.50% 0.77% 1.00% 0.52% 0.40% 0.50% 0.00% 2020 2021 2022 2023 2024 HIGHLIGHTS § Long-term growth in deposits driven primarily Deposit Composition by growth in checking and savings account (1) ($000) 2020Y 2021Y 2022Y 2023Y 2024Y CAGR relationships § Approximately 6.9% CAGR from December 31, Demand ‐ Noninterest Bearing $627,114 $792,086 $898,437 $728,881 $819,680 6.9% 2020, in Non-Int. Demand deposits strengthened by C&I and Treasury Demand ‐ Interest Bearing 951,903 1,079,336 1,007,202 803,093 706,796 ‐7.2% Management customer relationships § Time deposits represented 13.5% of total Savings 2,126,183 2,457,745 2,270,337 2,960,282 3,122,028 10.1% deposits as of December 31, 2024 Time Deposits 476,544 386,452 446,461 506,494 722,860 11.0% § Brokered deposits represented 3.4% of total deposits as of December 31, 2024 Total Deposits $4,181,744 $4,715,619 $4,622,437 $4,998,750 $5,371,3646.5% 11 (1) CAGR based on the period December 31, 2020, through December 31, 2024
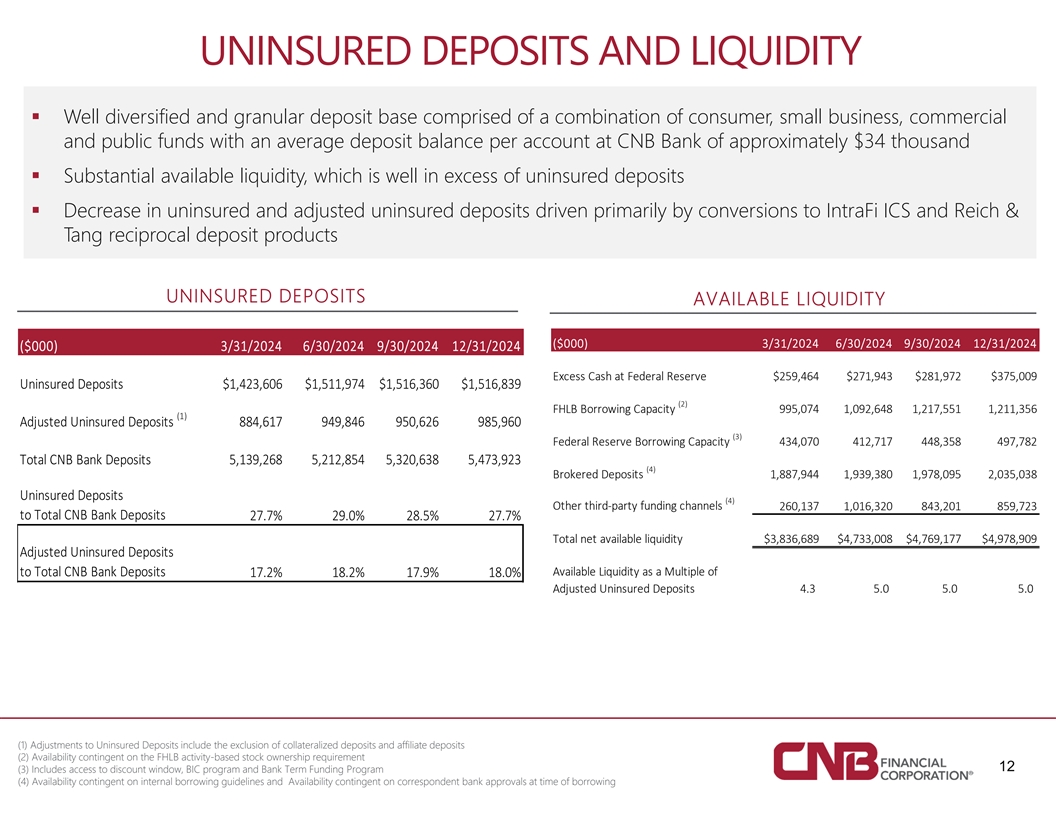
UNINSURED DEPOSITS AND LIQUIDITY § Well diversified and granular deposit base comprised of a combination of consumer, small business, commercial and public funds with an average deposit balance per account at CNB Bank of approximately $34 thousand § Substantial available liquidity, which is well in excess of uninsured deposits § Decrease in uninsured and adjusted uninsured deposits driven primarily by conversions to IntraFi ICS and Reich & Tang reciprocal deposit products UNINSURED DEPOSITS AVAILABLE LIQUIDITY ($000) 3/31/2024 6/30/2024 9/30/2024 12/31/2024 ($000) 3/31/2024 6/30/2024 9/30/2024 12/31/2024 Excess Cash at Federal Reserve $259,464 $271,943 $281,972 $375,009 Uninsured Deposits $1,423,606 $1,511,974 $1,516,360 $1,516,839 (2) FHLB Borrowing Capacity 995,074 1,092,648 1,217,551 1,211,356 (1) Adjusted Uninsured Deposits 884,617 949,846 950,626 985,960 (3) Federal Reserve Borrowing Capacity 434,070 412,717 448,358 497,782 Total CNB Bank Deposits 5,139,268 5,212,854 5,320,638 5,473,923 (4) Brokered Deposits 1,887,944 1,939,380 1,978,095 2,035,038 Uninsured Deposits (4) Other third‐party funding channels 260,137 1,016,320 843,201 859,723 to Total CNB Bank Deposits 27.7% 29.0% 28.5% 27.7% Total net available liquidity $3,836,689 $4,733,008 $4,769,177 $4,978,909 Adjusted Uninsured Deposits to Total CNB Bank Deposits Available Liquidity as a Multiple of 17.2% 18.2% 17.9% 18.0% Adjusted Uninsured Deposits 4.3 5.0 5 .0 5.0 (1) Adjustments to Uninsured Deposits include the exclusion of collateralized deposits and affiliate deposits (2) Availability contingent on the FHLB activity-based stock ownership requirement 12 (3) Includes access to discount window, BIC program and Bank Term Funding Program (4) Availability contingent on internal borrowing guidelines and Availability contingent on correspondent bank approvals at time of borrowing
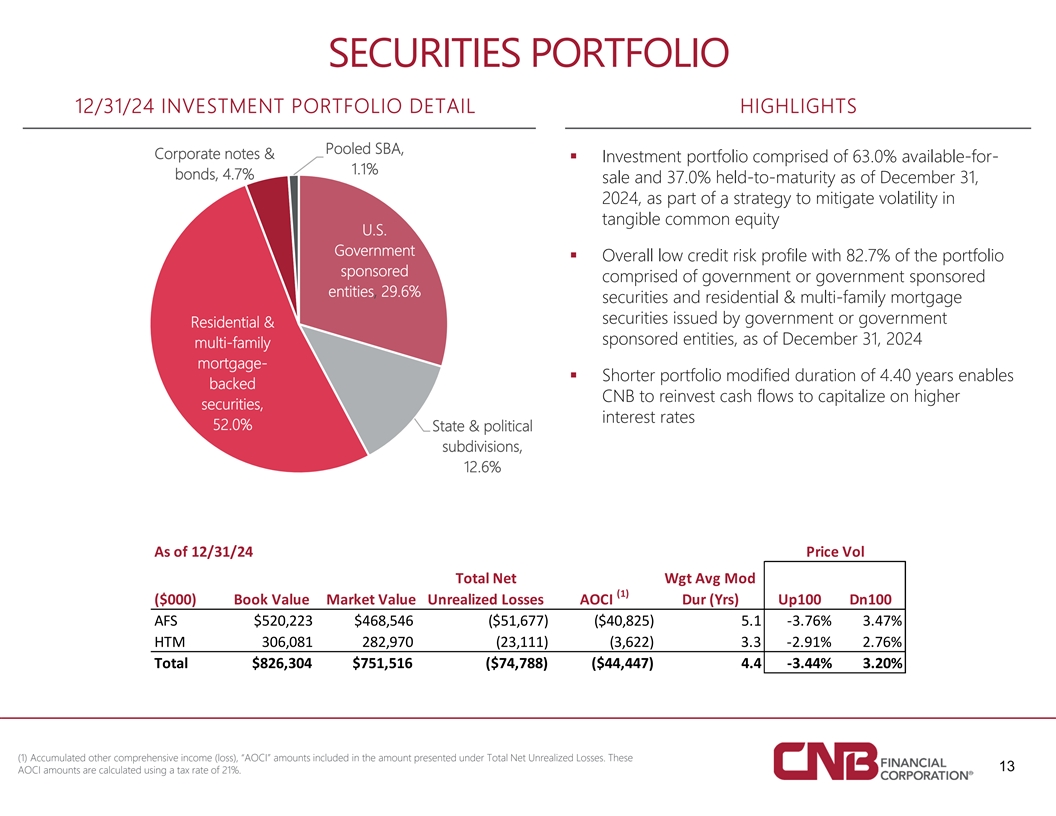
SECURITIES PORTFOLIO 12/31/24 INVESTMENT PORTFOLIO DETAIL HIGHLIGHTS Pooled SBA, Corporate notes & § Investment portfolio comprised of 63.0% available-for- 1.1% bonds, 4.7% sale and 37.0% held-to-maturity as of December 31, 2024, as part of a strategy to mitigate volatility in tangible common equity U.S. Government § Overall low credit risk profile with 82.7% of the portfolio sponsored comprised of government or government sponsored entities, 29.6% securities and residential & multi-family mortgage securities issued by government or government Residential & sponsored entities, as of December 31, 2024 multi-family mortgage- § Shorter portfolio modified duration of 4.40 years enables backed CNB to reinvest cash flows to capitalize on higher securities, interest rates 52.0% State & political subdivisions, 12.6% As of 12/31/24 Price Vol Total Net Wgt Avg Mod (1) ($000) Book Value Market Value Unrealized Losses AOCI Dur (Yrs) Up100 Dn100 AFS $520,223 $468,546 ($51,677) ($40,825) 5.1 ‐3.76% 3.47% HTM 306,081 282,970 (23,111) (3,622) 3.3 ‐2.91% 2.76% Total $826,304 $751,516 ($74,788) ($44,447) 4.4 ‐3.44% 3.20% (1) Accumulated other comprehensive income (loss), “AOCI” amounts included in the amount presented under Total Net Unrealized Losses. These 13 AOCI amounts are calculated using a tax rate of 21%.
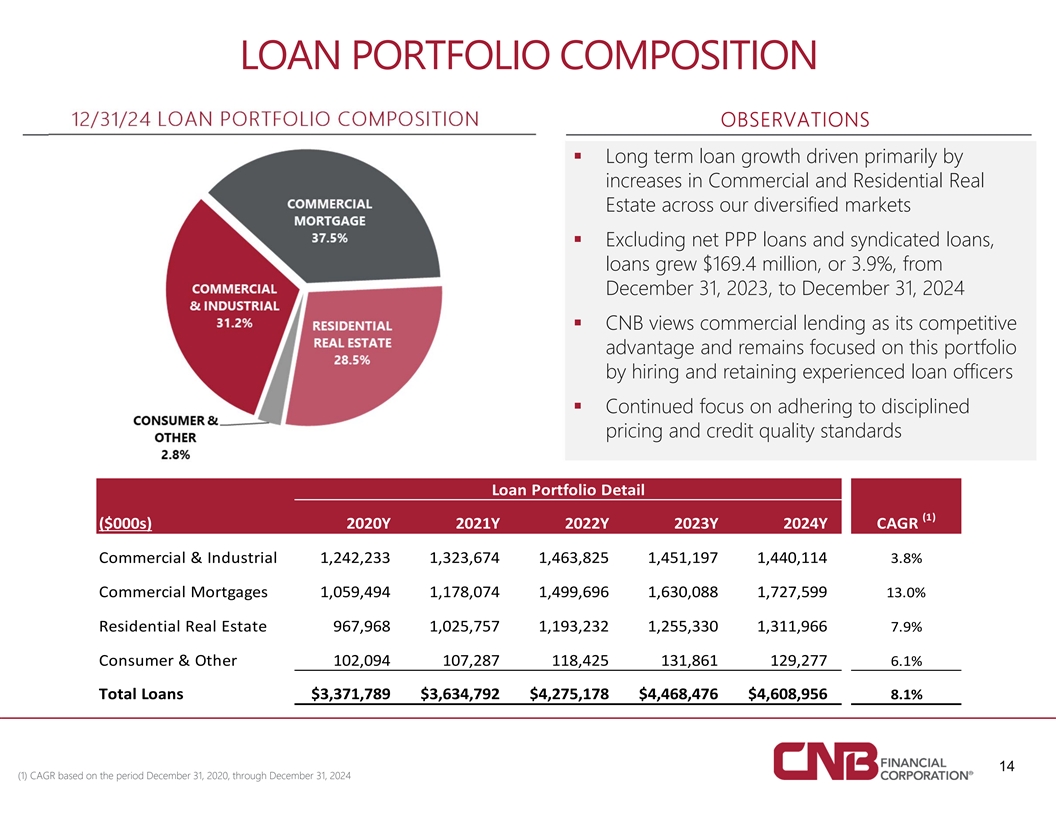
LOAN PORTFOLIO COMPOSITION 12/31/24 LOAN PORTFOLIO COMPOSITION OBSERVATIONS § Long term loan growth driven primarily by increases in Commercial and Residential Real Estate across our diversified markets § Excluding net PPP loans and syndicated loans, loans grew $169.4 million, or 3.9%, from December 31, 2023, to December 31, 2024 § CNB views commercial lending as its competitive advantage and remains focused on this portfolio by hiring and retaining experienced loan officers § Continued focus on adhering to disciplined pricing and credit quality standards Loan Portfolio Detail (1) ($000s) 2020Y 2021Y 2022Y 2023Y 2024Y CAGR Commercial & Industrial 1,242,233 1,323,674 1,463,825 1,451,197 1,440,114 3.8% Commercial Mortgages 1,059,494 1,178,074 1,499,696 1,630,088 1,727,599 13.0% Residential Real Estate 967,968 1,025,757 1,193,232 1,255,330 1,311,966 7.9% Consumer & Other 102,094 107,287 118,425 131,861 129,277 6.1% Total Loans $3,371,789 $3,634,792 $4,275,178 $4,468,476 $4,608,956 8.1% 14 (1) CAGR based on the period December 31, 2020, through December 31, 2024

ADDITIONAL LOAN PORTFOLIO DETAIL § Well diversified Commercial & Industrial (“C&I”) portfolio with no single industry greater than 19% of total C&I portfolio § CNB has proven C&I underwriting practices and strong loan loss history § Commercial Mortgage portfolio is also well diversified with no single segment greater than 26% of the total Commercial Mortgage portfolio, and with the Commercial Office segment representing less than 8% of the total Commercial Mortgage portfolio (1) COMMERCIAL MORTGAGE DETAIL (12/31/24) C&I DETAIL (12/31/24) 15 (1) Does not include construction loans
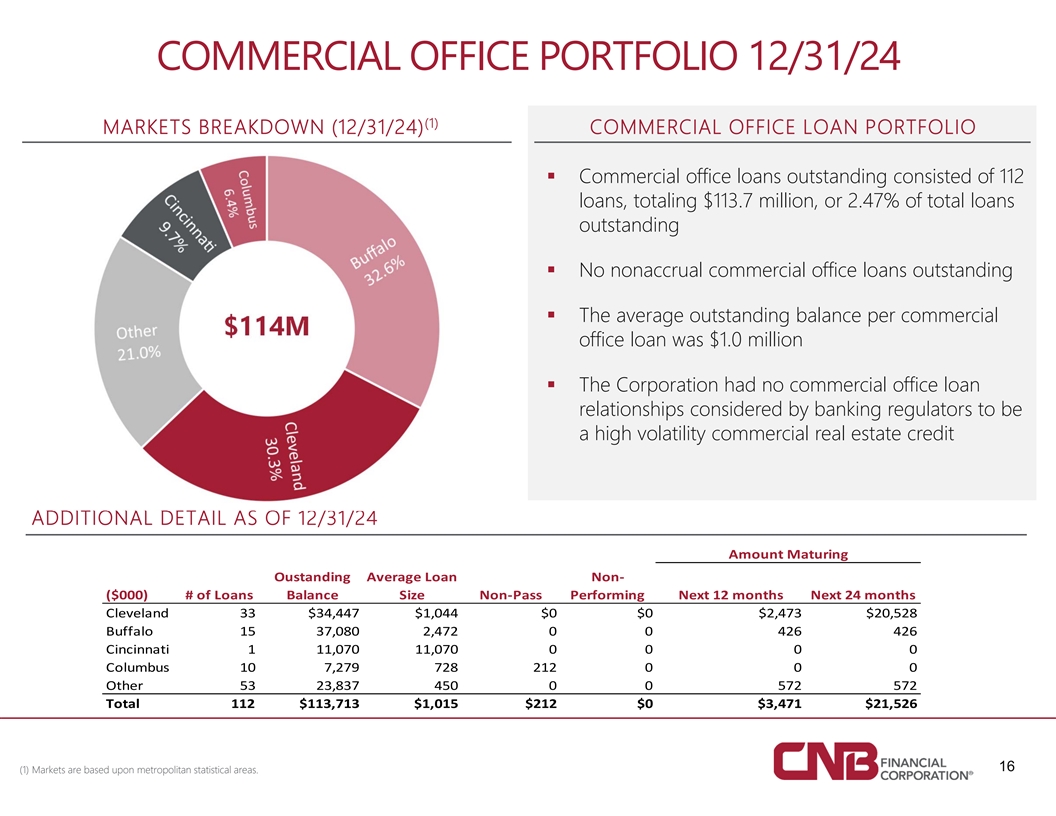
COMMERCIAL OFFICE PORTFOLIO 12/31/24 (1) MARKETS BREAKDOWN (12/31/24) COMMERCIAL OFFICE LOAN PORTFOLIO § Commercial office loans outstanding consisted of 112 loans, totaling $113.7 million, or 2.47% of total loans outstanding § No nonaccrual commercial office loans outstanding § The average outstanding balance per commercial $114M office loan was $1.0 million § The Corporation had no commercial office loan relationships considered by banking regulators to be a high volatility commercial real estate credit ADDITIONAL DETAIL AS OF 12/31/24 Amount Maturing Oustanding Average Loan Non‐ ($000) # of Loans Balance Size Non‐Pass Performing Next 12 months Next 24 months Cleveland 33 $34,447 $1,044 $0 $0 $2,473 $20,528 Buffalo 15 37,080 2,472 0 0 426 426 Cincinnati 1 11,070 11,070 0 0 0 0 Columbus 10 7,279 728 212 0 0 0 Other 53 23,837 450 0 0 572 572 Total 112 $113,713 $1,015 $212 $0 $3,471 $21,526 16 (1) Markets are based upon metropolitan statistical areas.

ADDITIONAL COMMERCIAL MORTGAGE DETAIL (1) (1) (1) LODGING (12/31/24) OFFICE (12/31/24) MULTI-FAMILY (12/31/24) • Consists of 225 loans, totaling $367.6 • Consists of 170 loans, totaling $321.6 • Consists of 112 loans, totaling $113.7 million, or 7.98% of total loans million, or 2.47% of total loans million, or 6.98% of total loans outstanding. outstanding. outstanding. • Nonaccrual multi-family loans totaled • There were no nonaccrual commercial • There were no nonaccrual commercial $20.7 million, or 5.62% of total multi-family lodging loans. office loans. (2) loans outstanding. • The average outstanding balance per loan • The average outstanding balance per loan • The average outstanding balance per loan was $1.0 million. was $1.9 million. was $1.6 million. (1) Markets are based upon metropolitan statistical areas. (2) As discussed in the earnings release issued on January 28, 2025, the increase in nonperforming assets was primarily due to one commercial multifamily relationship totaling 17 $20.4 million with a specific reserve balance of $885 thousand. Management does not believe there is risk of significant additional loss exposure beyond the specific reserves related to this loan relationship.

CONSERVATIVE CREDIT CULTURE 12/31/24 NONACCRUAL LOANS BY TYPE HISTORICAL NPAS/ASSETS & NCOS/LOANS 0.96% 1.00% 0.80% 0.67% 0.55% 0.60% COMMERCIAL 0.43% & INDUSTRIAL 0.38% 0.21% 30.4% 0.40% 0.17% COMMERCIAL REAL ESTATE 0.20% 0.08% 0.08% 49.8% 0.05% 0.17% 0.13% 0.05% 0.04% 0.02% 0.00% CONSUMER 2020 2021 2022 2023 2024 RESIDENTIAL 1.7% MORTGAGE NPAs/ASSETS (EX. TDRs) 18.1% NCOs / AVERAGE LOANS (1) NCOs / AVERAGE LOANS -BANK ONLY HISTORICAL ASSET QUALITY 12/31/2020 12/31/2021 12/31/2022 12/31/2023 13/31/2024 NONACCRUAL LOANS $30,359 $19,420 $20,986 $29,639 $56,323 ACCRUAL LOANS GREATER THAN 89 DAYS 325 168 1,121 55 653 OREO 862 707 1,439 2,111 2,509 (2) NONPERFORMING ASSETS $31,546 $20,295 $23,546 $31,805 $59,485 NONACCRUAL LOANS / LOANS 0.90% 0.53% 0.49% 0.66% 1.22% NPAs / ASSETS 0.67% 0.38% 0.43% 0.55% 0.96% ACL / NONACCRUAL LOANS 113.11% 193.55% 206.98% 154.63% 84.08% (1 ) NCOs-Bank Only excludes Holiday Financial Services (2) As discussed in the earnings release issued on January 28, 2025, the increase in nonperforming assets was primarily due to one commercial multifamily relationship totaling $20.4 million with a specific reserve balance of $885 thousand. Management does not believe there is risk of significant additional loss exposure beyond the specific reserves 18 related to this loan relationship. Note: “NCOs” means Net Charge-Offs. “ACL” means Allowance for Credit Losses.

CREDIT QUALITY (2) NONPERFORMING ASSETS TO TOTAL ASSETS NET CHARGE-OFFS TO LOANS 1.25% 0.50% 0.96% 1.00% 0.40% 0.67% 0.75% 0.30% 0.55% 0.21% 0.43% 0.17% 0.50% 0.20% 0.38% 0.08% 0.08% 0.10% 0.25% 0.05% 0.00% 0.00% 2020 2021 2022 2023 2024 2020 2021 2022 2023 2024 ALLOWANCE FOR CREDIT LOSSES TO NONACCRUAL LOANS 2.5 2.07 1.94 2.0 1.55 1.5 1.13 0.84 1.0 0.5 0.0 2020 2021 2022 2023 2024 (2) As discussed in the earnings release issued on January 28, 2025, the increase in nonperforming assets was primarily due to one commercial multifamily relationship totaling $20.4 million with a specific reserve balance of $885 thousand. Management does not believe there is risk of significant additional loss exposure beyond the specific reserves related to this loan relationship. 19
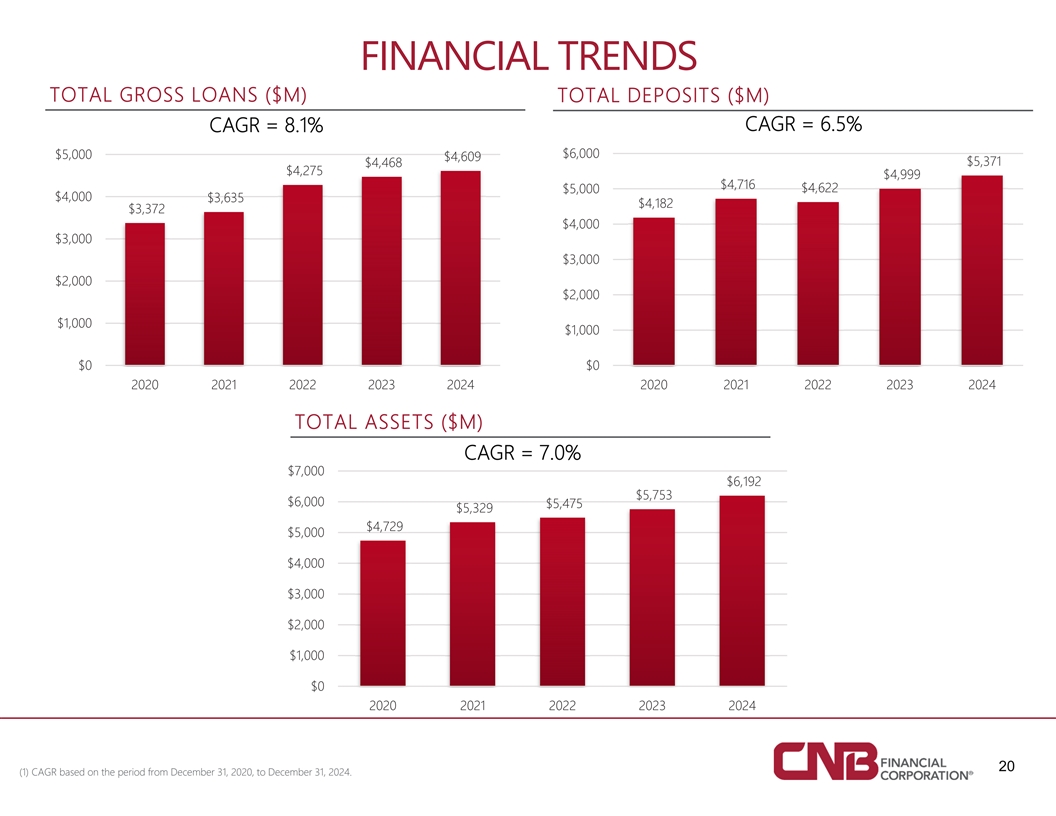
FINANCIAL TRENDS TOTAL GROSS LOANS ($M) TOTAL DEPOSITS ($M) CAGR = 6.5% CAGR = 8.1% $5,000 $6,000 $4,609 $4,468 $5,371 $4,275 $4,999 $4,716 $4,622 $5,000 $4,000 $3,635 $4,182 $3,372 $4,000 $3,000 $3,000 $2,000 $2,000 $1,000 $1,000 $0 $0 2020 2021 2022 2023 2024 2020 2021 2022 2023 2024 TOTAL ASSETS ($M) CAGR = 7.0% $7,000 $6,192 $5,753 $6,000 $5,475 $5,329 $4,729 $5,000 $4,000 $3,000 $2,000 $1,000 $0 2020 2021 2022 2023 2024 20 (1) CAGR based on the period from December 31, 2020, to December 31, 2024.
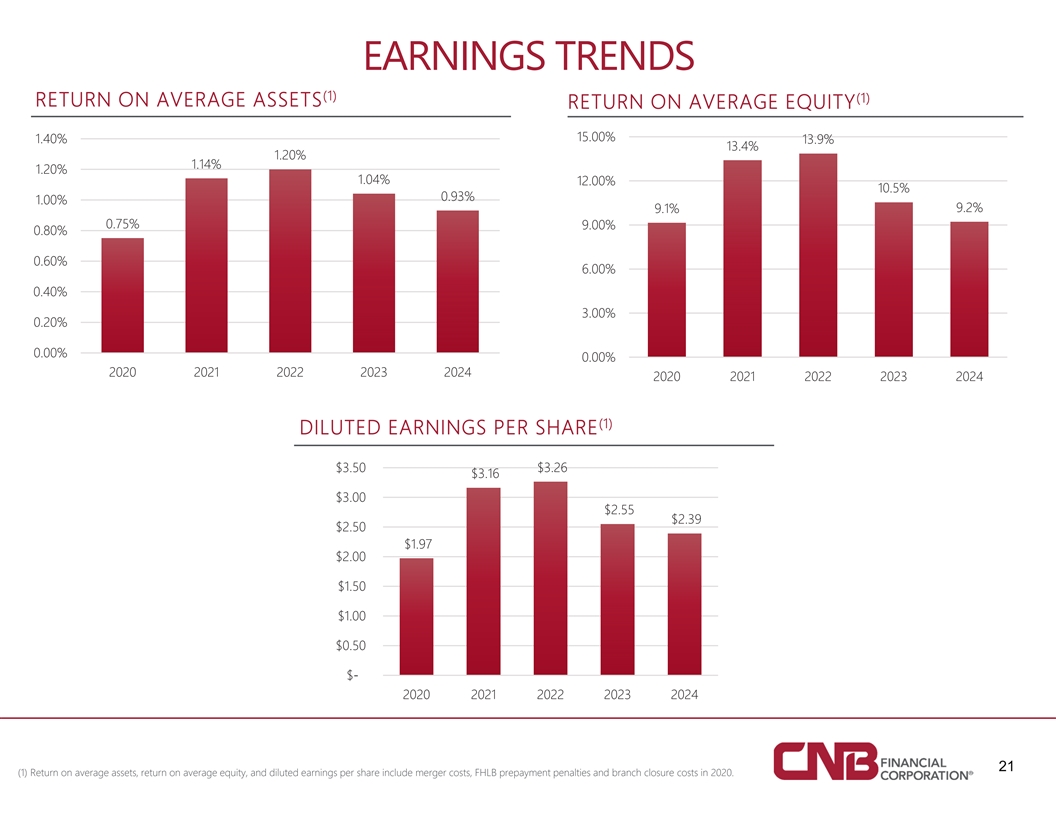
EARNINGS TRENDS (1) (1) RETURN ON AVERAGE ASSETS RETURN ON AVERAGE EQUITY 15.00% 1.40% 13.9% 13.4% 1.20% 1.14% 1.20% 1.04% 12.00% 10.5% 0.93% 1.00% 9.2% 9.1% 0.75% 9.00% 0.80% 0.60% 6.00% 0.40% 3.00% 0.20% 0.00% 0.00% 2020 2021 2022 2023 2024 2020 2021 2022 2023 2024 (1) DILUTED EARNINGS PER SHARE $3.50 $3.26 $3.16 $3.00 $2.55 $2.39 $2.50 $1.97 $2.00 $1.50 $1.00 $0.50 $- 2020 2021 2022 2023 2024 21 (1) Return on average assets, return on average equity, and diluted earnings per share include merger costs, FHLB prepayment penalties and branch closure costs in 2020.

EARNINGS TRENDS (2) (1)(2) NET INTEREST MARGIN EFFICIENCY RATIO Efficiency Ratio Efficiency Ratio - Fully Tax Equiv. NIM NIM Fully Tax Equiv. 80% 3.90% 3.83% 3.82% 3.80% 3.70% 70% 3.63% 3.61% 65.94% 66.20% 65.13% 3.60% 61.32% 65.47% 65.10% 60.26% 3.50% 64.45% 3.41% 60% 3.39% 3.38% 60.87% 3.40% 3.35% 59.76% 3.34% 3.29% 3.30% 50% 3.20% 3.10% 3.00% 40% 2020 2021 2022 2023 2024 2020 2021 2022 2023 2024 (1) Efficiency ratio includes merger costs, FHLB prepayment penalties and branch closure costs in 2020. (2) Net interest margin fully tax equivalent and efficiency ratio fully tax equivalent are non-GAAP financial measures – see Appendix for 22 reconciliations.

APPENDIX
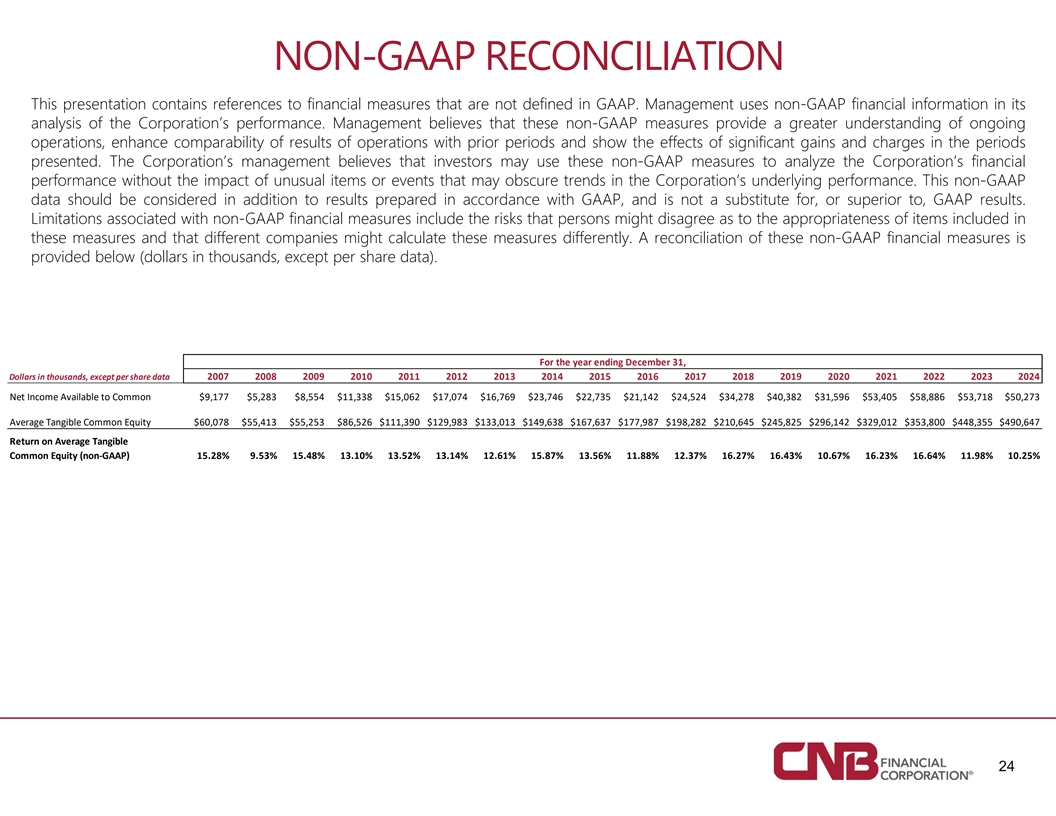
NON-GAAP RECONCILIATION This presentation contains references to financial measures that are not defined in GAAP. Management uses non-GAAP financial information in its analysis of the Corporation’s performance. Management believes that these non-GAAP measures provide a greater understanding of ongoing operations, enhance comparability of results of operations with prior periods and show the effects of significant gains and charges in the periods presented. The Corporation’s management believes that investors may use these non-GAAP measures to analyze the Corporation’s financial performance without the impact of unusual items or events that may obscure trends in the Corporation’s underlying performance. This non-GAAP data should be considered in addition to results prepared in accordance with GAAP, and is not a substitute for, or superior to, GAAP results. Limitations associated with non-GAAP financial measures include the risks that persons might disagree as to the appropriateness of items included in these measures and that different companies might calculate these measures differently. A reconciliation of these non-GAAP financial measures is provided below (dollars in thousands, except per share data). For the year ending December 31, Dollars in thousands, except per share data 2007 2008 2009 2010 2011 2012 2013 2014 2015 2016 2017 2018 2019 2020 2021 2022 2023 2024 Net Income Available to Common $9,177 $5,283 $8,554 $11,338 $15,062 $17,074 $16,769 $23,746 $22,735 $21,142 $24,524 $34,278 $40,382 $31,596 $53,405 $58,886 $53,718 $50,273 Average Tangible Common Equity $60,078 $55,413 $55,253 $86,526 $111,390 $129,983 $133,013 $149,638 $167,637 $177,987 $198,282 $210,645 $245,825 $296,142 $329,012 $353,800 $448,355 $490,647 Return on Average Tangible Common Equity (non‐GAAP) 15.28% 9.53% 15.48% 13.10% 13.52% 13.14% 12.61% 15.87% 13.56% 11.88% 12.37% 16.27% 16.43% 10.67% 16.23% 16.64% 11.98% 10.25% 24
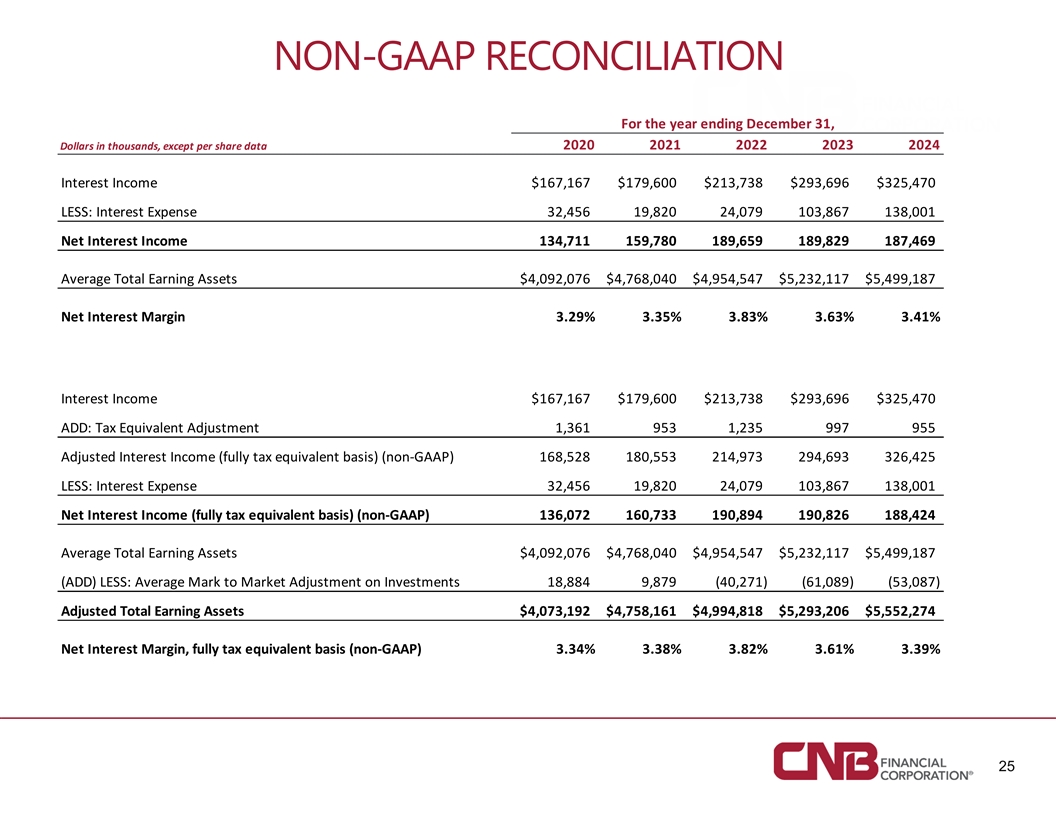
NON-GAAP RECONCILIATION For the year ending December 31, 2020 2021 2022 2023 2024 Dollars in thousands, except per share data Interest Income $167,167 $179,600 $213,738 $293,696 $325,470 LESS: Interest Expense 32,456 19,820 24,079 103,867 138,001 Net Interest Income 134,711 159,780 189,659 189,829 187,469 Average Total Earning Assets $4,092,076 $4,768,040 $4,954,547 $5,232,117 $5,499,187 Net Interest Margin 3.29% 3.35% 3.83% 3.63% 3.41% Interest Income $167,167 $179,600 $213,738 $293,696 $325,470 ADD: Tax Equivalent Adjustment 1,361 953 1,235 997 955 Adjusted Interest Income (fully tax equivalent basis) (non‐GAAP) 168,528 180,553 214,973 294,693 326,425 LESS: Interest Expense 32,456 19,820 24,079 103,867 138,001 Net Interest Income (fully tax equivalent basis) (non‐GAAP) 136,072 160,733 190,894 190,826 188,424 Average Total Earning Assets $4,092,076 $4,768,040 $4,954,547 $5,232,117 $5,499,187 (ADD) LESS: Average Mark to Market Adjustment on Investments 18,884 9,879 ( 40,271) ( 61,089) (53,087) Adjusted Total Earning Assets $ 4,073,192 $ 4,758,161 $ 4,994,818 $ 5,293,206 $ 5,552,274 Net Interest Margin, fully tax equivalent basis (non‐GAAP) 3.34% 3.38% 3.82% 3.61% 3.39% 25

NON-GAAP RECONCILIATION For the year ending December 31, Dollars in thousands, except per share data 2020 2021 2022 2023 2024 Calculation of efficiency ratio: Non‐interest expense $107,326 $116,433 $137,622 $145,342 $150,002 Non‐interest income 28,059 33,434 34,766 33,335 39,114 Net interest income 134,711 159,780 189,659 189,829 187,469 Total revenue 162,770 193,214 224,425 223,164 226,583 Efficiency ratio 65.94% 60.26% 61.32% 65.13% 66.20% Calculation of efficiency ratio (fully tax equivalent basis) (non‐GAAP): Non‐Interest Expense $107,326 $116,433 $137,622 $145,342 $150,002 LESS: Core Deposit Intangible Amortization 206 107 96 84 73 Adjusted Non‐Interest Expense $107,120 $116,326 $137,526 $145,258 $149,929 Non‐Interest Income 28,059 33,434 34,766 33,335 39,114 Net Interest Income 134,711 159,780 189,659 189,829 187,469 LESS: Tax Exempt Investment and Loan Income, net of TEFRA (non‐GAAP) 5,703 4,973 5,011 5,425 5,635 ADD: Tax Exempt Investment and Loan Income (non‐GAAP) (tax‐equivalent) 7,490 6,416 6,509 7,635 8,068 Adjusted Net Interest Income (non‐GAAP) 136,498 161,223 191,157 192,039 189,902 Adjusted Net Revenue (non‐GAAP) (tax‐equivalent) $ 164,557 $ 194,657 $ 225,923 $ 225,374 $ 229,016 Efficiency Ratio (fully tax‐equivalent) (non‐GAAP) 65.10% 59.76% 60.87% 64.45% 65.47% 26
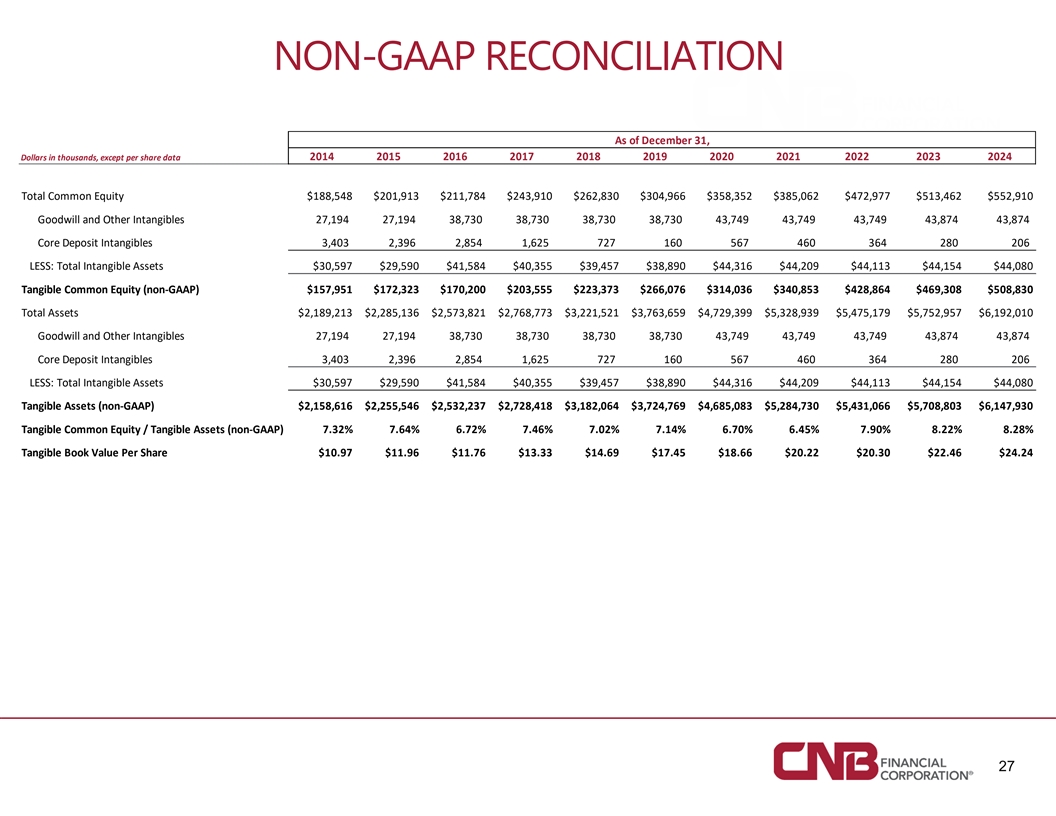
NON-GAAP RECONCILIATION As of December 31, 2014 2015 2016 2017 2018 2019 2020 2021 2022 2023 2024 Dollars in thousands, except per share data Total Common Equity $188,548 $201,913 $211,784 $243,910 $262,830 $304,966 $358,352 $385,062 $472,977 $513,462 $552,910 Goodwill and Other Intangibles 27,194 27,194 38,730 38,730 3 8,730 38,730 43,749 43,749 43,749 43,874 43,874 Core Deposit Intangibles 3,403 2,396 2,854 1,625 727 160 567 460 364 280 206 LESS: Total Intangible Assets $30,597 $29,590 $41,584 $40,355 $39,457 $38,890 $44,316 $44,209 $44,113 $44,154 $44,080 Tangible Common Equity (non‐GAAP) $157,951 $172,323 $170,200 $203,555 $223,373 $266,076 $314,036 $340,853 $428,864 $469,308 $508,830 Total Assets $2,189,213 $2,285,136 $2,573,821 $2,768,773 $3,221,521 $3,763,659 $4,729,399 $5,328,939 $5,475,179 $5,752,957 $6,192,010 Goodwill and Other Intangibles 27,194 27,194 38,730 38,730 3 8,730 38,730 43,749 43,749 43,749 43,874 43,874 Core Deposit Intangibles 3,403 2,396 2,854 1,625 727 160 567 460 364 280 206 LESS: Total Intangible Assets $30,597 $29,590 $41,584 $40,355 $39,457 $38,890 $44,316 $44,209 $44,113 $44,154 $44,080 Tangible Assets (non‐GAAP) $2,158,616 $2,255,546 $2,532,237 $2,728,418 $3,182,064 $3,724,769 $4,685,083 $5,284,730 $5,431,066 $5,708,803 $6,147,930 Tangible Common Equity / Tangible Assets (non‐GAAP) 7.32% 7.64% 6.72% 7.46% 7.02% 7.14% 6.70% 6.45% 7.90% 8.22% 8.28% Tangible Book Value Per Share $10.97 $11.96 $11.76 $13.33 $14.69 $17.45 $18.66 $20.22 $20.30 $22.46 $24.24 27