UNITED STATES
SECURITIES AND EXCHANGE COMMISSION
Washington, DC 20549
FORM N-CSR
CERTIFIED SHAREHOLDER REPORT OF REGISTERED MANANGEMENT INVESTMENT COMPANY
Investment Company Act file number 811-03931
CLIPPER FUND, INC.
(Exact name of registrant as specified in charter)
2949 East Elvira Road, Suite 101
Tucson, AZ 85756
(Address of principal executive offices)
Thomas D. Tays
Davis Selected Advisers, L.P.
2949 East Elvira Road, Suite 101
Tucson, AZ 85756
(Name and address of agent for service)
Registrant’s telephone number, including area code: 520-806-7600
Date of fiscal year end: December 31, 2008
Date of reporting period: June 30, 2008
____________________
ITEM 1. REPORT TO STOCKHOLDERS
Table of Contents
Shareholder Letter | 2 |
| |
Management’s Discussion and Analysis | 15 |
| |
Fund Overview | 17 |
| |
Expense Example | 18 |
| |
Schedule of Investments | 19 |
| |
Statement of Assets and Liabilities | 22 |
| |
Statement of Operations | 23 |
| |
Statements of Changes in Net Assets | 24 |
| |
Notes to Financial Statements | 25 |
| |
Financial Highlights | 30 |
| |
Fund Information | 31 |
| |
Director Approval of Advisory Agreements | 32 |
| |
Directors and Officers | 34 |
CLIPPER FUNDSM
2949 East Elvira Road, Suite 101
Cautionary Statement
Davis Advisors is committed to communicating with our investment partners as candidly as possible because we believe our investors benefit from understanding our investment philosophy and approach. Our views and opinions regarding the investment prospects of our portfolio holdings include “forward looking statements” which may or may not be accurate over the long term. While we believe we have a reasonable basis for our appraisals and we have confidence in our opinions, actual results may differ materially from those we anticipate. These opinions are current as of the date of this report but are subject to change. The information provided in this report should not be considered a recommendation to buy, sell, or hold any particular security.
You can identify forward looking statements by words like “believe,” “expect,” “anticipate,” or similar expressions when discussing prospects for particular portfolio holdings and/or of the Fund. We cannot assure future results and achievements. You should not place undue reliance on forward looking statements, which speak only as of the date of this report. We disclaim any obligation to update or alter any forward looking statements, whether as a result of new information, future events, or otherwise. This material must be preceded or accompanied by a Prospectus. Please read the Prospectus carefully for a discussion of investment objectives, risks, fees, and expenses. Current performance may be lower or higher than the performance quoted herein. You may obtain a current copy of the prospectus or more current performance information by calling investor services at 1-800-432-2504, or on Clipper Fund’s website (www.clipperfund.com).
CLIPPER FUNDSM
2949 East Elvira Road, Suite 101
Results and Reflections
The table below summarizes the returns for Clipper Fund compared with the S&P 500® Index, against which my partner Ken Charles Feinberg, our colleagues, and I judge ourselves.
Annualized Total Returns as of June 30, 2008 |
| YTD1 | 1 Year | 3 Years | 5 Years | 10 Years |
Clipper Fund | (21.54)% | (23.39)% | (2.74)% | 1.59% | 5.85% |
S&P 500® Index | (11.91)% | (13.12)% | 4.40% | 7.58% | 2.88% |
The performance presented represents past performance and is not a guarantee of future results. Total return assumes reinvestment of dividends and capital gain distributions. Investment return and principal value will vary so that, when redeemed, an investor’s shares may be worth more or less than their original cost. The total annual operating expense ratio for Clipper Fund shares as of the most recent prospectus was 0.69%. The total annual operating expense ratio may vary in future years. Current performance may be higher or lower than the performance data quoted. For most recent month-end returns, visit clipperfund.com or call 800-432-2504. Clipper Fund was managed from inception, February 29, 1984, until January 1, 2006 by another Adviser. Davis Selected Advisers, L.P. took over management of the Fund on January 1, 2006.
With the exception of the Fund’s respectable 10 year return, the results shown in the table above are poor both on a relative and absolute basis.2 As our firm only assumed management on January 1, 2006, we do not deserve credit for the good 10-year results and will confine our specific comments to the shorter term for which we bear more responsibility. Before doing so, however, it is worth noting that the combination of weak short-term results with strong long-term results presented in this table is far more common than might be expected. As the chart on the next page shows, of all of the managers in the top quartile for the last 10 years, 98% of them underperformed for at least three years during that 10. More dramatically, almost half fell into the bottom 10% of performance relative to their peers for a three year stretch.
_________________________
1 Returns for periods less than one year are not annualized.
2 Past performance is not a guarantee of future results.
2
Not a part of Semi-Annual Report to Fund shareholders
CLIPPER FUNDSM
2949 East Elvira Road, Suite 101
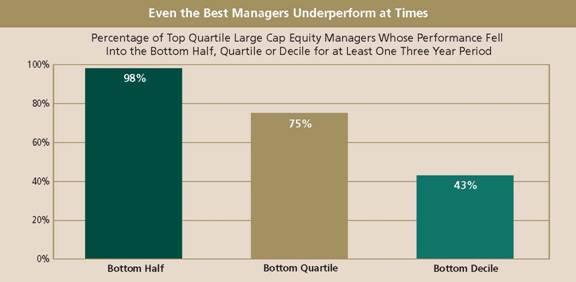
Source: Davis Advisors. 160 managers from eVestment Alliance’s large cap universe whose 10 year average annualized performance ranked in the top quartile from January 1, 1998–December 31, 2007. Past performance is not a guarantee of future results.
Perhaps more important, the periods of underperformance that successful investors will go through can be truly extreme. Consider the following vivid examples. Bill Ruane launched the Sequoia Fund in 1970 and went on to generate one of the best long-term investment records in mutual fund history. After the fund’s first four years, however, Sequoia trailed the market by a shocking 40%, posting a cumulative loss of 1% versus a gain of 39% for the S&P 500® Index.
Another manager that Ken and I have long admired posted similarly terrible results over an even longer period of time. In fact, in one particularly bad six year stretch, he lagged the market by more than 35%. Specifically, during this period, this manager’s fund declined more than 13% cumulatively while the market advanced 22%.3 Surely a portfolio manager whose fund trailed the market after six years by almost 35% could not have much of a future. But he did have a bright future. He experienced this awful stretch from 1970 to 1975 when he was managing the Davis New York Venture Fund. Yet even after this awful period the Fund more than made up the lost ground over the next four years, ending the decade ahead of the market and going on to generate one of the best long-term records in the industry.3 The reason this lesson hits particularly close to home is that this manager was our boss, and my father, Shelby Davis.
The average annual total returns for Davis New York Venture Fund Class A shares as of June 30, 2008, including a maximum 4.75% sales charge, are: 1 year, -17.97%; 5 years, 8.33%; and 10 years, 5.11%. The
_________________________
3 Class A Shares, not including a sales charge. The market is represented by S&P 500® Index. Past performance is not a guarantee of future results.
3
Not a part of Semi-Annual Report to Fund shareholders
CLIPPER FUNDSM
2949 East Elvira Road, Suite 101
performance presented represents past performance and is not a guarantee of future results. Total return assumes reinvestment of dividends and capital gain distributions. Investment return and principal value will vary so that, when redeemed, an investor’s shares may be worth more or less than their original cost. The total annual operating expense ratio for Class A shares as of the most recent prospectus was 0.85%. The total annual operating expense ratio may vary in future years. Returns and expenses for other classes of shares will vary. Current performance may be higher or lower than the performance quoted. For most recent month-end performance, visit davisfunds.com or call 800-279-0279.
Turning from these general observations about long-term results to more specific comments about the shorter term, it is worth focusing on Clipper’s five year returns, which are not satisfactory. As we mentioned in our last commentary, this five year record is actually a combination of two and a half years of our predecessor’s management and two and a half years of our management. During the two and a half years before we assumed management, our predecessors, whose long-term results were outstanding, went through an uncharacteristically bad patch, lagging the market by almost 5% per year. During this same period, the results of Selected American Shares (another mutual fund that Ken and I have run for more than a decade that is more diversified and thus not directly comparable to Clipper) outperformed the market by about 3% per year and Clipper by more than 8% per year.4 Unfortunately, just at the time that we were entrusted with Clipper’s management, we entered a period of relatively weak results and have lagged the market by almost 7% per year since then.5 We give this explanation not to make excuses but simply to highlight that had either our predecessor or we managed Clipper for the entire five year period, the results would likely have been somewhat better than they were.5 Two and a half years from now, the credit or blame for Clipper’s five year results will rest solely with us. We are doing our best to see that these results will be satisfactory.
The average annual total returns for Selected American Shares Class S as of June 30, 2008 are: 1 year, -13.22%; 5 years, 9.11%; and 10 years, 5.71%. The performance presented represents past performance and is not a guarantee of future results. Total return assumes reinvestment of dividends and capital gain distributions. Investment return and principal value will vary so that, when redeemed, an investor’s shares may be worth more or less than their original cost. The total annual operating expense ratio for Class S shares as of the most recent prospectus was 0.90%. The total annual operating expense ratio may vary in future years. Returns and expenses for other classes of shares will vary. Current performance may be higher or lower than the performance quoted. For most recent month-end returns, visit selectedfunds.com or call 800-243-1575.
Investment Environment
We are now more than eight years into one of the worst periods for stock market returns since the Great Depression.6 If you began investing in the market at the start of this decade, your total return through the end of July is essentially zero,6 While Clipper Fund fared significantly better on a relative basis, earning about 5% per year during this time,7 such a return is still not satisfactory on an absolute basis.
_________________________
4 Class S shares. Returns are from 07/01/2003 through 12/31/05. Past performance is not a guarantee of future results. While Selected American Shares and Clipper Fund are managed using the same Davis Investment Discipline the investment strategy will differ. As a result it is likely that their performance will vary.
5 Past performance is not a guarantee of future results.
6 Based on total returns of the S&P 500® Index.
7 Returns are from 1/1/00 through 7/31/08. Past performance is not a guarantee of future results.
4
Not a part of Semi-Annual Report to Fund shareholders
CLIPPER FUNDSM
2949 East Elvira Road, Suite 101
Such long periods of poor returns can be very costly not just because of the money that has been lost but also because they often drive investors out of the market at exactly the wrong time. To understand why this behavior is costly, we must go back to the nature of investing.
It is often said that investing is simple but not easy. The goal is to buy low and sell high. Every year new books are published that promise to teach investors how to achieve this goal, usually without much success. Rather than searching for a formula to achieve this goal, an alternative method is to invert the problem. This contrarian approach is championed by one of our role models, Charles Munger, vice chairman of Berkshire Hathaway. According to Charlie, “It is in the nature of things that many hard problems are best solved when they are addressed backward.” Turning to investing, one way to make progress toward the goal of buying low and selling high is to try to understand why investors so often do the opposite by buying when prices are high and selling when they are low.
The answer seems to lie more in the field of psychology than economics. After all, in most economic activities, people buy more when prices are lowered and less when prices are raised. For example, retailers often announce lower prices in the form of a sale as a way of getting more customers to come into their stores. With stocks, however, the opposite is true. As prices rise, people tend to invest more. When prices fall, they want out. The chart below demonstrates this by overlaying mutual fund returns with fund inflows and outflows over the last decade. As you can see, money poured in after periods of good returns when prices were high, with inflows reaching a record level just before the crash in 2000. Then, as prices came down, money flows slowed dramatically as fearful investors became more cautious close to the bottom in 2002 just before the market’s dramatic rise in 2003. It is worth noting that over the past year, Clipper has experienced net outflows of $790.4 million or 29.5% of average net assets for the period July 1, 2007 through June 30, 2008.
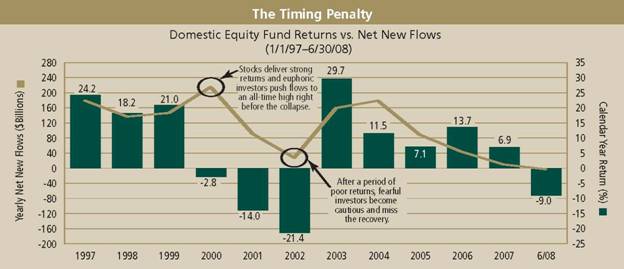
Source: Morningstar and Strategic Research Institution as of 6/30/08. Past performance is not a guarantee of future results.
5
Not a part of Semi-Annual Report to Fund shareholders
CLIPPER FUNDSM
2949 East Elvira Road, Suite 101
The cost of this self-inflicted wound is enormous. Investors consistently invest more after prices go up and get out after prices fall. The result is that over the last 20 years the average stock fund returned almost 12% but the average stock fund investor earned only 4.5%.8
Turning back to Charlie’s advice above, one way for investors to do better is to identify the forces that lead to this costly behavior and then try to avoid them. Chief among these forces is the media. When prices rise, the media rarely warns of a bubble and when prices fall they rarely declare a bargain. On the contrary, the media tends to amplify whatever is happening. For example, at the peak of the Internet bubble, the media was full of stories about the fortunes made by investing in Internet stocks. Similarly as real estate prices neared their peak, a Time Magazine cover in June 2005 showed a man hugging his house next to the headline “Home $weet Home.”
The media also amplifies on the way down. For example, in August 1979 after a decade long bear market with the Dow Jones Industrial Average around 875, a Business Week cover declared, “The Death of Equities.” In March 1999, with oil around $10 per barrel, about one-twelfth of today’s price, a cover from The Economist announced that the world was “Drowning in Oil.” For what it is worth, with home prices and stocks steeply lower than a year ago, today’s headlines are now full of words like “crisis,” “meltdown,” “recession,” and “collapse.” Clearly, if investors listen to the media headlines, they will be more likely to buy high and sell low.
A second and related force is the fact that investors spend a great deal of time reacting to predictions about such things as interest rates, the market and the economy, despite the fact that such macroeconomic factors have shown themselves to be stubbornly unpredictable. As a great example, for almost 25 years Bill Miller and his team at Legg Mason have kept track of the leading economists’ semiannual prediction for the level of interest rates six months ahead. Over those 25 years, the economists were wrong in predicting what the level of interest rates would be six months from now 95% of the time. They even got the direction wrong 66% of the time.9
Unfortunately, the wish to predict the unpredictable is incredibly powerful, as evidenced by the number of psychics and fortune tellers listed in any phonebook. But wishing does not make it so. No less an oracle than former Federal Reserve Chairman Alan Greenspan recently concluded in a refreshingly candid interview, “If I could figure out a way to determine whether or not people are more fearful or changing to more euphoric...I could forecast the economy better than any way I know. The trouble is that we can’t figure that out. I’ve been in the forecasting business for 50 years...I’m no better than I ever was, and nobody else is.”
Nevertheless, in every cycle, some forecasters who got it right in recent years are lionized. People hang on their every word and react to their predictions, making these predictions self-fulfilling for a time. Despite this temporary notoriety, however, no market or economic forecaster that we can think of has proven accurate for more than a couple of years.
Because the media and forecasters tend to be more positive when prices are high and more negative when prices are low, they push investors in and out of the market at the wrong time. As we go through a bear market, the desire of investors to sell after prices have fallen becomes intense. Each day the newspaper outlines reasons why the outlook is bleak. Although investors might know in their heads that equities should produce satisfactory returns over the
_________________________
8 Source: Quantitative Analysis of Investor Behavior by Dalbar, Inc. (July 2008) and Lipper. Past performance is not a guarantee of future results. Please see endnotes for important Dalbar disclosure.
9 Source: Legg Mason and the Wall Street Journal Survey of Economists. December 1982 – June 2008.
6
Not a part of Semi-Annual Report to Fund shareholders
CLIPPER FUNDSM
2949 East Elvira Road, Suite 101
long term, particularly if purchased after prolonged periods of poor performance, in their stomachs they want out. As the earlier chart shows, in this battle between head and stomach, the stomach often wins out. As investors rush for the exit, prices fall, creating bargains for those who can keep their head and resist going with their gut. While avoiding the timing penalty does not mean that you will achieve the goal of buying low and selling high, at least it ensures that you will avoid the opposite.
Portfolio Review10
Although Clipper Fund’s returns have been disappointing since we began managing the Portfolio, we believe that the companies that make up the Portfolio represent good value and we have continued to invest our own money in Clipper Fund. Nevertheless, given all of the factors described above, it should come as no surprise that Clipper shareholders continue to redeem. While there is no doubt that price and value can diverge for long periods, over time they should converge.
As is consistent with Clipper’s past, the Portfolio is eclectic, opportunistic and concentrated. By eclectic, we mean that the Portfolio defies any simple categorization. We hold both small and large capitalization stocks. We own domestic companies as well as foreign ones.11 And we invest in businesses that are growing quickly and others that are more mature. As a result of this eclecticism, the Fund is not optimized for any one environment. In times when the economy and the market are growing quickly, some of our holdings will seem overly defensive. And clearly in times such as we are experiencing now, many companies do not seem nearly defensive enough. My father Shelby Davis once described this approach using a sailing metaphor: To sail across the ocean, you must balance making progress in fair weather with the ability to withstand the inevitable storms. Those who think only of the storms will never leave the shore. Those who think only of fair weather will never reach the other side. Over time, it is our belief that this somewhat eclectic or all-weather approach will produce satisfactory results.
Clipper can also be opportunistic given its relatively small size. Unlike larger funds, Clipper is able to hold meaningful positions in small or illiquid companies. For example, we own shares in Oaktree Capital Group, a well-run investment firm. Although the market capitalization of the company is approximately $4 billion, only about $600 million worth of the shares are available to outside investors, with the rest held by management. Larger funds are simply not able to buy a meaningful position in such a company.
Finally, as always, Clipper is fairly concentrated, holding just 23 companies with our top 10 making up almost 70% of the Fund’s assets.12
_________________________
10 Individual securities are discussed in this piece. While we believe we have a reasonable basis for our appraisals and we have confidence in our opinions, actual results may differ materially from those we anticipate. The return of a security to a portfolio will vary based on weighting and timing of purchase. This is not a recommendation to buy or sell any specific security. Past performance is not a guarantee of future results.
11 Companies operating, incorporated, or principally traded in foreign countries may have more fluctuation as foreign economies may not be as strong or diversified, foreign political systems may not be as stable and foreign financial reporting standards may not be as rigorous as they are in the United States.
12 The Fund may be subject to greater volatility and risk, as the Fund’s investment performance, both good and bad, is expected to reflect the economic performance of the few companies on which the Fund focuses. As of 7/31/08.
7
Not a part of Semi-Annual Report to Fund shareholders
CLIPPER FUNDSM
2949 East Elvira Road, Suite 101
Mistakes and Lessons
Before turning to our mistakes, it is worth remembering that we do not define a mistake as a holding whose stock price trades below what we paid for it but rather one for which our assessment of the company’s value is lower than it was at the time of purchase. For example, although Microsoft’s shares currently trade well above their cost (particularly taking into account the dividends the company has paid), events that occurred during the last six months have led us to lower our assessment of fair value. Specifically, by bidding roughly $45 billion for Yahoo, Microsoft has made it clear that it views Google as a meaningful threat to some aspects of its software business. While the business that Google dominates, paid search, remains a relatively small part of Microsoft’s revenue, management is concerned that Google will use its strength in this niche to make inroads into other more valuable Microsoft franchises, including Windows and Office. As a result, Microsoft is willing to spend enormous amounts to counter this threat. Such spending lowers our assessment of Microsoft’s fair value, though this assessment remains well above today’s price.
Similarly, while we have a profit in our holding of ConocoPhillips, we failed to anticipate some relatively poor capital allocation decisions made by management. Before looking at the specifics, it is worth revisiting our rationale for holding energy companies. For many years now, major producers in the oil and gas industry have struggled to find new resources to offset the oil and gas they produce each year. Until recently, this had not been a problem because energy demand in developed economies had only increased at a very slow rate. However, as developing economies like China and India have become larger and larger, their thirst for energy has increased dramatically. This surging demand and limited supply have sent prices higher. These higher prices benefit all energy companies (at least for a time), but they are a particular boon to those companies that are able to economically grow reserves and production on a per share basis as this growth compounds on the rising prices. While some companies have succeeded in growing in this manner, ConocoPhillips unfortunately has struggled and instead turned to acquisitions. Although these acquisitions have generated an adequate return because of the unexpectedly steep rise in energy prices, they were very costly in comparison to ConocoPhillips buying in its own shares. The result of issuing shares at a discount to buy other companies at a premium may explain why ConocoPhillips’ stock price has significantly trailed many other energy companies over the last five years. Importantly, ConocoPhillips’ CEO Jim Mulva commented recently that he does not foresee any more large transactions and instead is dedicated to growing the company’s reserves and production per share by repurchasing shares. As the shares currently trade at a more than 40% discount to peers, this is a tremendous and low-risk way to grow shareholder value and should lead to much better relative returns in the years ahead.
While mistakes such as those described above deserve mention, they are a high-class problem in comparison to the far more significant mistakes we have made in our holdings in the financial industry. In our last commentary, we provided a detailed overview of the mortgage crisis that we still consider relevant. To read this commentary, please visit our Shareholder Reports section at www.clipperfund.com.
In addition, we recently came across another interesting description penned by Warren Buffett. In it he focuses on the woes of the banks, although the words equally apply to other financial institutions. He writes that in the last year, there was “a chaotic market in bank stocks. The disarray was appropriate: Month by month the foolish...decisions of once well-regarded banks were put on public display. As one huge loss after another was unveiled - often on the heels of managerial assurances that all was well - investors understandably concluded that no bank's numbers were to be trusted.”
8
Not a part of Semi-Annual Report to Fund shareholders
CLIPPER FUNDSM
2949 East Elvira Road, Suite 101
Two things are particularly interesting about Buffett’s description. First, he wrote it more than 17 years ago in the 1990 Berkshire Hathaway annual report in the midst of the last major banking crisis. Second, at the time of this “chaotic market,” Berkshire Hathaway was acquiring 10% of Wells Fargo. In Buffett’s words, “Our purchases of Wells Fargo...were helped by a chaotic market in bank stocks...Aided by [investors’] flight from bank stocks, we purchased our 10% interest in Wells Fargo... [whose stock had fallen] almost 50%.” This is a useful reminder that banking crises are nothing new and that they often create significant investment opportunities.
Since our last commentary market prices for financial companies have continued to fall steeply and almost all shares purchased since then now trade well below what we paid for them. While it is always disappointing for a company to trade below what we paid, it is inevitable. As the old saying goes, only liars buy at the bottom and sell at the top. In some cases such as American Express, the falling share prices have resulted from reduced earnings as credit costs ratchet up. Such falling earnings are a normal part of the credit cycle and do not lead us to conclude that such decisions were mistakes.
But others were. As we said above, what defines a mistake is not a change in the quoted price but rather a significant and permanent deterioration in the value of the underlying business. Also, in looking at mistakes, we must take into account the position size as well as the change in value. A 2% holding whose value declines 80% is less costly (though more embarrassing) than a 6% position whose value declines 30%. Unfortunately, we have examples of both. In financial companies, the cause of the largest deterioration in value was not temporarily falling earnings, but rather permanent destruction of shareholders’ equity and dilution.
Our most dramatic but not most costly mistake was our investment in the financial guarantor Ambac. Although we sold the shares at an enormous loss, the relatively modest size of our initial investment (about 1.1% of assets) made it less costly than some of our other mistakes detailed below. However, the extreme price decline makes it deserving of explanation.
At the time we made our investment, it was already apparent that Ambac had significant exposure resulting from insurance it sold on certain real estate related securities called collateralized debt obligations (CDOs). Counterbalancing these risks was the attractiveness of Ambac’s core municipal bond insurance business, which had generated good returns for decades. Our thesis was should the company be successful in riding out the storm in real estate, the value of its core business was well above the stock price.
In analyzing Ambac’s potential losses in real estate-related securities, we examined the underwriting models the company used when stress testing the portfolio. These models included what seemed like a very conservative worst case scenario. Specifically, the company assumed a nationwide decline in residential real estate based on the declines seen in Texas in the late 1980s. During that time, with oil prices falling, Texas home prices fell more than 30%, the worst regional decline since the Depression. Ambac then looked at the level of delinquencies, foreclosures and ultimate losses experienced by the Texas banks at that time. It applied these loss assumptions to the current real estate markets and reserved accordingly.
To us, this approach seemed conservative and led us to believe the company was adequately reserved. While this may still end up being the case, Ambac’s approach failed to take into account some dramatic differences. Most specifically, in Texas in the late 1980s, homeowners did not view their homes as an investment. As a result, they tended to be conservatively financed with long-term fixed-rate mortgages. In contrast, in recent years, many homeowners came to view their homes as financial assets that can only appreciate. This view was promoted by the
9
Not a part of Semi-Annual Report to Fund shareholders
CLIPPER FUNDSM
2949 East Elvira Road, Suite 101
media and also by highly commissioned brokers who pushed adjustable-rate mortgages with low teaser rates on borrowers who could not afford them. Underwriting standards deteriorated dramatically and many homeowners added second mortgages and home equity credit lines. As a result, although nationwide residential real estate prices have not fallen nearly as much as they did in Texas, delinquencies, foreclosures and losses have skyrocketed way beyond what the models predicted. As investors extrapolate these loss trends into their models, the market prices of real estate related securities have plunged causing Ambac to take enormous charges and raise dilutive capital. In fact, Ambac’s share count has increased from 101 million to 287 million in the past year. On top of this, the enormous reported losses and related media attention have also increased regulatory risk, which is particularly dangerous in a highly regulated industry.
Losses in this investment cost the Fund about 1.3% of performance. Having sold our shares at an enormous loss, we would only add that the history of Ambac is not yet written and we continue to follow it closely. Given that we still find the core business attractive, it is not inconceivable that we could own the shares again in the future.
Although the value of AIG and Merrill Lynch did not fall as much as Ambac, both were far larger holdings and thus have been more costly mistakes. The nature of their loss in value was also not just tied to deteriorating earnings. After all, because a business is worth the present value of all the cash generated between now and into the future, any one or two years worth of earnings generally do not dramatically change this value. On the other hand, if those earnings must be divided over more than twice as many shares, as with Ambac, then the business value per share is cut in half.
Unfortunately, both AIG and Merrill Lynch have suffered from this sort of dilution. In particular, Merrill’s shares outstanding have increased 45% since our initial purchase. In each case, we purchased more shares to offset some or all of our dilution; but the simple fact is that this share issuance lowered our assessment of fair value. While we were mistaken in our initial assessment, it is important to note that at this point, even after this dilution, our assessment of fair value is still significantly above today’s share price in both cases.
In the case of these biggest mistakes, what we missed was not something that stood out in their financial statements relative to their competitors, at least not in the quarters leading up to this mess. Rather, we mistakenly assessed the deterioration in their cultures. At any leveraged financial firm, culture is critical and it starts at the top. At such firms, the chief executive officer must serve as the ultimate chief risk officer. He or she must understand the nature (if not the specifics) of the risks that the firm is taking and ensure that the firm is adequately compensated for these risks. At both Merrill Lynch and AIG, a cultural deterioration and management ignorance allowed traders to “bet the firm.”
The managements at these firms clearly failed the test described above and in both cases management was replaced. It is our belief that under new leadership, both companies are making progress toward repairing their franchises. But the risks put on the balance sheets remain and must be monitored closely.
Looking ahead some years from now when this crisis will be behind us, three factors make us positive about our investments.13 First, because financial companies do not face the risk of obsolescence and their overall business model is fairly constant, there will be large banks and financial institutions whose returns on equity should
_________________________
13 Equity markets are volatile and an investor may lose money.
10
Not a part of Semi-Annual Report to Fund shareholders
CLIPPER FUNDSM
2949 East Elvira Road, Suite 101
approximate their historical averages. Second, because irrational institutions and capital have been wiped out, there is likely to be less competition and better pricing. Third, through Darwinian selection, the quality of management throughout the industry should be significantly higher. Our core holdings include American Express, Bank of New York Mellon, AIG, Merrill Lynch, and JPMorgan Chase. While this list may change in light of unfolding events, the combination of these three factors leads us to look for opportunity within the financial sector.
Concluding Thoughts
Great investment opportunities are created by fear, uncertainty and pessimism. With the valuations for many businesses at 20 year lows, investment prospects are significantly improved. While we cannot predict at what levels markets will reach bottom, we can be certain that we are far from the top. We feel confident in the long-term outlook for Clipper Fund based on the prospects and valuation of the Fund’s holdings and continue to invest our own money in the shares.
Finally, it is with sadness that we report to shareholders the death of Franklin Otis Booth, Jr., who served as a director of Clipper Fund for almost 25 years. Otis’s intelligence, diligence, common sense, and long-term perspective made him a valuable director. His loyalty, humor, integrity, and decency made him a role model for those lucky enough to know him.
We end by thanking our colleagues on the research team for their hard work and commitment. We and the entire staff of Davis Advisors remain mindful of our responsibility to the shareholders of Clipper Fund and grateful for the trust you have placed in us.
Sincerely,

| 
|
Christopher C. Davis | Kenneth Charles Feinberg |
President & Portfolio Manager | Portfolio Manager |
July 31, 2008
11
Not a part of Semi-Annual Report to Fund shareholders
CLIPPER FUNDSM
2949 East Elvira Road, Suite 101
You should carefully consider the Funds' investment objectives, risks, charges, and expenses before investing. You may obtain prospectuses containing this and other information about the Funds by calling Clipper Fund, Davis Funds or Selected Funds Shareholder Services at 800-432-2504, 800-279-0279 or 800-243-1575 respectively. Read the prospectus carefully before you invest or send money.
This report includes candid statements and observations regarding investment strategies, individual securities, economic and market conditions; however, there is no guarantee that these statements, opinions or forecasts will prove to be correct. These comments may also include the expression of opinions that are speculative in nature and should not be relied on as statements of fact.
Clipper Fund’s investment objective is long-term capital growth and capital preservation. Davis New York Venture Fund’s investment objective is long-term growth of capital. Selected American Shares’ investment objective is capital growth and income. In the current market environment, we expect that income will be low. There can be no assurance that a Fund will achieve its objective. The Funds invest primarily in common stock of U.S. companies with market capitalizations of at least $10 billion. A risk of investing in Clipper Fund is focused portfolio risk: concentrating a fund’s portfolio in a select limited number of securities can increase the volatility of the portfolio. Some of the other important risks of an investment in the Funds are: market risk: the market value of shares of common stock can change rapidly and unpredictably; company risk: the market value of a common stock varies with the success or failure of the company issuing the stock; financial services risk: investing a significant portion of assets in the financial services sector may cause a fund to be more volatile as securities within the financial services sector are more prone to regulatory action in the financial services industry, more sensitive to interest rate fluctuations and are the target of increased competition; and foreign country risk: companies operating, incorporated or principally traded in foreign countries may have more fluctuation as foreign economies may not be as strong or diversified, foreign political systems may not be as stable and foreign financial reporting standards may not be as rigorous as they are in the United States. As of June 30, 2008, Clipper Fund had 15.0% of assets invested in foreign companies. As of June 30, 2008, Davis New York Venture Fund had approximately 15.2% of assets invested in foreign companies. As of June 30, 2008, Selected American Shares had approximately 14.4% of assets invested in foreign companies. See the prospectus for a complete listing of the principal risks.
Davis Advisors is committed to communicating with our investment partners as candidly as possible because we believe our investors benefit from understanding our investment philosophy and approach. Our views and opinions regarding the investment prospects of our portfolio holdings include “forward looking statements” which may or may not be accurate over the long term. While we believe we have a reasonable basis for our appraisals and we have confidence in our opinions, actual results may differ materially from those we anticipate. These opinions are current as of the date of this piece but are subject to change. Market values will vary so that an investor may experience a gain or a loss. The information provided in this report should not be considered a recommendation to buy, sell or hold any particular security.
As of June 30, 2008, Clipper Fund had invested the following percentages of its assets in the companies listed:
Berkshire Hathaway | 7.35% | | Ambac | 0.09% |
Oaktree Capital Group | 3.36% | | American International Group | 6.11% |
Microsoft | 2.54% | | Merrill Lynch | 4.46% |
ConocoPhillips | 6.89% | | Bank of New York Mellon | 7.26% |
American Express | 7.77% | | JPMorgan Chase | 3.71% |
12
Not a part of Semi-Annual Report to Fund shareholders
CLIPPER FUNDSM
2949 East Elvira Road, Suite 101
As of June 30, 2008, Davis New York Venture Fund had invested the following percentages of its assets in the companies listed:
Berkshire Hathaway | 3.20% | | Ambac | 0.04% |
Microsoft | 1.96% | | American International Group | 2.05% |
Google | 0.92% | | Merrill Lynch | 2.10% |
ConocoPhillips | 4.55% | | Bank of New York Mellon | 2.06% |
Wells Fargo | 1.52% | | JPMorgan Chase | 2.58% |
American Express | 3.29% | | | |
As of June 30, 2008, Selected American Shares had invested the following percentages of its assets in the companies listed:
Berkshire Hathaway | 4.02% | | Ambac | 0.02% |
Microsoft | 2.15% | | American International Group | 2.12% |
Google | 0.59% | | Merrill Lynch | 2.07% |
ConocoPhillips | 4.58% | | Bank of New York Mellon | 1.22% |
Wells Fargo | 1.57% | | JPMorgan Chase | 3.08% |
American Express | 3.21% | | | |
The Funds have adopted a Portfolio Holdings Disclosure policy that governs the release of non-public portfolio holding information. This policy is described in detail in the prospectus. For Clipper Fund visit clipperfund.com or call 800-432-2504 for the most current public portfolio holdings information. For Davis Funds visit davisfunds.com or call 800-279-0279 for the most current public portfolio holdings information. For Selected Funds visit selectedfunds.com or call 800-243-1575 for the most current public portfolio holdings information.
Dalbar, a Boston based financial research firm that is independent from Davis Advisors, researched the results of actively trading mutual funds in a report entitled Quantitative Analysis of Investor Behavior (QAIB). The Dalbar report covered the time periods from 1988–2007. Dalbar computed the “average stock fund investor” returns by using industry cash flow reports from the Investment Company Institute. The “average stock fund return” figures represent the average return for all funds listed in Lipper’s U.S. Diversified Equity fund classification model. Dalbar also measured the behavior of a “systematic investor” and “asset allocation investor.” The annualized return for these investor types was 5.8% and 3.5% respectively over the time frame measured. All Dalbar returns were computed using the S&P 500® Index. Returns assume reinvestment of dividends and capital gain distributions. The Lipper Equity Lana Universe includes all U.S. registered equity and mixed-equity mutual funds with data available through Lipper. The fact that buy and hold has been a successful strategy in the past does not guarantee that it will continue to be successful in the future.
We gather our index data from a combination of reputable sources, including, but not limited to, Thomson Financial, Wilshire Atlas, Lipper, and index websites.
The S&P 500® Index is an unmanaged index of 500 selected common stocks, most of which are listed on the New York Stock Exchange. The Index is adjusted for dividends, weighted towards stocks with large market capitalizations and represents approximately two-thirds of the total market value of all domestic common stocks. Investments cannot be made directly in an index.
13
Not a part of Semi-Annual Report to Fund shareholders
CLIPPER FUNDSM
2949 East Elvira Road, Suite 101
After October 31, 2008, this piece must be accompanied by a supplement containing performance figures through the most recent quarter end.
Shares of the Funds are not deposits or obligations of any bank, are not guaranteed by any bank, are not insured by the FDIC or any other agency, and involve investment risks, including possible loss of the principal amount invested
The information provided in this commentary, unless otherwise indicated, is as of the date that this commentary was written (July 2008).
06/08 Davis Distributors, LLC, 2949 East Elvira Road, Suite 101, Tucson, AZ 85756, 800-432-2504, clipperfund.com.
14
Not a part of Semi-Annual Report to Fund shareholders
CLIPPER FUNDSM
2949 East Elvira Road, Suite 101
Management’s Discussion and Analysis
Clipper Fund
Clipper Fund delivered a negative return on net asset value of 21.54% for the six-month period ended June 30, 20081. Over the same time period, the Standard & Poor’s 500® Index2 (“Index”) decreased by 11.91%. Energy and materials were the only sectors3 within the Index that earned positive returns, with all other sectors, and especially financials, turning in negative returns.
Key Contributors to Performance
Energy companies were the most important contributors4 to the Fund’s performance over the six-month period. The Fund’s energy companies out-performed the corresponding sector within the Index (up 20% versus up 9% for the Index). The Fund’s relative performance was decreased by a lower relative average weighting in this sector (10% versus 14% for the Index). ConocoPhillips5 and Canadian Natural Resources were among the top contributors to performance.
The Fund managers have identified a number of investment opportunities in foreign companies. The Fund ended the period with approximately 15% of its assets invested in foreign companies. As a group, the foreign companies owned by the Fund increased in value, out-performing the Index over the period.
Costco Wholesale was also among the top contributors to performance.
Key Detractors from Performance
The Fund’s financial companies out-performed the corresponding sector within the Index (down 29% versus down 30% for the Index), but were still the largest detractors from performance. A higher relative average weighting in this sector (56% versus 17% for the Index) detracted from both absolute and relative performance. While Tokio Marine Holdings (formerly Millea Holdings) was among the top contributors to performance, American International Group, American Express, Bank of New York Mellon, Ambac Financial Group, and Merrill Lynch were among the top detractors from performance.
The Fund’s information technology companies under-performed the corresponding sector within the Index (down 22% versus down 13% for the Index). Microsoft was among the top detractors from performance.
UnitedHealth Group was also among the top detractors from performance.
______________________________________________________________
This Semi-Annual Report is authorized for use by existing shareholders. Prospective shareholders must receive a current Clipper Fund prospectus, which contains more information about investment strategies, risks, fees, and expenses. Please read the prospectus carefully before investing or sending money.
CLIPPER FUNDSM
2949 East Elvira Road, Suite 101
Management’s Discussion and Analysis – (Continued)
Clipper Fund’s investment objective is to seek long-term capital growth and capital preservation. There can be no assurance that the Fund will achieve its objective. The primary risks of an investment in Clipper Fund are: (1) market risk, (2) company risk, (3) focused portfolio risk, (4) financial services risk, (5) foreign country risk, (6) headline risk, and (7) selection risk. See the prospectus for a full description of each risk.
1 Total return assumes reinvestment of dividends and capital gain distributions. Past performance is not a guarantee of future results. Investment return and principal value will vary so that, when redeemed, an investor’s shares may be worth more or less than when purchased. The annualized operating expense ratio for the six months ended June 30, 2008 was 0.74%. The following table lists the average annual total returns for the periods ended June 30, 2008:
| | | | Fund |
| 1-Year | 5-Year | 10-Year | Inception |
| | | | (02/29/84) |
Clipper Fund | (23.39)% | 1.59% | 5.85% | 12.66% |
Standard & Poor’s 500® Index | (13.12)% | 7.58% | 2.88% | 11.77% |
Fund performance changes over time and current performance may be higher or lower than stated. The annualized operating expense ratio may vary in future years. For more current information please call Clipper Fund Investor Services at 1-800-432-2504.
Davis Selected Advisers, L.P. began serving as investment adviser to Clipper Fund on January 1, 2006. A different investment adviser managed the Fund from inception through December 31, 2005.
2 The Standard & Poor’s 500® Index is an unmanaged index of 500 selected common stocks, most of which are listed on the New York Stock Exchange. The Index is adjusted for dividends, weighted towards stocks with large market capitalization, and represents approximately two-thirds of the total market value of all domestic common stocks. Investments cannot be made directly in the Index.
3 The companies included in the Standard & Poor’s 500® Index are divided into ten sectors. One or more industry groups make up a sector.
4 A company’s or sector’s contribution to the Fund’s performance is a product both of its appreciation or depreciation and its weighting within the Fund. For example, a 5% holding that rises 20% has twice as much impact as a 1% holding that rises 50%.
5 This Management Discussion & Analysis discusses a number of individual companies. The information provided in this report does not provide information reasonably sufficient upon which to base an investment decision and should not be considered a recommendation to purchase or sell any particular security. The Schedule of Investments lists the Fund’s holdings of each company discussed.
Shares of the Clipper Fund are not deposits or obligations of any bank, are not guaranteed by any bank, are not insured by the FDIC or any other agency, and involve risks, including possible loss of the principal amount invested.
CLIPPER FUNDSM
FUND OVERVIEW
At June 30, 2008 (Unaudited)
Portfolio Composition | | Industry Weightings |
(% of Fund’s Net Assets) | | (% of Stock Holdings) |
| | | | | |
| | | | Fund | S&P 500® |
Common Stock (U.S.) | 83.78% | | Diversified Financials | 34.27% | 6.85% |
Common Stock (Foreign) | 15.38% | | Insurance | 17.47% | 3.52% |
Short Term Investments | 1.68% | | Energy | 13.97% | 16.21% |
Other Assets & Liabilities | (0.84)% | | Food & Staples Retailing | 10.83% | 2.76% |
| 100.00% | | Household & Personal Products | 6.50% | 2.45% |
| | | Automobiles & Components | 4.67% | 0.42% |
| | | Information Technology | 3.88% | 16.43% |
| | | Health Care | 3.10% | 11.91% |
| | | Real Estate | 2.38% | 1.21% |
| | | Media | 1.58% | 2.85% |
| | | Retailing | 1.35% | 2.54% |
| | | Capital Goods | – | 8.51% |
| | | Food, Beverage & Tobacco | – | 5.57% |
| | | Other | – | 18.77% |
| | | | 100.00% | 100.00% |
Top 10 Holdings
(% of Fund’s Net Assets)
| | |
Costco Wholesale Corp. | Food & Staples Retailing | 10.74% |
American Express Co. | Consumer Finance | 7.77% |
Berkshire Hathaway Inc., Class A | Property & Casualty Insurance | 7.35% |
Bank of New York Mellon Corp. | Capital Markets | 7.26% |
Canadian Natural Resources Ltd. | Energy | 6.96% |
ConocoPhillips | Energy | 6.89% |
Procter & Gamble Co. | Household & Personal Products | 6.45% |
American International Group, Inc. | Multi-Line Insurance | 6.11% |
Harley-Davidson, Inc. | Automobiles & Components | 4.63% |
Merrill Lynch & Co., Inc. | Capital Markets | 4.46% |
CLIPPER FUNDSM
EXPENSE EXAMPLE (Unaudited)
Example
As a shareholder of the Fund, you incur ongoing costs only, including advisory and administrative fees and other Fund expenses. The Expense Example is intended to help you understand your ongoing costs (in dollars) of investing in the Fund and to compare these costs with the ongoing costs of investing in other mutual funds. The Expense Example is based on an investment of $1,000 invested at the beginning of the period and held for the entire period indicated, which is from 01/01/08 to 06/30/08.
Actual Expenses
The information represented in the row entitled “Actual” provides information about actual account values and actual expenses. You may use the information in this row, together with the amount you invested, to estimate the expenses that you paid over the period. Simply divide your account value by $1,000 (for example, an $8,600 account value divided by $1,000 = 8.6), then multiply the result by the number under the heading “Expenses Paid During Period” to estimate the expenses you paid on your account during this period. An annual maintenance fee of $10, charged on retirement plan accounts per Social Security Number, is not included in the Expense Example. If this fee was included, the estimate of expenses you paid during the period would be higher, and your ending account value lower, by this amount.
Hypothetical Example for Comparison Purposes
The information represented in the row entitled “Hypothetical” provides information about hypothetical account values and hypothetical expenses based on the Fund’s actual expense ratio and an assumed rate of return of 5% per year before expenses, which is not the Fund’s actual return. The hypothetical account values and expenses may not be used to estimate the actual ending account balance or expenses you paid for the period. You may use this information to compare the ongoing costs of investing in the Fund and other funds. To do so, compare this 5% hypothetical example with the 5% hypothetical examples that appear in the shareholder reports of the other funds. An annual maintenance fee of $10, charged on retirement plan accounts per Social Security Number, is not included in the Expense Example. If this fee was included, the estimate of expenses you paid during the period would be higher, and your ending account value lower, by this amount.
Please note that the expenses shown in the table are meant to highlight your ongoing costs only. Therefore, the information in the row entitled “Hypothetical” is useful in comparing ongoing costs only, and will not help you determine the relative total costs of owning different funds.
| Beginning | Ending | Expenses Paid |
| Account Value | Account Value | During Period* |
| (01/01/08) | (06/30/08) | (01/01/08-06/30/08) |
| | | |
Actual | $1,000.00 | $784.59 | $3.28 |
Hypothetical | $1,000.00 | $1,021.18 | $3.72 |
Hypothetical assumes 5% annual return before expenses.
* Expenses are equal to the Fund’s annualized operating expense ratio (0.74%)**, multiplied by the average account value over the period, multiplied by 182/366 (to reflect the one-half year period).
** The expense ratio reflects the impact, if any, of the reduction of expenses paid indirectly and of certain reimbursements from the Adviser.
CLIPPER FUNDSM
SCHEDULE OF INVESTMENTS
June 30, 2008 (Unaudited)
Shares | | Security | | Value
(Note 1) |
COMMON STOCK - (99.16%) | |
| CONSUMER DISCRETIONARY - (7.53%) | |
| Automobiles & Components – (4.63%) | |
| 2,374,560 | Harley-Davidson, Inc. | | $ | 86,101,546 | |
|
| Media – (1.56%) | |
| 1,934,622 | News Corp., Class A | | | 29,096,715 | |
|
| Retailing – (1.34%) | |
| 1,758,123 | CarMax, Inc. * | | | 24,947,765 | |
|
| TOTAL CONSUMER DISCRETIONARY | | | 140,146,026 | |
|
| CONSUMER STAPLES - (17.19%) | |
| Food & Staples Retailing – (10.74%) | |
| 2,847,291 | Costco Wholesale Corp. | | | 199,822,883 | |
|
| Household & Personal Products – (6.45%) | |
| 1,971,025 | Procter & Gamble Co. | | | 119,858,030 | |
|
| TOTAL CONSUMER STAPLES | | | 319,680,913 | |
|
| ENERGY - (13.85%) | |
| 1,291,987 | Canadian Natural Resources Ltd. (Canada) | | | 129,521,697 | |
| 1,358,041 | ConocoPhillips | | | 128,185,490 | |
|
| TOTAL ENERGY | | | 257,707,187 | |
|
| FINANCIALS - (53.67%) | |
| Diversified Financials – (33.98%) | |
| Capital Markets – (16.08%) | |
| 1,276,629 | Ameriprise Financial, Inc. | | | 51,920,501 | |
| 3,568,789 | Bank of New York Mellon Corp. | | | 135,007,288 | |
| 896,000 | Brookfield Asset Management Inc., Class A (Canada) | | | 29,155,840 | |
| 2,617,617 | Merrill Lynch & Co., Inc. | | | 83,004,635 | |
|
| 299,088,264 | |
|
| Consumer Finance – (7.77%) | |
| 3,837,410 | American Express Co. | | | 144,555,235 | |
|
| Diversified Financial Services – (10.13%) | |
| 2,011,036 | JPMorgan Chase & Co. | | | 68,998,645 | |
| 2,232,700 | Oaktree Capital Group LLC, Class A (a) | | | 62,515,600 | |
| 4,528,341 | RHJ International *(b) (Belgium) | | | 57,037,211 | |
|
| 188,551,456 | |
|
| | 632,194,955 | |
|
| Insurance – (17.33%) | |
| Multi-line Insurance – (6.11%) | |
| 4,291,647 | American International Group, Inc. | | | 113,556,980 | |
|
| | | | | | | | | | | | | | | |
CLIPPER FUNDSM
SCHEDULE OF INVESTMENTS - (Continued)
June 30, 2008 (Unaudited)
Shares/Principal | | Security | | Value
(Note 1) |
COMMON STOCK - (CONTINUED) | |
| FINANCIALS - (CONTINUED) | |
| Insurance – (Continued) | |
| Property & Casualty Insurance – (11.22%) | |
| 1,282,164 | Ambac Financial Group, Inc. | | $ | 1,718,100 | |
| 1,132 | Berkshire Hathaway Inc., Class A * | | | 136,689,000 | |
| 6,665,300 | NIPPONKOA Insurance Co., Ltd. (Japan) | | | 57,811,756 | |
| 321,300 | Tokio Marine Holdings, Inc. (formerly Millea Holdings, Inc.) (Japan) | | | 12,527,023 | |
|
| 208,745,879 | |
|
| | 322,302,859 | |
|
| Real Estate – (2.36%) | |
| 1,928,563 | Redwood Trust, Inc. (b) | | | 43,951,950 | |
|
| TOTAL FINANCIALS | | | 998,449,764 | |
|
| HEALTH CARE - (3.07%) | |
| Health Care Equipment & Services – (3.07%) | |
| 2,176,855 | UnitedHealth Group Inc. | | | 57,142,444 | |
|
| TOTAL HEALTH CARE | | | 57,142,444 | |
|
| INFORMATION TECHNOLOGY - (3.85%) | |
| Software & Services – (2.54%) | |
| 1,714,329 | Microsoft Corp. | | | 47,195,477 | |
|
| Technology Hardware & Equipment – (1.31%) | |
| 171,941 | Agilent Technologies, Inc. * | | | 6,110,783 | |
| 415,000 | Hewlett-Packard Co. | | | 18,347,150 | |
|
| | 24,457,933 | |
|
| TOTAL INFORMATION TECHNOLOGY | | | 71,653,410 | |
|
| TOTAL COMMON STOCK – (Identified cost $2,047,857,005) | | | 1,844,779,744 | |
|
| |
SHORT TERM INVESTMENTS – (1.68%) | |
$ | 10,658,000 | ABN AMRO Inc. Joint Repurchase Agreement, | |
| 2.80%, 07/01/08, dated 06/30/08, repurchase value of $10,658,829 | |
| (collateralized by: U.S. Government agency mortgages and obligations in a pooled cash account, 3.15%-6.00%, 06/12/09-05/01/38, total market value $10,871,160) | | | 10,658,000 | |
| 10,658,000 | Banc of America Securities LLC Joint Repurchase Agreement, | |
| 2.45%, 07/01/08, dated 06/30/08, repurchase value of $10,658,725 | |
| (collateralized by: U.S. Government agency mortgages in a pooled cash account, 5.50%, 05/01/35-06/01/38, total market value $10,871,160) | | | 10,658,000 | |
| | | | | | | | | | | | | | |
CLIPPER FUNDSM
SCHEDULE OF INVESTMENTS - (Continued)
June 30, 2008 (Unaudited)
Principal | | Security | | Value
(Note 1) |
SHORT TERM INVESTMENTS – (CONTINUED) | |
$ | 2,842,000 | Lehman Brothers Inc. Joint Repurchase Agreement, | |
| 2.20%, 07/01/08, dated 06/30/08, repurchase value of $2,842,174 | |
| (collateralized by: U.S. Government agency mortgages in a pooled cash account, 4.50%-7.00%, 06/01/22-06/01/38, total market value $2,898,840) | | $ | 2,842,000 | |
| 7,065,000 | UBS Securities LLC Joint Repurchase Agreement, | |
| 2.60%, 07/01/08, dated 06/30/08, repurchase value of $7,065,510 | |
| (collateralized by : U.S. Government agency mortgages in a pooled cash account, 5.00%, 02/01/36, total market value $7,206,300) | | | 7,065,000 | |
|
| TOTAL SHORT TERM INVESTMENTS – (Identified cost $31,223,000) | | | 31,223,000 | |
|
| | | | | |
| Total Investments - (100.84%) - (identified cost $2,079,080,005) - (c) | | | 1,876,002,744 | |
| Liabilities Less Other Assets - (0.84%) | | | (15,546,768) | |
|
| Net Assets - (100.00%) | | $ | 1,860,455,976 | |
|
|
| | | | | |
| * | | Non-Income producing security. | | |
| (a) | | Illiquid Security - See Note 6 of the Notes to Financial Statements. | | |
| (b) | | Affiliated Company. Represents ownership of at least 5% of the voting securities of the issuer and is an affiliate, as defined in the Investment Company Act of 1940, at or during the six months ended June 30, 2008. The aggregate fair value of the securities of affiliated companies held by the Fund as of June 30, 2008, amounts to $100,989,161. Transactions during the period in which the issuers were affiliates are as follows: | | |
| Security | Shares December 31, 2007 | Gross Additions | Gross Reductions | Shares June 30, 2008 | | Dividend Income | |
| | | | | | | | | | | | | | | | | | | | | | | | |
| Redwood Trust, Inc. | | 1,928,564 | | – | | 1 | | 1,928,563 | | $ | 2,892,845 | | |
| RHJ International | | 4,448,941 | | 79,400 | | – | | 4,528,341 | | | – | | |
| | | | | |
| (c) | | Aggregate cost for Federal Income Tax purposes is $2,079,080,005. At June 30, 2008 unrealized appreciation (depreciation) of securities for Federal Income Tax purposes is as follows: | | |
| Unrealized appreciation | | $ | 239,128,072 | |
| Unrealized depreciation | | | (442,205,333) | |
|
| Net unrealized depreciation | | $ | (203,077,261) | |
|
|
|
See Notes to Financial Statements |
| | | | | | | | | | | | | | | | | | | | | | | |
CLIPPER FUNDSM
STATEMENT OF ASSETS AND LIABILITIES
At June 30, 2008 (Unaudited)
ASSETS: | |
Investments in securities at value* (see accompanying Schedule of Investments): | |
| Unaffiliated companies | | $ | 1,775,013,583 |
| Affiliated companies | | | 100,989,161 |
Cash | | | 101,848 |
Cash - foreign currencies** | | | 437,825 |
Receivables: | |
| Capital stock sold | | | 2,236,293 |
| Dividends and interest | | | 1,595,972 |
| Investment securities sold | | | 31,247,697 |
Prepaid expenses | | | 13,172 |
| Total assets | | | 1,911,635,551 |
LIABILITIES: | |
Payables: | |
| Investment securities purchased | | | 515,209 |
| Capital stock redeemed | | | 48,985,616 |
Accrued management fee | | | 1,077,946 |
Other accrued expenses | | | 600,804 |
| Total liabilities | | | 51,179,575 |
NET ASSETS | | $ | 1,860,455,976 |
SHARES OUTSTANDING | | | 29,276,384 |
NET ASSET VALUE, offering, and redemption price per share (Net Assets ÷ Shares Outstanding) | | $ | 63.55 |
NET ASSETS CONSIST OF: | |
Paid in capital | | $ | 1,954,178,614 |
Undistributed net investment income | | | 11,876,737 |
Accumulated net realized gains from investments and foreign currency transactions | | | 97,480,285 |
Net unrealized depreciation on investments and foreign currency transactions | | | (203,079,660) |
| Net Assets | | $ | 1,860,455,976 |
| |
*Including: | |
| Cost of unaffiliated companies | | $ | 1,936,776,530 |
| Cost of affiliated companies | | | 142,303,475 |
**Cost of cash - foreign currencies | | | 435,732 |
| |
See Notes to Financial Statements | |
| | | | | | | |
CLIPPER FUNDSM
STATEMENT OF OPERATIONS
For the six months ended June 30, 2008 (Unaudited) |
INVESTMENT INCOME: | |
Income: | |
| Dividends: | |
| Unaffiliated companies | | $ | 17,066,412 |
| Affiliated companies | | | 2,892,845 |
| Interest | | | 192,752 |
| Total income | | | 20,152,009 |
| |
Expenses: | |
| Management fees (Note 2) | | $ | 6,573,260 | |
| Custodian fees | | | 111,310 | |
| Transfer agent fees | | | 1,325,950 | |
| Audit fees | | | 27,000 | |
| Legal fees | | | 31,509 | |
| Reports to shareholders | | | 135,865 | |
| Directors’ fees and expenses | | | 43,758 | |
| Registration and filing fees | | | 30,444 | |
| Miscellaneous | | | 83,466 | |
| Total expenses | | | 8,362,562 | |
| Expenses paid indirectly (Note 5) | | | (24,605) | |
| Net expenses | | | 8,337,957 | |
| Net investment income | | | 11,814,052 | |
| |
REALIZED & UNREALIZED GAIN (LOSS) ON INVESTMENTS AND FOREIGN CURRENCY TRANSACTIONS: | |
Net realized gain (loss) from: | |
| Investment transactions | | | 97,256,869 |
| Foreign currency transactions | | | (98,960) |
Net change in unrealized appreciation (depreciation) | | | (658,763,552) |
Net realized and unrealized loss on investments and foreign currency | | | (561,605,643) |
| Net decrease in net assets resulting from operations | | $ | (549,791,591) |
| | | |
*Net of foreign taxes withheld as follows | | $ | 98,038 |
| |
See Notes to Financial Statements | |
| | | | | | | | | | |
CLIPPER FUNDSM
STATEMENTS OF CHANGES IN NET ASSETS
| | | | Six months ended June 30, 2008 (Unaudited) | | | Year ended December 31, 2007 |
OPERATIONS: | |
| Net investment income | | $ | 11,814,052 | | $ | 27,440,347 |
| Net realized gain from investments and foreign currency transactions | | | 97,157,909 | | | 319,575,287 |
| Net change in unrealized depreciation on investments and foreign currency transactions | | | (658,763,552) | | | (341,076,615) |
| Net increase (decrease) in net assets resulting from operations | | | (549,791,591) | | | 5,939,019 |
| |
DIVIDENDS AND DISTRIBUTIONS TO SHAREHOLDERS FROM: | |
| Net investment income | | | – | | | (27,209,131) |
| Realized gains from investment transactions | | | – | | | (317,456,555) |
| |
CAPITAL SHARE TRANSACTIONS: | |
| Net decrease in net assets resulting from capital share transactions (Note 4) | | | (371,058,478) | | | (308,368,312) |
| | | | | | |
Total decrease in net assets | | | (920,850,069) | | | (647,094,979) |
| |
NET ASSETS: | |
| Beginning of period | | | 2,781,306,045 | | | 3,428,401,024 |
| |
| End of period* | | $ | 1,860,455,976 | | $ | 2,781,306,045 |
| |
*Including undistributed net investment income of | | | 11,876,737 | | | 62,685 |
| |
See Notes to Financial Statements | |
| | | | | | | | | |
CLIPPER FUNDSM
NOTES TO FINANCIAL STATEMENTS
June 30, 2008 (Unaudited)
NOTE 1 — SUMMARY OF SIGNIFICANT ACCOUNTING POLICIES
Clipper Fund, Inc. (“Fund”, a California corporation) is registered under the Investment Company Act of 1940, as amended, as a non-diversified open-end management investment company. The Fund’s investment objective is long-term capital growth and capital preservation. Effective January 1, 2006, Davis Selected Advisers, L.P. (“Davis Advisors” or “Adviser”) assumed management of the Fund. The Adviser seeks to invest the Fund’s assets primarily in common stocks of large companies (generally, companies with market capitalizations of $10 billion or more at the time of initial purchase) that are trading at prices below the Adviser’s estimate of their intrinsic values. The following is a summary of significant accounting policies consistently followed by the Fund in the preparation of its financial statements.
A. VALUATION OF SECURITIES - The Fund calculates the net asset value of its shares as of the close of the New York Stock Exchange (“Exchange”), normally 4:00 P.M. Eastern time, on each day the Exchange is open for business. Securities listed on the Exchange (and other national exchanges) are valued at the last reported sales price on the day of valuation. Securities traded in the over-the-counter market (e.g. NASDAQ) and listed securities for which no sale was reported on that date are stated at the closing bid price. Securities traded on foreign exchanges are valued based upon the last sales price on the principal exchange on which the security is traded prior to the time when Fund’s assets are valued. Securities (including restricted securities) for which market quotations are not readily available are valued at their fair value. Securities whose values have been materially affected by what the Adviser identifies as a significant event occurring before the Fund’s assets are valued but after the close of their respective exchanges will be fair valued. Fair value is determined in good faith using consistently applied procedures under the supervision of the Board of Directors. Short-term securities purchased within 60 days to maturity are valued at amortized cost, which approximates market value. These valuation procedures are reviewed and subject to approval by the Board of Directors.
Fair Value Measurements – The Fund adopted Financial Accounting Standards Board Statement of Financial Accounting Standards No. 157, Fair Value Measurements (“FAS 157”), effective January 1, 2008. In accordance with FAS 157, fair value is defined as the price that the Fund would receive upon selling an investment in a timely transaction to an independent buyer in the principal or most advantageous market of the investment. FAS 157 established a three-tier hierarchy to maximize the use of observable market data and minimize the use of unobservable inputs and to establish classification of fair value measurements for disclosure purposes. The three-tier hierarchy of inputs is summarized in the three broad levels listed below.
| § | Level 1 – quoted prices in active markets for identical securities |
| § | Level 2 – other significant observable inputs (including quoted prices for similar investments, interest rates, prepayment speeds, credit risk, etc.) |
| § | Level 3 – significant unobservable inputs (including Fund’s own assumptions in determining the fair value of investments) |
The inputs or methodology used for valuing securities are not necessarily an indication of the risk associated with investing in those securities.
CLIPPER FUNDSM
NOTES TO FINANCIAL STATEMENTS - (Continued)
June 30, 2008 (Unaudited)
NOTE 1 — SUMMARY OF SIGNIFICANT ACCOUNTING POLICIES - (Continued)
A. | VALUATION OF SECURITIES - (Continued) |
The following is a summary of the inputs used as of June 30, 2008 in valuing the Fund’s investments carried at value:
| | Investments in |
Valuation inputs | | Securities at Value |
Level 1 – Quoted prices | | $ | 1,782,264,144 |
Level 2 – Other Significant Observable Inputs | | | 93,738,600 |
Level 3 – Significant Unobservable Inputs | | | – |
Total | | $ | 1,876,002,744 |
B. MASTER REPURCHASE AGREEMENTS - The Fund, along with other affiliated funds, may transfer uninvested cash balances into one or more master repurchase agreement accounts. These balances are invested in one or more repurchase agreements, secured by U.S. Government securities. A custodian bank holds securities pledged as collateral for repurchase agreements until the agreements mature. Each agreement requires that the market value of the collateral be sufficient to cover payments of interest and principal; however, in the event of default by the other party to the agreement, retention of the collateral may be subject to legal proceedings.
C. CURRENCY TRANSLATION - The market values of all assets and liabilities denominated in foreign currencies are recorded in the financial statements after translation to the U.S. Dollar based upon the mean between the bid and offered quotations of the currencies against U.S. Dollars on the date of valuation. The cost basis of such assets and liabilities is determined based upon historical exchange rates. Income and expenses are translated at average exchange rates in effect as accrued or incurred.
D. FOREIGN CURRENCY - The Fund may enter into forward purchases or sales of foreign currencies to hedge certain foreign currency denominated assets and liabilities against declines in market value relative to the U.S. Dollar. Forward currency contracts are marked-to-market daily and the change in market value is recorded by the Fund as an unrealized gain or loss. When the forward currency contract is closed, the Fund records a realized gain or loss equal to the difference between the value of the forward currency contract at the time it was opened and value at the time it was closed. Investments in forward currency contracts may expose the Fund to risks resulting from unanticipated movements in foreign currency exchange rates or failure of the counter-party to the agreement to perform in accordance with the terms of the contract.
Reported net realized foreign exchange gains or losses arise from the sales of foreign currencies, currency gains or losses realized between the trade and settlement dates on securities transactions, the difference between the amounts of dividends, interest and foreign withholding taxes recorded on the Fund’s books, and the U.S. Dollar equivalent of the amounts actually received or paid. Net unrealized foreign exchange gains and losses arise from changes in the value of assets and liabilities other than investments in securities at fiscal year end, resulting from changes in the exchange rate. The Fund includes foreign currency gains and losses realized on the sale of investments together with market gains and losses on such investments in the statement of operations.
CLIPPER FUNDSM
NOTES TO FINANCIAL STATEMENTS - (Continued)
June 30, 2008 (Unaudited)
NOTE 1 — SUMMARY OF SIGNIFICANT ACCOUNTING POLICIES - (Continued)
E. FEDERAL INCOME TAXES - It is the Fund’s policy to comply with the requirements of the Internal Revenue Code applicable to regulated investment companies, and to distribute substantially all of its taxable income, including any net realized gains on investments not offset by loss carryovers, to shareholders. Therefore, no provision for Federal Income or Excise Tax is required. The Adviser has analyzed the Fund’s tax positions taken on federal income tax returns for all open tax years and has concluded that as of June 30, 2008, no provision for income tax would be required in the Fund’s financial statements. The Fund’s federal and state income and federal excise tax returns for tax years for which the applicable statutes of limitations have not expired are subject to examination by the Internal Revenue Service and state departments of revenue.
F. USE OF ESTIMATES IN FINANCIAL STATEMENTS - In preparing financial statements in conformity with accounting principles generally accepted in the United States of America, management makes estimates and assumptions that affect the reported amounts of assets and liabilities and disclosure of contingent assets and liabilities at the date of the financial statements, as well as the reported amounts of income and expenses during the reporting period. Actual results may differ from these estimates.
G. INDEMNIFICATION - Under the Fund’s organizational documents, its officers and directors are indemnified against certain liabilities arising out of the performance of their duties to the Fund. In addition, some of the Fund’s contracts with its service providers contain general indemnification clauses. The Fund’s maximum exposure under these arrangements is unknown since the amount of any future claims that may be made against the Fund cannot be determined and the Fund has no historical basis for predicting the likelihood of any such claims.
H. SECURITIES TRANSACTIONS AND RELATED INVESTMENT INCOME - Securities transactions are accounted for on the trade date (date the order to buy or sell is executed) with realized gain or loss on the sale of securities being determined based upon identified cost. Dividend income is recorded on the ex-dividend date. Dividend income from REIT securities may include return of capital. Upon notification from the issuer, the amount of the return of capital is reclassified to adjust dividend income, reduce the cost basis, and/or adjust realized gain/loss. Interest income, which includes accretion of discount and amortization of premium, is accrued as earned.
I. DIVIDENDS AND DISTRIBUTIONS TO SHAREHOLDERS - Dividends and distributions to shareholders are recorded on the ex-dividend date. Net investment income (loss), net realized gains (losses), and net unrealized appreciation (depreciation) on investments may differ for financial statement and tax purposes primarily due to differing treatments of wash sales, foreign currency transactions and net operating losses. The character of dividends and distributions made during the fiscal year from net investment income and net realized securities gains may differ from their ultimate characterization for Federal Income Tax purposes. Also, due to the timing of dividends and distributions, the fiscal year in which amounts are distributed may differ from the fiscal year in which income or realized gain was recorded by the Fund. The Fund adjusts the classification of distributions to shareholders to reflect the differences between financial statement amounts and distributions determined in accordance with income tax regulations.
CLIPPER FUNDSM
NOTES TO FINANCIAL STATEMENTS - (Continued)
June 30, 2008 (Unaudited)
NOTE 2— INVESTMENT ADVISORY FEES
Advisory fees are paid monthly to the Adviser. The annual rate is 0.65% of the average net assets for the first $500 million, 0.60% on the next $500 million, 0.55% on the next $2 billion, 0.54% on the next $1 billion, 0.53% on the next $1 billion, 0.52% on the next $1 billion, 0.51% on the next $1 billion, 0.50% on the next $3 billion, and 0.485% of the average net assets greater than $10 billion. Advisory fees paid during the six months ended June 30, 2008 approximated 0.58% (annualized) of average net assets.
Boston Financial Data Services, Inc. (“BFDS”) is the Fund’s primary transfer agent. The Adviser is also paid for certain transfer agent services. The fee for these services for the six months ended June 30, 2008 amounted to $25,203. State Street Bank & Trust Co. (“State Street Bank”) is the Fund’s primary accounting provider. Fees for such services are included in the custodian fee as State Street Bank also serves as the Fund’s custodian. Certain officers of the Fund are also officers of the general partner of the Adviser.
Davis Selected Advisers-NY, Inc. (“DSA-NY”), a wholly-owned subsidiary of the Adviser, acts as sub-adviser to the Fund. DSA-NY performs research and portfolio management services for the Fund under a Sub-Advisory Agreement with the Adviser. The Fund pays no fees directly to DSA-NY.
NOTE 3 — PURCHASES AND SALES OF SECURITIES
Purchases and sales of investment securities (excluding short-term securities) for the six months ended June 30, 2008 were $80,449,424 and $462,446,196, respectively.
NOTE 4 — CAPITAL STOCK
At June 30, 2008, there were 200,000,000 shares of capital stock (no par value) authorized. Transactions in capital stock were as follows:
| Six months ended June 30, 2008 | | Year ended December 31, | |
| (Unaudited) | | 2007 | |
Shares sold | | 2,513,696 | | | 3,219,826 | |
Shares issued in reinvestment of distributions | | – | | | 4,089,235 | |
| | 2,513,696 | | | 7,309,061 | |
Shares redeemed* | | (7,575,598 | ) | | (10,242,878 | ) |
Net decrease | | (5,061,902 | ) | | (2,933,817 | ) |
| | | | | | |
Proceeds from shares sold | $ | 181,726,206 | | $ | 295,654,804 | |
Proceeds from shares issued in reinvestment of distributions | | – | | | 330,982,605 | |
| | 181,726,206 | | | 626,637,409 | |
Cost of shares redeemed* | | (552,784,684 | ) | | (935,005,721 | ) |
Net decrease | $ | (371,058,478 | ) | $ | (308,368,312 | ) |
* Amounts for the six months ended June 30, 2008 include a redemption as a result of an in-kind transfer of securities (see Note 7 of the Notes to Financial Statements).
CLIPPER FUNDSM
NOTES TO FINANCIAL STATEMENTS - (Continued)
June 30, 2008 (Unaudited)
NOTE 5 — EXPENSES PAID INDIRECTLY
Under an agreement with State Street Bank, custodian fees are reduced for earnings on cash balances maintained at the custodian by the Fund. Such reductions amounted to $24,605 during the six months ended June 30, 2008.
NOTE 6 — ILLIQUID SECURITIES
Securities may be considered illiquid if they lack a readily available market or if valuation has not changed for a certain period of time. The aggregate value of illiquid securities amounted to $62,515,600 or 3.36% of the Fund’s net assets as of June 30, 2008.
Security | | Acquisition Date | | Shares | | Cost per Share | | Valuation per Share as of June 30, 2008 |
| | | | | | | | | | |
Oaktree Capital Group, LLC, Class A | | 09/20/07 | | 2,232,700 | | $ | 36.90 | | $ | 28.0000 |
| | | | | | | | | | | | |
NOTE 7 — IN-KIND REDEMPTION
During the six months ended June 30, 2008, shareholders redeemed 1,433,782 shares in exchange for Fund portfolio securities valued at $114,286,748. The Fund realized a gain of $26,126,429. This gain is not taxable for federal income tax purposes.
CLIPPER FUNDSM
FINANCIAL HIGHLIGHTS
Financial Highlights for a share of capital stock outstanding throughout each period:
| Six months | | |
| ended | | |
| June 30, 2008 | Year ended December 31, | |
| (Unaudited) | 2007 | | 20064 | | 2005 | | 2004 | | 2003 | |
| | | | | | | | | | | | | | | | | | |
Net Asset Value, Beginning of Period | $ | 81.00 | | $ | 91.98 | | $ | 88.18 | | $ | 89.68 | | $ | 87.97 | | $ | 75.73 | |
| | | | | | | | | | | | | | | | | | |
Income (Loss) from Investment Operations: | | | | | | | | | | | | | | | | | | |
Net Investment Income | | 0.40 | | | 0.88 | | | 1.07 | | | 1.31 | | | 0.58 | | | 0.72 | |
Net Realized and Unrealized | | | | | | | | | | | | | | | | | | |
Gains (Losses) | | (17.85 | ) | | (0.84 | ) | | 11.84 | | | (1.52 | ) | | 4.51 | | | 13.87 | |
Total from Investment Operations | | (17.45 | ) | | 0.04 | | | 12.91 | | | (0.21 | ) | | 5.09 | | | 14.59 | |
| | | | | | | | | | | | | | | | | | |
Dividends and Distributions: | | | | | | | | | | | | | | | | | | |
Dividends from Net Investment Income | | – | | | (0.87 | ) | | (1.10 | ) | | (1.29 | ) | | (0.57 | ) | | (0.73 | ) |
Distributions from Realized Gains | | – | | | (10.15 | ) | | (8.01 | ) | | – | | | (2.81 | ) | | (1.62 | ) |
Total Dividends and Distributions | | – | | | (11.02 | ) | | (9.11 | ) | | (1.29 | ) | | (3.38 | ) | | (2.35 | ) |
| | | | | | | | | | | | | | | | | | |
Net Asset Value, End of Period | $ | 63.55 | | $ | 81.00 | | $ | 91.98 | | $ | 88.18 | | $ | 89.68 | | $ | 87.97 | |
| | | | | | | | | | | | | | | | | | |
Total Return1 | | (21.54)% | | | 0.05% | | | 15.27% | | | (0.24)% | | | 5.87% | | | 19.35% | |
| | | | | | | | | | | | | | | | | | |
Ratios/Supplemental Data: | | | | | | | | | | | | | | | | | | |
Net Assets, End of Period | | | | | | | | | | | | | | | | | | |
(000,000 omitted) | $ | 1,860 | | $ | 2,781 | | $ | 3,428 | | $ | 4,006 | | $ | 7,208 | | $ | 6,963 | |
Ratio of Expenses to Average | | | | | | | | | | | | | | | | | | |
Net Assets: | | | | | | | | | | | | | | | | | | |
Gross | | 0.74%* | | | 0.69% | | | 0.70% | | | 1.12% | | | 1.12% | | | 1.13% | |
Net3 | | 0.74%* | | | 0.69% | | | 0.62% | | | 1.11% | | | 1.12% | | | 1.12% | |
Ratio of Net Investment Income to | | | | | | | | | | | | | | | | | | |
Average Net Assets | | 1.05%* | | | 0.85% | | | 1.11% | | | 0.97% | | | 0.65% | | | 0.98% | |
Portfolio Turnover Rate2 | | 4% | | | 25% | | | 63% | | | 13% | | | 16% | | | 25% | |
1 Assumes hypothetical initial investment on the business day before the first day of the fiscal period, with all dividends and distributions reinvested in additional shares on the reinvestment date, and redemption at the net asset value calculated on the last business day of the fiscal period. Total returns for periods of less than one full year are not annualized.
2 The lesser of purchases or sales of portfolio securities for a period, divided by the monthly average of the market value of portfolio securities owned during the period. Securities with a maturity or expiration date at the time of acquisition of one year or less are excluded from the calculation.
3 The Net ratio of expenses to average net assets reflects the impact, if any, of the reduction of expenses paid indirectly and of certain reimbursements or waivers from the Adviser.
4 Effective January 1, 2006, Davis Selected Advisers, L.P., assumed management of the Fund. A different investment adviser managed the Fund from inception through December 31, 2005.
See Notes to Financial Statements |
CLIPPER FUNDSM
FUND INFORMATION
Portfolio Proxy Voting Policies and Procedures
The Fund has adopted Portfolio Proxy Voting Policies and Procedures under which the Fund votes proxies relating to securities held by the Fund. A description of the Fund’s Portfolio Proxy Voting Policies and Procedures is available (i) without charge, upon request, by calling the Fund toll-free at 1-800-432-2504, (ii) on the Fund’s website at www.clipperfund.com, and (iii) on the SEC’s website at www.sec.gov.
In addition, the Fund is required to file Form N-PX, with its complete proxy voting record for the 12 months ended June 30th, no later than August 31st of each year. The Fund’s Form N-PX filing is available (i) without charge, upon request, by calling the Fund toll-free at 1-800-432-2504, (ii) on the Fund’s website at www.clipperfund.com, and (iii) on the SEC’s website at www.sec.gov.
Form N–Q
The Fund files its complete schedule of portfolio holdings with the SEC for the first and third quarters of each fiscal year on Form N-Q. The Fund’s Form N-Q is available without charge, upon request, by calling 1-800-432-2504 or on the Fund’s website at www.clipperfund.com, or on the SEC’s website at www.sec.gov. The Fund’s Form N-Q may be reviewed and copied at the SEC’s Public Reference Room in Washington, DC, and that information on the operation of the Public Reference Room may be obtained by calling 1-800-SEC-0330.
CLIPPER FUNDSM
DIRECTOR APPROVAL OF ADVISORY AGREEMENTS
The Board of Directors of Clipper Fund, Inc. (“Fund”) oversees the management of the Fund and, as required by law, determines annually whether to approve the continuance of the Fund’s advisory agreement with Davis Selected Advisers, L.P. and sub-advisory agreement with Davis Selected Advisers-NY, Inc. (jointly “Advisory Agreement”). Davis Selected Advisers, L.P. and Davis Selected Advisers-NY, Inc. are jointly referred to below as “Davis Advisors.”
As a part of this process counsel for the Board of Directors (which is composed entirely of directors who are independent of Davis Advisors) prepares questions which it submits to Davis Advisors in anticipation of the annual contract review. In the March 2008 Board meeting, the Directors reviewed and evaluated Davis Advisors’ responses to these questions as well as a variety of information furnished to the Board during the previous year with respect to Davis Advisors and the operations of the Fund. Upon completion of this review, the Directors determined that the terms of the Advisory Agreement are fair and reasonable and that the Advisory Agreement continues to be in the best interests of the Fund and its shareholders, and approved its continuation for an additional year.
The Directors’ determinations were based upon a comprehensive consideration of all information provided to them and were not the result of any single factor. The following facts and conclusions were important, but not exclusive, in the Directors’ recommendation to renew the Advisory Agreement.
Performance, Expenses, and Advisory Fee Schedule
The Directors noted while the Fund delivered a 7.39% annualized return for the two-year period since Davis Advisors began managing the Fund on January 1, 2006, in both 2006 and 2007 the Fund under-performed both its benchmark, the Standard & Poor’s 500® Index, and the average performance of a peer group of comparable funds as determined by an independent service provider. The Directors considered that this two-year time period is too short to make meaningful judgments concerning performance, and also reviewed information showing that Davis Advisors’ investment discipline has delivered good investment performance to other clients when measured over longer time periods.
The Directors considered the total expense ratio for the Fund, noting that it had been significantly reduced from prior years, and concluded that it was reasonable and competitive with the average expense ratios of its peer group of comparable funds.
The Directors also considered the advisory fee schedule for the Fund and comparative fee information for its peer group. They noted that the Fund’s advisory fees are below the average of the fees paid by its peer group of comparable funds, and that the breakpoint discounts in the Fund’s advisory fee structure provide for the sharing between Fund shareholders and Davis Advisors of any economies of scale that may exist in the management of the Fund. The Board noted that the Fund’s advisory fees are identical to those paid by another open-end mutual fund for which Davis Advisors serves as investment adviser, and that although the advisory fees paid by other institutional clients of Davis Advisors are in many cases lower the differences reflect the significant investment, operational and regulatory differences between advising mutual funds and institutional clients.
In addition, the Directors considered various other potential benefits that Davis Advisors may receive in connection with the services it provides to the Fund, including reimbursement of a portion of Davis Advisors’ costs in providing shareholder services to the Fund. In that connection, the Board also reviewed Davis Advisors’ portfolio brokerage practices, and noted that Davis Advisors does not use client commissions to pay for publications that are available to the general public or for third-party research services.
CLIPPER FUNDSM
DIRECTOR APPROVAL OF ADVISORY AGREEMENTS - (Continued)
Other Significant Considerations
The Directors noted the importance of reviewing quantitative measures such as those described above, but also recognized that qualitative factors could be equally, or more important, in assessing whether Fund shareholders have been, or are likely to be, well served by the renewal of the Advisory Agreement. Accordingly, the Directors also considered the full range of services which Davis Advisors provides to the Fund and its shareholders, including whether it:
| 1. | Employs a disciplined, company specific, research driven, businesslike, and long-term investment philosophy; |
| 2. | Achieves satisfactory investment results over the long-term after all costs; |
| 3. | Handles shareholder transactions, inquiries, requests, and records efficiently and effectively, and provides quality accounting, legal, and compliance services, and oversight of third party service providers; and |
| 4. | Fosters healthy investor behavior. |
The Board considered the quality of Davis Advisors’ investment management process; the experience, capability and integrity of its senior management; the overall financial strength and stability of its organization; and Davis Advisors’ commitment to maintaining these attributes.
The Board noted that Davis Advisors and the Davis family invested over $50 million in the Fund when Davis Advisors began managing the Fund and invested an additional $10 million in the Fund in 2008, and that Davis Advisors and the Davis family’s interests are aligned with those of other shareholders, as they face the same risks, pay the same fees, and are highly motivated to achieve satisfactory long-term returns. The Directors also considered Davis Advisors’ efforts to minimize Fund transaction costs by generally applying a long-term time horizon to investments.
The Directors concluded that Davis Advisors had provided the Fund and its shareholders a reasonable level of both investment and non-investment services. The Directors further concluded that shareholders have received a significant benefit from Davis Advisors’ shareholder oriented approach.
CLIPPER FUNDSM
2949 East Elvira Road, Suite 101
Tucson, Arizona 85756
DIRECTORS
For the purpose of their service as directors to the Clipper Fund, the business address for each of the directors is 2949 E. Elvira Road, Suite 101, Tucson, AZ 85756. All directors qualify as independent under the Investment Company Act of 1940.
Name
(birthdate) | Position(s)
Held with
Fund | Term of Office
and Length of
Time Served | Principal
Occupation(s)
During Past
5 Years | Number of
Portfolios
Overseen in
Fund Complex | Other
Directorships
Held |
| | | | | |
Independent Directors | | | | | |
| | | | | | |
| Lawrence E. Harris (09/16/1956) | Director | Indefinite and since April 2006 | Fred V. Keenan Chair in Finance of the Marshall School of Business, University of Southern California, Los Angeles, CA | 1 | Interactive Brokers Group, Inc. |
| | | | | | |
| Steven N. Kearsley (09/29/1941) | Director | Indefinite and since April 2006 | Private Investor, Real Estate Development | 1 | None |
| | | | | | |
| Lawrence P. McNamee
(09/12/1934) | Director | Indefinite and since inception | Retired Educator | 1 | None |
| | | | | | |
Norman B. Williamson
(05/18/1932) | Director/ Chairman | Indefinite and since inception | Private Investor | 1 | None |
| | | | | | |
CLIPPER FUNDSM
2949 East Elvira Road, Suite 101
Tucson, Arizona 85756
OFFICERS
Christopher C. Davis (born 7/13/65, Clipper Fund officer since 12/19/05). President of Clipper Fund. Chairman, Davis Selected Advisers, L.P., and also serves as an executive officer in certain companies affiliated with the Adviser, including sole member of the Adviser’s general partner, Davis Investments, LLC; Chief Executive Officer, President or Vice President of each of the Davis Funds (consisting of 13 portfolios), and Selected Funds (consisting of three portfolios); Employee of Shelby Cullom Davis & Co. (registered broker/dealer). Director of the Washington Post (media and publishing company).
Kenneth C. Eich (born 8/14/53, Clipper Fund officer since 12/19/05). Executive Vice President and Principal Executive Officer of Clipper Fund, each of the Davis Funds (consisting of 13 portfolios), and Selected Funds (consisting of three portfolios); Chief Operating Officer, Davis Selected Advisers, L.P.; and also serves as an executive officer in certain companies affiliated with the Adviser.
Douglas A. Haines (born 3/4/71, Clipper Fund officer since 12/19/05). Vice President, Treasurer, Chief Financial Officer, Principal Financial Officer, and Principal Accounting Officer of Clipper Fund, each of the Davis Funds (consisting of 13 portfolios), and Selected Funds (consisting of three portfolios); Vice President and Director of Fund Accounting, Davis Selected Advisers, L.P.
Sharra L. Haynes (born 9/25/66, Clipper Fund officer since 12/19/05). Vice President, Chief Compliance Officer of Clipper Fund, each of the Davis Funds (consisting of 13 portfolios), and Selected Funds (consisting of three portfolios); Vice President and Chief Compliance Officer, Davis Selected Advisers, L.P.; and also serves as an executive officer in certain companies affiliated with the Adviser.
Thomas D. Tays (born 3/7/57, Clipper Fund officer since 12/19/05). Vice President and Secretary of Clipper Fund; each of the Davis Funds (consisting of 13 portfolios), and Selected Funds (consisting of three portfolios); Vice President, Chief Legal Officer and Secretary, Davis Selected Advisers, L.P.; and also serves as an executive officer in certain companies affiliated with the Adviser.
CLIPPER FUNDSM
2949 East Elvira Road, Suite 101
Tucson, Arizona 85756
Investment Adviser | |
Davis Selected Advisers, L.P. (Doing business as “Davis Advisors”) | |
2949 East Elvira Road, Suite 101 | |
Tucson, Arizona 85756 | |
(800) 432-2504 | |
| |
Distributor | |
Davis Distributors, LLC | |
2949 East Elvira Road, Suite 101 | |
Tucson, Arizona 85756 | |
| |
Transfer Agent | |
Boston Financial Data Services, Inc. | |
P.O. Box 55468 | |
Boston, Massachusetts 02205-5468 | |
| |
Custodian | |
State Street Bank and Trust Co. | |
One Lincoln Street | |
Boston, Massachusetts 02111 | |
| |
Counsel | |
Paul, Hastings, Janofsky & Walker, LLP | |
515 South Flower Street, 25th Floor | |
Los Angeles, CA 90071 | |
| |
Independent Registered Public Accounting Firm | |
KPMG LLP | |
707 Seventeenth Street, Suite 2700 | |
Denver, Colorado 80202 | |
For more information about Clipper Fund including management fee, charges, and expenses, see the current prospectus, which must precede or accompany this report. The Fund’s Statement of Additional Information contains additional information about the Fund’s Directors and is available upon request, free of charge, by contacting the Fund at 800-432-2504 or on the Fund’s website at www.clipperfund.com.
ITEM 2. CODE OF ETHICS
Not Applicable
ITEM 3. AUDIT COMMITTEE FINANCIAL EXPERT
The Fund’s Board of Directors has determined that independent trustee Steven N. Kearsley qualifies as the “audit committee financial expert”, as defined in Item 3 of form N-CSR.
ITEM 4. PRINCIPAL ACCOUNTANT FEES AND SERVICES
Not Applicable
ITEM 5. AUDIT COMMITTEE OF LISTED REGISTRANTS
Not Applicable
ITEM 6. SCHEDULE OF INVESTMENTS
Not Applicable. The complete Schedule of Investments is included in Item 1 of this for N-CSR
ITEM 7. DISCLOSURE OF PROXY VOTING POLICIES AND PROCEDURES FOR CLOSED-END MANAGEMENT INVESTMENT COMPANIES
Not Applicable
ITEM 8. PORTFOLIO MANAGERS OF CLOSED-END MANAGEMENT INVESTMENT COMPANIES
Not Applicable
ITEM 9. PURCHASES OF EQUITY SECURITIES BY CLOSED-END MANAGEMENT INVESTMENT COMPANIES AND AFFILIATED PURCHASERS
Not Applicable
ITEM 10. SUBMISSION OF MATTERS TO A VOTE OF SECURITY HOLDERS
There have been no changes to the procedure by which shareholders may recommend nominees to the registrant’s Board of Trustees.
ITEM 11. CONTROLS AND PROCUDURES
| (a) | The registrant’s principal executive officer and principal financial officer have concluded that the registrant’s disclosure controls and procedures (as defined in Rule 30a-3 (c) under the Investment Company Act of 1940, as amended) are effective as of a date within 90 days of the filing date of this report. |
| (b) | There have been no significant changes in the registrant’s internal controls or in other factors that could significantly affect these controls. |
ITEM 12. EXHIBITS
(a)(1) Not Applicable
(a)(2) Certifications pursuant to Section 302 of the Sarbanes-Oxley Act of 2002 are attached.
(a)(3) Not Applicable
(b) Certifications pursuant to Section 906 of the Sarbanes-Oxley Act of 2002 are attached.
SIGNATURES
Pursuant to the requirements of the Securities Exchange Act of 1934 and the Investment Company Act of 1940, the registrant has duly caused this report to be signed on its behalf by the undersigned, thereunto duly authorized.
CLIPPER FUND, INC.
| Principal Executive Officer |
Date: September 5, 2008
Pursuant to the requirements of the Securities Exchange Act of 1934 and the Investment Company Act of 1940, this report has been signed below by the following persons on behalf of the registrant and in the capacities and on the dates indicated.
| Principal Executive Officer |
Date: September 5, 2008
| Principal Financial Officer |
Date: September 5, 2008