UNITED STATES
SECURITIES AND EXCHANGE COMMISSION
Washington, DC 20549
FORM N-CSR
CERTIFIED SHAREHOLDER REPORT OF REGISTERED MANAGEMENT INVESTMENT COMPANY
Investment Company Act file number 811-03931
CLIPPER FUND, INC.
(Exact name of registrant as specified in charter)
2949 East Elvira Road, Suite 101
Tucson, AZ 85756
(Address of principal executive offices)
Ryan M. Charles
Davis Selected Advisers, L.P.
2949 East Elvira Road, Suite 101
Tucson, AZ 85756
(Name and address of agent for service)
Registrant’s telephone number, including area code: 520-806-7600
Date of fiscal year end: December 31, 2013
Date of reporting period: December 31, 2013
____________________
ITEM 1. REPORT TO STOCKHOLDERS
Cautionary Statement
Davis Advisors is committed to communicating with our investment partners as candidly as possible because we believe our investors benefit from understanding our investment philosophy and approach. Our views and opinions regarding the investment prospects of our portfolio holdings include “forward looking statements” which may or may not be accurate over the long term. While we believe we have a reasonable basis for our appraisals and we have confidence in our opinions, actual results may differ materially from those we anticipate. These opinions are current as of the date of this report but are subject to change. The information provided in this report should not be considered a recommendation to buy, sell, or hold any particular security.
You can identify forward looking statements by words like “believe,” “expect,” “anticipate,” or similar expressions when discussing prospects for particular portfolio holdings and/or of the Fund. We cannot assure future results and achievements. You should not place undue reliance on forward looking statements, which speak only as of the date of this report. We disclaim any obligation to update or alter any forward looking statements, whether as a result of new information, future events, or otherwise. This material must be preceded or accompanied by a prospectus. Please read the prospectus carefully for a discussion of investment objectives, risks, fees, and expenses. Current performance may be lower or higher than the performance quoted herein. You may obtain a current copy of the Fund’s Prospectus or more current performance information by calling Investor Services at 1-800-432-2504 or on Clipper Fund’s website (www.clipperfund.com).
Clipper Fund Shareholders Meeting
Davis Advisors cordially invites you to the 2014 Clipper Fund Shareholders Meeting with Portfolio Managers Christopher Davis and Danton Goei to be held on Thursday, March 27th.
| The Fund managers will discuss the investment approach and Portfolio. A question-and-answer session will follow. |
| | |
| Location: | The Peninsula Hotel Beverly Hills |
| | 9882 South Santa Monica Boulevard |
| | Beverly Hills, CA 90212 |
| | Magnolia Room |
| | |
| Time: | 9:30 A.M. – 11:00 A.M. (PDT) |
| | |
| Attendees: | Clipper Fund shareholders, consultants, and other interested parties. |
For more information, please call 800-432-2504.
CLIPPER FUNDSM | Table of Contents |
| Shareholder Letter | 2 |
| | |
| Management’s Discussion of Fund Performance | 8 |
| | |
| Fund Overview | 10 |
| | |
| Expense Example | 11 |
| | |
| Schedule of Investments | 12 |
| | |
| Statement of Assets and Liabilities | 14 |
| | |
| Statement of Operations | 15 |
| | |
| Statements of Changes in Net Assets | 16 |
| | |
| Notes to Financial Statements | 17 |
| | |
| Financial Highlights | 22 |
| | |
| Report of Independent Registered Public Accounting Firm | 23 |
| | |
| Federal Income Tax Information | 24 |
| | |
| Privacy Notice and Householding | 25 |
| | |
| Directors and Officers | 26 |
This Annual Report is authorized for use by existing shareholders. Prospective shareholders must receive a current Clipper Fund Prospectus, which contains more information about investment strategies, risks, fees, and expenses. Please read the prospectus carefully before investing or sending money.
Shares of Clipper Fund are not deposits or obligations of any bank, are not guaranteed by any bank, are not insured by the FDIC or any other agency, and involve investment risks, including possible loss of the principal amount invested.
Portfolio Proxy Voting Policies and Procedures
The Fund has adopted Portfolio Proxy Voting Policies and Procedures under which the Fund votes proxies relating to securities held by the Fund. A description of the Fund’s Portfolio Proxy Voting Policies and Procedures is available (i) without charge, upon request, by calling the Fund toll-free at 1-800-432-2504, (ii) on the Fund’s website at www.clipperfund.com, and (iii) on the SEC’s website at www.sec.gov.
In addition, the Fund is required to file Form N-PX, with its complete proxy voting record for the 12 months ended June 30th, no later than August 31st of each year. The Fund’s Form N-PX filing is available (i) without charge, upon request, by calling the Fund toll-free at 1-800-432-2504, (ii) on the Fund’s website at www.clipperfund.com, and (iii) on the SEC’s website at www.sec.gov.
Form N-Q
The Fund files its complete schedule of portfolio holdings with the SEC for the first and third quarters of each fiscal year on Form N-Q. The Fund’s Form N-Q is available without charge, upon request, by calling 1-800-432-2504, on the Fund’s website at www.clipperfund.com, and on the SEC’s website at www.sec.gov. The Fund’s Form N-Q may be reviewed and copied at the SEC’s Public Reference Room in Washington, DC, and information on the operation of the Public Reference Room may be obtained by calling 1-800-SEC-0330.
CLIPPER FUNDSM | Shareholder Letter |
The chart below summarizes results through December 31, 2013 for Clipper Fund. As the Fund’s managers, my colleagues and I at Davis Advisors have two objectives: to earn a satisfactory absolute investment return and to generate relative results in excess of the S&P 500® Index. In our view, the data in the chart below presents a mixed but improving picture. Since we were entrusted with the management of Clipper in 2006, we have generated an absolute return of 4.5% per year versus the 7.3% return of the S&P 500® Index.1 This result falls short of both of our goals. However, for the last five years, we have generated a return of 19.5% per year versus 17.9% for the S&P 500® Index. On a relative basis we consider outperformance by 1.6% more than satisfactory. On an absolute basis, we are pleased to report these results rank as the best five year stretch since Davis Advisors assumed management of the Fund. We still have ground to make up but are pleased to report this progress.
| Average Annual Total Returns as of December 31, 2013 |
| | 1 Year | 3 Years | 5 Years | 10 Years | Since Davis assumed management (1/1/06) | Since Inception (2/29/84) |
| Clipper Fund | 34.22% | 15.53% | 19.48% | 4.10% | 4.45% | 11.89% |
S&P 500® Index | 32.39% | 16.18% | 17.94% | 7.41% | 7.29% | 11.31% |
The performance presented represents past performance and is not a guarantee of future results. Total return assumes reinvestment of dividends and capital gain distributions. Investment return and principal value will vary so that, when redeemed, an investor’s shares may be worth more or less than their original cost. The total annual operating expense ratio as of the most recent prospectus was 0.75%. The total annual operating expense ratio may vary in future years. Current performance may be higher or lower than the performance quoted. For most recent month-end performance, visit clipperfund.com or call 800-432-2504. The Fund received favorable class action settlements from companies that it no longer owns. These settlements had a material impact on the investment performance of the Fund in 2009 and 2013. These were one-time events that are unlikely to be repeated. Clipper Fund was managed from inception, February 29, 1984, until December 31, 2005 by another Adviser. Davis Selected Advisers, L.P. took over management of the Fund on January 1, 2006.
As always, our goal in preparing these reports is to provide the information we would want if our positions were reversed and we were investors in rather than the manager of Clipper Fund. At Davis Advisors, this mindset is not just theoretical but is grounded in the fact that we, our colleagues and our families have more that $100 million of our own money invested in Clipper Fund alongside our shareholders.2 As a result, making decisions and communicating based on what best serves Fund shareholders is second nature to us.
With this perspective in mind, we would like to discuss two topics in this report. First, we want to provide some perspective on our decision to ask my longtime colleague Danton Goei to join me as comanager of Clipper Fund. Second, we want to provide an update on the Portfolio as well as offer some insight into our conviction that the Portfolio is well positioned in today’s uncertain world both to generate long-term growth and to weather the inevitable storms and shocks that can occur any time.
Our Investment Team
Starting with our investment team, in mid December last year, we announced that after working together since 1998, Danton Goei would join me as comanager of Clipper Fund and our firm’s other large cap equity portfolios effective January 1, 2014. At the same time, we asked Ken Feinberg to step down. We thank Ken for his service and wish him the best.
_____________________________
This report includes candid statements and observations regarding investment strategies, individual securities, and economic and market conditions; however, there is no guarantee that these statements, opinions or forecasts will prove to be correct. Equity markets are volatile and an investor may lose money. Past performance is not a guarantee of future results.
1 Past performance is not a guarantee of future results.
2 As of December 31, 2013.
Not a part of Annual Report to Fund shareholders
CLIPPER FUNDSM | Shareholder Letter – (Continued) |
As fellow investors, we made this decision because we believe it will lead to better investment results in the years ahead. In coming to this conclusion, we considered a number of factors, the most important of which is Danton’s proven investment ability. His research has been the foundation of many of our successful investments over the last 15 years in a range of different industries, including many of our current holdings. As a member of our analyst team, Danton’s stock recommendations for our larger diversified funds, including Davis New York Venture Fund and Selected American Shares, have meaningfully added to Fund returns.3 In fact, we have had such high regard for Danton’s contribution that we have singled him out more than any other individual in our shareholder commentaries over the years. Although we would caution that these other funds are not directly comparable to Clipper, his performance as one of our most influential contributors was another important consideration in our decision.
Beyond his talent as an investor, Danton also embodies the stewardship culture, research approach, investment philosophy, and valuation discipline of our firm. Given our focus on culture when evaluating potential investments, shareholders should not be surprised that culture played a role in this decision. On a personal level, Danton’s work ethic, modesty and humor make him a collegial as well as a capable partner that I look forward to working with in the years and decades ahead. In sum, as stewards of our clients’ savings, our responsibility is to field the best team we can. Danton’s results and character have earned him this place in our starting lineup.
Market Outlook
Turning to the Portfolio, strong market returns over the last five years have divided investors into two camps. The first camp includes those who worry because stock prices have gone up so much the market must be due for a fall. These investors point out the S&P 500® Index now trades a bit above the highs of 2000 and 2007, both of which preceded a steep market decline. The second camp includes those who have been heartened by the price increases and are anxious to jump on the bandwagon for fear of missing out. These investors are quick to point out because the world seems far less risky than it did during the dark days of the financial crisis now is a better time to invest.
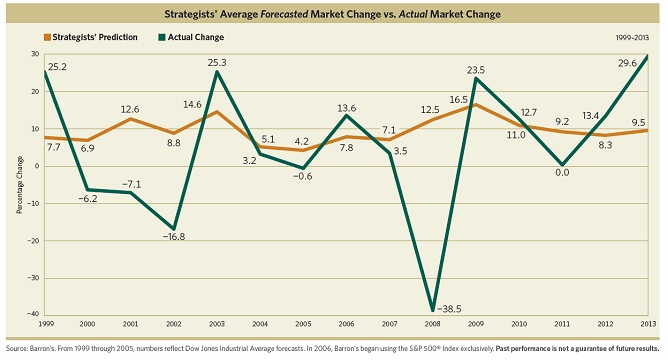
Although one of these camps will ultimately prove to be correct both their forecasts rest on the faulty assumption that short-term changes in stock prices are predictable when the overwhelming evidence suggests that they are not. For example, in the chart below, the gray line represents investment strategists’ average forecast for stock market returns in the following 12 months. The black line shows what actually happened. As far as we can tell, these lines are uncorrelated.
___________________________ 3 This is not a solicitation for Davis New York Venture Fund or Selected American Shares.
Not a part of Annual Report to Fund shareholders
CLIPPER FUNDSM | Shareholder Letter – (Continued) |
Beyond the folly of short-term market predictions, investors in both camps are making a second mistake by focusing on price rather than value. Because stocks represent ownership interests in real underlying businesses, discussing the price of a stock without reference to the value of the underlying business makes no sense. Bearing in mind the old saying “price is what you pay, value is what you get,” a closer look makes clear both the pessimists and the optimists are overlooking some important facts.
The pessimists who point out the market fell sharply in the years following the high prices reached in 2000 and 2007 are forgetting stocks purchased today are a much better value than those purchased in 2000 or in 2007 for the simple reason the underlying businesses are more profitable and less leveraged. To understand why this is important, imagine two hypothetical businesses for sale in your hometown. The first has a price of $1.5 million and generates annual earnings of $50,000 per year. The second has a price of $1.8 million and generates annual earnings of $100,000 per year. Although the price of the second business is slightly higher, its much higher earnings clearly make it a better value. Looking back to the market high in 2000, the math is almost identical for the companies that make up the S&P 500® Index. At that time, the market as measured by the S&P 500® Index was priced at about 1,500 while the earnings of companies underlying the Index were only $51 per share. Today the market sells at a price around 1,800 but the underlying companies generate earnings around $108 per share making them a far better value. Similarly, since the highs of 2007 just before the financial crisis, the earnings of companies underlying the Index have climbed from $83 per share then to $108 per share today, while at the same time companies have significantly reduced leverage. In short, by simply comparing today’s share prices to past market highs, the pessimists overlook the significant increase in the value of the underlying businesses.4
On the other hand, the optimists who point out that because the world seems less risky than it did during the dark days of the financial crisis now must be a safer time to invest are forgetting that, all other things being equal, higher prices may increase risk and reduce future returns. Investors buying stocks today are paying 30% more than if they bought one year ago while underlying earnings have only grown about 12%. This diminished gap between price and value leaves investors today with the prospect of lower future returns and a reduced margin of safety. Instead of feeling reassured by today’s higher prices, the optimists should acknowledge a rapid increase in prices is not good news for long-term investors.
Portfolio Review
That said, where do we stand? In managing Clipper Fund, we are neither optimistic nor pessimistic but realistic. Though our realistic approach may seem too restrained to the optimists and too confident to the pessimists, it recognizes the inherent uncertainty investors always face not just in trying to predict stock prices but in trying to predict all sorts of short-term variables from economic growth rates to interest rates to geopolitical developments.
By accepting that uncertainty is a constant, we can focus on the more realistic question of how best to invest in an uncertain world. Framed this way, the answer seems clearer. Investors should build a portfolio able to withstand downturns while also generating long-term growth. This is exactly our objective in managing Clipper Fund.
With our focus on balance sheet strength, proven management and durable business models, we look for companies with the resilience to weather the inevitable shocks and disruptions that can come at any time. Such strength allowed companies like Wells Fargo and Bank of New York Mellon to weather the worst financial crisis since the Depression.5 It enabled companies like Costco and Bed Bath & Beyond to grow despite the Great Recession and consolidation in the retail sector. And it has allowed healthcare companies like UnitedHealth Group and CVS Caremark to navigate the uncertainty and changing regulation associated with health care reform.
___________________________ 4 Source: Bloomberg.com, http://www.irrationalexuberance.com/ and Davis Advisors. Earnings per share are based on the reported income of the S&P 500® Index member companies. The S&P 500 Index high for the year 2000 was 1,527 on 3/24/00. Earnings per share for March 2000 were $50.94 and for March 2007 were $83.15. The market was 1,848 on 12/31/13. Earnings for today are represented by the 2013 full-year earnings estimate.
5 Individual securities are discussed in this piece. While we believe we have a reasonable basis for our appraisals and we have confidence in our opinions, actual results may differ materially from those we anticipate. The return of a security to the Fund will vary based on weighting and timing of purchase. This is not a recommendation to buy, sell or hold any specific security. Past performance is not a guarantee of future results.
Not a part of Annual Report to Fund shareholders
CLIPPER FUNDSM | Shareholder Letter – (Continued) |
At the same time, with our focus on secular growth, competitive advantages, global leadership, and innovation, we also seek out companies that can generate the growth needed to build wealth over the long term. Companies like Google and Texas Instruments use innovation to unleash technology’s potential across a range of applications. American Express is a leader in transforming the global payments industry and as such benefits not just from increasing consumer spending but also from market share growth and the long-term transition away from cash and checks. The fact the Internet does not accept cash makes the explosive growth of Internet commerce an additional tailwind. Finally, LabCorp benefits from both the growing demand for diagnostic testing and the market share gains that accrue to the low cost provider in a large and fragmented industry.
As investors in an uncertain world, one final characteristic that we seek is adaptability. Very few business models can be carved in stone and a number of our important holdings are companies with a proven record of adaptability. For example, roughly 50 years ago Berkshire Hathaway was nothing more than a New England-based textile mill. Today the company is one of the most valuable conglomerates in the world with leading positions in businesses ranging from insurance to railroads. As another example, 50 years ago Loews was a chain of movie theaters that today has been transformed into a diversified holding company including operations in insurance, hotels and energy. Finally, 50 years ago Alleghany Corporation operated railroads. Today the company is a leader in specialty insurance and reinsurance. These examples are worth highlighting because they remind us that in a changing world standing still is not an option. Long-term success requires constant learning and a willingness to change.
This brings us full circle. We began this report by sharing with you our thoughts about a change in our investment team with the addition of Danton as my new comanager in overseeing Clipper Fund. We went on to discuss why we believe the Portfolio is well positioned in an uncertain world both to weather the inevitable storms and to build wealth over the long term. And we ended by highlighting the importance of adaptability and a willingness to change. Although we cannot know what the immediate future holds, we have never had more confidence in the strength, resiliency, capability, growth prospects, and adaptability of our Portfolio companies, our investment team or our firm.
On behalf of all of our colleagues, we thank you for the trust you have placed in us and look forward to reporting to you in the years ahead.
We thank you for your continued trust.
Sincerely,
 |
| Christopher C. Davis |
| President & Portfolio Manager |
| |
| February 3, 2014 |
Not a part of Annual Report to Fund shareholders
CLIPPER FUNDSM | Shareholder Letter – (Continued) |
This report is authorized for use by existing shareholders. A current Clipper Fund prospectus must accompany or precede this material if it is distributed to prospective shareholders. You should carefully consider the Fund’s investment objective, risks, fees, and expenses before investing. Read the prospectus carefully before you invest or send money.
This report includes candid statements and observations regarding investment strategies, individual securities, and economic and market conditions; however, there is no guarantee that these statements, opinions or forecasts will prove to be correct. These comments may also include the expression of opinions that are speculative in nature and should not be relied on as statements of fact.
Objective and Risks. Clipper Fund’s investment objective is long-term capital growth and capital preservation. There can be no assurance that the Fund will achieve its objective. The Fund invests primarily in equity securities issued by large companies with market capitalizations of at least $10 billion. Some important risks of an investment in the Fund are: stock market risk: stock markets have periods of rising prices and periods of falling prices, including sharp declines; manager risk: poor security selection may cause the Fund to underperform relevant benchmarks; common stock risk: an adverse event may have a negative impact on a company and could result in a decline in the price of its common stock; large-capitalization companies risk: companies with $10 billion or more in market capitalization generally experience slower rates of growth in earnings per share than do mid- and small-capitalization companies; mid- and small-capitalization companies risk: companies with less than $10 billion in market capitalization typically have more limited product lines, markets and financial resources than larger companies, and may trade less frequently and in more limited volume; headline risk: the Fund may invest in a company when the company becomes the center of controversy. The company’s stock may never recover or may become worthless; focused portfolio risk: investing in a limited number of companies causes changes in the value of a single security to have a more significant effect on the value of the Fund’s total portfolio; financial services risk: investing a significant portion of assets in the financial services sector may cause the Fund to be more sensitive to systemic risk, regulatory actions, changes in interest rates, non-diversified loan portfolios, credit, and competition; foreign country risk: foreign companies may be subject to greater risk as foreign economies may not be as strong or diversified. As of December 31, 2013, the Fund had approximately 10.5% of assets invested in foreign companies; depositary receipts risk: depositary receipts may trade at a discount (or premium) to the underlying security and may be less liquid than the underlying securities listed on an exchange; and fees and expenses risk: the Fund may not earn enough through income and capital appreciation to offset the operating expenses of the Fund. See the prospectus for a complete description of the principal risks.
Davis Advisors is committed to communicating with our investment partners as candidly as possible because we believe our investors benefit from understanding our investment philosophy and approach. Our views and opinions include “forward-looking statements” which may or may not be accurate over the long term. Forward-looking statements can be identified by words like “believe,” “expect,” “anticipate,” or similar expressions. You should not place undue reliance on forward-looking statements, which are current as of the date of this report. We disclaim any obligation to update or alter any forward-looking statements, whether as a result of new information, future events, or otherwise. While we believe we have a reasonable basis for our appraisals and we have confidence in our opinions, actual results may differ materially from those we anticipate.
The information provided in this material should not be considered a recommendation to buy, sell, or hold any particular security. As of December 31, 2013, the top ten holdings of Clipper Fund were:
| American Express Co. | 14.97% |
| Berkshire Hathaway Inc., Class A | 10.06% |
| CVS Caremark Corp. | 9.79% |
| Costco Wholesale Corp. | 8.70% |
| Bank of New York Mellon Corp. | 7.21% |
| Canadian Natural Resources Ltd. | 6.53% |
| Google Inc., Class A | 5.36% |
| Alleghany Corp. | 4.59% |
| Loews Corp. | 4.32% |
| Laboratory Corp. of America Holdings | 3.01% |
Not a part of Annual Report to Fund shareholders
CLIPPER FUNDSM | Shareholder Letter – (Continued) |
Clipper Fund has adopted a Portfolio Holdings Disclosure policy that governs the release of non-public portfolio holding information. This policy is described in the prospectus. Holding percentages are subject to change. Visit clipperfund.com or call 800-432-2504 for the most current public portfolio holdings information.
Broker-dealers and other financial intermediaries may charge Davis Advisors substantial fees for selling its funds and providing continuing support to clients and shareholders. For example, broker-dealers and other financial intermediaries may charge: sales commissions; distribution and service fees; and record-keeping fees. In addition, payments or reimbursements may be requested for: marketing support concerning Davis Advisors’ products; placement on a list of offered products; access to sales meetings, sales representatives and management representatives; and participation in conferences or seminars, sales or training programs for invited registered representatives and other employees, client and investor events, and other dealer-sponsored events. Financial advisors should not consider Davis Advisors’ payment(s) to a financial intermediary as a basis for recommending Davis Advisors.
We gather our index data from a combination of reputable sources, including, but not limited to, Thomson Financial, Lipper and index websites.
The S&P 500® Index is an unmanaged index of 500 selected common stocks, most of which are listed on the New York Stock Exchange. The Index is adjusted for dividends, weighted towards stocks with large market capitalizations and represents approximately two-thirds of the total market value of all domestic common stocks. Investments cannot be made directly in an index.
After April 30, 2014, this material must be accompanied by a supplement containing performance data for the most recent quarter end.
Shares of the Clipper Fund are not deposits or obligations of any bank, are not guaranteed by any bank, are not insured by the FDIC or any other agency, and involve investment risks, including possible loss of the principal amount invested.
12/13 Davis Distributors, LLC, 2949 East Elvira Road, Suite 101, Tucson, AZ 85756, 800-432-2504, clipperfund.com.
Not a part of Annual Report to Fund shareholders
CLIPPER FUNDSM | Management’s Discussion of Fund Performance |
Performance Overview
Clipper Fund delivered a total return on net asset value of 34.22% for the year ended December 31, 2013. Over the same time period, the Standard & Poor’s 500® Index (“Index”) returned 32.39%. The Index turned in a strong performance with every sector1 within the Index returning positive results, increasing from as much as 43% (Consumer Discretionary) to a low of 11% (Telecommunication Services). The sectors within the Index that turned in the strongest performance over the year were Consumer Discretionary and Health Care. The sectors within the Index that turned in the weakest (but still positive) performance over the year were Telecommunication Services and Utilities.
The Fund’s Absolute Performance
Financial companies were the most important contributor2 to the Fund’s absolute performance over the year. American Express3, Berkshire Hathaway, Bank of New York Mellon, Oaktree, Ameriprise Financial, and Loews were among the most important contributors to performance. RHJ International was among the most important detractors from performance.
Consumer Staple companies were the second most important contributor to the Fund’s absolute performance. CVS Caremark and Costco Wholesale were among the most important contributors to performance. Brasil Pharma was among the most important detractors from performance.
Information Technology companies were also an important contributor to the Fund’s absolute performance. Google was among the most important contributors to performance.
The Fund had approximately 10% of its net assets invested in foreign companies at December 31, 2013. As a whole, those companies under-performed the domestic companies held by the Fund. The Fund’s performance benefited modestly from the recovery of shares, related to a class action settlement from 2005, and subsequent sale thereof (Interpublic Group).
The Fund’s Relative Performance
Information Technology companies were the most important contributor to the Fund’s performance relative to the Index over the year. The Fund’s Information Technology companies out-performed the corresponding sector within the Index and had a lower average weighting.
Financial Companies were the second most important contributor to the Fund’s relative performance. The Fund’s Financial companies out-performed the corresponding sector within the Index and had a higher average weighting.
Health Care companies were the most important detractor from the Fund’s relative performance. The Fund’s Health Care companies under-performed the corresponding sector within the Index and had a lower average weighting.
Consumer Discretionary companies were the second most important detractor from the Fund’s relative performance. The Fund’s Consumer Discretionary companies out-performed the corresponding sector within the Index and had a lower average weighting.
The Fund’s cash position over the year detracted from relative performance in a rising market.
Clipper Fund’s investment objective is to seek long-term capital growth and capital preservation. There can be no assurance that the Fund will achieve its objective. Clipper Fund’s principal risks are: stock market risk, manager risk, common stock risk, large-capitalization companies risk, mid- and small-capitalization companies risk, focused portfolio risk, financial services risk, foreign country risk, depositary receipts risk, headline risk, and fees and expenses risk. See the prospectus for a full description of each risk.
Clipper Fund focuses its investments in fewer companies, and it may be subject to greater risks than a more diversified fund that is not allowed to focus its investments in a few companies. The Fund’s investment performance, both good and bad, is expected to reflect the economic performance of its more focused portfolio.
1 The companies included in the Standard & Poor’s 500® Index are divided into ten sectors. One or more industry groups make up a sector.
2 A company’s or sector’s contribution to or detraction from the Fund’s performance is a product both of its appreciation or depreciation and its weighting within the Fund. For example, a 5% holding that rises 20% has twice as much impact as a 1% holding that rises 50%.
3 This Management Discussion of Fund Performance discusses a number of individual companies. The information provided in this report does not provide information reasonably sufficient upon which to base an investment decision and should not be considered a recommendation to purchase or sell any particular security. The Schedule of Investments lists the Fund’s holdings of each company discussed.
CLIPPER FUNDSM | Management’s Discussion of Fund Performance – (Continued) |
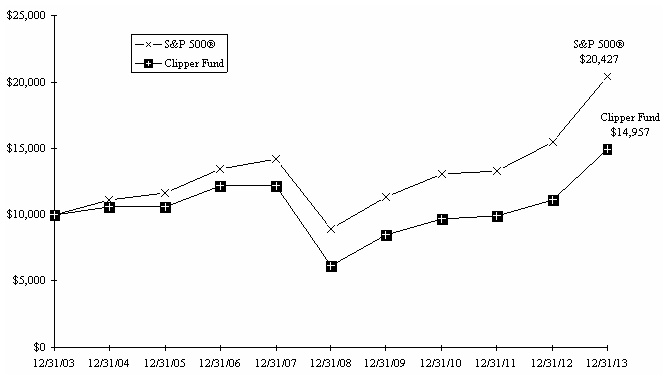
Comparison of a $10,000 investment in Clipper Fund versus the Standard & Poor’s 500® Index over 10
years for an investment made on December 31, 2003
Average Annual Total Return for periods ended December 31, 2013
Fund & Benchmark Index | 1-Year | 5-Year | 10-Year | Since Fund’s Inception (02/29/84) | Gross Expense Ratio | Net Expense Ratio |
| Clipper Fund | 34.22% | 19.48% | 4.10% | 11.89% | 0.74% | 0.74% |
Standard & Poor’s 500® Index | 32.39% | 17.94% | 7.41% | 11.31% | | |
In 2009, the Fund received favorable class action settlements from companies which it no longer owns. These settlements had a material impact on the investment performance of the Fund, adding approximately 5% to the Fund’s total return in 2009. In 2013, the Fund’s performance benefited modestly from the recovery of shares related to a class action settlement from 2005. These were one-time events that are unlikely to be repeated.
The Standard & Poor’s 500® Index is an unmanaged index of 500 selected common stocks, most of which are listed on the New York Stock Exchange. The Index is adjusted for dividends, weighted towards stocks with large market capitalizations, and represents approximately two-thirds of the total market value of all domestic common stocks. Investments cannot be made directly in the Index.
The performance data for Clipper Fund contained in this report represents past performance, assumes that all distributions were reinvested, and should not be considered as an indication of future performance from an investment in the Fund today. The investment return and principal value will fluctuate so that shares may be worth more or less than their original cost when redeemed. Fund performance changes over time and current performance may be higher or lower than stated. Returns shown do not reflect the deduction of taxes that a shareholder would pay on fund distributions or the redemption of fund shares. The operating expense ratio may vary in future years. For more current information please call Clipper Fund Investor Services at 1-800-432-2504.
Davis Selected Advisers, L.P. began serving as investment adviser to Clipper Fund on January 1, 2006. A different investment adviser managed the Fund through December 31, 2005.
CLIPPER FUNDSM | Fund Overview |
| | December 31, 2013 |
| Portfolio Composition | | Industry Weightings |
| (% of Fund’s 12/31/13 Net Assets) | | (% of 12/31/13 Stock Holdings) |
| | | | | | |
| | | | | Fund | S&P 500® |
| Common Stock (U.S.) | 89.42% | | Diversified Financials | 40.06% | 8.44% |
| Common Stock (Foreign) | 10.47% | | Food & Staples Retailing | 18.76% | 2.34% |
| Short-Term Investments | 0.24% | | Insurance | 11.89% | 3.01% |
| Other Assets & Liabilities | (0.13)% | | Information Technology | 11.36% | 18.63% |
| | 100.00% | | Energy | 6.53% | 10.28% |
| | | | Health Care | 4.90% | 12.95% |
| | | | Banks | 3.65% | 2.85% |
| | | | Retailing | 1.68% | 4.48% |
| | | | Food, Beverage & Tobacco | 1.17% | 5.26% |
| | | | Capital Goods | – | 8.29% |
| | | | Media | – | 3.71% |
| | | | Materials | – | 3.50% |
| | | | Utilities | – | 2.92% |
| | | | Other | – | 13.34% |
| | | | | 100.00% | 100.00% |
Top 10 Long-Term Holdings
(% of Fund’s 12/31/13 Net Assets)
| | | |
| American Express Co. | Consumer Finance | 14.97% |
| Berkshire Hathaway Inc., Class A | Diversified Financial Services | 10.06% |
| CVS Caremark Corp. | Food & Staples Retailing | 9.79% |
| Costco Wholesale Corp. | Food & Staples Retailing | 8.70% |
| Bank of New York Mellon Corp. | Capital Markets | 7.21% |
| Canadian Natural Resources Ltd. | Energy | 6.53% |
| Google Inc., Class A | Software & Services | 5.36% |
| Alleghany Corp. | Reinsurance | 4.59% |
| Loews Corp. | Multi-line Insurance | 4.32% |
| Laboratory Corp. of America Holdings | Health Care Equipment & Services | 3.01% |
New Positions Added (01/01/13 - 12/31/13)
(Highlighted positions are those greater than 3.00% of the Fund’s 12/31/13 net assets)
| | | Date of 1st | % of Fund’s 12/31/13 |
| Security | Industry | Purchase | Net Assets |
| | | |
| ASAC II L.P., Private Placement | Software & Services | 10/10/13 | 2.18% |
| Interpublic Group of Cos, Inc. | Media | 05/08/13 | – |
| Laboratory Corp. of America Holdings | Health Care Equipment & Services | 05/17/13 | 3.01% |
| UnitedHealth Group Inc. | Health Care Equipment & Services | 05/17/13 | 1.89% |
Positions Closed (01/01/13 - 12/31/13)
(Gains and losses greater than $4,000,000 are highlighted)
| | | Date of | Realized |
| Security | Industry | Final Sale | Gain (Loss) |
| | | |
| Goldman Sachs Group, Inc. | Capital Markets | 07/17/13 | | $ | 4,937,430 |
| Harley-Davidson, Inc. | Automobiles & Components | 02/14/13 | | (27,747) |
| Interpublic Group of Cos, Inc. | Media | 05/17/13 | | 2,123,527 |
CLIPPER FUNDSM | Expense Example |
As a shareholder of the Fund, you incur ongoing costs only, including advisory and administrative fees and other Fund expenses. The Expense Example is intended to help you understand your ongoing costs (in dollars) of investing in the Fund and to compare these costs with the ongoing costs of investing in other mutual funds. The Expense Example is based on an investment of $1,000 invested at the beginning of the period and held for the entire period indicated, which is for the six-month period ended December 31, 2013.
Actual Expenses
The information represented in the row entitled “Actual” provides information about actual account values and actual expenses. You may use the information in this row, together with the amount you invested, to estimate the expenses that you paid over the period. Simply divide your account value by $1,000 (for example, an $8,600 account value divided by $1,000 = 8.6), then multiply the result by the number under the heading “Expenses Paid During Period” to estimate the expenses you paid on your account during this period. An annual maintenance fee of $10, charged on retirement plan accounts per Social Security Number, is not included in the Expense Example. If this fee was included, the estimate of expenses you paid during the period would be higher, and your ending account value would be lower, by this amount.
Hypothetical Example for Comparison Purposes
The information represented in the row entitled “Hypothetical” provides information about hypothetical account values and hypothetical expenses based on the Fund’s actual expense ratio and an assumed rate of return of 5% per year before expenses, which is not the Fund’s actual return. The hypothetical account values and expenses may not be used to estimate the actual ending account balance or expenses you paid for the period. You may use this information to compare the ongoing costs of investing in the Fund and other funds. To do so, compare this 5% hypothetical example with the 5% hypothetical examples that appear in the shareholder reports of the other funds. An annual maintenance fee of $10, charged on retirement plan accounts per Social Security Number, is not included in the Expense Example. If this fee was included, the estimate of expenses you paid during the period would be higher, and your ending account value would be lower, by this amount.
Please note that the expenses shown in the table are meant to highlight your ongoing costs only. Therefore, the information in the row entitled “Hypothetical” is useful in comparing ongoing costs only, and will not help you determine the relative total costs of owning different funds.
| | Beginning | | Ending | | Expenses Paid |
| | Account Value | | Account Value | | During Period* |
| | (07/01/13) | | (12/31/13) | | (07/01/13-12/31/13) |
| | | | | | |
| Actual | $1,000.00 | | $1,150.99 | | $3.96 |
| Hypothetical | $1,000.00 | | $1,021.53 | | $3.72 |
Hypothetical assumes 5% annual return before expenses.
* Expenses are equal to the Fund’s annualized operating expense ratio (0.73%)**, multiplied by the average account value over the period, multiplied by 184/365 (to reflect the one-half year period).
** The expense ratio reflects the impact, if any, of certain reimbursements from the Adviser.
CLIPPER FUNDSM | Schedule of Investments |
| | December 31, 2013 |
| | Shares/Units | | Value (Note 1) |
|
| | CONSUMER DISCRETIONARY – (1.68%) |
| | | Retailing – (1.68%) |
| | | | | | | | | | |
| | | | | Total Consumer Discretionary | | | |
| | CONSUMER STAPLES – (19.90%) |
| | Food & Staples Retailing – (18.74%) |
| | Brasil Pharma S.A. (Brazil)* | | | | | | |
| | | | | | | | |
| | | | | | | | |
| | | | 235,009,341 |
| | Food, Beverage & Tobacco – (1.16%) |
| | Diageo PLC (United Kingdom) | | | | | | |
| | | | | |
| | ENERGY – (6.53%) |
| | Canadian Natural Resources Ltd. (Canada) | | | | | | |
| | | | | |
| | FINANCIALS – (55.53%) |
| | Banks – (3.65%) |
| | Commercial Banks – (3.65%) |
| | | | | | | | |
| | | | | | | | |
| | | | 45,689,760 |
| | Diversified Financials – (40.01%) |
| | Capital Markets – (14.34%) |
| | Ameriprise Financial, Inc. | | | | | | |
| | Bank of New York Mellon Corp. | | | | | | |
| | Julius Baer Group Ltd. (Switzerland) | | | | | | |
| | Oaktree Capital Group LLC, Class A | | | | | | |
| | RHJ International (Belgium)* | | | | | | |
| | | 179,781,267 |
| | Consumer Finance – (14.97%) |
| | | | | | | | |
| | Diversified Financial Services – (10.70%) |
| | Berkshire Hathaway Inc., Class A * | | | | | | |
| | | | | | | | |
| | | 134,144,004 |
| | | | 501,703,073 |
| | Insurance – (11.87%) |
| | Multi-line Insurance – (4.32%) |
| | | | | | | | |
| | Property & Casualty Insurance – (1.55%) |
| | | | | | | | |
| | Reinsurance – (6.00%) |
| | | | | | | | |
| | | | | | | | |
| | | 75,273,886 |
| | | | 148,876,618 |
| | | | | |
CLIPPER FUNDSM | Schedule of Investments – (Continued) |
| | December 31, 2013 |
| | Shares/Units/Principal | | Value (Note 1) |
COMMON STOCK – (CONTINUED) |
| | HEALTH CARE – (4.90%) |
| | | Health Care Equipment & Services – (4.90%) |
| | | | Laboratory Corp. of America Holdings * | | | | | | |
| | | | | | | | |
| | | | | |
| | | Total Health Care | | | | |
| | INFORMATION TECHNOLOGY – (11.35%) |
| | Semiconductors & Semiconductor Equipment – (1.70%) |
| | | | | | | | |
| | Software & Services – (8.50%) |
| | ASAC II L.P., Private Placement *(a) | | | | | | |
| | | | | | | | |
| | | | | | | | |
| | | | 106,564,459 |
| | Technology Hardware & Equipment – (1.15%) |
| | | | | | | | |
| | | | Total Information Technology | | | | |
| | | | | TOTAL COMMON STOCK – (Identified cost $767,162,715) | | | |
SHORT-TERM INVESTMENTS – (0.24%) |
| | Mizuho Securities USA Inc. Joint Repurchase Agreement, 0.01%, 01/02/14, dated 12/31/13, repurchase value of $1,195,001 (collateralized by: U.S. Government agency obligations in a pooled cash account, 0.00%-2.25%, 05/29/14-05/31/14, total market value $1,218,900) | | | | | | |
| | Nomura Securities International, Inc. Joint Repurchase Agreement, 0.02%, 01/02/14, dated 12/31/13, repurchase value of $1,861,002 (collateralized by: U.S. Government agency mortgages in a pooled cash account, 3.00%-3.50%, 02/01/26-06/01/43, total market value $1,898,220) | | | | | | |
| | TOTAL SHORT-TERM INVESTMENTS – (Identified cost $3,056,000) | | | |
| | Total Investments – (100.13%) – (Identified cost $770,218,715) – (b) | | | 1,255,528,469 |
| | Liabilities Less Other Assets – (0.13%) | | | (1,614,992) |
| | Net Assets – (100.00%) | | $ | 1,253,913,477 |
| | * | Non-Income producing security. |
| | | |
| | (a) | Restricted Security – See Note 5 of the Notes to Financial Statements. |
| | | |
| | (b) | Aggregate cost for federal income tax purposes is $776,575,325. At December 31, 2013 unrealized appreciation (depreciation) of securities for federal income tax purposes is as follows: |
| | Unrealized appreciation | | $ | 520,389,159 |
| | Unrealized depreciation | | | (41,436,015) |
| | Net unrealized appreciation | | $ | 478,953,144 |
| See Notes to Financial Statements |
CLIPPER FUNDSM | Statement of Assets and Liabilities |
| | At December 31, 2013 |
| | | | | | |
| ASSETS: | | | | | | |
| Investments in securities at value* (see accompanying Schedule of Investments) | | $ | 1,255,528,469 | |
| Cash | | | 1,995 | |
| Receivables: | | | | |
| Capital stock sold | | | 434,202 | |
| Dividends and interest | | | 562,466 | |
| Prepaid expenses | | | 62,669 | |
Total assets | | | | 1,256,589,801 | |
LIABILITIES: | | | | |
| Payables: | | | | |
| Capital stock redeemed | | | 1,679,112 | |
| Accrued investment advisory fee | | | 610,619 | |
| Accrued transfer agent fees | | | 284,076 | |
| Other accrued expenses | | | 102,517 | |
Total liabilities | | | | 2,676,324 | |
NET ASSETS | | $ | 1,253,913,477 | |
SHARES OUTSTANDING | | | 13,618,759 | |
NET ASSET VALUE, offering, and redemption price per share (Net assets ÷ Shares outstanding) | | $ | 92.07 | |
NET ASSETS CONSIST OF: | | | | |
| Paid in capital | | $ | 1,122,483,379 | |
| Undistributed net investment income | | | 79,303 | |
| Accumulated net realized losses from investments | | | (353,960,335) | |
| Net unrealized appreciation on investments and foreign currency transactions | | | 485,311,130 | |
| Net Assets | | | $ | 1,253,913,477 | |
| | | | | | |
| *Including: | | | | |
| Cost of Investments | | $ | 770,218,715 | |
| | | | | | |
| See Notes to Financial Statements |
CLIPPER FUNDSM | Statement of Operations |
| | For the year ended December 31, 2013 |
| INVESTMENT INCOME: | | | | | | | |
| Income: | | | | |
| Dividends* | | $ | 15,096,615 | |
| Interest | | | 67,084 | |
| | | Total income | | | | 15,163,699 | |
| | | | | | | | | | |
| Expenses: | | | | |
| Investment advisory fees (Note 3) | | $ | 6,347,862 | | | | |
| Custodian fees | | | 168,476 | | | | |
| Transfer agent fees | | | 1,465,255 | | | | |
| Audit fees | | | 48,600 | | | | |
| Legal fees | | | 52,151 | | | | |
| Reports to shareholders | | | 133,982 | | | | |
| Directors’ fees and expenses | | | 105,990 | | | | |
| Registration and filing fees | | | 45,157 | | | | |
| Miscellaneous | | | 117,886 | | | | |
| | Total expenses | | | | 8,485,359 | |
| Net investment income | | | 6,678,340 | |
| | | | | | | | | | |
REALIZED & UNREALIZED GAIN (LOSS) ON INVESTMENTS AND FOREIGN CURRENCY TRANSACTIONS: | | | | | | | |
| Net realized gain (loss) from: | | | | |
| | Investment transactions | | | 16,123,519 | |
| | Foreign currency transactions | | | (629) | |
| Net realized gain | | | 16,122,890 | |
| Net increase in unrealized appreciation | | | 311,808,329 | |
| | Net realized and unrealized gain on investments and foreign currency transactions | | | | 327,931,219 | |
| Net increase in net assets resulting from operations | | $ | 334,609,559 | |
| | | | | | | | | | |
| *Net of foreign taxes withheld as follows | | $ | 203,199 | |
| | | | | | | | | | |
| See Notes to Financial Statements |
CLIPPER FUNDSM | Statements of Changes in Net Assets |
| | | Year ended December 31, |
| | | 2013 | | 2012 |
| | | | | | | | |
| OPERATIONS: | | | | | | |
| Net investment income | | $ | 6,678,340 | | $ | 18,195,824 |
| Net realized gain from investments and foreign currency transactions | | | 16,122,890 | | | 53,408,602 |
Net increase in unrealized appreciation on investments and foreign currency transactions | | | 311,808,329 | | | 48,989,970 |
| | Net increase in net assets resulting from operations | | | 334,609,559 | | | 120,594,396 |
| | | | | | | | |
| DIVIDENDS AND DISTRIBUTIONS TO SHAREHOLDERS FROM: | | | | | | |
| Net investment income | | | (4,700,198) | | | (19,704,424) |
| | | | | | | | |
| CAPITAL SHARE TRANSACTIONS: | | | | | | |
| Net decrease in net assets resulting from capital share transactions (Note 4) | | | (90,626,027) | | | (119,690,308) |
| | Total increase (decrease) in net assets | | | 239,283,334 | | | (18,800,336) |
| | | | | | | | |
| NET ASSETS: | | | | | | |
| Beginning of year | | | 1,014,630,143 | | | 1,033,430,479 |
End of year* | | $ | 1,253,913,477 | | $ | 1,014,630,143 |
| | | | | | | | |
| *Including undistributed net investment income of | | $ | 79,303 | | $ | 171,972 |
| | | | | | | | |
| See Notes to Financial Statements |
CLIPPER FUNDSM | Notes to Financial Statements |
| | December 31, 2013 |
NOTE 1 - SUMMARY OF SIGNIFICANT ACCOUNTING POLICIES
Clipper Fund, Inc. (“Fund”) (a California corporation) is registered under the Investment Company Act of 1940, as amended, as a non-diversified, open-end management investment company. The Fund’s investment objective is long-term capital growth and capital preservation. Davis Selected Advisers, L.P. (“Davis Advisors” or “Adviser”), the Fund’s investment adviser, seeks to invest the Fund’s assets primarily in common stocks of large companies (generally, companies with market capitalizations of $10 billion or more at the time of initial purchase) that are trading at prices below the Adviser’s estimate of their intrinsic values. The following is a summary of significant accounting policies consistently followed by the Fund in the preparation of its financial statements.
Security Valuation - The Fund calculates the net asset value of its shares as of the close of the New York Stock Exchange (“Exchange”), normally 4:00 P.M. Eastern time, on each day the Exchange is open for business. Securities listed on the Exchange (and other national exchanges) are valued at the last reported sales price on the day of valuation. Securities traded in the over-the-counter market (e.g. NASDAQ) and listed securities for which no sale was reported on that date are valued at the closing bid price. Securities traded on foreign exchanges are valued based upon the last sales price on the principal exchange on which the security is traded prior to the time when the Fund’s assets are valued. Securities (including restricted securities) for which market quotations are not readily available or securities whose values have been materially affected by what the adviser identifies as a significant event occurring before the Fund’s assets are valued but after the close of their respective exchanges will be fair valued using a standardized fair valuation methodology applicable to the security type or the significant event as previously approved by the Fund’s Pricing Committee and Board of Directors. The Pricing Committee considers all facts it deems relevant that are reasonably available, through either public information or information available to the Adviser’s portfolio management team, when determining the fair value of a security. To assess the continuing appropriateness of security valuations, the Adviser may compare prior day prices, prices of comparable securities, and sale prices to the prior or current day prices and challenge those prices exceeding certain tolerance levels with the third-party pricing service or broker source. Fair value determinations are subject to review, approval, and ratification by the Fund’s Board of Directors at its next regularly scheduled meeting covering the period in which the fair valuation was determined. Fair valuation standardized methodologies used by the Fund for equity securities include, but are not limited to, pricing securities by adjusting the value based on changes in an appropriate securities index and applying liquidity discounts. The Fund also prices a partnership it holds by calculating the liquidation value of the investment on a daily basis using the closing price of the underlying stock and a waterfall schedule, which apportions the value of the partnership’s interests based on the value of the net assets of the investment. A liquidity discount is then applied to the liquidation value.
Short-term securities purchased within 60 days to maturity are valued at amortized cost, which approximates market value.
The Fund’s valuation procedures are reviewed and subject to approval by the Board of Directors. There have been no significant changes to the fair valuation procedures during the period.
Value Measurements - Fair value is defined as the price that the Fund would receive upon selling an investment in an orderly transaction to an independent buyer in the principal market for the investment. Various inputs are used to determine the fair value of the Fund’s investments. These inputs are summarized in the three broad levels listed below.
| Level 1 – | quoted prices in active markets for identical securities |
| Level 2 – | other significant observable inputs (including quoted prices for similar investments, interest rates, prepayment speeds, credit risk, etc.) |
| Level 3 – | significant unobservable inputs (including the Fund’s own assumptions in determining the fair value of investments) |
The inputs or methodologies used for valuing securities are not necessarily an indication of the risks associated with investing in those securities nor can it be assured that the Fund can obtain the fair value assigned to a security if it were to sell the security.
CLIPPER FUNDSM | Notes to Financial Statements – (Continued) |
| | December 31, 2013 |
NOTE 1 - SUMMARY OF SIGNIFICANT ACCOUNTING POLICIES – (CONTINUED)
Value Measurements - (Continued)
The following is a summary of the inputs used as of December 31, 2013 in valuing the Fund’s investments carried at value:
| | Investments in Securities at Value |
| | Valuation Inputs |
| | | | Level 2: | | Level 3: | | |
| | | | Other Significant | | Significant | | |
| | Level 1: | | Observable | | Unobservable | | |
| | Quoted Prices | | Inputs | | Inputs | | Total |
Equity securities: | | | | | | | | | | | |
| Consumer Discretionary | $ | 21,076,125 | | $ | – | | $ | – | | $ | 21,076,125 |
| Consumer Staples | | 249,606,275 | | | – | | | – | | | 249,606,275 |
| Energy | | 81,847,928 | | | – | | | – | | | 81,847,928 |
| Financials | | 687,412,711 | | | – | | | 8,856,740 | | | 696,269,451 |
| Health Care | | 61,396,659 | | | – | | | – | | | 61,396,659 |
| Information Technology | | 114,985,691 | | | – | | | 27,290,340 | | | 142,276,031 |
| Short-term securities | | – | | | 3,056,000 | | | – | | | 3,056,000 |
Total Investments | $ | 1,216,325,389 | | $ | 3,056,000 | | $ | 36,147,080 | | $ | 1,255,528,469 |
Level 2 to Level 1 Transfers*: | | |
| Consumer Staples | | 14,596,934 |
| Financials | | 23,674,159 |
Total | $ | 38,271,093 |
*The application of fair value procedures for securities traded on foreign exchanges triggered the transfers of investments between Level 1 and Level 2 of the fair value hierarchy during the year ended December 31, 2013.
The following table reconciles the valuation of assets in which significant unobservable inputs (Level 3) were used in determining fair value during the year ended December 31, 2013:
| Investment Securities: | | | |
| Beginning balance | | $ | 6,910,781 |
| Cost of purchases | | | 25,892,256 |
| Change in unrealized appreciation (depreciation) | | | 3,344,043 |
Ending balance | | $ | 36,147,080 |
| | | | |
| Change in unrealized appreciation (depreciation) during the period on Level 3 securities still held at December 31, 2013 and included in the change in net assets for the year | | $ | 3,344,043 |
There were no transfers of investments into or out of Level 3 of the fair value hierarchy during the year. The cost of purchases may include securities received through corporate actions or exchanges. Realized and unrealized gains (losses) are included in the related amounts on investments in the Statement of Operations.
The following table is a summary of those assets in which significant unobservable inputs (Level 3) were used by the Adviser in determining fair value. Note that these amounts exclude any valuations provided by a pricing service or broker.
| Assets Table | |
| | Fair Value at | | Valuation | | Unobservable | | | |
| Investments at Value | December 31, 2013 | | Technique | | Input | | Amount | |
| Equity securities | $ | 8,856,740 | | Index-based value adjustment with liquidity discount | | Discount rate | | | 25% | |
| | | | | | | | | | | |
| | | 27,290,340 | | Liquidation proceeds/waterfall methodology based on underlying investment value, then applying liquidity discount | | Discount rate | | | 15% | |
CLIPPER FUNDSM | Notes to Financial Statements – (Continued) |
| | December 31, 2013 |
NOTE 1 - SUMMARY OF SIGNIFICANT ACCOUNTING POLICIES – (CONTINUED)
Value Measurements - (Continued)
The significant unobservable input used in the fair value measurement of equity securities is the discount rate, which, if changed, would affect the fair value of the Fund’s investment. An increase in the discount rate would result in a decrease in the fair value of the investment.
Master Repurchase Agreements - The Fund, along with other affiliated funds, may transfer uninvested cash balances into one or more master repurchase agreement accounts. These balances are invested in one or more repurchase agreements, secured by U.S. Government securities. A custodian bank holds securities pledged as collateral for repurchase agreements until the agreements mature. Each agreement requires that the market value of the collateral be sufficient to cover payments of interest and principal; however, in the event of default by the other party to the agreement, retention of the collateral may be subject to legal proceedings.
Currency Translation - The market values of all assets and liabilities denominated in foreign currencies are recorded in the financial statements after translation to the U.S. Dollar based upon the mean between the bid and offered quotations of the currencies against U.S. Dollars on the date of valuation. The cost basis of such assets and liabilities is determined based upon historical exchange rates. Income and expenses are translated at average exchange rates in effect as accrued or incurred.
Foreign Currency - The Fund may enter into forward purchases or sales of foreign currencies to hedge certain foreign currency denominated assets and liabilities against declines in market value relative to the U.S. Dollar. Forward currency contracts are marked-to-market daily and the change in market value is recorded by the Fund as an unrealized gain or loss. When the forward currency contract is closed, the Fund records a realized gain or loss equal to the difference between the value of the forward currency contract at the time it was opened and value at the time it was closed. Investments in forward currency contracts may expose the Fund to risks resulting from unanticipated movements in foreign currency exchange rates or failure of the counter-party to the agreement to perform in accordance with the terms of the contract.
Reported net realized foreign exchange gains or losses arise from the sales of foreign currencies, currency gains or losses realized between the trade and settlement dates on securities transactions, the difference between the amounts of dividends, interest, and foreign withholding taxes recorded on the Fund’s books, and the U.S. Dollar equivalent of the amounts actually received or paid. Net unrealized foreign exchange gains and losses arise from changes in the value of assets and liabilities other than investments in securities at fiscal year end, resulting from changes in the exchange rate. The Fund includes foreign currency gains and losses realized on the sales of investments together with market gains and losses on such investments in the Statement of Operations.
Federal Income Taxes - It is the Fund’s policy to comply with the requirements of the Internal Revenue Code applicable to regulated investment companies, and to distribute substantially all of its taxable income, including any net realized gains on investments not offset by loss carryovers, to shareholders. Therefore, no provision for federal income tax or excise tax is required. The Adviser has analyzed the Fund’s tax positions taken on federal and state income tax returns for all open tax years and has concluded that as of December 31, 2013, no provision for income tax is required in the Fund’s financial statements related to those tax positions. The Fund’s federal and state (Arizona) income and federal excise tax returns for tax years for which the applicable statutes of limitations have not expired are subject to examination by the Internal Revenue Service and state department of revenue. The earliest tax year that remains subject to examination by these jurisdictions is 2010.
At December 31, 2013, the Fund had available for federal income tax purposes unused capital loss carryforwards as follows:
| | Capital Loss Carryforwards |
| Expiring | | |
| 12/31/2017 | $ | 342,120,000 |
| 12/31/2018 | | 5,484,000 |
| Total | $ | 347,604,000 |
| | | |
| Utilized in 2013 | | 11,085,000 |
CLIPPER FUNDSM | Notes to Financial Statements – (Continued) |
| | December 31, 2013 |
NOTE 1 - SUMMARY OF SIGNIFICANT ACCOUNTING POLICIES – (CONTINUED)
Securities Transactions and Related Investment Income - Securities transactions are accounted for on the trade date (date the order to buy or sell is executed) with realized gain or loss on the sale of securities being determined based upon identified cost. Dividend income is recorded on the ex-dividend date. Interest income, which includes accretion of discount and amortization of premium, is accrued as earned.
Dividends and Distributions to Shareholders - Dividends and distributions to shareholders are recorded on the ex-dividend date. Net investment income (loss), net realized gains (losses), and net unrealized appreciation (depreciation) on investments may differ for financial statement and tax purposes primarily due to differing treatments of wash sales, foreign currency transactions, partnership income, passive foreign investment company shares, and net operating losses. The character of dividends and distributions made during the fiscal year from net investment income and net realized securities gains may differ from their ultimate characterization for federal income tax purposes. Also, due to the timing of dividends and distributions, the fiscal year in which amounts are distributed may differ from the fiscal year in which income or realized gain was recorded by the Fund. The Fund adjusts certain components of capital to reflect permanent differences between financial statement amounts and net income and realized gains/losses determined in accordance with income tax rules. Accordingly, during the year ended December 31, 2013, amounts have been reclassified to reflect a decrease in undistributed net investment income of $2,070,811 and a corresponding decrease in accumulated net realized losses from investments and foreign currency transactions. Net assets have not been affected by this reclassification.
The tax character of distributions paid during the years ended December 31, 2013 and 2012 was as follows:
| | 2013 | | 2012 |
| Ordinary income | $ | 4,700,198 | | $ | 19,704,424 |
| Long-term capital gain | | – | | | – |
| Return of capital | | – | | | – |
| Total | $ | 4,700,198 | | $ | 19,704,424 |
As of December 31, 2013, the components of distributable earnings (accumulated losses) on a tax basis were as follows:
| Undistributed net investment income | $ | 79,303 |
| Accumulated net realized losses from investments and | | |
| foreign currency transactions | | (347,603,725) |
| Net unrealized appreciation on investments | | 478,954,520 |
| Total | $ | 131,430,098 |
Indemnification - Under the Fund’s organizational documents, its officers and directors are indemnified against certain liabilities arising out of the performance of their duties to the Fund. In addition, some of the Fund’s contracts with its service providers contain general indemnification clauses. The Fund’s maximum exposure under these arrangements is unknown since the amount of any future claims that may be made against the Fund cannot be determined and the Fund has no historical basis for predicting the likelihood of any such claims.
Use of Estimates in Financial Statements - In preparing financial statements in conformity with accounting principles generally accepted in the United States of America, management makes estimates and assumptions that affect the reported amounts of assets and liabilities and disclosure of contingent assets and liabilities at the date of the financial statements, as well as the reported amounts of income and expenses during the reporting period. Actual results may differ from these estimates.
NOTE 2 - PURCHASES AND SALES OF SECURITIES
The cost of purchases and proceeds from sales of investment securities (excluding short-term securities) during the year ended December 31, 2013 were $91,433,483 and $145,314,474, respectively.
CLIPPER FUNDSM | Notes to Financial Statements – (Continued) |
| | December 31, 2013 |
NOTE 3 - FEES AND OTHER TRANSACTIONS WITH AFFILIATES
Davis Selected Advisers-NY, Inc. (“DSA-NY”), a wholly-owned subsidiary of the Adviser, acts as sub-adviser to the Fund. DSA-NY performs research and portfolio management services for the Fund under a Sub-Advisory Agreement with the Adviser. The Fund pays no fees directly to DSA-NY.
Certain officers of the Fund are also officers of the general partner of the Adviser.
Investment Advisory Fees - Advisory fees are paid monthly to the Adviser. The annual rate is 0.55% of the average net assets for the first $3 billion, 0.54% on the next $1 billion, 0.53% on the next $1 billion, 0.52% on the next $1 billion, 0.51% on the next $1 billion, 0.50% on the next $3 billion, and 0.485% of the average net assets greater than $10 billion. Advisory fees paid during the year ended December 31, 2013 approximated 0.55% of average net assets.
Transfer Agent and Accounting Fees - Boston Financial Data Services, Inc. (“BFDS”) is the Fund’s primary transfer agent. The Adviser is also paid for certain transfer agent services. The fee paid to the Adviser for these services during the year ended December 31, 2013 amounted to $73,238. State Street Bank and Trust Company (“State Street Bank”) is the Fund’s primary accounting provider. Fees for such services are included in the custodian fees as State Street Bank also serves as the Fund’s custodian.
NOTE 4 - CAPITAL STOCK
At December 31, 2013, there were 200 million shares of capital stock (no par value) authorized. Transactions in capital stock were as follows:
| | Year ended December 31, 2013 |
| | | Sold | | | Reinvestment of Distributions | | | Redeemed | | | Net Decrease |
| | | | | | | | | | | | |
| Shares | | 1,529,328 | | | 49,523 | | | (2,695,148) | | | (1,116,297) |
| Value | $ | 123,307,176 | | $ | 4,441,261 | | $ | (218,374,464) | | $ | (90,626,027) |
| | | | | | | | | | | | |
| |
| | Year ended December 31, 2012 |
| | | Sold | | | Reinvestment of Distributions | | | Redeemed | | | Net Decrease |
| | | | | | | | | | | | |
| Shares | | 1,328,945 | | | 268,156 | | | (3,396,310) | | | (1,799,209) |
| Value | $ | 88,777,969 | | $ | 18,610,015 | | $ | (227,078,292) | | $ | (119,690,308) |
| | | | | | | | | | | | |
| |
NOTE 5 - RESTRICTED SECURITIES
Restricted securities are not registered under the Securities Act of 1933 and may have contractual restrictions on resale. They are valued under methods approved by the Board of Directors as reflecting fair value. The aggregate value of restricted securities amounted to $36,147,080 or 2.88% of the Fund’s net assets as of December 31, 2013. Information regarding restricted securities is as follows:
| Security | | Acquisition Date | | Units | | Cost per Unit | | | Valuation per Unit as of December 31, 2013 |
| | | | | | | | | | | | |
| ASAC II L.P., Private Placement | | 10/10/13 | | 24,200,000 | | $ | 1.00 | | | $ | 1.1277 |
| SKBHC Holdings LLC | | 11/08/10 | | 2,076 | | | 5,000.00 | | | | 4,266.60 |
CLIPPER FUNDSM | Financial Highlights |
| The following financial information represents selected data for each share of capital stock outstanding throughout each period: |
| | Year ended December 31, |
| | | | 2013 | | 2012 | | 2011 | | 2010 | | 2009 |
Net Asset Value, Beginning of Period | | $ | 68.86 | | $ | 62.50 | | $ | 61.96 | | $ | 54.56 | | $ | 39.98 |
| | | | | | | | | | | | | | | | | | | | | | | | | | | | |
| Income from Investment Operations: | | | | | | | | | | | | | | | | | | | | | | | | | |
| Net Investment Income | | 0.47a | | 1.16a | | 0.66a | | 0.55a | | 0.46 |
| Net Realized and Unrealized Gains | | 23.09 | | 6.54 | | 0.75 | | 7.48 | | 14.58 |
| | Total from Investment Operations | | 23.56 | | 7.70 | | 1.41 | | 8.03 | | 15.04 |
| | | | | | | | | | | | | | | | | | | | | | | | | | | | |
| Dividends and Distributions: | | | | | | | | | | | | | | | | | | | | | | | | | |
| Dividends from Net Investment Income | | (0.35) | | (1.34) | | (0.87) | | (0.63) | | (0.46) |
| | Total Dividends and Distributions | | (0.35) | | (1.34) | | (0.87) | | (0.63) | | (0.46) |
Net Asset Value, End of Period | | $ | 92.07 | | $ | 68.86 | | $ | 62.50 | | $ | 61.96 | | $ | 54.56 |
| | | | | | | | | | | | | | | | | | | | | | | | | | | | |
Total Returnb | | 34.22% | | 12.31% | | 2.29% | | 14.77% | | 37.60%c |
| | | | | | | | | | | | | | | | | | | | | | | | | | | | |
| Ratios/Supplemental Data: | | | | | | | | | | | | | | | | | | | | | | | | | |
| Net Assets, End of Period (in millions) | | $ | 1,254 | | $ | 1,015 | | $ | 1,033 | | $ | 1,153 | | $ | 1,162 |
| Ratio of Expenses to Average Net Assets: | | | | | | | | | | | | | | | | | | | | | | | | | |
| | Gross | | 0.74% | | 0.75% | | 0.75% | | 0.76% | | 0.80% |
| | Netd | | 0.74% | | 0.75% | | 0.75% | | 0.76% | | 0.80% |
Ratio of Net Investment Income to Average Net Assets | | 0.58% | | 1.74% | | 1.04% | | 0.96% | | 0.96% |
Portfolio Turnover Ratee | | 8% | | 6% | | 15% | | 3% | | 15% |
| a | Per share calculations were based on average shares outstanding for the period. |
| | |
| b | Assumes hypothetical initial investment on the business day before the first day of the fiscal period, with all dividends and distributions reinvested in additional shares on the reinvestment date, and redemption at the net asset value calculated on the last business day of the fiscal period. |
| | |
| c | Clipper Fund received favorable class action settlements from companies that it no longer owns. These settlements contributed approximately 5% to the Fund's total return in 2009. This was a one-time event that is unlikely to be repeated. |
| | |
| d | The Net Ratio of Expenses to Average Net Assets reflects the impact, if any, of the reduction of expenses paid indirectly and of certain reimbursements from the Adviser. |
| | |
| e | The lesser of purchases or sales of portfolio securities for a period, divided by the monthly average of the market value of portfolio securities owned during the period. Securities with a maturity or expiration date at the time of acquisition of one year or less are excluded from the calculation. |
| | |
| See Notes to Financial Statements |
CLIPPER FUNDSM | Report of Independent Registered Public Accounting Firm |
The Shareholders and Board of Directors
Clipper Fund, Inc.:
We have audited the accompanying statement of assets and liabilities of Clipper Fund, Inc., including the schedule of investments, as of December 31, 2013, the related statement of operations for the year then ended, the statements of changes in net assets for each of the years in the two-year period then ended, and the financial highlights for each of the years in the five-year period then ended. These financial statements and financial highlights are the responsibility of the Fund’s management. Our responsibility is to express an opinion on these financial statements and financial highlights based on our audits.
We conducted our audits in accordance with the standards of the Public Company Accounting Oversight Board (United States). Those standards require that we plan and perform the audit to obtain reasonable assurance about whether the financial statements and financial highlights are free of material misstatement. An audit includes examining, on a test basis, evidence supporting the amounts and disclosures in the financial statements. Our procedures included confirmation of securities owned as of December 31, 2013, by correspondence with the custodian. An audit also includes assessing the accounting principles used and significant estimates made by management, as well as evaluating the overall financial statement presentation. We believe that our audits provide a reasonable basis for our opinion.
In our opinion, the financial statements and financial highlights referred to above present fairly, in all material respects, the financial position of Clipper Fund, Inc. as of December 31, 2013, the results of its operations for the year then ended, the changes in its net assets for each of the years in the two-year period then ended, and the financial highlights for each of the years in the five-year period then ended, in conformity with U.S. generally accepted accounting principles.
KPMG LLP
Denver, Colorado
February 21, 2014
CLIPPER FUNDSM | Federal Income Tax Information (Unaudited) |
In early 2014, shareholders received information regarding all dividends and distributions paid to them by the Fund during the calendar year 2013. Regulations of the U.S. Treasury Department require the Fund to report this information to the Internal Revenue Service.
The information and distributions reported herein may differ from the information reported as distributions taxable to certain shareholders for the calendar year 2013 with their 2013 Form 1099-DIV.
During the calendar year 2013, $4,700,198 of dividends paid by the Fund constituted income dividends for federal income tax purposes. The Fund designates $4,700,198 or 100% as income qualifying for the corporate dividends-received deduction.
For the calendar year 2013, certain dividends paid by the Fund constitute qualified dividend income for federal income tax purposes. The Fund designates $4,700,198 or 100% as qualified dividend income.
The foregoing information is presented to assist shareholders in reporting dividends and distributions received from the Fund to the Internal Revenue Service. Because of the complexity of the federal regulations, which may affect your individual tax return and the many variations in state and local tax regulations, we recommend that you consult your tax adviser for specific guidance.
CLIPPER FUNDSM | Privacy Notice and Householding |
Privacy Notice
While you generally will be dealing with a broker-dealer or other financial adviser, we may collect information about you from your account application and other forms that you may deliver to us. We use this information to process your requests and transactions; for example, to provide you with additional information about the Fund, to open an account for you, or to process a transaction. In order to service your account and execute your transactions, we may provide your personal information to firms that assist us in servicing your account, such as our transfer agent. We may also provide your name and address to one of our agents for the purpose of mailing to you your account statement and other information about our products and services. We require these outside firms and agents to protect the confidentiality of your information and to use the information only for the purpose for which the disclosure is made. We do not provide customer names and addresses to outside firms, organizations, or individuals except in furtherance of our business relationship with you or as otherwise allowed by law.
We restrict access to nonpublic personal information about you to those employees who need to know that information to provide products or services to you. We maintain physical, electronic and procedural safeguards that comply with federal standards to guard your personal information.
Householding
To avoid sending duplicate copies of materials to households, the Fund will mail only one copy of each prospectus, Annual, and Semi-Annual Report to shareholders having the same last name and address on the Fund’s records. The consolidation of these mailings, called householding, benefits the Fund through reduced mailing expense. If you do not want the mailing of these documents to be combined with those to other members of your household, please contact the Clipper Fund by phone at 1-800-432-2504. Individual copies of current prospectuses and reports will be sent to you within 30 days after the Fund receives your request to stop householding.
CLIPPER FUNDSM | Directors and Officers |
For the purpose of their service as directors to the Clipper Fund, the business address for each of the directors is 2949 E. Elvira Road, Suite 101, Tucson, AZ 85756. All directors qualify as independent under the Investment Company Act of 1940.
Name (birthdate) | Position(s) Held with Fund | Term of Office and Length of Time Served | Principal Occupation(s) During Past 5 Years | Number of Portfolios Overseen in Fund Complex | Other Directorships Held |
| | | | | | |
| Independent Directors | | | | | |
| | | | | | |
Lawrence E. Harris (09/16/56) | Director/ Chairman | Indefinite and since April 2006 | Fred V. Keenan Chair in Finance of the Marshall School of Business, University of Southern California, Los Angeles, CA | 1 | Interactive Brokers Group, Inc.; Trustee, RS Investment Trust & RS Variable Products Trust |
| | | | | | |
Steven N. Kearsley (09/29/41) | Director | Indefinite and since April 2006 | Private Investor, Real Estate Development | 1 | None |
| | | | | | |
Lawrence P. McNamee (09/12/34) | Director | Indefinite and since inception | Retired Educator | 1 | None |
Officers
Christopher C. Davis (born 07/13/65, Clipper Fund officer since 12/19/05). President of Clipper Fund; Chairman, Davis Selected Advisers, L.P., and also serves as an executive officer of certain companies affiliated with the Adviser, including sole member of the Adviser’s general partner, Davis Investments, LLC; Chief Executive Officer, President, or Vice President of each of the Davis Funds (consisting of 13 portfolios) and Selected Funds (consisting of two portfolios); Employee of Shelby Cullom Davis & Co. (registered broker/dealer); Director of each of the Davis Funds (consisting of 13 portfolios) and the Selected Funds (consisting of two portfolios); Director of Graham Holdings Co. (publishing company).
Kenneth C. Eich (born 08/14/53, Clipper Fund officer since 12/19/05). Executive Vice President and Principal Executive Officer of Clipper Fund, each of the Davis Funds (consisting of 13 portfolios), and Selected Funds (consisting of two portfolios); Chief Operating Officer, Davis Selected Advisers, L.P., and also serves as an executive officer of certain companies affiliated with the Adviser.
Douglas A. Haines (born 03/04/71, Clipper Fund officer since 12/19/05). Vice President, Treasurer, Chief Financial Officer, Principal Financial Officer, and Principal Accounting Officer of Clipper Fund, each of the Davis Funds (consisting of 13 portfolios), and Selected Funds (consisting of two portfolios); Vice President and Director of Fund Accounting, Davis Selected Advisers, L.P.
Sharra L. Haynes (born 09/25/66, Clipper Fund officer since 12/19/05). Vice President and Chief Compliance Officer of Clipper Fund, each of the Davis Funds (consisting of 13 portfolios), and Selected Funds (consisting of two portfolios); Vice President and Chief Compliance Officer, Davis Selected Advisers, L.P., and also serves as an executive officer of certain companies affiliated with the Adviser.
Ryan M. Charles (born 07/25/78, Clipper Fund officer since 01/01/14). Vice President and Secretary of Clipper Fund, each of the Davis Funds (consisting of 13 portfolios), and Selected Funds (consisting of two portfolios); Vice President, Chief Legal Officer and Secretary, Davis Selected Advisers, L.P., and also serves as an executive officer of certain companies affiliated with the Adviser.
| Investment Adviser | |
| Davis Selected Advisers, L.P. (Doing business as “Davis Advisors”) | |
| 2949 East Elvira Road, Suite 101 | |
| Tucson, Arizona 85756 | |
| (800) 432-2504 | |
| | |
| Distributor | |
| Davis Distributors, LLC | |
| 2949 East Elvira Road, Suite 101 | |
| Tucson, Arizona 85756 | |
| | |
| Transfer Agent | |
| Boston Financial Data Services, Inc. | |
| P.O. Box 55468 | |
| Boston, Massachusetts 02205-5468 | |
| | |
| Custodian | |
| State Street Bank and Trust Co. | |
| One Lincoln Street | |
| Boston, Massachusetts 02111 | |
| | |
| Counsel | |
| Bingham McCutchen LLP | |
| 355 South Grand Avenue, Suite 4400 | |
| Los Angeles, CA 90071-3106 | |
| | |
| Independent Registered Public Accounting Firm | |
| KPMG LLP | |
| 1225 Seventeenth Street, Suite 800 | |
| Denver, Colorado 80202 | |
For more information about Clipper Fund including management fee, charges, and expenses, see the current prospectus, which must precede or accompany this report. The Fund’s Statement of Additional Information contains additional information about the Fund’s Directors and is available without charge, upon request, by contacting the Fund at 1-800-432-2504 and on the Fund’s website at www.clipperfund.com. Quarterly Fact Sheets are available on the Fund’s website at www.clipperfund.com.
ITEM 2. CODE OF ETHICS
The registrant has adopted a code of ethics that applies to the registrant’s principal executive officer, principal financial officer, principal accounting officer or controller, or persons performing similar functions.
A copy of the code of ethics is filed as an exhibit to this form N-CSR.
No waivers were granted to this code of ethics during the period covered by this report.
ITEM 3. AUDIT COMMITTEE FINANCIAL EXPERT
The Fund’s Board of Directors has determined that independent trustee Steven N. Kearsley qualifies as the “audit committee financial expert”, as defined in Item 3 of form N-CSR.
ITEM 4. PRINCIPAL ACCOUNTANT FEES AND SERVICES
| (a) | Audit Fees. The aggregate Audit Fees billed by KPMP LLP (“KPMG”) for professional services rendered for the audits of the audits of the financial statements, or services that are normally provided in connection with statutory and regulatory filings or engagements for the fiscal year ends December 31, 2013 and December 31, 2012 were $48,600 and $46,800, respectively. |
| (b) | Audit-Related Fees. The aggregate Audit-Related Fees billed by KPMG for services rendered for assurance and related services that are not reasonably related to the performance of the audit or review of the fund financial statements, but not reported as Audit Fees fore fiscal year ends December 31, 2013 and December 31, 2012 were $0 and $0, respectively. |
| (c) | Tax Fees. The aggregate Tax Fees billed by KPMG for professional services rendered for tax compliance, tax advice and tax planning for the fiscal year ends December 31, 2013 and December 31, 2012 were $7,700 and $7,150, respectively. |
Fees included in the Tax Fee category comprise all services performed by professional staff in the independent accountant’s tax division except those services related to the audit. These services include preparation of tax returns, tax advice related to mergers and a review of the fund income and capital gain distributions.
| (d) | All Other Fees. The aggregate Other Fees billed by KPMG for all other non-audit services rendered to the fund for the fiscal year ends December 31, 2013 and December 31, 2012 were $0 and $6,459, respectively. |
(e)(1) Audit Committee Pre-Approval Policies and Procedures.
The fund Audit Committee must pre-approve all audit and non-audit services provided by the independent accountant relating to the operations or financial reporting of the funds. Prior to the commencement of any audit or non-audit services to a fund, the Audit Committee reviews the services to determine whether they are appropriate and permissible under applicable law.
The fund Audit Committee has adopted a policy whereby audit and non-audit services performed by the fund independent accountant require pre-approval in advance at regularly scheduled Audit Committee meetings. If such a service is required between regularly scheduled Audit Committee meetings, pre-approval may be authorized by the Audit Committee Chairperson with ratification at the next scheduled audit committee meeting.
| (2) | No services included in (b) – (d) above were approved pursuant to paragraph (c)(7)(i)(C) of |
Rule 2-01 of Regulation S-X.
(f) Not applicable
| (g) | The Funds’ independent accountant did not provide any services to the investment advisor or any affiliate for the fiscal years ended December 31, 2013 and December 31, 2012. The fund has not paid any fees for non-audit not previously disclosed in items 4 (b) – (d). |
| (h) | The registrant’s audit committee of the board of trustees has considered whether the provision of non-audit services that were rendered to the registrant’s investment adviser, and any entity controlling, controlled by, or under common control with the investment adviser that provides ongoing services to the registrant that not pre-approved pursuant to paragraph (c)(7)(ii) of Rule 2-01 of Regulation S-X is compatible with maintaining the principal accountant’s independence. No such services were rendered. |
ITEM 5. AUDIT COMMITTEE OF LISTED REGISTRANTS
Not Applicable
ITEM 6. SCHEDULE OF INVESTMENTS
Not Applicable. The complete Schedule of Investments is included in Item 1 of this for N-CSR
ITEM 7. DISCLOSURE OF PROXY VOTING POLICIES AND PROCEDURES FOR CLOSED-END MANAGEMENT INVESTMENT COMPANIES
Not Applicable
ITEM 8. PORTFOLIO MANAGERS OF CLOSED-END MANAGEMENT INVESTMENT COMPANIES
Not Applicable
ITEM 9. PURCHASES OF EQUITY SECURITIES BY CLOSED-END MANAGEMENT INVESTMENT COMPANIES AND AFFILIATED PURCHASERS
Not Applicable
ITEM 10. SUBMISSION OF MATTERS TO A VOTE OF SECURITY HOLDERS
There have been no changes to the procedure by which shareholders may recommend nominees to the registrant’s Board of Trustees.
ITEM 11. CONTROLS AND PROCUDURES
| (a) | The registrant’s principal executive officer and principal financial officer have concluded that the registrant’s disclosure controls and procedures (as defined in Rule 30a-3 (c) under the Investment Company Act of 1940, as amended) are effective as of a date within 90 days of the filing date of this report. |
| (b) | There have been no significant changes in the registrant’s internal controls or in other factors that could significantly affect these controls. |
ITEM 12. EXHIBITS
| | (a)(1) The registrant’s code of ethics pursuant to Item 2 of Form N-CSR is filed as an exhibit to this form N-CSR. |
| | (a)(2) Certifications pursuant to Section 302 of the Sarbanes-Oxley Act of 2002 are attached. |
| | (b) Certifications pursuant to Section 906 of the Sarbanes-Oxley Act of 2002 are attached. |
Pursuant to the requirements of the Securities Exchange Act of 1934 and the Investment Company Act of 1940, the registrant has duly caused this report to be signed on its behalf by the undersigned, thereunto duly authorized.
CLIPPER FUND, INC.
By /s/ Kenneth C. Eich
Kenneth C. Eich
Principal Executive Officer
Date: March 6, 2014
Pursuant to the requirements of the Securities Exchange Act of 1934 and the Investment Company Act of 1940, this report has been signed below by the following persons on behalf of the registrant and in the capacities and on the dates indicated.
By /s/ Kenneth C. Eich
Kenneth C. Eich
Principal Executive Officer
Date: March 6, 2014
By /s/ Douglas A. Haines
Douglas A. Haines
Principal Financial Officer
Date: March 6, 2014