| UNITED STATES |
| SECURITIES AND EXCHANGE COMMISSION |
| Washington, D.C. 20549 |
| FORM N-CSR |
| |
| CERTIFIED SHAREHOLDER REPORT OF REGISTERED MANAGEMENT |
| INVESTMENT COMPANIES |
| |
| Investment Company Act file number 811-3940 |
| |
| Strategic Funds, Inc. |
| (formerly, Dreyfus Premier New Leaders Fund, Inc.) |
| (Exact name of Registrant as specified in charter) |
| c/o The Dreyfus Corporation |
| 200 Park Avenue |
| New York, New York 10166 |
| (Address of principal executive offices) (Zip code) |
| |
| Mark N. Jacobs, Esq. |
| 200 Park Avenue |
| New York, New York 10166 |
| (Name and address of agent for service) |
| |
| Registrant's telephone number, including area code: (212) 922-6000 |
| Date of fiscal year end: | | 12/31 |
| Date of reporting period: | | 12/31/06 |
The following N-CSR relates only to the Registrant’s series listed below and does not affect the other series of the Registrant, which have different fiscal year ends and, therefore, different N-CSR reporting requirements. Separate N-CSR Forms will be filed for these series, as appropriate.
Dreyfus Premier New Leaders Fund
|
Item 1. Reports to Stockholders.
| Dreyfus Premier |
| New Leaders Fund |
ANNUAL REPORT December 31, 2006

Save time. Save paper. View your next shareholder report online as soon as it’s available. Log into www.dreyfus.com and sign up for Dreyfus eCommunications. It’s simple and only takes a few minutes.
The views expressed in this report reflect those of the portfolio manager only through the end of the period covered and do not necessarily represent the views of Dreyfus or any other person in the Dreyfus organization. Any such views are subject to change at any time based upon market or other conditions and Dreyfus disclaims any responsibility to update such views.These views may not be relied on as investment advice and, because investment decisions for a Dreyfus fund are based on numerous factors, may not be relied on as an indication of trading intent on behalf of any Dreyfus fund.
Not FDIC-Insured • Not Bank-Guaranteed • May Lose Value
| | | Contents |
| |
| | | THE FUND |
| |
|
| 2 | | A Letter from the CEO |
| 3 | | Discussion of Fund Performance |
| 6 | | Fund Performance |
| 8 | | Understanding Your Fund’s Expenses |
| 8 | | Comparing Your Fund’s Expenses |
| | | With Those of Other Funds |
| 9 | | Statement of Investments |
| 14 | | Statement of Assets and Liabilities |
| 15 | | Statement of Operations |
| 16 | | Statement of Changes in Net Assets |
| 19 | | Financial Highlights |
| 24 | | Notes to Financial Statements |
| 33 | | Report of Independent Registered |
| | | Public Accounting Firm |
| 34 | | Important Tax Information |
| 34 | | Proxy Results |
| 35 | | Information About the Review and Approval |
| | | of the Fund’s Management Agreement |
| 40 | | Board Members Information |
| 44 | | Officers of the Fund |
| |
| | | FOR MORE INFORMATION |
| |
|
| | | Back Cover |
The Fund
| Dreyfus Premier |
| New Leaders Fund |

A LETTER FROM THE CEO
Dear Shareholder:
We are pleased to present this annual report for Dreyfus Premier New Leaders Fund, covering the 12-month period from January 1, 2006, through December 31, 2006.
2006 proved to be a good year for the financial markets.Virtually all sectors and capitalization ranges of the U.S. equity markets generated strong returns, especially over the second half of the year.A number of positive factors contributed to the markets’ gains in 2006, including an expanding domestic economy, subdued inflation, stabilizing interest rates, rising productivity and robust corporate profits.
In our analysis, 2006 provided an excellent reminder of the need for a long-term investment perspective. Adopting too short a time frame proved costly for some investors last year, as chasing recent winners often meant buying the next month’s losers. Indeed, history shows that reacting to near-term developments with extreme shifts in strategy rarely is the right decision.We believe that a better course of action is to set a portfolio mix to meet future goals, while attempting to ignore short term market fluctuations in favor of a longer-term view.
For information about how the fund performed during the reporting period, as well as market perspectives, we have provided a Discussion of Fund Performance given by the fund’s portfolio managers.
Thank you for your continued confidence and support.We wish you good health and prosperity in 2007.
2

DISCUSSION OF FUND PERFORMANCE
Franklin Portfolio Associates Midcap Team, Portfolio Managers
How did Dreyfus Premier New Leaders Fund perform relative to its benchmark?
For the 12-month period ended December 31, 2006, the fund achieved total returns of 13.56% for its Class A shares, 12.78% for its Class B shares, 12.75% for its Class C shares, 13.56% for its Class R shares and 13.39% for its Class T shares.1 In comparison, the Russell Midcap Index (the “Index”), the fund’s benchmark, achieved a total return of 15.26% for the same period.2
Better-than-expected revenues and earnings from a wide range of companies drove stock prices higher in 2006, with returns from midcap stocks roughly matching those of their large-cap counterparts.While the fund participated in the midcap market’s climb to a significant degree, the underperformance of certain growth/momentum factors in the stock ranking process, as well as the relatively stronger performance of more highly leveraged, less financially stable firms (which our process tends to avoid) caused the fund’s returns to lag its benchmark.
What is the fund’s investment approach?
The fund seeks capital appreciation by investing in the stocks of small and midsize companies. Often, these companies are “new leaders” in their industries, with new or innovative products, services or processes that have the potential to enhance earnings growth. A proprietary quantitative model considers more than 40 factors to identify and rank stocks based on fundamental momentum, relative value, future value, long-term growth and other factors. We then focus on “bottom-up” stock selection to construct a portfolio with exposure to industries and market capitalizations that are similar to the benchmark’s composition. We seek to overweight more attractive stocks and underweight or not hold stocks that have been ranked as less attractive.
DISCUSSION OF FUND PERFORMANCE (continued)
What other factors influenced the fund’s performance?
Conflicting economic forces produced relatively high levels of stock market volatility in 2006. After rising from January through April, the market declined sharply between May and July when resurgent energy prices and hawkish comments from members of the Federal Reserve Board (the “Fed”) caused investors to revise upward their expectations for inflation and interest rates. However, evidence of slowing economic growth emerged during the summer, and the Fed held short-term interest rates steady for the remainder of the year. Energy prices declined during the fall, helping to relieve investors’ inflation-related concerns, and stocks rose sharply through year-end.
Although the fund participated in the market’s gains to a significant degree, the underperformance of growth- and momentum-related quantitative analytical factors constrained its relative performance. However, many of the fund’s other metrics enhanced returns. For example, the fund’s focus on earnings yield, a measure that favors stocks with low price/earnings ratios, proved beneficial given the market’s value-oriented bias.
Stock selection was strongest among industrial, transportation, and commercial services holdings. Top performers included Terex, a construction machinery maker; Ryanair Holdings, a European short-haul passenger airline; Expeditors International of Washington, which provides worldwide shipping logistic services and was sold during the reporting period; and employment services provider Manpower, which generated notably strong returns in a robust labor market. Other sectors in which stock selection was positive included the consumer discretionary sector, in which the fund outperformed on the strength of lodging provider Hilton Hotels and two apparel retailers, American Eagle Outfitters and Nordstrom.
On the other hand, several sectors produced mixed or negative results compared to the benchmark. In the technology area, gains in holdings such as LAM Research and Network Appliance were offset by weakness in others, including Marvell Technology Group, which was sold
4
during the reporting period, and Jabil Circuit. In the construction area, homebuilders KB Home and Toll Brothers, which was sold during the reporting period, were hurt by softness in the residential housing market. Among mining and metals stocks, Alumina and Crown Holdings, which was sold during the reporting period, were underperformers. However, the energy sector proved to be the fund’s single weakest area of performance compared to the benchmark, due to both a slight overweight in the portfolio to this underperforming sector, as well as unsuccessful specific holdings including Patterson-UTI Energy, Pioneer Natural Resources and Sunoco.
What is the fund’s current strategy?
As always, our stock selection process is the primary focus of our efforts to add value and enhance returns.As of the end of the reporting period, the fund has continued to be fully invested and well-diversified across 125 stocks.We recently reduced the fund’s past sector and industry tilts, bringing sector allocations more closely in line with the benchmark’s composition. We believe that the fund currently is well balanced between growth-oriented and value-oriented stocks, with a focus on those stocks we believe will have the greatest potential for appreciation within our holding period.
January 16, 2007
| 1 | | Total return includes reinvestment of dividends and any capital gains paid, and does not take into |
| | | consideration the maximum initial sales charges in the case of Class A and Class T shares or the |
| | | applicable contingent deferred sales charges imposed on redemptions in the case of Class B and |
| | | Class C shares. Had these charges been reflected, returns would have been lower. Past performance |
| | | is no guarantee of future results. Share price and investment return fluctuate such that upon |
| | | redemption, fund shares may be worth more or less than their original cost. |
| 2 | | SOURCE: LIPPER INC. — Reflects reinvestment of dividends and, where applicable, capital |
| | | gain distributions.The Russell Midcap Index is a widely accepted, unmanaged index of medium- |
| | | cap stock market performance. |
| | | Franklin Portfolio Associates is an independently managed, wholly owned subsidiary of Mellon |
| | | Financial Corporation. Franklin Portfolio Associates has no affiliation to the Franklin Templeton |
| | | Group of Funds or Franklin Resources, Inc.The fund’s portfolio managers are dual employees of |
| | | Franklin Portfolio Associates and Dreyfus. |
FUND PERFORMANCE
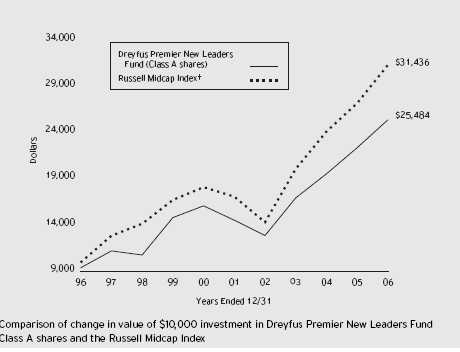
| † Source: Lipper Inc. |
| Past performance is not predictive of future performance. |
| The above graph compares a $10,000 investment made in Class A shares of Dreyfus Premier New Leaders Fund on |
| 12/31/96 to a $10,000 investment made in the Russell Midcap Index (the “Index”) on that date. All dividends and |
| capital gain distributions are reinvested. |
| The performance of the fund’s Class A shares shown in the line graph takes into account the maximum initial sales |
| charge and all other applicable fees and expenses.The Index is a widely accepted, unmanaged index of medium-cap stock |
| market performance.The Index does not take into account charges, fees and other expenses. Further information relating |
| to fund performance, including expense reimbursements, if applicable, is contained in the Financial Highlights section of |
| the prospectus and elsewhere in this report. |
6
| Average Annual Total Returns as of 12/31/06 | | | | | | |
| |
| | | | | Inception | | | | | | | | From |
| | | | | Date | | 1 Year | | 5 Years | | 10 Years | | Inception |
| |
| |
| |
| |
| |
| |
|
| Class A shares | | | | | | | | | | |
| with maximum sales charge (5.75%) | | 7.02% | | 10.47% | | 9.81% | | |
| without sales charge | | | | 13.56% | | 11.78% | | 10.46% | | |
| Class B shares | | | | | | | | | | |
| with applicable redemption charge † | | 11/27/02 | | 8.78% | | — | | — | | 16.51% |
| without redemption | | 11/27/02 | | 12.78% | | — | | — | | 16.82% |
| Class C shares | | | | | | | | | | |
| with applicable redemption charge †† | | 11/27/02 | | 11.75% | | — | | — | | 16.83% |
| without redemption | | 11/27/02 | | 12.75% | | — | | — | | 16.83% |
| Class R shares | | 11/27/02 | | 13.56% | | — | | — | | 17.87% |
| Class T shares | | | | | | | | | | |
| with applicable sales charge (4.5%) | | 11/27/02 | | 8.30% | | — | | — | | 16.09% |
| without sales charge | | 11/27/02 | | 13.39% | | — | | — | | 17.40% |
| |
| Past performance is not predictive of future performance.The fund’s performance shown in the graph and table does not |
| reflect the deduction of taxes that a shareholder would pay on fund distributions or the redemption of fund shares. |
| † | | The maximum contingent deferred sales charge for Class B shares is 4%. After six years Class B shares convert to |
| | | Class A shares. | | | | | | | | | | |
| †† | | The maximum contingent deferred sales charge for Class C shares is 1% for shares redeemed within one year of the |
| | | date of purchase. | | | | | | | | | | |
UNDERSTANDING YOUR FUND’S EXPENSES(Unaudited)
As a mutual fund investor, you pay ongoing expenses, such as management fees and other expenses. Using the information below, you can estimate how these expenses affect your investment and compare them with the expenses of other funds.You also may pay one-time transaction expenses, including sales charges (loads) and redemption fees, which are not shown in this section and would have resulted in higher total expenses. For more information, see your fund’s prospectus or talk to your financial adviser.
Review your fund’s expenses
The table below shows the expenses you would have paid on a $1,000 investment in Dreyfus Premier New Leaders Fund from July 1, 2006 to December 31, 2006. It also shows how much a $1,000 investment would be worth at the close of the period, assuming actual returns and expenses.
| Expenses and Value of a $1,000 Investment | | | | | | |
| assuming actual returns for the six months ended December 31, 2006 | | | | |
| | | Class A | | Class B | | Class C | | Class R | | Class T |
| |
| |
| |
| |
| |
|
| Expenses paid per $1,000 † | | $ 6.34 | | $ 10.45 | | $ 10.23 | | $ 5.82 | | $ 7.13 |
| Ending value (after expenses) | | $1,097.30 | | $1,093.60 | | $1,093.10 | | $1,097.60 | | $1,096.30 |
| COMPARING YOUR FUND’S EXPENSES |
| WITH THOSE OF OTHER FUNDS (Unaudited) |
Using the SEC’s method to compare expenses
The Securities and Exchange Commission (SEC) has established guidelines to help investors assess fund expenses. Per these guidelines, the table below shows your fund’s expenses based on a $1,000 investment, assuming a hypothetical 5% annualized return. You can use this information to compare the ongoing expenses (but not transaction expenses or total cost) of investing in the fund with those of other funds.All mutual fund shareholder reports will provide this information to help you make this comparison. Please note that you cannot use this information to estimate your actual ending account balance and expenses paid during the period.
| Expenses and Value of a $1,000 Investment | | | | | | |
| assuming a hypothetical 5% annualized return for the six months ended December 31, 2006 |
| | | Class A | | Class B | | Class C | | Class R | | Class T |
| |
| |
| |
| |
| |
|
| Expenses paid per $1,000 † | | $ 6.11 | | $ 10.06 | | $ 9.86 | | $ 5.60 | | $ 6.87 |
| Ending value (after expenses) | | $1,019.16 | | $1,015.22 | | $1,015.43 | | $1,019.66 | | $1,018.40 |
| |
| † Expenses are equal to the fund’s annualized expense ratio of 1.20% for Class A, 1.98% for Class B, 1.94% for |
| Class C, 1.10% for Class R and 1.35% for Class T, multiplied by the average account value over the period, multiplied |
| by 184/365 (to reflect the one-half year period). | | | | | | | | |
8
| STATEMENT OF INVESTMENTS |
| December 31, 2006 |
| Common Stocks—99.5% | | Shares | | | | Value ($) |
| |
| |
| |
|
| Commercial & Professional Services—5.4% | | | | |
| AmerisourceBergen | | 216,500 | | | | 9,733,840 |
| CDW | | 251,000 | | | | 17,650,320 |
| Corporate Executive Board | | 38,200 | | | | 3,350,140 |
| Ingram Micro, Cl. A | | 193,300 a | | | | 3,945,253 |
| Manpower | | 339,300 | | | | 25,423,749 |
| SEI Investments | | 92,600 | | | | 5,515,256 |
| | | | | | | 65,618,558 |
| Communications—2.2% | | | | | | |
| Qwest Communications International | | 3,154,000 a | | | | 26,398,980 |
| Consumer Durables—2.4% | | | | | | |
| KB Home | | 253,400 | | | | 12,994,352 |
| Lennar, Cl. A | | 222,800 | | | | 11,688,088 |
| Mattel | | 192,600 | | | | 4,364,316 |
| | | | | | | 29,046,756 |
| Consumer Non-Durables—4.8% | | | | | | |
| Coach | | 211,300 a | | | | 9,077,448 |
| Dean Foods | | 349,100 a | | | | 14,759,948 |
| International Flavors & Fragrances | | 186,500 | | | | 9,168,340 |
| Loews—Carolina Group | | 91,900 | | | | 5,947,768 |
| McCormick & Co. | | 350,000 | | | | 13,496,000 |
| Smithfield Foods | | 234,700 a | | | | 6,022,402 |
| | | | | | | 58,471,906 |
| Consumer Services—6.6% | | | | | | |
| Darden Restaurants | | 340,800 | | | | 13,689,936 |
| EchoStar Communications, Cl. A | | 248,200 a | | | | 9,439,046 |
| First Marblehead | | 32,100 | | | | 1,754,265 |
| Hilton Hotels | | 663,200 | | | | 23,145,680 |
| Regal Entertainment Group, Cl. A | | 281,200 | | | | 5,995,184 |
| Royal Caribbean Cruises | | 220,700 | | | | 9,132,566 |
| Starwood Hotels & Resorts Worldwide | | 173,000 | | | | 10,812,500 |
| Wynn Resorts | | 66,700 | | | | 6,259,795 |
| | | | | | | 80,228,972 |
| Electronic Technology—9.7% | | | | | | |
| Analog Devices | | 155,800 | | | | 5,121,146 |
| AVX | | 197,000 | | | | 2,913,630 |
| Comverse Technology | | 372,500 a | | | | 7,863,475 |
| Empresa Brasileira de Aeronautica, ADR | | 156,400 | | | | 6,479,652 |
The Fund 9
STATEMENT OF INVESTMENTS (continued)
| Common Stocks (continued) | | Shares | | Value ($) |
| |
| |
|
| Electronic Technology (continued) | | | | |
| Intersil, Cl. A | | 715,300 | | 17,109,976 |
| Jabil Circuit | | 234,600 | | 5,759,430 |
| Lam Research | | 464,200 a | | 23,497,804 |
| Microchip Technology | | 259,700 | | 8,492,190 |
| NCR | | 146,500 a | | 6,264,340 |
| Network Appliance | | 310,000 a | | 12,176,800 |
| Rockwell Collins | | 255,000 | | 16,138,950 |
| Western Digital | | 316,300 a | | 6,471,498 |
| | | | | 118,288,891 |
| Energy Minerals—4.1% | | | | |
| Chesapeake Energy | | 603,500 | | 17,531,675 |
| Pioneer Natural Resources | | 224,100 | | 8,894,529 |
| Sunoco | | 100,000 | | 6,236,000 |
| Tesoro | | 161,200 | | 10,602,124 |
| XTO Energy | | 150,400 | | 7,076,320 |
| | | | | 50,340,648 |
| Finance—20.5% | | | | |
| Ambac Financial Group | | 50,000 | | 4,453,500 |
| Assurant | | 325,000 | | 17,956,250 |
| Axis Capital Holdings | | 307,800 | | 10,271,286 |
| Bear Stearns Cos. | | 112,200 | | 18,263,916 |
| Camden Property Trust | | 97,600 | | 7,207,760 |
| CIT Group | | 441,400 | | 24,616,878 |
| Comerica | | 331,000 | | 19,423,080 |
| Commerce Bancshares/Kansas City, MO | | 174,751 | | 8,459,696 |
| Crescent Real Estate EQT | | 143,500 | | 2,834,125 |
| E*TRADE FINANCIAL | | 253,700 a | | 5,687,954 |
| Fidelity National Title Group, Cl. A | | 134,079 | | 3,201,806 |
| First Horizon National | | 137,300 | | 5,736,394 |
| Host Hotels & Resorts | | 765,010 | | 18,780,996 |
| HRPT Properties Trust | | 281,200 | | 3,472,820 |
| iStar Financial | | 245,000 | | 11,715,900 |
| Leucadia National | | 153,200 | | 4,320,240 |
| Marshall & Ilsley | | 235,000 | | 11,305,850 |
| MGIC Investment | | 154,000 | | 9,631,160 |
| Northern Trust | | 230,000 | | 13,958,700 |
| ProLogis | | 99,400 | | 6,040,538 |
10
| Common Stocks (continued) | | Shares | | Value ($) |
| |
| |
|
| Finance (continued) | | | | |
| SL Green Realty | | 53,100 | | 7,050,618 |
| Sovereign Bancorp | | 177,260 | | 4,500,631 |
| UnionBanCal | | 93,300 | | 5,714,625 |
| Vornado Realty Trust | | 67,400 | | 8,189,100 |
| Weingarten Realty Investors | | 114,600 | | 5,284,206 |
| Willis Group Holdings | | 283,800 | | 11,269,698 |
| | | | | 249,347,727 |
| Health Care Technology—6.8% | | | | |
| Applera—Applied Biosystems Group | | 266,000 | | 9,759,540 |
| C.R. Bard | | 177,600 | | 14,735,472 |
| Hospira | | 119,300 a | | 4,006,094 |
| Millennium Pharmaceuticals | | 1,127,300 a | | 12,287,570 |
| Mylan Laboratories | | 380,800 | | 7,600,768 |
| Sepracor | | 191,000 a | | 11,761,780 |
| Thermo Fisher Scientific | | 488,500 a | | 22,124,165 |
| | | | | 82,275,389 |
| Industrial Services—3.1% | | | | |
| ENSCO International | | 166,500 | | 8,334,990 |
| Grant Prideco | | 141,200 a | | 5,615,524 |
| Kinder Morgan | | 110,800 | | 11,717,100 |
| Patterson-UTI Energy | | 521,700 | | 12,119,091 |
| | | | | 37,786,705 |
| Non-Energy Minerals—2.5% | | | | |
| Alumina, ADR | | 566,600 | | 11,275,340 |
| Freeport-McMoRan Copper & Gold, Cl. B | | 70,700 | | 3,940,111 |
| Nucor | | 198,400 | | 10,844,544 |
| Steel Dynamics | | 155,000 | | 5,029,750 |
| | | | | 31,089,745 |
| Process Industries—3.2% | | | | |
| Ecolab | | 163,500 | | 7,390,200 |
| Pactiv | | 466,000 a | | 16,631,540 |
| Sigma-Aldrich | | 185,000 | | 14,378,200 |
| | | | | 38,399,940 |
| Producer Manufacturing—7.2% | | | | |
| AMETEK | | 243,100 | | 7,740,304 |
| Autoliv | | 90,000 | | 5,427,000 |
| Cummins | | 170,600 | | 20,161,508 |
The Fund 11
STATEMENT OF INVESTMENTS (continued)
| Common Stocks (continued) | | Shares | | Value ($) |
| |
| |
|
| Producer Manufacturing (continued) | | | | |
| Gardner Denver | | 80,400 a | | 2,999,724 |
| Joy Global | | 229,600 | | 11,098,864 |
| Roper Industries | | 210,300 | | 10,565,472 |
| Terex | | 250,400 a | | 16,170,832 |
| Trinity Industries | | 378,000 | | 13,305,600 |
| | | | | 87,469,304 |
| Retail Trade—5.1% | | | | |
| American Eagle Outfitters | | 646,200 | | 20,167,902 |
| Claire’s Stores | | 188,900 | | 6,260,146 |
| Family Dollar Stores | | 199,200 | | 5,842,536 |
| Nordstrom | | 444,200 | | 21,916,828 |
| Sherwin-Williams | | 115,600 | | 7,349,848 |
| | | | | 61,537,260 |
| Technology Services—6.2% | | | | |
| Acxiom | | 61,400 | | 1,574,910 |
| Alliance Data Systems | | 124,700 a | | 7,790,009 |
| BEA Systems | | 391,200 a | | 4,921,296 |
| Check Point Software Technologies | | 163,300 a | | 3,579,536 |
| CheckFree | | 137,100 a | | 5,505,936 |
| CIGNA | | 56,100 | | 7,381,077 |
| Cognizant Technology Solutions, Cl. A | | 116,200 a | | 8,965,992 |
| Community Health Systems | | 294,900 a | | 10,769,748 |
| DaVita | | 98,500 a | | 5,602,680 |
| Express Scripts | | 69,100 a | | 4,947,560 |
| Fidelity National Information | | | | |
| Services | | 175,410 | | 7,032,187 |
| HEALTHSOUTH | | 76,720 a | | 1,737,708 |
| Paychex | | 152,400 | | 6,025,896 |
| | | | | 75,834,535 |
| Transportation—2.8% | | | | |
| AMR | | 200,200 a | | 6,052,046 |
| Norfolk Southern | | 305,200 | | 15,348,508 |
| Ryanair Holdings, ADR | | 151,000 a | | 12,306,500 |
| | | | | 33,707,054 |
| Utilities—6.9% | | | | |
| AGL Resources | | 55,900 | | 2,175,069 |
| Allegheny Energy | | 94,800 a | | 4,352,268 |
12
| Common Stocks (continued) | | Shares | | Value ($) |
| |
| |
|
| Utilities (continued) | | | | | | |
| Alliant Energy | | | | 137,100 | | 5,178,267 |
| CMS Energy | | | | 401,300 a | | 6,701,710 |
| Edison International | | | | 137,300 | | 6,244,404 |
| KeySpan | | | | 264,700 | | 10,900,346 |
| PG & E | | | | 633,500 | | 29,983,555 |
| Pinnacle West Capital | | | | 154,000 | | 7,806,260 |
| PPL | | | | 177,700 | | 6,368,768 |
| Progress Energy | | | | 95,100 | | 4,667,508 |
| | | | | | | | | 84,378,155 |
| Total Common Stocks | | | | | | |
| (cost $912,835,118) | | | | | | 1,210,220,525 |
| |
| |
| |
|
| |
| Other Investment—.5% | | | | |
| |
| |
|
| Registered Investment Company; | | | | |
| Dreyfus Institutional Preferred | | | | |
| Plus Money Market Fund | | | | |
| (cost $6,356,000) | | | | 6,356,000 b | | 6,356,000 |
| |
| |
| |
|
| |
| Total Investments (cost $919,191,118) | | 100.0% | | 1,216,576,525 |
| Cash and Receivables (Net) | | .0% | | 11,561 |
| Net Assets | | | | 100.0% | | 1,216,588,086 |
| |
| ADR—American Depository Receipts | | | | |
| a | | Non-income producing security. | | | | |
| b | | Investment in affiliated money market mutual fund. | | | | |
| |
| |
| |
|
| |
| |
| Portfolio Summary (Unaudited) † | | | | |
| | | | | Value (%) | | | | Value (%) |
| |
| |
| |
| |
|
| Finance | | 20.5 | | Technology Services | | 6.2 |
| Electronic Technology | | 9.7 | | Commercial & Professional Services 5.4 |
| Producer Manufacturing | | 7.2 | | Retail Trade | | 5.1 |
| Utilities | | 6.9 | | Consumer Non-Durables | | 4.8 |
| Health Care Technology | | 6.8 | | Other | | 20.8 |
| Consumer Services | | 6.6 | | | | 100.0 |
| |
| † | | Based on net assets. | | | | | | |
| See notes to financial statements. | | | | |
The Fund 13
STATEMENT OF ASSETS AND LIABILITIES
December 31, 2006

| STATEMENT OF OPERATIONS |
| Year Ended December 31, 2006 |
| Investment Income ($): | | |
| Income: | | |
| Cash dividends (net of $25,443 foreign taxes withheld at source): | | |
| Unaffiliated issuers | | 17,254,594 |
| Affiliated issuers | | 223,270 |
| Income from securities lending | | 116,596 |
| Interest | | 316 |
| Total Income | | 17,594,776 |
| Expenses: | | |
| Management fee—Note 3(a) | | 8,856,566 |
| Shareholder servicing costs—Note 3(c) | | 4,765,083 |
| Distribution fees—Note 3(b) | | 391,176 |
| Registration fees | | 138,949 |
| Prospectus and shareholders’ reports | | 137,105 |
| Custodian fees—Note 3(c) | | 83,965 |
| Directors’ fees and expenses—Note 3(d) | | 83,876 |
| Professional fees | | 59,522 |
| Interest expense—Note 2 | | 14,616 |
| Loan commitment fees—Note 2 | | 10,914 |
| Miscellaneous | | 38,000 |
| Total Expenses | | 14,579,772 |
| Less—reduction in custody fees due | | |
| to earnings credits—Note 1(b) | | (3,122) |
| Net Expenses | | 14,576,650 |
| Investment Income—Net | | 3,018,126 |
| |
|
| Realized and Unrealized Gain (Loss) on Investments—Note 4 ($): |
| Net realized gain (loss) on investments | | 122,980,627 |
| Net unrealized appreciation (depreciation) on investments | | 20,733,523 |
| Net Realized and Unrealized Gain (Loss) on Investments | | 143,714,150 |
| Net Increase in Net Assets Resulting from Operations | | 146,732,276 |
See notes to financial statements.
STATEMENT OF CHANGES IN NET ASSETS
| | | Year Ended December 31, |
| |
|
| | | 2006 | | 2005 |
| |
| |
|
| Operations ($): | | | | |
| Investment income—net | | 3,018,126 | | 2,611,818 |
| Net realized gain (loss) on investments | | 122,980,627 | | 67,369,481 |
| Net unrealized appreciation | | | | |
| (depreciation) on investments | | 20,733,523 | | 67,833,318 |
| Net Increase (Decrease) in Net Assets | | |
| Resulting from Operations | | 146,732,276 | | 137,814,617 |
| |
| |
|
| Dividends to Shareholders from ($): | | | | |
| Investment income—net: | | | | |
| Class A shares | | (1,658,934) | | (1,854,439) |
| Class R shares | | (42,791) | | (25,354) |
| Class T shares | | (26,930) | | (32,913) |
| Net realized gain on investments: | | | | |
| Class A shares | | (116,638,136) | | (72,131,295) |
| Class B shares | | (2,402,895) | | (1,419,499) |
| Class C shares | | (2,731,530) | | (1,119,373) |
| Class R shares | | (1,513,135) | | (608,063) |
| Class T shares | | (2,251,915) | | (621,978) |
| Total Dividends | | (127,266,266) | | (77,812,914) |
| |
| |
|
| Capital Stock Transactions ($): | | | | |
| Net proceeds from shares sold: | | | | |
| Class A shares | | 217,027,518 | | 231,023,398 |
| Class B shares | | 3,423,360 | | 6,148,413 |
| Class C shares | | 9,847,742 | | 8,374,530 |
| Class R shares | | 6,828,310 | | 13,171,757 |
| Class T shares | | 8,703,274 | | 14,171,766 |
| Dividends reinvested: | | | | |
| Class A shares | | 112,510,731 | | 70,256,834 |
| Class B shares | | 2,264,517 | | 1,282,913 |
| Class C shares | | 2,346,797 | | 983,805 |
| Class R shares | | 1,416,790 | | 583,130 |
| Class T shares | | 2,224,599 | | 629,987 |
16
| | | Year Ended December 31, |
| |
|
| | | 2006 | | 2005 |
| |
| |
|
| Capital Stock Transactions ($) (continued): | | |
| Cost of shares redeemed: | | | | |
| Class A shares | | (257,671,117) | | (190,889,756) |
| Class B shares | | (4,429,896) | | (2,803,028) |
| Class C shares | | (3,979,056) | | (2,176,555) |
| Class R shares | | (3,349,133) | | (7,927,016) |
| Class T shares | | (6,347,795) | | (1,248,033) |
| Increase (Decrease) in Net Assets | | | | |
| from Capital Stock Transactions | | 90,816,641 | | 141,582,145 |
| Total Increase (Decrease) in Net Assets | | 110,282,651 | | 201,583,848 |
| |
| |
|
| Net Assets ($): | | | | |
| Beginning of Period | | 1,106,305,435 | | 904,721,587 |
| End of Period | | 1,216,588,086 | | 1,106,305,435 |
| Undistributed investment income—net | | 1,434,741 | | 650,706 |
STATEMENT OF CHANGES IN NET ASSETS (continued)
| | | Year Ended December 31, |
| |
|
| | | 2006 | | 2005 |
| |
| |
|
| Capital Share Transactions: | | | | |
| Class Aa | | | | |
| Shares sold | | 4,455,468 | | 5,186,927 |
| Shares issued for dividends reinvested | | 2,338,386 | | 1,561,832 |
| Shares redeemed | | (5,317,083) | | (4,287,557) |
| Net Increase (Decrease) in Shares Outstanding | | 1,476,771 | | 2,461,202 |
| |
| |
|
| Class B a | | | | |
| Shares sold | | 71,870 | | 141,443 |
| Shares issued for dividends reinvested | | 48,096 | | 29,004 |
| Shares redeemed | | (93,333) | | (63,877) |
| Net Increase (Decrease) in Shares Outstanding | | 26,633 | | 106,570 |
| |
| |
|
| Class C | | | | |
| Shares sold | | 207,901 | | 190,019 |
| Shares issued for dividends reinvested | | 50,358 | | 22,212 |
| Shares redeemed | | (84,437) | | (49,728) |
| Net Increase (Decrease) in Shares Outstanding | | 173,822 | | 162,503 |
| |
| |
|
| Class R | | | | |
| Shares sold | | 139,349 | | 291,450 |
| Shares issued for dividends reinvested | | 29,248 | | 12,763 |
| Shares redeemed | | (68,623) | | (166,627) |
| Net Increase (Decrease) in Shares Outstanding | | 99,974 | | 137,586 |
| |
| |
|
| Class T | | | | |
| Shares sold | | 181,727 | | 321,124 |
| Shares issued for dividends reinvested | | 46,808 | | 13,593 |
| Shares redeemed | | (131,526) | | (27,946) |
| Net Increase (Decrease) in Shares Outstanding | | 97,009 | | 306,771 |
| |
| a During the period ended December 31, 2006, 21,609 Class B shares representing $1,028,097 were automatically |
| converted to 21,016 Class A shares and during the period ended December 31, 2005, 13,164 Class B shares |
| representing $576,287 were automatically converted to 12,888 Class A shares. | | |
| See notes to financial statements. | | | | |
18
FINANCIAL HIGHLIGHTS
The following tables describe the performance for each share class for the fiscal periods indicated.All information (except portfolio turnover rate) reflects financial results for a single fund share.Total return shows how much your investment in the fund would have increased (or decreased) during each period, assuming you had reinvested all dividends and distributions.These figures have been derived from the fund’s financial statements.
| | | | | Year Ended December 31, | | |
| |
| |
| |
|
| Class A Shares | | 2006 | | 2005 | | 2004 | | 2003 | | 2002a |
| |
| |
| |
| |
| |
|
| Per Share Data ($): | | | | | | | | | | |
| Net asset value, beginning of period | | 47.02 | | 44.42 | | 41.91 | | 34.94 | | 39.54 |
| Investment Operations: | | | | | | | | | | |
| Investment income (loss)—net b | | .14 | | .13 | | (.05) | | (.03) | | .00c |
| Net realized and unrealized | | | | | | | | | | |
| gain (loss) on investments | | 6.16 | | 6.03 | | 6.34 | | 10.95 | | (4.56) |
| Total from Investment Operations | | 6.30 | | 6.16 | | 6.29 | | 10.92 | | (4.56) |
| Distributions: | | | | | | | | | | |
| Dividends from investment | | | | | | | | | | |
| income—net | | (.08) | | (.09) | | — | | (.00)c | | — |
| Dividends from net realized | | | | | | | | | | |
| gain on investments | | (5.32) | | (3.47) | | (3.78) | | (3.95) | | (.04) |
| Total Distributions | | (5.40) | | (3.56) | | (3.78) | | (3.95) | | (.04) |
| Redemption fee reimbursement | | — | | — | | — | | — | | .00c |
| Net asset value, end of period | | 47.92 | | 47.02 | | 44.42 | | 41.91 | | 34.94 |
| |
| |
| |
| |
| |
|
| Total Return (%) d | | 13.56 | | 14.40 | | 15.33 | | 31.68 | | (11.55) |
| |
| |
| |
| |
| |
|
| Ratios/Supplemental Data (%): | | | | | | | | | | |
| Ratio of total expenses | | | | | | | | | | |
| to average net assets | | 1.20 | | 1.16 | | 1.22 | | 1.25 | | 1.23 |
| Ratio of net expenses | | | | | | | | | | |
| to average net assets | | 1.20 | | 1.16 | | 1.22 | | 1.25 | | 1.23 |
| Ratio of net investment income | | | | | | | | | | |
| (loss) to average net assets | | .29 | | .29 | | (.12) | | (.08) | | .00e |
| Portfolio Turnover Rate | | 40.30 | | 37.93 | | 99.93 | | 121.01 | | 113.51 |
| |
| |
| |
| |
| |
|
| Net Assets, end of period | | | | | | | | | | |
| ($ x 1,000) | | 1,131,962 | | 1,041,238 | | 874,359 | | 728,634 | | 492,628 |
| |
| a The fund commenced offering five classes of shares on November 27, 2002.The existing shares were redesignated |
| Class A shares. | | | | | | | | | | |
| b Based on average shares outstanding at each month end. | | | | | | |
| c Amount represents less than $.01 per share. | | | | | | | | |
| d Exclusive of sales charge. | | | | | | | | | | |
| e Amount represents less than .01%. | | | | | | | | | | |
| See notes to financial statements. | | | | | | | | | | |
The Fund 19
FINANCIAL HIGHLIGHTS (continued)
| | | | | Year Ended December 31, | | |
| |
| |
| |
|
| Class B Shares | | 2006 | | 2005 | | 2004 | | 2003 | | 2002a |
| |
| |
| |
| |
| |
|
| Per Share Data ($): | | | | | | | | | | |
| Net asset value, beginning of period | | 45.86 | | 43.67 | | 41.57 | | 34.93 | | 35.42 |
| Investment Operations: | | | | | | | | | | |
| Investment income (loss)—net b | | (.23) | | (.24) | | (.38) | | (.32) | | .01 |
| Net realized and unrealized | | | | | | | | | | |
| gain (loss) on investments | | 6.02 | | 5.90 | | 6.26 | | 10.91 | | (.50) |
| Total from Investment Operations | | 5.79 | | 5.66 | | 5.88 | | 10.59 | | (.49) |
| Distributions: | | | | | | | | | | |
| Dividends from net realized | | | | | | | | | | |
| gain on investments | | (5.32) | | (3.47) | | (3.78) | | (3.95) | | — |
| Net asset value, end of period | | 46.33 | | 45.86 | | 43.67 | | 41.57 | | 34.93 |
| |
| |
| |
| |
| |
|
| Total Return (%) c | | 12.78 | | 13.48 | | 14.46 | | 30.73 | | (1.38)d |
| |
| |
| |
| |
| |
|
| Ratios/Supplemental Data (%): | | | | | | | | | | |
| Ratio of total expenses | | | | | | | | | | |
| to average net assets | | 1.97 | | 1.99 | | 2.00 | | 1.99 | | .19d |
| Ratio of net expenses | | | | | | | | | | |
| to average net assets | | 1.97 | | 1.99 | | 2.00 | | 1.99 | | .19d |
| Ratio of net investment income | | | | | | | | | | |
| (loss) to average net assets | | (.49) | | (.54) | | (.88) | | (.82) | | .05d |
| Portfolio Turnover Rate | | 40.30 | | 37.93 | | 99.93 | | 121.01 | | 113.51 |
| |
| |
| |
| |
| |
|
| Net Assets, end of period | | | | | | | | | | |
| ($ x 1,000) | | 22,388 | | 20,938 | | 15,285 | | 9,036 | | 74 |
| |
| a From November 27, 2002 (commencement of initial offering) to December 31, 2002. | | | | |
| b Based on average shares outstanding at each month end. | | | | | | | | |
| c Exclusive of sales charge. | | | | | | | | | | |
| d Not annualized. | | | | | | | | | | |
| See notes to financial statements. | | | | | | | | | | |
20
| | | | | Year Ended December 31, | | |
| |
| |
| |
|
| Class C Shares | | 2006 | | 2005 | | 2004 | | 2003 | | 2002a |
| |
| |
| |
| |
| |
|
| Per Share Data ($): | | | | | | | | | | |
| Net asset value, beginning of period | | 45.90 | | 43.70 | | 41.58 | | 34.93 | | 35.42 |
| Investment Operations: | | | | | | | | | | |
| Investment income (loss)—net b | | (.20) | | (.21) | | (.35) | | (.31) | | .03 |
| Net realized and unrealized | | | | | | | | | | |
| gain (loss) on investments | | 5.98 | | 5.88 | | 6.25 | | 10.91 | | (.52) |
| Total from Investment Operations | | 5.78 | | 5.67 | | 5.90 | | 10.60 | | (.49) |
| Distributions: | | | | | | | | | | |
| Dividends from net realized | | | | | | | | | | |
| gain on investments | | (5.32) | | (3.47) | | (3.78) | | (3.95) | | — |
| Net asset value, end of period | | 46.36 | | 45.90 | | 43.70 | | 41.58 | | 34.93 |
| |
| |
| |
| |
| |
|
| Total Return (%) c | | 12.75 | | 13.49 | | 14.49 | | 30.72 | | (1.35)d |
| |
| |
| |
| |
| |
|
| Ratios/Supplemental Data (%): | | | | | | | | | | |
| Ratio of total expenses | | | | | | | | | | |
| to average net assets | | 1.93 | | 1.93 | | 1.97 | | 1.95 | | .19d |
| Ratio of net expenses | | | | | | | | | | |
| to average net assets | | 1.93 | | 1.93 | | 1.97 | | 1.95 | | .19d |
| Ratio of net investment income | | | | | | | | | | |
| (loss) to average net assets | | (.43) | | (.49) | | (.82) | | (.78) | | .08d |
| Portfolio Turnover Rate | | 40.30 | | 37.93 | | 99.93 | | 121.01 | | 113.51 |
| |
| |
| |
| |
| |
|
| Net Assets, end of period | | | | | | | | | | |
| ($ x 1,000) | | 26,406 | | 18,166 | | 10,193 | | 3,514 | | 36 |
| |
| a From November 27, 2002 (commencement of initial offering) to December 31, 2002. | | | | |
| b Based on average shares outstanding at each month end. | | | | | | | | |
| c Exclusive of sales charge. | | | | | | | | | | |
| d Not annualized. | | | | | | | | | | |
| See notes to financial statements. | | | | | | | | | | |
FINANCIAL HIGHLIGHTS (continued)
| | | | | Year Ended December 31, | | |
| |
| |
| |
|
| Class R Shares | | 2006 | | 2005 | | 2004 | | 2003 | | 2002a |
| |
| |
| |
| |
| |
|
| Per Share Data ($): | | | | | | | | | | |
| Net asset value, beginning of period | | 47.37 | | 44.72 | | 42.04 | | 34.96 | | 35.42 |
| Investment Operations: | | | | | | | | | | |
| Investment income—net b | | .16 | | .12 | | .15 | | .09 | | .03 |
| Net realized and unrealized | | | | | | | | | | |
| gain (loss) on investments | | 6.19 | | 6.12 | | 6.31 | | 10.94 | | (.49) |
| Total from Investment Operations | | 6.35 | | 6.24 | | 6.46 | | 11.03 | | (.46) |
| Distributions: | | | | | | | | | | |
| Dividends from investment | | | | | | | | | | |
| income—net | | (.15) | | (.12) | | — | | — | | — |
| Dividends from net realized | | | | | | | | | | |
| gain on investments | | (5.32) | | (3.47) | | (3.78) | | (3.95) | | — |
| Total Distributions | | (5.47) | | (3.59) | | (3.78) | | (3.95) | | — |
| Net asset value, end of period | | 48.25 | | 47.37 | | 44.72 | | 42.04 | | 34.96 |
| |
| |
| |
| |
| |
|
| Total Return (%) | | 13.56 | | 14.48 | | 15.69 | | 31.97 | | (1.30)c |
| |
| |
| |
| |
| |
|
| Ratios/Supplemental Data (%): | | | | | | | | | | |
| Ratio of total expenses | | | | | | | | | | |
| to average net assets | | 1.18 | | 1.11 | | .92 | | .93 | | .09c |
| Ratio of net expenses | | | | | | | | | | |
| to average net assets | | 1.18 | | 1.11 | | .92 | | .93 | | .09c |
| Ratio of net investment income | | | | | | | | | | |
| to average net assets | | .32 | | .27 | | .38 | | .21 | | .07c |
| Portfolio Turnover Rate | | 40.30 | | 37.93 | | 99.93 | | 121.01 | | 113.51 |
| |
| |
| |
| |
| |
|
| Net Assets, end of period | | | | | | | | | | |
| ($ x 1,000) | | 15,328 | | 10,312 | | 3,583 | | 390 | | 1 |
| |
| a From November 27, 2002 (commencement of initial offering) to December 31, 2002. | | | | |
| b Based on average shares outstanding at each month end. | | | | | | | | |
| c Not annualized. | | | | | | | | | | |
| See notes to financial statements. | | | | | | | | | | |
22
| | | | | | | Year Ended December 31, | | |
| | | |
| |
| |
|
| Class T Shares | | 2006 | | 2005 | | 2004 | | 2003 | | 2002a |
| |
| |
| |
| |
| |
|
| Per Share Data ($): | | | | | | | | | | |
| Net asset value, beginning of period | | 46.54 | | 44.13 | | 41.76 | | 34.94 | | 35.42 |
| Investment Operations: | | | | | | | | | | |
| Investment income (loss)—net b | | .08 | | (.02) | | (.10) | | (.12) | | .01 |
| Net realized and unrealized | | | | | | | | | | |
| gain (loss) on investments | | 6.09 | | 6.01 | | 6.25 | | 10.89 | | (.49) |
| Total from Investment Operations | | 6.17 | | 5.99 | | 6.15 | | 10.77 | | (.48) |
| Distributions: | | | | | | | | | | |
| Dividends from investment | | | | | | | | | | |
| income—net | | (.07) | | (.11) | | — | | — | | — |
| Dividends from net realized | | | | | | | | | | |
| gain on investments | | (5.32) | | (3.47) | | (3.78) | | (3.95) | | — |
| Total Distributions | | (5.39) | | (3.58) | | (3.78) | | (3.95) | | — |
| Net asset value, end of period | | 47.32 | | 46.54 | | 44.13 | | 41.76 | | 34.94 |
| |
| |
| |
| |
| |
|
| Total Return (%) c | | 13.39 | | 14.12 | | 15.04 | | 31.24 | | (1.35)d |
| |
| |
| |
| |
| |
|
| Ratios/Supplemental Data (%): | | | | | | | | | | |
| Ratio of total expenses | | | | | | | | | | |
| to average net assets | | 1.33 | | 1.38 | | 1.46 | | 1.56 | | .14d |
| Ratio of net expenses | | | | | | | | | | |
| to average net assets | | 1.33 | | 1.38 | | 1.46 | | 1.56 | | .14d |
| Ratio of net investment income | | | | | | | | | | |
| (loss) to average net assets | | .17 | | (.05) | | (.24) | | (.33) | | .02d |
| Portfolio Turnover Rate | | 40.30 | | 37.93 | | 99.93 | | 121.01 | | 113.51 |
| |
| |
| |
| |
| |
|
| Net Assets, end of period | | | | | | | | | | |
| ($ x 1,000) | | 20,504 | | 15,651 | | 1,302 | | 122 | | 1 |
| |
| a | | From November 27, 2002 (commencement of initial offering) to December 31, 2002. | | | | |
| b | | Based on average shares outstanding at each month end. | | | | | | | | |
| c | | Exclusive of sales charge. | | | | | | | | | | |
| d | | Not annualized. | | | | | | | | | | |
| See notes to financial statements. | | | | | | | | | | |
NOTES TO FINANCIAL STATEMENTS
NOTE 1—Significant Accounting Policies:
Dreyfus Premier New Leaders Fund (the “fund”) is a separate diversified series of Strategic Funds, Inc. (the “Company”) which is registered under the Investment Company Act of 1940, as amended (the “Act”), as a diversified open-end management investment company and operates as a series company currently offering five series, including the fund.The fund’s investment objective is to maximize capital apprecia-tion.The Dreyfus Corporation (the “Manager” or “Dreyfus”) serves as the fund’s investment adviser. The Manager is a wholly-owned subsidiary of Mellon Financial Corporation (“Mellon Financial”).
On December 4, 2006, Mellon Financial and The Bank of New York Company, Inc. announced that they had entered into a definitive agreement to merge. The new company will be called The Bank of New York Mellon Corporation. As part of this transaction, Dreyfus would become a wholly-owned subsidiary of The Bank of New York Mellon Corporation.The transaction is subject to certain regulatory approvals and the approval of The Bank of New York Company, Inc.’s and Mellon Financial’s shareholders, as well as other customary conditions to closing. Subject to such approvals and the satisfaction of the other conditions, Mellon Financial and The Bank of New York Company, Inc. expect the transaction to be completed in the third quarter of 2007.
On May 17, 2006, the Board of Directors authorized the issuance of a second series of shares of the Company, and approved changing the name of the Company from “Dreyfus Premier New Leaders Fund, Inc.” to “Strategic Funds, Inc.” Outstanding shares were classified as shares of “Dreyfus Premier New Leaders Fund”.These changes were effective May 17, 2006.
Dreyfus Service Corporation (the “Distributor”), a wholly-owned subsidiary of the Manager, is the distributor of the fund’s shares.The fund is authorized to issue 100 million shares of $.001 par value Common Stock.The fund currently offers five classes of shares: Class A (35 million shares authorized), Class B (30 million shares authorized), Class C (15
24
million shares authorized), Class R (15 million shares authorized) and Class T (5 million shares authorized). Class A and Class T shares are subject to a sales charge imposed at the time of purchase. Class B shares are subject to a contingent deferred sales charge (“CDSC”) imposed on Class B share redemptions made within six years of purchase and automatically convert to Class A shares after six years. Class C shares are subject to a CDSC on Class C shares redeemed within one year of purchase. Class R shares are sold at net asset value per share only to institutional investors. Other differences between the classes include the services offered to and the expenses borne by each class and certain voting rights. Income,expenses (other than expenses attributable to a specific class),and realized and unrealized gains or losses on investments are allocated to each class of shares based on its relative net assets.
Effective March 1, 2006, Class A shares of the fund may be purchased at net asset value (“NAV”) without payment of a sales charge:
- By qualified investors who (i) purchase Class A shares directly through the Distributor, and (ii) have, or whose spouse or minor children have, beneficially owned shares and continuously maintained an open account directly through the Distributor in a Dreyfus-managed fund, including the fund, or a Founders Asset Management LLC
(“Founders”) managed fund since on or before February 28, 2006. Founders is a wholly-owned subsidiary of the Distributor. - With the cash proceeds from an investor’s exercise of employment- related stock options, whether invested in the fund directly or indi- rectly through an exchange from a Dreyfus-managed money market fund, provided that the proceeds are processed through an entity that has entered into an agreement with the Distributor specifically relat- ing to processing stock options. Upon establishing the account in the fund or the Dreyfus-managed money market fund, the investor and the investor’s spouse and minor children become eligible to purchase Class A shares of the fund at NAV, whether or not using the proceeds of the employment-related stock options.
NOTES TO FINANCIAL STATEMENTS (continued)
- By members of qualified affinity groups who purchase Class A shares directly through the Distributor, provided that the qualified affinity group has entered into an affinity agreement with the Distributor.
Effective March 1, 2006, Class A and Class T shares of the fund may be purchased at NAV without payment of a sales charge:
- For Dreyfus-sponsored IRA “Rollover Accounts” with the distrib- ution proceeds from qualified and non-qualified retirement plans or a Dreyfus-sponsored 403(b)(7) plan, provided that, in the case of a qualified or non-qualified retirement plan, the rollover is processed through an entity that has entered into an agreement with the Distributor specifically relating to processing rollovers. Upon estab- lishing the Dreyfus-sponsored IRA rollover account in the fund, the shareholder becomes eligible to make subsequent purchases of Class A or Class T shares of the fund at NAV in such account.
Effective June 1, 2006, the fund no longer offers Class B shares, except in connection with dividend reinvestment and permitted exchanges of Class B shares.
The Company accounts separately for the assets, liabilities and operations of each series. Expenses directly attributable to each series are charged to that series’ operations; expenses which are applicable to all series are allocated among them on a pro rata basis.
The fund’s financial statements are prepared in accordance with U.S. generally accepted accounting principles, which may require the use of management estimates and assumptions. Actual results could differ from those estimates.
The fund enters into contracts that contain a variety of indemnifications. The fund’s maximum exposure under these arrangements is unknown.The fund does not anticipate recognizing any loss related to these arrangements.
(a) Portfolio valuation: Investments in securities are valued at the last sales price on the securities exchange or national securities market on which such securities are primarily traded. Securities listed on the
26
National Market System for which market quotations are available are valued at the official closing price or, if there is no official closing price that day, at the last sales price. Securities not listed on an exchange or the national securities market, or securities for which there were no transactions, are valued at the average of the most recent bid and asked prices, except for open short positions, where the asked price is used for valuation purposes. Bid price is used when no asked price is available. Registered open-end investment companies that are not traded on an exchange are valued at their NAV. When market quotations or official closing prices are not readily available, or are determined not to reflect accurately fair value, such as when the value of a security has been significantly affected by events after the close of the exchange or market on which the security is principally traded (for example, a foreign exchange or market), but before the fund calculates its NAV, the fund may value these investments at fair value as determined in accordance with the procedures approved by the Board of Directors.Fair valuing of securities may be determined with the assistance of a pricing service using calculations based on indices of domestic securities and other appropriate indicators, such as prices of relevant ADR’s and futures contracts. For other securities that are fair valued by the Board of Directors, certain factors may be considered such as: fundamental analytical data, the nature and duration of restrictions on disposition, an evaluation of the forces that influence the market in which the securities are purchased and sold and public trading in similar securities of the issuer or comparable issuers. Financial futures are valued at the last sales price.
On September 20, 2006, the Financial Accounting Standards Board (FASB) released Statement of Financial Accounting Standards No. 157 “Fair Value Measurements” (“FAS 157”). FAS 157 establishes an authoritative definition of fair value, sets out a framework for measuring fair value, and requires additional disclosures about fair-value mea-surements.The application of FAS 157 is required for fiscal years beginning after November 15, 2007 and interim periods within those fiscal years. Management does not believe that the application of this standard will have a material impact on the financial statements of the fund.
NOTES TO FINANCIAL STATEMENTS (continued)
(b) Securities transactions and investment income: Securities transactions are recorded on a trade date basis. Realized gain and loss from securities transactions are recorded on the identified cost basis. Dividend income is recognized on the ex-dividend date and interest income, including, where applicable, accretion of discount and amortization of premium on investments, is recognized on the accrual basis.
The fund has an arrangement with the custodian bank whereby the fund receives earnings credits from the custodian when positive cash balances are maintained, which are used to offset custody fees. For financial reporting purposes, the fund includes net earnings credits as an expense offset in the Statement of Operations.
Pursuant to a securities lending agreement with Mellon Bank, N.A., an affiliate of the Manager, the fund may lend securities to qualified institutions. It is the fund’s policy, that at origination, all loans are secured by collateral of at least 102% of the value of U.S. securities loaned and 105% of the value of foreign securities loaned. Collateral equivalent to at least 100% of the market value of securities on loan is maintained at all times. Cash collateral is invested in certain money market mutual funds managed by the Manager.The fund is entitled to receive all income on securities loaned, in addition to income earned as a result of the lending transaction.Although each security loaned is fully collateralized, the fund bears the risk of delay in recovery of, or loss of rights in, the securities loaned should a borrower fail to return the securities in a timely manner.
(c) Affiliated issuers: Investments in other investment companies advised by the Manager are defined as “affiliated” in the Act.
(d) Dividends to shareholders: Dividends are recorded on the ex-dividend date. Dividends from investment income-net and dividends from net realized capital gain, if any, are normally declared and paid annually, but the fund may make distributions on a more frequent basis to comply with the distribution requirements of the Internal Revenue Code of 1986, as amended (the “Code”).To the extent that net realized capital gain can be offset by capital loss carryovers, it is the policy
28
of the fund not to distribute such gain. Income and capital gain distributions are determined in accordance with income tax regulations, which may differ from U.S. generally accepted accounting principles.
(e) Federal income taxes: It is the policy of the fund to continue to qualify as a regulated investment company, if such qualification is in the best interests of its shareholders, by complying with the applicable provisions of the Code, and to make distributions of taxable income sufficient to relieve it from substantially all federal income and excise taxes.
On July 13, 2006, the FASB released FASB Interpretation No. 48 “Accounting for Uncertainty in Income Taxes” (FIN 48). FIN 48 provides guidance for how uncertain tax positions should be recognized, measured, presented and disclosed in the financial statements. FIN 48 requires the evaluation of tax positions taken or expected to be taken in the course of preparing the fund’s tax returns to determine whether the tax positions are “more-likely-than-not” of being sustained by the applicable tax authority.Tax positions not deemed to meet the more-likely-than-not threshold would be recorded as a tax benefit or expense in the current year. Adoption of FIN 48 is required for fiscal years beginning after December 15, 2006 and is to be applied to all open tax years as of the effective date. Management does not believe that the application of this standard will have a material impact on the financial statements of the fund.
At December 31, 2006, the components of accumulated earnings on a tax basis were as follows: undistributed ordinary income $1,195,928, undistributed capital gains $18,899,727 and unrealized appreciation $298,046,157.
As a result of the fund’s merger with Dreyfus Premier Aggressive Growth Fund and Dreyfus Aggressive Growth Fund, capital losses of $12,238,096 are available to offset future gains. Based on certain provisions in the Code, the amount of losses which can be utilized in subsequent years is subject to an annual limitation. This acquired capital loss is expected to expire between 2007-2010.
NOTES TO FINANCIAL STATEMENTS (continued)
The tax character of distributions paid to shareholders during the fiscal periods ended December 31, 2006 and December 31, 2005 were as follows: ordinary income $12,632,464 and $14,505,354 and long-term capital gains $114,633,802 and $63,307,560, respectively.
During the period ended December 31, 2006, as a result of permanent book to tax differences, primarily due to the tax treatment for real estate investment trusts and capital losses utilized from acquired entities, the fund decreased accumulated undistributed investment income-net by $505,436, decreased accumulated net realized gain (loss) on investments by $2,554,088 and increased paid-in capital by $3,059,524. Net assets were not affected by this reclassification.
NOTE 2—Bank Line of Credit:
The fund participates with other Dreyfus-managed funds in a $350 million redemption credit facility (the “Facility”) to be utilized for temporary or emergency purposes, including the financing of redemptions. In connection therewith, the fund has agreed to pay commitment fees on its pro rata portion of the Facility. Interest is charged to the fund based on prevailing market rates in effect at the time of borrowing.
The average daily amount of borrowings outstanding under the Facility during the period ended December 31, 2006 was approximately $253,800, with a related weighted average annualized interest rate of 5.76% .
NOTE 3—Management Fee and Other Transactions With Affiliates:
(a) Pursuant to a management agreement (“Agreement”) with the Manager, the management fee is computed at the annual rate of .75% of the value of the fund’s average daily net assets and is payable monthly.
During the period ended December 31, 2006, the Distributor retained $86,061 and $416 from commissions earned on sales of the fund’s Class A and Class T shares, respectively, and $37,493 and $2,907 from CDSC on redemptions of the fund’s Class B and Class C shares, respectively.
30
(b) Under the Distribution Plan (the “Plan”) adopted pursuant to Rule 12b-1 under the Act, Class B, Class C and Class T shares pay the Distributor for distributing their shares at an annual rate of .75% of the value of the average daily net assets of Class B and Class C shares and .25% of the value of the average daily net assets of Class T shares. During the period ended December 31, 2006, Class B, Class C and Class T shares were charged $165,557, $175,489 and $50,130, respectively, pursuant to the Plan.
(c) Under the Shareholder Services Plan, Class A, Class B, Class C and Class T shares pay the Distributor at an annual rate of .25% of the value of their average daily net assets for the provision of certain services. The services provided may include personal services relating to shareholder accounts, such as answering shareholder inquiries regarding Class A, Class B, Class C and Class T shares and providing reports and other information, and services related to the maintenance of shareholder accounts. The Distributor may make payments to Service Agents (a securities dealer, financial institution or other industry professional) in respect of these services.The Distributor determines the amounts to be paid to Service Agents. During the period ended December 31, 2006, Class A, Class B, Class C and Class T shares were charged $2,754,473, $55,186, $58,496 and $50,130, respectively, pursuant to the Shareholder Services Plan.
The fund compensates Dreyfus Transfer, Inc., a wholly-owned subsidiary of the Manager, under a transfer agency agreement for providing personnel and facilities to perform transfer agency services for the fund. During the period ended December 31, 2006, the fund was charged $467,448 pursuant to the transfer agency agreement.
The fund compensates Mellon Bank, N.A., an affiliate of the Manager, under a custody agreement for providing custodial services for the fund. During the period ended December 31, 2006, the fund was charged $83,965 pursuant to the custody agreement.
NOTES TO FINANCIAL STATEMENTS (continued)
During the period ended December 31, 2006, the fund was charged $4,204 for services performed by the Chief Compliance Officer.
The components of Due to The Dreyfus Corporation and affiliates in the Statement of Assets and Liabilities consist of: management fees $777,256, Rule 12b-1 distribution plan fees $35,832, shareholder services plan fees $255,875, custodian fees $18,002, chief compliance officer fees $2,044 and transfer agency per account fees $75,464.
(d) Each Board member also serves as a Board member of other funds within the Dreyfus complex. Annual retainer fees and attendance fees are allocated to each fund based on net assets.
(e) Pursuant to an exemptive order from the SEC, the fund may invest its available cash balances in affiliated money market mutual funds. Management fees of the underlying money market mutual funds have been waived by the Manager.
NOTE 4—Securities Transactions:
The aggregate amount of purchases and sales of investment securities, excluding short-term securities, during the period ended December 31, 2006, amounted to $474,376,861 and $502,999,201, respectively.
At December 31, 2006, the cost of investments for federal income tax purposes was $918,530,368; accordingly, accumulated net unrealized appreciation on investments was $298,046,157, consisting of $315,037,966 gross unrealized appreciation and $16,991,809 gross unrealized depreciation.
32
| REPORT OF INDEPENDENT REGISTERED |
| PUBLIC ACCOUNTING FIRM |
| Shareholders and Board of Directors |
| Dreyfus Premier New Leaders Fund |
We have audited the accompanying statement of assets and liabilities of Dreyfus Premier New Leaders Fund, including the statement of investments, as of December 31, 2006, and the related statement of operations for the year then ended, the statement of changes in net assets for each of the two years in the period then ended, and financial highlights for each of the periods indicated therein. These financial statements and financial highlights are the responsibility of the Fund’s management. Our responsibility is to express an opinion on these financial statements and financial highlights based on our audits.
We conducted our audits in accordance with the standards of the Public Company Accounting Oversight Board (United States). Those standards require that we plan and perform the audit to obtain reasonable assurance about whether the financial statements and financial highlights are free of material misstatement. We were not engaged to perform an audit of the Fund’s internal control over financial reporting. Our audits included consideration of internal control over financial reporting as a basis for designing audit procedures that are appropriate in the circumstances, but not for the purpose of expressing an opinion on the effectiveness of the Fund’s internal control over financial reporting. Accordingly, we express no such opinion. An audit also includes examining, on a test basis, evidence supporting the amounts and disclosures in the financial statements and financial highlights, assessing the accounting principles used and significant estimates made by management, and evaluating the overall financial statement presentation. Our procedures included confirmation of securities owned as of December 31, 2006 by correspondence with the custodian.We believe that our audits provide a reasonable basis for our opinion.
In our opinion, the financial statements and financial highlights referred to above present fairly, in all material respects, the financial position of Dreyfus Premier New Leaders Fund at December 31, 2006, the results of its operations for the year then ended, the changes in its net assets for each of the two years in the period then ended, and the financial highlights for each of the indicated periods, in conformity with U. S. generally accepted accounting principles.
| New York, New York |
| February 15, 2007 |
The Fund 33
IMPORTANT TAX INFORMATION (Unaudited)
For federal tax purposes, the fund hereby designates $.5970 per share as a long-term capital gain distribution and $.4010 per share as a short-term capital gain distribution paid on March 29, 2006, and also designates $4.2760 per share as a long-term capital gain distribution and $.0460 per share as a short-term capital gain distribution paid on December 21, 2006. The fund also hereby designates 84.49% of the ordinary dividends paid during the fiscal year ended December 31, 2006 as qualifying for the corporate dividends received deduction. For the fiscal year ended December 31, 2006, certain dividends paid by the fund may be subject to a maximum tax rate of 15%, as provided for by the Jobs and Growth Tax Relief Reconciliation Act of 2003. Of the distributions paid during the fiscal year, $2,609,317 represents the maximum amount that may be considered qualified dividend income. Shareholders will receive notification in January 2007 of the percentage applicable to the preparation of their 2006 income tax returns.
PROXY RESULTS (Unaudited)
Strategic Funds, Inc. held a special meeting of shareholders on September 20, 2006. The proposal considered at the meeting, and the results, are as follows:
| | | | | Shares |
| |
| |
|
| | | Votes For | | Authority Withheld |
| |
| |
|
| To elect additional Board Members: | | | | |
| Gordon J. Davis † | | 11,204,479 | | 316,231 |
| Joni Evans † | | 11,199,303 | | 321,407 |
| Arnold S. Hiatt † | | 11,177,517 | | 343,193 |
| Burton N. Wallack † | | 11,207,038 | | 313,618 |
| |
| † Each new Board member’s term commenced on January 1, 2007. | | |
| In addition Joseph S. DiMartino, David W. Burke, Hodding Carter III, Ehud Houminer, Richard C. Leone, Hans |
| C. Mautner, Robin A. Melvin and John E. Zuccotti continue as Board members of the fund. |
34
| INFORMATION ABOUT THE REVIEW AND APPROVAL |
| OF THE FUND’S MANAGEMENT AGREEMENT (Unaudited) |
At a Meeting of the fund’s Board of Directors held on November 6, 2006, the Board considered the re-approval for an annual period of the fund’s Management Agreement,pursuant to which the Manager provides the fund with investment advisory and administrative services.The Board members, none of whom are “interested persons” (as defined in the Investment Company Act of 1940, as amended) of the fund, were assisted in their review by independent legal counsel and met with counsel in executive session separate from representatives of the Manager.
Analysis of Nature, Extent, and Quality of Services Provided to the Fund. The Board members received a presentation from representatives of the Manager regarding services provided to the fund and other funds in the Dreyfus fund complex, and discussed the nature, extent, and quality of the services provided to the fund pursuant to the fund’s Management Agreement.The Manager’s representatives reviewed the fund’s distribution of accounts and the relationships that the Manager has with various intermediaries and the different needs of each. The Manager’s representatives noted the diversity of distribution of the fund as well as among the funds in the Dreyfus fund complex, and the Manager’s corresponding need for broad, deep, and diverse resources to be able to provide ongoing shareholder services to each of the fund’s distribution channels. The Board also reviewed the number of shareholder accounts in the fund, as well as the fund’s asset size.
The Board members also considered the Manager’s research and portfolio management capabilities and that the Manager also provides oversight of day-to-day fund operations, including fund accounting and administration and assistance in meeting legal and regulatory requirements. The Board members also considered the Manager’s extensive administrative, accounting, and compliance infrastructure.
Comparative Analysis of the Fund’s Management Fee and Expense Ratio and Performance. The Board members reviewed reports prepared by Lipper, Inc., an independent provider of investment company data, which included information comparing the fund’s management fee and expense
| INFORMATION ABOUT THE | | REVIEW AND | | APPROVAL | | OF THE |
| FUND’S MANAGEMENT | | AGREEMENT | | (Unaudited) | | (continued) |
ratio with a group of comparable funds (the “Expense Group”) and with a broader group of funds (the “Expense Universe”) that were selected by Lipper. Included in the fund’s reports were comparisons of contractual and actual management fee rates and total operating expenses.
The Board members also reviewed the reports prepared by Lipper that presented the fund’s performance for various periods ended September 30, 2006, and placed significant emphasis on comparisons of total return performance for the fund to the same group of funds as the fund’s Expense Group (the “Performance Group”) and to a group of funds that was broader than the fund’s Expense Universe (the “Performance Universe”) that also were selected by Lipper.The Manager previously had furnished the Board with a description of the methodology Lipper used to select the fund’s Expense Group and Expense Universe, and Performance Group and Performance Universe.The Manager also provided a comparison of the fund’s total returns to the returns of the fund’s benchmark index for the past 10 calendar years.
The Board reviewed the results of the Expense Group and Expense Universe comparisons for various periods ended September 30, 2006. The Board reviewed the range of management fees and expense ratios of the funds in the Expense Group and Expense Universe, and noted that the fund’s contractual management fee was lower than the Expense Group median, and that the fund’s actual management fee was lower than the Expense Group and Expense Universe medians. The Board also noted that the fund’s total expense ratio was lower than the Expense Group and Expense Universe medians.
With respect to the fund’s performance, the Board noted that the fund achieved total return results at or higher than the Performance Group median for each reported time period up to 10 years. The Board also noted that the fund achieved total returns higher than the Performance Universe median for the majority of the reported time periods up to 10 years.
36
Representatives of the Manager reviewed with the Board members the fees paid to the Manager or its affiliates by mutual funds managed by the Manager or its affiliates that were reported in the same Lipper category as the fund (the “Similar Funds”), and explained the nature of the Similar Funds and the differences, from the Manager’s perspective, in providing services to the Similar Funds as compared to the fund.The Manager’s representatives also reviewed the costs associated with distribution through intermediaries.The Board discussed the relationship of the management fees paid in light of the Manager’s performance, and the services provided.The Board members considered the relevance of the fee information provided for the Similar Funds to evaluate the appropriateness and reasonableness of the fund’s management fee.The Manager’s representatives noted that there were no similarly managed institutional separate accounts or wrap fee accounts managed by the Manager or its affiliates with similar investment objectives, policies, and strategies as the fund.
Analysis of Profitability and Economies of Scale. The Manager’s representatives reviewed the dollar amount of expenses allocated and profit received by the Manager for the fund and the method used to determine such expenses and profit. The Board previously had been provided with information prepared by an independent consulting firm regarding the Manager’s approach to allocating costs to, and determining the profitability of, individual funds and the entire Dreyfus mutual fund complex.The Board also had been informed that the methodology had also been reviewed by an independent registered public accounting firm which, like the consultant, found the methodology to be reasonable. The consulting firm also analyzed where any economies of scale might emerge in connection with the management of the fund.The Board members evaluated the profitability analysis in light of the relevant circumstances for the fund, including any decline in fund assets from the prior year, and the extent to which economies
| INFORMATION ABOUT THE | | REVIEW AND | | APPROVAL | | OF THE |
| FUND’S MANAGEMENT | | AGREEMENT | | (Unaudited) | | (continued) |
of scale would be realized if the fund grows and whether fee levels reflect these economies of scale for the benefit of fund shareholders. The Board members also considered potential benefits to the Manager from acting as investment adviser to the fund and noted the soft dollar arrangements in effect with respect to trading the fund’s portfolio.
It was noted that the Board members should consider the Manager’s profitability with respect to the fund as part of their evaluation of whether the fees under the Management Agreement bear a reasonable relationship to the mix of services provided by the Manager, including the nature, extent, and quality of such services and that a discussion of economies of scale is predicated on increasing assets and that, if a fund’s assets had been decreasing, the possibility that the Manager may have realized any economies of scale would be less. It was noted that the profitability percentage for managing the fund was within ranges determined by appropriate court cases to be reasonable given the services rendered and the fund’s overall performance and generally superior service levels provided.
At the conclusion of these discussions, the Board agreed that it had been furnished with sufficient information to make an informed business decision with respect to continuation of the fund’s Management Agreement. Based on its discussions and considerations as described above, the fund’s Board made the following conclusions and determinations.
- The Board concluded that the nature, extent, and quality of the services provided by the Manager to the fund are adequate and appropriate.
- The Board was satisfied with the fund’s performance.
- The Board concluded that the fee paid to the Manager by the fund was reasonable in light of the services provided, comparative perfor- mance and expense and management fee information, costs of the services provided and profits to be realized and benefits derived or to be derived by the Manager from its relationship with the fund.
38
- The Board determined that the economies of scale which may accrue to the Manager and its affiliates in connection with the management of the fund had been adequately considered by the Manager in con- nection with the management fee rate charged to the fund, and that, to the extent in the future it were to be determined that material economies of scale had not been shared with the fund, the Board would seek to have those economies of scale shared with the fund.
The Board members considered these conclusions and determinations, along with the information received on a routine and regular basis throughout the year, and, without any one factor being dispositive, the Board determined that re-approval of the fund’s Management Agreement was in the best interests of the fund and its shareholders.
BOARD MEMBERS INFORMATION (Unaudited)
| Joseph S. DiMartino (63) |
| Chairman of the Board (1995) |
| Principal Occupation During Past 5 Years: |
| • Corporate Director and Trustee |
Other Board Memberships and Affiliations:
- The Muscular Dystrophy Association, Director
- Century Business Services, Inc., a provider of outsourcing functions for small and medium size companies, Director
- The Newark Group, a provider of a national market of paper recovery facilities, paperboard mills and paperboard converting plants, Director
- Sunair Services Corporation, engaging in the design, manufacture and sale of high frequency systems for long-range voice and data communications, as well as providing certain outdoor-related services to homes and businesses, Director
No. of Portfolios for which Board Member Serves: 190
———————
| David W. Burke (70) |
| Board Member (1994) |
| Principal Occupation During Past 5 Years: |
| • Corporate Director and Trustee. |
Other Board Memberships and Affiliations:
- John F. Kennedy Library Foundation, Director
- U.S.S. Constitution Museum, Director
No. of Portfolios for which Board Member Serves: 81
———————
| William Hodding Carter III (71) |
| Board Member (1988) |
| Principal Occupation During Past 5 Years: |
| • Professor of Leadership & Public Policy, University of North Carolina, Chapel Hill |
| (January 1, 2006-present) |
| • President and Chief Executive Officer of the John S. and James L. Knight Foundation |
| (February 1, 1998-February 1, 2006) |
| Other Board Memberships and Affiliations: |
| • The Century Foundation, Emeritus Director |
| • The Enterprise Corporation of the Delta, Director |
No. of Portfolios for which Board Member Serves: 30
40
| Gordon J. Davis (65) |
| Board Member (2006) |
| Principal Occupation During Past 5 Years: |
| • Partner in the law firm of LeBoeuf, Lamb, Greene & MacRae, LLP |
| • President, Lincoln Center for the Performing Arts, Inc. (2001) |
Other Board Memberships and Affiliations:
- Consolidated Edison, Inc., a utility company, Director
- Phoenix Companies, Inc., a life insurance company, Director
- Board Member/Trustee for several not-for-profit groups
No. of Portfolios for which Board Member Serves: 39
———————
| Joni Evans (64) |
| Board Member (2006) |
| Principal Occupation During Past 5 Years: |
| • Principal, Joni Evans Ltd. |
| • Senior Vice President of the William Morris Agency (2005) |
No. of Portfolios for which Board Member Serves: 30
———————
| Arnold S. Hiatt (79) |
| Board Member (2006) |
| Principal Occupation During Past 5 Years: |
| • Chairman of The Stride Rite Charitable Foundation |
| Other Board Memberships and Affiliations: |
| • Isabella Stewart Gardner Museum,Trustee |
| • John Merck Fund, a charitable trust,Trustee |
| • Business for Social Responsibility, Director |
| • The A.M. Fund,Trustee |
No. of Portfolios for which Board Member Serves: 30
———————
| Ehud Houminer (66) |
| Board Member (1994) |
| Principal Occupation During Past 5 Years: |
| • Executive-in-Residence at the Columbia Business School, Columbia University |
| Other Board Memberships and Affiliations: |
| • Avnet Inc., an electronics distributor, Director |
| • International Advisory Board to the MBA Program School of Management, Ben Gurion |
| University, Chairman |
| • Explore Charter School, Brooklyn, NY,Trustee |
No. of Portfolios for which Board Member Serves: 78
BOARD MEMBERS INFORMATION (Unaudited) (continued)
| Richard C. Leone (66) |
| Board Member (1984) |
| Principal Occupation During Past 5 Years: |
| • President of The Century Foundation (formerly,The Twentieth Century Fund, Inc.), a |
| tax exempt research foundation engaged in the study of economic, foreign policy and |
| domestic issues |
Other Board Memberships and Affiliations:
- The American Prospect, Director
- Center for American Progress, Director
No. of Portfolios for which Board Member Serves: 30
———————
| Hans C. Mautner (69) |
| Board Member (1984) |
| Principal Occupation During Past 5 Years: |
| • President—International Division and an Advisory Director of Simon Property Group, a |
| real estate investment company (1998-present) |
| • Director and Vice Chairman of Simon Property Group (1998-2003) |
| • Chairman and Chief Executive Officer of Simon Global Limited (1999-present) |
Other Board Memberships and Affiliations:
- Capital and Regional PLC, a British co-investing real estate asset manager, Director
- Member - Board of Managers of: Mezzacappa Long/Short Fund LLC
Mezzacappa Partners LLC
No. of Portfolios for which Board Member Serves: 30
———————
| Robin A. Melvin (43) |
| Board Member (1995) |
| Principal Occupation During Past 5 Years: |
| • Director, Boisi Family foundation, a private family foundation that supports youth-serving |
| organizations that promote the self sufficiency of youth from disadvantaged circumstances |
No. of Portfolios for which Board Member Serves: 30
———————
| Burton N. Wallack (56) |
| Board Member (2006) |
| Principal Occupation During Past 5 Years: |
| • President and co-owner of Wallack Management Company, a real estate management company |
| No. of Portfolios for which Board Member Serves: 30 |
42
| John E. Zuccotti (69) |
| Board Member (1984) |
| Principal Occupation During Past 5 Years: |
| • Chairman of Brookfield Financial Properties, Inc. |
| • Senior Counsel of Weil, Gotshal & Manges, LLP |
| • Chairman of the Real Estate Board of New York |
Other Board Memberships and Affiliations:
- Emigrant Savings Bank, Director
- Wellpoint, Inc., Director
- Visiting Nurse Service of New York, Director
- Columbia University,Trustee
- Doris Duke Charitable Foundation,Trustee
No. of Portfolios for which Board Member Serves: 30
———————
Once elected all Board Members serve for an indefinite term, but achieve Emeritus status upon reaching age 80.The address of the Board Members and Officers is in c/o The Dreyfus Corporation, 200 Park Avenue, New York, New York 10166.Additional information about the Board Members is available in the fund's Statement of Additional Information which can be obtained from Dreyfus free of charge by calling this toll free number: 1-800-554-4611.
OFFICERS OF THE FUND (Unaudited)
| J. DAVID OFFICER, President since |
| December 2006. |
Chief Operating Officer,Vice Chairman and a director of the Manager, and an officer of 90 investment companies (comprised of 190 portfolios) managed by the Manager. He is 58 years old and has been an employee of the Manager since April 1, 1998.
| MARK N. JACOBS, Vice President since |
| March 2000. |
Executive Vice President, Secretary and General Counsel of the Manager, and an officer of 91 investment companies (comprised of 206 portfolios) managed by the Manager. He is 60 years old and has been an employee of the Manager since June 1977.
| MICHAEL A. ROSENBERG, Vice President |
| and Secretary since August 2005. |
Associate General Counsel of the Manager, and an officer of 91 investment companies (comprised of 206 portfolios) managed by the Manager. He is 46 years old and has been an employee of the Manager since October 1991.
| JAMES BITETTO, Vice President and |
| Assistant Secretary since August 2005. |
Associate General Counsel and Assistant Secretary of the Manager, and an officer of 91 investment companies (comprised of 206 portfolios) managed by the Manager. He is 40 years old and has been an employee of the Manager since December 1996.
| JONI LACKS CHARATAN, Vice President |
| and Assistant Secretary since |
| August 2005. |
Associate General Counsel of the Manager, and an officer of 91 investment companies (comprised of 206 portfolios) managed by the Manager. She is 51 years old and has been an employee of the Manager since October 1988.
| JOSEPH M. CHIOFFI, Vice President and |
| Assistant Secretary since August 2005. |
Associate General Counsel of the Manager, and an officer of 91 investment companies (comprised of 206 portfolios) managed by the Manager. He is 45 years old and has been an employee of the Manager since June 2000.
| JANETTE E. FARRAGHER, Vice President |
| and Assistant Secretary since |
| August 2005. |
Associate General Counsel of the Manager, and an officer of 91 investment companies (comprised of 206 portfolios) managed by the Manager. She is 44 years old and has been an employee of the Manager since February 1984.
| JOHN B. HAMMALIAN, Vice President and |
| Assistant Secretary since August 2005. |
Associate General Counsel of the Manager, and an officer of 91 investment companies (comprised of 206 portfolios) managed by the Manager. He is 43 years old and has been an employee of the Manager since February 1991.
| ROBERT R. MULLERY, Vice President and |
| Assistant Secretary since August 2005. |
Associate General Counsel of the Manager, and an officer of 91 investment companies (comprised of 206 portfolios) managed by the Manager. He is 54 years old and has been an employee of the Manager since May 1986.
| JEFF PRUSNOFSKY, Vice President and |
| Assistant Secretary since August 2005. |
Associate General Counsel of the Manager, and an officer of 91 investment companies (comprised of 206 portfolios) managed by the Manager. He is 41 years old and has been an employee of the Manager since October 1990.
44
| JAMES WINDELS, Treasurer since |
| November 2001. |
Director – Mutual Fund Accounting of the Manager, and an officer of 91 investment companies (comprised of 206 portfolios) managed by the Manager. He is 48 years and has been an employee of the Manager since April 1985.
| ERIK D. NAVILOFF, Assistant Treasurer |
| since August 2005. |
Senior Accounting Manager – Taxable Fixed Income Funds of the Manager, and an officer of 91 investment companies (comprised of 206 portfolios) managed by the Manager. He is 38 years old and has been an employee of the Manager since November 1992.
| ROBERT ROBOL, Assistant Treasurer |
| since August 2005. |
Senior Accounting Manager – Money Market and Municipal Bond Funds of the Manager, and an officer of 91 investment companies (comprised of 206 portfolios) managed by the Manager. He is 42 years old and has been an employee of the Manager since October 1988.
| ROBERT SVAGNA, Assistant Treasurer |
| since December 2002. |
Senior Accounting Manager – Equity Funds of the Manager, and an officer of 91 investment companies (comprised of 206 portfolios) managed by the Manager. He is 39 years old and has been an employee of the Manager since November 1990.
| GAVIN C. REILLY, Assistant Treasurer |
| since December 2005. |
Tax Manager of the Investment Accounting and Support Department of the Manager, and an officer of 91 investment companies (comprised of 206 portfolios) managed by the Manager. He is 38 years old and has been an employee of the Manager since April 1991.
| JOSEPH W. CONNOLLY, Chief Compliance |
| Officer since October 2004. |
Chief Compliance Officer of the Manager and The Dreyfus Family of Funds (91 investment companies, comprised of 206 portfolios). From November 2001 through March 2004, Mr. Connolly was first Vice-President, Mutual Fund Servicing for Mellon Global Securities Services. In that capacity, Mr. Connolly was responsible for managing Mellon’s Custody, Fund Accounting and Fund Administration services to third-party mutual fund clients. He is 49 years old and has served in various capacities with the Manager since 1980, including manager of the firm’s Fund Accounting Department from 1997 through October 2001.
| WILLIAM GERMENIS, Anti-Money |
| Laundering Compliance Officer since |
| September 2002. |
Vice President and Anti-Money Laundering Compliance Officer of the Distributor, and the Anti-Money Laundering Compliance Officer of 87 investment companies (comprised of 202 portfolios) managed by the Manager. He is 36 years old and has been an employee of the Distributor since October 1998.
The Fund 45
| For More | | Information |
| |
|
| |
| Dreyfus Dreyfus Premier | | Transfer Agent & |
| New Leaders Fund | | Dividend Disbursing Agent |
| 200 Park Avenue | | |
| | | Dreyfus Transfer, Inc. |
| New York, NY 10166 | | |
| | | 200 Park Avenue |
| Manager | | New York, NY 10166 |
| The Dreyfus Corporation | | Distributor |
| 200 Park Avenue | | |
| | | Dreyfus Service Corporation |
| New York, NY 10166 | | |
| | | 200 Park Avenue |
| Custodian | | New York, NY 10166 |
| Mellon Bank, N.A. | | |
| One Mellon Bank Center | | |
| Pittsburgh, PA 15258 | | |
Telephone Call your financial representative or 1-800-554-4611
| Mail | | The Dreyfus Premier Family of Funds |
| | | 144 Glenn Curtiss Boulevard, Uniondale, NY 11556-0144 |
The fund files its complete schedule of portfolio holdings with the Securities and Exchange Commission (“SEC”) for the first and third quarters of each fiscal year on Form N-Q. The fund’s Forms N-Q are available on the SEC’s website at http://www.sec.gov and may be reviewed and copied at the SEC’s Public Reference Room in Washington, DC. Information on the operation of the Public Reference Room may be obtained by calling 1-202-551-8090.
A description of the policies and procedures that the fund uses to determine how to vote proxies relating to portfolio securities, and information regarding how the fund voted these proxies for the 12-month period ended June 30, 2006, is available at http://www.dreyfus.com and on the SEC’s website at http://www.sec.gov. The description of the policies and procedures is also available without charge, upon request, by calling 1-800-645-6561.
© 2007 Dreyfus Service Corporation

Item 2. Code of Ethics.
The Registrant has adopted a code of ethics that applies to the Registrant's principal executive officer, principal financial officer, principal accounting officer or controller, or persons performing similar functions. There have been no amendments to, or waivers in connection with, the Code of Ethics during the period covered by this Report.
Item 3. Audit Committee Financial Expert.
The Registrant's Board has determined that Richard C. Leone, a member of the Audit Committee of the Board, is an audit committee financial expert as defined by the Securities and Exchange Commission (the "SEC"). Richard C. Leone is "independent" as defined by the SEC for purposes of audit committee financial expert determinations.
Item 4. Principal Accountant Fees and Services
(a) Audit Fees. The aggregate fees billed for each of the last two fiscal years (the "Reporting Periods") for professional services rendered by the Registrant's principal accountant (the "Auditor") for the audit of the Registrant's annual financial statements, or services that are normally provided by the Auditor in connection with the statutory and regulatory filings or engagements for the Reporting Periods, were $29,024 in 2005 and $30,404 in 2006.
(b) Audit-Related Fees. The aggregate fees billed in the Reporting Periods for assurance and related services by the Auditor that are reasonably related to the performance of the audit of the Registrant's financial statements and are not reported under paragraph (a) of this Item 4 were $4,725 in 2005 and $5,122 in 2006. These services consisted of (i) security counts required by Rule 17f-2 under the Investment Company Act of 1940, as amended.
The aggregate fees billed in the Reporting Periods for non-audit assurance and related services by the Auditor to the Registrant's investment adviser (not including any sub-investment adviser whose role is primarily portfolio management and is subcontracted with or overseen by another investment adviser), and any entity controlling, controlled by or under common control with the investment adviser that provides ongoing services to the Registrant ("Service Affiliates"), that were reasonably related to the performance of the annual audit of the Service Affiliate, which required pre-approval by the Audit Committee were $0 in 2005 and $0 in 2006.
Note: For the second paragraph in each of (b) through (d) of this Item 4, certain of such services were not pre-approved prior to May 6, 2003, when such services were required to be pre-approved. On and after May 6, 2003, 100% of all services provided by the Auditor were pre-approved as required. For comparative purposes, the fees shown assume that all such services were pre-approved, including services that were not pre-approved prior to the compliance date of the pre-approval requirement.
(c) Tax Fees. The aggregate fees billed in the Reporting Periods for professional services rendered by the Auditor for tax compliance, tax advice and tax planning ("Tax Services") were $3,284 in 2005 and $4,356 in 2006. These services consisted of (i) review or preparation of U.S. federal, state, local and excise tax returns; (ii) U.S. federal, state and local tax planning, advice and assistance regarding statutory, regulatory or
administrative developments, (iii) tax advice regarding tax qualification matters and/or treatment of various financial instruments held or proposed to be acquired or held, and (iv) determination of Passive Foreign Investment Companies (as applicable).
The aggregate fees billed in the Reporting Periods for Tax Services by the Auditor to Service Affiliates which required pre-approval by the Audit Committee were $0 in 2005 and $0 in 2006.
(d) All Other Fees. The aggregate fees billed in the Reporting Periods for products and services provided by the Auditor, other than the services reported in paragraphs (a) through (c) of this Item, were $1,665 in 2005 and $1,933 in 2006. These services consisted of a review of the Registrant's anti-money laundering program.
The aggregate fees billed in the Reporting Periods for Non-Audit Services by the Auditor to Service Affiliates, other than the services reported in paragraphs (b) through (c) of this Item, which required pre-approval by the Audit Committee were $0 in 2005 and $0 in 2006.
Audit Committee Pre-Approval Policies and Procedures. The Registrant's Audit Committee has established policies and procedures (the "Policy") for pre-approval (within specified fee limits) of the Auditor's engagements for non-audit services to the Registrant and Service Affiliates without specific case-by-case consideration. Pre-approval considerations include whether the proposed services are compatible with maintaining the Auditor's independence. Pre-approvals pursuant to the Policy are considered annually.
Non-Audit Fees. The aggregate non-audit fees billed by the Auditor for services rendered to the Registrant, and rendered to Service Affiliates, for the Reporting Periods were $758,091 in 2005 and $383,726 in 2006.
Auditor Independence. The Registrant's Audit Committee has considered whether the provision of non-audit services that were rendered to Service Affiliates which were not pre-approved (not requiring pre-approval) is compatible with maintaining the Auditor's independence.
| Item 5. | | Audit Committee of Listed Registrants. |
| | | Not applicable. |
| Item 6. | | Schedule of Investments. |
| | | Not applicable. |
| Item 7. | | Disclosure of Proxy Voting Policies and Procedures for Closed-End Management |
| | | Investment Companies. |
| | | Not applicable. |
| Item 8. | | Portfolio Managers of Closed-End Management Investment Companies. |
| | | Not applicable. |
| Item 9. | | Purchases of Equity Securities by Closed-End Management Investment Companies and |
| | | Affiliated Purchasers. |
| | | Not applicable. |
Item 10. Submission of Matters to a Vote of Security Holders.
The Registrant has a Nominating Committee (the "Committee"), which is responsible for selecting and nominating persons for election or appointment by the Registrant's Board as Board members. The Committee has adopted a Nominating Committee Charter (the "Charter"). Pursuant to the Charter, the Committee will consider recommendations for nominees from shareholders submitted to the Secretary of the Registrant, c/o The Dreyfus Corporation Legal Department, 200 Park Avenue, 8th Floor East, New York, New York 10166. A nomination submission must include information regarding the recommended nominee as specified in the Charter. This information includes all information relating to a recommended nominee that is required to be disclosed in solicitations or proxy statements for the election of Board members, as well as information sufficient to evaluate the factors to be considered by the Committee, including character and integrity, business and professional experience, and whether the person has the ability to apply sound and independent business judgment and would act in the interests of the Registrant and its shareholders.
Nomination submissions are required to be accompanied by a written consent of the individual to stand for election if nominated by the Board and to serve if elected by the shareholders, and such additional information must be provided regarding the recommended nominee as reasonably requested by the Committee.
Item 11. Controls and Procedures.
(a) The Registrant's principal executive and principal financial officers have concluded, based on their evaluation of the Registrant's disclosure controls and procedures as of a date within 90 days of the filing date of this report, that the Registrant's disclosure controls and procedures are reasonably designed to ensure that information required to be disclosed by the Registrant on Form N-CSR is recorded, processed, summarized and reported within the required time periods and that information required to be disclosed by the Registrant in the reports that it files or submits on Form N-CSR is accumulated and communicated to the Registrant's management, including its principal executive and principal financial officers, as appropriate to allow timely decisions regarding required disclosure.
(b) There were no changes to the Registrant's internal control over financial reporting that occurred during the second fiscal quarter of the period covered by this report that have materially affected, or are reasonably likely to materially affect, the Registrant's internal control over financial reporting.
Item 12. Exhibits.
| (a)(1) | | Code of ethics referred to in Item 2. |
| (a)(2) | | Certifications of principal executive and principal financial officers as required by Rule 30a-2(a) |
| under the Investment Company Act of 1940. |
| (a)(3) | | Not applicable. |
| (b) | | Certification of principal executive and principal financial officers as required by Rule 30a-2(b) |
| under the Investment Company Act of 1940. |
Pursuant to the requirements of the Securities Exchange Act of 1934 and the Investment Company Act of 1940, the Registrant has duly caused this Report to be signed on its behalf by the undersigned, thereunto duly authorized.
Strategic Funds, Inc.
| By: | | /s/ J. David Officer |
| | | J. David Officer |
| | | President |
| |
| Date: | | February 27, 2007 |
| |
| Pursuant to the requirements of the Securities Exchange Act of 1934 and the Investment Company Act of |
| 1940, this Report has been signed below by the following persons on behalf of the Registrant and in the |
| capacities and on the dates indicated. |
| |
| By: | | /s/ J. David Officer |
| | | J. David Officer |
| | | President |
| |
| Date: | | February 27, 2007 |
| |
| By: | | /s/ James Windels |
| | | James Windels |
| | �� | Treasurer |
| |
| Date: | | February 27, 2007 |
| |
| EXHIBIT INDEX |
| |
| | | (a)(1) | | Code of ethics referred to in Item 2. |
| |
| | | (a)(2) | | Certifications of principal executive and principal financial officers as required by Rule 30a- |
| | | 2(a) under the Investment Company Act of 1940. (EX-99.CERT) |
| |
| | | (b) | | Certification of principal executive and principal financial officers as required by Rule 30a- |
| | | 2(b) under the Investment Company Act of 1940. (EX-99.906CERT) |
Exhibit (a)(1)