UNITED STATES
SECURITIES AND EXCHANGE COMMISSION
Washington, D.C. 20549
FORM N-CSR
CERTIFIED SHAREHOLDER REPORT OF REGISTERED MANAGEMENT
INVESTMENT COMPANIES
| Investment Company Act file number | 811-03940 | |||||
| BNY Mellon Strategic Funds | ||||||
| (Exact name of Registrant as specified in charter) | ||||||
c/o BNY Mellon Investment Adviser, Inc. 240 Greenwich Street New York, New York 10286 | ||||||
| (Address of principal executive offices) (Zip code) | ||||||
Deirdre Cunnane, Esq. 240 Greenwich Street New York, New York 10286 | ||||||
| (Name and address of agent for service) | ||||||
| Registrant's telephone number, including area code: | (212) 922-6400 | |||||
Date of fiscal year end:
| 11/30 | |||||
| Date of reporting period: | 11/30/23
| |||||
The following N-CSR relates only to the Registrant's series listed below and does not relate to any series of the Registrant with a different fiscal year end and, therefore, different N-CSR reporting requirements. A separate N-CSR will be filed for any series with a different fiscal year end, as appropriate.
-BNY Mellon Global Stock Fund
-BNY Mellon International Stock Fund
-BNY Mellon Select Managers Small Cap Value Fund
-BNY Mellon U.S. Equity Fund
FORM N-CSR
Item 1. Reports to Stockholders.
BNY Mellon Global Stock Fund
ANNUAL REPORT November 30, 2023 |
|

IMPORTANT NOTICE – UPCOMING CHANGES TO ANNUAL AND SEMI-ANNUAL REPORTS
The Securities and Exchange Commission (the “SEC”) has adopted rule and form amendments that will result in changes to the design and delivery of annual and semi-annual fund reports (“Reports”). Beginning in July 2024, Reports will be streamlined to highlight key information. Certain information currently included in Reports, including financial statements, will no longer appear in the Reports but will be available online, delivered free of charge to shareholders upon request, and filed with the SEC.
If you previously elected to receive the fund’s Reports electronically, you will continue to do so. Otherwise, you will receive paper copies of the fund’s re-designed Reports by USPS mail in the future. If you would like to receive the fund’s Reports (and/or other communications) electronically instead of by mail, please contact your financial advisor or, if you are a direct investor, please log into your mutual fund account at www.bnymellonim.com/us and select “E-Delivery” under the Profile page. You must be registered for online account access before you can enroll in E-Delivery.
Save time. Save paper. View your next shareholder report online as soon as it’s available. Log into www.im.bnymellon.com and sign up for eCommunications. It’s simple and only takes a few minutes. |
The views expressed in this report reflect those of the portfolio manager(s) only through the end of the period covered and do not necessarily represent the views of BNY Mellon Investment Adviser, Inc. or any other person in the BNY Mellon Investment Adviser, Inc. organization. Any such views are subject to change at any time based upon market or other conditions and BNY Mellon Investment Adviser, Inc. disclaims any responsibility to update such views. These views may not be relied on as investment advice and, because investment decisions for a fund in the BNY Mellon Family of Funds are based on numerous factors, may not be relied on as an indication of trading intent on behalf of any fund in the BNY Mellon Family of Funds. |
Not FDIC-Insured • Not Bank-Guaranteed • May Lose Value |
Contents
THE FUND
Information About the Renewal of | |
FOR MORE INFORMATION
Back Cover
DISCUSSION OF FUND PERFORMANCE (Unaudited)
For the period from December 1, 2022, through November 30, 2023, as provided by Charlie Macquaker, Roy Leckie, Jane Henderson, Fraser Fox and Maxim Skorniakov, members of the Investment Executive group at Walter Scott & Partners Limited (Walter Scott), sub-adviser.
Market and Fund Performance Overview
For the 12-month period ended November 30, 2023, the BNY Mellon Global Stock Fund (the “fund”) produced a return of 10.82% for Class A shares, 9.94% for Class C shares, 11.19% for Class I shares and 11.17% for Class Y shares.1 For the same period, the fund’s benchmark, the MSCI World Index (the “Index”), produced a total return of 12.98%.2
Global markets gained ground during the reporting period, as global economic growth remained positive in the face of high inflation and rising interest rates, the U.S. Federal Reserve (the “Fed”) appeared to near an inflection point in its rate cycle, and the Chinese economy reopened after the government rescinded its “zero-COVID-19” policy. The fund underperformed the Index largely due to unfavorable stock selection in the information technology and communication services sectors.
The Fund’s Investment Approach
The fund seeks long-term total return. To pursue its goal, the fund normally invests at least 80% of its net assets, plus any borrowings for investment purposes, in stocks. The fund’s investments will be focused on companies located in developed markets. The fund ordinarily invests in at least three countries and is not geographically limited in its investment selection but, at times, may invest a substantial portion of its assets in a single country. The fund may invest in the securities of companies of any market capitalization. Walter Scott seeks investment opportunities in companies with fundamental strengths that indicate the potential for sustainable growth. Walter Scott focuses on individual stock selection, building the fund’s portfolio from the bottom up through extensive fundamental research. The investment process begins with the screening of reported company financials. Companies that meet certain broad, absolute and trend criteria are candidates for more detailed financial analysis. The fund’s Investment Team collectively reviews and selects those stocks that meet Walter Scott’s criteria, and where the expected growth rate is combined with a reasonable valuation for the underlying equity. Geographic and sector allocations are the result of, not part of, the investment process, because the Investment Team’s sole focus is on the analysis of, and investment in, individual companies.
Global Equities Rebound on Positive Macroeconomic Trends
The outlook for inflation and the trajectory of monetary policy continued to dominate the narrative within financial markets during the reporting period. Despite hawkish rhetoric and actions from central banks, the early months of the period saw evidence of decelerating price growth in the United States, raising hopes that inflation had peaked and driving risk assets higher. Markets were also encouraged by China’s easing of its strict COVID-19 restrictions. In Europe, mild winter weather and effective management of reserves averted a potential energy crisis related to the reduction in supply of Russian oil and gas.
In February and March 2023, signs of interest-rate-related stress emerged within the U.S. banking sector. Equities dipped broadly, before swift action from federal authorities and
2
major banks eased investors’ concerns, enabling markets to regain upward momentum in mid-March. Global economic growth remained generally positive despite high inflation and rising interest rates. The U.S. economy continued to expand, supported by historically high levels of employment, strong wage growth and steady consumer spending. European economies remained in broadly positive territory as well, despite some notably weak areas, such as Germany. China’s reopening proved weaker than expected, while worsening U.S.-China relations further challenged the world’s second-largest economy, bringing the threat of U.S. restrictions on investments in China in areas such as artificial intelligence (“AI”), quantum computing and semiconductors.
Market sentiment turned negative in August, as hawkish comments from the Fed dashed hopes that the central bank might soon reverse course and begin to reduce interest rates. As investors absorbed the increasing likelihood that rates would remain higher for longer, stocks lost some of their earlier gains before turning positive again in November, as prospects increased for rate cuts in 2024.
Stock Selection Detracts from Relative Returns
The fund lagged the Index most significantly in the information technology and communication services sectors, largely due to underweight or zero exposure to high-flying, mega-cap market leaders driven by the market’s appetite for shares in AI-related companies. Specifically, while the fund held modest positions in Microsoft Corp. and Alphabet, Inc., it lacked exposure to NVIDIA Corp., Apple, Inc., Meta Platforms, Inc., Tesla, Inc. and Amazon.com, Inc. From a regional perspective, positions in the Pacific ex-Japan detracted most significantly from relative returns. Australia-based biotechnology company CSL Ltd. underperformed most notably, hampered by a slow post-pandemic business recovery.
Conversely, the fund outperformed the Index in the consumer staples and materials sectors. Top performers in consumer staples included France-based, high-end consumer products maker L’Oréal SA, which benefited from strong demand for luxury goods and a reacceleration of business in China, and Canada-based global convenience store chain Alimentation Couche-Tard, Inc., which experienced increased store traffic as consumers faced higher prices for everyday products. Among materials holdings, shares in US-based industrial gas producer Linde PLC rose after the company provided strong guidance based on resilient business fundamentals, while Japan-based diversified chemicals producer Shin-Etsu Chemical Co. Ltd. reported strong sales of silicon to the semiconductor industry related to AI demand. Regionally, European positions generated the strongest support for the Fund’s returns, with notably robust performance from Denmark-based pharmaceutical company Novo Nordisk A/S, which gained ground on strong sales and market optimism regarding the company’s recently launched obesity drugs.
Focusing on High-Quality Companies with Strong Fundamentals
As of the end of the reporting period, we are starting to see the effects of central banks’ aggressive rate hikes in various segments of the global economy, with further impacts likely as companies and consumers cope with an environment of high rates. While many companies have effectively controlled costs and continued to report reasonably strong earnings despite those pressures, we expect businesses to face increasing difficulties in meeting financial expectations in the months to come. We believe the fund’s holdings are relatively well positioned to outperform in the face of prevailing market uncertainties due to
3
DISCUSSION OF FUND PERFORMANCE (Unaudited) (continued)
their high-quality, defensive characteristics and solid fundamentals, which enable them to operate effectively in varying economic environments. Our focus on profitability, financial resilience and management quality is as strong as ever, given the challenges we expect may lie ahead.
December 15, 2023
1 Total return includes reinvestment of dividends and any capital gains paid and does not take into consideration the maximum initial sales charge in the case of Class A shares, or the applicable contingent deferred sales charge imposed on redemptions in the case of Class C shares. Had these charges been reflected, returns would have been lower. Past performance is no guarantee of future results. Share price, yield and investment return fluctuate such that upon redemption, fund shares may be worth more or less than their original cost.
2 Source: Lipper Inc. — The MSCI World Index is a free float-adjusted, market capitalization-weighted index that is designed to measure the equity market performance of developed markets. It reflects reinvestment of net dividends and, where applicable, capital gain distributions. Investors cannot invest directly in any index.
Equities are subject generally to market, market sector, market liquidity, issuer and investment style risks, among other factors, to varying degrees, all of which are more fully described in the fund’s prospectus.
Investing internationally involves special risks, including changes in currency exchange rates, political, economic, and social instability, a lack of comprehensive company information, differing auditing and legal standards, and less market liquidity. These risks generally are greater with emerging-market countries than with more economically and politically established foreign countries.
Small and midsized company stocks tend to be more volatile and less liquid than larger company stocks as these companies are less established and have more volatile earnings histories.
4
FUND PERFORMANCE (Unaudited)

Comparison of change in value of a $10,000 investment in Class A shares, Class C shares, and Class I shares of BNY Mellon Global Stock Fund with a hypothetical investment of $10,000 in the MSCI World Index (the “Index”).
† Source: Lipper Inc.
Past performance is not predictive of future performance.
The above graph compares a hypothetical investment of $10,000 made in each of the Class A shares, Class C shares, and Class I shares of BNY Mellon Global Stock Fund on 11/30/13 to a hypothetical investment of $10,000 made in the Index on that date. All dividends and capital gain distributions are reinvested.
The fund’s performance shown in the line graph above takes into account the maximum initial sales charge on Class A shares and all other applicable fees and expenses on Class A shares, Class C shares, and Class I shares. The Index is a free float-adjusted market capitalization-weighted index that is designed to measure the equity market performance of developed markets. Unlike a mutual fund, the Index is not subject to charges, fees and other expenses. Investors cannot invest directly in any index. Further information relating to fund performance, including expense reimbursements, if applicable, is contained in the Financial Highlights section of the prospectus and elsewhere in this report.
5
FUND PERFORMANCE (Unaudited) (continued)
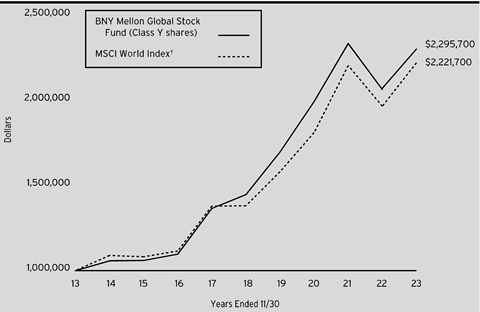
Comparison of change in value of a $1,000,000 investment in Class Y shares of BNY Mellon Global Stock Fund with a hypothetical investment of $1,000,000 in the MSCI World Index (the “Index”).
† Source: Lipper Inc.
Past performance is not predictive of future performance.
The above graph compares a hypothetical investment of $1,000,000 made in Class Y shares of BNY Mellon Global Stock Fund on 11/30/13 to a hypothetical investment of $1,000,000 made in the Index on that date. All dividends and capital gain distributions are reinvested.
The fund’s performance shown in the line graph above takes into account all applicable fees and expenses on the fund’s Class Y shares. The Index is a free float-adjusted market capitalization-weighted index that is designed to measure the equity market performance of developed markets. Unlike a mutual fund, the Index is not subject to charges, fees and other expenses. Investors cannot invest directly in any index. Further information relating to fund performance, including expense reimbursements, if applicable, is contained in the Financial Highlights section of the prospectus and elsewhere in this report.
6
Average Annual Total Returns as of 11/30/2023 | ||||
| 1 Year | 5 Years | 10 Years | |
Class A shares | ||||
with maximum sales charge (5.75%) | 4.47% | 8.03% | 7.68% | |
without sales charge | 10.82% | 9.32% | 8.32% | |
Class C shares | ||||
with applicable redemption charge † | 8.95% | 8.47% | 7.48% | |
without redemption | 9.94% | 8.47% | 7.48% | |
Class I shares | 11.19% | 9.64% | 8.63% | |
Class Y shares | 11.17% | 9.67% | 8.67% | |
MSCI World Index | 12.98% | 9.97% | 8.31% | |
† The maximum contingent deferred sales charge for Class C shares is 1% for shares redeemed within one year of the date of purchase.
The performance data quoted represents past performance, which is no guarantee of future results. Share price and investment return fluctuate and an investor’s shares may be worth more or less than original cost upon redemption. Current performance may be lower or higher than the performance quoted. Go to www.im.bnymellon.com for the fund’s most recent month-end returns.
The fund's performance shown in the graphs and table does not reflect the deduction of taxes that a shareholder would pay on fund distributions or the redemption of fund shares. In addition to the performance of Class A shares shown with and without a maximum sales charge, the fund's performance shown in the table takes into account all other applicable fees and expenses on all classes.
7
UNDERSTANDING YOUR FUND’S EXPENSES (Unaudited)
As a mutual fund investor, you pay ongoing expenses, such as management fees and other expenses. Using the information below, you can estimate how these expenses affect your investment and compare them with the expenses of other funds. You also may pay one-time transaction expenses, including sales charges (loads) and redemption fees, which are not shown in this section and would have resulted in higher total expenses. For more information, see your fund’s prospectus or talk to your financial adviser.
Review your fund’s expenses
The table below shows the expenses you would have paid on a $1,000 investment in BNY Mellon Global Stock Fund from June 1, 2023 to November 30, 2023. It also shows how much a $1,000 investment would be worth at the close of the period, assuming actual returns and expenses.
Expenses and Value of a $1,000 Investment |
| |||||
Assume actual returns for the six months ended November 30, 2023 |
| |||||
|
|
|
|
|
|
|
|
| Class A | Class C | Class I | Class Y |
|
Expenses paid per $1,000† | $6.24 | $10.51 | $4.71 | $4.61 |
| |
Ending value (after expenses) | $1,039.60 | $1,035.10 | $1,041.40 | $1,041.10 |
| |
COMPARING YOUR FUND’S EXPENSES WITH THOSE OF OTHER FUNDS (Unaudited)
Using the SEC’s method to compare expenses
The Securities and Exchange Commission (“SEC”) has established guidelines to help investors assess fund expenses. Per these guidelines, the table below shows your fund’s expenses based on a $1,000 investment, assuming a hypothetical 5% annualized return. You can use this information to compare the ongoing expenses (but not transaction expenses or total cost) of investing in the fund with those of other funds. All mutual fund shareholder reports will provide this information to help you make this comparison. Please note that you cannot use this information to estimate your actual ending account balance and expenses paid during the period.
Expenses and Value of a $1,000 Investment |
| |||||
Assuming a hypothetical 5% annualized return for the six months ended November 30, 2023 |
| |||||
|
|
|
|
|
|
|
|
| Class A | Class C | Class I | Class Y |
|
Expenses paid per $1,000† | $6.17 | $10.40 | $4.66 | $4.56 |
| |
Ending value (after expenses) | $1,018.95 | $1,014.74 | $1,020.46 | $1,020.56 |
| |
† | Expenses are equal to the fund’s annualized expense ratio of 1.22% for Class A, 2.06% for Class C, .92% for Class I and .90% for Class Y, multiplied by the average account value over the period, multiplied by 183/365 (to reflect the one-half year period). | |||||
8
STATEMENT OF INVESTMENTS
November 30, 2023
Description | Shares | Value ($) | |||||
Common Stocks - 98.9% | |||||||
Australia - 1.9% | |||||||
CSL Ltd. | 103,600 | 17,950,614 | |||||
Canada - 4.8% | |||||||
Alimentation Couche-Tard, Inc. | 415,300 | 23,688,581 | |||||
Canadian National Railway Co. | 183,700 | 21,316,483 | |||||
45,005,064 | |||||||
Denmark - 4.3% | |||||||
Novo Nordisk A/S, Cl. B | 392,200 | 39,829,032 | |||||
Finland - .4% | |||||||
Kone OYJ, Cl. B | 79,612 | 3,534,766 | |||||
France - 6.3% | |||||||
Dassault Systemes SE | 257,300 | 12,033,253 | |||||
L'Oreal SA | 49,000 | 22,990,698 | |||||
LVMH Moet Hennessy Louis Vuitton SE | 30,700 | 23,482,091 | |||||
58,506,042 | |||||||
Hong Kong - 3.1% | |||||||
AIA Group Ltd. | 2,341,400 | 20,202,829 | |||||
Prudential PLC | 759,900 | 8,279,068 | |||||
28,481,897 | |||||||
Ireland - 1.9% | |||||||
Experian PLC | 474,200 | 17,378,920 | |||||
Japan - 6.7% | |||||||
Keyence Corp. | 58,528 | 25,008,423 | |||||
Shin-Etsu Chemical Co. Ltd. | 652,500 | 22,938,284 | |||||
SMC Corp. | 29,600 | 14,863,888 | |||||
62,810,595 | |||||||
Netherlands - 1.0% | |||||||
ASML Holding NV | 13,600 | 9,222,643 | |||||
Spain - 2.3% | |||||||
Industria de Diseno Textil SA | 523,800 | 21,569,013 | |||||
Switzerland - 4.7% | |||||||
Lonza Group AG | 16,600 | 6,414,800 | |||||
Nestle SA | 156,800 | 17,789,288 | |||||
Roche Holding AG | 71,600 | 19,300,194 | |||||
43,504,282 | |||||||
Taiwan - 2.7% | |||||||
Taiwan Semiconductor Manufacturing Co. Ltd., ADR | 261,300 | 25,427,103 | |||||
United Kingdom - 2.1% | |||||||
Compass Group PLC | 785,900 | 19,872,954 | |||||
United States - 56.7% | |||||||
Adobe, Inc. | 54,700 | a | 33,422,247 | ||||
9
STATEMENT OF INVESTMENTS (continued)
Description | Shares | Value ($) | |||||
Common Stocks - 98.9% (continued) | |||||||
United States - 56.7% (continued) | |||||||
Alphabet, Inc., Cl. C | 203,040 | a | 27,191,117 | ||||
Amphenol Corp., Cl. A | 233,300 | 21,227,967 | |||||
Automatic Data Processing, Inc. | 99,200 | 22,808,064 | |||||
Booking Holdings, Inc. | 5,960 | a | 18,629,172 | ||||
Cisco Systems, Inc. | 364,500 | 17,634,510 | |||||
Cognex Corp. | 173,200 | 6,529,640 | |||||
Cognizant Technology Solutions Corp., Cl. A | 257,800 | 18,143,964 | |||||
Costco Wholesale Corp. | 36,700 | 21,753,558 | |||||
Edwards Lifesciences Corp. | 284,100 | a | 19,236,411 | ||||
Fastenal Co. | 314,900 | 18,884,553 | |||||
Fortinet, Inc. | 255,600 | a | 13,434,336 | ||||
Intuitive Surgical, Inc. | 62,000 | a | 19,272,080 | ||||
Linde PLC | 67,400 | 27,888,098 | |||||
Mastercard, Inc., Cl. A | 65,800 | 27,230,014 | |||||
Microsoft Corp. | 102,400 | 38,800,384 | |||||
Moody's Corp. | 25,980 | 9,481,661 | |||||
NIKE, Inc., Cl. B | 177,300 | 19,550,871 | |||||
Old Dominion Freight Line, Inc. | 45,790 | 17,815,057 | |||||
O'Reilly Automotive, Inc. | 12,500 | a | 12,279,750 | ||||
Paychex, Inc. | 148,100 | 18,063,757 | |||||
Stryker Corp. | 66,700 | 19,765,211 | |||||
Texas Instruments, Inc. | 125,100 | 19,104,021 | |||||
The TJX Companies, Inc. | 206,400 | 18,185,904 | |||||
The Walt Disney Company | 98,300 | 9,111,427 | |||||
Waters Corp. | 63,100 | a | 17,706,491 | ||||
West Pharmaceutical Services, Inc. | 43,700 | 15,328,212 | |||||
528,478,477 | |||||||
Total Common Stocks (cost $391,337,947) | 921,571,402 | ||||||
1-Day | |||||||
Investment Companies - 1.9% | |||||||
Registered Investment Companies - 1.9% | |||||||
Dreyfus Institutional Preferred Government Plus Money Market Fund, Institutional Shares | 5.41 | 18,144,985 | b | 18,144,985 | |||
Total Investments (cost $409,482,932) | 100.8% | 939,716,387 | |||||
Liabilities, Less Cash and Receivables | (.8%) | (7,601,124) | |||||
Net Assets | 100.0% | 932,115,263 | |||||
ADR—American Depositary Receipt
a Non-income producing security.
b Investment in affiliated issuer. The investment objective of this investment company is publicly available and can be found within the investment company’s prospectus.
10
Portfolio Summary (Unaudited) † | Value (%) |
Pharmaceuticals, Biotechnology & Life Sciences | 12.5 |
Software & Services | 12.4 |
Technology Hardware & Equipment | 7.6 |
Health Care Equipment & Services | 6.2 |
Commercial & Professional Services | 6.2 |
Semiconductors & Semiconductor Equipment | 5.8 |
Consumer Discretionary Distribution | 5.6 |
Materials | 5.5 |
Consumer Staples Distribution | 4.9 |
Consumer Durables & Apparel | 4.6 |
Transportation | 4.2 |
Consumer Services | 4.1 |
Capital Goods | 4.0 |
Financial Services | 3.9 |
Media & Entertainment | 3.9 |
Insurance | 3.1 |
Household & Personal Products | 2.5 |
Investment Companies | 1.9 |
Food, Beverage & Tobacco | 1.9 |
100.8 |
† Based on net assets.
See notes to financial statements.
11
STATEMENT OF INVESTMENTS (continued)
Affiliated Issuers | ||||||
Description | Value ($) 11/30/2022 | Purchases ($)† | Sales ($) | Value ($) 11/30/2023 | Dividends/ | |
Registered Investment Companies - 1.9% | ||||||
Dreyfus Institutional Preferred Government Plus Money Market Fund, Institutional Shares - 1.9% | 8,741,138 | 287,232,081 | (277,828,234) | 18,144,985 | 691,514 | |
Investment of Cash Collateral for Securities Loaned - .0%†† | ||||||
Dreyfus Institutional Preferred Government Plus Money Market Fund, SL Shares - .0% | 3,484,166 | 127,528 | (3,611,694) | - | 200 | †† |
Total - 1.9% | 12,225,304 | 287,359,609 | (281,439,928) | 18,144,985 | 691,714 | |
† Includes reinvested dividends/distributions.
†† Represents securities lending income earned from the reinvestment of cash collateral from loaned securities, net of fees and collateral investment expenses, and other payments to and from borrowers of securities.
See notes to financial statements.
12
STATEMENT OF ASSETS AND LIABILITIES
November 30, 2023
|
|
|
|
|
|
|
|
|
| Cost |
| Value |
|
Assets ($): |
|
|
|
| ||
Investments in securities—See Statement of Investments |
|
|
| |||
Unaffiliated issuers | 391,337,947 |
| 921,571,402 |
| ||
Affiliated issuers |
| 18,144,985 |
| 18,144,985 |
| |
Cash denominated in foreign currency |
|
| 70 |
| 71 |
|
Tax reclaim receivable—Note 1(b) |
| 1,573,916 |
| |||
Receivable for investment securities sold |
| 1,034,818 |
| |||
Dividends receivable |
| 293,168 |
| |||
Receivable for shares of Common Stock subscribed |
| 146,290 |
| |||
Prepaid expenses |
|
|
|
| 48,956 |
|
|
|
|
|
| 942,813,606 |
|
Liabilities ($): |
|
|
|
| ||
Due to BNY Mellon Investment Adviser, Inc. and affiliates—Note 3(c) |
| 697,233 |
| |||
Payable for investment securities purchased |
| 9,395,126 |
| |||
Payable for shares of Common Stock redeemed |
| 473,556 |
| |||
Directors’ fees and expenses payable |
| 22,667 |
| |||
Other accrued expenses |
|
|
|
| 109,761 |
|
|
|
|
|
| 10,698,343 |
|
Net Assets ($) |
|
| 932,115,263 |
| ||
Composition of Net Assets ($): |
|
|
|
| ||
Paid-in capital |
|
|
|
| 255,807,735 |
|
Total distributable earnings (loss) |
|
|
|
| 676,307,528 |
|
Net Assets ($) |
|
| 932,115,263 |
| ||
Net Asset Value Per Share | Class A | Class C | Class I | Class Y |
|
Net Assets ($) | 34,765,070 | 2,207,632 | 533,265,800 | 361,876,761 |
|
Shares Outstanding | 1,521,033 | 103,914 | 22,813,919 | 15,517,487 |
|
Net Asset Value Per Share ($) | 22.86 | 21.24 | 23.37 | 23.32 |
|
|
|
|
|
|
|
See notes to financial statements. |
|
|
|
|
|
13
STATEMENT OF OPERATIONS
Year Ended November 30, 2023
|
|
|
|
|
|
|
|
|
|
|
|
|
|
Investment Income ($): |
|
|
|
| ||
Income: |
|
|
|
| ||
Cash dividends (net of $857,871 foreign taxes withheld at source): |
| |||||
Unaffiliated issuers |
|
| 12,131,754 |
| ||
Affiliated issuers |
|
| 691,514 |
| ||
Interest |
|
| 2,724 |
| ||
Income from securities lending—Note 1(c) |
|
| 200 |
| ||
Total Income |
|
| 12,826,192 |
| ||
Expenses: |
|
|
|
| ||
Management fee—Note 3(a) |
|
| 8,393,635 |
| ||
Shareholder servicing costs—Note 3(c) |
|
| 223,857 |
| ||
Professional fees |
|
| 108,564 |
| ||
Directors’ fees and expenses—Note 3(d) |
|
| 105,387 |
| ||
Registration fees |
|
| 74,243 |
| ||
Custodian fees—Note 3(c) |
|
| 62,757 |
| ||
Prospectus and shareholders’ reports |
|
| 28,379 |
| ||
Chief Compliance Officer fees—Note 3(c) |
|
| 20,851 |
| ||
Loan commitment fees—Note 2 |
|
| 15,922 |
| ||
Distribution fees—Note 3(b) |
|
| 15,381 |
| ||
Interest expense—Note 2 |
|
| 6,046 |
| ||
Miscellaneous |
|
| 46,123 |
| ||
Total Expenses |
|
| 9,101,145 |
| ||
Less—reduction in fees due to earnings credits—Note 3(c) |
|
| (9,289) |
| ||
Net Expenses |
|
| 9,091,856 |
| ||
Net Investment Income |
|
| 3,734,336 |
| ||
Realized and Unrealized Gain (Loss) on Investments—Note 4 ($): |
|
| ||||
Net realized gain (loss) on investments and foreign currency transactions | 167,981,733 |
| ||||
Net change in unrealized appreciation (depreciation) on investments | (65,469,422) |
| ||||
Net Realized and Unrealized Gain (Loss) on Investments |
|
| 102,512,311 |
| ||
Net Increase in Net Assets Resulting from Operations |
| 106,246,647 |
| |||
|
|
|
|
|
|
|
See notes to financial statements. | ||||||
14
STATEMENT OF CHANGES IN NET ASSETS
|
|
|
| Year Ended November 30, | |||||
|
|
|
| 2023 |
| 2022 |
| ||
Operations ($): |
|
|
|
|
|
|
|
| |
Net investment income |
|
| 3,734,336 |
|
|
| 4,947,764 |
| |
Net realized gain (loss) on investments |
| 167,981,733 |
|
|
| 114,538,018 |
| ||
Net change in unrealized appreciation |
| (65,469,422) |
|
|
| (291,210,715) |
| ||
Net Increase (Decrease) in Net Assets | 106,246,647 |
|
|
| (171,724,933) |
| |||
Distributions ($): |
| ||||||||
Distributions to shareholders: |
|
|
|
|
|
|
|
| |
Class A |
|
| (3,370,083) |
|
|
| (4,038,293) |
| |
Class C |
|
| (233,003) |
|
|
| (402,809) |
| |
Class I |
|
| (60,469,007) |
|
|
| (77,813,997) |
| |
Class Y |
|
| (40,210,788) |
|
|
| (51,099,609) |
| |
Total Distributions |
|
| (104,282,881) |
|
|
| (133,354,708) |
| |
Capital Stock Transactions ($): |
| ||||||||
Net proceeds from shares sold: |
|
|
|
|
|
|
|
| |
Class A |
|
| 2,258,643 |
|
|
| 2,566,854 |
| |
Class C |
|
| 570,666 |
|
|
| 188,515 |
| |
Class I |
|
| 78,814,312 |
|
|
| 72,130,511 |
| |
Class Y |
|
| 7,582,009 |
|
|
| 26,529,561 |
| |
Distributions reinvested: |
|
|
|
|
|
|
|
| |
Class A |
|
| 3,112,810 |
|
|
| 3,707,708 |
| |
Class C |
|
| 214,817 |
|
|
| 356,095 |
| |
Class I |
|
| 58,523,929 |
|
|
| 72,709,117 |
| |
Class Y |
|
| 29,788,453 |
|
|
| 36,669,026 |
| |
Cost of shares redeemed: |
|
|
|
|
|
|
|
| |
Class A |
|
| (5,483,997) |
|
|
| (7,704,105) |
| |
Class C |
|
| (819,660) |
|
|
| (1,759,602) |
| |
Class I |
|
| (222,902,718) |
|
|
| (211,156,002) |
| |
Class Y |
|
| (81,300,560) |
|
|
| (104,730,636) |
| |
Increase (Decrease) in Net Assets | (129,641,296) |
|
|
| (110,492,958) |
| |||
Total Increase (Decrease) in Net Assets | (127,677,530) |
|
|
| (415,572,599) |
| |||
Net Assets ($): |
| ||||||||
Beginning of Period |
|
| 1,059,792,793 |
|
|
| 1,475,365,392 |
| |
End of Period |
|
| 932,115,263 |
|
|
| 1,059,792,793 |
| |
15
STATEMENT OF CHANGES IN NET ASSETS (continued)
|
|
|
| Year Ended November 30, | |||||
|
|
|
| 2023 |
| 2022 |
| ||
Capital Share Transactions (Shares): |
| ||||||||
Class Aa |
|
|
|
|
|
|
|
| |
Shares sold |
|
| 103,168 |
|
|
| 106,001 |
| |
Shares issued for distributions reinvested |
|
| 149,472 |
|
|
| 139,035 |
| |
Shares redeemed |
|
| (249,883) |
|
|
| (324,647) |
| |
Net Increase (Decrease) in Shares Outstanding | 2,757 |
|
|
| (79,611) |
| |||
Class C |
|
|
|
|
|
|
|
| |
Shares sold |
|
| 27,753 |
|
|
| 7,963 |
| |
Shares issued for distributions reinvested |
|
| 11,009 |
|
|
| 14,064 |
| |
Shares redeemed |
|
| (40,752) |
|
|
| (78,475) |
| |
Net Increase (Decrease) in Shares Outstanding | (1,990) |
|
|
| (56,448) |
| |||
Class Ia |
|
|
|
|
|
|
|
| |
Shares sold |
|
| 3,585,715 |
|
|
| 3,051,443 |
| |
Shares issued for distributions reinvested |
|
| 2,757,269 |
|
|
| 2,679,150 |
| |
Shares redeemed |
|
| (9,962,989) |
|
|
| (9,102,664) |
| |
Net Increase (Decrease) in Shares Outstanding | (3,620,005) |
|
|
| (3,372,071) |
| |||
Class Ya |
|
|
|
|
|
|
|
| |
Shares sold |
|
| 339,594 |
|
|
| 1,061,652 |
| |
Shares issued for distributions reinvested |
|
| 1,406,740 |
|
|
| 1,354,201 |
| |
Shares redeemed |
|
| (3,653,664) |
|
|
| (4,458,923) |
| |
Net Increase (Decrease) in Shares Outstanding | (1,907,330) |
|
|
| (2,043,070) |
| |||
|
|
|
|
|
|
|
|
|
|
a | During the period ended November 30, 2023, 319,683 Class Y shares representing $7,067,807 were exchanged for 318,933 Class I shares. During the period ended November 30, 2022, 1,971 Class Y shares representing $55,393 were exchanged for 2,001 Class A shares, and 274,616 Class Y shares representing $6,265,506 were exchanged for 273,993 Class I shares. | ||||||||
See notes to financial statements. | |||||||||
16
FINANCIAL HIGHLIGHTS
The following tables describe the performance for each share class for the fiscal periods indicated. All information (except portfolio turnover rate) reflects financial results for a single fund share. Net asset value total return is calculated assuming an initial investment made at the net asset value at the beginning of the period, reinvestment of all dividends and distributions at net asset value during the period, and redemption at net asset value on the last day of the period. Net asset value total return includes adjustments in accordance with accounting principles generally accepted in the United States of America and as such, the net asset value for financial reporting purposes and the returns based upon those net asset values may differ from the net asset value and returns for shareholder transactions. These figures have been derived from the fund’s financial statements.
Year Ended November 30, | ||||||
Class A Shares | 2023 | 2022 | 2021 | 2020 | 2019 | |
Per Share Data ($): | ||||||
Net asset value, beginning of period | 22.86 | 28.41 | 25.74 | 23.07 | 21.08 | |
Investment Operations: | ||||||
Net investment incomea | .01 | .02 | .01 | .06 | .10 | |
Net realized and unrealized | 2.24 | (3.04) | 4.09 | 3.71 | 3.17 | |
Total from Investment Operations | 2.25 | (3.02) | 4.10 | 3.77 | 3.27 | |
Distributions: | ||||||
Dividends from | (.03) | (.00)b | (.08) | (.10) | (.12) | |
Dividends from net realized | (2.22) | (2.53) | (1.35) | (1.00) | (1.16) | |
Total Distributions | (2.25) | (2.53) | (1.43) | (1.10) | (1.28) | |
Net asset value, end of period | 22.86 | 22.86 | 28.41 | 25.74 | 23.07 | |
Total Return (%)c | 10.82 | (11.84) | 16.72 | 17.00 | 17.04 | |
Ratios/Supplemental Data (%): | ||||||
Ratio of total expenses | 1.22 | 1.22 | 1.20 | 1.23 | 1.21 | |
Ratio of net expenses | 1.22 | 1.22 | 1.20 | 1.23 | 1.21 | |
Ratio of net investment income | .07 | .09 | .03 | .27 | .46 | |
Portfolio Turnover Rate | 10.12 | 1.10 | 9.79 | 4.13 | 6.62 | |
Net Assets, end of period ($ x 1,000) | 34,765 | 34,704 | 45,402 | 38,828 | 35,891 | |
a Based on average shares outstanding.
b Amount represents less than $.01 per share.
c Exclusive of sales charge.
See notes to financial statements.
17
FINANCIAL HIGHLIGHTS (continued)
Year Ended November 30, | ||||||
Class C Shares | 2023 | 2022 | 2021 | 2020 | 2019 | |
Per Share Data ($): | ||||||
Net asset value, beginning of period | 21.53 | 27.11 | 24.73 | 22.26 | 20.41 | |
Investment Operations: | ||||||
Net investment (loss)a | (.16) | (.15) | (.19) | (.10) | (.05) | |
Net realized and unrealized | 2.09 | (2.90) | 3.92 | 3.57 | 3.06 | |
Total from Investment Operations | 1.93 | (3.05) | 3.73 | 3.47 | 3.01 | |
Distributions: | ||||||
Dividends from net realized | (2.22) | (2.53) | (1.35) | (1.00) | (1.16) | |
Net asset value, end of period | 21.24 | 21.53 | 27.11 | 24.73 | 22.26 | |
Total Return (%)b | 9.94 | (12.59) | 15.83 | 16.15 | 16.12 | |
Ratios/Supplemental Data (%): | ||||||
Ratio of total expenses | 2.06 | 2.01 | 1.97 | 1.98 | 1.96 | |
Ratio of net expenses | 2.06 | 2.01 | 1.97 | 1.98 | 1.96 | |
Ratio of net investment | (.77) | (.69) | (.77) | (.45) | (.25) | |
Portfolio Turnover Rate | 10.12 | 1.10 | 9.79 | 4.13 | 6.62 | |
Net Assets, end of period ($ x 1,000) | 2,208 | 2,281 | 4,401 | 8,114 | 11,260 | |
a Based on average shares outstanding.
b Exclusive of sales charge.
See notes to financial statements.
18
Year Ended November 30, | ||||||
Class I Shares | 2023 | 2022 | 2021 | 2020 | 2019 | |
Per Share Data ($): | ||||||
Net asset value, beginning of period | 23.34 | 28.95 | 26.19 | 23.44 | 21.41 | |
Investment Operations: | ||||||
Net investment incomea | .09 | .10 | .09 | .12 | .15 | |
Net realized and unrealized | 2.27 | (3.10) | 4.16 | 3.78 | 3.21 | |
Total from Investment Operations | 2.36 | (3.00) | 4.25 | 3.90 | 3.36 | |
Distributions: | ||||||
Dividends from | (.11) | (.08) | (.14) | (.15) | (.17) | |
Dividends from net realized | (2.22) | (2.53) | (1.35) | (1.00) | (1.16) | |
Total Distributions | (2.33) | (2.61) | (1.49) | (1.15) | (1.33) | |
Net asset value, end of period | 23.37 | 23.34 | 28.95 | 26.19 | 23.44 | |
Total Return (%) | 11.19 | (11.59) | 17.07 | 17.32 | 17.32 | |
Ratios/Supplemental Data (%): | ||||||
Ratio of total expenses | .91 | .89 | .93 | .96 | .97 | |
Ratio of net expenses | .91 | .89 | .93 | .96 | .97 | |
Ratio of net investment income | .39 | .42 | .31 | .53 | .71 | |
Portfolio Turnover Rate | 10.12 | 1.10 | 9.79 | 4.13 | 6.62 | |
Net Assets, end of period ($ x 1,000) | 533,266 | 616,996 | 862,835 | 1,026,985 | 965,481 | |
a Based on average shares outstanding.
See notes to financial statements.
19
FINANCIAL HIGHLIGHTS (continued)
Year Ended November 30, | ||||||
Class Y Shares | 2023 | 2022 | 2021 | 2020 | 2019 | |
Per Share Data ($): | ||||||
Net asset value, beginning of period | 23.29 | 28.91 | 26.16 | 23.41 | 21.38 | |
Investment Operations: | ||||||
Net investment incomea | .09 | .10 | .08 | .14 | .17 | |
Net realized and unrealized | 2.27 | (3.10) | 4.17 | 3.78 | 3.20 | |
Total from Investment Operations | 2.36 | (3.00) | 4.25 | 3.92 | 3.37 | |
Distributions: | ||||||
Dividends from | (.11) | (.09) | (.15) | (.17) | (.18) | |
Dividends from net realized | (2.22) | (2.53) | (1.35) | (1.00) | (1.16) | |
Total Distributions | (2.33) | (2.62) | (1.50) | (1.17) | (1.34) | |
Net asset value, end of period | 23.32 | 23.29 | 28.91 | 26.16 | 23.41 | |
Total Return (%) | 11.17 | (11.58) | 17.11 | 17.43 | 17.36 | |
Ratios/Supplemental Data (%): | ||||||
Ratio of total expenses | .90 | .89 | .89 | .89 | .89 | |
Ratio of net expenses | .90 | .89 | .89 | .89 | .89 | |
Ratio of net investment income | .40 | .43 | .29 | .62 | .80 | |
Portfolio Turnover Rate | 10.12 | 1.10 | 9.79 | 4.13 | 6.62 | |
Net Assets, end of period ($ x 1,000) | 361,877 | 405,812 | 562,727 | 338,021 | 398,977 | |
a Based on average shares outstanding.
See notes to financial statements.
20
NOTES TO FINANCIAL STATEMENTS
NOTE 1—Significant Accounting Policies:
BNY Mellon Global Stock Fund (the “fund”) is a separate diversified series of BNY Mellon Strategic Funds, Inc. (the “Company”), which is registered under the Investment Company Act of 1940, as amended (the “Act”), as an open-end management investment company and operates as a series company currently offering six series, including the fund. The fund’s investment objective is to seek long-term total return. BNY Mellon Investment Adviser, Inc. (the “Adviser”), a wholly-owned subsidiary of The Bank of New York Mellon Corporation (“BNY Mellon”), serves as the fund’s investment adviser. Walter Scott & Partners Limited (the “Sub-Adviser”), an indirect wholly-owned subsidiary of BNY Mellon and an affiliate of the Adviser, serves as the fund’s sub-adviser.
BNY Mellon Securities Corporation (the “Distributor”), a wholly-owned subsidiary of the Adviser, is the distributor of the fund’s shares. The fund is authorized to issue 600 million shares of $.001 par value Common Stock. The fund currently has authorized four classes of shares: Class A (100 million shares authorized), Class C (100 million shares authorized), Class I (250 million shares authorized) and Class Y (150 million shares authorized). Class A and Class C shares are sold primarily to retail investors through financial intermediaries and bear Distribution and/or Shareholder Services Plan fees. Class A shares generally are subject to a sales charge imposed at the time of purchase. Class A shares bought without an initial sales charge as part of an investment of $1 million or more may be charged a contingent deferred sales charge (“CDSC”) of 1.00% if redeemed within one year. Class C shares are subject to a CDSC imposed on Class C shares redeemed within one year of purchase. Class C shares automatically convert to Class A shares eight years after the date of purchase, without the imposition of a sales charge. Class I shares are sold primarily to bank trust departments and other financial service providers (including BNY Mellon and its affiliates), acting on behalf of customers having a qualified trust or an investment account or relationship at such institution, and bear no Distribution or Shareholder Services Plan fees. Class Y shares are sold at net asset value per share generally to institutional investors, and bear no Distribution or Shareholder Services Plan fees. Class I and Class Y shares are offered without a front-end sales charge or CDSC. Other differences between the classes include the services offered to and the expenses borne by each class, the allocation of certain transfer agency costs and certain voting rights. Income, expenses (other than expenses attributable to a specific class), and realized and unrealized gains or losses
21
NOTES TO FINANCIAL STATEMENTS (continued)
on investments are allocated to each class of shares based on its relative net assets.
The Company accounts separately for the assets, liabilities and operations of each series. Expenses directly attributable to each series are charged to that series’ operations; expenses which are applicable to all series are allocated among them on a pro rata basis.
The Financial Accounting Standards Board (“FASB”) Accounting Standards Codification (“ASC”) is the exclusive reference of authoritative U.S. generally accepted accounting principles (“GAAP”) recognized by the FASB to be applied by nongovernmental entities. Rules and interpretive releases of the SEC under authority of federal laws are also sources of authoritative GAAP for SEC registrants. The fund is an investment company and applies the accounting and reporting guidance of the FASB ASC Topic 946 Financial Services-Investment Companies. The fund’s financial statements are prepared in accordance with GAAP, which may require the use of management estimates and assumptions. Actual results could differ from those estimates.
The Company enters into contracts that contain a variety of indemnifications. The fund’s maximum exposure under these arrangements is unknown. The fund does not anticipate recognizing any loss related to these arrangements.
(a) Portfolio valuation: The fair value of a financial instrument is the amount that would be received to sell an asset or paid to transfer a liability in an orderly transaction between market participants at the measurement date (i.e., the exit price). GAAP establishes a fair value hierarchy that prioritizes the inputs of valuation techniques used to measure fair value. This hierarchy gives the highest priority to unadjusted quoted prices in active markets for identical assets or liabilities (Level 1 measurements) and the lowest priority to unobservable inputs (Level 3 measurements).
Additionally, GAAP provides guidance on determining whether the volume and activity in a market has decreased significantly and whether such a decrease in activity results in transactions that are not orderly. GAAP requires enhanced disclosures around valuation inputs and techniques used during annual and interim periods.
Various inputs are used in determining the value of the fund’s investments relating to fair value measurements. These inputs are summarized in the three broad levels listed below:
Level 1—unadjusted quoted prices in active markets for identical investments.
22
Level 2—other significant observable inputs (including quoted prices for similar investments, interest rates, prepayment speeds, credit risk, etc.).
Level 3—significant unobservable inputs (including the fund’s own assumptions in determining the fair value of investments).
The inputs or methodology used for valuing securities are not necessarily an indication of the risk associated with investing in those securities.
Changes in valuation techniques may result in transfers in or out of an assigned level within the disclosure hierarchy. Valuation techniques used to value the fund’s investments are as follows:
The Company’s Board of Directors (the “Board”) has designated the Adviser as the fund’s valuation designee to make all fair value determinations with respect to the fund’s portfolio investments, subject to the Board’s oversight and pursuant to Rule 2a-5 under the Act.
Investments in equity securities are valued at the last sales price on the securities exchange or national securities market on which such securities are primarily traded. Securities listed on the National Market System for which market quotations are available are valued at the official closing price or, if there is no official closing price that day, at the last sales price. For open short positions, asked prices are used for valuation purposes. Bid price is used when no asked price is available. Registered investment companies that are not traded on an exchange are valued at their net asset value. All of the preceding securities are generally categorized within Level 1 of the fair value hierarchy.
Securities not listed on an exchange or the national securities market, or securities for which there were no transactions, are valued at the average of the most recent bid and asked prices. These securities are generally categorized within Level 2 of the fair value hierarchy.
Fair valuing of securities may be determined with the assistance of a pricing service using calculations based on indices of domestic securities and other appropriate indicators, such as prices of relevant ADRs and futures. Utilizing these techniques may result in transfers between Level 1 and Level 2 of the fair value hierarchy.
When market quotations or official closing prices are not readily available, or are determined not to accurately reflect fair value, such as when the value of a security has been significantly affected by events after the close of the exchange or market on which the security is principally traded (for example, a foreign exchange or market), but before the fund calculates its net asset value, the fund may value these investments at fair value as
23
NOTES TO FINANCIAL STATEMENTS (continued)
determined in accordance with the procedures approved by the Board. Certain factors may be considered when fair valuing investments such as: fundamental analytical data, the nature and duration of restrictions on disposition, an evaluation of the forces that influence the market in which the securities are purchased and sold, and public trading in similar securities of the issuer or comparable issuers. These securities are either categorized within Level 2 or 3 of the fair value hierarchy depending on the relevant inputs used.
For securities where observable inputs are limited, assumptions about market activity and risk are used and such securities are generally categorized within Level 3 of the fair value hierarchy.
Investments denominated in foreign currencies are translated to U.S. dollars at the prevailing rates of exchange.
The following is a summary of the inputs used as of November 30, 2023 in valuing the fund’s investments:
Level 1-Unadjusted Quoted Prices | Level 2- Other Significant Observable Inputs | Level 3-Significant Unobservable Inputs | Total | |||
Assets ($) | ||||||
Investments in Securities:† | ||||||
Equity Securities - Common Stocks | 921,571,402 | - | - | 921,571,402 | ||
Investment Companies | 18,144,985 | - | - | 18,144,985 | ||
† See Statement of Investments for additional detailed categorizations, if any.
(b) Foreign currency transactions: The fund does not isolate that portion of the results of operations resulting from changes in foreign exchange rates on investments from the fluctuations arising from changes in the market prices of securities held. Such fluctuations are included with the net realized and unrealized gain or loss on investments.
Net realized foreign exchange gains or losses arise from sales of foreign currencies, currency gains or losses realized on securities transactions between trade and settlement date, and the difference between the amounts of dividends, interest and foreign withholding taxes recorded on the fund’s books and the U.S. dollar equivalent of the amounts actually received or paid. Net unrealized foreign exchange gains and losses arise from changes in the value of assets and liabilities other than investments resulting from changes in exchange rates. Foreign currency gains and losses on foreign currency transactions are also included with net realized and unrealized gain or loss on investments.
24
Foreign taxes: The fund may be subject to foreign taxes (a portion of which may be reclaimable) on income, stock dividends, realized and unrealized capital gains on investments or certain foreign currency transactions. Foreign taxes are recorded in accordance with the applicable foreign tax regulations and rates that exist in the foreign jurisdictions in which the fund invests. These foreign taxes, if any, are paid by the fund and are reflected in the Statement of Operations, if applicable. Foreign taxes payable or deferred or those subject to reclaims as of November 30, 2023, if any, are disclosed in the fund’s Statement of Assets and Liabilities.
(c) Securities transactions and investment income: Securities transactions are recorded on a trade date basis. Realized gains and losses from securities transactions are recorded on the identified cost basis. Dividend income is recognized on the ex-dividend date and interest income, including, where applicable, accretion of discount and amortization of premium on investments, is recognized on the accrual basis.
Pursuant to a securities lending agreement with BNY Mellon, the fund may lend securities to qualified institutions. It is the fund’s policy that, at origination, all loans are secured by collateral of at least 102% of the value of U.S. securities loaned and 105% of the value of foreign securities loaned. Collateral equivalent to at least 100% of the market value of securities on loan is maintained at all times. Collateral is either in the form of cash, which can be invested in certain money market mutual funds managed by the Adviser, or U.S. Government and Agency securities. Any non-cash collateral received cannot be sold or re-pledged by the fund, except in the event of borrower default. The securities on loan, if any, are also disclosed in the fund’s Statement of Investments. The fund is entitled to receive all dividends, interest and distributions on securities loaned, in addition to income earned as a result of the lending transaction. Should a borrower fail to return the securities in a timely manner, BNY Mellon is required to replace the securities for the benefit of the fund or credit the fund with the market value of the unreturned securities and is subrogated to the fund’s rights against the borrower and the collateral. Additionally, the contractual maturity of security lending transactions are on an overnight and continuous basis. During the period ended November 30, 2023, BNY Mellon earned $27 from the lending of the fund’s portfolio securities, pursuant to the securities lending agreement.
For financial reporting purposes, the fund elects not to offset assets and liabilities subject to a securities lending agreement, if any, in the Statement of Assets and Liabilities. Therefore, all qualifying transactions are
25
NOTES TO FINANCIAL STATEMENTS (continued)
presented on a gross basis in the Statement of Assets and Liabilities. As of November 30, 2023, the fund had no securities on loan.
(d) Affiliated issuers: Investments in other investment companies advised by the Adviser are considered “affiliated” under the Act.
(e) Market Risk: The value of the securities in which the fund invests may be affected by political, regulatory, economic and social developments, and developments that impact specific economic sectors, industries or segments of the market. In addition, turbulence in financial markets and reduced liquidity in equity, credit and/or fixed-income markets may negatively affect many issuers, which could adversely affect the fund. Global economies and financial markets are becoming increasingly interconnected, and conditions and events in one country, region or financial market may adversely impact issuers in a different country, region or financial market. These risks may be magnified if certain events or developments adversely interrupt the global supply chain; in these and other circumstances, such risks might affect companies world-wide.
Foreign Investment Risk: To the extent the fund invests in foreign securities, the fund’s performance will be influenced by political, social and economic factors affecting investments in foreign issuers. Special risks associated with investments in foreign issuers include exposure to currency fluctuations, less liquidity, less developed or less efficient trading markets, lack of comprehensive company information, political and economic instability and differing auditing and legal standards. To the extent the fund’s investments are focused in a limited number of foreign countries, the fund’s performance could be more volatile than that of more geographically diversified funds.
(f) Dividends and distributions to shareholders: Dividends and distributions are recorded on the ex-dividend date. Dividends from net investment income and dividends from net realized capital gains, if any, are normally declared and paid annually, but the fund may make distributions on a more frequent basis to comply with the distribution requirements of the Internal Revenue Code of 1986, as amended (the “Code”). To the extent that net realized capital gains can be offset by capital loss carryovers, it is the policy of the fund not to distribute such gains. Income and capital gain distributions are determined in accordance with income tax regulations, which may differ from GAAP.
(g) Federal income taxes: It is the policy of the fund to continue to qualify as a regulated investment company, if such qualification is in the best interests of its shareholders, by complying with the applicable provisions of the Code, and to make distributions of taxable income and
26
net realized capital gain sufficient to relieve it from substantially all federal income and excise taxes.
As of and during the period ended November 30, 2023, the fund did not have any liabilities for any uncertain tax positions. The fund recognizes interest and penalties, if any, related to uncertain tax positions as income tax expense in the Statement of Operations. During the period ended November 30, 2023, the fund did not incur any interest or penalties.
Each tax year in the four-year period ended November 30, 2023 remains subject to examination by the Internal Revenue Service and state taxing authorities.
At November 30, 2023, the components of accumulated earnings on a tax basis were as follows: undistributed ordinary income $4,348,285, undistributed capital gains $141,891,770 and unrealized appreciation $530,067,473.
The tax character of distributions paid to shareholders during the fiscal years ended November 30, 2023 and November 30, 2022 were as follows: ordinary income $4,935,123 and $5,403,849, and long-term capital gains $99,347,758 and $127,950,859, respectively.
During the period ended November 30, 2023, as a result of permanent book to tax differences, primarily due to the tax treatment for treating a portion of the proceeds from redemptions as a distribution for tax purposes, the fund decreased total distributable earnings (loss) by $25,465,649 and increased paid-in capital by the same amount. Net assets and net asset value per share were not affected by this reclassification.
NOTE 2—Bank Lines of Credit:
The fund participates with other long-term open-end funds managed by the Adviser in a $738 million unsecured credit facility led by Citibank, N.A. (the “Citibank Credit Facility”) and a $300 million unsecured credit facility provided by BNY Mellon (the “BNYM Credit Facility”), each to be utilized primarily for temporary or emergency purposes, including the financing of redemptions (each, a “Facility”). The Citibank Credit Facility is available in two tranches: (i) Tranche A is in an amount equal to $618 million and is available to all long-term open-ended funds, including the fund, and (ii) Tranche B is an amount equal to $120 million and is available only to BNY Mellon Floating Rate Income Fund, a series of BNY Mellon Investment Funds IV, Inc. Prior to September 27, 2023, the Citibank Credit Facility was $823.5 million with Tranche A available in an amount equal to $688.5 million and Tranche B available in an amount equal to $135 million. In connection therewith, the fund has agreed to pay its pro
27
NOTES TO FINANCIAL STATEMENTS (continued)
rata portion of commitment fees for Tranche A of the Citibank Credit Facility and the BNYM Credit Facility. Interest is charged to the fund based on rates determined pursuant to the terms of the respective Facility at the time of borrowing.
During the period ended November 30, 2023, the fund was charged $6,046 for interest expense. These fees are included in Interest expense in the Statement of Operations. The average amount of borrowings outstanding under the Facilities during the period ended November 30, 2023 was approximately $98,356 with a related weighted average annualized interest rate of 6.15%.
NOTE 3—Management Fee, Sub-Advisory Fee and Other Transactions with Affiliates:
(a) Pursuant to a management agreement with the Adviser, the management fee is computed at the annual rate of .85% of the value of the fund’s average daily net assets and is payable monthly.
Pursuant to a sub-investment advisory agreement between the Adviser and the Sub-Adviser, the Adviser pays the Sub-Adviser a monthly fee at an annual rate of .41% of the value of the fund’s average daily net assets.
During the period ended November 30, 2023, the Distributor retained $1,165 from commissions earned on sales of the fund’s Class A shares.
(b) Under the Distribution Plan adopted pursuant to Rule 12b-1 under the Act, Class C shares pay the Distributor for distributing its shares at an annual rate of .75% of the value of its average daily net assets. The Distributor may pay one or more Service Agents in respect of advertising, marketing and other distribution services, and determines the amounts, if any, to be paid to Service Agents and the basis on which such payments are made. During the period ended November 30, 2023, Class C shares were charged $15,381 pursuant to the Distribution Plan.
(c) Under the Shareholder Services Plan, Class A and Class C shares pay the Distributor at an annual rate of .25% of the value of their average daily net assets for the provision of certain services. The services provided may include personal services relating to shareholder accounts, such as answering shareholder inquiries regarding the fund, and services related to the maintenance of shareholder accounts. The Distributor may make payments to Service Agents (securities dealers, financial institutions or other industry professionals) with respect to these services. The Distributor determines the amounts to be paid to Service Agents. During the period ended November 30, 2023, Class A and Class C shares were
28
charged $86,810 and $5,127, respectively, pursuant to the Shareholder Services Plan.
The fund has an arrangement with BNY Mellon Transfer, Inc., (the “Transfer Agent”), a subsidiary of BNY Mellon and an affiliate of the Adviser, whereby the fund may receive earnings credits when positive cash balances are maintained, which are used to offset Transfer Agent fees. For financial reporting purposes, the fund includes transfer agent net earnings credits, if any, as an expense offset in the Statement of Operations.
The fund has an arrangement with The Bank of New York Mellon (the “Custodian”), a subsidiary of BNY Mellon and an affiliate of the Adviser, whereby the fund will receive interest income or be charged overdraft fees when cash balances are maintained. For financial reporting purposes, the fund includes this interest income and overdraft fees, if any, as interest income in the Statement of Operations.
The fund compensates the Transfer Agent, under a transfer agency agreement, for providing transfer agency and cash management services for the fund. The majority of Transfer Agent fees are comprised of amounts paid on a per account basis, while cash management fees are related to fund subscriptions and redemptions. During the period ended November 30, 2023, the fund was charged $11,544 for transfer agency services. These fees are included in Shareholder servicing costs in the Statement of Operations. These fees were partially offset by earnings credits of $9,289.
The fund compensates the Custodian, under a custody agreement, for providing custodial services for the fund. These fees are determined based on net assets, geographic region and transaction activity. During the period ended November 30, 2023, the fund was charged $62,757 pursuant to the custody agreement.
During the period ended November 30, 2023, the fund was charged $20,851 for services performed by the fund’s Chief Compliance Officer and his staff. These fees are included in Chief Compliance Officer fees in the Statement of Operations.
The components of “Due to BNY Mellon Investment Adviser, Inc. and affiliates” in the Statement of Assets and Liabilities consist of: management fee of $646,934, Distribution Plan fees of $1,281, Shareholder Services Plan fees of $7,484, Custodian fees of $35,052, Chief Compliance Officer fees of $3,502 and Transfer Agent fees of $2,980.
29
NOTES TO FINANCIAL STATEMENTS (continued)
(d) Each board member also serves as a board member of other funds in the BNY Mellon Family of Funds complex. Annual retainer fees and attendance fees are allocated to each fund based on net assets.
NOTE 4—Securities Transactions:
The aggregate amount of purchases and sales of investment securities, excluding short-term securities, during the period ended November 30, 2023, amounted to $98,185,364 and $325,938,605, respectively.
At November 30, 2023, the cost of investments for federal income tax purposes was $409,699,886; accordingly, accumulated net unrealized appreciation on investments was $530,016,501, consisting of $550,877,344 gross unrealized appreciation and $20,860,843 gross unrealized depreciation.
30
REPORT OF INDEPENDENT REGISTERED PUBLIC ACCOUNTING FIRM
To the Shareholders and the Board of Directors of BNY Mellon Global Stock Fund
Opinion on the Financial Statements
We have audited the accompanying statement of assets and liabilities of BNY Mellon Global Stock Fund (the “Fund”) (one of the funds constituting BNY Mellon Strategic Funds, Inc. (the “Company”)), including the statement of investments, as of November 30, 2023, and the related statement of operations for the year then ended, the statements of changes in net assets for each of the two years in the period then ended, the financial highlights for each of the five years in the period then ended and the related notes (collectively referred to as the “financial statements”). In our opinion, the financial statements present fairly, in all material respects, the financial position of the Fund (one of the funds constituting BNY Mellon Strategic Funds, Inc.) at November 30, 2023, the results of its operations for the year then ended, the changes in its net assets for each of the two years in the period then ended and its financial highlights for each of the five years in the period then ended, in conformity with U.S. generally accepted accounting principles.
Basis for Opinion
These financial statements are the responsibility of the Company’s management. Our responsibility is to express an opinion on the Fund’s financial statements based on our audits. We are a public accounting firm registered with the Public Company Accounting Oversight Board (United States) (“PCAOB”) and are required to be independent with respect to the Company in accordance with the U.S. federal securities laws and the applicable rules and regulations of the Securities and Exchange Commission and the PCAOB.
We conducted our audits in accordance with the standards of the PCAOB. Those standards require that we plan and perform the audit to obtain reasonable assurance about whether the financial statements are free of material misstatement, whether due to error or fraud. The Company is not required to have, nor were we engaged to perform, an audit of the Company’s internal control over financial reporting. As part of our audits, we are required to obtain an understanding of internal control over financial reporting but not for the purpose of expressing an opinion on the effectiveness of the Company’s internal control over financial reporting. Accordingly, we express no such opinion.
Our audits included performing procedures to assess the risks of material misstatement of the financial statements, whether due to error or fraud, and performing procedures that respond to those risks. Such procedures included examining, on a test basis, evidence regarding the amounts and disclosures in the financial statements. Our procedures included confirmation of securities owned as of November 30, 2023, by correspondence with the custodian, brokers and others; when replies were not received from brokers and others, we performed other auditing procedures. Our audits also included evaluating the accounting principles used and significant estimates made by management, as well as evaluating the overall presentation of the financial statements. We believe that our audits provide a reasonable basis for our opinion.

We have served as the auditor of one or more investment companies in the BNY Mellon Family of Funds since at least 1957, but we are unable to determine the specific year.
New York, New York
January 22, 2024
31
ADDITIONAL INFORMATION (Unaudited)
UPDATES TO SALES CHARGE REDUCTIONS AND WAIVERS AVAILABLE FROM CERTAIN FINANCIAL INTERMEDIARIES:
The availability of certain sales charge reductions and waivers will depend on whether you purchase fund shares directly from the fund or through a financial intermediary. Financial intermediaries may have different policies and procedures regarding the availability of front-end sales load reductions or waivers or CDSC waivers, which are described in the fund’s prospectus. In all instances, it is the investor’s responsibility to notify the fund or the investor’s financial intermediary at the time of purchase of any relationship or other facts qualifying the investor for sales charge reductions or waivers. For reductions or waivers not available through a particular financial intermediary, investors will have to purchase fund shares directly from the fund or through another financial intermediary to receive these reductions or waivers.
Edward Jones
Clients of Edward D. Jones & Co., L.P. (Edward Jones) purchasing fund shares on the Edward Jones commission and fee-based platforms are eligible only for the following sales charge reductions and waivers, which can differ from the sales charge reductions and waivers described elsewhere in the fund’s prospectus or the SAI or through another financial intermediary. In all instances, it is the shareholder’s responsibility to inform Edward Jones at the time of purchase of any relationship, holdings of BNY Mellon Family of Funds, or other facts qualifying the purchaser for sales charge reductions or waivers. Edward Jones can ask for documentation of such circumstance. Shareholders should contact Edward Jones if they have questions regarding their eligibility for these discounts and waivers.
Front-end sales charge reductions on Class A shares purchased on the Edward Jones commission and fee-based platforms
Shareholders purchasing Class A shares of the fund on the Edward Jones commission and fee-based platforms can reduce their initial sales charge in the following ways:
· Transaction size breakpoints, as described in the fund’s prospectus.
· Rights of accumulation (ROA), which entitle shareholders to breakpoint discounts as described in the fund’s prospectus, will be calculated based on the aggregated holdings of shares of funds in the BNY Mellon Family of Funds (except certain money market funds and any assets held in group retirement plans) held by the purchaser or in an account grouped by Edward Jones with other accounts for the purpose of providing certain pricing considerations (“pricing groups”) and, if grouping assets as a shareholder, includes all share classes of such funds held on the Edward Jones platform and/or held on another platform. Shares of funds in the BNY Mellon Family of Funds may be included in the ROA calculation only if the shareholder notifies Edward Jones about such shares. Money market funds are included only if such shares were sold with a sales charge at the time of purchase or acquired in exchange for shares purchased with a sales charge. The employer maintaining a SEP IRA plan and/or SIMPLE IRA plan may elect to establish or change ROA for the IRA accounts associated with the plan to a plan-level grouping as opposed to including all share classes at a shareholder or pricing group level. For purposes of determining the value of a shareholder’s aggregated holdings, eligible shares held will be valued at the higher of their cost minus redemptions or current market value.
32
· Letter of intent (LOI), which allows for breakpoint discounts as described in the fund’s prospectus, based on anticipated purchases of shares of funds in the BNY Mellon Family of Funds purchased over a 13-month period from the date Edward Jones receives the LOI. Eligible shares purchased pursuant to a LOI will be valued at the higher of their cost or current market value for purposes of determining the front-end sales charge and any breakpoint discounts with respect to such share purchases. Each purchase a shareholder makes pursuant to a LOI during the 13-month period will receive the front-end sales charge and breakpoint discount that applies to the total amount indicated in the LOI. Shares of funds in the BNY Mellon Family of Funds may be included in the LOI calculation only if the shareholder notifies Edward Jones about such shares at the time of calculation. Shares purchased before the LOI is received by Edward Jones are not adjusted under the LOI and will not reduce the sales charge previously paid by the shareholder. The sales charge will be adjusted if the shareholder does not meet the goal indicated in the LOI. If the employer maintaining a SEP IRA plan and/or SIMPLE IRA plan has elected to establish or change ROA for the IRA accounts associated with the plan to a plan-level grouping, LOIs will also be at the plan-level and may only be established by the employer.
Front-end sales charge waivers on Class A shares purchased on the Edward Jones commission and fee-based platforms
Shareholders purchasing Class A shares of the fund on the Edward Jones commission and fee-based platforms may purchase Class A shares at NAV without payment of a sales charge as follows:
· shares purchased by associates of Edward Jones or its affiliates and their family members who are in the same pricing group (as determined by Edward Jones under its policies and procedures) as the associate. This waiver will continue for the remainder of the associate’s life if the associate retires from Edward Jones in good standing and remains in good standing pursuant to Edward Jones’ policies and procedures (Effective January 1, 2024, this waiver will be revised as follows: shares purchased by associates of Edward Jones and its affiliates and other accounts in the same pricing group (as determined by Edward Jones under its policies and procedures) as the associate. This waiver will continue for the remainder of the associate’s life if the associate retires from Edward Jones in good-standing and remains in good standing pursuant to Edward Jones’ policies and procedures)
· shares purchased in an Edward Jones fee-based program
· shares purchased through reinvestment of dividends and capital gains distributions of the fund
· shares purchased from the proceeds of redemptions of shares of a fund in the BNY Mellon Family of Funds, provided (1) the repurchase occurs within 60 days following the redemption, and (2) the redemption and purchase are made in the same share class and the same account or the purchase is made in an individual retirement account with
33
ADDITIONAL INFORMATION (Unaudited) (continued)
proceeds from liquidations in a non-retirement account (i.e., Right of Reinstatement) (Effective January 1, 2024, this waiver will be revised as follows: shares purchased from the proceeds of redemptions of shares of a fund in the BNY Mellon Family of Funds, provided that (1) the repurchase occurs within 60 days following the redemption, and (2) the redemption and purchase are made in a share class that charges a front-end sales charge, subject to one of the following conditions being met:
o the redemption and repurchase occur in the same account
o the redemption proceeds are used to process an IRA contribution, excess contributions, conversion, recharacterizing of contributions, or distribution, and the repurchase is done in an account within the same Edward Jones grouping for ROA)
· shares exchanged into Class A shares from another share class so long as the exchange is into the same fund and was initiated at the discretion of Edward Jones. Edward Jones is responsible for any CDSC due, if applicable. Any future purchases are subject to the applicable sales charge as disclosed in the fund’s prospectus
· exchanges from Class C shares to Class A shares of the same fund, generally, in the 84th month following the anniversary of the purchase date or earlier at the discretion of Edward Jones
· Effective January 1, 2024: purchases of Class A shares for a 529 plan account through a rollover from either another education savings plan or a security used for qualified distributions
· Effective January 1, 2024: purchases of Class A shares for a 529 plan account made for recontribution of refunded amounts
CDSC waivers on Class A and C shares purchased on the Edward Jones commission and fee-based platforms
The fund’s CDSC on Class A and C shares may be waived for shares purchased on the Edward Jones commission and fee-based platforms in the following cases:
· redemptions made upon the death or disability of the shareholder
· redemptions made through a systematic withdrawal plan, if such redemptions do not exceed 10% of the value of the account annually
· redemptions made in connection with a return of excess contributions from an IRA account
· redemptions made as part of a required minimum distribution for IRA and retirement accounts if the redemption is taken in or after the year the shareholder reaches qualified age based on applicable IRS regulations
· redemptions made to pay Edward Jones fees or costs, but only if the redemption is initiated by Edward Jones
· shares exchanged in an Edward Jones fee-based program
34
· shares acquired through a Right of Reinstatement (as defined above)
· shares redeemed at the discretion of Edward Jones for accounts not meeting Edward Jones’ minimum balance requirements described below
Other important information for clients of Edward Jones who purchase fund shares on the Edward Jones commission and fee-based platforms
Minimum Purchase Amounts
· Initial purchase minimum: $250
· Subsequent purchase minimum: none
Minimum Balances
· Edward Jones has the right to redeem at its discretion fund holdings with a balance of $250 or less. The following are examples of accounts that are not included in this policy:
o A fee-based account held on an Edward Jones platform
o A 529 account held on an Edward Jones platform
o An account with an active systematic investment plan or LOI
Exchanging Share Classes
· At any time it deems necessary, Edward Jones has the authority to exchange at NAV a shareholder’s holdings in a fund to Class A shares of the same fund. Edward Jones is responsible for any CDSC due, if applicable. Any future purchases are subject to the applicable sales charge as disclosed in the fund’s prospectus.
Merrill
Purchases or sales of front-end (i.e., Class A) or level-load (i.e., Class C) mutual fund shares through a Merrill platform or account are eligible only for the following sales load waivers (front-end or CDSC) and discounts, which differ from those disclosed elsewhere in the fund’s prospectus. Purchasers will have to buy mutual fund shares directly from the mutual fund company or through another intermediary to be eligible for waivers or discounts not listed below.
It is the client’s responsibility to notify Merrill at the time of purchase or sale of any relationship or other facts that qualify the transaction for a waiver or discount. A Merrill representative may ask for reasonable documentation of such facts and Merrill may condition the granting of a waiver or discount on the timely receipt of such documentation. Additional information on waivers or discounts is available in the Merrill Sales Load Waiver and Discounts Supplement (the “Merrill SLWD Supplement”) and in the Mutual Fund Investing at Merrill pamphlet at ml.com/funds. Clients are encouraged to review these documents and speak with their financial advisor to determine whether a transaction is eligible for a waiver or discount.
Front-end sales charge waivers on Class A shares purchased through Merrill
35
ADDITIONAL INFORMATION (Unaudited) (continued)
Shareholders purchasing Class A shares of the fund through a Merrill platform or account are eligible only for the following sales charge waivers, which may differ from those disclosed elsewhere in the fund’s prospectus or the SAI. Such shareholders may purchase Class A shares at NAV without payment of a sales charge as follows:
· shares of mutual funds available for purchase by employer-sponsored retirement, deferred compensation and employee benefit plans (including health savings accounts) and trusts used to fund those plans provided that the shares are not held in a commission-based brokerage account and shares are held for the benefit of the plan. For purposes of this provision, employer-sponsored retirement plans do not include SEP IRAs, Simple IRAs, SAR-SEPs or Keogh plans
· shares purchased through a Merrill investment advisory program
· brokerage class shares exchanged from advisory class shares due to the holdings moving from a Merrill investment advisory program to a Merrill brokerage account
· shares purchased through the Merrill Edge Self-Directed platform
· shares purchased through the systematic reinvestment of capital gains distributions and dividend reinvestment when purchasing shares of the same mutual fund in the same account
· shares exchanged from level-load shares to front-end load shares of the same mutual fund in accordance with the description in the Merrill SLWD Supplement
· shares purchased by eligible employees of Merrill or its affiliates and their family members who purchase shares in accounts within the employee’s Merrill Household (as defined in the Merrill SLWD Supplement)
· shares purchased by eligible persons associated with the fund as defined in the fund’s prospectus (e.g., the fund’s officers or trustees)
· shares purchased from the proceeds of a mutual fund redemption in front-end load shares, provided (1) the repurchase is in a mutual fund within the same fund family, (2) the repurchase occurs within 90 calendar days from the redemption trade date, and (3) the redemption and purchase occur in the same account (known as Rights of Reinstatement). Automated transactions (i.e., systematic purchases and withdrawals) and purchases made after shares are automatically sold to pay Merrill’s account maintenance fees are not eligible for Rights of Reinstatement
CDSC waivers on Class A and C shares purchased through Merrill
Fund shares purchased through a Merrill platform or account are eligible only for the following CDSC waivers, which may differ from those disclosed elsewhere in the fund’s prospectus or the SAI:
· shares sold due to the client’s death or disability (as defined by Internal Revenue Code Section 22(e)(3))
36
· shares sold pursuant to a systematic withdrawal program subject to Merrill’s maximum systematic withdrawal limits, as described in the Merrill SLWD Supplement
· shares sold due to return of excess contributions from an IRA account
· shares sold as part of a required minimum distribution for IRA and retirement accounts due to the investor reaching the qualified age based on applicable IRS regulation
· front-end or level-load shares held in commission-based, non-taxable retirement brokerage accounts (e.g., traditional, Roth, rollover, SEP IRAs, Simple IRAs, SAR-SEPs or Keogh plans) that are transferred to fee-based accounts or platforms and exchanged for a lower cost share class of the same mutual fund.
Front-end sales charge reductions on Class A shares purchased through Merrill
Shareholders purchasing Class A shares of the fund through a Merrill platform or account are eligible only for the following sales charge reductions (i.e., discounts), which may differ from those disclosed elsewhere in the fund’s prospectus or the SAI. Such shareholders can reduce their initial sales charge in the following ways:
· Breakpoint discounts, as described in the fund’s prospectus, where the sales load is at or below the maximum sales load that Merrill permits to be assessed to a front-end load purchase, as described in the Merrill SLWD Supplement.
· Rights of accumulation (ROA), as described in the Merrill SLWD Supplement, which entitle clients to breakpoint discounts based on the aggregated holdings of mutual fund family assets held in accounts in their Merrill Household.
· Letters of Intent (LOI), which allow for breakpoint discounts on eligible new purchases based on anticipated future eligible purchases within a fund family at Merrill, in accounts within your Merrill Household, as further described in the Merrill SLWD Supplement.
37
IMPORTANT TAX INFORMATION (Unaudited)
For federal tax purposes the fund hereby reports 100% of the ordinary dividends paid during the fiscal year ended November 30, 2023 as qualifying for the corporate dividends received deduction. Also certain dividends paid by the fund may be subject to a maximum tax rate of 15%, as provided for by the Jobs and Growth Tax Relief Reconciliation Act of 2003. Of the distributions paid during the fiscal year, $4,935,123 represents the maximum amount that may be considered qualified dividend income. Shareholders will receive notification in early 2024 of the percentage applicable to the preparation of their 2023 income tax returns. Also, the fund hereby reports $2.153 and $.0623 per share as a long-term capital gain distribution paid on December 13, 2022 and March 28, 2023, respectively.
38
INFORMATION ABOUT THE RENEWAL OF THE FUND’S MANAGEMENT AND SUB-INVESTMENT ADVISORY AGREEMENTS (Unaudited)
At a meeting of the fund’s Board of Directors (the “Board”) held on October 30-31st, 2023, the Board considered the renewal of the fund’s Management Agreement, pursuant to which the Adviser provides the fund with investment advisory and administrative services (the “Agreement”), and the Sub-Investment Advisory Agreement (together, the “Agreements”), pursuant to which Walter Scott & Partners Limited (the “Sub-Adviser”) provides day-to-day management of the fund’s investments. The Board members, none of whom are “interested persons” (as defined in the Investment Company Act of 1940, as amended) of the fund, were assisted in their review by independent legal counsel and met with counsel in executive session separate from representatives of the Adviser and the Sub-Adviser. In considering the renewal of the Agreements, the Board considered several factors that it believed to be relevant, including those discussed below. The Board did not identify any one factor as dispositive, and each Board member may have attributed different weights to the factors considered.
Analysis of Nature, Extent, and Quality of Services Provided to the Fund. The Board considered information provided to it at the meeting and in previous presentations from representatives of the Adviser regarding the nature, extent, and quality of the services provided to funds in the BNY Mellon fund complex, including the fund. The Adviser provided the number of open accounts in the fund, the fund’s asset size and the allocation of fund assets among distribution channels. The Adviser also had previously provided information regarding the diverse intermediary relationships and distribution channels of funds in the BNY Mellon fund complex (such as retail direct or intermediary, in which intermediaries typically are paid by the fund and/or the Adviser) and the Adviser’s corresponding need for broad, deep, and diverse resources to be able to provide ongoing shareholder services to each intermediary or distribution channel, as applicable to the fund.
The Board also considered research support available to, and portfolio management capabilities of, the fund’s portfolio management personnel and that the Adviser also provides oversight of day-to-day fund operations, including fund accounting and administration and assistance in meeting legal and regulatory requirements. The Board also considered the Adviser’s extensive administrative, accounting and compliance infrastructures, as well as the Adviser’s supervisory activities over the Sub-Adviser. The Board also considered portfolio management’s brokerage policies and practices (including that there are no soft dollar arrangements in place for the fund) and the standards applied in seeking best execution.
Comparative Analysis of the Fund’s Performance and Management Fee and Expense Ratio. The Board reviewed reports prepared by Broadridge Financial Solutions, Inc. (“Broadridge”), an independent provider of investment company data based on classifications provided by Thomson Reuters Lipper (“Lipper”), which included information comparing (1) the performance of the fund’s Class I shares with the performance of a group of eight other global large-cap growth funds, one global large-cap core fund, and one global multi-cap growth fund selected by Broadridge as
39
INFORMATION ABOUT THE RENEWAL OF THE FUND’S MANAGEMENT AND SUB-INVESTMENT ADVISORY AGREEMENTS (Unaudited) (continued)
comparable to the fund (the “Performance Group”) and with a broader group of funds consisting of all retail and institutional global large-cap growth funds (the “Performance Universe”), all for various periods ended August 31st, 2023, and (2) the fund’s actual and contractual management fees and total expenses with those of the same group of funds in the Performance Group (the “Expense Group”) and with a broader group of all other institutional global large-cap growth funds, global large-cap core funds, and global multi-cap growth funds, excluding outliers (the “Expense Universe”), the information for which was derived in part from fund financial statements available to Broadridge as of the date of its analysis. The Adviser previously had furnished the Board with a description of the methodology Broadridge used to select the Performance Group and Performance Universe and the Expense Group and Expense Universe.
Performance Comparisons. Representatives of the Adviser stated that the usefulness of performance comparisons may be affected by a number of factors, including different investment limitations and policies that may be applicable to the fund and comparison funds and the end date selected. They also considered that performance generally should be considered over longer periods of time, although it is possible that long-term performance can be adversely affected by even one period of significant underperformance so that a single investment decision or theme has the ability to affect disproportionately long-term performance. The Board discussed with representatives of the Adviser and the Sub-Adviser the results of the comparisons and considered that the fund’s total return performance was above the Performance Group and Performance Universe medians for all periods except for the four-year period when the fund’s total return performance was below the Performance Group median. The Adviser also provided a comparison of the fund’s calendar year total returns to the returns of the fund’s benchmark index, and it was noted that the fund’s returns were above the returns of the index in five of the ten calendar years shown. The Board also noted that Morningstar had rated the fund a Morningstar Silver Medalist due to its four-star overall rating and it’s four-star rating for the three-, five-, and ten-year periods based on Morningstar’s risk-adjusted return measure.
Management Fee and Expense Ratio Comparisons. The Board reviewed and considered the contractual management fee rate payable by the fund to the Adviser in light of the nature, extent and quality of the management services and the sub-advisory services provided by the Adviser and the Sub-Adviser, respectively. In addition, the Board reviewed and considered the actual management fee rate paid by the fund over the fund’s last fiscal year. The Board also reviewed the range of actual and contractual management fees and total expenses as a percentage of average net assets of the Expense Group and Expense Universe funds and discussed the results of the comparisons.
The Board considered that the fund’s contractual management fee was higher than the Expense Group median contractual management fee, the fund’s actual management fee was higher than the Expense Group median and higher than the Expense Universe median actual management fee and the fund’s total expenses were higher than the Expense Group median and higher than the Expense Universe median total expenses.
40
Representatives of the Adviser reviewed with the Board the management or investment advisory fees (1) paid by funds advised or administered by the Adviser that are in the same Lipper category as the fund and (2) paid to the Adviser or the Sub-Adviser or its affiliates for advising any separate accounts and/or other types of client portfolios that are considered to have similar investment strategies and policies as the fund (the “Similar Clients”), and explained the nature of the Similar Clients. They discussed differences in fees paid and the relationship of the fees paid in light of any differences in the services provided and other relevant factors. The Board considered the relevance of the fee information provided for the Similar Clients to evaluate the appropriateness of the fund’s management fee.
The Board considered the fee payable to the Sub-Adviser in relation to the fee payable to the Adviser by the fund and the respective services provided by the Sub-Adviser and the Adviser. The Board also took into consideration that the Sub-Adviser’s fee is paid by the Adviser, out of its fee from the fund, and not the fund.
Analysis of Profitability and Economies of Scale. Representatives of the Adviser reviewed the expenses allocated and profit received by the Adviser and its affiliates and the resulting profitability percentage for managing the fund and the aggregate profitability percentage to the Adviser and its affiliates for managing the funds in the BNY Mellon fund complex, and the method used to determine the expenses and profit. The Board concluded that the profitability results were not excessive, given the services rendered and service levels provided by the Adviser and its affiliates. The Board also had been provided with information prepared by an independent consulting firm regarding the Adviser’s approach to allocating costs to, and determining the profitability of, individual funds and the entire BNY Mellon fund complex. The consulting firm also had analyzed where any economies of scale might emerge in connection with the management of a fund.
The Board considered, on the advice of its counsel, the profitability analysis (1) as part of its evaluation of whether the fees under the Agreements, considered in relation to the mix of services provided by the Adviser and the Sub-Adviser, including the nature, extent and quality of such services, supported the renewal of the Agreements and (2) in light of the relevant circumstances for the fund and the extent to which economies of scale would be realized if the fund grows and whether fee levels reflect these economies of scale for the benefit of fund shareholders. Representatives of the Adviser stated that a discussion of economies of scale is predicated on a fund having achieved a substantial size with increasing assets and that, if a fund’s assets had been stable or decreasing, the possibility that the Adviser may have realized any economies of scale would be less. Representatives of the Adviser also stated that, as a result of shared and allocated costs among funds in the BNY Mellon fund complex, the extent of economies of scale could depend substantially on the level of assets in the complex as a whole, so that increases and decreases in complex-wide assets can affect potential economies of scale in a manner that is disproportionate to, or even in the opposite direction from, changes in the fund’s asset level. The Board also considered potential benefits to the Adviser and the Sub-Adviser from acting as investment adviser and sub-investment adviser,
41
INFORMATION ABOUT THE RENEWAL OF THE FUND’S MANAGEMENT AND SUB-INVESTMENT ADVISORY AGREEMENTS (Unaudited) (continued)
respectively, and took into consideration that there were no soft dollar arrangements in effect for trading the fund’s investments.
At the conclusion of these discussions, the Board agreed that it had been furnished with sufficient information to make an informed business decision with respect to the renewal of the Agreements. Based on the discussions and considerations as described above, the Board concluded and determined as follows.
· The Board concluded that the nature, extent and quality of the services provided by the Adviser and the Sub-Adviser are adequate and appropriate.
· The Board was satisfied with the fund’s performance.
· The Board concluded that the fees paid to the Adviser and the Sub-Adviser continued to be appropriate under the circumstances and in light of the factors and the totality of the services provided as discussed above.
· The Board determined that the economies of scale which may accrue to the Adviser and its affiliates in connection with the management of the fund had been adequately considered by the Adviser in connection with the fee rate charged to the fund pursuant to its Agreement and that, to the extent in the future it were determined that material economies of scale had not been shared with the fund, the Board would seek to have those economies of scale shared with the fund.
In evaluating the Agreements, the Board considered these conclusions and determinations and also relied on its previous knowledge, gained through meetings and other interactions with the Adviser and its affiliates and the Sub-Adviser, of the Adviser and the Sub-Adviser and the services provided to the fund by the Adviser and the Sub-Adviser. The Board also relied on information received on a routine and regular basis throughout the year relating to the operations of the fund and the investment management and other services provided under the Agreements, including information on the investment performance of the fund in comparison to similar mutual funds and benchmark performance indices; general market outlook as applicable to the fund; and compliance reports. In addition, the Board’s consideration of the contractual fee arrangements for the fund had the benefit of a number of years of reviews of the Agreements for the fund, or substantially similar agreements for other BNY Mellon funds that the Board oversees, during which lengthy discussions took place between the Board and representatives of the Adviser. Certain aspects of the arrangements may receive greater scrutiny in some years than in others, and the Board’s conclusions may be based, in part, on their consideration of the fund’s arrangements, or substantially similar arrangements for other BNY Mellon funds that the Board oversees, in prior years. The Board determined to renew the Agreements.
42
BOARD MEMBERS INFORMATION (Unaudited)
Independent Board Members
Joseph S. DiMartino (80)
Chairman of the Board (1995)
Principal Occupation During Past 5 Years:
· Director or Trustee of funds in the BNY Mellon Family of Funds and certain other entities (as described in the fund’s Statement of Additional Information) (1995-Present)
Other Public Company Board Memberships During Past 5 Years:
· CBIZ, Inc., a public company providing professional business services, products and solutions, Director (1997-May 2023)
No. of Portfolios for which Board Member Serves: 86
———————
Joni Evans (81)
Board Member (2006)
Principal Occupation During Past 5 Years:
· www.PureWow.com, an online community dedicated to women’s conversations and publications, Chief Executive Officer (2007-2019)
· Joni Evans Ltd. publishing, Principal (2006-2019)
No. of Portfolios for which Board Member Serves: 17
———————
Joan Gulley (76)
Board Member (2017)
Principal Occupation During Past 5 Years:
· Nantucket Atheneum, public library, Chair (June 2018-June 2021) and Director (2015-June 2021)
· Orchard Island Club, golf and beach club, Governor (2016-Present) and President (February 2023-Present)
No. of Portfolios for which Board Member Serves: 39
———————
43
BOARD MEMBERS INFORMATION (Unaudited) (continued)
Alan H. Howard (64)
Board Member (2018)
Principal Occupation During Past 5 Years:
· Heathcote Advisors LLC, a financial advisory services firm, Managing Partner (2008-Present)
· Dynatech/MPX Holdings LLC, a global supplier and service provider of military aircraft parts, President (2012-May 2019); and Board Member of its two operating subsidiaries, Dynatech International LLC and Military Parts Exchange LLC (2012-December 2019), including Chief Executive Officer of an operating subsidiary, Dynatech International LLC (2013-May 2019)
· Rossoff & Co., an independent investment banking firm, Senior Advisor (2013-June 2021)
Other Public Company Board Memberships During Past 5 Years:
· Movado Group, Inc., a public company that designs, sources, markets and distributes watches, Director (1997-Present)
· Diamond Offshore Drilling, Inc., a public company that provides contract drilling services, Director (March 2020-April 2021)
No. of Portfolios for which Board Member Serves: 17
———————
Robin A. Melvin (60)
Board Member (1995)
Principal Occupation During Past 5 Years:
· Westover School, a private girls’ boarding school in Middlebury, Connecticut, Trustee (2019-June 2023)
· Mentor Illinois, a non-profit organization dedicated to increasing the quantity and quality of mentoring services in Illinois. Co-Chair (2014–March 2020); Board Member (2013-March 2020)
· JDRF, a non-profit juvenile diabetes research foundation, Board Member (June 2021-June 2022)
Other Public Company Board Memberships During Past 5 Years:
· HPS Corporate Lending Fund, a closed-end management investment company regulated as a business development company, Trustee (August 2021-Present)
No. of Portfolios for which Board Member Serves: 68
———————
Burton N. Wallack (73)
Board Member (2006)
Principal Occupation During Past 5 Years:
Wallack Management Company, a real estate management company, President and Co-owner (1987-Present)
Other Public Company Board Memberships During Past 5 Years:
Mount Sinai Hospital Urology, Board Member (2017-Present)
No. of Portfolios for which Board Member Serves: 17
———————
44
Benaree Pratt Wiley (77)
Board Member (2016)
Principal Occupation During Past 5 Years:
· The Wiley Group, a firm specializing in strategy and business development. Principal (2005-Present)
Other Public Company Board Memberships During Past 5 Years:
· CBIZ, Inc., a public company providing professional business services, products and solutions, Director (2008-Present)
· Blue Cross-Blue Shield of Massachusetts, Director (2004-December 2020)
No. of Portfolios for which Board Member Serves: 57
———————
Gordon J. Davis (81)
Advisory Board Member (2021)
Principal Occupation During Past 5 Years:
· Venable LLP, a law firm, Partner (2012-Present)
Other Public Company Board Memberships During Past 5 Years:
· BNY Mellon Family of Funds (53 funds), Board Member (1995-August 2021)
No. of Portfolios for which Advisory Board Member Serves: 39
———————
The address of the Board Members and Officers is c/o BNY Mellon Investment Adviser, Inc., 240 Greenwich Street, New York, New York 10286. Additional information about each Board Member is available in the fund’s Statement of Additional Information which can be obtained from the Adviser free of charge by calling this toll free number: 1-800-373-9387.
45
OFFICERS OF THE FUND (Unaudited)
DAVID DIPETRILLO, President since January 2021.
Vice President and Director of the Adviser since February 2021; Head of North America Distribution, BNY Mellon Investment Management since February 2023; and Head of North America Product, BNY Mellon Investment Management from January 2018 to February 2023. He is an officer of 53 investment companies (comprised of 102 portfolios) managed by the Adviser or an affiliate of the Adviser. He is 45 years old and has been an employee of BNY Mellon since 2005.
JAMES WINDELS, Treasurer since November 2001.
Director of the Adviser since February 2023; Vice President of the Adviser since September 2020; and Director–BNY Mellon Fund Administration. He is an officer of 54 investment companies (comprised of 121 portfolios) managed by the Adviser or an affiliate of the Adviser. He is 65 years old and has been an employee of the Adviser since April 1985.
PETER M. SULLIVAN, Chief Legal Officer since July 2021 and Vice President and Assistant Secretary since March 2019.
Chief Legal Officer of the Adviser and Associate General Counsel of BNY Mellon since July 2021; Senior Managing Counsel of BNY Mellon from December 2020 to July 2021; and Managing Counsel of BNY Mellon from March 2009 to December 2020. He is an officer of 54 investment companies (comprised of 121 portfolios) managed by the Adviser or an affiliate of the Adviser. He is 55 years old and has been an employee of BNY Mellon since April 2004.
JAMES BITETTO, Vice President since August 2005 and Secretary since February 2018.
Senior Managing Counsel of BNY Mellon since December 2019; Managing Counsel of BNY Mellon from April 2014 to December 2019; and Secretary of the Adviser. He is an officer of 54 investment companies (comprised of 121 portfolios) managed by the Adviser or an affiliate of the Adviser. He is 57 years old and has been an employee of the Adviser since December 1996.
DEIRDRE CUNNANE, Vice President and Assistant Secretary since March 2019.
Managing Counsel of BNY Mellon since December 2021; and Counsel of BNY Mellon from August 2018 to December 2021. She is an officer of 54 investment companies (comprised of 121 portfolios) managed by the Adviser or an affiliate of the Adviser. She is 33 years old and has been an employee of BNY Mellon since August 2013.
SARAH S. KELLEHER, Vice President and Assistant Secretary since April 2014.
Vice President of BNY Mellon ETF Investment Adviser; LLC since February 2020; Senior Managing Counsel of BNY Mellon since September 2021; and Managing Counsel of BNY Mellon from December 2017 to September 2021. She is an officer of 54 investment companies (comprised of 121 portfolios) managed by the Adviser or an affiliate of the Adviser. She is 48 years old and has been an employee of BNY Mellon since March 2013.
JEFF PRUSNOFSKY, Vice President and Assistant Secretary since August 2005.
Senior Managing Counsel of BNY Mellon. He is an officer of 54 investment companies (comprised of 121 portfolios) managed by the Adviser or an affiliate of the Adviser. He is 58 years old and has been an employee of the Adviser since October 1990.
AMANDA QUINN, Vice President and Assistant Secretary since March 2020.
Counsel of BNY Mellon since June 2019; and Regulatory Administration Manager at BNY Mellon Investment Management Services from September 2018 to May 2019. She is an officer of 54 investment companies (comprised of 121 portfolios) managed by the Adviser or an affiliate of the Adviser. She is 38 years old and has been an employee of BNY Mellon since June 2012.
JOANNE SKERRETT, Vice President and Assistant Secretary since March 2023.
Managing Counsel of BNY Mellon since June 2022; and Senior Counsel with the Mutual Fund Directors Forum, a leading funds industry organization, from 2016 to June 2022. She is an officer of 54 investment companies (comprised of 121 portfolios) managed by the Adviser or an affiliate of the Adviser. She is 51 years old and has been an employee of the Adviser since June 2022.
46
NATALYA ZELENSKY, Vice President and Assistant Secretary since March 2017.
Chief Compliance Officer since August 2021 and Vice President since February 2020 of BNY Mellon ETF Investment Adviser, LLC; Chief Compliance Officer since August 2021 and Vice President and Assistant Secretary since February 2020 of BNY Mellon ETF Trust; Managing Counsel of BNY Mellon from December 2019 to August 2021; Counsel of BNY Mellon from May 2016 to December 2019; and Assistant Secretary of the Adviser from April 2018 to August 2021. She is an officer of 54 investment companies (comprised of 121 portfolios) managed by the Adviser or an affiliate of the Adviser. She is 38 years old and has been an employee of BNY Mellon since May 2016.
DANIEL GOLDSTEIN, Vice President since March 2022.
Head of Product Development of North America Distribution, BNY Mellon Investment Management since January 2018; Executive Vice President of North America Product, BNY Mellon Investment Management since April 2023; and Senior Vice President, Development & Oversight of North America Product, BNY Mellon Investment Management from 2010 to March 2023. He is an officer of 53 investment companies (comprised of 102 portfolios) managed by the Adviser or an affiliate of the Adviser. He is 54 years old and has been an employee of the Distributor since 1991.
JOSEPH MARTELLA, Vice President since March 2022.
Vice President of the Adviser since December 2022; Head of Product Management of North America Distribution, BNY Mellon Investment Management since January 2018; Executive Vice President of North America Product, BNY Mellon Investment Management since April 2023; and Senior Vice President of North America Product, BNY Mellon Investment Management from 2010 to March 2023. He is an officer of 53 investment companies (comprised of 102 portfolios) managed by the Adviser or an affiliate of the Adviser. He is 47 years old and has been an employee of the Distributor since 1999.
GAVIN C. REILLY, Assistant Treasurer since December 2005.
Tax Manager–BNY Mellon Fund Administration. He is an officer of 54 investment companies (comprised of 121 portfolios) managed by the Adviser or an affiliate of the Adviser. He is 55 years old and has been an employee of the Adviser since April 1991.
ROBERT SALVIOLO, Assistant Treasurer since July 2007.
Senior Accounting Manager–BNY Mellon Fund Administration. He is an officer of 54 investment companies (comprised of 121 portfolios) managed by the Adviser or an affiliate of the Adviser. He is 56 years old and has been an employee of the Adviser since June 1989.
ROBERT SVAGNA, Assistant Treasurer since December 2002.
Senior Accounting Manager–BNY Mellon Fund Administration. He is an officer of 54 investment companies (comprised of 121 portfolios) managed by the Adviser or an affiliate of the Adviser. He is 56 years old and has been an employee of the Adviser since November 1990.
JOSEPH W. CONNOLLY, Chief Compliance Officer since October 2004.
Chief Compliance Officer of the BNY Mellon Family of Funds and BNY Mellon Funds Trust since 2004; and Chief Compliance Officer of the Adviser from 2004 until June 2021. He is the Chief Compliance Officer of 53 investment companies (comprised of 105 portfolios) managed by the Adviser. He is 66 years old.
CARIDAD M. CAROSELLA, Anti-Money Laundering Compliance Officer since January 2016.
Anti-Money Laundering Compliance Officer of the BNY Mellon Family of Funds and BNY Mellon Funds Trust. She is an officer of 47 investment companies (comprised of 114 portfolios) managed by the Adviser or an affiliate of the Adviser. She is 55 years old and has been an employee of the Distributor since 1997.
47
This page intentionally left blank.
48
This page intentionally left blank.
49
BNY Mellon Global Stock Fund
240 Greenwich Street
New York, NY 10286
Adviser
BNY Mellon Investment Adviser, Inc.
240 Greenwich Street
New York, NY 10286
Sub-Adviser
Walter Scott & Partners Limited
One Charlotte Square
Edinburgh, Scotland, UK
Custodian
The Bank of New York Mellon
240 Greenwich Street
New York, NY 10286
Transfer Agent &
Dividend Disbursing Agent
BNY Mellon Transfer, Inc.
240 Greenwich Street
New York, NY 10286
Distributor
BNY Mellon Securities Corporation
240 Greenwich Street
New York, NY 10286
Ticker Symbols: | Class A: DGLAX Class C: DGLCX Class I: DGLRX Class Y: DGLYX |
Telephone Call your financial representative or 1-800-373-9387
Mail The BNY Mellon Family of Funds, 144 Glenn Curtiss Boulevard, Uniondale, NY 11556-0144
E-mail Send your request to info@bnymellon.com
Internet Information can be viewed online or downloaded at www.im.bnymellon.com
The fund files its complete schedule of portfolio holdings with the Securities and Exchange Commission (“SEC”) for the first and third quarters of each fiscal year on Form N-PORT. The fund’s Forms N-PORT are available on the SEC’s website at www.sec.gov.
A description of the policies and procedures that the fund uses to determine how to vote proxies relating to portfolio securities and information regarding how the fund voted these proxies for the most recent 12-month period ended June 30 is available at www.im.bnymellon.com and on the SEC’s website at www.sec.gov and without charge, upon request, by calling 1-800-373-9387.
© 2024 BNY Mellon Securities Corporation |
|

BNY Mellon International Stock Fund
ANNUAL REPORT November 30, 2023 |
|

IMPORTANT NOTICE – UPCOMING CHANGES TO ANNUAL AND SEMI-ANNUAL REPORTS
The Securities and Exchange Commission (the “SEC”) has adopted rule and form amendments that will result in changes to the design and delivery of annual and semi-annual fund reports (“Reports”). Beginning in July 2024, Reports will be streamlined to highlight key information. Certain information currently included in Reports, including financial statements, will no longer appear in the Reports but will be available online, delivered free of charge to shareholders upon request, and filed with the SEC.
If you previously elected to receive the fund’s Reports electronically, you will continue to do so. Otherwise, you will receive paper copies of the fund’s re-designed Reports by USPS mail in the future. If you would like to receive the fund’s Reports (and/or other communications) electronically instead of by mail, please contact your financial advisor or, if you are a direct investor, please log into your mutual fund account at www.bnymellonim.com/us and select “E-Delivery” under the Profile page. You must be registered for online account access before you can enroll in E-Delivery.
Save time. Save paper. View your next shareholder report online as soon as it’s available. Log into www.im.bnymellon.com and sign up for eCommunications. It’s simple and only takes a few minutes. |
The views expressed in this report reflect those of the portfolio manager(s) only through the end of the period covered and do not necessarily represent the views of BNY Mellon Investment Adviser, Inc. or any other person in the BNY Mellon Investment Adviser, Inc. organization. Any such views are subject to change at any time based upon market or other conditions and BNY Mellon Investment Adviser, Inc. disclaims any responsibility to update such views. These views may not be relied on as investment advice and, because investment decisions for a fund in the BNY Mellon Family of Funds are based on numerous factors, may not be relied on as an indication of trading intent on behalf of any fund in the BNY Mellon Family of Funds. |
Not FDIC-Insured • Not Bank-Guaranteed • May Lose Value |
Contents
THE FUND
Information About the Renewal of | |
FOR MORE INFORMATION
Back Cover
DISCUSSION OF FUND PERFORMANCE (Unaudited)
For the period from December 1, 2022, through November 30, 2023, as provided by Charlie Macquaker, Roy Leckie, Jane Henderson, Fraser Fox and Maxim Skorniakov, members of the Investment Executive group at Walter Scott & Partners Limited (Walter Scott), sub-adviser
Market and Fund Performance Overview
For the 12-month period ended November 30, 2023, the BNY Mellon International Stock Fund (the “fund”) produced a return of 9.59% for Class A shares, 8.83% for Class C shares, 9.95% for Class I shares and 10.02% for Class Y shares.1 In comparison, the fund’s benchmark index, the MSCI EAFE® Index (the “Index”), achieved a return of 12.36% for the same period.2
International equities gained ground during the reporting period as global economic growth remained positive in the face of high inflation and rising interest rates, the U.S. Federal Reserve (the “Fed”) appeared to near an inflection point in its rate cycle, and the Chinese economy reopened after the government rescinded its “zero-COVID-19” policy. The fund underperformed the Index largely due to unfavorable stock selection in the industrial sector.
The Fund’s Investment Approach
The fund seeks long-term total returns. To pursue its goal, the fund normally invests at least 80% of its net assets, plus any borrowings for investment purposes, in stocks. The fund normally invests primarily in foreign companies located in developed markets. The fund ordinarily invests in at least three countries and is not geographically limited in its investment selection but, at times, may invest a substantial portion of its assets in a single country. The fund may invest in the securities of companies of any market capitalization. Walter Scott seeks investment opportunities in companies with fundamental strengths that indicate the potential for sustainable growth. Walter Scott focuses on individual stock selection, building the fund’s portfolio from the bottom up through extensive fundamental research. The investment process begins with the screening of reported company financials. Companies that meet certain broad, absolute and trend criteria are candidates for more detailed financial analysis. The fund’s Investment Team collectively reviews and selects those stocks that meet Walter Scott’s criteria, and where the expected growth rate is combined with a reasonable valuation for the underlying equity. Geographic and sector allocations are results of, not part of, the investment process, because the Investment Team’s sole focus is on the analysis of, and investment in, individual companies.
Equities Gain Ground as Inflation Eases
International developed-markets equities climbed during the reporting period as interest-rate hikes implemented by central banks gained traction in the fight against rampant inflation. In October 2022, just prior to the start of the reporting period, inflation in the 20-member eurozone averaged 10.6%, its highest level since the eurozone group was established in 1999. The European Central Bank raised its fixed benchmark rate from 0.75% to 1.50% on November 2, 2022, followed by seven additional increases during the reporting period to a range of 4.00% to 4.50% as of September 20, 2023. Inflation appeared to respond, declining to 2.40% as of November 2023. Economic growth rates declined as well, approaching zero at the end of the period, but remained positive on average for the period as a whole. Similar trends in the United States (where growth remained more strongly positive) and elsewhere
2
encouraged hopes that inflation might be tamed without prompting a major global recession. International markets were further buoyed by the Chinese government’s decision in December 2022 to end its “zero-COVID-19” strategy, which had resulted in lockdowns that slowed Chinese economic growth and disrupted global supply chains, with negative effects felt throughout the world’s economies. Although Chinese economic growth remained sluggish in the aftermath of the lockdowns, exacerbated by restrictive government and regulatory policies, investors continued to anticipate an eventual return to the more rapid pre-pandemic growth patterns. Developed-markets equities, particularly those denominated in U.S. dollars, also benefited from a weakening U.S. dollar relative to most international currencies. The U.S. dollar trended weaker during the first half of the period as U.S. inflation moderated, and the Fed appeared to near the end of its current rate-hike cycle.
Strong Stock Selection Bolsters Relative Returns
A few of the fund’s cyclical holdings underperformed as the pace of global economic growth slowed. Shares in Japan-based factory automation equipment and die component maker MISUMI Group Inc. lost ground, as some of the company’s customers slowed the pace of new orders as they worked to destock existing inventory. Canadian National Railway Co. experienced a slowdown in business tied to negative, global business trends, although the company’s fundamentals remained largely intact. Underweight exposure to the financial sector further detracted from relative returns, as did the performance of holdings in insurers AIA Group Ltd. and Prudential PLC, both of which were hurt by their business exposure to China. From a country perspective, Japanese holdings provided the weakest relative returns, largely due to the fund’s position in MISUMI, described above.
Conversely, the fund’s returns relative to the Index benefited from strong issue selection in the consumer discretionary and information technology sectors, as well as overweight exposure to information technology. Among consumer discretionary holdings, top performers included Germany-based sportswear apparel and accessories company adidas AG, which issued improved guidance as a new CEO reset the company’s business, and Spain-based apparel retailer Industria de Diseño Textil SA (Inditex), which maintained pricing power and generated strong performance in the wake of the pandemic. In information technology, Netherlands-based semiconductor equipment maker ASM International NV gained ground on investor enthusiasm for companies leveraged to the revolution in artificial intelligence. On a regional basis, investments in Europe provided the strongest boost to the fund’s relative performance.
Focusing on High-Quality Companies with Strong Fundamentals
As of the end of the reporting period, we are starting to see the effects of central banks’ aggressive rate hikes in various segments of the global economy, with further impacts likely as companies and consumers cope with an environment of high rates. While many companies have effectively controlled costs and continued to report reasonably strong earnings despite those pressures, we expect businesses to face increasing difficulties in meeting financial expectations in the months to come. We believe the fund’s holdings are relatively well positioned to outperform in the face of prevailing market uncertainties due to their high-quality, defensive characteristics and solid fundamentals, which enable them to operate effectively in varying economic environments. Our focus on profitability, financial
3
DISCUSSION OF FUND PERFORMANCE (Unaudited) (continued)
resilience and management quality is as strong as ever, given the challenges we expect may lie ahead.
December 15, 2023
1 Total return includes reinvestment of dividends and any capital gains paid and does not take into consideration the maximum initial sales charge in the case of Class A shares, or the applicable contingent deferred sales charge imposed on redemptions in the case of Class C shares. Had these charges been reflected, returns would have been lower. Past performance is no guarantee of future results. Share price and investment return fluctuate such that upon redemption, fund shares may be worth more or less than their original cost.
2 Source: Lipper Inc. — The MSCI EAFE® Index (Europe, Australasia, Far East) is a free float-adjusted, market capitalization-weighted index that is designed to measure the equity market performance of developed markets, excluding the U.S. and Canada. It reflects reinvestment of net dividends and, where applicable, capital gain distributions. Investors cannot invest directly in any index.
Equities are subject generally to market, market sector, market liquidity, issuer and investment style risks, among other factors, to varying degrees, all of which are more fully described in the fund’s prospectus.
Investing internationally involves special risks, including changes in currency exchange rates, political, economic, and social instability, a lack of comprehensive company information, differing auditing and legal standards, and less market liquidity.
Small and midsized company stocks tend to be more volatile and less liquid than larger company stocks as these companies are less established and have more volatile earnings histories.
The fund may, but is not required, to use derivative instruments. A small investment in derivatives could have a potentially large impact on the fund’s performance. The use of derivatives involves risks different from, or possibly greater than, the risks associated with investing directly in the underlying assets.
4
FUND PERFORMANCE (Unaudited)
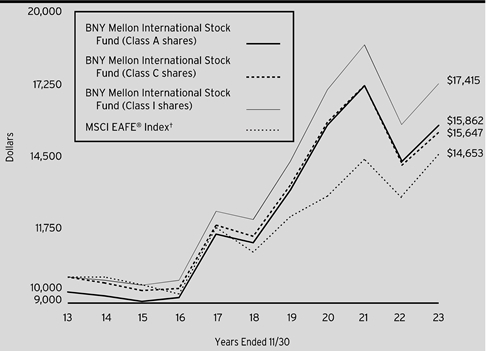
Comparison of change in value of a $10,000 investment in Class A shares, Class C shares, and Class I shares of BNY Mellon International Stock Fund with a hypothetical investment of $10,000 in the MSCI EAFE® Index (the “Index”).
† Source: Lipper Inc.
Past performance is not predictive of future performance.
The above graph compares a hypothetical investment of $10,000 made in each of the Class A shares, Class C shares, and Class I shares of BNY Mellon International Stock Fund on 11/30/13 to a hypothetical investment of $10,000 made in the Index on that date. All dividends and capital gain distributions are reinvested.
The fund’s performance shown in the line graph above takes into account the maximum initial sales charge on Class A shares and all other applicable fees and expenses on all classes. The Index (Europe, Australasia, Far East) is a free float-adjusted market capitalization-weighted index that is designed to measure the equity market performance of developed markets, excluding the U.S. and Canada. Unlike a mutual fund, the Index is not subject to charges, fees and other expenses. Investors cannot invest directly in any index. Further information relating to fund performance, including expense reimbursements, if applicable, is contained in the Financial Highlights section of the prospectus and elsewhere in this report.
5
FUND PERFORMANCE (Unaudited) (continued)
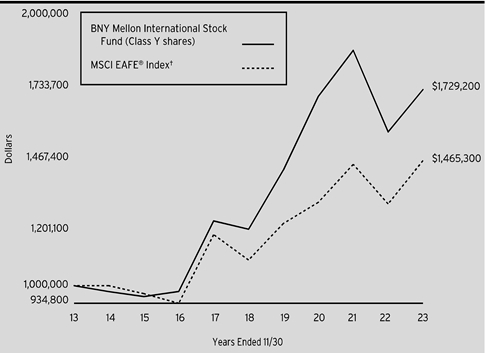
Comparison of change in value of a $1,000,000 investment in Class Y shares of BNY Mellon International Stock Fund with a hypothetical investment of $1,000,000 in the MSCI EAFE® Index (the “Index”).
† Source: Lipper Inc.
Past performance is not predictive of future performance.
The above graph compares a hypothetical investment of $1,000,000 made in Class Y shares of BNY Mellon International Stock Fund on 11/30/13 to a hypothetical investment of $1,000,000 made in the Index on that date. All dividends and capital gain distributions are reinvested.
The fund’s performance shown in the line graph above takes into account all other applicable fees and expenses of fund’s Class Y shares. The Index (Europe, Australasia, Far East) is a free float-adjusted market capitalization-weighted index that is designed to measure the equity market performance of developed markets, excluding the U.S. and Canada. Unlike a mutual fund, the Index is not subject to charges, fees and other expenses. Investors cannot invest directly in any index. Further information relating to fund performance, including expense reimbursements, if applicable, is contained in the Financial Highlights section of the prospectus and elsewhere in this report.
6
Average Annual Total Returns as of 11/30/2023 | ||||
| 1 Year | 5 Years | 10 Years | |
Class A shares | ||||
with maximum sales charge (5.75%) | 3.29% | 5.73% | 4.72% | |
without sales charge | 9.59% | 6.99% | 5.34% | |
Class C shares | ||||
with applicable redemption charge† | 7.83% | 6.24% | 4.58% | |
without redemption | 8.83% | 6.24% | 4.58% | |
Class I shares | 9.95% | 7.37% | 5.70% | |
Class Y shares | 10.02% | 7.40% | 5.63% | |
MSCI EAFE® Index | 12.36% | 5.99% | 3.89% | |
† The maximum contingent deferred sales charge for Class C shares is 1% for shares redeemed within one year of the date of purchase.
The performance data quoted represents past performance, which is no guarantee of future results. Share price and investment return fluctuate and an investor’s shares may be worth more or less than original cost upon redemption. Current performance may be lower or higher than the performance quoted. Go to www.im.bnymellon.com for the fund’s most recent month-end returns.
The fund’s performance shown in the graphs and table does not reflect the deduction of taxes that a shareholder would pay on fund distributions or the redemption of fund shares. In addition to the performance of Class A shares shown with and without a maximum sales charge, the fund’s performance shown in the table takes into account all other applicable fees and expenses on all classes.
7
UNDERSTANDING YOUR FUND’S EXPENSES (Unaudited)
As a mutual fund investor, you pay ongoing expenses, such as management fees and other expenses. Using the information below, you can estimate how these expenses affect your investment and compare them with the expenses of other funds. You also may pay one-time transaction expenses, including sales charges (loads) and redemption fees, which are not shown in this section and would have resulted in higher total expenses. For more information, see your fund’s prospectus or talk to your financial adviser.
Review your fund’s expenses
The table below shows the expenses you would have paid on a $1,000 investment in BNY Mellon International Stock Fund from June 1, 2023 to November 30, 2023. It also shows how much a $1,000 investment would be worth at the close of the period, assuming actual returns and expenses.
Expenses and Value of a $1,000 Investment |
| |||||
Assume actual returns for the six months ended November 30, 2023 |
| |||||
|
|
|
|
|
|
|
|
| Class A | Class C | Class I | Class Y |
|
Expenses paid per $1,000† | $6.25 | $9.89 | $4.66 | $4.46 |
| |
Ending value (after expenses) | $996.10 | $992.80 | $997.80 | $998.20 |
| |
COMPARING YOUR FUND’S EXPENSES WITH THOSE OF OTHER FUNDS (Unaudited)
Using the SEC’s method to compare expenses
The Securities and Exchange Commission (“SEC”) has established guidelines to help investors assess fund expenses. Per these guidelines, the table below shows your fund’s expenses based on a $1,000 investment, assuming a hypothetical 5% annualized return. You can use this information to compare the ongoing expenses (but not transaction expenses or total cost) of investing in the fund with those of other funds. All mutual fund shareholder reports will provide this information to help you make this comparison. Please note that you cannot use this information to estimate your actual ending account balance and expenses paid during the period.
Expenses and Value of a $1,000 Investment |
| |||||
Assuming a hypothetical 5% annualized return for the six months ended November 30, 2023 |
| |||||
|
|
|
|
|
|
|
|
| Class A | Class C | Class I | Class Y |
|
Expenses paid per $1,000† | $6.33 | $10.00 | $4.71 | $4.51 |
| |
Ending value (after expenses) | $1,018.80 | $1,015.14 | $1,020.41 | $1,020.61 |
| |
† | Expenses are equal to the fund’s annualized expense ratio of 1.25% for Class A, 1.98% for Class C, .93% for Class I and .89% for Class Y, multiplied by the average account value over the period, multiplied by 183/365 (to reflect the one-half year period). | |||||
8
STATEMENT OF INVESTMENTS
November 30, 2023
Description | Shares | Value ($) | |||||
Common Stocks - 98.1% | |||||||
Australia - 3.4% | |||||||
Cochlear Ltd. | 431,100 | 77,775,260 | |||||
CSL Ltd. | 686,800 | 119,000,787 | |||||
196,776,047 | |||||||
Canada - 5.5% | |||||||
Alimentation Couche-Tard, Inc. | 3,146,200 | 179,458,256 | |||||
Canadian National Railway Co. | 1,132,300 | 131,391,693 | |||||
310,849,949 | |||||||
Denmark - 6.2% | |||||||
Coloplast A/S, Cl. B | 923,000 | 108,895,038 | |||||
Novo Nordisk A/S, Cl. B | 2,401,000 | 243,828,419 | |||||
352,723,457 | |||||||
Finland - 1.5% | |||||||
Kone OYJ, Cl. B | 1,905,000 | 84,581,838 | |||||
France - 14.6% | |||||||
Air Liquide SA | 844,100 | 159,687,935 | |||||
Dassault Systemes SE | 2,371,400 | 110,904,218 | |||||
Hermes International SCA | 42,000 | 87,054,312 | |||||
L'Oreal SA | 372,000 | 174,541,628 | |||||
LVMH Moet Hennessy Louis Vuitton SE | 203,500 | 155,654,901 | |||||
TotalEnergies SE | 2,126,000 | 144,079,041 | |||||
831,922,035 | |||||||
Germany - 7.1% | |||||||
adidas AG | 663,300 | 138,725,474 | |||||
Merck KGaA | 631,000 | 109,997,986 | |||||
SAP SE | 967,100 | 153,145,101 | |||||
401,868,561 | |||||||
Hong Kong - 6.4% | |||||||
AIA Group Ltd. | 13,412,000 | 115,725,782 | |||||
CLP Holdings Ltd. | 9,862,500 | 76,702,582 | |||||
Hang Lung Properties Ltd. | 29,108,000 | 38,903,578 | |||||
Jardine Matheson Holdings Ltd. | 983,100 | 37,957,491 | |||||
Prudential PLC | 8,634,900 | 94,076,748 | |||||
363,366,181 | |||||||
Ireland - 2.4% | |||||||
Experian PLC | 3,750,400 | 137,448,123 | |||||
Italy - 1.3% | |||||||
Ferrari NV | 211,400 | 76,074,002 | |||||
Japan - 19.1% | |||||||
Daikin Industries Ltd. | 647,400 | 96,743,201 | |||||
FANUC Corp. | 2,576,000 | 71,480,264 | |||||
Hoya Corp. | 1,065,100 | 119,721,378 | |||||
9
STATEMENT OF INVESTMENTS (continued)
Description | Shares | Value ($) | |||||
Common Stocks - 98.1% (continued) | |||||||
Japan - 19.1% (continued) | |||||||
Keyence Corp. | 427,280 | 182,572,427 | |||||
MISUMI Group, Inc. | 1,837,800 | 29,749,899 | |||||
Murata Manufacturing Co. Ltd. | 5,700,000 | 110,858,964 | |||||
Shin-Etsu Chemical Co. Ltd. | 4,683,500 | 164,645,906 | |||||
SMC Corp. | 271,400 | 136,285,782 | |||||
Sysmex Corp. | 1,382,900 | 76,308,545 | |||||
Terumo Corp. | 3,014,900 | 95,941,577 | |||||
1,084,307,943 | |||||||
Netherlands - 7.0% | |||||||
ASM International NV | 251,000 | 128,601,594 | |||||
ASML Holding NV | 314,790 | 213,470,274 | |||||
Wolters Kluwer NV | 415,500 | 57,121,922 | |||||
399,193,790 | |||||||
Spain - 3.6% | |||||||
Amadeus IT Group SA | 860,700 | 58,854,296 | |||||
Industria de Diseno Textil SA | 3,600,000 | 148,240,638 | |||||
207,094,934 | |||||||
Sweden - 1.6% | |||||||
Atlas Copco AB, Cl. B | 6,766,700 | 89,190,645 | |||||
Switzerland - 11.4% | |||||||
Kuehne + Nagel International AG | 374,300 | 108,225,146 | |||||
Lonza Group AG | 198,600 | 76,745,735 | |||||
Nestle SA | 1,000,000 | 113,452,095 | |||||
Novartis AG | 1,339,800 | 130,231,559 | |||||
Roche Holding AG | 409,500 | 110,383,094 | |||||
SGS SA | 1,271,000 | 107,839,785 | |||||
646,877,414 | |||||||
Taiwan - 2.7% | |||||||
Taiwan Semiconductor Manufacturing Co. Ltd., ADR | 1,574,600 | 153,224,326 | |||||
United Kingdom - 4.3% | |||||||
Compass Group PLC | 5,375,500 | 135,929,588 | |||||
Diageo PLC | 3,088,600 | 107,754,477 | |||||
243,684,065 | |||||||
Total Common Stocks (cost $3,656,759,811) | 5,579,183,310 | ||||||
10
Description | 1-Day | Shares | Value ($) | ||||
Investment Companies - 1.6% | |||||||
Registered Investment Companies - 1.6% | |||||||
Dreyfus Institutional Preferred Government Plus Money Market Fund, Institutional Shares | 5.41 | 89,283,243 | a | 89,283,243 | |||
Total Investments (cost $3,746,043,054) | 99.7% | 5,668,466,553 | |||||
Cash and Receivables (Net) | .3% | 15,411,637 | |||||
Net Assets | 100.0% | 5,683,878,190 | |||||
ADR—American Depositary Receipt
a Investment in affiliated issuer. The investment objective of this investment company is publicly available and can be found within the investment company’s prospectus.
Portfolio Summary (Unaudited) † | Value (%) |
Pharmaceuticals, Biotechnology & Life Sciences | 13.9 |
Capital Goods | 9.6 |
Semiconductors & Semiconductor Equipment | 8.7 |
Health Care Equipment & Services | 8.4 |
Consumer Durables & Apparel | 6.7 |
Materials | 5.7 |
Commercial & Professional Services | 5.3 |
Technology Hardware & Equipment | 5.2 |
Software & Services | 4.6 |
Transportation | 4.2 |
Food, Beverage & Tobacco | 3.9 |
Insurance | 3.7 |
Consumer Services | 3.4 |
Consumer Staples Distribution | 3.2 |
Household & Personal Products | 3.1 |
Consumer Discretionary Distribution | 2.6 |
Energy | 2.5 |
Investment Companies | 1.6 |
Utilities | 1.4 |
Automobiles & Components | 1.3 |
Real Estate Management & Development | .7 |
99.7 |
† Based on net assets.
See notes to financial statements.
11
STATEMENT OF INVESTMENTS (continued)
Affiliated Issuers | ||||||
Description | Value ($) 11/30/2022 | Purchases ($)† | Sales ($) | Value ($) 11/30/2023 | Dividends/ | |
Registered Investment Companies - 1.6% | ||||||
Dreyfus Institutional Preferred Government Plus Money Market Fund, Institutional Shares - 1.6% | 56,786,189 | 787,503,022 | (755,005,968) | 89,283,243 | 5,560,630 | |
Investment of Cash Collateral for Securities Loaned - .0%†† | ||||||
Dreyfus Institutional Preferred Government Plus Money Market Fund, SL Shares - .0% | 2,950,693 | 22,213,248 | (25,163,941) | - | 1,570 | †† |
Total - 1.6% | 59,736,882 | 809,716,270 | (780,169,909) | 89,283,243 | 5,562,200 | |
† Includes reinvested dividends/distributions.
†† Represents securities lending income earned from the reinvestment of cash collateral from loaned securities, net of fees and collateral investment expenses, and other payments to and from borrowers of securities.
See notes to financial statements.
12
STATEMENT OF ASSETS AND LIABILITIES
November 30, 2023
|
|
|
|
|
|
|
|
|
| Cost |
| Value |
|
Assets ($): |
|
|
|
| ||
Investments in securities—See Statement of Investments |
|
|
| |||
Unaffiliated issuers | 3,656,759,811 |
| 5,579,183,310 |
| ||
Affiliated issuers |
| 89,283,243 |
| 89,283,243 |
| |
Cash denominated in foreign currency |
|
| 249,797 |
| 249,797 |
|
Tax reclaim receivable—Note 1(b) |
| 21,493,753 |
| |||
Dividends and securities lending income receivable |
| 3,164,998 |
| |||
Receivable for shares of Common Stock subscribed |
| 2,611,340 |
| |||
Prepaid expenses |
|
|
|
| 83,295 |
|
|
|
|
|
| 5,696,069,736 |
|
Liabilities ($): |
|
|
|
| ||
Due to BNY Mellon Investment Adviser, Inc. and affiliates—Note 3(c) |
| 4,278,837 |
| |||
Payable for shares of Common Stock redeemed |
| 7,447,569 |
| |||
Directors’ fees and expenses payable |
| 96,667 |
| |||
Other accrued expenses |
|
|
|
| 368,473 |
|
|
|
|
|
| 12,191,546 |
|
Net Assets ($) |
|
| 5,683,878,190 |
| ||
Composition of Net Assets ($): |
|
|
|
| ||
Paid-in capital |
|
|
|
| 3,635,484,714 |
|
Total distributable earnings (loss) |
|
|
|
| 2,048,393,476 |
|
Net Assets ($) |
|
| 5,683,878,190 |
| ||
Net Asset Value Per Share | Class A | Class C | Class I | Class Y |
|
Net Assets ($) | 53,399,890 | 8,255,402 | 3,345,179,052 | 2,277,043,846 |
|
Shares Outstanding | 2,333,689 | 372,102 | 145,014,486 | 99,935,637 |
|
Net Asset Value Per Share ($) | 22.88 | 22.19 | 23.07 | 22.79 |
|
|
|
|
|
|
|
See notes to financial statements. |
|
|
|
|
|
13
STATEMENT OF OPERATIONS
Near Ended November 30, 2023
|
|
|
|
|
|
|
|
|
|
|
|
|
|
Investment Income ($): |
|
|
|
| ||
Income: |
|
|
|
| ||
Cash dividends (net of $12,293,507 foreign taxes withheld at source): |
| |||||
Unaffiliated issuers |
|
| 96,319,192 |
| ||
Affiliated issuers |
|
| 5,560,630 |
| ||
Interest |
|
| 71,032 |
| ||
Income from securities lending—Note 1(c) |
|
| 1,570 |
| ||
Total Income |
|
| 101,952,424 |
| ||
Expenses: |
|
|
|
| ||
Management fee—Note 3(a) |
|
| 47,338,978 |
| ||
Shareholder servicing costs—Note 3(c) |
|
| 1,450,855 |
| ||
Custodian fees—Note 3(c) |
|
| 604,721 |
| ||
Directors’ fees and expenses—Note 3(d) |
|
| 600,124 |
| ||
Prospectus and shareholders’ reports |
|
| 206,179 |
| ||
Registration fees |
|
| 203,126 |
| ||
Professional fees |
|
| 116,377 |
| ||
Loan commitment fees—Note 2 |
|
| 114,317 |
| ||
Distribution fees—Note 3(b) |
|
| 59,980 |
| ||
Chief Compliance Officer fees—Note 3(c) |
|
| 20,809 |
| ||
Interest expense—Note 2 |
|
| 7,053 |
| ||
Miscellaneous |
|
| 199,214 |
| ||
Total Expenses |
|
| 50,921,733 |
| ||
Less—reduction in fees due to earnings credits—Note 3(c) |
|
| (19,735) |
| ||
Net Expenses |
|
| 50,901,998 |
| ||
Net Investment Income |
|
| 51,050,426 |
| ||
Realized and Unrealized Gain (Loss) on Investments—Note 4 ($): |
|
| ||||
Net realized gain (loss) on investments and foreign currency transactions | 84,194,207 |
| ||||
Net realized gain (loss) on forward foreign currency exchange contracts | (122) |
| ||||
Net Realized Gain (Loss) |
|
| 84,194,085 |
| ||
Net change in unrealized appreciation (depreciation) on investments | 376,839,238 |
| ||||
Net Realized and Unrealized Gain (Loss) on Investments |
|
| 461,033,323 |
| ||
Net Increase in Net Assets Resulting from Operations |
| 512,083,749 |
| |||
|
|
|
|
|
|
|
See notes to financial statements. | ||||||
14
STATEMENT OF CHANGES IN NET ASSETS
|
|
|
| Year Ended November 30, | |||||
|
|
|
| 2023 |
| 2022 |
| ||
Operations ($): |
|
|
|
|
|
|
|
| |
Net investment income |
|
| 51,050,426 |
|
|
| 48,670,809 |
| |
Net realized gain (loss) on investments |
| 84,194,085 |
|
|
| 70,582,127 |
| ||
Net change in unrealized appreciation |
| 376,839,238 |
|
|
| (1,294,177,138) |
| ||
Net Increase (Decrease) in Net Assets | 512,083,749 |
|
|
| (1,174,924,202) |
| |||
Distributions ($): |
| ||||||||
Distributions to shareholders: |
|
|
|
|
|
|
|
| |
Class A |
|
| (1,125,756) |
|
|
| (413,959) |
| |
Class C |
|
| (122,014) |
|
|
| (39,893) |
| |
Class I |
|
| (69,770,512) |
|
|
| (34,258,850) |
| |
Class Y |
|
| (57,671,055) |
|
|
| (28,298,432) |
| |
Total Distributions |
|
| (128,689,337) |
|
|
| (63,011,134) |
| |
Capital Stock Transactions ($): |
| ||||||||
Net proceeds from shares sold: |
|
|
|
|
|
|
|
| |
Class A |
|
| 18,167,024 |
|
|
| 18,118,520 |
| |
Class C |
|
| 1,770,409 |
|
|
| 1,118,761 |
| |
Class I |
|
| 827,278,810 |
|
|
| 1,082,898,560 |
| |
Class Y |
|
| 232,930,379 |
|
|
| 424,941,188 |
| |
Distributions reinvested: |
|
|
|
|
|
|
|
| |
Class A |
|
| 1,063,135 |
|
|
| 385,478 |
| |
Class C |
|
| 122,014 |
|
|
| 39,848 |
| |
Class I |
|
| 65,996,191 |
|
|
| 32,404,933 |
| |
Class Y |
|
| 30,875,099 |
|
|
| 13,658,420 |
| |
Cost of shares redeemed: |
|
|
|
|
|
|
|
| |
Class A |
|
| (25,114,006) |
|
|
| (25,399,495) |
| |
Class C |
|
| (83,433) |
|
|
| (4,312,164) |
| |
Class I |
|
| (692,551,639) |
|
|
| (1,339,576,090) |
| |
Class Y |
|
| (471,867,779) |
|
|
| (657,385,624) |
| |
Increase (Decrease) in Net Assets | (11,413,796) |
|
|
| (453,107,665) |
| |||
Total Increase (Decrease) in Net Assets | 371,980,616 |
|
|
| (1,691,043,001) |
| |||
Net Assets ($): |
| ||||||||
Beginning of Period |
|
| 5,311,897,574 |
|
|
| 7,002,940,575 |
| |
End of Period |
|
| 5,683,878,190 |
|
|
| 5,311,897,574 |
| |
15
STATEMENT OF CHANGES IN NET ASSETS (continued)
|
|
|
| Year Ended November 30, | |||||
|
|
|
| 2023 |
| 2022 |
| ||
Capital Share Transactions (Shares): |
| ||||||||
Class Aa,b |
|
|
|
|
|
|
|
| |
Shares sold |
|
| 819,259 |
|
|
| 826,044 |
| |
Shares issued for distributions reinvested |
|
| 50,077 |
|
|
| 14,809 |
| |
Shares redeemed |
|
| (1,121,924) |
|
|
| (1,166,148) |
| |
Net Increase (Decrease) in Shares Outstanding | (252,588) |
|
|
| (325,295) |
| |||
Class Ca,b |
|
|
|
|
|
|
|
| |
Shares sold |
|
| 81,500 |
|
|
| 47,039 |
| |
Shares issued for distributions reinvested |
|
| 5,886 |
|
|
| 1,565 |
| |
Shares redeemed |
|
| (262) |
|
|
| (210,035) |
| |
Net Increase (Decrease) in Shares Outstanding | 87,124 |
|
|
| (161,431) |
| |||
Class Ia |
|
|
|
|
|
|
|
| |
Shares sold |
|
| 36,903,799 |
|
|
| 49,149,580 |
| |
Shares issued for distributions reinvested |
|
| 3,092,605 |
|
|
| 1,238,247 |
| |
Shares redeemed |
|
| (31,071,754) |
|
|
| (62,997,157) |
| |
Net Increase (Decrease) in Shares Outstanding | 8,924,650 |
|
|
| (12,609,330) |
| |||
Class Ya |
|
|
|
|
|
|
|
| |
Shares sold |
|
| 10,514,691 |
|
|
| 19,556,870 |
| |
Shares issued for distributions reinvested |
|
| 1,465,359 |
|
|
| 528,372 |
| |
Shares redeemed |
|
| (21,512,833) |
|
|
| (30,663,296) |
| |
Net Increase (Decrease) in Shares Outstanding | (9,532,783) |
|
|
| (10,578,054) |
| |||
|
|
|
|
|
|
|
|
|
|
a | During the period ended November 30, 2023, 1,542,792 Class Y shares representing $34,142,061 were exchanged for 1,523,613 Class I shares. During the period ended November 30, 2022, 3,779,535 Class Y shares representing $90,873,549 were exchanged for 3,733,659 Class I shares, 94,931 Class C shares representing $1,919,508 were exchanged for 91,492 Class I shares and 652 Class I shares representing $10,867 were exchanged for 657 Class A shares. | ||||||||
b | During the period ended November 30, 2022, 8 Class C shares representing $175 were automatically converted to 8 Class A shares. | ||||||||
See notes to financial statements. | |||||||||
16
FINANCIAL HIGHLIGHTS
The following tables describe the performance for each share class for the fiscal periods indicated. All information (except portfolio turnover rate) reflects financial results for a single fund share. Net asset value total return is calculated assuming an initial investment made at the net asset value at the beginning of the period, reinvestment of all dividends and distributions at net asset value during the period, and redemption at net asset value on the last day of the period. Net asset value total return includes adjustments in accordance with accounting principles generally accepted in the United States of America and as such, the net asset value for financial reporting purposes and the returns based upon those net asset values may differ from the net asset value and returns for shareholder transactions. These figures have been derived from the fund’s financial statements.
| ||||||
Year Ended November 30, | ||||||
Class A Shares | 2023 | 2022 | 2021 | 2020 | 2019 | |
Per Share Data ($): | ||||||
Net asset value, | 21.31 | 25.66 | 24.09 | 20.76 | 17.86 | |
Investment Operations: | ||||||
Net investment incomea | .14 | .10 | .05 | .08 | .15 | |
Net realized and unrealized | 1.88 | (4.31) | 2.21 | 3.72 | 2.98 | |
Total from | 2.02 | (4.21) | 2.26 | 3.80 | 3.13 | |
Distributions: | ||||||
Dividends from | (.12) | (.05) | (.08) | (.15) | (.15) | |
Dividends from net realized | (.33) | (.09) | (.61) | (.32) | (.08) | |
Total Distributions | (.45) | (.14) | (.69) | (.47) | (.23) | |
Net asset value, end of period | 22.88 | 21.31 | 25.66 | 24.09 | 20.76 | |
Total Return (%)b | 9.59 | (16.50) | 9.58 | 18.67 | 17.81 | |
Ratios/Supplemental Data (%): | ||||||
Ratio of total expenses | 1.23 | 1.29 | 1.27 | 1.30 | 1.24 | |
Ratio of net expenses | 1.23 | 1.29 | 1.27 | 1.30 | 1.24 | |
Ratio of net investment income | .62 | .45 | .20 | .35 | .77 | |
Portfolio Turnover Rate | 7.37 | 6.98 | 8.72 | 7.20 | 7.38 | |
Net Assets, | 53,400 | 55,110 | 74,707 | 59,740 | 37,036 | |
a Based on average shares outstanding.
b Exclusive of sales charge.
See notes to financial statements.
17
FINANCIAL HIGHLIGHTS (continued)
Year Ended November 30, | ||||||
Class C Shares | 2023 | 2022 | 2021 | 2020 | 2019 | |
Per Share Data ($): | ||||||
Net asset value, | 20.71 | 25.07 | 23.63 | 20.38 | 17.53 | |
Investment Operations: | ||||||
Net investment income (loss)a | (.04) | (.05) | (.12) | (.06) | .02 | |
Net realized and unrealized | 1.85 | (4.22) | 2.17 | 3.65 | 2.92 | |
Total from | 1.81 | (4.27) | 2.05 | 3.59 | 2.94 | |
Distributions: | ||||||
Dividends from | - | - | - | (.02) | (.01) | |
Dividends from net realized | (.33) | (.09) | (.61) | (.32) | (.08) | |
Total Distributions | (.33) | (.09) | (.61) | (.34) | (.09) | |
Net asset value, end of period | 22.19 | 20.71 | 25.07 | 23.63 | 20.38 | |
Total Return (%)b | 8.83 | (17.10) | 8.85 | 17.84 | 16.96 | |
Ratios/Supplemental Data (%): | ||||||
Ratio of total expenses | 1.98 | 1.98 | 1.97 | 1.98 | 1.98 | |
Ratio of net expenses | 1.98 | 1.98 | 1.97 | 1.98 | 1.98 | |
Ratio of net investment income | (.18) | (.24) | (.47) | (.30) | .12 | |
Portfolio Turnover Rate | 7.37 | 6.98 | 8.72 | 7.20 | 7.38 | |
Net Assets, | 8,255 | 5,903 | 11,190 | 14,510 | 12,001 | |
a Based on average shares outstanding.
b Exclusive of sales charge.
See notes to financial statements.
18
Year Ended November 30, | ||||||
Class I Shares | 2023 | 2022 | 2021 | 2020 | 2019 | |
Per Share Data ($): | ||||||
Net asset value, | 21.50 | 25.88 | 24.27 | 20.90 | 17.98 | |
Investment Operations: | ||||||
Net investment incomea | .20 | .18 | .14 | .15 | .22 | |
Net realized and unrealized | 1.90 | (4.33) | 2.23 | 3.75 | 2.99 | |
Total from | 2.10 | (4.15) | 2.37 | 3.90 | 3.21 | |
Distributions: | ||||||
Dividends from | (.20) | (.14) | (.15) | (.21) | (.21) | |
Dividends from net realized | (.33) | (.09) | (.61) | (.32) | (.08) | |
Total Distributions | (.53) | (.23) | (.76) | (.53) | (.29) | |
Net asset value, end of period | 23.07 | 21.50 | 25.88 | 24.27 | 20.90 | |
Total Return (%) | 9.95 | (16.20) | 10.01 | 19.07 | 18.23 | |
Ratios/Supplemental Data (%): | ||||||
Ratio of total expenses | .93 | .92 | .91 | .91 | .91 | |
Ratio of net expenses | .93 | .92 | .91 | .91 | .91 | |
Ratio of net investment income | ||||||
to average net assets | .90 | .81 | .56 | .72 | 1.13 | |
Portfolio Turnover Rate | 7.37 | 6.98 | 8.72 | 7.20 | 7.38 | |
Net Assets, | 3,345,179 | 2,925,622 | 3,847,708 | 3,142,203 | 2,191,801 | |
a Based on average shares outstanding.
See notes to financial statements.
19
FINANCIAL HIGHLIGHTS (continued)
Year Ended November 30, | ||||||
Class Y Shares | 2023 | 2022 | 2021 | 2020 | 2019 | |
Per Share Data ($): | ||||||
Net asset value, | 21.24 | 25.57 | 23.99 | 20.66 | 17.78 | |
Investment Operations: | ||||||
Net investment incomea | .21 | .19 | .15 | .16 | .21 | |
Net realized and unrealized | 1.88 | (4.28) | 2.19 | 3.71 | 2.97 | |
Total from Investment Operations | 2.09 | (4.09) | 2.34 | 3.87 | 3.18 | |
Distributions: | ||||||
Dividends from | (.21) | (.15) | (.15) | (.22) | (.22) | |
Dividends from net realized | (.33) | (.09) | (.61) | (.32) | (.08) | |
Total Distributions | (.54) | (.24) | (.76) | (.54) | (.30) | |
Net asset value, end of period | 22.79 | 21.24 | 25.57 | 23.99 | 20.66 | |
Total Return (%) | 10.02 | (16.17) | 10.02 | 19.12 | 18.24 | |
Ratios/Supplemental Data (%): | ||||||
Ratio of total expenses | .89 | .89 | .88 | .89 | .89 | |
Ratio of net expenses | .89 | .89 | .88 | .89 | .89 | |
Ratio of net investment income | .95 | .85 | .59 | .77 | 1.12 | |
Portfolio Turnover Rate | 7.37 | 6.98 | 8.72 | 7.20 | 7.38 | |
Net Assets, | 2,277,044 | 2,325,263 | 3,069,335 | 2,818,746 | 2,284,939 | |
a Based on average shares outstanding.
See notes to financial statements.
20
NOTES TO FINANCIAL STATEMENTS
NOTE 1—Significant Accounting Policies:
BNY Mellon International Stock Fund (the “fund”) is a separate diversified series of BNY Mellon Strategic Funds, Inc. (the “Company”), which is registered under the Investment Company Act of 1940, as amended (the “Act”), as an open-end management investment company and operates as a series company currently offering six series, including the fund. The fund’s investment objective is to seek long-term total return. BNY Mellon Investment Adviser, Inc. (the “Adviser”), a wholly-owned subsidiary of The Bank of New York Mellon Corporation (“BNY Mellon”), serves as the fund’s investment adviser. Walter Scott & Partners Limited (the “Sub-Adviser”), an indirect wholly-owned subsidiary of BNY Mellon and an affiliate of the Adviser, serves as the fund’s sub-adviser.
BNY Mellon Securities Corporation (the “Distributor”), a wholly-owned subsidiary of the Adviser, is the distributor of the fund’s shares. The fund is authorized to issue 700 million shares of $.001 par value Common Stock. The fund currently has authorized four classes of shares: Class A (100 million shares authorized), Class C (100 million shares authorized), Class I (250 million shares authorized) and Class Y (250 million shares authorized). Class A and Class C shares are sold primarily to retail investors through financial intermediaries and bear Distribution and/or Shareholder Services Plan fees. Class A shares generally are subject to a sales charge imposed at the time of purchase. Class A shares bought without an initial sales charge as part of an investment of $1 million or more may be charged a contingent deferred sales charge (“CDSC”) of 1.00% if redeemed within one year. Class C shares are subject to a CDSC imposed on Class C shares redeemed within one year of purchase. Class C shares automatically convert to Class A shares eight years after the date of purchase, without the imposition of a sales charge. Class I shares are sold primarily to bank trust departments and other financial service providers (including BNY Mellon and its affiliates), acting on behalf of customers having a qualified trust or an investment account or relationship at such institution, and bear no Distribution or Shareholder Services Plan fees. Class Y shares are sold at net asset value per share generally to institutional investors, and bear no Distribution or Shareholder Services Plan fees. Class I and Class Y shares are offered without a front-end sales charge or CDSC. Other differences between the classes include the services offered to and the expenses borne by each class, the allocation of certain transfer agency costs and certain voting rights. Income, expenses (other than expenses attributable to a specific class), and realized and unrealized gains or losses
21
NOTES TO FINANCIAL STATEMENTS (continued)
on investments are allocated to each class of shares based on its relative net assets.
The Company accounts separately for the assets, liabilities and operations of each series. Expenses directly attributable to each series are charged to that series’ operations; expenses which are applicable to all series are allocated among them on a pro rata basis.
The Financial Accounting Standards Board (“FASB”) Accounting Standards Codification (“ASC”) is the exclusive reference of authoritative U.S. generally accepted accounting principles (“GAAP”) recognized by the FASB to be applied by nongovernmental entities. Rules and interpretive releases of the SEC under authority of federal laws are also sources of authoritative GAAP for SEC registrants. The fund is an investment company and applies the accounting and reporting guidance of the FASB ASC Topic 946 Financial Services-Investment Companies. The fund’s financial statements are prepared in accordance with GAAP, which may require the use of management estimates and assumptions. Actual results could differ from those estimates.
The Company enters into contracts that contain a variety of indemnifications. The fund’s maximum exposure under these arrangements is unknown. The fund does not anticipate recognizing any loss related to these arrangements.
(a) Portfolio valuation: The fair value of a financial instrument is the amount that would be received to sell an asset or paid to transfer a liability in an orderly transaction between market participants at the measurement date (i.e., the exit price). GAAP establishes a fair value hierarchy that prioritizes the inputs of valuation techniques used to measure fair value. This hierarchy gives the highest priority to unadjusted quoted prices in active markets for identical assets or liabilities (Level 1 measurements) and the lowest priority to unobservable inputs (Level 3 measurements).
Additionally, GAAP provides guidance on determining whether the volume and activity in a market has decreased significantly and whether such a decrease in activity results in transactions that are not orderly. GAAP requires enhanced disclosures around valuation inputs and techniques used during annual and interim periods.
Various inputs are used in determining the value of the fund’s investments relating to fair value measurements. These inputs are summarized in the three broad levels listed below:
Level 1—unadjusted quoted prices in active markets for identical investments.
22
Level 2—other significant observable inputs (including quoted prices for similar investments, interest rates, prepayment speeds, credit risk, etc.).
Level 3—significant unobservable inputs (including the fund’s own assumptions in determining the fair value of investments).
The inputs or methodology used for valuing securities are not necessarily an indication of the risk associated with investing in those securities.
Changes in valuation techniques may result in transfers in or out of an assigned level within the disclosure hierarchy. Valuation techniques used to value the fund’s investments are as follows:
The Company’s Board of Directors (the “Board”) has designated the Adviser as the fund’s valuation designee to make all fair value determinations with respect to the fund’s portfolio investments, subject to the Board’s oversight and pursuant to Rule 2a-5 under the Act.
Investments in equity securities are valued at the last sales price on the securities exchange or national securities market on which such securities are primarily traded. Securities listed on the National Market System for which market quotations are available are valued at the official closing price or, if there is no official closing price that day, at the last sales price. For open short positions, asked prices are used for valuation purposes. Bid price is used when no asked price is available. Registered investment companies that are not traded on an exchange are valued at their net asset value. All of the preceding securities are generally categorized within Level 1 of the fair value hierarchy.
Securities not listed on an exchange or the national securities market, or securities for which there were no transactions, are valued at the average of the most recent bid and asked prices. These securities are generally categorized within Level 2 of the fair value hierarchy.
Fair valuing of securities may be determined with the assistance of a pricing service using calculations based on indices of domestic securities and other appropriate indicators, such as prices of relevant ADRs and futures. Utilizing these techniques may result in transfers between Level 1 and Level 2 of the fair value hierarchy.
When market quotations or official closing prices are not readily available, or are determined not to accurately reflect fair value, such as when the value of a security has been significantly affected by events after the close of the exchange or market on which the security is principally traded (for example, a foreign exchange or market), but before the fund calculates its net asset value, the fund may value these investments at fair value as
23
NOTES TO FINANCIAL STATEMENTS (continued)
determined in accordance with the procedures approved by the Board. Certain factors may be considered when fair valuing investments such as: fundamental analytical data, the nature and duration of restrictions on disposition, an evaluation of the forces that influence the market in which the securities are purchased and sold, and public trading in similar securities of the issuer or comparable issuers. These securities are either categorized within Level 2 or 3 of the fair value hierarchy depending on the relevant inputs used.
For securities where observable inputs are limited, assumptions about market activity and risk are used and such securities are generally categorized within Level 3 of the fair value hierarchy.
Investments denominated in foreign currencies are translated to U.S. dollars at the prevailing rates of exchange.
The following is a summary of the inputs used as of November 30, 2023 in valuing the fund’s investments:
Level 1-Unadjusted Quoted Prices | Level 2- Other Significant Observable Inputs | Level 3-Significant Unobservable Inputs | Total | |||
Assets ($) | ||||||
Investments in Securities:† | ||||||
Equity Securities - Common Stocks | 5,579,183,310 | - | - | 5,579,183,310 | ||
Investment Companies | 89,283,243 | - | - | 89,283,243 | ||
† See Statement of Investments for additional detailed categorizations, if any.
(b) Foreign currency transactions: The fund does not isolate that portion of the results of operations resulting from changes in foreign exchange rates on investments from the fluctuations arising from changes in the market prices of securities held. Such fluctuations are included with the net realized and unrealized gain or loss on investments.
Net realized foreign exchange gains or losses arise from sales of foreign currencies, currency gains or losses realized on securities transactions between trade and settlement date, and the difference between the amounts of dividends, interest and foreign withholding taxes recorded on the fund’s books and the U.S. dollar equivalent of the amounts actually received or paid. Net unrealized foreign exchange gains and losses arise from changes in the value of assets and liabilities other than investments resulting from changes in exchange rates. Foreign currency gains and losses on foreign currency transactions are also included with net realized and unrealized gain or loss on investments.
24
Foreign taxes: The fund may be subject to foreign taxes (a portion of which may be reclaimable) on income, stock dividends, realized and unrealized capital gains on investments or certain foreign currency transactions. Foreign taxes are recorded in accordance with the applicable foreign tax regulations and rates that exist in the foreign jurisdictions in which the fund invests. These foreign taxes, if any, are paid by the fund and are reflected in the Statement of Operations, if applicable. Foreign taxes payable or deferred or those subject to reclaims as of November 30, 2023, if any, are disclosed in the fund’s Statement of Assets and Liabilities.
(c) Securities transactions and investment income: Securities transactions are recorded on a trade date basis. Realized gains and losses from securities transactions are recorded on the identified cost basis. Dividend income is recognized on the ex-dividend date and interest income, including, where applicable, accretion of discount and amortization of premium on investments, is recognized on the accrual basis.
Pursuant to a securities lending agreement with BNY Mellon, the fund may lend securities to qualified institutions. It is the fund’s policy that, at origination, all loans are secured by collateral of at least 102% of the value of U.S. securities loaned and 105% of the value of foreign securities loaned. Collateral equivalent to at least 100% of the market value of securities on loan is maintained at all times. Collateral is either in the form of cash, which can be invested in certain money market mutual funds managed by the Adviser, or U.S. Government and Agency securities. Any non-cash collateral received cannot be sold or re-pledged by the fund, except in the event of borrower default. The securities on loan, if any, are also disclosed in the fund’s Statement of Investments. The fund is entitled to receive all dividends, interest and distributions on securities loaned, in addition to income earned as a result of the lending transaction. Should a borrower fail to return the securities in a timely manner, BNY Mellon is required to replace the securities for the benefit of the fund or credit the fund with the market value of the unreturned securities and is subrogated to the fund’s rights against the borrower and the collateral. Additionally, the contractual maturity of security lending transactions are on an overnight and continuous basis. During the period ended November 30, 2023, BNY Mellon earned $214 from the lending of the fund’s portfolio securities, pursuant to the securities lending agreement.
For financial reporting purposes, the fund elects not to offset assets and liabilities subject to a securities lending agreement, if any, in the Statement of Assets and Liabilities. Therefore, all qualifying transactions are
25
NOTES TO FINANCIAL STATEMENTS (continued)
presented on a gross basis in the Statement of Assets and Liabilities. As of November 30, 2023, the fund had no securities on loan.
(d) Affiliated issuers: Investments in other investment companies advised by the Adviser are considered “affiliated” under the Act.
(e) Market Risk: The value of the securities in which the fund invests may be affected by political, regulatory, economic and social developments, and developments that impact specific economic sectors, industries or segments of the market. In addition, turbulence in financial markets and reduced liquidity in equity, credit and/or fixed-income markets may negatively affect many issuers, which could adversely affect the fund. Global economies and financial markets are becoming increasingly interconnected, and conditions and events in one country, region or financial market may adversely impact issuers in a different country, region or financial market. These risks may be magnified if certain events or developments adversely interrupt the global supply chain; in these and other circumstances, such risks might affect companies world-wide.
Foreign Investment Risk: To the extent the fund invests in foreign securities, the fund’s performance will be influenced by political, social and economic factors affecting investments in foreign issuers. Special risks associated with investments in foreign issuers include exposure to currency fluctuations, less liquidity, less developed or less efficient trading markets, lack of comprehensive company information, political and economic instability and differing auditing and legal standards. To the extent the fund’s investments are focused in a limited number of foreign countries, the fund’s performance could be more volatile than that of more geographically diversified funds.
(f) Dividends and distributions to shareholders: Dividends and distributions are recorded on the ex-dividend date. Dividends from net investment income and dividends from net realized capital gains, if any, are normally declared and paid annually, but the fund may make distributions on a more frequent basis to comply with the distribution requirements of the Internal Revenue Code of 1986, as amended (the “Code”). To the extent that net realized capital gains can be offset by capital loss carryovers, it is the policy of the fund not to distribute such gains. Income and capital gain distributions are determined in accordance with income tax regulations, which may differ from GAAP.
(g) Federal income taxes: It is the policy of the fund to continue to qualify as a regulated investment company, if such qualification is in the best interests of its shareholders, by complying with the applicable provisions of the Code, and to make distributions of taxable income and
26
net realized capital gain sufficient to relieve it from substantially all federal income and excise taxes.
As of and during the period ended November 30, 2023, the fund did not have any liabilities for any uncertain tax positions. The fund recognizes interest and penalties, if any, related to uncertain tax positions as income tax expense in the Statement of Operations. During the period ended November 30, 2023, the fund did not incur any interest or penalties.
Each tax year in the four-year period ended November 30, 2023 remains subject to examination by the Internal Revenue Service and state taxing authorities.
At November 30, 2023, the components of accumulated earnings on a tax basis were as follows: undistributed ordinary income $49,566,579, undistributed capital gains $76,208,675 and unrealized appreciation $1,922,618,222.
The tax character of distributions paid to shareholders during the fiscal years ended November 30, 2023 and November 30, 2022 were as follows: ordinary income $49,508,337 and $38,686,760, and long-term capital gains $79,181,000 and $24,324,374, respectively.
NOTE 2—Bank Lines of Credit:
The fund participates with other long-term open-end funds managed by the Adviser in a $738 million unsecured credit facility led by Citibank, N.A. (the “Citibank Credit Facility”) and a $300 million unsecured credit facility provided by BNY Mellon (the “BNYM Credit Facility”), each to be utilized primarily for temporary or emergency purposes, including the financing of redemptions (each, a “Facility”). The Citibank Credit Facility is available in two tranches: (i) Tranche A is in an amount equal to $618 million and is available to all long-term open-ended funds, including the fund, and (ii) Tranche B is an amount equal to $120 million and is available only to BNY Mellon Floating Rate Income Fund, a series of BNY Mellon Investment Funds IV, Inc. Prior to September 27, 2023, the Citibank Credit Facility was $823.5 million with Tranche A available in an amount equal to $688.5 million and Tranche B available in an amount equal to $135 million. In connection therewith, the fund has agreed to pay its pro rata portion of commitment fees for Tranche A of the Citibank Credit Facility and the BNYM Credit Facility. Interest is charged to the fund based on rates determined pursuant to the terms of the respective Facility at the time of borrowing.
During the period ended November 30, 2023, the fund was charged $7,053 for interest expense. These fees are included in Interest expense in the
27
NOTES TO FINANCIAL STATEMENTS (continued)
Statement of Operations. The average amount of borrowings outstanding under the Facilities during the period ended November 30, 2023 was approximately $136,986 with a related weighted average annualized interest rate of 5.15%.
NOTE 3—Management Fee, Sub-Advisory Fee and Other Transactions with Affiliates:
(a) Pursuant to a management agreement with the Adviser, the management fee is computed at the annual rate of .85% of the value of the fund’s average daily net assets and is payable monthly.
Pursuant to a sub-investment advisory agreement between the Adviser and the Sub-Adviser, the Adviser pays the Sub-Adviser a monthly fee at an annual rate of .41% of the value of the fund’s average daily net assets.
During the period ended November 30, 2023, the Distributor retained $4,647 from commissions earned on sales of the fund’s Class A shares and $1,295 from CDSC fees on redemptions of the fund’s Class C shares.
(b) Under the Distribution Plan adopted pursuant to Rule 12b-1 under the Act, Class C shares pay the Distributor for distributing its shares at an annual rate of .75% of the value of its average daily net assets. The Distributor may pay one or more Service Agents in respect of advertising, marketing and other distribution services, and determines the amounts, if any, to be paid to Service Agents and the basis on which such payments are made. During the period ended November 30, 2023, Class C shares were charged $59,980 pursuant to the Distribution Plan.
(c) Under the Shareholder Services Plan, Class A and Class C shares pay the Distributor at an annual rate of .25% of the value of their average daily net assets for the provision of certain services. The services provided may include personal services relating to shareholder accounts, such as answering shareholder inquiries regarding the fund, and services related to the maintenance of shareholder accounts. The Distributor may make payments to Service Agents (securities dealers, financial institutions or other industry professionals) with respect to these services. The Distributor determines the amounts to be paid to Service Agents. During the period ended November 30, 2023, Class A and Class C shares were charged $139,676 and $19,993, respectively, pursuant to the Shareholder Services Plan.
The fund has an arrangement with BNY Mellon Transfer, Inc., (the “Transfer Agent”), a subsidiary of BNY Mellon and an affiliate of the Adviser, whereby the fund may receive earnings credits when positive cash balances are maintained, which are used to offset Transfer Agent fees. For
28
financial reporting purposes, the fund includes transfer agent net earnings credits, if any, as an expense offset in the Statement of Operations.
The fund has an arrangement with The Bank of New York Mellon (the “Custodian”), a subsidiary of BNY Mellon and an affiliate of the Adviser, whereby the fund will receive interest income or be charged overdraft fees when cash balances are maintained. For financial reporting purposes, the fund includes this interest income and overdraft fees, if any, as interest income in the Statement of Operations.
The fund compensates the Transfer Agent, under a transfer agency agreement, for providing transfer agency and cash management services for the fund. The majority of Transfer Agent fees are comprised of amounts paid on a per account basis, while cash management fees are related to fund subscriptions and redemptions. During the period ended November 30, 2023, the fund was charged $41,813 for transfer agency services. These fees are included in Shareholder servicing costs in the Statement of Operations. These fees were partially offset by earnings credits of $19,735.
The fund compensates the Custodian, under a custody agreement, for providing custodial services for the fund. These fees are determined based on net assets, geographic region and transaction activity. During the period ended November 30, 2023, the fund was charged $604,721 pursuant to the custody agreement.
During the period ended November 30, 2023, the fund was charged $20,809 for services performed by the fund’s Chief Compliance Officer and his staff. These fees are included in Chief Compliance Officer fees in the Statement of Operations.
The components of “Due to BNY Mellon Investment Adviser, Inc. and affiliates” in the Statement of Assets and Liabilities consist of: management fee of $3,894,755, Distribution Plan fees of $4,988, Shareholder Services Plan fees of $12,350, Custodian fees of $356,205, Chief Compliance Officer fees of $3,471 and Transfer Agent fees of $7,068.
(d) Each board member also serves as a board member of other funds in the BNY Mellon Family of Funds complex. Annual retainer fees and attendance fees are allocated to each fund based on net assets.
NOTE 4—Securities Transactions:
The aggregate amount of purchases and sales of investment securities, excluding short-term securities and forward foreign currency exchange contracts (“forward contracts”), during the period ended November 30, 2023, amounted to $399,667,727 and $577,561,572, respectively.
29
NOTES TO FINANCIAL STATEMENTS (continued)
Derivatives: A derivative is a financial instrument whose performance is derived from the performance of another asset. The fund enters into International Swaps and Derivatives Association, Inc. Master Agreements or similar agreements (collectively, “Master Agreements”) with its over-the-counter (“OTC”) derivative contract counterparties in order to, among other things, reduce its credit risk to counterparties. Master Agreements include provisions for general obligations, representations, collateral and events of default or termination. Under a Master Agreement, the fund may offset with the counterparty certain derivative financial instruments’ payables and/or receivables with collateral held and/or posted and create one single net payment in the event of default or termination. Rule 18f-4 under the Act regulates the use of derivatives transactions for certain funds registered under the Act. The fund is deemed a “limited” derivatives user under the rule and is required to limit its derivatives exposure so that the total notional value of applicable derivatives does not exceed 10% of fund’s net assets, and is subject to certain reporting requirements.
Each type of derivative instrument that was held by the fund during the period ended November 30, 2023 is discussed below.
Forward Foreign Currency Exchange Contracts: The fund enters into forward contracts in order to hedge its exposure to changes in foreign currency exchange rates on its foreign portfolio holdings, to settle foreign currency transactions or as a part of its investment strategy. When executing forward contracts, the fund is obligated to buy or sell a foreign currency at a specified rate on a certain date in the future. With respect to sales of forward contracts, the fund incurs a loss if the value of the contract increases between the date the forward contract is opened and the date the forward contract is closed. The fund realizes a gain if the value of the contract decreases between those dates. With respect to purchases of forward contracts, the fund incurs a loss if the value of the contract decreases between the date the forward contract is opened and the date the forward contract is closed. The fund realizes a gain if the value of the contract increases between those dates. Any realized or unrealized gains or losses which occurred during the period are reflected in the Statement of Operations. The fund is exposed to foreign currency risk as a result of changes in value of underlying financial instruments. The fund is also exposed to credit risk associated with counterparty non-performance on these forward contracts, which is generally limited to the unrealized gain on each open contract. This risk may be mitigated by Master Agreements, if any, between the fund and the counterparty and the posting of collateral, if any, by the counterparty to the fund to cover the fund’s exposure to the
30
counterparty. At November 30, 2023, there were no forward contracts outstanding.
|
| Average Market Value ($) |
$33,502
At November 30, 2023, the cost of investments for federal income tax purposes was $3,746,153,306; accordingly, accumulated net unrealized appreciation on investments was $1,922,313,247, consisting of $2,170,886,869 gross unrealized appreciation and $248,573,622 gross unrealized depreciation.
31
REPORT OF INDEPENDENT REGISTERED PUBLIC ACCOUNTING FIRM
To the Shareholders and the Board of Directors of BNY Mellon International Stock Fund
Opinion on the Financial Statements
We have audited the accompanying statement of assets and liabilities of BNY Mellon International Stock Fund (the “Fund”) (one of the funds constituting BNY Mellon Strategic Funds, Inc. (the “Company”)), including the statement of investments, as of November 30, 2023, and the related statement of operations for the year then ended, the statements of changes in net assets for each of the two years in the period then ended, the financial highlights for each of the five years in the period then ended and the related notes (collectively referred to as the “financial statements”). In our opinion, the financial statements present fairly, in all material respects, the financial position of the Fund (one of the funds constituting BNY Mellon Strategic Funds, Inc.) at November 30, 2023, the results of its operations for the year then ended, the changes in its net assets for each of the two years in the period then ended and its financial highlights for each of the five years in the period then ended, in conformity with U.S. generally accepted accounting principles.
Basis for Opinion
These financial statements are the responsibility of the Company’s management. Our responsibility is to express an opinion on the Fund’s financial statements based on our audits. We are a public accounting firm registered with the Public Company Accounting Oversight Board (United States) (“PCAOB”) and are required to be independent with respect to the Company in accordance with the U.S. federal securities laws and the applicable rules and regulations of the Securities and Exchange Commission and the PCAOB.
We conducted our audits in accordance with the standards of the PCAOB. Those standards require that we plan and perform the audit to obtain reasonable assurance about whether the financial statements are free of material misstatement, whether due to error or fraud. The Company is not required to have, nor were we engaged to perform, an audit of the Company’s internal control over financial reporting. As part of our audits, we are required to obtain an understanding of internal control over financial reporting but not for the purpose of expressing an opinion on the effectiveness of the Company’s internal control over financial reporting. Accordingly, we express no such opinion.
Our audits included performing procedures to assess the risks of material misstatement of the financial statements, whether due to error or fraud, and performing procedures that respond to those risks. Such procedures included examining, on a test basis, evidence regarding the amounts and disclosures in the financial statements. Our procedures included confirmation of securities owned as of November 30, 2023, by correspondence with the custodian, brokers and others; when replies were not received from brokers and others, we performed other auditing procedures. Our audits also included evaluating the accounting principles used and significant estimates made by management, as well as evaluating the overall presentation of the financial statements. We believe that our audits provide a reasonable basis for our opinion.

We have served as the auditor of one or more investment companies in the BNY Mellon Family of Funds since at least 1957, but we are unable to determine the specific year.
New York, New York
January 22, 2024
32
ADDITIONAL INFORMATION (Unaudited)
UPDATES TO SALES CHARGE REDUCTIONS AND WAIVERS AVAILABLE FROM CERTAIN FINANCIAL INTERMEDIARIES:
The availability of certain sales charge reductions and waivers will depend on whether you purchase fund shares directly from the fund or through a financial intermediary. Financial intermediaries may have different policies and procedures regarding the availability of front-end sales load reductions or waivers or CDSC waivers, which are described in the fund’s prospectus. In all instances, it is the investor’s responsibility to notify the fund or the investor’s financial intermediary at the time of purchase of any relationship or other facts qualifying the investor for sales charge reductions or waivers. For reductions or waivers not available through a particular financial intermediary, investors will have to purchase fund shares directly from the fund or through another financial intermediary to receive these reductions or waivers.
Edward Jones
Clients of Edward D. Jones & Co., L.P. (Edward Jones) purchasing fund shares on the Edward Jones commission and fee-based platforms are eligible only for the following sales charge reductions and waivers, which can differ from the sales charge reductions and waivers described elsewhere in the fund’s prospectus or the SAI or through another financial intermediary. In all instances, it is the shareholder’s responsibility to inform Edward Jones at the time of purchase of any relationship, holdings of BNY Mellon Family of Funds, or other facts qualifying the purchaser for sales charge reductions or waivers. Edward Jones can ask for documentation of such circumstance. Shareholders should contact Edward Jones if they have questions regarding their eligibility for these discounts and waivers.
Front-end sales charge reductions on Class A shares purchased on the Edward Jones commission and fee-based platforms
Shareholders purchasing Class A shares of the fund on the Edward Jones commission and fee-based platforms can reduce their initial sales charge in the following ways:
· Transaction size breakpoints, as described in the fund’s prospectus.
· Rights of accumulation (ROA), which entitle shareholders to breakpoint discounts as described in the fund’s prospectus, will be calculated based on the aggregated holdings of shares of funds in the BNY Mellon Family of Funds (except certain money market funds and any assets held in group retirement plans) held by the purchaser or in an account grouped by Edward Jones with other accounts for the purpose of providing certain pricing considerations (“pricing groups”) and, if grouping assets as a shareholder, includes all share classes of such funds held on the Edward Jones platform and/or held on another platform. Shares of funds in the BNY Mellon Family of Funds may be included in the ROA calculation only if the shareholder notifies Edward Jones about such shares. Money market funds are included only if such shares were sold with a sales charge at the time of purchase or
33
ADDITIONAL INFORMATION (Unaudited) (continued)
acquired in exchange for shares purchased with a sales charge. The employer maintaining a SEP IRA plan and/or SIMPLE IRA plan may elect to establish or change ROA for the IRA accounts associated with the plan to a plan-level grouping as opposed to including all share classes at a shareholder or pricing group level. For purposes of determining the value of a shareholder’s aggregated holdings, eligible shares held will be valued at the higher of their cost minus redemptions or current market value.
· Letter of intent (LOI), which allows for breakpoint discounts as described in the fund’s prospectus, based on anticipated purchases of shares of funds in the BNY Mellon Family of Funds purchased over a 13-month period from the date Edward Jones receives the LOI. Eligible shares purchased pursuant to a LOI will be valued at the higher of their cost or current market value for purposes of determining the front-end sales charge and any breakpoint discounts with respect to such share purchases. Each purchase a shareholder makes pursuant to a LOI during the 13-month period will receive the front-end sales charge and breakpoint discount that applies to the total amount indicated in the LOI. Shares of funds in the BNY Mellon Family of Funds may be included in the LOI calculation only if the shareholder notifies Edward Jones about such shares at the time of calculation. Shares purchased before the LOI is received by Edward Jones are not adjusted under the LOI and will not reduce the sales charge previously paid by the shareholder. The sales charge will be adjusted if the shareholder does not meet the goal indicated in the LOI. If the employer maintaining a SEP IRA plan and/or SIMPLE IRA plan has elected to establish or change ROA for the IRA accounts associated with the plan to a plan-level grouping, LOIs will also be at the plan-level and may only be established by the employer.
Front-end sales charge waivers on Class A shares purchased on the Edward Jones commission and fee-based platforms
Shareholders purchasing Class A shares of the fund on the Edward Jones commission and fee-based platforms may purchase Class A shares at NAV without payment of a sales charge as follows:
· shares purchased by associates of Edward Jones or its affiliates and their family members who are in the same pricing group (as determined by Edward Jones under its policies and procedures) as the associate. This waiver will continue for the remainder of the associate’s life if the associate retires from Edward Jones in good standing and remains in good standing pursuant to Edward Jones’ policies and procedures (Effective January 1, 2024, this waiver will be revised as follows: shares purchased by associates of Edward Jones and its affiliates and other accounts in the same pricing group (as determined by Edward Jones under its policies and procedures) as the associate. This waiver will continue for the remainder of the associate’s life if the associate retires from Edward Jones in good-standing and remains in good standing pursuant to Edward Jones’ policies and procedures)
· shares purchased in an Edward Jones fee-based program
34
· shares purchased through reinvestment of dividends and capital gains distributions of the fund
· shares purchased from the proceeds of redemptions of shares of a fund in the BNY Mellon Family of Funds, provided (1) the repurchase occurs within 60 days following the redemption, and (2) the redemption and purchase are made in the same share class and the same account or the purchase is made in an individual retirement account with proceeds from liquidations in a non-retirement account (i.e., Right of Reinstatement) (Effective January 1, 2024, this waiver will be revised as follows: shares purchased from the proceeds of redemptions of shares of a fund in the BNY Mellon Family of Funds, provided that (1) the repurchase occurs within 60 days following the redemption, and (2) the redemption and purchase are made in a share class that charges a front-end sales charge, subject to one of the following conditions being met:
o the redemption and repurchase occur in the same account
o the redemption proceeds are used to process an IRA contribution, excess contributions, conversion, recharacterizing of contributions, or distribution, and the repurchase is done in an account within the same Edward Jones grouping for ROA)
· shares exchanged into Class A shares from another share class so long as the exchange is into the same fund and was initiated at the discretion of Edward Jones. Edward Jones is responsible for any CDSC due, if applicable. Any future purchases are subject to the applicable sales charge as disclosed in the fund’s prospectus
· exchanges from Class C shares to Class A shares of the same fund, generally, in the 84th month following the anniversary of the purchase date or earlier at the discretion of Edward Jones
· Effective January 1, 2024: purchases of Class A shares for a 529 plan account through a rollover from either another education savings plan or a security used for qualified distributions
· Effective January 1, 2024: purchases of Class A shares for a 529 plan account made for recontribution of refunded amounts
CDSC waivers on Class A and C shares purchased on the Edward Jones commission and fee-based platforms
The fund’s CDSC on Class A and C shares may be waived for shares purchased on the Edward Jones commission and fee-based platforms in the following cases:
· redemptions made upon the death or disability of the shareholder
· redemptions made through a systematic withdrawal plan, if such redemptions do not exceed 10% of the value of the account annually
35
ADDITIONAL INFORMATION (Unaudited) (continued)
· redemptions made in connection with a return of excess contributions from an IRA account
· redemptions made as part of a required minimum distribution for IRA and retirement accounts if the redemption is taken in or after the year the shareholder reaches qualified age based on applicable IRS regulations
· redemptions made to pay Edward Jones fees or costs, but only if the redemption is initiated by Edward Jones
· shares exchanged in an Edward Jones fee-based program
· shares acquired through a Right of Reinstatement (as defined above)
· shares redeemed at the discretion of Edward Jones for accounts not meeting Edward Jones’ minimum balance requirements described below
Other important information for clients of Edward Jones who purchase fund shares on the Edward Jones commission and fee-based platforms
Minimum Purchase Amounts
· Initial purchase minimum: $250
· Subsequent purchase minimum: none
Minimum Balances
· Edward Jones has the right to redeem at its discretion fund holdings with a balance of $250 or less. The following are examples of accounts that are not included in this policy:
o A fee-based account held on an Edward Jones platform
o A 529 account held on an Edward Jones platform
o An account with an active systematic investment plan or LOI
Exchanging Share Classes
· At any time it deems necessary, Edward Jones has the authority to exchange at NAV a shareholder’s holdings in a fund to Class A shares of the same fund. Edward Jones is responsible for any CDSC due, if applicable. Any future purchases are subject to the applicable sales charge as disclosed in the fund’s prospectus.
Merrill
Purchases or sales of front-end (i.e., Class A) or level-load (i.e., Class C) mutual fund shares through a Merrill platform or account are eligible only for the following sales load waivers (front-end or CDSC) and discounts, which differ from those disclosed elsewhere in the fund’s prospectus. Purchasers will have to buy mutual fund shares
36
directly from the mutual fund company or through another intermediary to be eligible for waivers or discounts not listed below.
It is the client’s responsibility to notify Merrill at the time of purchase or sale of any relationship or other facts that qualify the transaction for a waiver or discount. A Merrill representative may ask for reasonable documentation of such facts and Merrill may condition the granting of a waiver or discount on the timely receipt of such documentation. Additional information on waivers or discounts is available in the Merrill Sales Load Waiver and Discounts Supplement (the “Merrill SLWD Supplement”) and in the Mutual Fund Investing at Merrill pamphlet at ml.com/funds. Clients are encouraged to review these documents and speak with their financial advisor to determine whether a transaction is eligible for a waiver or discount.
Front-end sales charge waivers on Class A shares purchased through Merrill
Shareholders purchasing Class A shares of the fund through a Merrill platform or account are eligible only for the following sales charge waivers, which may differ from those disclosed elsewhere in the fund’s prospectus or the SAI. Such shareholders may purchase Class A shares at NAV without payment of a sales charge as follows:
· shares of mutual funds available for purchase by employer-sponsored retirement, deferred compensation and employee benefit plans (including health savings accounts) and trusts used to fund those plans provided that the shares are not held in a commission-based brokerage account and shares are held for the benefit of the plan. For purposes of this provision, employer-sponsored retirement plans do not include SEP IRAs, Simple IRAs, SAR-SEPs or Keogh plans
· shares purchased through a Merrill investment advisory program
· brokerage class shares exchanged from advisory class shares due to the holdings moving from a Merrill investment advisory program to a Merrill brokerage account
· shares purchased through the Merrill Edge Self-Directed platform
· shares purchased through the systematic reinvestment of capital gains distributions and dividend reinvestment when purchasing shares of the same mutual fund in the same account
· shares exchanged from level-load shares to front-end load shares of the same mutual fund in accordance with the description in the Merrill SLWD Supplement
· shares purchased by eligible employees of Merrill or its affiliates and their family members who purchase shares in accounts within the employee’s Merrill Household (as defined in the Merrill SLWD Supplement)
37
ADDITIONAL INFORMATION (Unaudited) (continued)
· shares purchased by eligible persons associated with the fund as defined in the fund’s prospectus (e.g., the fund’s officers or trustees)
· shares purchased from the proceeds of a mutual fund redemption in front-end load shares, provided (1) the repurchase is in a mutual fund within the same fund family, (2) the repurchase occurs within 90 calendar days from the redemption trade date, and (3) the redemption and purchase occur in the same account (known as Rights of Reinstatement). Automated transactions (i.e., systematic purchases and withdrawals) and purchases made after shares are automatically sold to pay Merrill’s account maintenance fees are not eligible for Rights of Reinstatement
CDSC waivers on Class A and C shares purchased through Merrill
Fund shares purchased through a Merrill platform or account are eligible only for the following CDSC waivers, which may differ from those disclosed elsewhere in the fund’s prospectus or the SAI:
· shares sold due to the client’s death or disability (as defined by Internal Revenue Code Section 22(e)(3))
· shares sold pursuant to a systematic withdrawal program subject to Merrill’s maximum systematic withdrawal limits, as described in the Merrill SLWD Supplement
· shares sold due to return of excess contributions from an IRA account
· shares sold as part of a required minimum distribution for IRA and retirement accounts due to the investor reaching the qualified age based on applicable IRS regulation
· front-end or level-load shares held in commission-based, non-taxable retirement brokerage accounts (e.g., traditional, Roth, rollover, SEP IRAs, Simple IRAs, SAR-SEPs or Keogh plans) that are transferred to fee-based accounts or platforms and exchanged for a lower cost share class of the same mutual fund.
Front-end sales charge reductions on Class A shares purchased through Merrill
Shareholders purchasing Class A shares of the fund through a Merrill platform or account are eligible only for the following sales charge reductions (i.e., discounts), which may differ from those disclosed elsewhere in the fund’s prospectus or the SAI. Such shareholders can reduce their initial sales charge in the following ways:
· Breakpoint discounts, as described in the fund’s prospectus, where the sales load is at or below the maximum sales load that Merrill permits to be assessed to a front-end load purchase, as described in the Merrill SLWD Supplement.
38
· Rights of accumulation (ROA), as described in the Merrill SLWD Supplement, which entitle clients to breakpoint discounts based on the aggregated holdings of mutual fund family assets held in accounts in their Merrill Household.
· Letters of Intent (LOI), which allow for breakpoint discounts on eligible new purchases based on anticipated future eligible purchases within a fund family at Merrill, in accounts within your Merrill Household, as further described in the Merrill SLWD Supplement.
39
IMPORTANT TAX INFORMATION (Unaudited)
In accordance with federal tax law, the fund elects to provide each shareholder with their portion of the fund’s foreign taxes paid and the income sourced from foreign countries. Accordingly, the fund hereby reports the following information regarding its fiscal year ended November 30, 2023:
- the total amount of taxes paid to foreign countries was $12,293,507
- the total amount of income sourced from foreign countries was $108,612,700.
Where required by federal tax law rules, shareholders will receive notification of their proportionate share of foreign taxes paid and foreign sourced income for the 2023 calendar year with Form 1099-DIV which will be mailed in early 2024. For the fiscal year ended November 30, 2023, certain dividends paid by the fund may be subject to a maximum tax rate of 15%, as provided for by the Jobs and Growth Tax Relief Reconciliation Act of 2003. Of the distributions paid during the fiscal year, $61,801,844 represents the maximum amount that may be considered qualified dividend income. Also, the fund hereby reports $.3252 per share as a long-term capital gain distribution paid on December 13, 2022.
40
INFORMATION ABOUT THE RENEWAL OF THE FUND’S MANAGEMENT AND SUB-INVESTMENT ADVISORY AGREEMENTS (Unaudited)
At a meeting of the fund’s Board of Directors (the “Board”) held on October 30-31, 2023, the Board considered the renewal of the fund’s Management Agreement, pursuant to which the Adviser provides the fund with investment advisory and administrative services, and the Sub-Investment Advisory Agreement (together with the Management Agreement, the “Agreements”), pursuant to which Walter Scott & Partners Limited (the “Sub-Adviser”) provides day-to-day management of the fund’s investments. The Board members, none of whom are “interested persons” (as defined in the Investment Company Act of 1940, as amended) of the fund, were assisted in their review by independent legal counsel and met with counsel in executive session separate from representatives of the Adviser and the Sub-Adviser. In considering the renewal of the Agreements, the Board considered several factors that it believed to be relevant, including those discussed below. The Board did not identify any one factor as dispositive, and each Board member may have attributed different weights to the factors considered.
Analysis of Nature, Extent, and Quality of Services Provided to the Fund. The Board considered information provided to it at the meeting and in previous presentations from representatives of the Adviser regarding the nature, extent, and quality of the services provided to funds in the BNY Mellon fund complex, including the fund. The Adviser provided the number of open accounts in the fund, the fund’s asset size and the allocation of fund assets among distribution channels. The Adviser also had previously provided information regarding the diverse intermediary relationships and distribution channels of funds in the BNY Mellon fund complex (such as retail direct or intermediary, in which intermediaries typically are paid by the fund and/or the Adviser) and the Adviser’s corresponding need for broad, deep, and diverse resources to be able to provide ongoing shareholder services to each intermediary or distribution channel, as applicable to the fund.
The Board also considered research support available to, and portfolio management capabilities of, the fund’s portfolio management personnel and that the Adviser also provides oversight of day-to-day fund operations, including fund accounting and administration and assistance in meeting legal and regulatory requirements. The Board also considered the Adviser’s extensive administrative, accounting and compliance infrastructures, as well as the Adviser’s supervisory activities over the Sub-Adviser. The Board also considered portfolio management’s brokerage policies and practices (including that there are no soft dollar arrangements in place for the fund) and the standards applied in seeking best execution.
Comparative Analysis of the Fund’s Performance and Management Fee and Expense Ratio. The Board reviewed reports prepared by Broadridge Financial Solutions, Inc. (“Broadridge”), an independent provider of investment company data based on classifications provided by Thomson Reuters Lipper (“Lipper”), which included information comparing (1) the performance of the fund’s Class I shares with the performance of a group of institutional international large-cap growth funds selected by
41
INFORMATION ABOUT THE RENEWAL OF THE FUND’S MANAGEMENT AND SUB-INVESTMENT ADVISORY AGREEMENTS (Unaudited) (continued)
Broadridge as comparable to the fund (the “Performance Group”) and with a broader group of funds consisting of all retail and institutional international large-cap growth funds (the “Performance Universe”), all for various periods ended August 31, 2023, and (2) the fund’s actual and contractual management fees and total expenses with those of the same group of funds in the Performance Group (the “Expense Group”) and with a broader group of funds consisting of all institutional international large-cap growth funds, excluding outliers (the “Expense Universe”), the information for which was derived in part from fund financial statements available to Broadridge as of the date of its analysis. The Adviser previously had furnished the Board with a description of the methodology Broadridge used to select the Performance Group and Performance Universe and the Expense Group and Expense Universe.
Performance Comparisons. Representatives of the Adviser stated that the usefulness of performance comparisons may be affected by a number of factors, including different investment limitations and policies that may be applicable to the fund and comparison funds and the end date selected. The Board also considered the fund’s performance in light of overall financial market conditions. The Board discussed with representatives of the Adviser and the Sub-Adviser the results of the comparisons and considered that the fund’s total return performance was above the Performance Group and Performance Universe medians for all periods. The Adviser also provided a comparison of the fund’s calendar year total returns to the returns of the fund’s benchmark index, and it was noted that the fund’s returns were above the returns of the index in seven of the ten calendar years shown. The Board noted that the fund had a four-star overall rating from Morningstar and a four-star rating for each of the five- and ten-year periods from Morningstar based on Morningstar’s risk-adjusted return measure.
Management Fee and Expense Ratio Comparisons. The Board reviewed and considered the contractual management fee rate payable by the fund to the Adviser in light of the nature, extent and quality of the management services and the sub-advisory services provided by the Adviser and the Sub-Adviser, respectively. In addition, the Board reviewed and considered the actual management fee rate paid by the fund over the fund’s last fiscal year. The Board also reviewed the range of actual and contractual management fees and total expenses as a percentage of average net assets of the Expense Group and Expense Universe funds and discussed the results of the comparisons.
The Board considered that the fund’s contractual management fee was higher than the Expense Group median contractual management fee, the fund’s actual management fee was higher than the Expense Group median and higher than the Expense Universe median actual management fee, and the fund’s total expenses were higher than the Expense Group median and higher than the Expense Universe median total expenses.
Representatives of the Adviser reviewed with the Board the management or investment advisory fees paid to the Adviser or the Sub-Adviser or its affiliates for advising any separate accounts and/or other types of client portfolios that are considered to have similar investment strategies and policies as the fund (the “Similar Clients”), and explained the nature of the Similar Clients. They discussed differences in fees paid and
42
the relationship of the fees paid in light of any differences in the services provided and other relevant factors. The Board considered the relevance of the fee information provided for the Similar Clients to evaluate the appropriateness of the fund’s management fee. Representatives of the Adviser noted that there were no other funds advised by the Adviser that are in the same Lipper category as the fund.
The Board considered the fee payable to the Sub-Adviser in relation to the fee payable to the Adviser by the fund and the respective services provided by the Sub-Adviser and the Adviser. The Board also took into consideration that the Sub-Adviser’s fee is paid by the Adviser, out of its fee from the fund, and not the fund.
Analysis of Profitability and Economies of Scale. Representatives of the Adviser reviewed the expenses allocated and profit received by the Adviser and its affiliates and the resulting profitability percentage for managing the fund and the aggregate profitability percentage to the Adviser and its affiliates for managing the funds in the BNY Mellon fund complex, and the method used to determine the expenses and profit. The Board concluded that the profitability results were not excessive, given the services rendered and service levels provided by the Adviser and its affiliates. The Board also had been provided with information prepared by an independent consulting firm regarding the Adviser’s approach to allocating costs to, and determining the profitability of, individual funds and the entire BNY Mellon fund complex. The consulting firm also had analyzed where any economies of scale might emerge in connection with the management of a fund.
The Board considered, on the advice of its counsel, the profitability analysis (1) as part of its evaluation of whether the fees under the Agreements, considered in relation to the mix of services provided by the Adviser and the Sub-Adviser, including the nature, extent and quality of such services, supported the renewal of the Agreements and (2) in light of the relevant circumstances for the fund and the extent to which economies of scale would be realized if the fund grows and whether fee levels reflect these economies of scale for the benefit of fund shareholders. Representatives of the Adviser stated that, as a result of shared and allocated costs among funds in the BNY Mellon fund complex, the extent of economies of scale could depend substantially on the level of assets in the complex as a whole, so that increases and decreases in complex-wide assets can affect potential economies of scale in a manner that is disproportionate to, or even in the opposite direction from, changes in the fund’s asset level. The Board also considered potential benefits to the Adviser and the Sub-Adviser from acting as investment adviser and sub-investment adviser, respectively, and took into consideration that there were no soft dollar arrangements in effect for trading the fund’s investments.
At the conclusion of these discussions, the Board agreed that it had been furnished with sufficient information to make an informed business decision with respect to the renewal of the Agreements. Based on the discussions and considerations as described above, the Board concluded and determined as follows.
· The Board concluded that the nature, extent and quality of the services provided by the Adviser and the Sub-Adviser are adequate and appropriate.
43
INFORMATION ABOUT THE RENEWAL OF THE FUND’S MANAGEMENT AND SUB-INVESTMENT ADVISORY AGREEMENTS (Unaudited) (continued)
· The Board was satisfied with the fund’s overall performance.
· The Board concluded that the fees paid to the Adviser and the Sub-Adviser continued to be appropriate under the circumstances and in light of the factors and the totality of the services provided as discussed above.
· The Board determined that the economies of scale which may accrue to the Adviser and its affiliates in connection with the management of the fund had been adequately considered by the Adviser in connection with the fee rate charged to the fund pursuant to the Management Agreement and that, to the extent in the future it were determined that material economies of scale had not been shared with the fund, the Board would seek to have those economies of scale shared with the fund.
In evaluating the Agreements, the Board considered these conclusions and determinations and also relied on its previous knowledge, gained through meetings and other interactions with the Adviser and its affiliates and the Sub-Adviser, of the Adviser and the Sub-Adviser and the services provided to the fund by the Adviser and the Sub-Adviser. The Board also relied on information received on a routine and regular basis throughout the year relating to the operations of the fund and the investment management and other services provided under the Agreements, including information on the investment performance of the fund in comparison to similar mutual funds and benchmark performance indices; general market outlook as applicable to the fund; and compliance reports. In addition, the Board’s consideration of the contractual fee arrangements for the fund had the benefit of a number of years of reviews of the Agreements for the fund, or substantially similar agreements for other BNY Mellon funds that the Board oversees, during which lengthy discussions took place between the Board and representatives of the Adviser. Certain aspects of the arrangements may receive greater scrutiny in some years than in others, and the Board’s conclusions may be based, in part, on its consideration of the fund’s arrangements, or substantially similar arrangements for other BNY Mellon funds that the Board oversees, in prior years. The Board determined to renew the Agreements.
44
BOARD MEMBERS INFORMATION (Unaudited)
Independent Board Members
Joseph S. DiMartino (80)
Chairman of the Board (1995)
Principal Occupation During Past 5 Years:
· Director or Trustee of funds in the BNY Mellon Family of Funds and certain other entities (as described in the fund’s Statement of Additional Information) (1995-Present)
Other Public Company Board Memberships During Past 5 Years:
· CBIZ, Inc., a public company providing professional business services, products and solutions, Director (1997-May 2023)
No. of Portfolios for which Board Member Serves: 86
———————
Joni Evans (81)
Board Member (2006)
Principal Occupation During Past 5 Years:
· www.PureWow.com, an online community dedicated to women’s conversations and publications, Chief Executive Officer (2007-2019)
· Joni Evans Ltd. publishing, Principal (2006-2019)
No. of Portfolios for which Board Member Serves: 17
———————
Joan Gulley (76)
Board Member (2017)
Principal Occupation During Past 5 Years:
· Nantucket Atheneum, public library, Chair (June 2018-June 2021) and Director (2015-June 2021)
· Orchard Island Club, golf and beach club, Governor (2016-Present) and President (February 2023-Present)
No. of Portfolios for which Board Member Serves: 39
———————
45
BOARD MEMBERS INFORMATION (Unaudited) (continued)
Alan H. Howard (64)
Board Member (2018)
Principal Occupation During Past 5 Years:
· Heathcote Advisors LLC, a financial advisory services firm, Managing Partner (2008-Present)
· Dynatech/MPX Holdings LLC, a global supplier and service provider of military aircraft parts, President (2012-May 2019); and Board Member of its two operating subsidiaries, Dynatech International LLC and Military Parts Exchange LLC (2012-December 2019), including Chief Executive Officer of an operating subsidiary, Dynatech International LLC (2013-May 2019)
· Rossoff & Co., an independent investment banking firm, Senior Advisor (2013-June 2021)
Other Public Company Board Memberships During Past 5 Years:
· Movado Group, Inc., a public company that designs, sources, markets and distributes watches, Director (1997-Present)
· Diamond Offshore Drilling, Inc., a public company that provides contract drilling services, Director (March 2020-April 2021)
No. of Portfolios for which Board Member Serves: 17
———————
Robin A. Melvin (60)
Board Member (1995)
Principal Occupation During Past 5 Years:
· Westover School, a private girls’ boarding school in Middlebury, Connecticut, Trustee (2019-June 2023)
· Mentor Illinois, a non-profit organization dedicated to increasing the quantity and quality of mentoring services in Illinois. Co-Chair (2014–March 2020); Board Member (2013-March 2020)
· JDRF, a non-profit juvenile diabetes research foundation, Board Member (June 2021-June 2022)
Other Public Company Board Memberships During Past 5 Years:
· HPS Corporate Lending Fund, a closed-end management investment company regulated as a business development company, Trustee (August 2021-Present)
No. of Portfolios for which Board Member Serves: 68
———————
Burton N. Wallack (73)
Board Member (2006)
Principal Occupation During Past 5 Years:
Wallack Management Company, a real estate management company, President and Co-owner (1987-Present)
Other Public Company Board Memberships During Past 5 Years:
Mount Sinai Hospital Urology, Board Member (2017-Present)
No. of Portfolios for which Board Member Serves: 17
———————
46
Benaree Pratt Wiley (77)
Board Member (2016)
Principal Occupation During Past 5 Years:
· The Wiley Group, a firm specializing in strategy and business development. Principal (2005-Present)
Other Public Company Board Memberships During Past 5 Years:
· CBIZ, Inc., a public company providing professional business services, products and solutions, Director (2008-Present)
· Blue Cross-Blue Shield of Massachusetts, Director (2004-December 2020)
No. of Portfolios for which Board Member Serves: 57
———————
Gordon J. Davis (81)
Advisory Board Member (2021)
Principal Occupation During Past 5 Years:
· Venable LLP, a law firm, Partner (2012-Present)
Other Public Company Board Memberships During Past 5 Years:
· BNY Mellon Family of Funds (53 funds), Board Member (1995-August 2021)
No. of Portfolios for which Advisory Board Member Serves: 39
———————
The address of the Board Members and Officers is c/o BNY Mellon Investment Adviser, Inc., 240 Greenwich Street, New York, New York 10286. Additional information about each Board Member is available in the fund’s Statement of Additional Information which can be obtained from the Adviser free of charge by calling this toll free number: 1-800-373-9387.
47
OFFICERS OF THE FUND (Unaudited)
DAVID DIPETRILLO, President since January 2021.
Vice President and Director of the Adviser since February 2021; Head of North America Distribution, BNY Mellon Investment Management since February 2023; and Head of North America Product, BNY Mellon Investment Management from January 2018 to February 2023. He is an officer of 53 investment companies (comprised of 102 portfolios) managed by the Adviser or an affiliate of the Adviser. He is 45 years old and has been an employee of BNY Mellon since 2005.
JAMES WINDELS, Treasurer since November 2001.
Director of the Adviser since February 2023; Vice President of the Adviser since September 2020; and Director–BNY Mellon Fund Administration. He is an officer of 54 investment companies (comprised of 121 portfolios) managed by the Adviser or an affiliate of the Adviser. He is 65 years old and has been an employee of the Adviser since April 1985.
PETER M. SULLIVAN, Chief Legal Officer since July 2021 and Vice President and Assistant Secretary since March 2019.
Chief Legal Officer of the Adviser and Associate General Counsel of BNY Mellon since July 2021; Senior Managing Counsel of BNY Mellon from December 2020 to July 2021; and Managing Counsel of BNY Mellon from March 2009 to December 2020. He is an officer of 54 investment companies (comprised of 121 portfolios) managed by the Adviser or an affiliate of the Adviser. He is 55 years old and has been an employee of BNY Mellon since April 2004.
JAMES BITETTO, Vice President since August 2005 and Secretary since February 2018.
Senior Managing Counsel of BNY Mellon since December 2019; Managing Counsel of BNY Mellon from April 2014 to December 2019; and Secretary of the Adviser. He is an officer of 54 investment companies (comprised of 121 portfolios) managed by the Adviser or an affiliate of the Adviser. He is 57 years old and has been an employee of the Adviser since December 1996.
DEIRDRE CUNNANE, Vice President and Assistant Secretary since March 2019.
Managing Counsel of BNY Mellon since December 2021; and Counsel of BNY Mellon from August 2018 to December 2021. She is an officer of 54 investment companies (comprised of 121 portfolios) managed by the Adviser or an affiliate of the Adviser. She is 33 years old and has been an employee of BNY Mellon since August 2013.
SARAH S. KELLEHER, Vice President and Assistant Secretary since April 2014.
Vice President of BNY Mellon ETF Investment Adviser; LLC since February 2020; Senior Managing Counsel of BNY Mellon since September 2021; and Managing Counsel of BNY Mellon from December 2017 to September 2021. She is an officer of 54 investment companies (comprised of 121 portfolios) managed by the Adviser or an affiliate of the Adviser. She is 48 years old and has been an employee of BNY Mellon since March 2013.
JEFF PRUSNOFSKY, Vice President and Assistant Secretary since August 2005.
Senior Managing Counsel of BNY Mellon. He is an officer of 54 investment companies (comprised of 121 portfolios) managed by the Adviser or an affiliate of the Adviser. He is 58 years old and has been an employee of the Adviser since October 1990.
AMANDA QUINN, Vice President and Assistant Secretary since March 2020.
Counsel of BNY Mellon since June 2019; and Regulatory Administration Manager at BNY Mellon Investment Management Services from September 2018 to May 2019. She is an officer of 54 investment companies (comprised of 121 portfolios) managed by the Adviser or an affiliate of the Adviser. She is 38 years old and has been an employee of BNY Mellon since June 2012.
JOANNE SKERRETT, Vice President and Assistant Secretary since March 2023.
Managing Counsel of BNY Mellon since June 2022; and Senior Counsel with the Mutual Fund Directors Forum, a leading funds industry organization, from 2016 to June 2022. She is an officer of 54 investment companies (comprised of 121 portfolios) managed by the Adviser or an affiliate of the Adviser. She is 51 years old and has been an employee of the Adviser since June 2022.
48
NATALYA ZELENSKY, Vice President and Assistant Secretary since March 2017.
Chief Compliance Officer since August 2021 and Vice President since February 2020 of BNY Mellon ETF Investment Adviser, LLC; Chief Compliance Officer since August 2021 and Vice President and Assistant Secretary since February 2020 of BNY Mellon ETF Trust; Managing Counsel of BNY Mellon from December 2019 to August 2021; Counsel of BNY Mellon from May 2016 to December 2019; and Assistant Secretary of the Adviser from April 2018 to August 2021. She is an officer of 54 investment companies (comprised of 121 portfolios) managed by the Adviser or an affiliate of the Adviser. She is 38 years old and has been an employee of BNY Mellon since May 2016.
DANIEL GOLDSTEIN, Vice President since March 2022.
Head of Product Development of North America Distribution, BNY Mellon Investment Management since January 2018; Executive Vice President of North America Product, BNY Mellon Investment Management since April 2023; and Senior Vice President, Development & Oversight of North America Product, BNY Mellon Investment Management from 2010 to March 2023. He is an officer of 53 investment companies (comprised of 102 portfolios) managed by the Adviser or an affiliate of the Adviser. He is 54 years old and has been an employee of the Distributor since 1991.
JOSEPH MARTELLA, Vice President since March 2022.
Vice President of the Adviser since December 2022; Head of Product Management of North America Distribution, BNY Mellon Investment Management since January 2018; Executive Vice President of North America Product, BNY Mellon Investment Management since April 2023; and Senior Vice President of North America Product, BNY Mellon Investment Management from 2010 to March 2023. He is an officer of 53 investment companies (comprised of 102 portfolios) managed by the Adviser or an affiliate of the Adviser. He is 47 years old and has been an employee of the Distributor since 1999.
GAVIN C. REILLY, Assistant Treasurer since December 2005.
Tax Manager–BNY Mellon Fund Administration. He is an officer of 54 investment companies (comprised of 121 portfolios) managed by the Adviser or an affiliate of the Adviser. He is 55 years old and has been an employee of the Adviser since April 1991.
ROBERT SALVIOLO, Assistant Treasurer since July 2007.
Senior Accounting Manager–BNY Mellon Fund Administration. He is an officer of 54 investment companies (comprised of 121 portfolios) managed by the Adviser or an affiliate of the Adviser. He is 56 years old and has been an employee of the Adviser since June 1989.
ROBERT SVAGNA, Assistant Treasurer since December 2002.
Senior Accounting Manager–BNY Mellon Fund Administration. He is an officer of 54 investment companies (comprised of 121 portfolios) managed by the Adviser or an affiliate of the Adviser. He is 56 years old and has been an employee of the Adviser since November 1990.
JOSEPH W. CONNOLLY, Chief Compliance Officer since October 2004.
Chief Compliance Officer of the BNY Mellon Family of Funds and BNY Mellon Funds Trust since 2004; and Chief Compliance Officer of the Adviser from 2004 until June 2021. He is the Chief Compliance Officer of 53 investment companies (comprised of 105 portfolios) managed by the Adviser. He is 66 years old.
CARIDAD M. CAROSELLA, Anti-Money Laundering Compliance Officer since January 2016.
Anti-Money Laundering Compliance Officer of the BNY Mellon Family of Funds and BNY Mellon Funds Trust. She is an officer of 47 investment companies (comprised of 114 portfolios) managed by the Adviser or an affiliate of the Adviser. She is 55 years old and has been an employee of the Distributor since 1997.
49
BNY Mellon International Stock Fund
240 Greenwich Street
New York, NY 10286
Adviser
BNY Mellon Investment Adviser, Inc.
240 Greenwich Street
New York, NY 10286
Sub-Adviser
Walter Scott & Partners Limited
One Charlotte Square
Edinburgh, Scotland, UK
Custodian
The Bank of New York Mellon
240 Greenwich Street
New York, NY 10286
Transfer Agent &
Dividend Disbursing Agent
BNY Mellon Transfer, Inc.
240 Greenwich Street
New York, NY 10286
Distributor
BNY Mellon Securities Corporation
240 Greenwich Street
New York, NY 10286
Ticker Symbols: | Class A: DISAX Class C: DISCX Class I: DISRX Class Y: DISYX |
Telephone Call your financial representative or 1-800-373-9387
Mail The BNY Mellon Family of Funds, 144 Glenn Curtiss Boulevard, Uniondale, NY 11556-0144
E-mail Send your request to info@bnymellon.com
Internet Information can be viewed online or downloaded at www.im.bnymellon.com
The fund files its complete schedule of portfolio holdings with the Securities and Exchange Commission (“SEC”) for the first and third quarters of each fiscal year on Form N-PORT. The fund’s Forms N-PORT are available on the SEC’s website at www.sec.gov.
A description of the policies and procedures that the fund uses to determine how to vote proxies relating to portfolio securities and information regarding how the fund voted these proxies for the most recent 12-month period ended June 30 is available at www.im.bnymellon.com and on the SEC’s website at www.sec.gov and without charge, upon request, by calling 1-800-373-9387.
© 2024 BNY Mellon Securities Corporation |
|

BNY Mellon Select Managers Small Cap Value Fund
ANNUAL REPORT November 30, 2023 |
|

IMPORTANT NOTICE – UPCOMING CHANGES TO ANNUAL AND SEMI-ANNUAL REPORTS
The Securities and Exchange Commission (the “SEC”) has adopted rule and form amendments that will result in changes to the design and delivery of annual and semi-annual fund reports (“Reports”). Beginning in July 2024, Reports will be streamlined to highlight key information. Certain information currently included in Reports, including financial statements, will no longer appear in the Reports but will be available online, delivered free of charge to shareholders upon request, and filed with the SEC.
If you previously elected to receive the fund’s Reports electronically, you will continue to do so. Otherwise, you will receive paper copies of the fund’s re-designed Reports by USPS mail in the future. If you would like to receive the fund’s Reports (and/or other communications) electronically instead of by mail, please contact your financial advisor or, if you are a direct investor, please log into your mutual fund account at www.bnymellonim.com/us and select “E-Delivery” under the Profile page. You must be registered for online account access before you can enroll in E-Delivery.
Save time. Save paper. View your next shareholder report online as soon as it’s available. Log into www.im.bnymellon.com and sign up for eCommunications. It’s simple and only takes a few minutes. |
The views expressed in this report reflect those of the portfolio manager(s) only through the end of the period covered and do not necessarily represent the views of BNY Mellon Investment Adviser, Inc. or any other person in the BNY Mellon Investment Adviser, Inc. organization. Any such views are subject to change at any time based upon market or other conditions and BNY Mellon Investment Adviser, Inc. disclaims any responsibility to update such views. These views may not be relied on as investment advice and, because investment decisions for a fund in the BNY Mellon Family of Funds are based on numerous factors, may not be relied on as an indication of trading intent on behalf of any fund in the BNY Mellon Family of Funds. |
Not FDIC-Insured • Not Bank-Guaranteed • May Lose Value |
Contents
THE FUND
Information About the Renewal | |
FOR MORE INFORMATION
Back Cover
DISCUSSION OF FUND PERFORMANCE (Unaudited)
For the period from December 1, 2022, through November 30, 2023, as provided by Portfolio Allocation Manager, Elena Goncharova.
Market and Fund Performance Overview
For the 12-month period ended November 30, 2023, BNY Mellon Select Managers Small Cap Value Fund’s (the “fund”) Class A, Class C, Class I and Class Y shares at NAV produced total returns of −1.52%, −2.22%, −1.22% and −1.22%, respectively.1 In comparison, the Russell 2000® Value Index (the “Index”), the fund’s benchmark, returned −4.73% for the same period.2
Small-cap value stocks lost ground over the reporting period even as large caps benefited from easing inflation and falling interest rates. The fund outperformed the Index as both asset allocation and stock selection decisions proved beneficial.
The Fund’s Investment Approach
The fund seeks capital appreciation. To pursue its goal, the fund normally invests at least 80% of its net assets in the stocks of small-cap companies. The fund currently considers small-cap companies to be those companies with market capitalizations that fall within the range of companies in the Index. The fund’s portfolio is constructed to have a value tilt.
The fund uses a “multi-manager” approach by selecting various sub-advisers to manage its assets. We may hire, terminate or replace sub-advisers and modify material terms and conditions of sub-advisory arrangements without shareholder approval.
The fund’s assets will be allocated among five sub-advisers— Channing Capital Management, LLC, Eastern Shore Capital Management, Neuberger Berman Investment Advisers LLC, Heartland Advisors, Inc. and Denali Advisors, LLC. As of November 30, 2023, the target percentage of the fund’s assets to be allocated over time to the sub-advisers is approximately 26% to Channing; 14% to Eastern Shore; 18% to Neuberger Berman; 17% to Heartland and 25% to Denali. In addition, BNY Mellon Investment Adviser, Inc., the fund’s investment adviser & portfolio allocation manager, is permitted to adjust those allocations by up to 20% of the fund’s assets without board approval. Subject to board approval, the fund may hire, terminate or replace sub-advisers and modify material terms and conditions of sub-advisory arrangements without shareholder approval.
Sentiment Improves, but Small Caps Lag
Investor sentiment improved during the period due to a variety of factors, including easing inflation, a slower pace of interest-rate increases and the U.S. government’s quick response to the regional banking crisis. The market was also supported early on by the launch of ChatGPT by Open AI and later by relatively strong economic growth.
But the primary beneficiaries of this support were large-cap companies, especially the “Magnificent Seven,” including Microsoft, Google, Apple and other mega-cap growth-oriented companies. Small-cap value stocks, in contrast, experienced significant volatility during the period and finished down for the 12 months ended November 30, 2023.
The banking crisis that emerged among U.S. regional banks in March 2023 resulted in some short-lived volatility. But actions by the Federal Deposit Insurance Corporation to secure
2
deposits and by the Fed to provide additional liquidity helped calm the situation, and markets generally recovered quickly.
With the banking crisis addressed, the Fed’s actions remained the dominant theme as it continued its tightening policies aimed at curbing inflation. The Fed’s rate hikes hindered markets at times, but as the period progressed, it reduced the size and pace of its rate increases. This provided the market with some support.
The possibility the economy could avoid recession provided some support as economic growth and employment remained stronger than expected. Despite declining steadily for months, inflation ticked up late in the period, and the Fed indicated that rates could remain “higher for longer.” This produced some volatility, but markets rebounded strongly in November, buoyed by strong corporate earnings, growing confidence that the Fed had achieved a “soft landing” and the belief that the end of rate hikes was approaching.
Asset Allocation and Stock Selection Aided Relative Returns
The fund’s returns versus the Index benefited from outperformance by four of the five underlying strategies, and both asset allocation and stock selection contributed positively. Regarding allocation, overweight positioning in the industrial sector and underweights in the utilities and financials sectors contributed positively to relative returns. As for stock selection, positions in the health care and industrial sectors were the primary contributors. In the industrial sector, the fund’s position in Powell Industries, Inc. which makes custom engineered electrical systems, was advantageous. The company has benefited from the nearshoring/onshoring trend. As for factor exposures, overweights in size and liquidity were both beneficial.
On the other hand, the fund’s stock selection in certain sectors was detrimental to performance. Selections in the energy sector were leading detractors, and in the consumer discretionary sector, a large out-of-benchmark position in Marriott Vacations Worldwide Corp. was a significant hindrance. The underperformance stemmed mainly from the disruption caused by several product rollouts/rebrands that the company underwent in 2023.
Interest Rates Have Probably Peaked
Our outlook on the small-cap market is positive. With inflation continuing to decline, it appears that the Fed has probably reached the end of its rate-hiking cycle, and, in fact, the Fed’s “dot plot” showing Fed governors’ forecasts of the federal funds rate indicates that two rate cuts are likely next year. If this scenario plays out, small-cap stocks are likely to benefit.
Some risks remain on the horizon, however. Rates remain high, and this affects financing for small caps more than for large caps. In addition, while consumer spending remains robust, high rates could begin to take a toll, which would also have a greater impact on small caps.
Nevertheless, small-cap stocks remain attractive, as they are undervalued relative to larger
3
DISCUSSION OF FUND PERFORMANCE (Unaudited) (continued)
caps. In addition, the fund remains favorably exposed to secular trends including onshoring/nearshoring and clean energy.
December 15, 2023
1 Total return includes reinvestment of dividends and any capital gains paid and does not take into consideration the maximum initial sales charge in the case of Class A shares, or the applicable contingent deferred sales charge imposed on redemptions in the case of Class C shares. Had these charges been reflected, returns would have been lower. Past performance is no guarantee of future results. Share price and investment return fluctuate such that upon redemption, fund shares may be worth more or less than their original cost. Return figures provided reflect the absorption of certain fund expenses by BNY Mellon Investment Adviser, Inc. pursuant to an undertaking in effect through March 31, 2024, at which time it may be extended, terminated or modified. Had these expenses not been absorbed, the fund’s returns would have been lower.
2 Source: Lipper Inc. — The Russell 2000® Value Index measures the performance of the small-cap value segment of the U.S. equity universe. It includes those Russell 2000 companies that are considered more value-oriented relative to the overall market as defined by Russell’s leading style methodology. The Russell 2000® Value Index is constructed to provide a comprehensive and unbiased barometer for the small-cap value segment. The Index is completely reconstituted annually to ensure larger stocks do not distort the performance and characteristics of the true small-cap opportunity set, and that the represented companies continue to reflect value characteristics. Investors cannot invest directly in any index.
Equities are subject generally to market, market sector, market liquidity, issuer and investment style risks, among other factors, to varying degrees, all of which are more fully described in the fund’s prospectus.
Multi-manager risk means each sub-adviser makes investment decisions independently, and it is possible that the investment styles of the sub advisers may not complement one another. Consequently, the fund’s exposure to given stock, industry or investment style could be greater or smaller than if the fund had a single adviser.
Investing in foreign denominated and/or domiciled securities involves special risks, including changes in currency exchange rates, political, economic and social instability, limited company information, differing auditing and legal standards, and less market liquidity. These risks are generally greater with emerging market countries.
The prices of small company stocks tend to be more volatile than the prices of large company stocks, mainly because these companies have less established and more volatile earnings histories. They also tend to be less liquid than larger company stocks.
References to specific securities, asset classes and financial markets are for illustrative purposes only and are not intended to be and should not be interpreted as recommendations.
4
FUND PERFORMANCE (Unaudited)
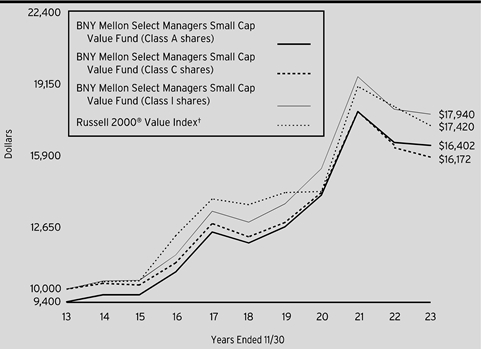
Comparison of change in value of a $10,000 investment in Class A shares, Class C shares and Class I shares of BNY Mellon Select Managers Small Cap Value Fund with a hypothetical investment of $10,000 in the Russell 2000® Value Index (the “Index”).
† Source: Lipper Inc.
Past performance is not predictive of future performance. The above graph compares a hypothetical $10,000 investment made in each of the Class A shares, Class C shares and Class I shares of BNY Mellon Select Managers Small Cap Value Fund on 11/30/13 to a hypothetical investment of $10,000 made in the Index on that date. All dividends and capital gain distributions are reinvested.
The fund’s performance shown in the line graph above takes into account the maximum initial sales charge on Class A shares and all other applicable fees and expenses on Class A shares, Class C shares and Class I shares. The Index measures the performance of the small-cap value segment of the U.S. equity universe. It includes those Russell 2000 companies that are considered more value-oriented relative to the overall market as defined by Russell’s leading style methodology. The Index is constructed to provide a comprehensive and unbiased barometer for the small-cap value segment. The Index is completely reconstituted annually to ensure larger stocks do not distort the performance and characteristics of the true small-cap opportunity set and that the represented companies continue to reflect value characteristics. Unlike a mutual fund, the Index is not subject to charges, fees and other expenses. Investors cannot invest directly in any index. Further information relating to fund performance, including expense reimbursements, if applicable, is contained in the Financial Highlights section of the prospectus and elsewhere in this report.
5
FUND PERFORMANCE (Unaudited) (continued)
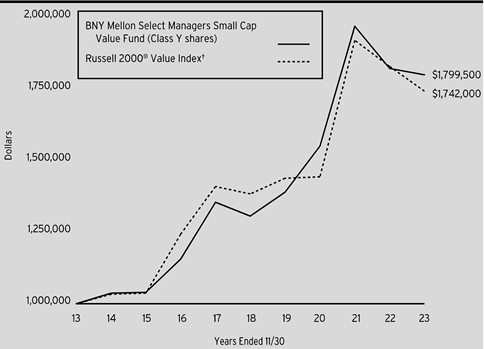
Comparison of change in value of a $1,000,000 investment in Class Y shares of BNY Mellon Select Managers Small Cap Value Fund with a hypothetical investment of $1,000,000 in the Russell 2000® Value Index (the “Index”).
† Source: Lipper Inc.
Past performance is not predictive of future performance. The above graph compares a hypothetical $1,000,000 investment made in Class Y shares of BNY Mellon Select Managers Small Cap Value Fund on 11/30/13 to a hypothetical investment of $1,000,000 made in the Index on that date. All dividends and capital gain distributions are reinvested.
The fund’s performance shown in the line graph above takes into account all other applicable fees and expenses of fund’s Class Y shares. The Index measures the performance of the small-cap value segment of the U.S. equity universe. It includes those Russell 2000 companies that are considered more value-oriented relative to the overall market as defined by Russell’s leading style methodology. The Index is constructed to provide a comprehensive and unbiased barometer for the small-cap value segment. The Index is completely reconstituted annually to ensure larger stocks do not distort the performance and characteristics of the true small-cap opportunity set and that the represented companies continue to reflect value characteristics. Unlike a mutual fund, the Index is not subject to charges, fees and other expenses. Investors cannot invest directly in any index. Further information relating to fund performance, including expense reimbursements, if applicable, is contained in the Financial Highlights section of the prospectus and elsewhere in this report.
6
Average Annual Total Returns as of 11/30/2023 | ||||
| 1 Year | 5 Years | 10 Years | |
Class A shares | ||||
with maximum sales charge (5.75%) | -7.17% | 5.03% | 5.07% | |
without sales charge | -1.52% | 6.28% | 5.70% | |
Class C shares | ||||
with applicable redemption charge† | -3.05% | 5.50% | 4.92% | |
without redemption | -2.22% | 5.50% | 4.92% | |
Class I shares | -1.22% | 6.59% | 6.02% | |
Class Y shares | -1.22% | 6.62% | 6.05% | |
Russell 2000® Value Index | -4.73% | 4.72% | 5.71% | |
† The maximum contingent deferred sales charge for Class C shares is 1% for shares redeemed within one year of the date of purchase.
The performance data quoted represents past performance, which is no guarantee of future results. Share price and investment return fluctuate and an investor’s shares may be worth more or less than original cost upon redemption. Current performance may be lower or higher than the performance quoted. Go to www.im.bnymellon.com for the fund’s most recent month-end returns.
The fund’s performance shown in the graphs and table does not reflect the deduction of taxes that a shareholder would pay on fund distributions or the redemption of fund shares. In addition to the performance of Class A shares shown with and without a maximum sales charge, the fund’s performance shown in the table takes into account all other applicable fees and expenses on all classes
7
UNDERSTANDING YOUR FUND’S EXPENSES (Unaudited)
As a mutual fund investor, you pay ongoing expenses, such as management fees and other expenses. Using the information below, you can estimate how these expenses affect your investment and compare them with the expenses of other funds. You also may pay one-time transaction expenses, including sales charges (loads) and redemption fees, which are not shown in this section and would have resulted in higher total expenses. For more information, see your fund’s prospectus or talk to your financial adviser.
Review your fund’s expenses
The table below shows the expenses you would have paid on a $1,000 investment in BNY Mellon Select Managers Small Cap Value Fund from June 1, 2023 to November 30, 2023. It also shows how much a $1,000 investment would be worth at the close of the period, assuming actual returns and expenses.
Expenses and Value of a $1,000 Investment |
| |||||
Assume actual returns for the six months ended November 30, 2023 |
| |||||
|
|
|
|
|
|
|
|
| Class A | Class C | Class I | Class Y |
|
Expenses paid per $1,000† | $6.71 | $10.57 | $5.43 | $5.43 |
| |
Ending value (after expenses) | $1,059.90 | $1,056.70 | $1,062.00 | $1,061.60 |
| |
COMPARING YOUR FUND’S EXPENSES WITH THOSE OF OTHER FUNDS (Unaudited)
Using the SEC’s method to compare expenses
The Securities and Exchange Commission (“SEC”) has established guidelines to help investors assess fund expenses. Per these guidelines, the table below shows your fund’s expenses based on a $1,000 investment, assuming a hypothetical 5% annualized return. You can use this information to compare the ongoing expenses (but not transaction expenses or total cost) of investing in the fund with those of other funds. All mutual fund shareholder reports will provide this information to help you make this comparison. Please note that you cannot use this information to estimate your actual ending account balance and expenses paid during the period.
Expenses and Value of a $1,000 Investment |
| |||||
Assuming a hypothetical 5% annualized return for the six months ended November 30, 2023 |
| |||||
|
|
|
|
|
|
|
|
| Class A | Class C | Class I | Class Y |
|
Expenses paid per $1,000† | $6.58 | $10.35 | $5.32 | $5.32 |
| |
Ending value (after expenses) | $1,018.55 | $1,014.79 | $1,019.80 | $1,019.80 |
| |
† | Expenses are equal to the fund’s annualized expense ratio of 1.30% for Class A, 2.05% for Class C, 1.05% for Class I and 1.05% for Class Y, multiplied by the average account value over the period, multiplied by 183/365 (to reflect the one-half year period). | |||||
8
STATEMENT OF INVESTMENTS
November 30, 2023
Description | Shares | Value ($) | |||||
Common Stocks - 97.6% | |||||||
Automobiles & Components - .1% | |||||||
Standard Motor Products, Inc. | 1,800 | 64,746 | |||||
Visteon Corp. | 1,490 | a | 176,818 | ||||
241,564 | |||||||
Banks - 9.3% | |||||||
1st Source Corp. | 12,900 | 623,457 | |||||
Banc of California, Inc. | 7,131 | 82,434 | |||||
BankUnited, Inc. | 3,725 | 102,773 | |||||
Cathay General Bancorp | 2,000 | 73,360 | |||||
Columbia Banking System, Inc. | 20,090 | 450,619 | |||||
ConnectOne Bancorp, Inc. | 4,000 | 78,640 | |||||
Customers Bancorp, Inc. | 16,300 | a | 734,641 | ||||
FB Financial Corp. | 26,787 | 898,972 | |||||
First Busey Corp. | 4,600 | 99,820 | |||||
First Financial Bancorp | 31,500 | 636,615 | |||||
First Merchants Corp. | 14,300 | 438,581 | |||||
Glacier Bancorp, Inc. | 16,527 | 555,803 | |||||
Heartland Financial USA, Inc. | 27,860 | 861,710 | |||||
Hope Bancorp, Inc. | 28,200 | 276,360 | |||||
Independent Bank Corp. | 8,845 | 504,342 | |||||
OFG Bancorp | 11,300 | 379,228 | |||||
Old National Bancorp | 73,574 | 1,095,517 | |||||
Pathward Financial, Inc. | 5,500 | 272,745 | |||||
Pinnacle Financial Partners, Inc. | 15,870 | 1,151,686 | |||||
Premier Financial Corp. | 9,700 | 193,709 | |||||
QCR Holdings, Inc. | 1,000 | 49,680 | |||||
Republic Bancorp, Inc., Cl. A | 4,200 | 197,190 | |||||
Sandy Spring Bancorp, Inc. | 27,100 | 596,742 | |||||
Seacoast Banking Corp. of Florida | 46,996 | 1,092,187 | |||||
SouthState Corp. | 14,921 | 1,104,900 | |||||
Synovus Financial Corp. | 25,944 | 798,816 | |||||
Texas Capital Bancshares, Inc. | 36,263 | a | 1,990,113 | ||||
The Bancorp, Inc. | 12,540 | a | 489,185 | ||||
The Bank of NT Butterfield & Son Ltd. | 26,500 | 734,845 | |||||
WesBanco, Inc. | 3,300 | 87,846 | |||||
Wintrust Financial Corp. | 19,929 | 1,707,317 | |||||
18,359,833 | |||||||
Capital Goods - 9.7% | |||||||
AerCap Holdings NV | 11,508 | a | 785,076 | ||||
Albany International Corp., Cl. A | 4,215 | 361,731 | |||||
Arcosa, Inc. | 5,758 | 427,244 | |||||
Astec Industries, Inc. | 16,866 | 524,364 | |||||
9
STATEMENT OF INVESTMENTS (continued)
Description | Shares | Value ($) | |||||
Common Stocks - 97.6% (continued) | |||||||
Capital Goods - 9.7% (continued) | |||||||
Atkore, Inc. | 1,595 | a | 207,191 | ||||
Babcock & Wilcox Enterprises, Inc. | 65,662 | a | 93,240 | ||||
Bloom Energy Corp., Cl. A | 15,352 | a | 221,683 | ||||
BlueLinx Holdings, Inc. | 9,900 | a | 869,715 | ||||
BWX Technologies, Inc. | 8,785 | 685,494 | |||||
Chart Industries, Inc. | 2,885 | a | 375,137 | ||||
Comfort Systems USA, Inc. | 1,490 | 288,434 | |||||
Construction Partners, Inc., Cl. A | 6,630 | a | 278,195 | ||||
Douglas Dynamics, Inc. | 10,164 | 277,680 | |||||
Enerpac Tool Group Corp. | 37,290 | 1,018,017 | |||||
ESCO Technologies, Inc. | 2,565 | 269,274 | |||||
Franklin Electric Co., Inc. | 2,165 | 192,685 | |||||
Global Industrial Co. | 13,800 | 491,418 | |||||
GrafTech International Ltd. | 168,900 | 417,183 | |||||
Granite Construction, Inc. | 28,661 | 1,316,973 | |||||
Herc Holdings, Inc. | 10,333 | 1,277,779 | |||||
Hexcel Corp. | 21,191 | 1,468,748 | |||||
Hillenbrand, Inc. | 19,371 | 750,433 | |||||
Leonardo DRS, Inc. | 31,155 | a | 574,187 | ||||
Lindsay Corp. | 3,888 | 463,877 | |||||
Markforged Holding Corp. | 33,484 | a | 24,778 | ||||
Mercury Systems, Inc. | 5,646 | a | 193,601 | ||||
NEXTracker, Inc., Cl. A | 5,290 | a | 214,986 | ||||
Park Aerospace Corp. | 81,150 | 1,223,742 | |||||
Powell Industries, Inc. | 8,719 | 725,072 | |||||
Resideo Technologies, Inc. | 37,390 | a | 614,318 | ||||
Rush Enterprises, Inc., Cl. A | 18,450 | 731,911 | |||||
Simpson Manufacturing Co., Inc. | 1,540 | 257,134 | |||||
SPX Technologies, Inc. | 14,875 | a | 1,268,986 | ||||
Textainer Group Holdings Ltd. | 1,000 | 49,230 | |||||
The AZEK Company, Inc. | 5,350 | a | 184,522 | ||||
Twin Disc, Inc. | 5,948 | 81,428 | |||||
19,205,466 | |||||||
Commercial & Professional Services - 6.6% | |||||||
Brady Corp., Cl. A | 3,384 | 190,418 | |||||
CACI International, Inc., Cl. A | 1,435 | a | 460,563 | ||||
Clean Harbors, Inc. | 5,286 | a | 854,535 | ||||
Conduent, Inc. | 126,812 | a | 385,508 | ||||
CoreCivic, Inc. | 38,556 | a | 557,905 | ||||
Enviri Corp. | 30,331 | a | 178,953 | ||||
Healthcare Services Group, Inc. | 56,601 | 549,596 | |||||
Heidrick & Struggles International, Inc. | 2,300 | 62,514 | |||||
ICF International, Inc. | 4,525 | 633,274 | |||||
10
Description | Shares | Value ($) | |||||
Common Stocks - 97.6% (continued) | |||||||
Commercial & Professional Services - 6.6% (continued) | |||||||
KBR, Inc. | 17,685 | 913,784 | |||||
MSA Safety, Inc. | 7,893 | 1,374,487 | |||||
Openlane, Inc. | 28,506 | a | 416,758 | ||||
Parsons Corp. | 20,914 | a | 1,302,733 | ||||
Stericycle, Inc. | 31,117 | a | 1,461,566 | ||||
The Brink's Company | 20,164 | 1,590,940 | |||||
The GEO Group, Inc. | 44,900 | a | 455,735 | ||||
TTEC Holdings, Inc. | 22,300 | 417,456 | |||||
Vestis Corp. | 64,902 | 1,188,356 | |||||
12,995,081 | |||||||
Consumer Discretionary Distribution - 2.4% | |||||||
Asbury Automotive Group, Inc. | 6,505 | a | 1,364,879 | ||||
Caleres, Inc. | 8,340 | 253,202 | |||||
Dillard's, Inc., Cl. A | 2,300 | 798,307 | |||||
Haverty Furniture Cos., Inc. | 5,000 | 156,700 | |||||
Monro, Inc. | 11,819 | 341,805 | |||||
Shoe Carnival, Inc. | 5,600 | 136,024 | |||||
Sonic Automotive, Inc., Cl. A | 6,400 | 328,128 | |||||
The Buckle, Inc. | 24,000 | 925,440 | |||||
The Children's Place, Inc. | 4,009 | a | 91,205 | ||||
The ODP Corp. | 8,136 | a | 370,595 | ||||
4,766,285 | |||||||
Consumer Durables & Apparel - 3.9% | |||||||
Beazer Homes USA, Inc. | 18,800 | a | 494,628 | ||||
Carter's, Inc. | 23,851 | 1,626,400 | |||||
Century Communities, Inc. | 12,700 | 916,178 | |||||
Dream Finders Homes, Inc., Cl. A | 23,200 | a | 564,688 | ||||
Helen of Troy Ltd. | 3,545 | a | 372,331 | ||||
Installed Building Products, Inc. | 4,695 | 706,644 | |||||
Johnson Outdoors, Inc., Cl. A | 3,200 | 168,128 | |||||
Meritage Homes Corp. | 1,235 | 174,506 | |||||
Movado Group, Inc. | 2,200 | 57,530 | |||||
Oxford Industries, Inc. | 1,545 | 139,714 | |||||
PVH Corp. | 6,301 | 616,112 | |||||
SharkNinja, Inc. | 7,765 | 364,955 | |||||
Smith & Wesson Brands, Inc. | 49,500 | 680,625 | |||||
Tempur Sealy International, Inc. | 8,509 | 343,083 | |||||
Under Armour, Inc., Cl. C | 23,634 | a | 181,036 | ||||
Vista Outdoor, Inc. | 11,200 | a | 315,952 | ||||
7,722,510 | |||||||
Consumer Services - 2.7% | |||||||
Bloomin' Brands, Inc. | 19,330 | 451,162 | |||||
Boyd Gaming Corp. | 17,446 | 1,030,186 | |||||
11
STATEMENT OF INVESTMENTS (continued)
Description | Shares | Value ($) | |||||
Common Stocks - 97.6% (continued) | |||||||
Consumer Services - 2.7% (continued) | |||||||
Graham Holdings Co., Cl. B | 400 | 250,860 | |||||
Hilton Grand Vacations, Inc. | 5,545 | a | 189,972 | ||||
International Game Technology PLC | 34,694 | 927,371 | |||||
Light & Wonder, Inc. | 3,295 | a | 291,344 | ||||
Marriott Vacations Worldwide Corp. | 7,525 | 548,572 | |||||
OneSpaWorld Holdings Ltd. | 59,441 | a | 716,264 | ||||
Perdoceo Education Corp. | 34,100 | 594,022 | |||||
SeaWorld Entertainment, Inc. | 5,204 | a | 254,476 | ||||
5,254,229 | |||||||
Consumer Staples Distribution - .6% | |||||||
Ingles Markets, Inc., Cl. A | 10,800 | 881,496 | |||||
Weis Markets, Inc. | 5,000 | 301,750 | |||||
1,183,246 | |||||||
Energy - 6.8% | |||||||
Cactus, Inc., Cl. A | 7,350 | 312,301 | |||||
Callon Petroleum Co. | 28,502 | a | 891,258 | ||||
Centrus Energy Corp., Cl. A | 2,000 | a | 100,040 | ||||
ChampionX Corp. | 7,270 | 213,156 | |||||
Chord Energy Corp. | 2,935 | 475,881 | |||||
CNX Resources Corp. | 16,403 | a | 342,167 | ||||
Comstock Resources, Inc. | 148,836 | 1,469,011 | |||||
Crescent Energy Co., Cl. A | 13,000 | 148,200 | |||||
Devon Energy Corp. | 14,289 | 642,576 | |||||
Diamond Offshore Drilling, Inc. | 17,580 | a | 226,255 | ||||
Dril-Quip, Inc. | 48,387 | a | 1,075,160 | ||||
Gulfport Energy Corp. | 6,900 | a | 945,576 | ||||
Helmerich & Payne, Inc. | 5,710 | 206,873 | |||||
HighPeak Energy, Inc. | 43,200 | 664,416 | |||||
ION Geophysical Corp. | 12,608 | a,b | 0 | ||||
Murphy Oil Corp. | 19,364 | 828,198 | |||||
Oil States International, Inc. | 24,825 | a | 171,044 | ||||
Patterson-UTI Energy, Inc. | 17,064 | 199,819 | |||||
PBF Energy, Inc., Cl. A | 17,300 | 768,120 | |||||
Peabody Energy Corp. | 21,700 | 517,328 | |||||
Permian Resources Corp. | 41,275 | 542,353 | |||||
Riley Exploration Permian, Inc. | 7,000 | 172,900 | |||||
SandRidge Energy, Inc. | 17,800 | 245,818 | |||||
Scorpio Tankers, Inc. | 5,350 | 293,662 | |||||
SilverBow Resources, Inc. | 8,500 | a | 270,385 | ||||
SM Energy Co. | 25,176 | 942,841 | |||||
TechnipFMC PLC | 30,829 | 638,777 | |||||
TETRA Technologies, Inc. | 52,873 | a | 249,561 | ||||
13,553,676 | |||||||
12
Description | Shares | Value ($) | |||||
Common Stocks - 97.6% (continued) | |||||||
Equity Real Estate Investment - 3.7% | |||||||
Alexander's, Inc. | 2,200 | c | 404,712 | ||||
Armada Hoffler Properties, Inc. | 11,400 | c | 125,172 | ||||
Chatham Lodging Trust | 10,794 | c | 106,969 | ||||
COPT Defense Properties | 53,909 | c | 1,304,598 | ||||
Farmland Partners, Inc. | 47,094 | c | 583,024 | ||||
Lamar Advertising Co., Cl. A | 5,951 | c | 602,777 | ||||
Piedmont Office Realty Trust, Inc., Cl. A | 4,200 | c | 26,124 | ||||
Potlatchdeltic Corp. | 29,179 | c | 1,337,565 | ||||
RLJ Lodging Trust | 10,702 | c | 114,404 | ||||
SL Green Realty Corp. | 9,820 | c | 359,117 | ||||
STAG Industrial, Inc. | 46,866 | c | 1,680,146 | ||||
Terreno Realty Corp. | 10,380 | c | 592,802 | ||||
7,237,410 | |||||||
Financial Services - 7.8% | |||||||
Affiliated Managers Group, Inc. | 8,613 | 1,167,492 | |||||
Artisan Partners Asset Management, Inc., Cl. A | 65,332 | 2,459,750 | |||||
Atlanticus Holdings Corp. | 2,500 | a | 77,175 | ||||
Bread Financial Holdings, Inc. | 34,012 | 955,737 | |||||
Brightsphere Investment Group, Inc. | 12,700 | 221,615 | |||||
Cannae Holdings, Inc. | 5,758 | a | 103,414 | ||||
Claros Mortgage Trust, Inc. | 8,400 | 102,564 | |||||
Cohen & Steers, Inc. | 7,240 | 423,468 | |||||
Enact Holdings, Inc. | 32,100 | 889,491 | |||||
Enova International, Inc. | 17,500 | a | 721,000 | ||||
Essent Group Ltd. | 18,700 | 903,958 | |||||
Evercore, Inc., Cl. A | 13,087 | 1,930,987 | |||||
Jackson Financial, Inc., Cl. A | 20,200 | 964,146 | |||||
Merchants Bancorp | 19,100 | 642,715 | |||||
Navient Corp. | 19,700 | 337,461 | |||||
Nelnet, Inc., Cl. A | 10,000 | 839,000 | |||||
Pennymac Financial Services, Inc. | 4,000 | 311,160 | |||||
Stifel Financial Corp. | 18,875 | 1,151,752 | |||||
Victory Capital Holdings Inc., Cl. A | 27,000 | 868,050 | |||||
Walker & Dunlop, Inc. | 4,310 | 362,126 | |||||
15,433,061 | |||||||
Food, Beverage & Tobacco - 2.9% | |||||||
Darling Ingredients, Inc. | 24,901 | a | 1,092,407 | ||||
Lancaster Colony Corp. | 8,162 | 1,354,076 | |||||
National Beverage Corp. | 18,500 | a | 879,490 | ||||
The Hain Celestial Group, Inc. | 22,606 | a | 238,945 | ||||
The Simply Good Foods Company | 13,620 | a | 527,639 | ||||
Tootsie Roll Industries, Inc. | 9,546 | 315,877 | |||||
13
STATEMENT OF INVESTMENTS (continued)
Description | Shares | Value ($) | |||||
Common Stocks - 97.6% (continued) | |||||||
Food, Beverage & Tobacco - 2.9% (continued) | |||||||
TreeHouse Foods, Inc. | 26,535 | a | 1,080,240 | ||||
Vector Group Ltd. | 17,300 | 185,283 | |||||
5,673,957 | |||||||
Health Care Equipment & Services - 6.5% | |||||||
Acadia Healthcare Co., Inc. | 12,287 | a | 896,828 | ||||
Accuray, Inc. | 59,028 | a | 154,063 | ||||
AngioDynamics, Inc. | 28,490 | a | 186,040 | ||||
AtriCure, Inc. | 7,114 | a | 252,405 | ||||
Avanos Medical, Inc. | 44,411 | a | 957,057 | ||||
CONMED Corp. | 2,615 | 280,511 | |||||
Cytosorbents Corp. | 15,473 | a | 18,568 | ||||
Enovis Corp. | 28,594 | a | 1,414,259 | ||||
Haemonetics Corp. | 19,926 | a | 1,611,416 | ||||
HealthEquity, Inc. | 5,660 | a | 379,333 | ||||
HealthStream, Inc. | 51,125 | 1,278,125 | |||||
Integer Holdings Corp. | 12,836 | a | 1,119,556 | ||||
Integra LifeSciences Holdings Corp. | 4,638 | a | 181,763 | ||||
Lantheus Holdings, Inc. | 1,125 | a | 80,573 | ||||
Merit Medical Systems, Inc. | 15,056 | a | 1,077,407 | ||||
Molina Healthcare, Inc. | 1,886 | a | 689,446 | ||||
National HealthCare Corp. | 5,700 | 436,449 | |||||
Option Care Health, Inc. | 8,990 | a | 267,453 | ||||
OraSure Technologies, Inc. | 28,579 | a | 209,198 | ||||
Patterson Cos., Inc. | 11,906 | 302,531 | |||||
Select Medical Holdings Corp. | 13,900 | 314,140 | |||||
SI-BONE, Inc. | 7,810 | a | 148,078 | ||||
TransMedics Group, Inc. | 3,140 | a | 237,635 | ||||
Varex Imaging Corp. | 9,908 | a | 186,766 | ||||
Zimvie, Inc. | 12,465 | a | 117,794 | ||||
12,797,394 | |||||||
Household & Personal Products - 1.7% | |||||||
BellRing Brands, Inc. | 4,725 | a | 249,953 | ||||
e.l.f. Beauty, Inc. | 3,600 | a | 425,124 | ||||
Medifast, Inc. | 3,400 | 225,692 | |||||
Oil-Dri Corp. of America | 14,782 | 839,026 | |||||
Reynolds Consumer Products, Inc. | 9,499 | 249,254 | |||||
Spectrum Brands Holdings, Inc. | 11,923 | 826,622 | |||||
USANA Health Sciences, Inc. | 9,900 | a | 467,874 | ||||
3,283,545 | |||||||
Insurance - 1.9% | |||||||
American Equity Investment Life Holding Co. | 15,200 | 838,432 | |||||
CNO Financial Group, Inc. | 11,300 | 299,450 | |||||
14
Description | Shares | Value ($) | |||||
Common Stocks - 97.6% (continued) | |||||||
Insurance - 1.9% (continued) | |||||||
Enstar Group Ltd. | 600 | a | 164,784 | ||||
Genworth Financial, Inc., Cl. A | 26,500 | a | 156,085 | ||||
Selective Insurance Group, Inc. | 5,768 | 586,548 | |||||
Skyward Specialty Insurance Group, Inc. | 14,290 | a | 467,283 | ||||
Stewart Information Services Corp. | 690 | 32,603 | |||||
The Hanover Insurance Group, Inc. | 10,441 | 1,297,816 | |||||
3,843,001 | |||||||
Materials - 7.4% | |||||||
American Vanguard Corp. | 47,219 | 442,914 | |||||
ATI, Inc. | 34,087 | a | 1,498,123 | ||||
Avery Dennison Corp. | 4,364 | 848,798 | |||||
Avient Corp. | 38,204 | 1,312,307 | |||||
Balchem Corp. | 2,210 | 275,631 | |||||
Cleveland-Cliffs, Inc. | 37,139 | a | 637,305 | ||||
Crown Holdings, Inc. | 9,447 | 812,536 | |||||
Element Solutions, Inc. | 17,780 | 372,669 | |||||
Greif, Inc., Cl. A | 12,700 | 887,730 | |||||
Knife River Corp. | 7,755 | a | 462,818 | ||||
Koppers Holdings, Inc. | 3,100 | 140,027 | |||||
Kronos Worldwide, Inc. | 32,200 | 281,106 | |||||
Louisiana-Pacific Corp. | 21,513 | 1,312,078 | |||||
Royal Gold, Inc. | 11,677 | 1,422,259 | |||||
Ryerson Holding Corp. | 28,300 | 876,451 | |||||
Schnitzer Steel Industries, Inc., Cl. A | 18,792 | 481,639 | |||||
Sensient Technologies Corp. | 9,745 | 564,625 | |||||
Summit Materials Inc., Cl. A | 12,843 | a | 445,524 | ||||
Sylvamo Corp. | 18,500 | 930,180 | |||||
Worthington Industries, Inc. | 9,900 | 709,830 | |||||
14,714,550 | |||||||
Media & Entertainment - 2.6% | |||||||
AMC Networks, Inc., Cl. A | 27,900 | a | 425,196 | ||||
Criteo SA, ADR | 32,694 | a | 814,734 | ||||
Gray Television, Inc. | 61,200 | 473,076 | |||||
Lions Gate Entertainment Corp., Cl. B | 65,660 | a | 548,918 | ||||
Madison Square Garden Entertainment Corp. | 40,135 | a | 1,215,288 | ||||
Nexstar Media Group, Inc. | 10,017 | 1,421,713 | |||||
TEGNA, Inc. | 13,935 | 213,624 | |||||
Thryv Holdings, Inc. | 3,700 | a | 65,823 | ||||
5,178,372 | |||||||
Pharmaceuticals, Biotechnology & Life Sciences - 3.1% | |||||||
Alkermes PLC | 3,545 | a | 85,576 | ||||
Amneal Pharmaceuticals, Inc. | 38,906 | a | 167,685 | ||||
15
STATEMENT OF INVESTMENTS (continued)
Description | Shares | Value ($) | |||||
Common Stocks - 97.6% (continued) | |||||||
Pharmaceuticals, Biotechnology & Life Sciences - 3.1% (continued) | |||||||
Amphastar Pharmaceuticals, Inc. | 4,365 | a | 245,837 | ||||
Arrowhead Pharmaceuticals, Inc. | 3,450 | a | 73,140 | ||||
Axsome Therapeutics, Inc. | 4,265 | a | 287,674 | ||||
Bridgebio Pharma, Inc. | 7,915 | a | 227,240 | ||||
Catalyst Pharmaceuticals, Inc. | 20,770 | a | 299,711 | ||||
Charles River Laboratories International, Inc. | 2,005 | a | 395,145 | ||||
Crinetics Pharmaceuticals, Inc. | 3,755 | a | 119,371 | ||||
CymaBay Therapeutics, Inc. | 19,835 | a | 379,444 | ||||
Cytokinetics, Inc. | 3,905 | a | 130,739 | ||||
Immatics NV | 7,295 | a | 64,488 | ||||
ImmunoGen, Inc. | 8,885 | a | 260,775 | ||||
Innoviva, Inc. | 64,100 | a | 887,785 | ||||
Madrigal Pharmaceuticals, Inc. | 570 | a | 115,881 | ||||
Medpace Holdings, Inc. | 3,418 | a | 925,321 | ||||
Pacific Biosciences of California, Inc. | 23,880 | a | 202,502 | ||||
Phibro Animal Health Corp., Cl. A | 28,413 | 272,481 | |||||
Protagonist Therapeutics, Inc. | 4,210 | a | 76,664 | ||||
Prothena Corp. PLC | 1,440 | a | 46,915 | ||||
Rocket Pharmaceuticals, Inc. | 3,540 | a | 82,588 | ||||
Standard Biotools, Inc. | 52,908 | a | 136,503 | ||||
Vaxcyte, Inc. | 7,765 | a | 401,994 | ||||
Verona Pharma PLC, ADR | 20,770 | a | 280,810 | ||||
6,166,269 | |||||||
Real Estate Management & Development - .8% | |||||||
Forestar Group, Inc. | 19,590 | a | 598,083 | ||||
Newmark Group, Inc., Cl. A | 110,700 | 911,061 | |||||
1,509,144 | |||||||
Semiconductors & Semiconductor Equipment - 2.8% | |||||||
Amkor Technology, Inc. | 12,100 | 340,857 | |||||
CEVA, Inc. | 7,199 | a | 156,650 | ||||
Credo Technology Group Holding Ltd. | 7,610 | a | 136,295 | ||||
Diodes, Inc. | 18,515 | a | 1,229,766 | ||||
indie Semiconductor, Inc., Cl. A | 10,456 | a | 78,002 | ||||
MACOM Technology Solutions Holdings, Inc. | 12,846 | a | 1,078,807 | ||||
Onto Innovation, Inc. | 1,540 | a | 217,155 | ||||
Power Integrations, Inc. | 1,395 | 106,592 | |||||
Rambus, Inc. | 16,215 | a | 1,097,269 | ||||
Semtech Corp. | 10,945 | a | 179,170 | ||||
Silicon Laboratories, Inc. | 820 | a | 86,403 | ||||
Veeco Instruments, Inc. | 31,150 | a | 888,709 | ||||
5,595,675 | |||||||
16
Description | Shares | Value ($) | |||||
Common Stocks - 97.6% (continued) | |||||||
Software & Services - 2.5% | |||||||
Adeia, Inc. | 29,812 | 273,972 | |||||
Box, Inc., Cl. A | 8,647 | a | 226,292 | ||||
Cognyte Software Ltd. | 47,834 | a | 245,388 | ||||
DigitalOcean Holdings, Inc. | 4,390 | a | 130,032 | ||||
Fastly, Inc., CI. A | 5,475 | a | 90,940 | ||||
Freshworks, Inc., Cl. A | 10,120 | a | 202,602 | ||||
Kyndryl Holdings, Inc. | 43,446 | a | 783,331 | ||||
OneSpan, Inc. | 15,185 | a | 152,306 | ||||
Qualys, Inc. | 1,695 | a | 313,304 | ||||
Radware Ltd. | 9,968 | a | 152,012 | ||||
SPS Commerce, Inc. | 2,420 | a | 416,918 | ||||
Unisys Corp. | 52,575 | a | 251,834 | ||||
Varonis Systems, Inc. | 14,924 | a | 625,166 | ||||
Verint Systems, Inc. | 12,403 | a | 304,742 | ||||
Wix.com Ltd. | 3,261 | a | 330,991 | ||||
Workiva, Inc. | 2,875 | a | 276,489 | ||||
Xperi, Inc. | 24,006 | a | 247,742 | ||||
5,024,061 | |||||||
Technology Hardware & Equipment - 5.7% | |||||||
Advanced Energy Industries, Inc. | 12,268 | 1,166,073 | |||||
Belden, Inc. | 19,037 | 1,264,818 | |||||
Ciena Corp. | 16,790 | a | 769,821 | ||||
Coherent Corp. | 6,514 | a | 239,650 | ||||
CTS Corp. | 19,817 | 767,909 | |||||
EMCORE Corp. | 22,272 | a | 10,477 | ||||
Extreme Networks, Inc. | 5,595 | a | 90,303 | ||||
Infinera Corp. | 25,684 | a | 99,911 | ||||
Innoviz Technologies Ltd. | 43,064 | a | 73,639 | ||||
IPG Photonics Corp. | 13,478 | a | 1,290,653 | ||||
Itron, Inc. | 7,268 | a | 489,718 | ||||
Knowles Corp. | 47,079 | a | 747,144 | ||||
Methode Electronics, Inc. | 14,542 | 345,082 | |||||
nLight, Inc. | 9,686 | a | 128,049 | ||||
Novanta, Inc. | 1,395 | a | 201,494 | ||||
OSI Systems, Inc. | 3,399 | a | 419,063 | ||||
PC Connection, Inc. | 15,000 | 894,450 | |||||
Quantum Corp. | 290,578 | a | 86,970 | ||||
Ribbon Communications, Inc. | 135,145 | a | 287,859 | ||||
Rogers Corp. | 1,800 | a | 232,920 | ||||
Stratasys Ltd. | 36,814 | a | 406,427 | ||||
Super Micro Computer, Inc. | 772 | a | 211,119 | ||||
Teledyne Technologies, Inc. | 748 | a | 301,414 | ||||
Viasat, Inc. | 20,847 | a | 426,321 | ||||
17
STATEMENT OF INVESTMENTS (continued)
Description | Shares | Value ($) | |||||
Common Stocks - 97.6% (continued) | |||||||
Technology Hardware & Equipment - 5.7% (continued) | |||||||
Viavi Solutions, Inc. | 29,296 | a | 236,712 | ||||
11,187,996 | |||||||
Telecommunication Services - .4% | |||||||
ATN International, Inc. | 26,799 | 815,762 | |||||
EchoStar Corp., Cl. A | 7,300 | a | 76,431 | ||||
892,193 | |||||||
Transportation - 2.5% | |||||||
ArcBest Corp. | 2,375 | 283,076 | |||||
Costamare, Inc. | 95,800 | 968,538 | |||||
Golden Ocean Group Ltd. | 110,700 | 1,046,115 | |||||
Heartland Express, Inc. | 32,979 | 442,578 | |||||
Matson, Inc. | 3,600 | 344,772 | |||||
Universal Logistics Holdings, Inc. | 18,600 | 460,164 | |||||
XPO, Inc. | 16,732 | a | 1,443,637 | ||||
4,988,880 | |||||||
Utilities - 3.2% | |||||||
ALLETE, Inc. | 3,680 | 204,166 | |||||
Atmos Energy Corp. | 1,792 | 203,948 | |||||
New Jersey Resources Corp. | 4,690 | 197,918 | |||||
NorthWestern Energy Group, Inc. | 3,985 | 200,485 | |||||
Ormat Technologies, Inc. | 9,682 | 651,792 | |||||
Portland General Electric Co. | 57,375 | 2,355,817 | |||||
Southwest Gas Holdings, Inc. | 30,699 | 1,814,618 | |||||
Vistra Corp. | 22,706 | 804,019 | |||||
6,432,763 | |||||||
Total Common Stocks (cost $169,488,495) | 193,240,161 | ||||||
Exchange-Traded Funds - .6% | |||||||
Registered Investment Companies - .6% | |||||||
iShares Russell 2000 ETF | 6,352 | 1,141,200 | |||||
Coupon | Maturity | Principal | |||||
Escrow Bonds - .0% | |||||||
Energy - .0% | |||||||
Ion Geophysical Escrow Bond | 8.00 | 12/15/2025 | 48,000 | b | 0 | ||
18
Description | 1-Day | Shares | Value ($) | ||||
Investment Companies - 2.3% | |||||||
Registered Investment Companies - 2.3% | |||||||
Dreyfus Institutional Preferred Government Plus Money Market Fund, Institutional Shares | 5.41 | 4,569,287 | d | 4,569,287 | |||
Total Investments (cost $175,167,106) | 100.5% | 198,950,648 | |||||
Liabilities, Less Cash and Receivables | (.5%) | (982,380) | |||||
Net Assets | 100.0% | 197,968,268 | |||||
ADR—American Depositary Receipt
ETF—Exchange-Traded Fund
a Non-income producing security.
b The fund held Level 3 securities at November 30, 2023. These securities were valued at $0 or .0% of net assets.
c Investment in real estate investment trust within the United States.
d Investment in affiliated issuer. The investment objective of this investment company is publicly available and can be found within the investment company’s prospectus.
Portfolio Summary (Unaudited) † | Value (%) |
Financials | 19.0 |
Industrials | 18.8 |
Information Technology | 11.0 |
Health Care | 9.6 |
Consumer Discretionary | 9.1 |
Materials | 7.4 |
Energy | 6.8 |
Consumer Staples | 5.1 |
Real Estate | 4.4 |
Utilities | 3.3 |
Communication Services | 3.1 |
Investment Companies | 2.9 |
100.5 |
† Based on net assets.
See notes to financial statements.
Affiliated Issuers | ||||||
Description | Value ($) 11/30/2022 | Purchases ($)† | Sales ($) | Value ($) 11/30/2023 | Dividends/ | |
Registered Investment Companies - 2.3% | ||||||
Dreyfus Institutional Preferred Government Plus Money Market Fund, Institutional Shares - 2.3% | 8,925,142 | 196,987,574 | (201,343,429) | 4,569,287 | 358,980 | |
19
STATEMENT OF INVESTMENTS (continued)
Affiliated Issuers (continued) | ||||||
Description | Value ($) 11/30/2022 | Purchases ($)† | Sales ($) | Value ($) 11/30/2023 | Dividends/ | |
Investment of Cash Collateral for Securities Loaned - .0%†† | ||||||
Dreyfus Institutional Preferred Government Plus Money Market Fund, SL Shares - .0% | 6,056,465 | 30,475,076 | (36,531,541) | - | 41,358 | †† |
Total - 2.3% | 14,981,607 | 227,462,650 | (237,874,970) | 4,569,287 | 400,338 | |
† Includes reinvested dividends/distributions.
†† Represents securities lending income earned from the reinvestment of cash collateral from loaned securities, net of fees and collateral investment expenses, and other payments to and from borrowers of securities.
See notes to financial statements.
20
STATEMENT OF ASSETS AND LIABILITIES
November 30, 2023
|
|
|
|
|
|
|
|
|
| Cost |
| Value |
|
Assets ($): |
|
|
|
| ||
Investments in securities—See Statement of Investments |
|
|
| |||
Unaffiliated issuers | 170,597,819 |
| 194,381,361 |
| ||
Affiliated issuers |
| 4,569,287 |
| 4,569,287 |
| |
Receivable for investment securities sold |
| 1,112,918 |
| |||
Dividends and interest receivable |
| 321,852 |
| |||
Receivable for shares of Common Stock subscribed |
| 130 |
| |||
Prepaid expenses |
|
|
|
| 43,349 |
|
|
|
|
|
| 200,428,897 |
|
Liabilities ($): |
|
|
|
| ||
Due to BNY Mellon Investment Adviser, Inc. and affiliates—Note 3(c) |
| 181,286 |
| |||
Payable for shares of Common Stock redeemed |
| 1,127,845 |
| |||
Payable for investment securities purchased |
| 1,066,381 |
| |||
Directors’ fees and expenses payable |
| 4,667 |
| |||
Interest payable—Note 2 |
| 2,023 |
| |||
Other accrued expenses |
|
|
|
| 78,427 |
|
|
|
|
|
| 2,460,629 |
|
Net Assets ($) |
|
| 197,968,268 |
| ||
Composition of Net Assets ($): |
|
|
|
| ||
Paid-in capital |
|
|
|
| 163,282,749 |
|
Total distributable earnings (loss) |
|
|
|
| 34,685,519 |
|
Net Assets ($) |
|
| 197,968,268 |
| ||
Net Asset Value Per Share | Class A | Class C | Class I | Class Y |
|
Net Assets ($) | 849,454 | 69,217 | 10,448,955 | 186,600,642 |
|
Shares Outstanding | 43,621 | 4,319 | 521,233 | 9,336,287 |
|
Net Asset Value Per Share ($) | 19.47 | 16.03 | 20.05 | 19.99 |
|
|
|
|
|
|
|
See notes to financial statements. |
|
|
|
|
|
21
STATEMENT OF OPERATIONS
Near Ended November 30, 2023
|
|
|
|
|
|
|
|
|
|
|
|
|
|
Investment Income ($): |
|
|
|
| ||
Income: |
|
|
|
| ||
Cash dividends (net of $380 foreign taxes withheld at source): |
| |||||
Unaffiliated issuers |
|
| 4,156,631 |
| ||
Affiliated issuers |
|
| 358,980 |
| ||
Income from securities lending—Note 1(c) |
|
| 41,358 |
| ||
Interest |
|
| 12,001 |
| ||
Total Income |
|
| 4,568,970 |
| ||
Expenses: |
|
|
|
| ||
Management fee—Note 3(a) |
|
| 2,389,307 |
| ||
Professional fees |
|
| 104,727 |
| ||
Registration fees |
|
| 67,474 |
| ||
Custodian fees—Note 3(c) |
|
| 50,685 |
| ||
Chief Compliance Officer fees—Note 3(c) |
|
| 47,234 |
| ||
Prospectus and shareholders’ reports |
|
| 29,329 |
| ||
Directors’ fees and expenses—Note 3(d) |
|
| 28,188 |
| ||
Shareholder servicing costs—Note 3(c) |
|
| 15,309 |
| ||
Loan commitment fees—Note 2 |
|
| 5,031 |
| ||
Interest expense—Note 2 |
|
| 4,756 |
| ||
Distribution fees—Note 3(b) |
|
| 537 |
| ||
Miscellaneous |
|
| 44,600 |
| ||
Total Expenses |
|
| 2,787,177 |
| ||
Less—reduction in expenses due to undertaking—Note 3(a) |
|
| (8,301) |
| ||
Less—reduction in fees due to earnings credits—Note 3(c) |
|
| (2,377) |
| ||
Net Expenses |
|
| 2,776,499 |
| ||
Net Investment Income |
|
| 1,792,471 |
| ||
Realized and Unrealized Gain (Loss) on Investments—Note 4 ($): |
|
| ||||
Net realized gain (loss) on investments | 18,908,944 |
| ||||
Net change in unrealized appreciation (depreciation) on investments | (27,461,525) |
| ||||
Net Realized and Unrealized Gain (Loss) on Investments |
|
| (8,552,581) |
| ||
Net (Decrease) in Net Assets Resulting from Operations |
| (6,760,110) |
| |||
|
|
|
|
|
|
|
See notes to financial statements. | ||||||
22
STATEMENT OF CHANGES IN NET ASSETS
|
|
|
| Year Ended November 30, | |||||
|
|
|
| 2023 |
| 2022 |
| ||
Operations ($): |
|
|
|
|
|
|
|
| |
Net investment income |
|
| 1,792,471 |
|
|
| 1,926,282 |
| |
Net realized gain (loss) on investments |
| 18,908,944 |
|
|
| 36,801,877 |
| ||
Net change in unrealized appreciation |
| (27,461,525) |
|
|
| (83,493,340) |
| ||
Net Increase (Decrease) in Net Assets | (6,760,110) |
|
|
| (44,765,181) |
| |||
Distributions ($): |
| ||||||||
Distributions to shareholders: |
|
|
|
|
|
|
|
| |
Class A |
|
| (153,929) |
|
|
| (272,534) |
| |
Class C |
|
| (11,385) |
|
|
| (23,235) |
| |
Class I |
|
| (1,992,839) |
|
|
| (3,636,404) |
| |
Class Y |
|
| (38,005,883) |
|
|
| (92,159,940) |
| |
Total Distributions |
|
| (40,164,036) |
|
|
| (96,092,113) |
| |
Capital Stock Transactions ($): |
| ||||||||
Net proceeds from shares sold: |
|
|
|
|
|
|
|
| |
Class A |
|
| 25,704 |
|
|
| 112,352 |
| |
Class C |
|
| - |
|
|
| 2,994 |
| |
Class I |
|
| 4,748,298 |
|
|
| 14,093,526 |
| |
Class Y |
|
| 24,533,704 |
|
|
| 47,378,147 |
| |
Distributions reinvested: |
|
|
|
|
|
|
|
| |
Class A |
|
| 153,928 |
|
|
| 270,878 |
| |
Class C |
|
| 10,270 |
|
|
| 21,390 |
| |
Class I |
|
| 1,620,684 |
|
|
| 2,956,040 |
| |
Class Y |
|
| 19,143,726 |
|
|
| 45,640,636 |
| |
Cost of shares redeemed: |
|
|
|
|
|
|
|
| |
Class A |
|
| (391,368) |
|
|
| (518,349) |
| |
Class C |
|
| (22,045) |
|
|
| (27,851) |
| |
Class I |
|
| (10,421,965) |
|
|
| (17,525,858) |
| |
Class Y |
|
| (146,701,494) |
|
|
| (221,930,787) |
| |
Increase (Decrease) in Net Assets | (107,300,558) |
|
|
| (129,526,882) |
| |||
Total Increase (Decrease) in Net Assets | (154,224,704) |
|
|
| (270,384,176) |
| |||
Net Assets ($): |
| ||||||||
Beginning of Period |
|
| 352,192,972 |
|
|
| 622,577,148 |
| |
End of Period |
|
| 197,968,268 |
|
|
| 352,192,972 |
| |
23
STATEMENT OF CHANGES IN NET ASSETS (continued)
|
|
|
| Year Ended November 30, | |||||
|
|
|
| 2023 |
| 2022 |
| ||
Capital Share Transactions (Shares): |
| ||||||||
Class Aa |
|
|
|
|
|
|
|
| |
Shares sold |
|
| 1,185 |
|
|
| 4,968 |
| |
Shares issued for distributions reinvested |
|
| 7,931 |
|
|
| 10,540 |
| |
Shares redeemed |
|
| (19,894) |
|
|
| (22,016) |
| |
Net Increase (Decrease) in Shares Outstanding | (10,778) |
|
|
| (6,508) |
| |||
Class C |
|
|
|
|
|
|
|
| |
Shares sold |
|
| - |
|
|
| 142 |
| |
Shares issued for distributions reinvested |
|
| 636 |
|
|
| 971 |
| |
Shares redeemed |
|
| (1,246) |
|
|
| (1,334) |
| |
Net Increase (Decrease) in Shares Outstanding | (610) |
|
|
| (221) |
| |||
Class Ia |
|
|
|
|
|
|
|
| |
Shares sold |
|
| 233,184 |
|
|
| 582,730 |
| |
Shares issued for distributions reinvested |
|
| 81,285 |
|
|
| 112,390 |
| |
Shares redeemed |
|
| (515,829) |
|
|
| (750,473) |
| |
Net Increase (Decrease) in Shares Outstanding | (201,360) |
|
|
| (55,353) |
| |||
Class Ya |
|
|
|
|
|
|
|
| |
Shares sold |
|
| 1,197,670 |
|
|
| 1,831,114 |
| |
Shares issued for distributions reinvested |
|
| 961,437 |
|
|
| 1,738,870 |
| |
Shares redeemed |
|
| (7,195,241) |
|
|
| (9,434,825) |
| |
Net Increase (Decrease) in Shares Outstanding | (5,036,134) |
|
|
| (5,864,841) |
| |||
|
|
|
|
|
|
|
|
|
|
a | During the period ended November 30, 2023, 201,079 Class Y shares representing $4,054,416 were exchanged for 200,485 Class I shares. During the period ended November 30, 2022, 481,494 Class Y shares representing $11,733,984 were exchanged for 480,331 Class I shares and 837 Class Y shares representing $22,518 were exchanged for 855 Class A shares. | ||||||||
See notes to financial statements. | |||||||||
24
FINANCIAL HIGHLIGHTS
The following tables describe the performance for each share class for the fiscal periods indicated. All information (except portfolio turnover rate) reflects financial results for a single fund share. Net asset value total return is calculated assuming an initial investment made at the net asset value at the beginning of the period, reinvestment of all dividends and distributions at net asset value during the period, and redemption at net asset value on the last day of the period. Net asset value total return includes adjustments in accordance with accounting principles generally accepted in the United States of America and as such, the net asset value for financial reporting purposes and the returns based upon those net asset values may differ from the net asset value and returns for shareholder transactions. These figures have been derived from the fund’s financial statements.
Year Ended November 30, | ||||||
Class A Shares | 2023 | 2022 | 2021 | 2020 | 2019 | |
Per Share Data ($): | ||||||
Net asset value, beginning of period | 22.69 | 28.97 | 24.13 | 22.15 | 23.94 | |
Investment Operations: | ||||||
Net investment income (loss)a | .08 | .02 | (.07) | .03 | .02 | |
Net realized and unrealized | (.53) | (1.81) | 6.28 | 2.39 | .86 | |
Total from Investment Operations | (.45) | (1.79) | 6.21 | 2.42 | .88 | |
Distributions: | ||||||
Dividends from net investment income | (.06) | - | (.04) | (.01) | - | |
Dividends from net realized | (2.71) | (4.49) | (1.33) | (.43) | (2.67) | |
Total Distributions | (2.77) | (4.49) | (1.37) | (.44) | (2.67) | |
Net asset value, end of period | 19.47 | 22.69 | 28.97 | 24.13 | 22.15 | |
Total Return (%)b | (1.52) | (7.76) | 26.55 | 11.21 | 6.07 | |
Ratios/Supplemental Data (%): | ||||||
Ratio of total expenses | 1.49 | 1.38 | 1.33 | 1.44 | 1.38 | |
Ratio of net expenses | 1.30 | 1.30 | 1.30 | 1.30 | 1.30 | |
Ratio of net investment income (loss) | .42 | .09 | (.23) | .14 | .12 | |
Portfolio Turnover Rate | 74.64 | 70.59 | 70.67 | 86.50 | 57.74 | |
Net Assets, end of period ($ x 1,000) | 849 | 1,234 | 1,765 | 1,025 | 1,125 | |
a Based on average shares outstanding.
b Exclusive of sales charge.
See notes to financial statements.
25
FINANCIAL HIGHLIGHTS (continued)
Year Ended November 30, | ||||||
Class C Shares | 2023 | 2022 | 2021 | 2020 | 2019 | |
Per Share Data ($): | ||||||
Net asset value, beginning of period | 19.26 | 25.41 | 21.44 | 19.86 | 21.92 | |
Investment Operations: | ||||||
Net investment (loss)a | (.06) | (.13) | (.24) | (.10) | (.12) | |
Net realized and unrealized | (.46) | (1.53) | 5.54 | 2.11 | .73 | |
Total from Investment Operations | (.52) | (1.66) | 5.30 | 2.01 | .61 | |
Distributions: | ||||||
Dividends from net realized | (2.71) | (4.49) | (1.33) | (.43) | (2.67) | |
Net asset value, end of period | 16.03 | 19.26 | 25.41 | 21.44 | 19.86 | |
Total Return (%)b | (2.22) | (8.44) | 25.58 | 10.42 | 5.28 | |
Ratios/Supplemental Data (%): | ||||||
Ratio of total expenses | 2.87 | 2.62 | 2.43 | 2.39 | 2.12 | |
Ratio of net expenses | 2.05 | 2.05 | 2.05 | 2.05 | 2.05 | |
Ratio of net investment (loss) | (.36) | (.66) | (.95) | (.55) | (.61) | |
Portfolio Turnover Rate | 74.64 | 70.59 | 70.67 | 86.50 | 57.74 | |
Net Assets, end of period ($ x 1,000) | 69 | 95 | 131 | 117 | 430 | |
a Based on average shares outstanding.
b Exclusive of sales charge.
See notes to financial statements.
26
Year Ended November 30, | ||||||
Class I Shares | 2023 | 2022 | 2021 | 2020 | 2019 | |
Per Share Data ($): | ||||||
Net asset value, beginning of period | 23.29 | 29.59 | 24.60 | 22.61 | 24.41 | |
Investment Operations: | ||||||
Net investment incomea | .14 | .09 | .03 | .08 | .10 | |
Net realized and unrealized | (.54) | (1.87) | 6.39 | 2.44 | .86 | |
Total from Investment Operations | (.40) | (1.78) | 6.42 | 2.52 | .96 | |
Distributions: | ||||||
Dividends from | (.13) | (.03) | (.10) | (.10) | (.09) | |
Dividends from net realized | (2.71) | (4.49) | (1.33) | (.43) | (2.67) | |
Total Distributions | (2.84) | (4.52) | (1.43) | (.53) | (2.76) | |
Net asset value, end of period | 20.05 | 23.29 | 29.59 | 24.60 | 22.61 | |
Total Return (%) | (1.22) | (7.55) | 26.95 | 11.53 | 6.40 | |
Ratios/Supplemental Data (%): | ||||||
Ratio of total expenses | 1.10 | 1.03 | 1.00 | 1.03 | .99 | |
Ratio of net expenses | 1.05 | 1.03 | 1.00 | 1.03 | .99 | |
Ratio of net investment income | .66 | .37 | .09 | .41 | .45 | |
Portfolio Turnover Rate | 74.64 | 70.59 | 70.67 | 86.50 | 57.74 | |
Net Assets, end of period ($ x 1,000) | 10,449 | 16,832 | 23,019 | 13,851 | 15,955 | |
a Based on average shares outstanding.
See notes to financial statements.
27
FINANCIAL HIGHLIGHTS (continued)
Year Ended November 30, | ||||||
Class Y Shares | 2023 | 2022 | 2021 | 2020 | 2019 | |
Per Share Data ($): | ||||||
Net asset value, beginning of period | 23.24 | 29.53 | 24.56 | 22.59 | 24.40 | |
Investment Operations: | ||||||
Net investment incomea | .14 | .10 | .04 | .10 | .10 | |
Net realized and unrealized | (.54) | (1.86) | 6.37 | 2.42 | .86 | |
Total from Investment Operations | (.40) | (1.76) | 6.41 | 2.52 | .96 | |
Distributions: | ||||||
Dividends | (.14) | (.04) | (.11) | (.12) | (.10) | |
Dividends from net realized | (2.71) | (4.49) | (1.33) | (.43) | (2.67) | |
Total Distributions | (2.85) | (4.53) | (1.44) | (.55) | (2.77) | |
Net asset value, end of period | 19.99 | 23.24 | 29.53 | 24.56 | 22.59 | |
Total Return (%) | (1.22) | (7.48) | 26.97 | 11.58 | 6.41 | |
Ratios/Supplemental Data (%): | ||||||
Ratio of total expenses | 1.05 | .98 | .96 | .98 | .95 | |
Ratio of net expenses | 1.04 | .98 | .96 | .98 | .95 | |
Ratio of net investment income | .68 | .42 | .14 | .46 | .48 | |
Portfolio Turnover Rate | 74.64 | 70.59 | 70.67 | 86.50 | 57.74 | |
Net Assets, end of period ($ x 1,000) | 186,601 | 334,032 | 597,663 | 467,798 | 578,267 | |
a Based on average shares outstanding.
See notes to financial statements.
28
NOTES TO FINANCIAL STATEMENTS
NOTE 1—Significant Accounting Policies:
BNY Mellon Select Managers Small Cap Value Fund (the “fund”) is a separate diversified series of BNY Mellon Strategic Funds, Inc. (the “Company”), which is registered under the Investment Company Act of 1940, as amended (the “Act”), as an open-end management investment company and operates as a series company currently offering six series, including the fund. The fund’s investment objective is to seek capital appreciation. BNY Mellon Investment Adviser, Inc. (the “Adviser”), a wholly-owned subsidiary of The Bank of New York Mellon Corporation (“BNY Mellon”), serves as the fund’s investment adviser and the fund’s portfolio allocation manager. Channing Capital Management, LLC (“Channing”), Denali Advisors, LLC (“Denali”), Eastern Shore Capital Management (“Eastern Shore”), Heartland Advisors, Inc. (“Heartland”) and Neuberger Berman Investment Advisers LLC (“Neuberger Berman”), serve as the fund’s sub-advisers (collectively, the “Sub-Advisers”), each managing an allocated portion of the fund’s portfolio.
BNY Mellon Securities Corporation (the “Distributor”), a wholly-owned subsidiary of the Adviser, is the distributor of the fund’s shares. The fund is authorized to issue 500 million shares of $.001 par value Common Stock. The fund currently has authorized four classes of shares: Class A (100 million shares authorized), Class C (100 million shares authorized), Class I (100 million shares authorized) and Class Y (200 million shares authorized). Class A and Class C shares are sold primarily to retail investors through financial intermediaries and bear Distribution and/or Shareholder Services Plan fees. Class A shares generally are subject to a sales charge imposed at the time of purchase. Class A shares bought without an initial sales charge as part of an investment of $1 million or more may be charged a contingent deferred sales charge (“CDSC”) of 1.00% if redeemed within one year. Class C shares are subject to a CDSC imposed on Class C shares redeemed within one year of purchase. Class C shares automatically convert to Class A shares eight years after the date of purchase, without the imposition of a sales charge. Class I shares are sold primarily to bank trust departments and other financial service providers (including BNY Mellon and its affiliates), acting on behalf of customers having a qualified trust or an investment account or relationship at such institution, and bear no Distribution or Shareholder Services Plan fees. Class Y shares are sold at net asset value per share generally to institutional investors, and bear no Distribution or Shareholder Services Plan fees. Class I and Class Y shares are offered without a front-end sales charge or CDSC. Other differences between the classes include the services offered to and
29
NOTES TO FINANCIAL STATEMENTS (continued)
the expenses borne by each class, the allocation of certain transfer agency costs and certain voting rights. Income, expenses (other than expenses attributable to a specific class), and realized and unrealized gains or losses on investments are allocated to each class of shares based on its relative net assets.
As of November 30, 2023, MBC Investments Corporation, an indirect subsidiary of BNY Mellon, held 411 Class C shares of the fund.
The Company accounts separately for the assets, liabilities and operations of each series. Expenses directly attributable to each series are charged to that series’ operations; expenses which are applicable to all series are allocated among them on a pro rata basis.
The Financial Accounting Standards Board (“FASB”) Accounting Standards Codification (“ASC”) is the exclusive reference of authoritative U.S. generally accepted accounting principles (“GAAP”) recognized by the FASB to be applied by nongovernmental entities. Rules and interpretive releases of the SEC under authority of federal laws are also sources of authoritative GAAP for SEC registrants. The fund is an investment company and applies the accounting and reporting guidance of the FASB ASC Topic 946 Financial Services-Investment Companies. The fund’s financial statements are prepared in accordance with GAAP, which may require the use of management estimates and assumptions. Actual results could differ from those estimates.
The Company enters into contracts that contain a variety of indemnifications. The fund’s maximum exposure under these arrangements is unknown. The fund does not anticipate recognizing any loss related to these arrangements.
(a) Portfolio valuation: The fair value of a financial instrument is the amount that would be received to sell an asset or paid to transfer a liability in an orderly transaction between market participants at the measurement date (i.e., the exit price). GAAP establishes a fair value hierarchy that prioritizes the inputs of valuation techniques used to measure fair value. This hierarchy gives the highest priority to unadjusted quoted prices in active markets for identical assets or liabilities (Level 1 measurements) and the lowest priority to unobservable inputs (Level 3 measurements).
Additionally, GAAP provides guidance on determining whether the volume and activity in a market has decreased significantly and whether such a decrease in activity results in transactions that are not orderly. GAAP requires enhanced disclosures around valuation inputs and techniques used during annual and interim periods.
30
Various inputs are used in determining the value of the fund’s investments relating to fair value measurements. These inputs are summarized in the three broad levels listed below:
Level 1—unadjusted quoted prices in active markets for identical investments.
Level 2—other significant observable inputs (including quoted prices for similar investments, interest rates, prepayment speeds, credit risk, etc.).
Level 3—significant unobservable inputs (including the fund’s own assumptions in determining the fair value of investments).
The inputs or methodology used for valuing securities are not necessarily an indication of the risk associated with investing in those securities.
Changes in valuation techniques may result in transfers in or out of an assigned level within the disclosure hierarchy. Valuation techniques used to value the fund’s investments are as follows:
The Company’s Board of Directors (the “Board”) has designated the Adviser as the fund’s valuation designee to make all fair value determinations with respect to the fund’s portfolio investments, subject to the Board’s oversight and pursuant to Rule 2a-5 under the Act.
Investments in debt securities excluding short-term investments (other than U.S. Treasury Bills) are valued each business day by one or more independent pricing services (each, a “Service”) approved by the Board. Investments for which quoted bid prices are readily available and are representative of the bid side of the market in the judgment of a Service are valued at the mean between the quoted bid prices (as obtained by a Service from dealers in such securities) and asked prices (as calculated by a Service based upon its evaluation of the market for such securities). Securities are valued as determined by a Service, based on methods which include consideration of the following: yields or prices of securities of comparable quality, coupon, maturity and type; indications as to values from dealers; and general market conditions. The Services are engaged under the general supervision of the Board. These securities are generally categorized within Level 2 of the fair value hierarchy.
Investments in equity securities and exchange-traded funds are valued at the last sales price on the securities exchange or national securities market on which such securities are primarily traded. Securities listed on the National Market System for which market quotations are available are valued at the official closing price or, if there is no official closing price that day, at the last sales price. For open short positions, asked prices are
31
NOTES TO FINANCIAL STATEMENTS (continued)
used for valuation purposes. Bid price is used when no asked price is available. Registered investment companies that are not traded on an exchange are valued at their net asset value. All of the preceding securities are generally categorized within Level 1 of the fair value hierarchy.
Securities not listed on an exchange or the national securities market, or securities for which there were no transactions, are valued at the average of the most recent bid and asked prices. These securities are generally categorized within Level 2 of the fair value hierarchy.
Fair valuing of securities may be determined with the assistance of a Service using calculations based on indices of domestic securities and other appropriate indicators, such as prices of relevant ADRs and futures. Utilizing these techniques may result in transfers between Level 1 and Level 2 of the fair value hierarchy.
When market quotations or official closing prices are not readily available, or are determined not to accurately reflect fair value, such as when the value of a security has been significantly affected by events after the close of the exchange or market on which the security is principally traded, but before the fund calculates its net asset value, the fund may value these investments at fair value as determined in accordance with the procedures approved by the Board. Certain factors may be considered when fair valuing investments such as: fundamental analytical data, the nature and duration of restrictions on disposition, an evaluation of the forces that influence the market in which the securities are purchased and sold, and public trading in similar securities of the issuer or comparable issuers. These securities are either categorized within Level 2 or 3 of the fair value hierarchy depending on the relevant inputs used.
For securities where observable inputs are limited, assumptions about market activity and risk are used and such securities are generally categorized within Level 3 of the fair value hierarchy.
The following is a summary of the inputs used as of November 30, 2023 in valuing the fund’s investments:
Level 1-Unadjusted Quoted Prices | Level 2- Other Significant Observable Inputs | Level 3-Significant Unobservable Inputs | Total | |||
Assets ($) | ||||||
Investments in Securities:† | ||||||
Equity Securities - Common Stocks | 193,240,161 | - | 0 | 193,240,161 | ||
Escrow Bonds | - | - | 0 | 0 | ||
32
Level 1-Unadjusted Quoted Prices | Level 2- Other Significant Observable Inputs | Level 3-Significant Unobservable Inputs | Total | |||
Assets ($) (continued) | ||||||
Investments in Securities:† (continued) | ||||||
Exchange-Traded Funds | 1,141,200 | - | - | 1,141,200 | ||
Investment Companies | 4,569,287 | - | - | 4,569,287 | ||
† See Statement of Investments for additional detailed categorizations, if any.
The following is a reconciliation of Level 3 assets for which significant unobservable inputs were used to determine fair value:
Equity Securities – | |
Balance as of 11/30/2022† | 0 |
Purchases/Issuances | - |
Sales/Dispositions | - |
Net realized gain (loss) | - |
Change in unrealized appreciation (depreciation) | - |
Transfers into Level 3 | - |
Transfers out of Level 3 | - |
Balances as of 11/30/2023† | 0 |
The amount of net realized gains (loss) for the period included in earnings attributable to the change in unrealized appreciation (depreciation) relating to investments still held at 11/30/2023 | - |
† Securities deemed as Level 3 due to the lack of observable inputs by management assessment.
(b) Foreign taxes: The fund may be subject to foreign taxes (a portion of which may be reclaimable) on income, stock dividends, realized and unrealized capital gains on investments or certain foreign currency transactions. Foreign taxes are recorded in accordance with the applicable foreign tax regulations and rates that exist in the foreign jurisdictions in which the fund invests. These foreign taxes, if any, are paid by the fund and are reflected in the Statement of Operations, if applicable. Foreign taxes payable or deferred or those subject to reclaims as of November 30, 2023, if any, are disclosed in the fund’s Statement of Assets and Liabilities.
(c) Securities transactions and investment income: Securities transactions are recorded on a trade date basis. Realized gains and losses from securities transactions are recorded on the identified cost basis.
33
NOTES TO FINANCIAL STATEMENTS (continued)
Dividend income is recognized on the ex-dividend date and interest income, including, where applicable, accretion of discount and amortization of premium on investments, is recognized on the accrual basis.
Pursuant to a securities lending agreement with BNY Mellon, the fund may lend securities to qualified institutions. It is the fund’s policy that, at origination, all loans are secured by collateral of at least 102% of the value of U.S. securities loaned and 105% of the value of foreign securities loaned. Collateral equivalent to at least 100% of the market value of securities on loan is maintained at all times. Collateral is either in the form of cash, which can be invested in certain money market mutual funds managed by the Adviser, or U.S. Government and Agency securities. Any non-cash collateral received cannot be sold or re-pledged by the fund, except in the event of borrower default. The securities on loan, if any, are also disclosed in the fund’s Statement of Investments. The fund is entitled to receive all dividends, interest and distributions on securities loaned, in addition to income earned as a result of the lending transaction. Should a borrower fail to return the securities in a timely manner, BNY Mellon is required to replace the securities for the benefit of the fund or credit the fund with the market value of the unreturned securities and is subrogated to the fund’s rights against the borrower and the collateral. Additionally, the contractual maturity of security lending transactions are on an overnight and continuous basis. During the period ended November 30, 2023, BNY Mellon earned $5,634 from the lending of the fund’s portfolio securities, pursuant to the securities lending agreement.
For financial reporting purposes, the fund elects not to offset assets and liabilities subject to a securities lending agreement, if any, in the Statement of Assets and Liabilities. Therefore, all qualifying transactions are presented on a gross basis in the Statement of Assets and Liabilities. As of November 30, 2023, the fund had no securities on loan.
(d) Affiliated issuers: Investments in other investment companies advised by the Adviser are considered “affiliated” under the Act.
(e) Market Risk: The value of the securities in which the fund invests may be affected by political, regulatory, economic and social developments, and developments that impact specific economic sectors, industries or segments of the market. In addition, turbulence in financial markets and reduced liquidity in equity, credit and/or fixed-income markets may negatively affect many issuers, which could adversely affect the fund. Global economies and financial markets are becoming increasingly interconnected, and conditions and events in one country, region or financial market may adversely impact issuers in a different country, region
34
or financial market. These risks may be magnified if certain events or developments adversely interrupt the global supply chain; in these and other circumstances, such risks might affect companies world-wide.
Foreign Investment Risk: To the extent the fund invests in foreign securities, the fund’s performance will be influenced by political, social and economic factors affecting investments in foreign issuers. Special risks associated with investments in foreign issuers include exposure to currency fluctuations, less liquidity, less developed or less efficient trading markets, lack of comprehensive company information, political and economic instability and differing auditing and legal standards.
Multi-Manager Risk: Each sub-adviser makes investment decisions independently, and it is possible that the investment styles of the sub-advisers may not complement one another. As a result, the fund's exposure to a given stock, industry or investment style could unintentionally be greater or smaller than it would have been if the fund had a single adviser. In addition, if one sub-adviser buys a security during a time frame when another sub-adviser sells it, the fund will incur transaction costs and the fund's net position in the security may be approximately the same as it would have been with a single adviser and no such sale and purchase.
Allocation Risk: The ability of the fund to achieve its investment goal depends, in part, on the ability of the Adviser to allocate effectively the fund's assets among the sub-advisers. There can be no assurance that the actual allocations will be effective in achieving the fund's investment goal.
(f) Dividends and distributions to shareholders: Dividends and distributions are recorded on the ex-dividend date. Dividends from net investment income and dividends from net realized capital gains, if any, are normally declared and paid annually, but the fund may make distributions on a more frequent basis to comply with the distribution requirements of the Internal Revenue Code of 1986, as amended (the “Code”). To the extent that net realized capital gains can be offset by capital loss carryovers, it is the policy of the fund not to distribute such gains. Income and capital gain distributions are determined in accordance with income tax regulations, which may differ from GAAP.
(g) Federal income taxes: It is the policy of the fund to continue to qualify as a regulated investment company, if such qualification is in the best interests of its shareholders, by complying with the applicable provisions of the Code, and to make distributions of taxable income and net realized capital gain sufficient to relieve it from substantially all federal income and excise taxes.
35
NOTES TO FINANCIAL STATEMENTS (continued)
As of and during the period ended November 30, 2023, the fund did not have any liabilities for any uncertain tax positions. The fund recognizes interest and penalties, if any, related to uncertain tax positions as income tax expense in the Statement of Operations. During the period ended November 30, 2023, the fund did not incur any interest or penalties.
Each tax year in the four-year period ended November 30, 2023 remains subject to examination by the Internal Revenue Service and state taxing authorities.
At November 30, 2023, the components of accumulated earnings on a tax basis were as follows: undistributed ordinary income $1,768,153, undistributed capital gains $15,463,489 and unrealized appreciation $17,453,877.
The tax character of distributions paid to shareholders during the fiscal years ended November 30, 2023 and November 30, 2022 were as follows: ordinary income $1,999,841 and $34,033,285, and long-term capital gains $38,164,195 and $62,058,828, respectively.
NOTE 2—Bank Lines of Credit:
The fund participates with other long-term open-end funds managed by the Adviser in a $738 million unsecured credit facility led by Citibank, N.A. (the “Citibank Credit Facility”) and a $300 million unsecured credit facility provided by BNY Mellon (the “BNYM Credit Facility”), each to be utilized primarily for temporary or emergency purposes, including the financing of redemptions (each, a “Facility”). The Citibank Credit Facility is available in two tranches: (i) Tranche A is in an amount equal to $618 million and is available to all long-term open-ended funds, including the fund, and (ii) Tranche B is an amount equal to $120 million and is available only to BNY Mellon Floating Rate Income Fund, a series of BNY Mellon Investment Funds IV, Inc. Prior to September 27, 2023, the Citibank Credit Facility was $823.5 million with Tranche A available in an amount equal to $688.5 million and Tranche B available in an amount equal to $135 million. In connection therewith, the fund has agreed to pay its pro rata portion of commitment fees for Tranche A of the Citibank Credit Facility and the BNYM Credit Facility. Interest is charged to the fund based on rates determined pursuant to the terms of the respective Facility at the time of borrowing.
During the period ended November 30, 2023, the fund was charged $4,756 for interest expense. These fees are included in Interest expense in the Statement of Operations. The average amount of borrowings outstanding under the Facilities during the period ended November 30, 2023 was
36
approximately $80,548 with a related weighted average annualized interest rate of 5.90%.
NOTE 3—Management Fee, Sub-Advisory Fee and Other Transactions with Affiliates:
(a) Pursuant to a management agreement with the Adviser, the management fee is computed at the annual rate of .90% of the value of the fund’s average daily net assets and is payable monthly. The Adviser has contractually agreed, from December 1, 2022 through March 31, 2024, to waive receipt of its fees and/or assume the direct expenses of the fund so that the direct expenses of none of the fund’s share classes (excluding Rule 12b-1 Distribution Plan fees, Shareholder Services Plan fees, taxes, interest expense, brokerage commissions, commitment fees on borrowings and extraordinary expenses) exceed 1.05% of the value of the fund’s average daily net assets. On or after March 31, 2024, the Adviser may terminate this expense limitation at any time. The reduction in expenses, pursuant to the undertakings, amounted to $8,301 during the period ended November 30, 2023.
Pursuant to separate sub-investment advisory agreements between the Adviser and the Sub-Advisers, each serves as the fund’s sub-adviser responsible for the day-to-day management of a portion of the fund’s portfolio. The Adviser pays each sub-adviser a monthly fee at an annual percentage of the value of the fund’s average daily net assets. The Adviser has obtained an exemptive order from the SEC (the “Order”), upon which the fund may rely, to use a manager of managers approach that permits the Adviser, subject to certain conditions and approval by the Board, to enter into and materially amend sub-investment advisory agreements with one or more sub-advisers who are either unaffiliated with the Adviser or are wholly-owned subsidiaries (as defined under the Act) of the Adviser’s ultimate parent company, BNY Mellon, without obtaining shareholder approval. The Order also allows the fund to disclose the sub-advisory fee paid by the Adviser to any unaffiliated sub-adviser in the aggregate with other unaffiliated sub-advisers in documents filed with the SEC and provided to shareholders. In addition, pursuant to the Order, it is not necessary to disclose the sub-advisory fee payable by the Adviser separately to a sub-adviser that is a wholly-owned subsidiary of BNY Mellon in documents filed with the SEC and provided to shareholders; such fees are to be aggregated with fees payable to the Adviser. The Adviser has ultimate responsibility (subject to oversight by the Board) to supervise any sub-adviser and recommend the hiring, termination, and replacement of any sub-adviser to the Board.
37
NOTES TO FINANCIAL STATEMENTS (continued)
(b) Under the Distribution Plan adopted pursuant to Rule 12b-1 under the Act, Class C shares pay the Distributor for distributing its shares at an annual rate of .75% of the value of its average daily net assets. The Distributor may pay one or more Service Agents in respect of advertising, marketing and other distribution services, and determines the amounts, if any, to be paid to Service Agents and the basis on which such payments are made. During the period ended November 30, 2023, Class C shares were charged $537 pursuant to the Distribution Plan.
(c) Under the Shareholder Services Plan, Class A and Class C shares pay the Distributor at an annual rate of .25% of the value of their average daily net assets for the provision of certain services. The services provided may include personal services relating to shareholder accounts, such as answering shareholder inquiries regarding the fund, and services related to the maintenance of shareholder accounts. The Distributor may make payments to Service Agents (securities dealers, financial institutions or other industry professionals) with respect to these services. The Distributor determines the amounts to be paid to Service Agents. During the period ended November 30, 2023, Class A and Class C shares were charged $2,649 and $179, respectively, pursuant to the Shareholder Services Plan.
The fund has an arrangement with BNY Mellon Transfer, Inc., (the “Transfer Agent”), a subsidiary of BNY Mellon and an affiliate of the Adviser, whereby the fund may receive earnings credits when positive cash balances are maintained, which are used to offset Transfer Agent fees. For financial reporting purposes, the fund includes transfer agent net earnings credits, if any, as an expense offset in the Statement of Operations.
The fund has an arrangement with The Bank of New York Mellon (the “Custodian”), a subsidiary of BNY Mellon and an affiliate of the Adviser, whereby the fund will receive interest income or be charged overdraft fees when cash balances are maintained. For financial reporting purposes, the fund includes this interest income and overdraft fees, if any, as interest income in the Statement of Operations.
The fund compensates the Transfer Agent, under a transfer agency agreement, for providing transfer agency and cash management services for the fund. The majority of Transfer Agent fees are comprised of amounts paid on a per account basis, while cash management fees are related to fund subscriptions and redemptions. During the period ended November 30, 2023, the fund was charged $5,370 for transfer agency services. These fees are included in Shareholder servicing costs in the Statement of Operations. These fees were partially offset by earnings credits of $2,377.
38
The fund compensates the Custodian, under a custody agreement, for providing custodial services for the fund. These fees are determined based on net assets, geographic region and transaction activity. During the period ended November 30, 2023, the fund was charged $50,685 pursuant to the custody agreement.
During the period ended November 30, 2023, the fund was charged $47,234 for services performed by the fund’s Chief Compliance Officer and his staff. These fees are included in Chief Compliance Officer fees in the Statement of Operations.
The components of “Due to BNY Mellon Investment Adviser, Inc. and affiliates” in the Statement of Assets and Liabilities consist of: management fee of $154,360, Distribution Plan fees of $42, Shareholder Services Plan fees of $194, Custodian fees of $16,950, Chief Compliance Officer fees of $9,189 and Transfer Agent fees of $1,333, which are offset against an expense reimbursement currently in effect in the amount of $782.
(d) Each board member also serves as a board member of other funds in the BNY Mellon Family of Funds complex. Annual retainer fees and attendance fees are allocated to each fund based on net assets.
NOTE 4—Securities Transactions:
The aggregate amount of purchases and sales of investment securities, excluding short-term securities, during the period ended November 30, 2023, amounted to $192,929,367 and $331,784,182, respectively.
At November 30, 2023, the cost of investments for federal income tax purposes was $181,496,771; accordingly, accumulated net unrealized appreciation on investments was $17,453,877, consisting of $37,229,824 gross unrealized appreciation and $19,775,947 gross unrealized depreciation.
39
REPORT OF INDEPENDENT REGISTERED PUBLIC ACCOUNTING FIRM
To the Shareholders and the Board of Directors of BNY Mellon Select Managers Small Cap Value Fund
Opinion on the Financial Statements
We have audited the accompanying statement of assets and liabilities of BNY Mellon Select Managers Small Cap Value Fund (the “Fund”) (one of the funds constituting BNY Mellon Strategic Funds, Inc. (the “Company”)), including the statement of investments, as of November 30, 2023, and the related statement of operations for the year then ended, the statements of changes in net assets for each of the two years in the period then ended, the financial highlights for each of the five years in the period then ended and the related notes (collectively referred to as the “financial statements”). In our opinion, the financial statements present fairly, in all material respects, the financial position of the Fund (one of the funds constituting BNY Mellon Strategic Funds, Inc.) at November 30, 2023, the results of its operations for the year then ended, the changes in its net assets for each of the two years in the period then ended and its financial highlights for each of the five years in the period then ended, in conformity with U.S. generally accepted accounting principles.
Basis for Opinion
These financial statements are the responsibility of the Company’s management. Our responsibility is to express an opinion on the Fund’s financial statements based on our audits. We are a public accounting firm registered with the Public Company Accounting Oversight Board (United States) (“PCAOB”) and are required to be independent with respect to the Company in accordance with the U.S. federal securities laws and the applicable rules and regulations of the Securities and Exchange Commission and the PCAOB.
We conducted our audits in accordance with the standards of the PCAOB. Those standards require that we plan and perform the audit to obtain reasonable assurance about whether the financial statements are free of material misstatement, whether due to error or fraud. The Company is not required to have, nor were we engaged to perform, an audit of the Company’s internal control over financial reporting. As part of our audits, we are required to obtain an understanding of internal control over financial reporting but not for the purpose of expressing an opinion on the effectiveness of the Company’s internal control over financial reporting. Accordingly, we express no such opinion.
Our audits included performing procedures to assess the risks of material misstatement of the financial statements, whether due to error or fraud, and performing procedures that respond to those risks. Such procedures included examining, on a test basis, evidence regarding the amounts and disclosures in the financial statements. Our procedures included confirmation of securities owned as of November 30, 2023, by correspondence with the custodian, brokers and others; when replies were not received from brokers and others, we performed other auditing procedures. Our audits also included evaluating the accounting principles used and significant estimates made by management, as well as evaluating the overall presentation of the financial statements. We believe that our audits provide a reasonable basis for our opinion.

We have served as the auditor of one or more investment companies in the BNY Mellon Family of Funds since at least 1957, but we are unable to determine the specific year.
New York, New York
January 22, 2024
40
ADDITIONAL INFORMATION (Unaudited)
UPDATES TO SALES CHARGE REDUCTIONS AND WAIVERS AVAILABLE FROM CERTAIN FINANCIAL INTERMEDIARIES:
The availability of certain sales charge reductions and waivers will depend on whether you purchase fund shares directly from the fund or through a financial intermediary. Financial intermediaries may have different policies and procedures regarding the availability of front-end sales load reductions or waivers or CDSC waivers, which are described in the fund’s prospectus. In all instances, it is the investor’s responsibility to notify the fund or the investor’s financial intermediary at the time of purchase of any relationship or other facts qualifying the investor for sales charge reductions or waivers. For reductions or waivers not available through a particular financial intermediary, investors will have to purchase fund shares directly from the fund or through another financial intermediary to receive these reductions or waivers.
Edward Jones
Clients of Edward D. Jones & Co., L.P. (Edward Jones) purchasing fund shares on the Edward Jones commission and fee-based platforms are eligible only for the following sales charge reductions and waivers, which can differ from the sales charge reductions and waivers described elsewhere in the fund’s prospectus or the SAI or through another financial intermediary. In all instances, it is the shareholder’s responsibility to inform Edward Jones at the time of purchase of any relationship, holdings of BNY Mellon Family of Funds, or other facts qualifying the purchaser for sales charge reductions or waivers. Edward Jones can ask for documentation of such circumstance. Shareholders should contact Edward Jones if they have questions regarding their eligibility for these discounts and waivers.
Front-end sales charge reductions on Class A shares purchased on the Edward Jones commission and fee-based platforms
Shareholders purchasing Class A shares of the fund on the Edward Jones commission and fee-based platforms can reduce their initial sales charge in the following ways:
· Transaction size breakpoints, as described in the fund’s prospectus.
· Rights of accumulation (ROA), which entitle shareholders to breakpoint discounts as described in the fund’s prospectus, will be calculated based on the aggregated holdings of shares of funds in the BNY Mellon Family of Funds (except certain money market funds and any assets held in group retirement plans) held by the purchaser or in an account grouped by Edward Jones with other accounts for the purpose of providing certain pricing considerations (“pricing groups”) and, if grouping assets as a shareholder, includes all share classes of such funds held on the Edward Jones platform and/or held on another platform. Shares of funds in the BNY Mellon Family of Funds may be included in the ROA calculation only if the shareholder notifies Edward Jones about such shares. Money market funds are included only if such shares were sold with a sales charge at the time of purchase or
41
ADDITIONAL INFORMATION (Unaudited) (continued)
acquired in exchange for shares purchased with a sales charge. The employer maintaining a SEP IRA plan and/or SIMPLE IRA plan may elect to establish or change ROA for the IRA accounts associated with the plan to a plan-level grouping as opposed to including all share classes at a shareholder or pricing group level. For purposes of determining the value of a shareholder’s aggregated holdings, eligible shares held will be valued at the higher of their cost minus redemptions or current market value.
· Letter of intent (LOI), which allows for breakpoint discounts as described in the fund’s prospectus, based on anticipated purchases of shares of funds in the BNY Mellon Family of Funds purchased over a 13-month period from the date Edward Jones receives the LOI. Eligible shares purchased pursuant to a LOI will be valued at the higher of their cost or current market value for purposes of determining the front-end sales charge and any breakpoint discounts with respect to such share purchases. Each purchase a shareholder makes pursuant to a LOI during the 13-month period will receive the front-end sales charge and breakpoint discount that applies to the total amount indicated in the LOI. Shares of funds in the BNY Mellon Family of Funds may be included in the LOI calculation only if the shareholder notifies Edward Jones about such shares at the time of calculation. Shares purchased before the LOI is received by Edward Jones are not adjusted under the LOI and will not reduce the sales charge previously paid by the shareholder. The sales charge will be adjusted if the shareholder does not meet the goal indicated in the LOI. If the employer maintaining a SEP IRA plan and/or SIMPLE IRA plan has elected to establish or change ROA for the IRA accounts associated with the plan to a plan-level grouping, LOIs will also be at the plan-level and may only be established by the employer.
Front-end sales charge waivers on Class A shares purchased on the Edward Jones commission and fee-based platforms
Shareholders purchasing Class A shares of the fund on the Edward Jones commission and fee-based platforms may purchase Class A shares at NAV without payment of a sales charge as follows:
· shares purchased by associates of Edward Jones or its affiliates and their family members who are in the same pricing group (as determined by Edward Jones under its policies and procedures) as the associate. This waiver will continue for the remainder of the associate’s life if the associate retires from Edward Jones in good standing and remains in good standing pursuant to Edward Jones’ policies and procedures (Effective January 1, 2024, this waiver will be revised as follows: shares purchased by associates of Edward Jones and its affiliates and other accounts in the same pricing group (as determined by Edward Jones under its policies and procedures) as the associate. This waiver will continue for the remainder of the associate’s life if the associate retires from Edward Jones in good-standing and remains in good standing pursuant to Edward Jones’ policies and procedures)
· shares purchased in an Edward Jones fee-based program
42
· shares purchased through reinvestment of dividends and capital gains distributions of the fund
· shares purchased from the proceeds of redemptions of shares of a fund in the BNY Mellon Family of Funds, provided (1) the repurchase occurs within 60 days following the redemption, and (2) the redemption and purchase are made in the same share class and the same account or the purchase is made in an individual retirement account with proceeds from liquidations in a non-retirement account (i.e., Right of Reinstatement) (Effective January 1, 2024, this waiver will be revised as follows: shares purchased from the proceeds of redemptions of shares of a fund in the BNY Mellon Family of Funds, provided that (1) the repurchase occurs within 60 days following the redemption, and (2) the redemption and purchase are made in a share class that charges a front-end sales charge, subject to one of the following conditions being met:
o the redemption and repurchase occur in the same account
o the redemption proceeds are used to process an IRA contribution, excess contributions, conversion, recharacterizing of contributions, or distribution, and the repurchase is done in an account within the same Edward Jones grouping for ROA)
· shares exchanged into Class A shares from another share class so long as the exchange is into the same fund and was initiated at the discretion of Edward Jones. Edward Jones is responsible for any CDSC due, if applicable. Any future purchases are subject to the applicable sales charge as disclosed in the fund’s prospectus
· exchanges from Class C shares to Class A shares of the same fund, generally, in the 84th month following the anniversary of the purchase date or earlier at the discretion of Edward Jones
· Effective January 1, 2024: purchases of Class A shares for a 529 plan account through a rollover from either another education savings plan or a security used for qualified distributions
· Effective January 1, 2024: purchases of Class A shares for a 529 plan account made for recontribution of refunded amounts
CDSC waivers on Class A and C shares purchased on the Edward Jones commission and fee-based platforms
The fund’s CDSC on Class A and C shares may be waived for shares purchased on the Edward Jones commission and fee-based platforms in the following cases:
· redemptions made upon the death or disability of the shareholder
· redemptions made through a systematic withdrawal plan, if such redemptions do not exceed 10% of the value of the account annually
43
ADDITIONAL INFORMATION (Unaudited) (continued)
· redemptions made in connection with a return of excess contributions from an IRA account
· redemptions made as part of a required minimum distribution for IRA and retirement accounts if the redemption is taken in or after the year the shareholder reaches qualified age based on applicable IRS regulations
· redemptions made to pay Edward Jones fees or costs, but only if the redemption is initiated by Edward Jones
· shares exchanged in an Edward Jones fee-based program
· shares acquired through a Right of Reinstatement (as defined above)
· shares redeemed at the discretion of Edward Jones for accounts not meeting Edward Jones’ minimum balance requirements described below
Other important information for clients of Edward Jones who purchase fund shares on the Edward Jones commission and fee-based platforms
Minimum Purchase Amounts
· Initial purchase minimum: $250
· Subsequent purchase minimum: none
Minimum Balances
· Edward Jones has the right to redeem at its discretion fund holdings with a balance of $250 or less. The following are examples of accounts that are not included in this policy:
o A fee-based account held on an Edward Jones platform
o A 529 account held on an Edward Jones platform
o An account with an active systematic investment plan or LOI
Exchanging Share Classes
· At any time it deems necessary, Edward Jones has the authority to exchange at NAV a shareholder’s holdings in a fund to Class A shares of the same fund. Edward Jones is responsible for any CDSC due, if applicable. Any future purchases are subject to the applicable sales charge as disclosed in the fund’s prospectus.
Merrill
Purchases or sales of front-end (i.e., Class A) or level-load (i.e., Class C) mutual fund shares through a Merrill platform or account are eligible only for the following sales load waivers (front-end or CDSC) and discounts, which differ from those disclosed elsewhere in the fund’s prospectus. Purchasers will have to buy mutual fund shares
44
directly from the mutual fund company or through another intermediary to be eligible for waivers or discounts not listed below.
It is the client’s responsibility to notify Merrill at the time of purchase or sale of any relationship or other facts that qualify the transaction for a waiver or discount. A Merrill representative may ask for reasonable documentation of such facts and Merrill may condition the granting of a waiver or discount on the timely receipt of such documentation. Additional information on waivers or discounts is available in the Merrill Sales Load Waiver and Discounts Supplement (the “Merrill SLWD Supplement”) and in the Mutual Fund Investing at Merrill pamphlet at ml.com/funds. Clients are encouraged to review these documents and speak with their financial advisor to determine whether a transaction is eligible for a waiver or discount.
Front-end sales charge waivers on Class A shares purchased through Merrill
Shareholders purchasing Class A shares of the fund through a Merrill platform or account are eligible only for the following sales charge waivers, which may differ from those disclosed elsewhere in the fund’s prospectus or the SAI. Such shareholders may purchase Class A shares at NAV without payment of a sales charge as follows:
· shares of mutual funds available for purchase by employer-sponsored retirement, deferred compensation and employee benefit plans (including health savings accounts) and trusts used to fund those plans provided that the shares are not held in a commission-based brokerage account and shares are held for the benefit of the plan. For purposes of this provision, employer-sponsored retirement plans do not include SEP IRAs, Simple IRAs, SAR-SEPs or Keogh plans
· shares purchased through a Merrill investment advisory program
· brokerage class shares exchanged from advisory class shares due to the holdings moving from a Merrill investment advisory program to a Merrill brokerage account
· shares purchased through the Merrill Edge Self-Directed platform
· shares purchased through the systematic reinvestment of capital gains distributions and dividend reinvestment when purchasing shares of the same mutual fund in the same account
· shares exchanged from level-load shares to front-end load shares of the same mutual fund in accordance with the description in the Merrill SLWD Supplement
· shares purchased by eligible employees of Merrill or its affiliates and their family members who purchase shares in accounts within the employee’s Merrill Household (as defined in the Merrill SLWD Supplement)
45
ADDITIONAL INFORMATION (Unaudited) (continued)
· shares purchased by eligible persons associated with the fund as defined in the fund’s prospectus (e.g., the fund’s officers or trustees)
· shares purchased from the proceeds of a mutual fund redemption in front-end load shares, provided (1) the repurchase is in a mutual fund within the same fund family, (2) the repurchase occurs within 90 calendar days from the redemption trade date, and (3) the redemption and purchase occur in the same account (known as Rights of Reinstatement). Automated transactions (i.e., systematic purchases and withdrawals) and purchases made after shares are automatically sold to pay Merrill’s account maintenance fees are not eligible for Rights of Reinstatement
CDSC waivers on Class A and C shares purchased through Merrill
Fund shares purchased through a Merrill platform or account are eligible only for the following CDSC waivers, which may differ from those disclosed elsewhere in the fund’s prospectus or the SAI:
· shares sold due to the client’s death or disability (as defined by Internal Revenue Code Section 22(e)(3))
· shares sold pursuant to a systematic withdrawal program subject to Merrill’s maximum systematic withdrawal limits, as described in the Merrill SLWD Supplement
· shares sold due to return of excess contributions from an IRA account
· shares sold as part of a required minimum distribution for IRA and retirement accounts due to the investor reaching the qualified age based on applicable IRS regulation
· front-end or level-load shares held in commission-based, non-taxable retirement brokerage accounts (e.g., traditional, Roth, rollover, SEP IRAs, Simple IRAs, SAR-SEPs or Keogh plans) that are transferred to fee-based accounts or platforms and exchanged for a lower cost share class of the same mutual fund.
Front-end sales charge reductions on Class A shares purchased through Merrill
Shareholders purchasing Class A shares of the fund through a Merrill platform or account are eligible only for the following sales charge reductions (i.e., discounts), which may differ from those disclosed elsewhere in the fund’s prospectus or the SAI. Such shareholders can reduce their initial sales charge in the following ways:
· Breakpoint discounts, as described in the fund’s prospectus, where the sales load is at or below the maximum sales load that Merrill permits to be assessed to a front-end load purchase, as described in the Merrill SLWD Supplement.
46
· Rights of accumulation (ROA), as described in the Merrill SLWD Supplement, which entitle clients to breakpoint discounts based on the aggregated holdings of mutual fund family assets held in accounts in their Merrill Household.
· Letters of Intent (LOI), which allow for breakpoint discounts on eligible new purchases based on anticipated future eligible purchases within a fund family at Merrill, in accounts within your Merrill Household, as further described in the Merrill SLWD Supplement.
47
IMPORTANT TAX INFORMATION (Unaudited)
For federal tax purposes the fund hereby reports 100% of the ordinary dividends paid during the fiscal year ended November 30, 2023 as qualifying for the corporate dividends received deduction. Also certain dividends paid by the fund may be subject to a maximum tax rate of 15%, as provided for by the Jobs and Growth Tax Relief Reconciliation Act of 2003. Of the distributions paid during the fiscal year, $1,999,841 represents the maximum amount that may be considered qualified dividend income. Shareholders will receive notification in early 2024 of the percentage applicable to the preparation of their 2023 income tax returns. Also, the fund hereby reports $1.4101 per share as a long-term capital gain distribution paid on December 22, 2022 and $1.3031 per share as a long-term capital gain distribution paid on March 28, 2023.
48
INFORMATION ABOUT THE RENEWAL OF THE FUND’S MANAGEMENT AND SUB-INVESTMENT ADVISORY AGREEMENTS (Unaudited)
At a meeting of the fund’s Board of Directors (the “Board’) held on October 30-31, 2023, the Board considered the renewal of (a) the fund’s Management Agreement, pursuant to which the Adviser provides the fund with investment management and administrative services and is responsible for evaluating and recommending sub-advisers to provide the fund with day-to-day portfolio management services, recommending the percentage of fund assets to be allocated to each sub-adviser, monitoring and evaluating the performance of the sub-advisers, and recommending whether a sub-adviser should be terminated and (b) the separate Sub-Investment Advisory Agreements (together with the Management Agreement, the “Agreements”), between the Adviser and each of Channing Capital Management, LLC, Denali Advisers, LLC, Eastern Shore Capital Management, Heartland Advisors, Inc., and Neuberger Berman Investment Advisers LLC (each, a “Sub-Adviser” and collectively, the “Sub-Advisers”), pursuant to which each Sub-Adviser serves as a sub-investment adviser and provides day-to-day management of the fund’s investments with respect to the portion of the fund’s assets allocated to the Sub-Adviser. The Board members, none of whom are “interested persons” (as defined in the Investment Company Act of 1940), as amended of the fund, were assisted in their review by independent legal counsel and met with counsel in executive session separate from representatives of the Adviser and the Sub-Advisers. In considering the renewal of the Agreements, the Board considered several factors that it believed to be relevant, including those discussed below. The Board did not identify any one factor as dispositive, and each Board member may have attributed different weights to the factors considered.
Analysis of Nature, Extent, and Quality of Services Provided to the Fund. The Board considered information provided to it at the meeting and in previous presentations from representatives of the Adviser regarding the nature, extent, and quality of the services provided to funds in the BNY Mellon fund complex, including the fund. The Adviser provided the number of open accounts in the fund, the fund’s asset size and the allocation of fund assets among distribution channels. The Adviser also had previously provided information regarding the diverse intermediary relationships and distribution channels of funds in the BNY Mellon fund complex (such as retail direct or intermediary, in which intermediaries typically are paid by the fund and/or the Adviser) and the Adviser’s corresponding need for broad, deep, and diverse resources to be able to provide ongoing shareholder services to each intermediary or distribution channel, as applicable to the fund.
The Board also considered research support available to, and portfolio management capabilities of, the fund’s portfolio management personnel and that the Adviser also provides oversight of day-to-day fund operations, including fund accounting and administration and assistance in meeting legal and regulatory requirements. The Board also considered the Adviser’s extensive administrative, accounting and compliance infrastructures, as well as the Adviser’s supervisory, evaluation and other responsibilities in respect of the Sub-Advisers. As part of its review, the Board considered information regarding the process by which the Adviser selected and recommended the
49
INFORMATION ABOUT THE RENEWAL OF THE FUND’S MANAGEMENT AND SUB-INVESTMENT ADVISORY AGREEMENTS (Unaudited) (continued)
Sub-Advisers for Board approval. The Board considered each Sub-Adviser’s specific responsibilities in the day-to-day management of the portion of the fund’s assets allocated to it, as well as the qualifications, experience and responsibilities of the persons serving as the portfolio managers for the segment of the fund’s assets managed by the respective Sub-Adviser, and other key personnel at the Sub-Adviser. The Board specifically took into account each Sub-Adviser’s investment process and capabilities, evaluating how the Sub-Adviser complemented each of the other Sub-Advisers to the fund, noting the Adviser’s favorable assessment of the nature and quality of the sub-advisory services provided to the fund by the Sub-Advisers. The Board also considered portfolio management’s brokerage policies and practices (including policies and practices regarding soft dollars) and the standards applied in seeking best execution.
Comparative Analysis of the Fund’s Performance and Management Fee and Expense Ratio. The Board reviewed reports prepared by Broadridge Financial Solutions, Inc. (“Broadridge”), an independent provider of investment company data based on classifications provided by Thomson Reuters Lipper (“Lipper”), which included information comparing (1) the performance of the fund’s Class I shares with the performance of a group of institutional small-cap core funds selected by Broadridge as comparable to the fund (the “Performance Group”) and with a broader group of funds consisting of all retail and institutional small-cap core funds (the “Performance Universe”), all for various periods ended August 31, 2023, and (2) the fund’s actual and contractual management fees and total expenses with those of the same group of funds in the Performance Group (the “Expense Group”) and with a broader group of funds consisting of all institutional small-cap core funds, excluding outliers (the “Expense Universe”), the information for which was derived in part from fund financial statements available to Broadridge as of the date of its analysis. The Adviser previously had furnished the Board with a description of the methodology Broadridge used to select the Performance Group and Performance Universe and the Expense Group and Expense Universe. The Board also reviewed performance information provided by the Adviser with respect to each Sub-Adviser for various periods ended August 31, 2023.
Performance Comparisons. Representatives of the Adviser stated that the usefulness of performance comparisons may be affected by a number of factors, including different investment limitations and policies that may be applicable to the fund and comparison funds and the end date selected, noting that the funds included in the Performance Group and the Performance Universe were not limited to funds that engage multiple sub-advisers like the fund, nor did they include only funds that use a value-style of investing. The Board also considered the fund’s performance generally should be considered over longer periods of time, although it is possible that long-term performance can be adversely affected by even one period of significant underperformance so that a single investment decision or theme has the ability to affect disproportionately long-term performance. The Board also considered the fund’s performance in light of overall financial market conditions. The Board discussed with representatives of the Adviser the results of the comparisons and considered that the fund’s total return performance was below the Performance Group median for all periods except the four- and five-year periods when the fund’s total return performance
50
was above the Performance Group median, and was below the Performance Universe median for all periods, except the one-, four-, and five-year periods when the fund’s total return performance was above the Performance Universe median. The Board considered the relative proximity of the fund’s performance to the Performance Group and/or Performance Universe medians in certain periods when performance was below median. The Board noted that the fund had a four-star rating for the five-year period from Morningstar based on Morningstar’s risk-adjusted return measure.
Management Fee and Expense Ratio Comparisons. The Board reviewed and considered the contractual management fee rate payable by the fund to the Adviser in light of the nature, extent and quality of the management services and the sub-advisory services provided by the Adviser and the Sub-Advisers, respectively. In addition, the Board reviewed and considered the actual management fee rate paid by the fund over the fund’s last fiscal year, which included reductions for a fee waiver arrangement in place that reduced the management fee paid to the Adviser. The Board also reviewed the range of actual and contractual management fees and total expenses as a percentage of average net assets of the Expense Group and Expense Universe funds and discussed the results of the comparisons. It was noted that, as in the case of the funds included in the Performance Group and the Performance Universe, the funds included in the Expense Group and the Expense Universe were not limited to funds that engage multiple sub-advisers like the fund.
The Board considered that the fund’s contractual management fee was higher than the Expense Group median contractual management fee, the fund’s actual management fee was higher than the Expense Group median and higher than the Expense Universe median actual management fee, and the fund’s total expenses were higher than the Expense Group median and higher than the Expense Universe median total expenses.
Representatives of the Adviser stated that the Adviser has contractually agreed, until March 31, 2024, to waive receipt of its fees and/or assume the direct expenses of the fund so that the direct expenses of none of the fund’s classes of shares (excluding Rule 12b-1 fees, shareholder services fees, taxes, interest expense, brokerage commissions, commitment fees on borrowings and extraordinary expenses) exceed 1.05% of the fund’s average daily net assets.
Representatives of the Adviser reviewed with the Board the management or investment advisory fees paid by funds advised by the Adviser that are in the same Lipper category as the fund (the “Similar Funds”), and explained the nature of the Similar Funds. They discussed differences in fees paid in light of any differences in the services provided and other relevant factors. The Board considered the relevance of the fee information provided for the Similar Funds to evaluate the appropriateness of the fund’s management fee. Representatives of the Adviser noted that there were no separate accounts and/or other types of client portfolios advised by the Adviser that are considered to have similar investment strategies and policies as the fund.
The Board considered the fees payable to the Sub-Advisers in relation to the fee payable to the Adviser by the fund and the respective services provided by the Sub-Advisers and
51
INFORMATION ABOUT THE RENEWAL OF THE FUND’S MANAGEMENT AND SUB-INVESTMENT ADVISORY AGREEMENTS (Unaudited) (continued)
the Adviser. The Board also took into consideration that the Sub-Advisers’ fees are paid by the Adviser, out of its fee from the fund, and not the fund.
Analysis of Profitability and Economies of Scale. Representatives of the Adviser reviewed the expenses allocated and profit received by the Adviser and its affiliates and the resulting profitability percentage for managing the fund and the aggregate profitability percentage to the Adviser and its affiliates for managing the funds in the BNY Mellon fund complex, and the method used to determine the expenses and profit. The Board concluded that the profitability results were not excessive, given the services rendered and service levels provided by the Adviser and its affiliates. The Board also had been provided with information prepared by an independent consulting firm regarding the Adviser’s approach to allocating costs to, and determining the profitability of, individual funds and the entire BNY Mellon fund complex. The consulting firm also had analyzed where any economies of scale might emerge in connection with the management of a fund.
The Board considered, on the advice of its counsel, the profitability analysis (1) as part of its evaluation of whether the fees under the Agreements, considered in relation to the mix of services provided by the Adviser and the Sub-Advisers, including the nature, extent and quality of such services, supported the renewal of the Agreements and (2) in light of the relevant circumstances for the fund and the extent to which economies of scale would be realized if the fund grows and whether fee levels reflect these economies of scale for the benefit of fund shareholders. Since the Adviser, and not the fund, pays the Sub-Advisers pursuant to the respective Sub-Investment Advisory Agreements, the Board did not consider any Sub-Adviser’s profitability to be relevant to its deliberations. Representatives of the Adviser stated that a discussion of economies of scale is predicated on a fund having achieved a substantial size with increasing assets and that, if a fund’s assets had been stable or decreasing, the possibility that the Adviser may have realized any economies of scale would be less. Representatives of the Adviser also stated that, as a result of shared and allocated costs among funds in the BNY Mellon fund complex, the extent of economies of scale could depend substantially on the level of assets in the complex as a whole, so that increases and decreases in complex-wide assets can affect potential economies of scale in a manner that is disproportionate to, or even in the opposite direction from, changes in the fund’s asset level. The Board also considered potential benefits to the Adviser and each Sub-Adviser from acting as investment adviser and sub-investment adviser, respectively, and took into consideration the soft dollar arrangements in effect for trading the fund’s investments.
At the conclusion of these discussions, the Board agreed that it had been furnished with sufficient information to make an informed business decision with respect to the renewal of the Agreements. Based on the discussions and considerations as described above, the Board concluded and determined as follows.
· The Board concluded that the nature, extent and quality of the services provided by the Adviser and the Sub-Advisers are adequate and appropriate.
52
· The Board generally was satisfied with the fund’s overall, relative performance and with the manner in which the Adviser monitors and evaluates the performance of each Sub-Adviser.
· The Board concluded that the fees paid to the Adviser and the Sub-Advisers continued to be appropriate under the circumstances and in light of the factors and the totality of the services provided as discussed above.
· The Board determined that the economies of scale which may accrue to the Adviser and its affiliates in connection with the management of the fund had been adequately considered by the Adviser in connection with the fee rate charged to the fund pursuant to the Management Agreement and that, to the extent in the future it were determined that material economies of scale had not been shared with the fund, the Board would seek to have those economies of scale shared with the fund.
In evaluating the Agreements, the Board considered these conclusions and determinations and also relied on its previous knowledge, gained through meetings and other interactions with the Adviser and its affiliates and the Sub-Advisers, of the Adviser and the Sub-Advisers and the services provided to the fund by the Adviser and the Sub-Advisers. The Board also relied on information received on a routine and regular basis throughout the year relating to the operations of the fund and the investment management and other services provided under the Agreements, including information on the investment performance of the fund in comparison to similar mutual funds and benchmark performance indices; general market outlook as applicable to the fund; and compliance reports. In addition, the Board’s consideration of the contractual fee arrangements for the fund had the benefit of a number of years of reviews of the Agreements for the fund, or substantially similar agreements for other BNY Mellon funds that the Board oversees, during which lengthy discussions took place between the Board and representatives of the Adviser. Certain aspects of the arrangements may receive greater scrutiny in some years than in others, and the Board’s conclusions may be based, in part, on its consideration of the fund’s arrangements, or substantially similar arrangements for other BNY Mellon funds that the Board oversees, in prior years. The Board also noted that the Adviser continued to believe that the Sub-Advisers complemented each other’s specific style of investing and that the Adviser recommended that the Board approve each Sub-Investment Advisory Agreement. The Board determined to renew the Agreements.
53
BOARD MEMBERS INFORMATION (Unaudited)
Independent Board Members
Joseph S. DiMartino (80)h
Cairman of the Board (1995)
Principal Occupation During Past 5 Years:
· Director or Trustee of funds in the BNY Mellon Family of Funds and certain other entities (as described in the fund’s Statement of Additional Information) (1995-Present)
Other Public Company Board Memberships During Past 5 Years:
· CBIZ, Inc., a public company providing professional business services, products and solutions, Director (1997-May 2023)
No. of Portfolios for which Board Member Serves: 86
———————
Joni Evans (81)
Board Member (2006)
Principal Occupation During Past 5 Years:
· www.PureWow.com, an online community dedicated to women’s conversations and publications, Chief Executive Officer (2007-2019)
· Joni Evans Ltd. publishing, Principal (2006-2019)
No. of Portfolios for which Board Member Serves: 17
———————
Joan Gulley (76)
Board Member (2017)
Principal Occupation During Past 5 Years:
· Nantucket Atheneum, public library, Chair (June 2018-June 2021) and Director (2015-June 2021)
· Orchard Island Club, golf and beach club, Governor (2016-Present) and President (February 2023-Present)
No. of Portfolios for which Board Member Serves: 39
———————
54
Alan H. Howard (64)
Board Member (2018)
Principal Occupation During Past 5 Years:
· Heathcote Advisors LLC, a financial advisory services firm, Managing Partner (2008-Present)
· Dynatech/MPX Holdings LLC, a global supplier and service provider of military aircraft parts, President (2012-May 2019); and Board Member of its two operating subsidiaries, Dynatech International LLC and Military Parts Exchange LLC (2012-December 2019), including Chief Executive Officer of an operating subsidiary, Dynatech International LLC (2013-May 2019)
· Rossoff & Co., an independent investment banking firm, Senior Advisor (2013-June 2021)
Other Public Company Board Memberships During Past 5 Years:
· Movado Group, Inc., a public company that designs, sources, markets and distributes watches, Director (1997-Present)
· Diamond Offshore Drilling, Inc., a public company that provides contract drilling services, Director (March 2020-April 2021)
No. of Portfolios for which Board Member Serves: 17
———————
Robin A. Melvin (60)
Board Member (1995)
Principal Occupation During Past 5 Years:
· Westover School, a private girls’ boarding school in Middlebury, Connecticut, Trustee (2019-June 2023)
· Mentor Illinois, a non-profit organization dedicated to increasing the quantity and quality of mentoring services in Illinois. Co-Chair (2014–March 2020); Board Member (2013-March 2020)
· JDRF, a non-profit juvenile diabetes research foundation, Board Member (June 2021-June 2022)
Other Public Company Board Memberships During Past 5 Years:
· HPS Corporate Lending Fund, a closed-end management investment company regulated as a business development company, Trustee (August 2021-Present)
No. of Portfolios for which Board Member Serves: 68
———————
Burton N. Wallack (73)
Board Member (2006)
Principal Occupation During Past 5 Years:
Wallack Management Company, a real estate management company, President and Co-owner (1987-Present)
Other Public Company Board Memberships During Past 5 Years:
Mount Sinai Hospital Urology, Board Member (2017-Present)
No. of Portfolios for which Board Member Serves: 17
———————
55
BOARD MEMBERS INFORMATION (Unaudited) (continued)
Benaree Pratt Wiley (77)
Board Member (2016)
Principal Occupation During Past 5 Years:
· The Wiley Group, a firm specializing in strategy and business development. Principal (2005-Present)
Other Public Company Board Memberships During Past 5 Years:
· CBIZ, Inc., a public company providing professional business services, products and solutions, Director (2008-Present)
· Blue Cross-Blue Shield of Massachusetts, Director (2004-December 2020)
No. of Portfolios for which Board Member Serves: 57
———————
Gordon J. Davis (81)
Advisory Board Member (2021)
Principal Occupation During Past 5 Years:
· Venable LLP, a law firm, Partner (2012-Present)
Other Public Company Board Memberships During Past 5 Years:
· BNY Mellon Family of Funds (53 funds), Board Member (1995-August 2021)
No. of Portfolios for which Advisory Board Member Serves: 39
———————
The address of the Board Members and Officers is c/o BNY Mellon Investment Adviser, Inc., 240 Greenwich Street, New York, New York 10286. Additional information about each Board Member is available in the fund’s Statement of Additional Information which can be obtained from the Adviser free of charge by calling this toll free number: 1-800-373-9387.
56
OFFICERS OF THE FUND (Unaudited)
DAVID DIPETRILLO, President since January 2021.
Vice President and Director of the Adviser since February 2021; Head of North America Distribution, BNY Mellon Investment Management since February 2023; and Head of North America Product, BNY Mellon Investment Management from January 2018 to February 2023. He is an officer of 53 investment companies (comprised of 102 portfolios) managed by the Adviser or an affiliate of the Adviser. He is 45 years old and has been an employee of BNY Mellon since 2005.
JAMES WINDELS, Treasurer since November 2001.
Director of the Adviser since February 2023; Vice President of the Adviser since September 2020; and Director–BNY Mellon Fund Administration. He is an officer of 54 investment companies (comprised of 121 portfolios) managed by the Adviser or an affiliate of the Adviser. He is 65 years old and has been an employee of the Adviser since April 1985.
PETER M. SULLIVAN, Chief Legal Officer since July 2021 and Vice President and Assistant Secretary since March 2019.
Chief Legal Officer of the Adviser and Associate General Counsel of BNY Mellon since July 2021; Senior Managing Counsel of BNY Mellon from December 2020 to July 2021; and Managing Counsel of BNY Mellon from March 2009 to December 2020. He is an officer of 54 investment companies (comprised of 121 portfolios) managed by the Adviser or an affiliate of the Adviser. He is 55 years old and has been an employee of BNY Mellon since April 2004.
JAMES BITETTO, Vice President since August 2005 and Secretary since February 2018.
Senior Managing Counsel of BNY Mellon since December 2019; Managing Counsel of BNY Mellon from April 2014 to December 2019; and Secretary of the Adviser. He is an officer of 54 investment companies (comprised of 121 portfolios) managed by the Adviser or an affiliate of the Adviser. He is 57 years old and has been an employee of the Adviser since December 1996.
DEIRDRE CUNNANE, Vice President and Assistant Secretary since March 2019.
Managing Counsel of BNY Mellon since December 2021; and Counsel of BNY Mellon from August 2018 to December 2021. She is an officer of 54 investment companies (comprised of 121 portfolios) managed by the Adviser or an affiliate of the Adviser. She is 33 years old and has been an employee of BNY Mellon since August 2013.
SARAH S. KELLEHER, Vice President and Assistant Secretary since April 2014.
Vice President of BNY Mellon ETF Investment Adviser; LLC since February 2020; Senior Managing Counsel of BNY Mellon since September 2021; and Managing Counsel of BNY Mellon from December 2017 to September 2021. She is an officer of 54 investment companies (comprised of 121 portfolios) managed by the Adviser or an affiliate of the Adviser. She is 48 years old and has been an employee of BNY Mellon since March 2013.
JEFF PRUSNOFSKY, Vice President and Assistant Secretary since August 2005.
Senior Managing Counsel of BNY Mellon. He is an officer of 54 investment companies (comprised of 121 portfolios) managed by the Adviser or an affiliate of the Adviser. He is 58 years old and has been an employee of the Adviser since October 1990.
AMANDA QUINN, Vice President and Assistant Secretary since March 2020.
Counsel of BNY Mellon since June 2019; and Regulatory Administration Manager at BNY Mellon Investment Management Services from September 2018 to May 2019. She is an officer of 54 investment companies (comprised of 121 portfolios) managed by the Adviser or an affiliate of the Adviser. She is 38 years old and has been an employee of BNY Mellon since June 2012.
JOANNE SKERRETT, Vice President and Assistant Secretary since March 2023.
Managing Counsel of BNY Mellon since June 2022; and Senior Counsel with the Mutual Fund Directors Forum, a leading funds industry organization, from 2016 to June 2022. She is an officer of 54 investment companies (comprised of 121 portfolios) managed by the Adviser or an affiliate of the Adviser. She is 51 years old and has been an employee of the Adviser since June 2022.
57
OFFICERS OF THE FUND (Unaudited) (continued)
NATALYA ZELENSKY, Vice President and Assistant Secretary since March 2017.
Chief Compliance Officer since August 2021 and Vice President since February 2020 of BNY Mellon ETF Investment Adviser, LLC; Chief Compliance Officer since August 2021 and Vice President and Assistant Secretary since February 2020 of BNY Mellon ETF Trust; Managing Counsel of BNY Mellon from December 2019 to August 2021; Counsel of BNY Mellon from May 2016 to December 2019; and Assistant Secretary of the Adviser from April 2018 to August 2021. She is an officer of 54 investment companies (comprised of 121 portfolios) managed by the Adviser or an affiliate of the Adviser. She is 38 years old and has been an employee of BNY Mellon since May 2016.
DANIEL GOLDSTEIN, Vice President since March 2022.
Head of Product Development of North America Distribution, BNY Mellon Investment Management since January 2018; Executive Vice President of North America Product, BNY Mellon Investment Management since April 2023; and Senior Vice President, Development & Oversight of North America Product, BNY Mellon Investment Management from 2010 to March 2023. He is an officer of 53 investment companies (comprised of 102 portfolios) managed by the Adviser or an affiliate of the Adviser. He is 54 years old and has been an employee of the Distributor since 1991.
JOSEPH MARTELLA, Vice President since March 2022.
Vice President of the Adviser since December 2022; Head of Product Management of North America Distribution, BNY Mellon Investment Management since January 2018; Executive Vice President of North America Product, BNY Mellon Investment Management since April 2023; and Senior Vice President of North America Product, BNY Mellon Investment Management from 2010 to March 2023. He is an officer of 53 investment companies (comprised of 102 portfolios) managed by the Adviser or an affiliate of the Adviser. He is 47 years old and has been an employee of the Distributor since 1999.
GAVIN C. REILLY, Assistant Treasurer since December 2005.
Tax Manager–BNY Mellon Fund Administration. He is an officer of 54 investment companies (comprised of 121 portfolios) managed by the Adviser or an affiliate of the Adviser. He is 55 years old and has been an employee of the Adviser since April 1991.
ROBERT SALVIOLO, Assistant Treasurer since May 2007.
Senior Accounting Manager–BNY Mellon Fund Administration. He is an officer of 54 investment companies (comprised of 121 portfolios) managed by the Adviser or an affiliate of the Adviser. He is 56 years old and has been an employee of the Adviser since June 1989.
ROBERT SVAGNA, Assistant Treasurer since August 2005.
Senior Accounting Manager–BNY Mellon Fund Administration. He is an officer of 54 investment companies (comprised of 121 portfolios) managed by the Adviser or an affiliate of the Adviser. He is 56 years old and has been an employee of the Adviser since November 1990.
JOSEPH W. CONNOLLY, Chief Compliance Officer since October 2004.
Chief Compliance Officer of the BNY Mellon Family of Funds and BNY Mellon Funds Trust since 2004; and Chief Compliance Officer of the Adviser from 2004 until June 2021. He is the Chief Compliance Officer of 53 investment companies (comprised of 105 portfolios) managed by the Adviser. He is 66 years old.
CARIDAD M. CAROSELLA, Anti-Money Laundering Compliance Officer since January 2016.
Anti-Money Laundering Compliance Officer of the BNY Mellon Family of Funds and BNY Mellon Funds Trust. She is an officer of 47 investment companies (comprised of 114 portfolios) managed by the Adviser or an affiliate of the Adviser. She is 55 years old and has been an employee of the Distributor since 1997.
58
This page intentionally left blank.
59
This page intentionally left blank.
60
This page intentionally left blank.
61
BNY Mellon Select Managers Small Cap Value Fund
240 Greenwich Street
New York, NY 10286
Adviser
BNY Mellon Investment Adviser, Inc.
240 Greenwich Street
New York, NY 10286
Sub-Advisers
Channing Capital Management, LLC
10 South LaSalle Street
Suite 2401
Chicago, IL 60633
Denali Advisors, LLC
5075 Shoreham Place, Suite #120
San Diego, CA 92122
Eastern Shore Capital Management
18 Sewall Street
Marblehead, MA 01945
Heartland Advisors, Inc.
790 North Water Street, Suite 1200
Milwaukee, WI 53202
Neuberger Berman Investment Advisers, LLC
605 Third Avenue
New York, NY 10158
Custodian
The Bank of New York Mellon
240 Greenwich Street
New York, NY 10286
Transfer Agent &
Dividend Disbursing Agent
BNY Mellon Transfer, Inc.
240 Greenwich Street
New York, NY 10286
Distributor
BNY Mellon Securities Corporation
240 Greenwich Street
New York, NY 10286
Ticker Symbols: | Class A: DMVAX Class C: DMECX Class I: DMVIX Class Y: DMVYX |
Telephone Call your financial representative or 1-800-373-9387
Mail The BNY Mellon Family of Funds, 144 Glenn Curtiss Boulevard, Uniondale, NY 11556-0144
E-mail Send your request to info@bnymellon.com
Internet Information can be viewed online or downloaded at www.im.bnymellon.com
The fund files its complete schedule of portfolio holdings with the Securities and Exchange Commission (“SEC”) for the first and third quarters of each fiscal year on Form N-PORT. The fund’s Forms N-PORT are available on the SEC’s website at www.sec.gov.
A description of the policies and procedures that the fund uses to determine how to vote proxies relating to portfolio securities and information regarding how the fund voted these proxies for the most recent 12-month period ended June 30 is available at www.im.bnymellon.com and on the SEC’s website at www.sec.gov and without charge, upon request, by calling 1-800-373-9387.
© 2024 BNY Mellon Securities Corporation |
|

BNY Mellon U.S. Equity Fund
ANNUAL REPORT November 30, 2023 |
|

IMPORTANT NOTICE – UPCOMING CHANGES TO ANNUAL AND SEMI-ANNUAL REPORTS
The Securities and Exchange Commission (the “SEC”) has adopted rule and form amendments that will result in changes to the design and delivery of annual and semi-annual fund reports (“Reports”). Beginning in July 2024, Reports will be streamlined to highlight key information. Certain information currently included in Reports, including financial statements, will no longer appear in the Reports but will be available online, delivered free of charge to shareholders upon request, and filed with the SEC.
If you previously elected to receive the fund’s Reports electronically, you will continue to do so. Otherwise, you will receive paper copies of the fund’s re-designed Reports by USPS mail in the future. If you would like to receive the fund’s Reports (and/or other communications) electronically instead of by mail, please contact your financial advisor or, if you are a direct investor, please log into your mutual fund account at www.bnymellonim.com/us and select “E-Delivery” under the Profile page. You must be registered for online account access before you can enroll in E-Delivery.
Save time. Save paper. View your next shareholder report online as soon as it’s available. Log into www.im.bnymellon.com and sign up for eCommunications. It’s simple and only takes a few minutes. |
The views expressed in this report reflect those of the portfolio manager(s) only through the end of the period covered and do not necessarily represent the views of BNY Mellon Investment Adviser, Inc. or any other person in the BNY Mellon Investment Adviser, Inc. organization. Any such views are subject to change at any time based upon market or other conditions and BNY Mellon Investment Adviser, Inc. disclaims any responsibility to update such views. These views may not be relied on as investment advice and, because investment decisions for a fund in the BNY Mellon Family of Funds are based on numerous factors, may not be relied on as an indication of trading intent on behalf of any fund in the BNY Mellon Family of Funds. |
Not FDIC-Insured • Not Bank-Guaranteed • May Lose Value |
Contents
THE FUND
Comparing Your Fund’s Expenses
Information About the Renewal of | |
FOR MORE INFORMATION
Back Cover
DISCUSSION OF FUND PERFORMANCE (Unaudited)
For the period from December 1, 2022, through November 30, 2023, as provided by Charlie Macquaker, Roy Leckie, Jane Henderson, Fraser Fox and Maxim Skorniakov, members of the Investment Executive group at Walter Scott & Partners Limited (Walter Scott), sub-adviser.
Market and Fund Performance Overview
For the 12-month period ended November 30, 2023, the BNY Mellon U.S. Equity Fund (the “fund”) produced a return of 6.88% for Class A shares, 6.07% for Class C shares, 7.18% for Class I shares and 7.23% for Class Y shares.1 In comparison, the fund’s benchmark, the MSCI USA Index (the “Index”), produced a return of 13.69% over the same period.2
U.S. stocks gained ground during the reporting period as inflationary pressures eased, the U.S. Federal Reserve (the “Fed”) reduced the pace of interest-rate hikes, and economic growth remained positive. The fund underperformed the Index largely due to unfavorable stock selection in the information technology, communication services, consumer discretionary and consumer staples sectors.
The Fund’s Investment Approach
The fund seeks long-term total return. To pursue its goal, the fund normally invests at least 80% of its net assets, plus any borrowings for investment purposes, in equity securities of companies located in the United States. The fund may invest in the securities of companies of any market capitalization. Walter Scott seeks investment opportunities in companies with fundamental strengths that indicate the potential for sustainable growth. Walter Scott focuses on individual stock selection, building the fund’s portfolio from the bottom up through extensive fundamental research. The investment process begins with the screening of reported company financials. Companies that meet certain broad, absolute and trend criteria are candidates for more detailed financial analysis. The fund’s Investment Team collectively reviews and selects those stocks that meet Walter Scott’s criteria, and where the expected growth rate is combined with a reasonable valuation for the underlying equity. Market capitalization and sector allocations are a residual of, not part of, the investment process, because the Investment Team’s sole focus is on the analysis of, and investment in, individual companies.
Equities Gain Ground as Inflation Eases
Large-cap U.S. equities gained ground during the reporting period as interest-rate hikes implemented by the Fed gained traction in the fight against inflation. Inflation decreased from more than 7% annually in November 2022 to between 3% and 4% from June through October 2023, while the federal funds rate rose by more than 2 percentage points to a range of 5.25%–5.50%. Counter to expectations, despite the rise in interest rates, economic growth remained relatively strong, bolstered by robust consumer spending and healthy corporate profits. As a result, investor expectations turned to hopes for a “soft landing,” in which the Fed would bring inflation under control without triggering a serious recession. Growth-oriented stocks performed particularly well in this environment, with market strength led by mega-cap technology-related names leveraged to advances in artificial intelligence (“AI”). Value-oriented and interest-rate-sensitive stocks underperformed, while energy stocks were undermined by declining petroleum and natural gas prices.
Market sentiment shifted late in the period, as hawkish comments from the Fed dashed hopes that the central bank might soon reverse course and begin to reduce interest rates. As investors absorbed the increasing likelihood that rates would remain higher for longer, stocks lost some of
2
their earlier gains in August, September and October, before turning positive again in November as prospects increased for rate cuts in 2024.
Stock Selection Detracts from Relative Returns
The fund lagged the Index most significantly in the information technology and communication services sectors, largely due to underweight or zero exposure to high-flying, mega-cap market leaders driven by the market’s appetite for shares in AI-related companies. Specifically, while the fund held modest positions in Microsoft Corp. and Alphabet, Inc. it lacked exposure to NVIDIA, Apple, Meta Platforms, Tesla and Amazon.com. In the consumer discretionary sector, the fund’s position in rural merchandise retailer Tractor Supply Co. lost ground as business slowed due to weakening economic conditions. Among consumer staples holdings, discount retailer Dollar General Corp. issued disappointing earnings and weak guidance, warning of softening consumer spending, while shares in personal care products maker The Estee Lauder Companies, Inc. came under pressure due to the company’s position in China, which experienced slowing growth and implemented regulatory restrictions affecting sales.
Conversely, the fund’s returns relative to the Index benefited from underweight exposure to the lagging financials sector, particularly banking stocks, which were negatively affected by industry uncertainty. Relative returns also benefited from strong stock selection in the industrials sector. Top-performing individual holdings included salvage car auction company Copart, Inc. which reported solid financial results and improving margins, as the total loss rate continues to rebound and drive a recovery in volume of salvage vehicles. Copart, Inc. continues to win market share and has been able to offset softening used car prices via the pass through of higher fees.
Focusing on High-Quality Companies with Strong Fundamentals
As of the end of the reporting period, we are starting to see the effects of the Fed’s aggressive rate hikes in various segments of the economy, with further impacts likely as companies and consumers cope with an environment of more restrictive and costly access to credit. While many companies have effectively controlled costs and continued to report reasonably strong earnings despite those pressures, we expect businesses to face increasing difficulties in meeting financial expectations in the months to come. We believe the fund’s holdings are relatively well positioned to outperform in the face of prevailing market uncertainties due to their high-quality, defensive characteristics and solid fundamentals, which enable them to operate effectively in varying economic environments. We are increasing the fund’s focus on profitability, financial resilience and on profitability, financial resilience and management quality is as strong as ever, given the challenges we expect may lie ahead.
December 15, 2023
1 Total return includes reinvestment of dividends and any capital gains paid and does not take into consideration the maximum initial sales charge in the case of Class A shares, or the applicable contingent deferred sales charge imposed on redemptions in the case of Class C shares. Share price and investment return fluctuate such that upon redemption, fund shares may be worth more or less than their original cost. The fund’s return reflects the absorption of certain fund expenses by BNY Mellon Investment Adviser, Inc. pursuant to an agreement in effect through March 31, 2024, at which time it may be extended, modified or terminated. Had these expenses not been absorbed, returns would have been lower. Past performance is no guarantee of future results.
2 Source: Lipper Inc. — The MSCI USA Index is designed to measure the performance of the large- and mid-cap segments of the U.S. market. It reflects reinvestment of net dividends and, where applicable, capital gain distributions. Investors cannot invest directly in any index.
Equities are subject generally to market, market sector, market liquidity, issuer and investment style risks, among other factors, to varying degrees, all of which are more fully described in the fund’s prospectus.
Small and midsized company stocks tend to be more volatile and less liquid than larger company stocks as these companies are less established and have more volatile earnings histories.
3
FUND PERFORMANCE (Unaudited)
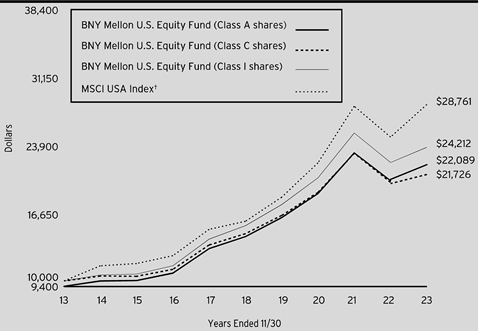
Comparison of change in value of a $10,000 investment in Class A shares, Class C shares and Class I shares of BNY Mellon U.S. Equity Fund with a hypothetical investment of $10,000 in the MSCI USA Index (the “Index”).
† Source: Lipper Inc.
Past performance is not predictive of future performance.
The above graph compares a hypothetical $10,000 investment made in each of the Class A shares, Class C shares and Class I shares of BNY Mellon U.S. Equity Fund on 11/30/13 to a hypothetical investment of $10,000 made in the Index on that date. All dividends and capital gain distributions are reinvested.
The fund’s performance shown in the line graph above takes into account the maximum initial sales charge on Class A shares and all other applicable fees and expenses on all classes. The Index is designed to measure the performance of the large- and mid-cap segments of the U.S. market. Unlike a mutual fund, the Index is not subject to charges, fees and other expenses. Investors cannot invest directly in any index. Further information relating to fund performance, including expense reimbursements, if applicable, is contained in the Financial Highlights section of the prospectus and elsewhere in this report.
4
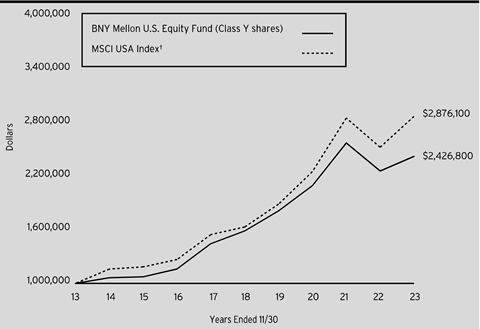
Comparison of change in value of a $1,000,000 investment in Class Y shares of BNY Mellon U.S. Equity Fund with a hypothetical investment of $1,000,000 in the MSCI USA Index (the “Index”).
† Source: Lipper Inc.
Past performance is not predictive of future performance.
The above graph compares a hypothetical $1,000,000 investment made in Class Y shares of BNY Mellon U.S. Equity Fund on 11/30/13 to a hypothetical investment of $1,000,000 made in the Index on that date. All dividends and capital gain distributions are reinvested.
The fund’s performance shown in the line graph above takes into account all other applicable fees and expenses of the fund’s Class Y shares. The Index is designed to measure the performance of the large- and mid-cap segments of the U.S. market. Unlike a mutual fund, the Index is not subject to charges, fees and other expenses. Investors cannot invest directly in any index. Further information relating to fund performance, including expense reimbursements, if applicable, is contained in the Financial Highlights section of the prospectus and elsewhere in this report.
5
FUND PERFORMANCE (Unaudited) (continued)
Average Annual Total Returns as of 11/30/2023 | ||||
| 1 Year | 5 Years | 10 Years | |
Class A shares | ||||
with maximum sales charge (5.75 %) | .73% | 7.19% | 8.25% | |
without sales charge | 6.88% | 8.47% | 8.89% | |
Class C shares | ||||
with applicable redemption charge† | 5.29% | 7.66% | 8.07% | |
without redemption | 6.07% | 7.66% | 8.07% | |
Class I shares | 7.18% | 8.82% | 9.25% | |
Class Y shares | 7.23% | 8.84% | 9.27% | |
MSCI USA Index | 13.69% | 11.97% | 11.14% | |
† The maximum contingent deferred sales charge for Class C shares is 1% for shares redeemed within one year of the date of purchase.
The performance data quoted represents past performance, which is no guarantee of future results. Share price and investment return fluctuate and an investor’s shares may be worth more or less than original cost upon redemption. Current performance may be lower or higher than the performance quoted. Go to www.im.bnymellon.com for the fund’s most recent month-end returns.
The fund’s performance shown in the graphs and table does not reflect the deduction of taxes that a shareholder would pay on fund distributions or the redemption of fund shares. In addition to the performance of Class A shares shown with and without a maximum sales charge, the fund’s performance shown in the table takes into account all other applicable fees and expenses on all classes.
6
UNDERSTANDING YOUR FUND’S EXPENSES (Unaudited)
As a mutual fund investor, you pay ongoing expenses, such as management fees and other expenses. Using the information below, you can estimate how these expenses affect your investment and compare them with the expenses of other funds. You also may pay one-time transaction expenses, including sales charges (loads) and redemption fees, which are not shown in this section and would have resulted in higher total expenses. For more information, see your fund’s prospectus or talk to your financial adviser.
Review your fund’s expenses
The table below shows the expenses you would have paid on a $1,000 investment in BNY Mellon U.S. Equity Fund from June 1, 2023 to November 30, 2023. It also shows how much a $1,000 investment would be worth at the close of the period, assuming actual returns and expenses.
Expenses and Value of a $1,000 Investment |
| |||||
Assume actual returns for the six months ended November 30, 2023 |
| |||||
|
|
|
|
|
|
|
|
| Class A | Class C | Class I | Class Y |
|
Expenses paid per $1,000† | $5.93 | $9.72 | $4.62 | $4.42 |
| |
Ending value (after expenses) | $1,023.10 | $1,019.10 | $1,024.40 | $1,024.50 |
| |
COMPARING YOUR FUND’S EXPENSES WITH THOSE OF OTHER FUNDS (Unaudited)
Using the SEC’s method to compare expenses
The Securities and Exchange Commission (“SEC”) has established guidelines to help investors assess fund expenses. Per these guidelines, the table below shows your fund’s expenses based on a $1,000 investment, assuming a hypothetical 5% annualized return. You can use this information to compare the ongoing expenses (but not transaction expenses or total cost) of investing in the fund with those of other funds. All mutual fund shareholder reports will provide this information to help you make this comparison. Please note that you cannot use this information to estimate your actual ending account balance and expenses paid during the period.
Expenses and Value of a $1,000 Investment |
| |||||
Assuming a hypothetical 5% annualized return for the six months ended November 30, 2023 |
| |||||
|
|
|
|
|
|
|
|
| Class A | Class C | Class I | Class Y |
|
Expenses paid per $1,000† | $5.92 | $9.70 | $4.61 | $4.41 |
| |
Ending value (after expenses) | $1,019.20 | $1,015.44 | $1,020.51 | $1,020.71 |
| |
† | Expenses are equal to the fund’s annualized expense ratio of 1.17% for Class A, 1.92% for Class C, .91% for Class I and .87% for Class Y, multiplied by the average account value over the period, multiplied by 183/365 (to reflect the one-half year period). | |||||
7
STATEMENT OF INVESTMENTS
November 30, 2023
Description | Shares | Value ($) | |||||
Common Stocks - 99.5% | |||||||
Capital Goods - 5.1% | |||||||
Fastenal Co. | 69,200 | 4,149,924 | |||||
Hexcel Corp. | 26,100 | 1,808,991 | |||||
The Toro Company | 33,900 | 2,813,700 | |||||
8,772,615 | |||||||
Commercial & Professional Services - 7.0% | |||||||
Automatic Data Processing, Inc. | 16,800 | 3,862,656 | |||||
Copart, Inc. | 83,000 | a | 4,168,260 | ||||
Paychex, Inc. | 32,800 | 4,000,616 | |||||
12,031,532 | |||||||
Consumer Discretionary Distribution - 6.6% | |||||||
O'Reilly Automotive, Inc. | 4,700 | a | 4,617,186 | ||||
The TJX Companies, Inc. | 39,400 | 3,471,534 | |||||
Tractor Supply Co. | 16,800 | 3,410,568 | |||||
11,499,288 | |||||||
Consumer Durables & Apparel - 2.0% | |||||||
NIKE, Inc., Cl. B | 31,600 | 3,484,532 | |||||
Consumer Services - 3.8% | |||||||
Booking Holdings, Inc. | 960 | a | 3,000,672 | ||||
McDonald's Corp. | 12,400 | 3,494,816 | |||||
6,495,488 | |||||||
Consumer Staples Distribution - 2.9% | |||||||
Costco Wholesale Corp. | 8,400 | 4,979,016 | |||||
Financial Services - 9.3% | |||||||
Jack Henry & Associates, Inc. | 22,600 | 3,586,394 | |||||
Mastercard, Inc., Cl. A | 10,100 | 4,179,683 | |||||
Moody's Corp. | 14,300 | 5,218,928 | |||||
Visa, Inc., Cl. A | 12,200 | b | 3,131,496 | ||||
16,116,501 | |||||||
Health Care Equipment & Services - 12.3% | |||||||
Align Technology, Inc. | 9,400 | a | 2,009,720 | ||||
Edwards Lifesciences Corp. | 69,600 | a | 4,712,616 | ||||
Intuitive Surgical, Inc. | 13,800 | a | 4,289,592 | ||||
ResMed, Inc. | 32,500 | 5,126,225 | |||||
Stryker Corp. | 17,100 | 5,067,243 | |||||
21,205,396 | |||||||
Household & Personal Products - 1.8% | |||||||
The Estee Lauder Companies, Inc., Cl. A | 24,300 | 3,102,867 | |||||
Materials - 3.7% | |||||||
Ecolab, Inc. | 9,400 | 1,802,262 | |||||
Linde PLC | 11,100 | 4,592,847 | |||||
6,395,109 | |||||||
8
Description | Shares | Value ($) | |||||
Common Stocks - 99.5% (continued) | |||||||
Media & Entertainment - 7.3% | |||||||
Alphabet, Inc., Cl. C | 59,320 | a | 7,944,134 | ||||
Netflix, Inc. | 4,200 | a | 1,990,674 | ||||
The Walt Disney Company | 29,700 | 2,752,893 | |||||
12,687,701 | |||||||
Pharmaceuticals, Biotechnology & Life Sciences - 9.4% | |||||||
Eli Lilly & Co. | 6,250 | 3,694,000 | |||||
Mettler-Toledo International, Inc. | 3,900 | a | 4,258,527 | ||||
Waters Corp. | 12,400 | a | 3,479,564 | ||||
West Pharmaceutical Services, Inc. | 13,900 | 4,875,564 | |||||
16,307,655 | |||||||
Semiconductors & Semiconductor Equipment - 3.0% | |||||||
Texas Instruments, Inc. | 33,700 | 5,146,327 | |||||
Software & Services - 15.5% | |||||||
Adobe, Inc. | 7,900 | a | 4,826,979 | ||||
Ansys, Inc. | 12,400 | a | 3,637,664 | ||||
Cognizant Technology Solutions Corp., Cl. A | 48,900 | 3,441,582 | |||||
Fortinet, Inc. | 67,700 | a | 3,558,312 | ||||
Manhattan Associates, Inc. | 15,500 | a | 3,457,275 | ||||
Microsoft Corp. | 20,700 | 7,843,437 | |||||
26,765,249 | |||||||
Technology Hardware & Equipment - 7.4% | |||||||
Amphenol Corp., Cl. A | 53,700 | 4,886,163 | |||||
Cisco Systems, Inc. | 55,800 | 2,699,604 | |||||
Cognex Corp. | 48,300 | 1,820,910 | |||||
IPG Photonics Corp. | 18,100 | a | 1,733,256 | ||||
Keysight Technologies, Inc. | 12,550 | a | 1,705,420 | ||||
12,845,353 | |||||||
Transportation - 2.4% | |||||||
Old Dominion Freight Line, Inc. | 10,900 | 4,240,754 | |||||
Total Common Stocks (cost $77,492,745) | 172,075,383 | ||||||
9
STATEMENT OF INVESTMENTS (continued)
Description | 1-Day | Shares | Value ($) | ||||
Investment Companies - .1% | |||||||
Registered Investment Companies - .1% | |||||||
Dreyfus Institutional Preferred Government Plus Money Market Fund, Institutional Shares | 5.41 | 91,962 | c | 91,962 | |||
Total Investments (cost $77,584,707) | 99.6% | 172,167,345 | |||||
Cash and Receivables (Net) | .4% | 770,637 | |||||
Net Assets | 100.0% | 172,937,982 | |||||
a Non-income producing security.
b Security, or portion thereof, on loan. At November 30, 2023, the value of the fund’s securities on loan was $3,100,181 and the value of the collateral was $3,141,933, consisting of U.S. Government & Agency securities. In addition, the value of collateral may include pending sales that are also on loan.
c Investment in affiliated issuer. The investment objective of this investment company is publicly available and can be found within the investment company’s prospectus.
Portfolio Summary (Unaudited) † | Value (%) |
Information Technology | 25.9 |
Health Care | 21.7 |
Industrials | 14.5 |
Consumer Discretionary | 12.4 |
Financials | 9.3 |
Communication Services | 7.3 |
Consumer Staples | 4.7 |
Materials | 3.7 |
Investment Companies | .1 |
99.6 |
† Based on net assets.
See notes to financial statements.
Affiliated Issuers | ||||||
Description | Value ($) 11/30/2022 | Purchases ($)† | Sales ($) | Value ($) 11/30/2023 | Dividends/ | |
Registered Investment Companies - .1% | ||||||
Dreyfus Institutional Preferred Government Plus Money Market Fund, Institutional Shares - .1% | 12,802 | 122,149,477 | (122,070,317) | 91,962 | 142,384 | |
† Includes reinvested dividends/distributions.
See notes to financial statements.
10
STATEMENT OF ASSETS AND LIABILITIES
November 30, 2023
|
|
|
|
|
|
|
|
|
| Cost |
| Value |
|
Assets ($): |
|
|
|
| ||
Investments in securities—See Statement of Investments |
|
|
| |||
Unaffiliated issuers | 77,492,745 |
| 172,075,383 |
| ||
Affiliated issuers |
| 91,962 |
| 91,962 |
| |
Receivable for investment securities sold |
| 6,065,384 |
| |||
Receivable for shares of Common Stock subscribed |
| 2,135,937 |
| |||
Dividends and securities lending income receivable |
| 145,480 |
| |||
Prepaid expenses |
|
|
|
| 27,524 |
|
|
|
|
|
| 180,541,670 |
|
Liabilities ($): |
|
|
|
| ||
Due to BNY Mellon Investment Adviser, Inc. and affiliates—Note 3(c) |
| 144,036 |
| |||
Payable for shares of Common Stock redeemed |
| 3,761,233 |
| |||
Note payable—Note 2 |
| 3,600,000 |
| |||
Interest payable—Note 2 |
| 18,309 |
| |||
Directors’ fees and expenses payable |
| 5,000 |
| |||
Other accrued expenses |
|
|
|
| 75,110 |
|
|
|
|
|
| 7,603,688 |
|
Net Assets ($) |
|
| 172,937,982 |
| ||
Composition of Net Assets ($): |
|
|
|
| ||
Paid-in capital |
|
|
|
| (12,888,807) |
|
Total distributable earnings (loss) |
|
|
|
| 185,826,789 |
|
Net Assets ($) |
|
| 172,937,982 |
| ||
Net Asset Value Per Share | Class A | Class C | Class I | Class Y |
|
Net Assets ($) | 1,700,996 | 30,721 | 18,451,964 | 152,754,301 |
|
Shares Outstanding | 93,525 | 1,988 | 999,802 | 8,286,075 |
|
Net Asset Value Per Share ($) | 18.19 | 15.45 | 18.46 | 18.44 |
|
|
|
|
|
|
|
See notes to financial statements. |
|
|
|
|
|
11
STATEMENT OF OPERATIONS
Year Ended November 30, 2023
|
|
|
|
|
|
|
|
|
|
|
|
|
|
Investment Income ($): |
|
|
|
| ||
Income: |
|
|
|
| ||
Cash dividends: |
| |||||
Unaffiliated issuers |
|
| 2,691,013 |
| ||
Affiliated issuers |
|
| 142,384 |
| ||
Income from securities lending—Note 1(b) |
|
| 4,755 |
| ||
Total Income |
|
| 2,838,152 |
| ||
Expenses: |
|
|
|
| ||
Management fee—Note 3(a) |
|
| 2,339,857 |
| ||
Professional fees |
|
| 91,162 |
| ||
Registration fees |
|
| 72,781 |
| ||
Prospectus and shareholders’ reports |
|
| 38,440 |
| ||
Directors’ fees and expenses—Note 3(d) |
|
| 32,259 |
| ||
Interest expense—Note 2 |
|
| 24,890 |
| ||
Chief Compliance Officer fees—Note 3(c) |
|
| 20,855 |
| ||
Shareholder servicing costs—Note 3(c) |
|
| 14,285 |
| ||
Custodian fees—Note 3(c) |
|
| 7,677 |
| ||
Loan commitment fees—Note 2 |
|
| 5,909 |
| ||
Distribution fees—Note 3(b) |
|
| 218 |
| ||
Miscellaneous |
|
| 25,300 |
| ||
Total Expenses |
|
| 2,673,633 |
| ||
Less—reduction in expenses due to undertaking—Note 3(a) |
|
| (1,653) |
| ||
Less—reduction in fees due to earnings credits—Note 3(c) |
|
| (2,375) |
| ||
Net Expenses |
|
| 2,669,605 |
| ||
Net Investment Income |
|
| 168,547 |
| ||
Realized and Unrealized Gain (Loss) on Investments—Note 4 ($): |
|
| ||||
Net realized gain (loss) on investments | 157,913,692 |
| ||||
Net change in unrealized appreciation (depreciation) on investments | (138,441,375) |
| ||||
Net Realized and Unrealized Gain (Loss) on Investments |
|
| 19,472,317 |
| ||
Net Increase in Net Assets Resulting from Operations |
| 19,640,864 |
| |||
|
|
|
|
|
|
|
See notes to financial statements. | ||||||
12
STATEMENT OF CHANGES IN NET ASSETS
|
|
|
| Year Ended November 30, | |||||
|
|
|
| 2023 |
| 2022 |
| ||
Operations ($): |
|
|
|
|
|
|
|
| |
Net investment income |
|
| 168,547 |
|
|
| 673,568 |
| |
Net realized gain (loss) on investments |
| 157,913,692 |
|
|
| 124,845,371 |
| ||
Net change in unrealized appreciation |
| (138,441,375) |
|
|
| (206,244,903) |
| ||
Net Increase (Decrease) in Net Assets | 19,640,864 |
|
|
| (80,725,964) |
| |||
Distributions ($): |
| ||||||||
Distributions to shareholders: |
|
|
|
|
|
|
|
| |
Class A |
|
| (397,664) |
|
|
| (257,595) |
| |
Class C |
|
| (4,192) |
|
|
| (4,667) |
| |
Class I |
|
| (5,389,418) |
|
|
| (4,396,588) |
| |
Class Y |
|
| (94,895,735) |
|
|
| (86,574,572) |
| |
Total Distributions |
|
| (100,687,009) |
|
|
| (91,233,422) |
| |
Capital Stock Transactions ($): |
| ||||||||
Net proceeds from shares sold: |
|
|
|
|
|
|
|
| |
Class A |
|
| 483,342 |
|
|
| 272,114 |
| |
Class C |
|
| 21,546 |
|
|
| - |
| |
Class I |
|
| 7,437,022 |
|
|
| 14,958,564 |
| |
Class Y |
|
| 10,355,991 |
|
|
| 65,687,656 |
| |
Distributions reinvested: |
|
|
|
|
|
|
|
| |
Class A |
|
| 337,991 |
|
|
| 232,055 |
| |
Class C |
|
| 1,557 |
|
|
| 2,840 |
| |
Class I |
|
| 4,731,943 |
|
|
| 3,476,970 |
| |
Class Y |
|
| 41,932,567 |
|
|
| 38,736,237 |
| |
Cost of shares redeemed: |
|
|
|
|
|
|
|
| |
Class A |
|
| (486,054) |
|
|
| (434,621) |
| |
Class C |
|
| (1,556) |
|
|
| (16,464) |
| |
Class I |
|
| (13,616,499) |
|
|
| (19,666,201) |
| |
Class Y |
|
| (267,605,116) |
|
|
| (213,592,453) |
| |
Increase (Decrease) in Net Assets | (216,407,266) |
|
|
| (110,343,303) |
| |||
Total Increase (Decrease) in Net Assets | (297,453,411) |
|
|
| (282,302,689) |
| |||
Net Assets ($): |
| ||||||||
Beginning of Period |
|
| 470,391,393 |
|
|
| 752,694,082 |
| |
End of Period |
|
| 172,937,982 |
|
|
| 470,391,393 |
| |
13
STATEMENT OF CHANGES IN NET ASSETS (continued)
|
|
|
| Year Ended November 30, | |||||
|
|
|
| 2023 |
| 2022 |
| ||
Capital Share Transactions (Shares): |
| ||||||||
Class Aa |
|
|
|
|
|
|
|
| |
Shares sold |
|
| 27,560 |
|
|
| 11,441 |
| |
Shares issued for distributions reinvested |
|
| 19,001 |
|
|
| 8,864 |
| |
Shares redeemed |
|
| (27,173) |
|
|
| (18,629) |
| |
Net Increase (Decrease) in Shares Outstanding | 19,388 |
|
|
| 1,676 |
| |||
Class C |
|
|
|
|
|
|
|
| |
Shares sold |
|
| 1,470 |
|
|
| - |
| |
Shares issued for distributions reinvested |
|
| 105 |
|
|
| 121 |
| |
Shares redeemed |
|
| (106) |
|
|
| (910) |
| |
Net Increase (Decrease) in Shares Outstanding | 1,469 |
|
|
| (789) |
| |||
Class Ia |
|
|
|
|
|
|
|
| |
Shares sold |
|
| 404,066 |
|
|
| 622,732 |
| |
Shares issued for distributions reinvested |
|
| 262,422 |
|
|
| 132,097 |
| |
Shares redeemed |
|
| (751,307) |
|
|
| (861,065) |
| |
Net Increase (Decrease) in Shares Outstanding | (84,819) |
|
|
| (106,236) |
| |||
Class Ya |
|
|
|
|
|
|
|
| |
Shares sold |
|
| 568,321 |
|
|
| 3,051,454 |
| |
Shares issued for distributions reinvested |
|
| 2,330,867 |
|
|
| 1,470,926 |
| |
Shares redeemed |
|
| (14,529,698) |
|
|
| (9,381,933) |
| |
Net Increase (Decrease) in Shares Outstanding | (11,630,510) |
|
|
| (4,859,553) |
| |||
|
|
|
|
|
|
|
|
|
|
a | During the period ended November 30, 2023, 284,195 Class Y shares representing $5,225,801 were exchanged for 283,860 Class I shares. During the period ended November 30, 2022, 585,474 Class Y shares representing $14,126,479 were exchanged for 584,953 Class I shares and 6,365 Class Y shares representing $159,598 were exchanged for 6,409 Class A shares. | ||||||||
See notes to financial statements. | |||||||||
14
FINANCIAL HIGHLIGHTS
The following tables describe the performance for each share class for the fiscal periods indicated. All information (except portfolio turnover rate) reflects financial results for a single fund share. Net asset value total return is calculated assuming an initial investment made at the net asset value at the beginning of the period, reinvestment of all dividends and distributions at net asset value during the period, and redemption at net asset value on the last day of the period. Net asset value total return includes adjustments in accordance with accounting principles generally accepted in the United States of America and as such, the net asset value for financial reporting purposes and the returns based upon those net asset values may differ from the net asset value and returns for shareholder transactions. These figures have been derived from the fund’s financial statements.
Year Ended November 30, | ||||||
Class A Shares | 2023 | 2022 | 2021 | 2020 | 2019 | |
Per Share Data ($): | ||||||
Net asset value, beginning of period | 22.11 | 28.74 | 23.75 | 20.85 | 20.44 | |
Investment Operations: | ||||||
Net investment income (loss)a | (.04) | (.05) | (.05) | .00b | .04 | |
Net realized and unrealized | 1.20 | (3.06) | 5.32 | 3.16 | 2.30 | |
Total from Investment Operations | 1.16 | (3.11) | 5.27 | 3.16 | 2.34 | |
Distributions: | ||||||
Dividends from net | - | - | (.03) | (.07) | (.03) | |
Dividends from net realized | (5.08) | (3.52) | (.25) | (.19) | (1.90) | |
Total Distributions | (5.08) | (3.52) | (.28) | (.26) | (1.93) | |
Net asset value, end of period | 18.19 | 22.11 | 28.74 | 23.75 | 20.85 | |
Total Return (%)c | 6.88 | (12.50) | 22.41 | 15.28 | 13.77 | |
Ratios/Supplemental Data (%): | ||||||
Ratio of total expenses | 1.24 | 1.19 | 1.15 | 1.17 | 1.20 | |
Ratio of net expenses | 1.16 | 1.15 | 1.15 | 1.15 | 1.15 | |
Ratio of net investment income (loss) | (.24) | (.23) | (.20) | .02 | .20 | |
Portfolio Turnover Rate | 4.83 | 10.61 | 10.70 | 11.94 | 14.11 | |
Net Assets, end of period ($ x 1,000) | 1,701 | 1,639 | 2,082 | 1,720 | 1,540 | |
a Based on average shares outstanding.
b Amount represents less than $.01 per share.
c Exclusive of sales charge.
See notes to financial statements.
15
FINANCIAL HIGHLIGHTS (continued)
Year Ended November 30, | ||||||
Class C Shares | 2023 | 2022 | 2021 | 2020 | 2019 | |
Per Share Data ($): | ||||||
Net asset value, beginning of period | 19.66 | 26.10 | 21.74 | 19.18 | 19.07 | |
Investment Operations: | ||||||
Net investment (loss)a | (.15) | (.22) | (.19) | (.14) | (.10) | |
Net realized and unrealized | 1.02 | (2.70) | 4.80 | 2.89 | 2.11 | |
Total from Investment Operations | .87 | (2.92) | 4.61 | 2.75 | 2.01 | |
Distributions: | ||||||
Dividends from net realized | (5.08) | (3.52) | (.25) | (.19) | (1.90) | |
Net asset value, end of period | 15.45 | 19.66 | 26.10 | 21.74 | 19.18 | |
Total Return (%)b | 6.07 | (13.12) | 21.42 | 14.44 | 12.92 | |
Ratios/Supplemental Data (%): | ||||||
Ratio of total expenses | 2.71 | 2.40 | 2.34 | 2.35 | 2.40 | |
Ratio of net expenses | 1.91 | 1.90 | 1.90 | 1.90 | 1.90 | |
Ratio of net investment (loss) | (.97) | (1.01) | (.81) | (.72) | (.56) | |
Portfolio Turnover Rate | 4.83 | 10.61 | 10.70 | 11.94 | 14.11 | |
Net Assets, end of period ($ x 1,000) | 31 | 10 | 34 | 107 | 121 | |
a Based on average shares outstanding.
b Exclusive of sales charge.
See notes to financial statements.
16
Year Ended November 30, | ||||||
Class I Shares | 2023 | 2022 | 2021 | 2020 | 2019 | |
Per Share Data ($): | ||||||
Net asset value, beginning of period | 22.34 | 28.92 | 23.89 | 20.94 | 20.54 | |
Investment Operations: | ||||||
Net investment incomea | .01 | .02 | .03 | .08 | .10 | |
Net realized and unrealized | 1.22 | (3.07) | 5.34 | 3.17 | 2.31 | |
Total from Investment Operations | 1.23 | (3.05) | 5.37 | 3.25 | 2.41 | |
Distributions: | ||||||
Dividends from net | (.03) | (.01) | (.09) | (.11) | (.11) | |
Dividends from net realized | (5.08) | (3.52) | (.25) | (.19) | (1.90) | |
Total Distributions | (5.11) | (3.53) | (.34) | (.30) | (2.01) | |
Net asset value, end of period | 18.46 | 22.34 | 28.92 | 23.89 | 20.94 | |
Total Return (%) | 7.18 | (12.19) | 22.75 | 15.71 | 14.17 | |
Ratios/Supplemental Data (%): | ||||||
Ratio of total expenses | .89 | .83 | .81 | .82 | .82 | |
Ratio of net expenses | .89 | .83 | .81 | .82 | .82 | |
Ratio of net investment income | .03 | .09 | .12 | .36 | .53 | |
Portfolio Turnover Rate | 4.83 | 10.61 | 10.70 | 11.94 | 14.11 | |
Net Assets, end of period ($ x 1,000) | 18,452 | 24,227 | 34,445 | 24,508 | 26,577 | |
a Based on average shares outstanding.
b Amount represents less than $.01 per share.
See notes to financial statements.
17
FINANCIAL HIGHLIGHTS (continued)
Year Ended November 30, | ||||||
Class Y Shares | 2023 | 2022 | 2021 | 2020 | 2019 | |
Per Share Data ($): | ||||||
Net asset value, beginning of period | 22.32 | 28.90 | 23.87 | 20.93 | 20.54 | |
Investment Operations: | ||||||
Net investment incomea | .01 | .03 | .04 | .08 | .11 | |
Net realized and unrealized | 1.22 | (3.07) | 5.33 | 3.17 | 2.29 | |
Total from Investment Operations | 1.23 | (3.04) | 5.37 | 3.25 | 2.40 | |
Distributions: | ||||||
Dividends from net | (.03) | (.02) | (.09) | (.12) | (.11) | |
Dividends from net realized | (5.08) | (3.52) | (.25) | (.19) | (1.90) | |
Total Distributions | (5.11) | (3.54) | (.34) | (.31) | (2.01) | |
Net asset value, end of period | 18.44 | 22.32 | 28.90 | 23.87 | 20.93 | |
Total Return (%) | 7.23 | (12.18) | 22.80 | 15.69 | 14.15 | |
Ratios/Supplemental Data (%): | ||||||
Ratio of total expenses | .85 | .80 | .79 | .80 | .80 | |
Ratio of net expenses | .85 | .80 | .79 | .80 | .80 | |
Ratio of net investment income | .06 | .12 | .16 | .37 | .55 | |
Portfolio Turnover Rate | 4.83 | 10.61 | 10.70 | 11.94 | 14.11 | |
Net Assets, end of period ($ x 1,000) | 152,754 | 444,516 | 716,133 | 725,418 | 619,812 | |
a Based on average shares outstanding.
See notes to financial statements.
18
NOTES TO FINANCIAL STATEMENTS
NOTE 1—Significant Accounting Policies:
BNY Mellon U.S. Equity Fund (the “fund”) is a separate diversified series of BNY Mellon Strategic Funds, Inc. (the “Company”), which is registered under the Investment Company Act of 1940, as amended (the “Act”), as an open-end management investment company and operates as a series company currently offering six series, including the fund. The fund’s investment objective is to seek long-term total return. BNY Mellon Investment Adviser, Inc. (the “Adviser”), a wholly-owned subsidiary of The Bank of New York Mellon Corporation (“BNY Mellon”), serves as the fund’s investment adviser. Walter Scott & Partners Limited (the “Sub-Adviser”), an indirect wholly-owned subsidiary of BNY Mellon and an affiliate of the Adviser, serves as the fund’s sub-adviser.
BNY Mellon Securities Corporation (the “Distributor”), a wholly-owned subsidiary of the Adviser, is the distributor of fund’s shares. The fund is authorized to issue 500 million shares of $.001 par value Common Stock. The fund currently has authorized four classes of shares: Class A (100 million shares authorized), Class C (100 million shares authorized), Class I (100 million shares authorized) and Class Y (200 million shares authorized). Class A and Class C shares are sold primarily to retail investors through financial intermediaries and bear Distribution and/or Shareholder Services Plan fees. Class A shares generally are subject to a sales charge imposed at the time of purchase. Class A shares bought without an initial sales charge as part of an investment of $1 million or more may be charged a contingent deferred sales charge (“CDSC”) of 1.00% if redeemed within one year. Class C shares are subject to a CDSC imposed on Class C shares redeemed within one year of purchase. Class C shares automatically convert to Class A shares eight years after the date of purchase, without the imposition of a sales charge. Class I shares are sold primarily to bank trust departments and other financial service providers (including BNY Mellon and its affiliates), acting on behalf of customers having a qualified trust or an investment account or relationship at such institution, and bear no Distribution or Shareholder Services Plan fees. Class Y shares are sold at net asset value per share generally to institutional investors, and bear no Distribution or Shareholder Services Plan fees. Class I and Class Y shares are offered without a front-end sales charge or CDSC. Other differences between the classes include the services offered to and the expenses borne by each class, the allocation of certain transfer agency costs and certain voting rights. Income, expenses (other than expenses attributable to a specific class), and realized and unrealized gains or losses
19
NOTES TO FINANCIAL STATEMENTS (continued)
on investments are allocated to each class of shares based on its relative net assets.
The Company accounts separately for the assets, liabilities and operations of each series. Expenses directly attributable to each series are charged to that series’ operations; expenses which are applicable to all series are allocated among them on a pro rata basis.
The Financial Accounting Standards Board (“FASB”) Accounting Standards Codification (“ASC”) is the exclusive reference of authoritative U.S. generally accepted accounting principles (“GAAP”) recognized by the FASB to be applied by nongovernmental entities. Rules and interpretive releases of the SEC under authority of federal laws are also sources of authoritative GAAP for SEC registrants. The fund is an investment company and applies the accounting and reporting guidance of the FASB ASC Topic 946 Financial Services-Investment Companies. The fund’s financial statements are prepared in accordance with GAAP, which may require the use of management estimates and assumptions. Actual results could differ from those estimates.
The Company enters into contracts that contain a variety of indemnifications. The fund’s maximum exposure under these arrangements is unknown. The fund does not anticipate recognizing any loss related to these arrangements.
(a) Portfolio valuation: The fair value of a financial instrument is the amount that would be received to sell an asset or paid to transfer a liability in an orderly transaction between market participants at the measurement date (i.e., the exit price). GAAP establishes a fair value hierarchy that prioritizes the inputs of valuation techniques used to measure fair value. This hierarchy gives the highest priority to unadjusted quoted prices in active markets for identical assets or liabilities (Level 1 measurements) and the lowest priority to unobservable inputs (Level 3 measurements).
Additionally, GAAP provides guidance on determining whether the volume and activity in a market has decreased significantly and whether such a decrease in activity results in transactions that are not orderly. GAAP requires enhanced disclosures around valuation inputs and techniques used during annual and interim periods.
Various inputs are used in determining the value of the fund’s investments relating to fair value measurements. These inputs are summarized in the three broad levels listed below:
Level 1—unadjusted quoted prices in active markets for identical investments.
20
Level 2—other significant observable inputs (including quoted prices for similar investments, interest rates, prepayment speeds, credit risk, etc.).
Level 3—significant unobservable inputs (including the fund’s own assumptions in determining the fair value of investments).
The inputs or methodology used for valuing securities are not necessarily an indication of the risk associated with investing in those securities.
Changes in valuation techniques may result in transfers in or out of an assigned level within the disclosure hierarchy. Valuation techniques used to value the fund’s investments are as follows:
The Company’s Board of Directors (the “Board”) has designated the Adviser as the fund’s valuation designee to make all fair value determinations with respect to the fund’s portfolio investments, subject to the Board’s oversight and pursuant to Rule 2a-5 under the Act.
Investments in equity securities are valued at the last sales price on the securities exchange or national securities market on which such securities are primarily traded. Securities listed on the National Market System for which market quotations are available are valued at the official closing price or, if there is no official closing price that day, at the last sales price. For open short positions, asked prices are used for valuation purposes. Bid price is used when no asked price is available. Registered investment companies that are not traded on an exchange are valued at their net asset value. All of the preceding securities are generally categorized within Level 1 of the fair value hierarchy.
Securities not listed on an exchange or the national securities market, or securities for which there were no transactions, are valued at the average of the most recent bid and asked prices. These securities are generally categorized within Level 2 of the fair value hierarchy.
Fair valuing of securities may be determined with the assistance of a pricing service using calculations based on indices of domestic securities and other appropriate indicators, such as prices of relevant American Depositary Receipts and futures. Utilizing these techniques may result in transfers between Level 1 and Level 2 of the fair value hierarchy.
When market quotations or official closing prices are not readily available, or are determined not to accurately reflect fair value, such as when the value of a security has been significantly affected by events after the close of the exchange or market on which the security is principally traded, but before the fund calculates its net asset value, the fund may value these investments at fair value as determined in accordance with the procedures
21
NOTES TO FINANCIAL STATEMENTS (continued)
approved by the Board. Certain factors may be considered when fair valuing investments such as: fundamental analytical data, the nature and duration of restrictions on disposition, an evaluation of the forces that influence the market in which the securities are purchased and sold, and public trading in similar securities of the issuer or comparable issuers. These securities are either categorized within Level 2 or 3 of the fair value hierarchy depending on the relevant inputs used.
For securities where observable inputs are limited, assumptions about market activity and risk are used and such securities are generally categorized within Level 3 of the fair value hierarchy.
The following is a summary of the inputs used as of November 30, 2023 in valuing the fund’s investments:
Level 1-Unadjusted Quoted Prices | Level 2- Other Significant Observable Inputs | Level 3-Significant Unobservable Inputs | Total | |||
Assets ($) | ||||||
Investments in Securities:† | ||||||
Equity Securities - Common Stocks | 172,075,383 | - | - | 172,075,383 | ||
Investment Companies | 91,962 | - | - | 91,962 | ||
† See Statement of Investments for additional detailed categorizations, if any.
(b) Securities transactions and investment income: Securities transactions are recorded on a trade date basis. Realized gains and losses from securities transactions are recorded on the identified cost basis. Dividend income is recognized on the ex-dividend date and interest income, including, where applicable, accretion of discount and amortization of premium on investments, is recognized on the accrual basis.
Pursuant to a securities lending agreement with BNY Mellon, the fund may lend securities to qualified institutions. It is the fund’s policy that, at origination, all loans are secured by collateral of at least 102% of the value of U.S. securities loaned and 105% of the value of foreign securities loaned. Collateral equivalent to at least 100% of the market value of securities on loan is maintained at all times. Collateral is either in the form of cash, which can be invested in certain money market mutual funds managed by the Adviser, or U.S. Government and Agency securities. Any non-cash collateral received cannot be sold or re-pledged by the fund, except in the event of borrower default. The securities on loan, if any, are also disclosed in the fund’s Statement of Investments. The fund is entitled to receive all dividends, interest and distributions on securities loaned, in
22
addition to income earned as a result of the lending transaction. Should a borrower fail to return the securities in a timely manner, BNY Mellon is required to replace the securities for the benefit of the fund or credit the fund with the market value of the unreturned securities and is subrogated to the fund’s rights against the borrower and the collateral. Additionally, the contractual maturity of security lending transactions are on an overnight and continuous basis. During the period ended November 30, 2023, BNY Mellon earned $648 from the lending of the fund’s portfolio securities, pursuant to the securities lending agreement.
For financial reporting purposes, the fund elects not to offset assets and liabilities subject to a securities lending agreement, if any, in the Statement of Assets and Liabilities. Therefore, all qualifying transactions are presented on a gross basis in the Statement of Assets and Liabilities. As of November 30, 2023, the fund had securities lending and the impact of netting of assets and liabilities and the offsetting of collateral pledged or received, if any, based on contractual netting/set-off provisions in the securities lending agreement are detailed in the following table:
|
|
| Assets ($) |
| Liabilities ($) |
|
Securities Lending |
| 3,100,181 |
| - |
| |
Total gross amount of assets and |
| 3,100,181 |
| - |
| |
Collateral (received)/posted not offset |
| (3,100,181) | 1 | - |
| |
Net amount |
| - |
| - |
| |
1 | The value of the related collateral received by the fund normally exceeded the value of the securities loaned by the fund pursuant to the securities lending agreement. In addition, the value of collateral may include pending sales that are also on loan. See Statement of Investments for detailed information regarding collateral received for open securities lending. | |||||
(c) Affiliated issuers: Investments in other investment companies advised by the Adviser are considered “affiliated” under the Act.
(d) Market Risk: The value of the securities in which the fund invests may be affected by political, regulatory, economic and social developments, and developments that impact specific economic sectors, industries or segments of the market. In addition, turbulence in financial markets and reduced liquidity in equity, credit and/or fixed-income markets may negatively affect many issuers, which could adversely affect the fund. Global economies and financial markets are becoming increasingly interconnected, and conditions and events in one country, region or financial market may adversely impact issuers in a different country, region or financial market. These risks may be magnified if certain events or
23
NOTES TO FINANCIAL STATEMENTS (continued)
developments adversely interrupt the global supply chain; in these and other circumstances, such risks might affect companies world-wide.
(e) Dividends and distributions to shareholders: Dividends and distributions are recorded on the ex-dividend date. Dividends from net investment income and dividends from net realized capital gains, if any, are normally declared and paid annually, but the fund may make distributions on a more frequent basis to comply with the distribution requirements of the Internal Revenue Code of 1986, as amended (the “Code”). To the extent that net realized capital gains can be offset by capital loss carryovers, it is the policy of the fund not to distribute such gains. Income and capital gain distributions are determined in accordance with income tax regulations, which may differ from GAAP.
(f) Federal income taxes: It is the policy of the fund to continue to qualify as a regulated investment company, if such qualification is in the best interests of its shareholders, by complying with the applicable provisions of the Code, and to make distributions of taxable income and net realized capital gain sufficient to relieve it from substantially all federal income and excise taxes.
As of and during the period ended November 30, 2023, the fund did not have any liabilities for any uncertain tax positions. The fund recognizes interest and penalties, if any, related to uncertain tax positions as income tax expense in the Statement of Operations. During the period ended November 30, 2023, the fund did not incur any interest or penalties.
Each tax year in the four-year period ended November 30, 2023 remains subject to examination by the Internal Revenue Service and state taxing authorities.
At November 30, 2023, the components of accumulated earnings on a tax basis were as follows: undistributed ordinary income $166,035, undistributed capital gains $91,601,444 and unrealized appreciation $94,059,310.
The tax character of distributions paid to shareholders during the fiscal years ended November 30, 2023 and November 30, 2022 were as follows: ordinary income $670,133 and $11,710,883, and long-term capital gains $100,016,876 and $79,522,539, respectively.
During the period ended November 30, 2023, as a result of permanent book to tax differences, primarily due to the tax treatment for treating a portion of the proceeds from redemptions as a distribution for tax purposes, the fund decreased total distributable earnings (loss) by
24
$66,284,390 and increased paid-in-capital by the same amount. Net assets and net asset value per share were not affected by this reclassification.
NOTE 2—Bank Lines of Credit:
The fund participates with other long-term open-end funds managed by the Adviser in a $738 million unsecured credit facility led by Citibank, N.A. (the “Citibank Credit Facility”) and a $300 million unsecured credit facility provided by BNY Mellon (the “BNYM Credit Facility”), each to be utilized primarily for temporary or emergency purposes, including the financing of redemptions (each, a “Facility”). The Citibank Credit Facility is available in two tranches: (i) Tranche A is in an amount equal to $618 million and is available to all long-term open-ended funds, including the fund, and (ii) Tranche B is an amount equal to $120 million and is available only to BNY Mellon Floating Rate Income Fund, a series of BNY Mellon Investment Funds IV, Inc. Prior to September 27, 2023, the Citibank Credit Facility was $823.5 million with Tranche A available in an amount equal to $688.5 million and Tranche B available in an amount equal to $135 million. In connection therewith, the fund has agreed to pay its pro rata portion of commitment fees for Tranche A of the Citibank Credit Facility and the BNYM Credit Facility. Interest is charged to the fund based on rates determined pursuant to the terms of the respective Facility at the time of borrowing.
During the period ended November 30, 2023, the fund was charged $24,890 for interest expense. These fees are included in Interest expense in the Statement of Operations. The average amount of borrowings outstanding under the Facilities during the period ended November 30, 2023 was approximately $396,164 with a related weighted average annualized interest rate of 6.28%.
NOTE 3—Management Fee, Sub-Advisory Fee and Other Transactions with Affiliates:
(a) Pursuant to a management agreement with the Adviser, the management fee is computed at the annual rate of .75% of the value of the fund’s average daily net assets and is payable monthly. The Adviser has contractually agreed, from December 1, 2022 through March 31, 2024, to waive receipt of its fees and/or assume the direct expenses of the fund so that the direct expenses of none of the fund’s share classes (excluding Rule 12b-1 Distribution Plan fees, Shareholder Services Plan fees, taxes, interest expense, brokerage commissions, commitment fees on borrowings and extraordinary expenses) exceed .90% of the value of the fund’s average daily net assets. On or after March 31, 2024, the Adviser may terminate this expense limitation at any time. The reduction in expenses, pursuant to
25
NOTES TO FINANCIAL STATEMENTS (continued)
the undertaking, amounted to $1,653 during the period ended November 30, 2023.
Pursuant to a sub-investment advisory agreement between the Adviser and the Sub-Adviser, the Adviser pays the Sub-Adviser a monthly fee at an annual rate of .36% of the value of the fund’s average daily net assets.
During the period ended November 30, 2023, the Distributor retained $21 from commissions earned on sales of the fund’s Class A shares.
(b) Under the Distribution Plan adopted pursuant to Rule 12b-1 under the Act, Class C shares pay the Distributor for distributing its shares at an annual rate of .75% of the value of its average daily net assets. The Distributor may pay one or more Service Agents in respect of advertising, marketing and other distribution services, and determines the amounts, if any, to be paid to Service Agents and the basis on which such payments are made. During the period ended November 30, 2023, Class C shares were charged $218 pursuant to the Distribution Plan.
(c) Under the Shareholder Services Plan, Class A and Class C shares pay the Distributor at an annual rate of .25% of the value of their average daily net assets for the provision of certain services. The services provided may include personal services relating to shareholder accounts, such as answering shareholder inquiries regarding the fund, and services related to the maintenance of shareholder accounts. The Distributor may make payments to Service Agents (securities dealers, financial institutions or other industry professionals) with respect to these services. The Distributor determines the amounts to be paid to Service Agents. During the period ended November 30, 2023, Class A and Class C shares were charged $4,468 and $73, respectively, pursuant to the Shareholder Services Plan.
The fund has an arrangement with BNY Mellon Transfer, Inc., (the “Transfer Agent”), a subsidiary of BNY Mellon and an affiliate of the Adviser, whereby the fund may receive earnings credits when positive cash balances are maintained, which are used to offset Transfer Agent fees. For financial reporting purposes, the fund includes transfer agent net earnings credits, if any, as an expense offset in the Statement of Operations.
The fund has an arrangement with The Bank of New York Mellon (the “Custodian”), a subsidiary of BNY Mellon and an affiliate of the Adviser, whereby the fund will receive interest income or be charged overdraft fees when cash balances are maintained. For financial reporting purposes, the fund includes this interest income and overdraft fees, if any, as interest income in the Statement of Operations.
26
The fund compensates the Transfer Agent, under a transfer agency agreement, for providing transfer agency and cash management services for the fund. The majority of Transfer Agent fees are comprised of amounts paid on a per account basis, while cash management fees are related to fund subscriptions and redemptions. During the period ended November 30, 2023, the fund was charged $4,911 for transfer agency services. These fees are included in Shareholder servicing costs in the Statement of Operations. These fees were partially offset by earnings credits of $2,375.
The fund compensates the Custodian, under a custody agreement, for providing custodial services for the fund. These fees are determined based on net assets, geographic region and transaction activity. During the period ended November 30, 2023, the fund was charged $7,677 pursuant to the custody agreement.
During the period ended November 30, 2023, the fund was charged $20,855 for services performed by the fund’s Chief Compliance Officer and his staff. These fees are included in Chief Compliance Officer fees in the Statement of Operations.
The components of “Due to BNY Mellon Investment Adviser, Inc. and affiliates” in the Statement of Assets and Liabilities consist of: management fee of $133,611, Distribution Plan fees of $18, Shareholder Services Plan fees of $370, Custodian fees of $5,510, Chief Compliance Officer fees of $3,484 and Transfer Agent fees of $1,244, which are offset against an expense reimbursement currently in effect in the amount of $201.
(d) Each board member also serves as a board member of other funds in the BNY Mellon Family of Funds complex. Annual retainer fees and attendance fees are allocated to each fund based on net assets.
NOTE 4—Securities Transactions:
The aggregate amount of purchases and sales of investment securities, excluding short-term securities, during the period ended November 30, 2023, amounted to $14,914,424 and $332,226,167, respectively.
At November 30, 2023, the cost of investments for federal income tax purposes was $78,108,035; accordingly, accumulated net unrealized appreciation on investments was $94,059,310, consisting of $98,720,481 gross unrealized appreciation and $4,661,171 gross unrealized depreciation.
27
REPORT OF INDEPENDENT REGISTERED PUBLIC ACCOUNTING FIRM
To the Shareholders and the Board of Directors of BNY Mellon U.S. Equity Fund
Opinion on the Financial Statements
We have audited the accompanying statement of assets and liabilities of BNY Mellon U.S. Equity Fund (the “Fund”) (one of the funds constituting BNY Mellon Strategic Funds, Inc. (the “Company”)), including the statement of investments, as of November 30, 2023, and the related statement of operations for the year then ended, the statements of changes in net assets for each of the two years in the period then ended, the financial highlights for each of the five years in the period then ended and the related notes (collectively referred to as the “financial statements”). In our opinion, the financial statements present fairly, in all material respects, the financial position of the Fund (one of the funds constituting BNY Mellon Strategic Funds, Inc.) at November 30, 2023, the results of its operations for the year then ended, the changes in its net assets for each of the two years in the period then ended and its financial highlights for each of the five years in the period then ended, in conformity with U.S. generally accepted accounting principles.
Basis for Opinion
These financial statements are the responsibility of the Company’s management. Our responsibility is to express an opinion on the Fund’s financial statements based on our audits. We are a public accounting firm registered with the Public Company Accounting Oversight Board (United States) (“PCAOB”) and are required to be independent with respect to the Company in accordance with the U.S. federal securities laws and the applicable rules and regulations of the Securities and Exchange Commission and the PCAOB.
We conducted our audits in accordance with the standards of the PCAOB. Those standards require that we plan and perform the audit to obtain reasonable assurance about whether the financial statements are free of material misstatement, whether due to error or fraud. The Company is not required to have, nor were we engaged to perform, an audit of the Company’s internal control over financial reporting. As part of our audits, we are required to obtain an understanding of internal control over financial reporting but not for the purpose of expressing an opinion on the effectiveness of the Company’s internal control over financial reporting. Accordingly, we express no such opinion.
Our audits included performing procedures to assess the risks of material misstatement of the financial statements, whether due to error or fraud, and performing procedures that respond to those risks. Such procedures included examining, on a test basis, evidence regarding the amounts and disclosures in the financial statements. Our procedures included confirmation of securities owned as of November 30, 2023, by correspondence with the custodian, brokers and others; when replies were not received from brokers and others, we performed other auditing procedures. Our audits also included evaluating the accounting principles used and significant estimates made by management, as well as evaluating the overall presentation of the financial statements. We believe that our audits provide a reasonable basis for our opinion.

We have served as the auditor of one or more investment companies in the BNY Mellon Family of Funds since at least 1957, but we are unable to determine the specific year.
New York, New York
January 22, 2024
28
ADDITIONAL INFORMATION (Unaudited)
UPDATES TO SALES CHARGE REDUCTIONS AND WAIVERS AVAILABLE FROM CERTAIN FINANCIAL INTERMEDIARIES:
The availability of certain sales charge reductions and waivers will depend on whether you purchase fund shares directly from the fund or through a financial intermediary. Financial intermediaries may have different policies and procedures regarding the availability of front-end sales load reductions or waivers or CDSC waivers, which are described in the fund’s prospectus. In all instances, it is the investor’s responsibility to notify the fund or the investor’s financial intermediary at the time of purchase of any relationship or other facts qualifying the investor for sales charge reductions or waivers. For reductions or waivers not available through a particular financial intermediary, investors will have to purchase fund shares directly from the fund or through another financial intermediary to receive these reductions or waivers.
Edward Jones
Clients of Edward D. Jones & Co., L.P. (Edward Jones) purchasing fund shares on the Edward Jones commission and fee-based platforms are eligible only for the following sales charge reductions and waivers, which can differ from the sales charge reductions and waivers described elsewhere in the fund’s prospectus or the SAI or through another financial intermediary. In all instances, it is the shareholder’s responsibility to inform Edward Jones at the time of purchase of any relationship, holdings of BNY Mellon Family of Funds, or other facts qualifying the purchaser for sales charge reductions or waivers. Edward Jones can ask for documentation of such circumstance. Shareholders should contact Edward Jones if they have questions regarding their eligibility for these discounts and waivers.
Front-end sales charge reductions on Class A shares purchased on the Edward Jones commission and fee-based platforms
Shareholders purchasing Class A shares of the fund on the Edward Jones commission and fee-based platforms can reduce their initial sales charge in the following ways:
· Transaction size breakpoints, as described in the fund’s prospectus.
· Rights of accumulation (ROA), which entitle shareholders to breakpoint discounts as described in the fund’s prospectus, will be calculated based on the aggregated holdings of shares of funds in the BNY Mellon Family of Funds (except certain money market funds and any assets held in group retirement plans) held by the purchaser or in an account grouped by Edward Jones with other accounts for the purpose of providing certain pricing considerations (“pricing groups”) and, if grouping assets as a shareholder, includes all share classes of such funds held on the Edward Jones platform and/or held on another platform. Shares of funds in the BNY Mellon Family of Funds may be included in the ROA calculation only if the shareholder notifies Edward Jones about such shares. Money market funds are included only if such shares were sold with a sales charge at the time of purchase or acquired in exchange for shares purchased with a sales charge. The employer maintaining a SEP IRA plan and/or SIMPLE IRA plan may elect to establish or change ROA for the IRA accounts associated with the plan to a plan-level grouping as opposed to including all share classes at a shareholder or pricing group level. For purposes of determining the value of a shareholder’s aggregated holdings, eligible shares held will be valued at the higher of their cost minus redemptions or current market value.
29
ADDITIONAL INFORMATION (Unaudited) (continued)
· Letter of intent (LOI), which allows for breakpoint discounts as described in the fund’s prospectus, based on anticipated purchases of shares of funds in the BNY Mellon Family of Funds purchased over a 13-month period from the date Edward Jones receives the LOI. Eligible shares purchased pursuant to a LOI will be valued at the higher of their cost or current market value for purposes of determining the front-end sales charge and any breakpoint discounts with respect to such share purchases. Each purchase a shareholder makes pursuant to a LOI during the 13-month period will receive the front-end sales charge and breakpoint discount that applies to the total amount indicated in the LOI. Shares of funds in the BNY Mellon Family of Funds may be included in the LOI calculation only if the shareholder notifies Edward Jones about such shares at the time of calculation. Shares purchased before the LOI is received by Edward Jones are not adjusted under the LOI and will not reduce the sales charge previously paid by the shareholder. The sales charge will be adjusted if the shareholder does not meet the goal indicated in the LOI. If the employer maintaining a SEP IRA plan and/or SIMPLE IRA plan has elected to establish or change ROA for the IRA accounts associated with the plan to a plan-level grouping, LOIs will also be at the plan-level and may only be established by the employer.
Front-end sales charge waivers on Class A shares purchased on the Edward Jones commission and fee-based platforms
Shareholders purchasing Class A shares of the fund on the Edward Jones commission and fee-based platforms may purchase Class A shares at NAV without payment of a sales charge as follows:
· shares purchased by associates of Edward Jones or its affiliates and their family members who are in the same pricing group (as determined by Edward Jones under its policies and procedures) as the associate. This waiver will continue for the remainder of the associate’s life if the associate retires from Edward Jones in good standing and remains in good standing pursuant to Edward Jones’ policies and procedures (Effective January 1, 2024, this waiver will be revised as follows: shares purchased by associates of Edward Jones and its affiliates and other accounts in the same pricing group (as determined by Edward Jones under its policies and procedures) as the associate. This waiver will continue for the remainder of the associate’s life if the associate retires from Edward Jones in good-standing and remains in good standing pursuant to Edward Jones’ policies and procedures)
· shares purchased in an Edward Jones fee-based program
· shares purchased through reinvestment of dividends and capital gains distributions of the fund
· shares purchased from the proceeds of redemptions of shares of a fund in the BNY Mellon Family of Funds, provided (1) the repurchase occurs within 60 days following the redemption, and (2) the redemption and purchase are made in the same share class and the same account or the purchase is made in an individual retirement account with
30
proceeds from liquidations in a non-retirement account (i.e., Right of Reinstatement) (Effective January 1, 2024, this waiver will be revised as follows: shares purchased from the proceeds of redemptions of shares of a fund in the BNY Mellon Family of Funds, provided that (1) the repurchase occurs within 60 days following the redemption, and (2) the redemption and purchase are made in a share class that charges a front-end sales charge, subject to one of the following conditions being met:
o the redemption and repurchase occur in the same account
o the redemption proceeds are used to process an IRA contribution, excess contributions, conversion, recharacterizing of contributions, or distribution, and the repurchase is done in an account within the same Edward Jones grouping for ROA)
· shares exchanged into Class A shares from another share class so long as the exchange is into the same fund and was initiated at the discretion of Edward Jones. Edward Jones is responsible for any CDSC due, if applicable. Any future purchases are subject to the applicable sales charge as disclosed in the fund’s prospectus
· exchanges from Class C shares to Class A shares of the same fund, generally, in the 84th month following the anniversary of the purchase date or earlier at the discretion of Edward Jones
· Effective January 1, 2024: purchases of Class A shares for a 529 plan account through a rollover from either another education savings plan or a security used for qualified distributions
· Effective January 1, 2024: purchases of Class A shares for a 529 plan account made for recontribution of refunded amounts
CDSC waivers on Class A and C shares purchased on the Edward Jones commission and fee-based platforms
The fund’s CDSC on Class A and C shares may be waived for shares purchased on the Edward Jones commission and fee-based platforms in the following cases:
· redemptions made upon the death or disability of the shareholder
· redemptions made through a systematic withdrawal plan, if such redemptions do not exceed 10% of the value of the account annually
· redemptions made in connection with a return of excess contributions from an IRA account
· redemptions made as part of a required minimum distribution for IRA and retirement accounts if the redemption is taken in or after the year the shareholder reaches qualified age based on applicable IRS regulations
· redemptions made to pay Edward Jones fees or costs, but only if the redemption is initiated by Edward Jones
· shares exchanged in an Edward Jones fee-based program
31
ADDITIONAL INFORMATION (Unaudited) (continued)
· shares acquired through a Right of Reinstatement (as defined above)
· shares redeemed at the discretion of Edward Jones for accounts not meeting Edward Jones’ minimum balance requirements described below
Other important information for clients of Edward Jones who purchase fund shares on the Edward Jones commission and fee-based platforms
Minimum Purchase Amounts
· Initial purchase minimum: $250
· Subsequent purchase minimum: none
Minimum Balances
· Edward Jones has the right to redeem at its discretion fund holdings with a balance of $250 or less. The following are examples of accounts that are not included in this policy:
o A fee-based account held on an Edward Jones platform
o A 529 account held on an Edward Jones platform
o An account with an active systematic investment plan or LOI
Exchanging Share Classes
· At any time it deems necessary, Edward Jones has the authority to exchange at NAV a shareholder’s holdings in a fund to Class A shares of the same fund. Edward Jones is responsible for any CDSC due, if applicable. Any future purchases are subject to the applicable sales charge as disclosed in the fund’s prospectus.
Merrill
Purchases or sales of front-end (i.e., Class A) or level-load (i.e., Class C) mutual fund shares through a Merrill platform or account are eligible only for the following sales load waivers (front-end or CDSC) and discounts, which differ from those disclosed elsewhere in the fund’s prospectus. Purchasers will have to buy mutual fund shares directly from the mutual fund company or through another intermediary to be eligible for waivers or discounts not listed below.
It is the client’s responsibility to notify Merrill at the time of purchase or sale of any relationship or other facts that qualify the transaction for a waiver or discount. A Merrill representative may ask for reasonable documentation of such facts and Merrill may condition the granting of a waiver or discount on the timely receipt of such documentation. Additional information on waivers or discounts is available in the Merrill Sales Load Waiver and Discounts Supplement (the “Merrill SLWD Supplement”) and in the Mutual Fund Investing at Merrill pamphlet at ml.com/funds. Clients are encouraged to review these documents and speak with their financial advisor to determine whether a transaction is eligible for a waiver or discount.
Front-end sales charge waivers on Class A shares purchased through Merrill
32
Shareholders purchasing Class A shares of the fund through a Merrill platform or account are eligible only for the following sales charge waivers, which may differ from those disclosed elsewhere in the fund’s prospectus or the SAI. Such shareholders may purchase Class A shares at NAV without payment of a sales charge as follows:
· shares of mutual funds available for purchase by employer-sponsored retirement, deferred compensation and employee benefit plans (including health savings accounts) and trusts used to fund those plans provided that the shares are not held in a commission-based brokerage account and shares are held for the benefit of the plan. For purposes of this provision, employer-sponsored retirement plans do not include SEP IRAs, Simple IRAs, SAR-SEPs or Keogh plans
· shares purchased through a Merrill investment advisory program
· brokerage class shares exchanged from advisory class shares due to the holdings moving from a Merrill investment advisory program to a Merrill brokerage account
· shares purchased through the Merrill Edge Self-Directed platform
· shares purchased through the systematic reinvestment of capital gains distributions and dividend reinvestment when purchasing shares of the same mutual fund in the same account
· shares exchanged from level-load shares to front-end load shares of the same mutual fund in accordance with the description in the Merrill SLWD Supplement
· shares purchased by eligible employees of Merrill or its affiliates and their family members who purchase shares in accounts within the employee’s Merrill Household (as defined in the Merrill SLWD Supplement)
· shares purchased by eligible persons associated with the fund as defined in the fund’s prospectus (e.g., the fund’s officers or trustees)
· shares purchased from the proceeds of a mutual fund redemption in front-end load shares, provided (1) the repurchase is in a mutual fund within the same fund family, (2) the repurchase occurs within 90 calendar days from the redemption trade date, and (3) the redemption and purchase occur in the same account (known as Rights of Reinstatement). Automated transactions (i.e., systematic purchases and withdrawals) and purchases made after shares are automatically sold to pay Merrill’s account maintenance fees are not eligible for Rights of Reinstatement
CDSC waivers on Class A and C shares purchased through Merrill
Fund shares purchased through a Merrill platform or account are eligible only for the following CDSC waivers, which may differ from those disclosed elsewhere in the fund’s prospectus or the SAI:
· shares sold due to the client’s death or disability (as defined by Internal Revenue Code Section 22(e)(3))
33
ADDITIONAL INFORMATION (Unaudited) (continued)
· shares sold pursuant to a systematic withdrawal program subject to Merrill’s maximum systematic withdrawal limits, as described in the Merrill SLWD Supplement
· shares sold due to return of excess contributions from an IRA account
· shares sold as part of a required minimum distribution for IRA and retirement accounts due to the investor reaching the qualified age based on applicable IRS regulation
· front-end or level-load shares held in commission-based, non-taxable retirement brokerage accounts (e.g., traditional, Roth, rollover, SEP IRAs, Simple IRAs, SAR-SEPs or Keogh plans) that are transferred to fee-based accounts or platforms and exchanged for a lower cost share class of the same mutual fund.
Front-end sales charge reductions on Class A shares purchased through Merrill
Shareholders purchasing Class A shares of the fund through a Merrill platform or account are eligible only for the following sales charge reductions (i.e., discounts), which may differ from those disclosed elsewhere in the fund’s prospectus or the SAI. Such shareholders can reduce their initial sales charge in the following ways:
· Breakpoint discounts, as described in the fund’s prospectus, where the sales load is at or below the maximum sales load that Merrill permits to be assessed to a front-end load purchase, as described in the Merrill SLWD Supplement.
· Rights of accumulation (ROA), as described in the Merrill SLWD Supplement, which entitle clients to breakpoint discounts based on the aggregated holdings of mutual fund family assets held in accounts in their Merrill Household.
· Letters of Intent (LOI), which allow for breakpoint discounts on eligible new purchases based on anticipated future eligible purchases within a fund family at Merrill, in accounts within your Merrill Household, as further described in the Merrill SLWD Supplement.
34
IMPORTANT TAX INFORMATION (Unaudited)
For federal tax purposes the fund hereby reports 100% of the ordinary dividends paid during the fiscal year ended November 30, 2023 as qualifying for the corporate dividends received deduction. Also certain dividends paid by the fund may be subject to a maximum tax rate of 15%, as provided for by the Jobs and Growth Tax Relief Reconciliation Act of 2003. Of the distributions paid during the fiscal year, $670,133 represents the maximum amount that may be considered qualified dividend income. Shareholders will receive notification in early 2024 of the percentage applicable to the preparation of their 2023 income tax returns. Also, the fund hereby reports $4.0231 as a long-term capital gain distribution paid on December 13, 2022 and $1.0590 as a long-term capital gain distribution paid on March 28, 2023.
35
INFORMATION ABOUT THE RENEWAL OF THE FUND’S MANAGEMENT AND SUB-INVESTMENT ADVISORY AGREEMENTS (Unaudited)
At a meeting of the fund’s Board of Directors (the “Board”) held on October 30-31, 2023, the Board considered the renewal of the fund’s Management Agreement, pursuant to which the Adviser provides the fund with investment advisory and administrative services, and the Sub-Investment Advisory Agreement (together with the Management Agreement, the “Agreements”), pursuant to which Walter Scott & Partners Limited (the “Sub-Adviser”) provides day-to-day management of the fund’s investments. The Board members, none of whom are “interested persons” (as defined in the Investment Company Act of 1940, as amended) of the fund, were assisted in their review by independent legal counsel and met with counsel in executive session separate from representatives of the Adviser and the Sub-Adviser. In considering the renewal of the Agreements, the Board considered several factors that it believed to be relevant, including those discussed below. The Board did not identify any one factor as dispositive, and each Board member may have attributed different weights to the factors considered.
Analysis of Nature, Extent, and Quality of Services Provided to the Fund. The Board considered information provided to it at the meeting and in previous presentations from representatives of the Adviser regarding the nature, extent, and quality of the services provided to funds in the BNY Mellon fund complex, including the fund. The Adviser provided the number of open accounts in the fund, the fund’s asset size and the allocation of fund assets among distribution channels. The Adviser also had previously provided information regarding the diverse intermediary relationships and distribution channels of funds in the BNY Mellon fund complex (such as retail direct or intermediary, in which intermediaries typically are paid by the fund and/or the Adviser) and the Adviser’s corresponding need for broad, deep, and diverse resources to be able to provide ongoing shareholder services to each intermediary or distribution channel, as applicable to the fund.
The Board also considered research support available to, and portfolio management capabilities of, the fund’s portfolio management personnel and that the Adviser also provides oversight of day-to-day fund operations, including fund accounting and administration and assistance in meeting legal and regulatory requirements. The Board also considered the Adviser’s extensive administrative, accounting and compliance infrastructures, as well as the Adviser’s supervisory activities over the Sub-Adviser. The Board also considered portfolio management’s brokerage policies and practices (including that there are no soft dollar arrangements in place for the fund) and the standards applied in seeking best execution.
Comparative Analysis of the Fund’s Performance and Management Fee and Expense Ratio. The Board reviewed reports prepared by Broadridge Financial Solutions, Inc. (“Broadridge”), an independent provider of investment company data based on classifications provided by Thomson Reuters Lipper (“Lipper”), which included information comparing (1) the performance of the fund’s Class I shares with the performance of a group of institutional multi-cap growth funds selected by Broadridge
36
as comparable to the fund (the “Performance Group”) and with a broader group of funds consisting of all retail and institutional multi-cap growth funds (the “Performance Universe”), all for various periods ended August 31, 2023, and (2) the fund’s actual and contractual management fees and total expenses with those of the same group of funds in the Performance Group (the “Expense Group”) and with a broader group of funds consisting of all institutional multi-cap growth funds, excluding outliers (the “Expense Universe”), the information for which was derived in part from fund financial statements available to Broadridge as of the date of its analysis. The Adviser previously had furnished the Board with a description of the methodology Broadridge used to select the Performance Group and Performance Universe and the Expense Group and Expense Universe.
Performance Comparisons. Representatives of the Adviser stated that the usefulness of performance comparisons may be affected by a number of factors, including different investment limitations and policies that may be applicable to the fund and comparison funds and the end date selected. The Board also considered the fund’s performance in light of overall financial market conditions. The Board discussed with representatives of the Adviser and the Sub-Adviser the results of the comparisons and considered that the fund’s total return performance was above the Performance Group and Performance Universe medians for all periods, except the one-year period when the fund’s total return performance was slightly below the Performance Group median and the four- and ten-year periods when the fund’s total return performance was below the Performance Group and Performance Universe medians. The Board considered the relative proximity of the fund’s performance to the Performance Group and/or Performance Universe medians in certain periods when performance was below median. The Board noted that the fund had a four-star rating for the three-year period from Morningstar based on Morningstar’s risk-adjusted return measure.
Management Fee and Expense Ratio Comparisons. The Board reviewed and considered the contractual management fee rate payable by the fund to the Adviser in light of the nature, extent and quality of the management services and the sub-advisory services provided by the Adviser and the Sub-Adviser, respectively. In addition, the Board reviewed and considered the actual management fee rate paid by the fund over the fund’s last fiscal year. The Board also reviewed the range of actual and contractual management fees and total expenses as a percentage of average net assets of the Expense Group and Expense Universe funds and discussed the results of the comparisons.
The Board considered that the fund’s contractual management fee was equal to the Expense Group median contractual management fee, the fund’s actual management fee was slightly higher than the Expense Group median and higher than the Expense Universe median actual management fee, and the fund’s total expenses were slightly lower than the Expense Group median and higher than the Expense Universe median total expenses.
Representatives of the Adviser stated that the Adviser has contractually agreed, until March 31, 2024, to waive receipt of its fees and/or assume the direct expenses of the
37
INFORMATION ABOUT THE RENEWAL OF THE FUND’S MANAGEMENT AND SUB-INVESTMENT ADVISORY AGREEMENTS (Unaudited) (continued)
fund so that the direct expenses of none of the fund’s share classes (excluding Rule 12b-1 fees, shareholder services fees, taxes, interest expense, brokerage commissions, commitment fees on borrowings and extraordinary expenses) exceed 0.90% of the fund’s average daily net assets.
Representatives of the Adviser reviewed with the Board the management or investment advisory fees paid to the Adviser or the Sub-Adviser or its affiliates for advising any separate accounts and/or other types of client portfolios that are considered to have similar investment strategies and policies as the fund (the “Similar Clients”), and explained the nature of the Similar Clients. They discussed differences in fees paid and the relationship of the fees paid in light of any differences in the services provided and other relevant factors. The Board considered the relevance of the fee information provided for the Similar Clients to evaluate the appropriateness of the fund’s management fee. Representatives of the Adviser noted that there were no other funds advised by the Adviser that are in the same Lipper category as the fund.
The Board considered the fee payable to the Sub-Adviser in relation to the fee payable to the Adviser by the fund and the respective services provided by the Sub-Adviser and the Adviser. The Board also took into consideration that the Sub-Adviser’s fee is paid by the Adviser, out of its fee from the fund, and not the fund.
Analysis of Profitability and Economies of Scale. Representatives of the Adviser reviewed the expenses allocated and profit received by the Adviser and its affiliates and the resulting profitability percentage for managing the fund and the aggregate profitability percentage to the Adviser and its affiliates for managing the funds in the BNY Mellon fund complex, and the method used to determine the expenses and profit. The Board concluded that the profitability results were not excessive, given the services rendered and service levels provided by the Adviser and its affiliates. The Board also had been provided with information prepared by an independent consulting firm regarding the Adviser’s approach to allocating costs to, and determining the profitability of, individual funds and the entire BNY Mellon fund complex. The consulting firm also had analyzed where any economies of scale might emerge in connection with the management of a fund.
The Board considered, on the advice of its counsel, the profitability analysis (1) as part of its evaluation of whether the fees under the Agreements, considered in relation to the mix of services provided by the Adviser and the Sub-Adviser, including the nature, extent and quality of such services, supported the renewal of the Agreements and (2) in light of the relevant circumstances for the fund and the extent to which economies of scale would be realized if the fund grows and whether fee levels reflect these economies of scale for the benefit of fund shareholders. Representatives of the Adviser stated that a discussion of economies of scale is predicated on a fund having achieved a substantial size with increasing assets and that, if a fund’s assets had been stable or decreasing, the possibility that the Adviser may have realized any economies of scale would be less. Representatives of the Adviser also stated that, as a result of shared and allocated costs among funds in the BNY Mellon fund complex, the extent of economies of scale could depend substantially on the level of assets in the complex as a whole, so that increases
38
and decreases in complex-wide assets can affect potential economies of scale in a manner that is disproportionate to, or even in the opposite direction from, changes in the fund’s asset level. The Board also considered potential benefits to the Adviser and the Sub-Adviser from acting as investment adviser and sub-investment adviser, respectively, and took into consideration that there were no soft dollar arrangements in effect for trading the fund’s investments.
At the conclusion of these discussions, the Board agreed that it had been furnished with sufficient information to make an informed business decision with respect to the renewal of the Agreements. Based on the discussions and considerations as described above, the Board concluded and determined as follows.
· The Board concluded that the nature, extent and quality of the services provided by the Adviser and the Sub-Adviser are adequate and appropriate.
· The Board was generally satisfied with the fund’s overall performance.
· The Board concluded that the fees paid to the Adviser and the Sub-Adviser continued to be appropriate under the circumstances and in light of the factors and the totality of the services provided as discussed above.
· The Board determined that the economies of scale which may accrue to the Adviser and its affiliates in connection with the management of the fund had been adequately considered by the Adviser in connection with the fee rate charged to the fund pursuant to the Management Agreement and that, to the extent in the future it were determined that material economies of scale had not been shared with the fund, the Board would seek to have those economies of scale shared with the fund.
In evaluating the Agreements, the Board considered these conclusions and determinations and also relied on its previous knowledge, gained through meetings and other interactions with the Adviser and its affiliates and the Sub-Adviser, of the Adviser and the Sub-Adviser and the services provided to the fund by the Adviser and the Sub-Adviser. The Board also relied on information received on a routine and regular basis throughout the year relating to the operations of the fund and the investment management and other services provided under the Agreements, including information on the investment performance of the fund in comparison to similar mutual funds and benchmark performance indices; general market outlook as applicable to the fund; and compliance reports. In addition, the Board’s consideration of the contractual fee arrangements for the fund had the benefit of a number of years of reviews of the Agreements for the fund, or substantially similar agreements for other BNY Mellon funds that the Board oversees, during which lengthy discussions took place between the Board and representatives of the Adviser. Certain aspects of the arrangements may receive greater scrutiny in some years than in others, and the Board’s conclusions may be based, in part, on its consideration of the fund’s arrangements, or substantially similar arrangements for other BNY Mellon funds that the Board oversees, in prior years. The Board determined to renew the Agreements.
39
BOARD MEMBERS INFORMATION (Unaudited)
Independent Board Members
Joseph S. DiMartino (80)
Chairman of the Board (1995)
Principal Occupation During Past 5 Years:
· Director or Trustee of funds in the BNY Mellon Family of Funds and certain other entities (as described in the fund’s Statement of Additional Information) (1995-Present)
Other Public Company Board Memberships During Past 5 Years:
· CBIZ, Inc., a public company providing professional business services, products and solutions, Director (1997-May 2023)
No. of Portfolios for which Board Member Serves: 86
———————
Joni Evans (81)
Board Member (2006)
Principal Occupation During Past 5 Years:
· www.PureWow.com, an online community dedicated to women’s conversations and publications, Chief Executive Officer (2007-2019)
· Joni Evans Ltd. publishing, Principal (2006-2019)
No. of Portfolios for which Board Member Serves: 17
———————
Joan Gulley (76)
Board Member (2017)
Principal Occupation During Past 5 Years:
· Nantucket Atheneum, public library, Chair (June 2018-June 2021) and Director (2015-June 2021)
· Orchard Island Club, golf and beach club, Governor (2016-Present) and President (February 2023-Present)
No. of Portfolios for which Board Member Serves: 39
———————
40
Alan H. Howard (64)
Board Member (2018)
Principal Occupation During Past 5 Years:
· Heathcote Advisors LLC, a financial advisory services firm, Managing Partner (2008-Present)
· Dynatech/MPX Holdings LLC, a global supplier and service provider of military aircraft parts, President (2012-May 2019); and Board Member of its two operating subsidiaries, Dynatech International LLC and Military Parts Exchange LLC (2012-December 2019), including Chief Executive Officer of an operating subsidiary, Dynatech International LLC (2013-May 2019)
· Rossoff & Co., an independent investment banking firm, Senior Advisor (2013-June 2021)
Other Public Company Board Memberships During Past 5 Years:
· Movado Group, Inc., a public company that designs, sources, markets and distributes watches, Director (1997-Present)
· Diamond Offshore Drilling, Inc., a public company that provides contract drilling services, Director (March 2020-April 2021)
No. of Portfolios for which Board Member Serves: 17
———————
Robin A. Melvin (60)
Board Member (1995)
Principal Occupation During Past 5 Years:
· Westover School, a private girls’ boarding school in Middlebury, Connecticut, Trustee (2019-June 2023)
· Mentor Illinois, a non-profit organization dedicated to increasing the quantity and quality of mentoring services in Illinois. Co-Chair (2014–March 2020); Board Member (2013-March 2020)
· JDRF, a non-profit juvenile diabetes research foundation, Board Member (June 2021-June 2022)
Other Public Company Board Memberships During Past 5 Years:
· HPS Corporate Lending Fund, a closed-end management investment company regulated as a business development company, Trustee (August 2021-Present)
No. of Portfolios for which Board Member Serves: 68
———————
Burton N. Wallack (73)
Board Member (2006)
Principal Occupation During Past 5 Years:
Wallack Management Company, a real estate management company, President and Co-owner (1987-Present)
Other Public Company Board Memberships During Past 5 Years:
Mount Sinai Hospital Urology, Board Member (2017-Present)
No. of Portfolios for which Board Member Serves: 17
———————
41
BOARD MEMBERS INFORMATION (Unaudited) (continued)
Benaree Pratt Wiley (77)
Board Member (2016)
Principal Occupation During Past 5 Years:
· The Wiley Group, a firm specializing in strategy and business development. Principal (2005-Present)
Other Public Company Board Memberships During Past 5 Years:
· CBIZ, Inc., a public company providing professional business services, products and solutions, Director (2008-Present)
· Blue Cross-Blue Shield of Massachusetts, Director (2004-December 2020)
No. of Portfolios for which Board Member Serves: 57
———————
Gordon J. Davis (81)
Advisory Board Member (2021)
Principal Occupation During Past 5 Years:
· Venable LLP, a law firm, Partner (2012-Present)
Other Public Company Board Memberships During Past 5 Years:
· BNY Mellon Family of Funds (53 funds), Board Member (1995-August 2021)
No. of Portfolios for which Advisory Board Member Serves: 39
———————
The address of the Board Members and Officers is c/o BNY Mellon Investment Adviser, Inc., 240 Greenwich Street, New York, New York 10286. Additional information about each Board Member is available in the fund’s Statement of Additional Information which can be obtained from the Adviser free of charge by calling this toll free number: 1-800-373-9387.
42
OFFICERS OF THE FUND (Unaudited)
DAVID DIPETRILLO, President since January 2021.
Vice President and Director of the Adviser since February 2021; Head of North America Distribution, BNY Mellon Investment Management since February 2023; and Head of North America Product, BNY Mellon Investment Management from January 2018 to February 2023. He is an officer of 53 investment companies (comprised of 102 portfolios) managed by the Adviser or an affiliate of the Adviser. He is 45 years old and has been an employee of BNY Mellon since 2005.
JAMES WINDELS, Treasurer since November 2001.
Director of the Adviser since February 2023; Vice President of the Adviser since September 2020; and Director–BNY Mellon Fund Administration. He is an officer of 54 investment companies (comprised of 121 portfolios) managed by the Adviser or an affiliate of the Adviser. He is 65 years old and has been an employee of the Adviser since April 1985.
PETER M. SULLIVAN, Chief Legal Officer since July 2021 and Vice President and Assistant Secretary since March 2019.
Chief Legal Officer of the Adviser and Associate General Counsel of BNY Mellon since July 2021; Senior Managing Counsel of BNY Mellon from December 2020 to July 2021; and Managing Counsel of BNY Mellon from March 2009 to December 2020. He is an officer of 54 investment companies (comprised of 121 portfolios) managed by the Adviser or an affiliate of the Adviser. He is 55 years old and has been an employee of BNY Mellon since April 2004.
JAMES BITETTO, Vice President since August 2005 and Secretary since February 2018.
Senior Managing Counsel of BNY Mellon since December 2019; Managing Counsel of BNY Mellon from April 2014 to December 2019; and Secretary of the Adviser. He is an officer of 54 investment companies (comprised of 121 portfolios) managed by the Adviser or an affiliate of the Adviser. He is 57 years old and has been an employee of the Adviser since December 1996.
DEIRDRE CUNNANE, Vice President and Assistant Secretary since March 2019.
Managing Counsel of BNY Mellon since December 2021; and Counsel of BNY Mellon from August 2018 to December 2021. She is an officer of 54 investment companies (comprised of 121 portfolios) managed by the Adviser or an affiliate of the Adviser. She is 33 years old and has been an employee of BNY Mellon since August 2013.
SARAH S. KELLEHER, Vice President and Assistant Secretary since April 2014.
Vice President of BNY Mellon ETF Investment Adviser; LLC since February 2020; Senior Managing Counsel of BNY Mellon since September 2021; and Managing Counsel of BNY Mellon from December 2017 to September 2021. She is an officer of 54 investment companies (comprised of 121 portfolios) managed by the Adviser or an affiliate of the Adviser. She is 48 years old and has been an employee of BNY Mellon since March 2013.
JEFF PRUSNOFSKY, Vice President and Assistant Secretary since August 2005.
Senior Managing Counsel of BNY Mellon. He is an officer of 54 investment companies (comprised of 121 portfolios) managed by the Adviser or an affiliate of the Adviser. He is 58 years old and has been an employee of the Adviser since October 1990.
AMANDA QUINN, Vice President and Assistant Secretary since March 2020.
Counsel of BNY Mellon since June 2019; and Regulatory Administration Manager at BNY Mellon Investment Management Services from September 2018 to May 2019. She is an officer of 54 investment companies (comprised of 121 portfolios) managed by the Adviser or an affiliate of the Adviser. She is 38 years old and has been an employee of BNY Mellon since June 2012.
JOANNE SKERRETT, Vice President and Assistant Secretary since March 2023.
Managing Counsel of BNY Mellon since June 2022; and Senior Counsel with the Mutual Fund Directors Forum, a leading funds industry organization, from 2016 to June 2022. She is an officer of 54 investment companies (comprised of 121 portfolios) managed by the Adviser or an affiliate of the Adviser. She is 51 years old and has been an employee of the Adviser since June 2022.
43
OFFICERS OF THE FUND (Unaudited) (continued)
NATALYA ZELENSKY, Vice President and Assistant Secretary since March 2017.
Chief Compliance Officer since August 2021 and Vice President since February 2020 of BNY Mellon ETF Investment Adviser, LLC; Chief Compliance Officer since August 2021 and Vice President and Assistant Secretary since February 2020 of BNY Mellon ETF Trust; Managing Counsel of BNY Mellon from December 2019 to August 2021; Counsel of BNY Mellon from May 2016 to December 2019; and Assistant Secretary of the Adviser from April 2018 to August 2021. She is an officer of 54 investment companies (comprised of 121 portfolios) managed by the Adviser or an affiliate of the Adviser. She is 38 years old and has been an employee of BNY Mellon since May 2016.
DANIEL GOLDSTEIN, Vice President since March 2022.
Head of Product Development of North America Distribution, BNY Mellon Investment Management since January 2018; Executive Vice President of North America Product, BNY Mellon Investment Management since April 2023; and Senior Vice President, Development & Oversight of North America Product, BNY Mellon Investment Management from 2010 to March 2023. He is an officer of 53 investment companies (comprised of 102 portfolios) managed by the Adviser or an affiliate of the Adviser. He is 54 years old and has been an employee of the Distributor since 1991.
JOSEPH MARTELLA, Vice President since March 2022.
Vice President of the Adviser since December 2022; Head of Product Management of North America Distribution, BNY Mellon Investment Management since January 2018; Executive Vice President of North America Product, BNY Mellon Investment Management since April 2023; and Senior Vice President of North America Product, BNY Mellon Investment Management from 2010 to March 2023. He is an officer of 53 investment companies (comprised of 102 portfolios) managed by the Adviser or an affiliate of the Adviser. He is 47 years old and has been an employee of the Distributor since 1999.
GAVIN C. REILLY, Assistant Treasurer since December 2005.
Tax Manager–BNY Mellon Fund Administration. He is an officer of 54 investment companies (comprised of 121 portfolios) managed by the Adviser or an affiliate of the Adviser. He is 55 years old and has been an employee of the Adviser since April 1991.
ROBERT SALVIOLO, Assistant Treasurer since July 2007.
Senior Accounting Manager–BNY Mellon Fund Administration. He is an officer of 54 investment companies (comprised of 121 portfolios) managed by the Adviser or an affiliate of the Adviser. He is 56 years old and has been an employee of the Adviser since June 1989.
ROBERT SVAGNA, Assistant Treasurer since September 2002.
Senior Accounting Manager–BNY Mellon Fund Administration. He is an officer of 54 investment companies (comprised of 121 portfolios) managed by the Adviser or an affiliate of the Adviser. He is 56 years old and has been an employee of the Adviser since November 1990.
JOSEPH W. CONNOLLY, Chief Compliance Officer since October 2004.
Chief Compliance Officer of the BNY Mellon Family of Funds and BNY Mellon Funds Trust since 2004; and Chief Compliance Officer of the Adviser from 2004 until June 2021. He is the Chief Compliance Officer of 53 investment companies (comprised of 105 portfolios) managed by the Adviser. He is 66 years old.
CARIDAD M. CAROSELLA, Anti-Money Laundering Compliance Officer since January 2016.
Anti-Money Laundering Compliance Officer of the BNY Mellon Family of Funds and BNY Mellon Funds Trust. She is an officer of 47 investment companies (comprised of 114 portfolios) managed by the Adviser or an affiliate of the Adviser. She is 55 years old and has been an employee of the Distributor since 1997.
44
This page intentionally left blank.
45
BNY Mellon U.S. Equity Fund
240 Greenwich Street
New York, NY 10286
Adviser
BNY Mellon Investment Adviser, Inc.
240 Greenwich Street
New York, NY 10286
Sub-Adviser
Walter Scott & Partners Limited
One Charlotte Square
Edinburgh, Scotland, UK
Custodian
The Bank of New York Mellon
240 Greenwich Street
New York, NY 10286
Transfer Agent &
Dividend Disbursing Agent
BNY Mellon Transfer, Inc.
240 Greenwich Street
New York, NY 10286
Distributor
BNY Mellon Securities Corporation
240 Greenwich Street
New York, NY 10286
Ticker Symbols: | Class A: DPUAX Class C: DPUCX Class I: DPUIX Class Y: DPUYX |
Telephone Call your financial representative or 1-800-373-9387
Mail The BNY Mellon Family of Funds, 144 Glenn Curtiss Boulevard, Uniondale, NY 11556-0144
E-mail Send your request to info@bnymellon.com
Internet Information can be viewed online or downloaded at www.im.bnymellon.com
The fund files its complete schedule of portfolio holdings with the Securities and Exchange Commission (“SEC”) for the first and third quarters of each fiscal year on Form N-PORT. The fund’s Forms N-PORT are available on the SEC’s website at www.sec.gov.
A description of the policies and procedures that the fund uses to determine how to vote proxies relating to portfolio securities and information regarding how the fund voted these proxies for the most recent 12-month period ended June 30 is available at www.im.bnymellon.com and on the SEC’s website at www.sec.gov and without charge, upon request, by calling 1-800-373-9387.
© 2024 BNY Mellon Securities Corporation |
|

Item 2. Code of Ethics.
The Registrant has adopted a code of ethics that applies to the Registrant's principal executive officer, principal financial officer, principal accounting officer or controller, or persons performing similar functions. There have been no amendments to, or waivers in connection with, the Code of Ethics during the period covered by this Report.
Item 3. Audit Committee Financial Expert.
The Registrant's Board has determined that Alan H. Howard, a member of the Audit Committee of the Board, is an audit committee financial expert as defined by the Securities and Exchange Commission (the "SEC"). Mr. Howard is "independent" as defined by the SEC for purposes of audit committee financial expert determinations.
Item 4. Principal Accountant Fees and Services.
(a) Audit Fees. The aggregate fees billed for each of the last two fiscal years (the "Reporting Periods") for professional services rendered by the Registrant's principal accountant (the "Auditor") for the audit of the Registrant's annual financial statements or services that are normally provided by the Auditor in connection with the statutory and regulatory filings or engagements for the Reporting Periods, were $168,000 in 2022 and $171,360 in 2023.
(b) Audit-Related Fees. The aggregate fees billed in the Reporting Periods for assurance and related services by the Auditor that are reasonably related to the performance of the audit of the Registrant's financial statements and are not reported under paragraph (a) of this Item 4 were $36,088 in 2022 and $36,898 in 2023. These services consisted of one or more of the following: (i) agreed upon procedures related to compliance with Internal Revenue Code section 817(h), (ii) security counts required by Rule 17f-2 under the Investment Company Act of 1940, as amended, (iii) advisory services as to the accounting or disclosure treatment of Registrant transactions or events and (iv) advisory services to the accounting or disclosure treatment of the actual or potential impact to the Registrant of final or proposed rules, standards or interpretations by the Securities and Exchange Commission, the Financial Accounting Standards Boards or other regulatory or standard-setting bodies.
The aggregate fees billed in the Reporting Periods for non-audit assurance and related services by the Auditor to the Registrant's investment adviser (not including any sub-investment adviser whose role is primarily portfolio management and is subcontracted with or overseen by another investment adviser), and any entity controlling, controlled by or under common control with the investment adviser that provides ongoing services to the Registrant ("Service Affiliates"), that were reasonably related to the performance of the annual audit of the Service Affiliate, which required pre-approval by the Audit Committee were $0 in 2022 and $0 in 2023.
(c) Tax Fees. The aggregate fees billed in the Reporting Periods for professional services rendered by the Auditor for tax compliance, tax advice, and tax planning ("Tax Services") were $19,051 in 2022 and $19,051 in 2023. These services consisted of: (i) review or preparation of U.S. federal, state, local and excise tax returns; (ii) U.S. federal, state and local tax planning, advice and assistance regarding statutory, regulatory or administrative developments; (iii) tax advice regarding tax qualification matters and/or treatment of various financial instruments held or proposed to be acquired or held, and (iv) determination of Passive Foreign Investment Companies. The aggregate fees billed in the Reporting Periods for Tax Services by the Auditor to Service Affiliates, which required pre-approval by the Audit Committee were $26,949 in 2022 and $26,949 in 2023.
(d) All Other Fees. The aggregate fees billed in the Reporting Periods for products and services provided by the Auditor, other than the services reported in paragraphs (a) through (c) of this Item, were $1,913 in 2022 and $874 in 2023. These services consisted of a review of the Registrant's anti-money laundering program.
The aggregate fees billed in the Reporting Periods for Non-Audit Services by the Auditor to Service Affiliates, other than the services reported in paragraphs (b) through (c) of this Item, which required pre-approval by the Audit Committee, were $0 in 2022 and $0 in 2023.
(e)(1) Audit Committee Pre-Approval Policies and Procedures. The Registrant's Audit Committee has established policies and procedures (the "Policy") for pre-approval (within specified fee limits) of the Auditor's engagements for non-audit services to the Registrant and Service Affiliates without specific case-by-case consideration. The pre-approved services in the Policy can include pre-approved audit services, pre-approved audit-related services, pre-approved tax services and pre-approved all other services. Pre-approval considerations include whether the proposed services are compatible with maintaining the Auditor's independence. Pre-approvals pursuant to the Policy are considered annually.
(e)(2) Note. None of the services described in paragraphs (b) through (d) of this Item 4 were approved by the Audit Committee pursuant to paragraph (c)(7)(i)(C) of Rule 2-01 of Regulation S-X.
(f) None of the hours expended on the principal accountant's engagement to audit the registrant's financial statements for the most recent fiscal year were attributed to work performed by persons other than the principal accountant's full-time, permanent employees.
Non-Audit Fees. The aggregate non-audit fees billed by the Auditor for services rendered to the Registrant, and rendered to Service Affiliates, for the Reporting Periods were $2,144,335 in 2022 and $1,886,566 in 2023.
Auditor Independence. The Registrant's Audit Committee has considered whether the provision of non-audit services that were rendered to Service Affiliates, which were not pre-approved (not requiring pre-approval), is compatible with maintaining the Auditor's independence.
| (i) | Not applicable. |
(j) Not applicable.
Item 5. Audit Committee of Listed Registrants.
Not applicable.
Item 6. Investments.
| (a) | Not applicable. |
| Item 7. | Disclosure of Proxy Voting Policies and Procedures for Closed-End Management Investment Companies. |
Not applicable.
Item 8. Portfolio Managers of Closed-End Management Investment Companies.
Not applicable.
| Item 9. | Purchases of Equity Securities by Closed-End Management Investment Companies and Affiliated Purchasers. |
Not applicable.
| Item 10. | Submission of Matters to a Vote of Security Holders. |
There have been no material changes to the procedures applicable to Item 10.
| Item 11. | Controls and Procedures. |
(a) The Registrant's principal executive and principal financial officers have concluded, based on their evaluation of the Registrant's disclosure controls and procedures as of a date within 90 days of the filing date of this report, that the Registrant's disclosure controls and procedures are reasonably designed to ensure that information required to be disclosed by the Registrant on Form N-CSR is recorded, processed, summarized and reported within the required time periods and that information required to be disclosed by the Registrant in the reports that it files or submits on Form N-CSR is accumulated and communicated to the Registrant's management, including its principal executive and principal financial officers, as appropriate to allow timely decisions regarding required disclosure.
(b) There were no changes to the Registrant's internal control over financial reporting that occurred during the period covered by this report that have materially affected, or are reasonably likely to materially affect, the Registrant's internal control over financial reporting.
| Item 12. | Disclosure of Securities Lending Activities for Closed-End Management Investment Companies. |
Not applicable.
| Item 13. | Exhibits. |
(a)(1) Code of ethics referred to in Item 2.
(a)(3) Not applicable.
SIGNATURES
Pursuant to the requirements of the Securities Exchange Act of 1934 and the Investment Company Act of 1940, the Registrant has duly caused this Report to be signed on its behalf by the undersigned, thereunto duly authorized.
BNY Mellon Strategic Funds, Inc.
By: /s/ David J. DiPetrillo
David J. DiPetrillo
President (Principal Executive Officer)
Date: January 19, 2024
Pursuant to the requirements of the Securities Exchange Act of 1934 and the Investment Company Act of 1940, this Report has been signed below by the following persons on behalf of the Registrant and in the capacities and on the dates indicated.
By: /s/ David J. DiPetrillo
David J. DiPetrillo
President (Principal Executive Officer)
Date: January 19, 2024
By: /s/ James Windels
James Windels
Treasurer (Principal Financial Officer)
Date: January 19, 2024
EXHIBIT INDEX
(a)(1) Code of ethics referred to in Item 2.
(a)(2) Certifications of principal executive and principal financial officers as required by Rule 30a-2(a) under the Investment Company Act of 1940. (EX-99.CERT)
(b) Certification of principal executive and principal financial officers as required by Rule 30a-2(b) under the Investment Company Act of 1940. (EX-99.906CERT)