Exhibit 99.2
December 2020 First Keystone Corporation Subordinated Notes Offering Presentation CONFIDENTIAL
Notice to Recipients 2 This confidential presentation (this “Presentation”) has been prepared solely for general informational purposes by First Key sto ne Corporation (the “Company,” the “holding company,” “we” or “our”), and is being furnished solely for use by prospective participants in considering participation in the propose d p rivate offering (the “Offering”) of the Company’s subordinated notes (the “Securities”). No representation or warranty as to the accuracy, completeness, or fairness of such information is bei ng made by the Company or any other person, and neither the Company nor any other person shall have any liability for any information contained herein, or for any omissions from thi s P resentation or any other written or oral communications transmitted to the recipient by the Company or any other person in the course of the recipient’s evaluation of the Offering. The Securities are not a deposit or bank account, and are not, and will not be, insured or guaranteed by the Federal Deposit Ins urance Corporation (the “FDIC”) or any other federal or state government agency. Neither the Securities nor the investment in the Securities has been approved or disapproved by the Sec urities and Exchange Commission (the “SEC”), the FDIC, the Board of Governors of the Federal Reserve System, the Pennsylvania Department of Banking and Securities or any othe r f ederal or state regulatory authority, nor has any authority passed upon or endorsed the merits of the Offering or the accuracy or adequacy of this Presentation. Any representa tio n to the contrary is a criminal offense. The securities referenced in this Presentation have not been registered under the Securities Act of 1933, as amended, or any state securitie s l aws, and may not be offered or sold absent registration or an exemption from registration under applicable law. The Securities are being offered only to individuals and entities that qualify as an “accredited investor,” as defined in Rul e 5 01(a)(1) - (3) and (7) of Regulation D promulgated under the Securities Act of 1933, as amended. This presentation does not constitute an offer to sell, or a solicitation of an offer to bu y, any securities of the Company by any person in any jurisdiction in which it is unlawful for such person to make such an offering or solicitation. The Company has authorized Performance Trust Capital Partners, LLC, to act as its sole placement agent in the Offering. The information contained herein is intended only as an outline and summary that has been prepared to assist interested parti es in making their own evaluations of the Company. It does not purport to be all - inclusive or to contain all of the information that a prospective participant may desire. Each recipi ent of the information and data contained herein should perform its own independent investigation and analysis of the Offering and the value of the Company. The information and data co ntained herein are not a substitute for a recipient’s independent evaluation and analysis. In making an investment decision, prospective participants must rely on their own examination of the Company, including the m eri ts and risks involved. Prospective participants are urged to consult with their own legal, tax, investment and accounting advisers with respect to the consequences of an investm ent in the Securities. In the event that any portion of this Presentation is inconsistent with or contrary to any of the terms of the subordinated note purchase agreement (the “NPA”), th e N PA shall control. Except as otherwise indicated, this presentation speaks as of the date hereof. The delivery of this presentation shall not, under any circumstances, create any imp lication that there has been no change in the affairs of the Company after the date hereof and the Company assumes no obligation to update such information except to the extent requi red by applicable law. You will be given the opportunity to ask questions of and receive answers from Company representatives concerning the Company ’s business and the terms and conditions of the Offering, and the Company may provide you with additional relevant information that you may reasonably request to the extent the Company possesses such information or can obtain it without unreasonable effort or expense. Except for information provided in response to such requests, the Company has not aut hor ized any other person to give you information that is not found in this Presentation. If such unauthorized information is obtained or provided, the Company cannot and does not ass ume responsibility for its accuracy, credibility, or validity. This Presentation may contain statistics and other data that in some cases has been obtained from or compiled from informatio n m ade available by third - party service providers, including references to the Performance Trust PT Score developed by Performance Trust Capital Partners, LLC. The Company mak es no representation or warranty, express or implied, with respect to the accuracy, reasonableness or completeness of such information. The Company is not providing you with any legal, business, investment, tax or other advice regarding an investment in the Sec uri ties. You should consult with your own advisors as needed to assist you in making your investment decision and to advise you whether you are legally permitted to purchase the S ecu rities. The Company reserves the right to withdraw or amend this Offering for any reason and to reject any NPA in whole or in part.
Offering Disclaimer This Presentation has been prepared based on information regarding our operations, as well as information from public sources . T he information in this Presentation is confidential and may not be reproduced or redistributed, passed on or divulged, directly or indirectly, to any other person. The Company reserves th e right to request the return of this Presentation at any time. Any offering of Securities may be made only by the NPA and the information contained herein will be superseded in its entiret y b y such NPA. This Presentation does not contain all of the information you should consider before investing in Securities of the Company and should not be construed as investment, lega l, regulatory or tax advice. The Securities will be subject to significant restrictions and limitations on their liquidity. Only potential investors who can bear the risk of an unregistere d i lliquid investment should consider investment in the Securities. This Presentation and oral statements made from time to time by the Company’s representatives may contain “forward - looking state ments" within the meaning of the Private Securities Litigation Reform Act of 1995 that are subject to risks and uncertainties. You should not place undue reliance on those state men ts because they are subject to numerous risks and uncertainties relating to the Company’s operations and business environment, all of which are difficult to predict and may be be yond our control. Forward - looking statements include information concerning the Company’s future results, interest rates and the interest rate environment, loan and deposit growt h, loan performance, operations, employees and business strategy. These statements often include words such as "may," "believe," "expect," "anticipate," "intend," “potential,” “oppo rtu nity,” “could,” “project,” “seek,” “should,” “will,” “would,” "plan," "estimate" or other similar expressions. Forward - looking statements are not a guarantee of future performance or results, are ba sed on information available at the time the statements are made and involve known and unknown risks, uncertainties and other factors that could cause our actual results to differ mater ial ly from the information in the forward - looking statements and can change as a result of many possible events or factors, not all of which are known to us or in our control. These factors inc lude but are not limited to: (i) prevailing local, regional, national, and international economic conditions and the impact they may have on us and our customers and our assessment of that impact; (i i) changes in interest rates, loan demand and real estate values, any of which can materially affect origination levels and gain on sale results in our business, as well as other aspe cts of our financial performance, including earnings on interest - earning assets; (iii) the level of defaults, losses and prepayments on loans made by us, whether held in portfolio or sold in th e whole loan secondary markets, which can materially affect charge - off levels and required credit loss reserve levels; (iv) changes in monetary and fiscal policies of the U.S. Government, including policies of the U.S. Treasury and the Board of Governors of the Federal Reserve System or future actions or inactions by such entities, including the effects of short - and lon g - term federal budget and tax negotiations and a failure to increase the government debt limit or a prolonged shutdown of the federal government and the effects of economic conditions, par ticularly with regard to the negative impact of severe, wide - ranging and continuing disruptions caused by the spread of Coronavirus Disease 2019 (COVID - 19) and responses thereto on current customers and the operation of the Company, specifically the effect of the economy on loan customers’ ability to repay loans; (v) changes in the banking and other financ ial services regulatory environment; (vi) competition with national, regional and community financial institutions; (vii) failures of or interruptions in the communications and information sy stems on which we rely to conduct business; (viii) expected or potential impacts of public health crises (such as governmental, social and economic effects of the novel coronavirus (COVID - 19) pandemic) ; (ix) levels of unemployment in the Company’s market area; (x) the impact of the COVID - 19 pandemic on our business, including the impact of actions taken by governmental and regulat ory authorities in response to such pandemic, such as the CARES Act and the programs established thereunder, and our participation in such programs; (xi) volatility and disruption in nat ional and international financial markets; (xii) the effect of changes in accounting policies and practices as may be adopted by the regulatory agencies, as well as the Financial Accountin g S tandards Board, and other accounting standard setters, such as the Current Expected Credit Losses (CECL) accounting standard; and (xiii) our success at managing the risks involved in the foregoing factors. The financial condition and results of operations of the Company and the Securities are subject to the risk factors included as an exhibit to the NPA. Each recipie nt of the information and data contained herein should review the risk factors contained in such exhibit before making a decision to invest in the Securities. All statements in this Presentation, including forward - looking statements, speak only as of the date they are made. Although the Company believes that these forward - looking statements are based on reasonable assumptions, beliefs and expectations, if a change occurs or our beliefs, assumptions and expectations we re incorrect, our business, financial condition, liquidity or results of operations may vary materially from those expressed in our forward - looking statements. New risks and uncertainties a rise from time to time, and we cannot predict these events or how they may affect the Company. The Company has no duty to, and does not intend to, update or revise the forward - looking statem ents after the date on which they are made. In light of these risks and uncertainties, you should keep in mind that any forward - looking statement made in this Presentation or elsewhere might not reflect our actual results. Certain of the information contained herein may be derived from information provided by industry sources. The Company believe s t hat such information is accurate and that the sources from which it has been obtained are reliable. The Company cannot guarantee the accuracy of such information, however, and has not ind ependently verified such information. This presentation includes certain measures that are not calculated under United States generally accepted accounting princip les (“GAAP”). These non - GAAP financial measures should be considered only as supplemental to, and not superior to, financial measures prepared in accordance with GAAP. 3
Table of Contents Executive Summary 5 I Management Team, Board & Ownership Information 15 II Assets Highlights 19 III Liabilities Highlights 28 IV Capital Highlights 32 V Income Statement Highlights 35 VI Appendix 40 VII 4
I. Executive Summary 5

Terms of the Offered Securities Issuer: First Keystone Corporation , holding company of First Keystone Community Bank (the "Bank") Security: Subordinated Debt Principal Amount : $20 million Term: 10 - year term, 5 - year no - call period Coupon: [TBD] fixed for 5 years; floating thereafter at [TBD] spread to SOFR Optional Redemption: Redeemable at par beginning 5 years prior to maturity in 10 - NC5 Credit Rating: -- Regulatory Capital: Structured consistent with requirements for Tier 2 capital treatment at the holding company Use of Proceeds: Proceeds will be used for general corporate purposes, including to support subsidiary bank regulatory capital ratios Expected Closing : December 2020 Sole Placement Agent: Performance Trust Capital Partners, LLC 6
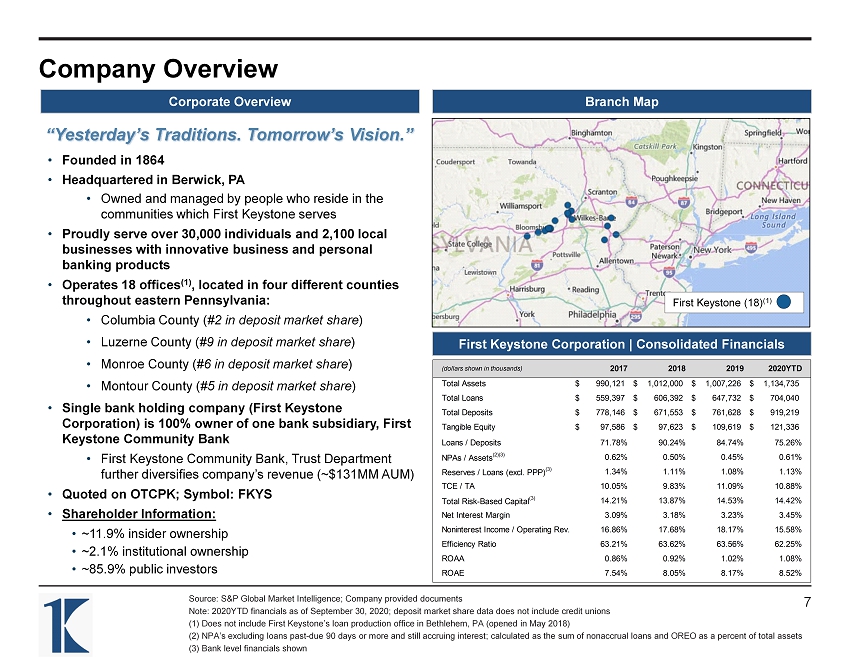
(dollars shown in thousands) 2017 2018 2019 2020YTD Total Assets 990,121$ 1,012,000$ 1,007,226$ 1,134,735$ Total Loans 559,397$ 606,392$ 647,732$ 704,040$ Total Deposits 778,146$ 671,553$ 761,628$ 919,219$ Tangible Equity 97,586$ 97,623$ 109,619$ 121,336$ Loans / Deposits 71.78% 90.24% 84.74% 75.26% NPAs / Assets (2)(3) 0.62% 0.50% 0.45% 0.61% Reserves / Loans (excl. PPP) (3) 1.34% 1.11% 1.08% 1.13% TCE / TA 10.05% 9.83% 11.09% 10.88% Total Risk-Based Capital (3) 14.21% 13.87% 14.53% 14.42% Net Interest Margin 3.09% 3.18% 3.23% 3.45% Noninterest Income / Operating Rev. 16.86% 17.68% 18.17% 15.58% Efficiency Ratio 63.21% 63.62% 63.56% 62.25% ROAA 0.86% 0.92% 1.02% 1.08% ROAE 7.54% 8.05% 8.17% 8.52% Company Overview Source: S&P Global Market Intelligence; Company provided documents Note: 2020YTD financials as of September 30, 2020; deposit market share data does not include credit unions (1) Does not include First Keystone’s loan production office in Bethlehem, PA (opened in May 2018) (2) NPA’s excluding loans past - due 90 days or more and still accruing interest; calculated as the sum of nonaccrual loans and OR EO as a percent of total assets (3) Bank level financials shown Branch Map Corporate Overview First Keystone Corporation | Consolidated Financials .” • Founded in 1864 • Headquartered in Berwick, PA • Owned and managed by people who reside in the communities which First Keystone serves • Proudly serve over 30,000 individuals and 2,100 local businesses with innovative business and personal banking products • Operates 18 offices (1) , located in four different counties throughout eastern Pennsylvania: • Columbia County ( #2 in deposit market share ) • Luzerne County ( #9 in deposit market share ) • Monroe County ( #6 in deposit market share ) • Montour County ( #5 in deposit market share ) • Single bank holding company (First Keystone Corporation) is 100% owner of one bank subsidiary, First Keystone Community Bank • First Keystone Community Bank, Trust Department further diversifies company’s revenue (~$131MM AUM) • Quoted on OTCPK; Symbol: FKYS • Shareholder Information: • ~11.9% insider ownership • ~2.1% institutional ownership • ~85.9% public investors First Keystone (18) (1) 7 “Yesterday’s Traditions. Tomorrow’s Vision.”
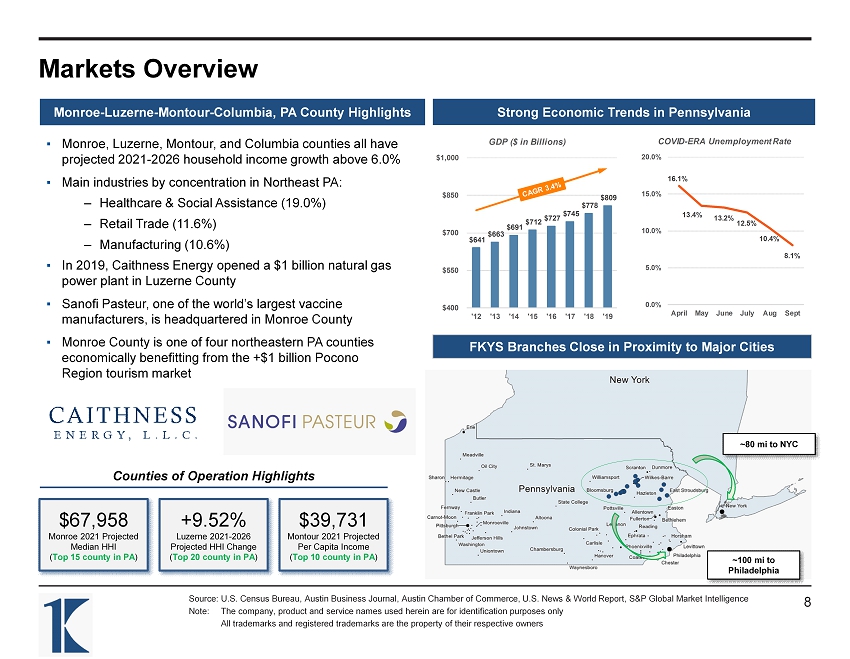
Source: U.S. Census Bureau, Austin Business Journal, Austin Chamber of Commerce, U.S. News & World Report, S&P Global Market Int elligence Note: The company, product and service names used herein are for identification purposes only All trademarks and registered trademarks are the property of their respective owners 8 Markets Overview FKYS Branches Close in Proximity to Major Cities ~80 mi to NYC ~100 mi to Philadelphia Monroe - Luzerne - Montour - Columbia, PA County Highlights ▪ Monroe, Luzerne, Montour, and Columbia counties all have projected 2021 - 2026 household income growth above 6.0% ▪ Main industries by concentration in Northeast PA: – Healthcare & Social Assistance (19.0%) – Retail Trade (11.6%) – Manufacturing (10.6%) ▪ In 2019, Caithness Energy opened a $1 billion natural gas power plant in Luzerne County ▪ Sanofi Pasteur, one of the world’s largest vaccine manufacturers, is headquartered in Monroe County ▪ Monroe County is one of four northeastern PA counties economically benefitting from the +$1 billion Pocono Region tourism market $39,731 Montour 2021 Projected Per Capita Income ( Top 10 county in PA ) $67,958 Monroe 2021 Projected Median HHI ( Top 15 county in PA ) +9.52% Luzerne 2021 - 2026 Projected HHI Change ( Top 20 county in PA ) Counties of Operation Highlights 16.1% 13.4% 13.2% 12.5% 10.4% 8.1% 0.0% 5.0% 10.0% 15.0% 20.0% April May June July Aug Sept COVID - ERA Unemployment Rate Strong Economic Trends in Pennsylvania $641 $663 $691 $712 $727 $745 $778 $809 $400 $550 $700 $850 $1,000 '12 '13 '14 '15 '16 '17 '18 '19 GDP ($ in Billions)

Investment Highlights Source: S&P Global Market Intelligence; Company provided documents (1) Net noninterest expense / AA calculation detailed on page 39 (2) Statistic represents 79% of loans classified as CRE loans for internal collateral purposes (3) Statistic represents 89% of loans classified as residential real estate for internal collateral purposes Experienced Management Team & Board • Senior management team has decades of banking experience specific to northeast Pennsylvania and is committed to providing inn ova tive business and personal banking products tailored to their customers needs • Strong continuity in leadership across senior management and the board of directors Robust Profitability Metrics • Historically strong earner; YTD ROA of 1.08% (average ROA from January 1, 2016 to September 30, 2020 of 0.97%) • Exceptional investment portfolio performance performing in the 97 th percentile of all banks from a 3 - year total return perspective (ranked 6 th out of 138 banks in Pennsylvania) • Low and consistent efficiency ratio, highlighted in average of 62.29% since 2016; 62.25% for the nine months ended September 30, 2020 • Net noninterest expense / avg. assets (1) has remained well below 2.00% each of the past 5 quarters (1.76% at 9/30/20), emphasizing management’s focus on expense controls • First Keystone has $0 BHC debt as of September 30, 2020; pro forma debt / equity of ~14% with $20MM subordinated debt issuanc e • Approximately 12.0x – 13.0x debt service coverage based on annualized 2020YTD earnings; $11.8MM of cash at holding company at 9/ 30/2020 Strong Capital Position, Balanced Loan Portfolio, and Solid Asset Quality • Bank has consistently remained well above regulatory “well - capitalized” levels • First Keystone Community Bank has a 9.31% leverage ratio and 14.42% total risk - based ratio as of September 30, 2020 pre - capital raise • Balanced loan portfolio with notable credit metrics (Avg. LTV of CRE loans of 60% (2) and Avg. FICO of Residential RE loans of 740 (3) ) • Strong historical bank asset quality with NPA’s / Assets of 0.61% and NCO’s / Avg. Loans of 0.02% as of September 30, 2020; S inc e 2017, NCO’s / Avg. Loans have never hit more than 16bps on year - end reporting Steady Growth in Attractive Northeast PA Markets • Measured organic balance sheet growth over the past 4 years; Total asset CAGR of 3.9% since 2016 • Deposit growth supported by sturdy economic trends in the northeastern PA region; the Bank holds ~31% of total deposits in Co lum bia County, PA Balanced Risk Profile • PT Score™ of 177 (out of 500+) as of 9/30/20 BEFORE the capital raise suggests low structural risk and very low overall risk score within the PT Score™ risk - reward spectrum • Sub 100 PT Score post $20MM subordinated debt issuance 9
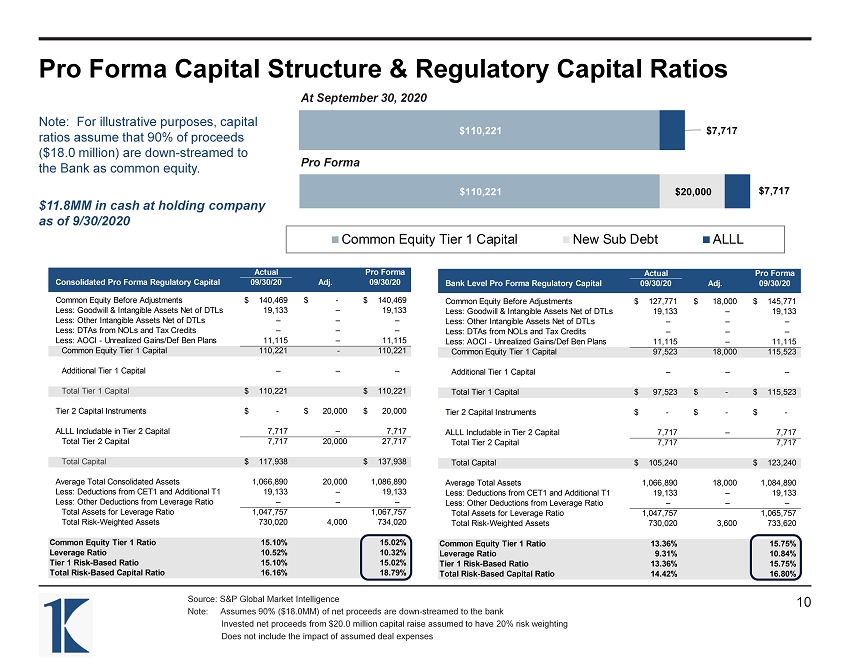
$110,221 $20,000 $7,717 Common Equity Tier 1 Capital New Sub Debt ALLL $110,221 $7,717 Actual Pro Forma Bank Level Pro Forma Regulatory Capital 09/30/20 Adj. 09/30/20 Common Equity Before Adjustments 127,771$ 18,000$ 145,771$ Less: Goodwill & Intangible Assets Net of DTLs 19,133 – 19,133 Less: Other Intangible Assets Net of DTLs – – – Less: DTAs from NOLs and Tax Credits – – – Less: AOCI - Unrealized Gains/Def Ben Plans 11,115 – 11,115 Common Equity Tier 1 Capital 97,523 18,000 115,523 Additional Tier 1 Capital – – – Total Tier 1 Capital 97,523$ -$ 115,523$ Tier 2 Capital Instruments -$ -$ -$ ALLL Includable in Tier 2 Capital 7,717 – 7,717 Total Tier 2 Capital 7,717 7,717 Total Capital 105,240$ 123,240$ Average Total Assets 1,066,890 18,000 1,084,890 Less: Deductions from CET1 and Additional T1 19,133 – 19,133 Less: Other Deductions from Leverage Ratio – – – Total Assets for Leverage Ratio 1,047,757 1,065,757 Total Risk-Weighted Assets 730,020 3,600 733,620 Common Equity Tier 1 Ratio 13.36% 15.75% Leverage Ratio 9.31% 10.84% Tier 1 Risk-Based Ratio 13.36% 15.75% Total Risk-Based Capital Ratio 14.42% 16.80% Actual Pro Forma Consolidated Pro Forma Regulatory Capital 09/30/20 Adj. 09/30/20 Common Equity Before Adjustments 140,469$ -$ 140,469$ Less: Goodwill & Intangible Assets Net of DTLs 19,133 – 19,133 Less: Other Intangible Assets Net of DTLs – – – Less: DTAs from NOLs and Tax Credits – – – Less: AOCI - Unrealized Gains/Def Ben Plans 11,115 – 11,115 Common Equity Tier 1 Capital 110,221 - 110,221 Additional Tier 1 Capital – – – Total Tier 1 Capital 110,221$ 110,221$ Tier 2 Capital Instruments -$ 20,000$ 20,000$ ALLL Includable in Tier 2 Capital 7,717 – 7,717 Total Tier 2 Capital 7,717 20,000 27,717 Total Capital 117,938$ 137,938$ Average Total Consolidated Assets 1,066,890 20,000 1,086,890 Less: Deductions from CET1 and Additional T1 19,133 – 19,133 Less: Other Deductions from Leverage Ratio – – – Total Assets for Leverage Ratio 1,047,757 1,067,757 Total Risk-Weighted Assets 730,020 4,000 734,020 Common Equity Tier 1 Ratio 15.10% 15.02% Leverage Ratio 10.52% 10.32% Tier 1 Risk-Based Ratio 15.10% 15.02% Total Risk-Based Capital Ratio 16.16% 18.79% Pro Forma Capital Structure & Regulatory Capital Ratios Source: S&P Global Market Intelligence Note: Assumes 90% ($18.0MM) of net proceeds are down - streamed to the bank Invested net proceeds from $20.0 million capital raise assumed to have 20% risk weighting Does not include the impact of assumed deal expenses At September 30, 2020 Pro Forma Note: For illustrative purposes, capital ratios assume that 90% of proceeds ($18.0 million) are down - streamed to the Bank as common equity. $11.8MM in cash at holding company as of 9/30/2020 10

Source: Company documents, S&P Global Market Intelligence (1) 2020E consolidated based on 09/30/20 YTD annualized pre - tax net income (2) 2020E bank net income based on 9/30/20 YTD annualized net income (3) Pro forma September 30, 2020 bank level equity assumes First Keystone down - streams 90% of proceeds ($18.0MM) to the bank as common equity Debt Service Coverage Ratio 11 ($ in thousands) Interest Coverage 2019 9/30/20 YTD Ann. Consolidated Pre-Tax Earnings Consolidated Pre-Tax Income, Ex Budgeted Sub-Debt (1) 11,341 12,968 Debt Expense – – A Pre-Tax Earnings Before BHC Debt Interest Expense 11,341 12,968 BHC Debt Interest Expense B Total Interest Expense - Sub Debt at 4.50% & Other Debt Expense 900 900 C Total Interest Expense - Sub Debt at 4.75% & Other Debt Expense 950 950 D Total Interest Expense - Sub Debt at 5.00% & Other Debt Expense 1,000 1,000 Pro Forma Interest Coverage - A / B 12.6x 14.4x Pro Forma Interest Coverage - A / C 11.9x 13.7x Pro Forma Interest Coverage - A / D 11.3x 13.0x Bank Net Income Coverage of BHC Interest Expense Bank Net Income (2) 9,962 12,049 BHC Operating Expenses 125 178 E Bank Net Income Less BHC Operating Expenses 9,837 11,871 Pro Forma Interest Coverage - E / B 10.9x 13.2x Pro Forma Interest Coverage - E / C 10.4x 12.5x Pro Forma Interest Coverage - E / D 9.8x 11.9x Pro Forma Debt / Equity and Double Leverage 12/31/19 A 09/30/20 A 09/30/20 PF Consolidated Equity $128,752 $140,469 $140,469 Trust Preferred – – – Senior Debt / Long-Term Borrowings – – – Subordinated Debt – – $20,000 Debt / Equity - - 14.2% Debt / Equity (ex. AOCI) - - 15.5% Bank Equity (3) $116,417 $127,771 $145,771 Double Leverage Ratio 90.4% 91.0% 103.8% Note: $11.8MM in cash at holding company as of 9/30/2020
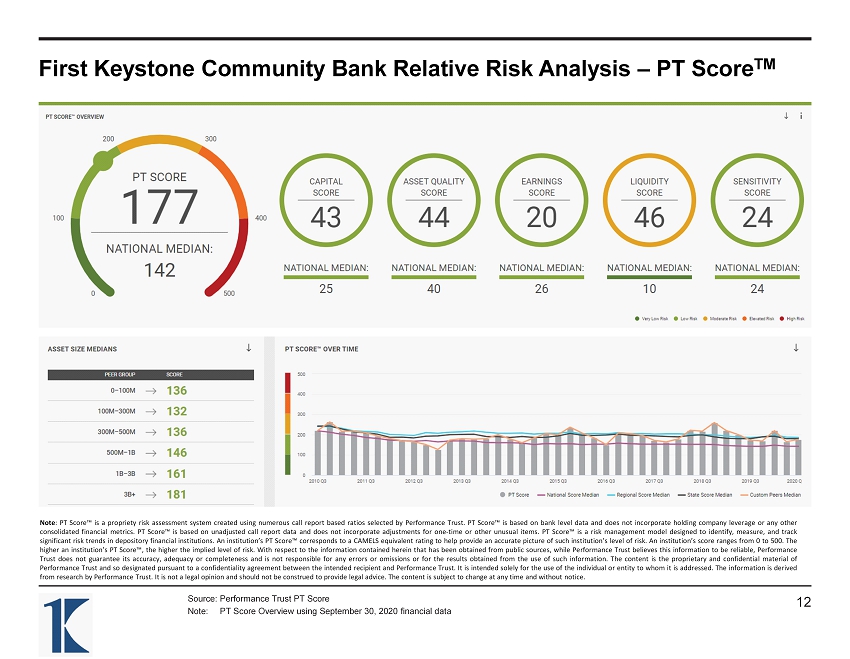
First Keystone Community Bank Relative Risk Analysis – PT Score TM Source: Performance Trust PT Score Note: PT Score Overview using September 30, 2020 financial data Note : PT Score™ is a propriety risk assessment system created using numerous call report based ratios selected by Performance Trust . PT Score™ is based on bank level data and does not incorporate holding company leverage or any other consolidated financial metrics . PT Score™ is based on unadjusted call report data and does not incorporate adjustments for one - time or other unusual items . PT Score™ is a risk management model designed to identify, measure, and track significant risk trends in depository financial institutions . An institution’s PT Score™ corresponds to a CAMELS equivalent rating to help provide an accurate picture of such institution’s level of risk . An institution’s score ranges from 0 to 500 . The higher an institution’s PT Score™, the higher the implied level of risk . With respect to the information contained herein that has been obtained from public sources, while Performance Trust believes this information to be reliable, Performance Trust does not guarantee its accuracy, adequacy or completeness and is not responsible for any errors or omissions or for the results obtained from the use of such information . The content is the proprietary and confidential material of Performance Trust and so designated pursuant to a confidentiality agreement between the intended recipient and Performance Trust . It is intended solely for the use of the individual or entity to whom it is addressed . The information is derived from research by Performance Trust . It is not a legal opinion and should not be construed to provide legal advice . The content is subject to change at any time and without notice . 12
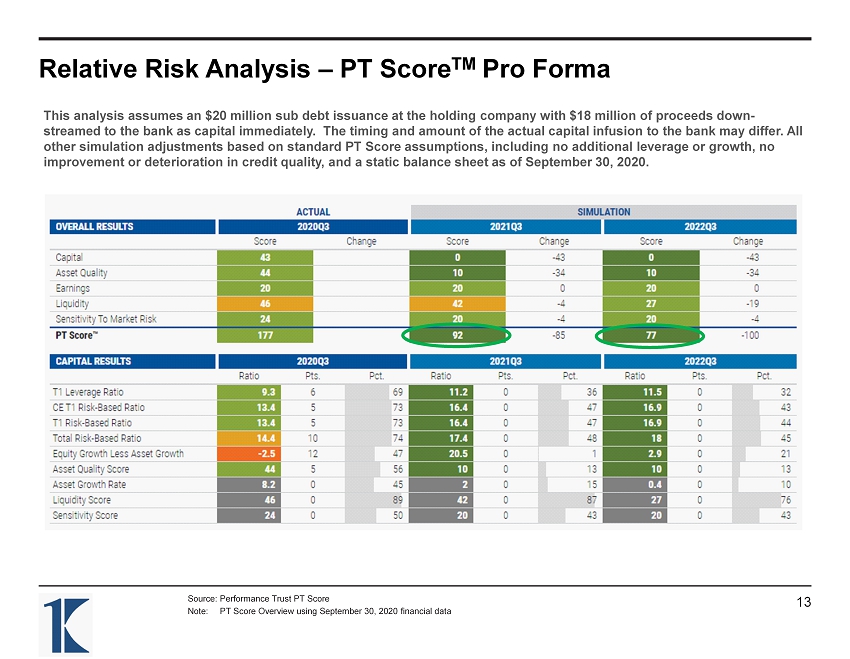
Relative Risk Analysis – PT Score TM Pro Forma Source: Performance Trust PT Score Note: PT Score Overview using September 30, 2020 financial data 13 This analysis assumes an $20 million sub debt issuance at the holding company with $18 million of proceeds down - streamed to the bank as capital immediately. The timing and amount of the actual capital infusion to the bank may differ. Al l other simulation adjustments based on standard PT Score assumptions, including no additional leverage or growth, no improvement or deterioration in credit quality, and a static balance sheet as of September 30, 2020.
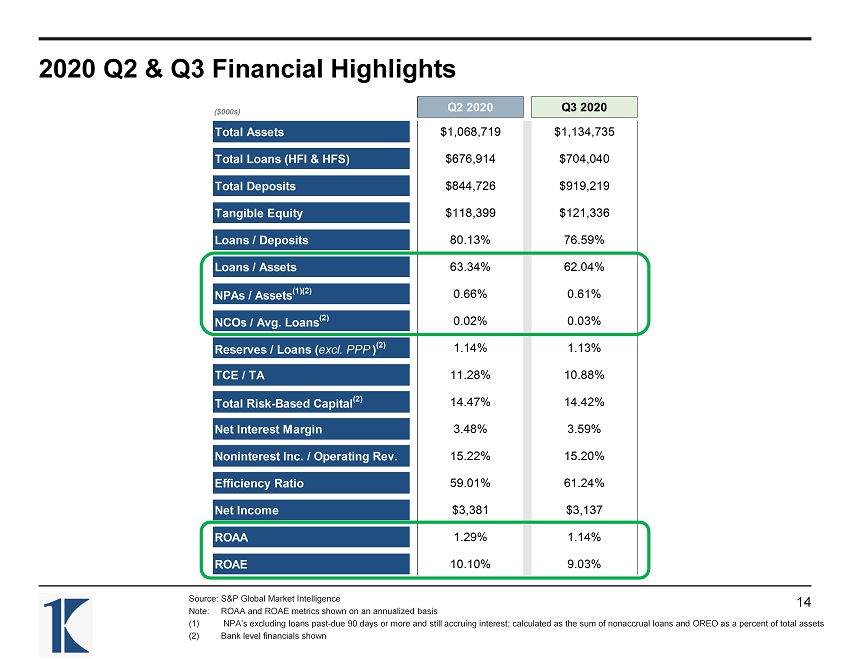
($000s) Q2 2020 Q3 2020 Total Assets $1,068,719 $1,134,735 Total Loans (HFI & HFS) $676,914 $704,040 Total Deposits $844,726 $919,219 Tangible Equity $118,399 $121,336 Loans / Deposits 80.13% 76.59% Loans / Assets 63.34% 62.04% NPAs / Assets (1)(2) 0.66% 0.61% NCOs / Avg. Loans (2) 0.02% 0.03% Reserves / Loans ( excl. PPP ) (2) 1.14% 1.13% TCE / TA 11.28% 10.88% Total Risk-Based Capital (2) 14.47% 14.42% Net Interest Margin 3.48% 3.59% Noninterest Inc. / Operating Rev. 15.22% 15.20% Efficiency Ratio 59.01% 61.24% Net Income $3,381 $3,137 ROAA 1.29% 1.14% ROAE 10.10% 9.03% 2020 Q2 & Q3 Financial Highlights Source: S&P Global Market Intelligence Note: ROAA and ROAE metrics shown on an annualized basis (1) NPA’s excluding loans past - due 90 days or more and still accruing interest; calculated as the sum of nonaccrual loans and O REO as a percent of total assets (2) Bank level financials shown 14

II. Management Team, Board & Ownership Information 15

Elaine A. Woodland – President and CEO Experienced Management Team Source: Company provided biographies 16 Elaine joined First Keystone Community Bank on November 1, 2007 when the Bank acquired Pocono Community Bank where she served as a Commercial Loan Officer. In 2008 she was promoted to Sr. VP / Sr. Lending Officer; in 2011 to Director of Lending; in 2014 to Chief Operating Officer; in April 2018 to Interim President and Chief Executive Officer and lastly September 2018 to Presi den t and Chief Executive Officer. Elaine graduated from Bloomsburg University with a BS in Mathematics. Her education also includes th e Stonier Graduate School of Banking; Wharton Leadership Certificate, The Wharton School; various Pennsylvania Bankers and AIB Certifications; Cohen Brown Extraordinary Business Development Techniques; Dale Carnegie Program; RMA Certified Lender; Centr al Atlantic School of Commercial Lending; and PA Bankers Executive Leadership Institute. Diane C. A. Rosler – SVP and CFO Diane began employment on July 2, 1990 as the Purchasing Agent. She was promoted to Accounting Manager in September 1992; Controller in January 2006; and Chief Financial Officer in April 2007. Diane earned a BS in Accounting at Goldey - Beacom College. Her education also includes Pennsylvania Bankers Association Advanced School of Banking; ABA Stonier Graduate School of Banking; Wharton Leadership Certificate, The Wharton School; Dale Carnegie Program and PA Bankers Executive Leadership Institute. Mark McDonald – SVP and Chief Credit Officer Mark began employment on January 2, 2006 as Chief Credit Officer, the position he holds today. He earned a BS in Economics fr om Bucknell University. He also graduated from the Central Atlantic Advanced School of Banking – Top Honor Student; Stonier Graduat e School of Banking; and Wharton Leadership Certificate, The Wharton School.

Experienced Management Team (Con’t) Source: Company provided biographies 17 Jonathan R. Littlewood – VP and Chief Lending Officer Jonathan joined First Keystone Community Bank on January 7, 2008 as Business Deposit Specialist. He was promoted to Commercia l Services Officer in September 2008 and Chief Lending Officer in August 2020. Jon earned a BA in Business Management from Gettysburg College and a Masters in Applied Project Management from Villanova University. His education also includes Pennsyl van ia Bankers Association Advanced School of Banking, School of Commercial Lending and Sales Coaching Curriculum. Jonathan is currently enrolled in ABA Stonier Graduate School of Banking. Jeff Wozniak – SVP, Information Security Officer and IT Manager Jeff began his employment with the Bank as a Personal Computer Specialist on December 20, 2001. He was promoted to Network Administrator December 2003; Asst. IT Manager April 2006; Technology Systems Manager May 2009; Technology Systems Manager May 2001; IT Manager/Information Security Officer May 2015; SVP/Sr. IT Mgr./Information Security Officer. Jeff earned a BS i n Business Administration, majoring in Computer Information Systems.

Ownership Information Source: S&P Global market intelligence, recent 13F filings, proxy statements, and Form 4’s Holder Common Stock Equivalent Held (actual) Percent of Common Shares Outstanding (%) Position with First Keystone William E. Rinehart 138,693 2.36 Independent Director Robert A. Bull 134,072 2.29 Chairman Fulton Financial Advisors NA 124,349 2.13 – Robert E. Bull 120,565 2.06 Director John E. Arndt 117,147 2.00 Vice Chairman Jerome F. Fabian 59,063 1.01 Director Emeritus Joseph B. Conahan Jr. 56,441 0.96 Director Emeritus Michael L. Jezewski 28,819 0.49 Independent Director Nancy Jean Marr 11,531 0.20 Independent Director David R. Saracino 8,825 0.15 Secretary & Independent Director Bull & Bull, LLP 7,636 0.13 – Elaine A. Woodland 4,900 0.08 CEO, President & Director John G. Gerlach 4,477 0.08 Consultant, Advisor & Directors Emeritus Diane C. A. Rosler 3,103 0.05 Senior VP, CFO & Treasurer Donald Matthew Bower 1,716 0.03 Independent Director Mark James McDonald 1,145 0.02 Senior VP & Chief Credit Officer Jonathan Robert Littlewood 285 – VP & Chief Lending Officer Jeffrey Wozniak 206 – Senior VP & Senior IT Manager Ownership Distribution By Holder Type Ownership Disclosures Individuals/ Insiders , 11.9% Institutions , 2.1% Corporations , 0.1% Public and Other , 85.9% • ~11.9% Ownership - Management and Directors of the Company 18 Total Ownership % of Composition Shares (000s) Outstanding Local 2,057 35% Non-local 3,809 65%

III. Assets Highlights 19
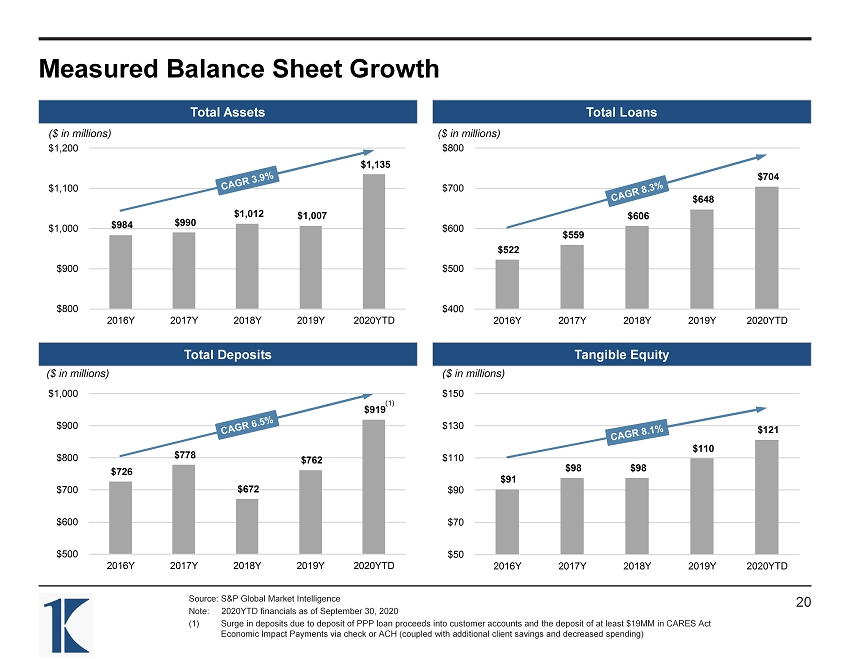
$726 $778 $672 $762 $919 $500 $600 $700 $800 $900 $1,000 2016Y 2017Y 2018Y 2019Y 2020YTD $91 $98 $98 $110 $121 $50 $70 $90 $110 $130 $150 2016Y 2017Y 2018Y 2019Y 2020YTD $984 $990 $1,012 $1,007 $1,135 $800 $900 $1,000 $1,100 $1,200 2016Y 2017Y 2018Y 2019Y 2020YTD $522 $559 $606 $648 $704 $400 $500 $600 $700 $800 2016Y 2017Y 2018Y 2019Y 2020YTD Measured Balance Sheet Growth Source: S&P Global Market Intelligence Note: 2020YTD financials as of September 30, 2020 (1) Surge in deposits due to deposit of PPP loan proceeds into customer accounts and the deposit of at least $19MM in CARES Act Economic Impact Payments via check or ACH (coupled with additional client savings and decreased spending) Total Loans Total Assets Tangible Equity Total Deposits ($ in millions) ($ in millions) ($ in millions) ($ in millions) 20 (1)
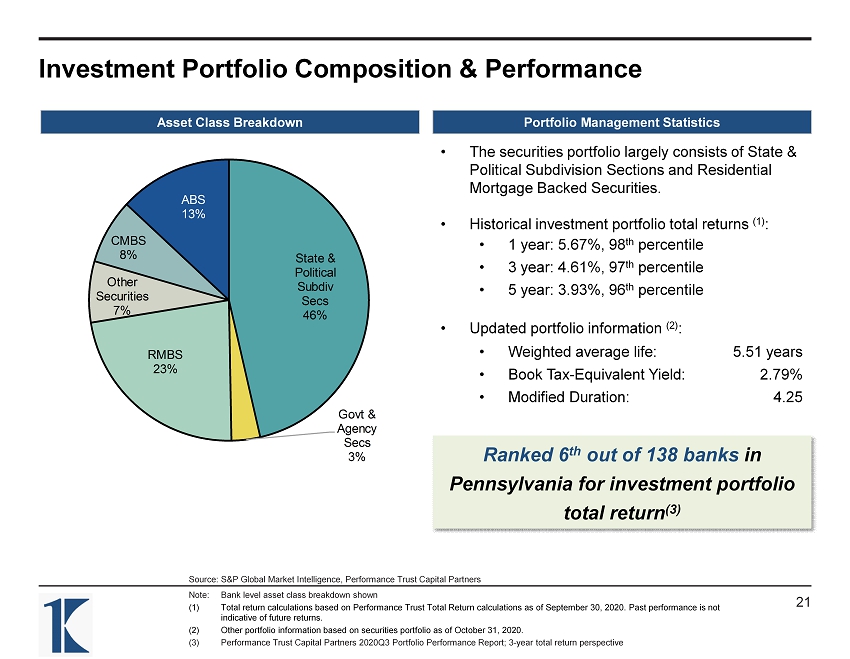
Investment Portfolio Composition & Performance Source: S&P Global Market Intelligence, Performance Trust Capital Partners Note: Bank level asset class breakdown shown (1) Total return calculations based on Performance Trust Total Return calculations as of September 30, 2020. Past performance is not indicative of future returns. (2) Other portfolio information based on securities portfolio as of October 31, 2020. (3) Performance Trust Capital Partners 2020Q3 Portfolio Performance Report; 3 - year total return perspective State & Political Subdiv Secs 46% Govt & Agency Secs 3% RMBS 23% Other Securities 7% CMBS 8% ABS 13% Portfolio Management Statistics Asset Class Breakdown • The securities portfolio largely consists of State & Political Subdivision Sections and Residential Mortgage Backed Securities. • Historical investment portfolio total returns (1) : • 1 year: 5.67%, 98 th percentile • 3 year: 4.61%, 97 th percentile • 5 year: 3.93%, 96 th percentile • Updated portfolio information (2) : • Weighted average life: 5.51 years • Book Tax - Equivalent Yield: 2.79% • Modified Duration: 4.25 21 Ranked 6 th out of 138 banks in Pennsylvania for investment portfolio total return (3)
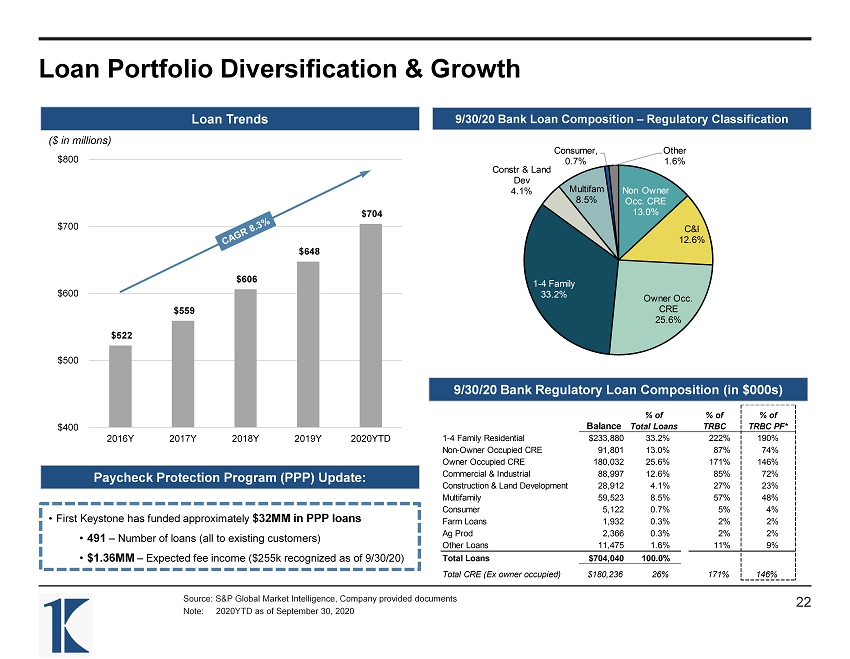
$522 $559 $606 $648 $704 $400 $500 $600 $700 $800 2016Y 2017Y 2018Y 2019Y 2020YTD Loan Portfolio Diversification & Growth Source: S&P Global Market Intelligence, Company provided documents Note: 2020YTD as of September 30, 2020 9/30/20 Bank Loan Composition – Regulatory Classification Loan Trends ($ in millions) 9/30/20 Bank Regulatory Loan Composition (in $000s) • First Keystone has funded approximately $32MM in PPP loans • 491 – Number of loans (all to existing customers) • $1.36MM – Expected fee income ($255k recognized as of 9/30/20) Paycheck Protection Program (PPP) Update: 22 Non Owner Occ. CRE 13.0% C&I 12.6% Owner Occ. CRE 25.6% 1 - 4 Family 33.2% Constr & Land Dev 4.1% Multifam 8.5% Consumer , 0.7% Other 1.6% Balance % of Total Loans % of TRBC % of TRBC PF* 1-4 Family Residential $233,880 33.2% 222% 190% Non-Owner Occupied CRE 91,801 13.0% 87% 74% Owner Occupied CRE 180,032 25.6% 171% 146% Commercial & Industrial 88,997 12.6% 85% 72% Construction & Land Development 28,912 4.1% 27% 23% Multifamily 59,523 8.5% 57% 48% Consumer 5,122 0.7% 5% 4% Farm Loans 1,932 0.3% 2% 2% Ag Prod 2,366 0.3% 2% 2% Other Loans 11,475 1.6% 11% 9% Total Loans $704,040 100.0% Total CRE (Ex owner occupied) $180,236 26% 171% 146%
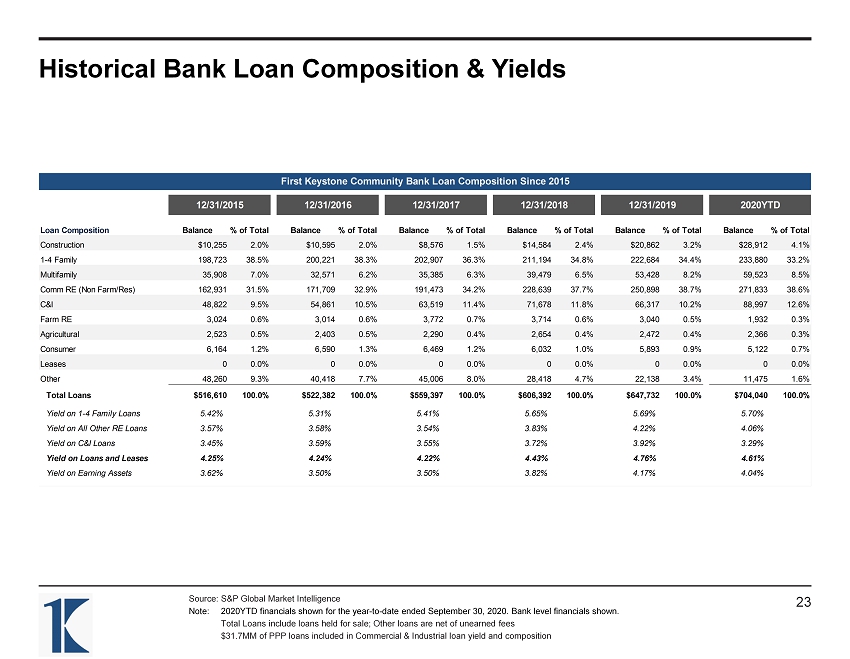
Historical Bank Loan Composition & Yields Source: S&P Global Market Intelligence Note: 2020YTD financials shown for the year - to - date ended September 30, 2020. Bank level financials shown. Total Loans include loans held for sale; Other loans are net of unearned fees $31.7MM of PPP loans included in Commercial & Industrial loan yield and composition First Keystone Community Bank Loan Composition Since 2015 12/31/2015 12/31/2016 12/31/2017 12/31/2018 12/31/2019 2020YTD Loan Composition Balance % of Total Balance % of Total Balance % of Total Balance % of Total Balance % of Total Balance % of Total Construction $10,255 2.0% $10,595 2.0% $8,576 1.5% $14,584 2.4% $20,862 3.2% $28,912 4.1% 1-4 Family 198,723 38.5% 200,221 38.3% 202,907 36.3% 211,194 34.8% 222,684 34.4% 233,880 33.2% Multifamily 35,908 7.0% 32,571 6.2% 35,385 6.3% 39,479 6.5% 53,428 8.2% 59,523 8.5% Comm RE (Non Farm/Res) 162,931 31.5% 171,709 32.9% 191,473 34.2% 228,639 37.7% 250,898 38.7% 271,833 38.6% C&I 48,822 9.5% 54,861 10.5% 63,519 11.4% 71,678 11.8% 66,317 10.2% 88,997 12.6% Farm RE 3,024 0.6% 3,014 0.6% 3,772 0.7% 3,714 0.6% 3,040 0.5% 1,932 0.3% Agricultural 2,523 0.5% 2,403 0.5% 2,290 0.4% 2,654 0.4% 2,472 0.4% 2,366 0.3% Consumer 6,164 1.2% 6,590 1.3% 6,469 1.2% 6,032 1.0% 5,893 0.9% 5,122 0.7% Leases 0 0.0% 0 0.0% 0 0.0% 0 0.0% 0 0.0% 0 0.0% Other 48,260 9.3% 40,418 7.7% 45,006 8.0% 28,418 4.7% 22,138 3.4% 11,475 1.6% Total Loans $516,610 100.0% $522,382 100.0% $559,397 100.0% $606,392 100.0% $647,732 100.0% $704,040 100.0% Yield on 1-4 Family Loans 5.42% 5.31% 5.41% 5.65% 5.69% 5.70% Yield on All Other RE Loans 3.57% 3.58% 3.54% 3.83% 4.22% 4.06% Yield on C&I Loans 3.45% 3.59% 3.55% 3.72% 3.92% 3.29% Yield on Loans and Leases 4.25% 4.24% 4.22% 4.43% 4.76% 4.61% Yield on Earning Assets 3.62% 3.50% 3.50% 3.82% 4.17% 4.04% 23

CRE and C&I Portfolio by Product Type Source: Company provided documents as of 9/30/20; based on internal code classifications, may not match call report classific ati ons (1) Statistic represents 79% of loans classified as CRE loans for internal collateral purposes 24 9/30/2020 % of # of Balance CRE + C&I NAICS Industry Description Loans ($) Loans Agricultural, Forestry, Fishing & Hunting 38 $4,933,054 0.9% Mining, Quarrying, Gas / Oil Extraction 3 – – Utilities (Electric Power Distribution) 1 7,762,500 1.5% Construction 210 20,320,080 3.8% Manufacturing - Food / Agr / Clothing 15 4,867,077 0.9% Manufacturing - Wood Products 22 2,602,634 0.5% Manufacturing - Primary Metals 61 12,982,691 2.4% Wholesale Trade 43 4,390,108 0.8% Retail Trade - Consumer 188 45,340,997 8.5% Retail Trade - Specialty 52 4,687,351 0.9% Transportation - Ground / Air / Sea / Rail 54 2,469,619 0.5% Transportation - Postal / Courier / Warehehouse 3 489,744 0.1% Information Industries 8 806,640 0.2% Finance & Insurance 30 1,303,316 0.2% Real Estate and Rental and Leasing 1,213 263,823,350 49.6% Professional, Scientific, & Technical Services 95 5,958,461 1.1% Management of Companies / Enterprises 1 26,545 0.0% Administrative / Support / Mgmt. Services 84 3,987,429 0.7% Educational Services 14 3,575,858 0.7% Health Care & Social Assistance Services 116 33,709,622 6.3% Arts, Entertainment, and Recreation 49 5,303,011 1.0% Accomodations and Food Services 200 83,021,336 15.6% Other Services (except Public Administration) 179 12,042,477 2.3% Public Administration 33 7,675,052 1.4% Total 2,712 $532,078,952 60% Average LTV on CRE Loans (1) Real Estate Portfolio Notes: Real Estate and Rental and Leasing • Outstanding loan balance of $263,823,350 consisting of 1,213 loans (250.68% of Capital) • $259,021,740 or 96% are Lessors of Real Estate (NAICS Code 5311) – comprised of 1,158 loans • Exposure comprised of establishments primarily engaged in acting as lessors of buildings used as residences or dwellings, such as: single - family homes, apartment buildings, town homes, and student housing units. • Average loan size of approximately $217k • Top 10 loans in this category represent 18.07% of the $259MM • 94.9% of this category is given a Pass Rating
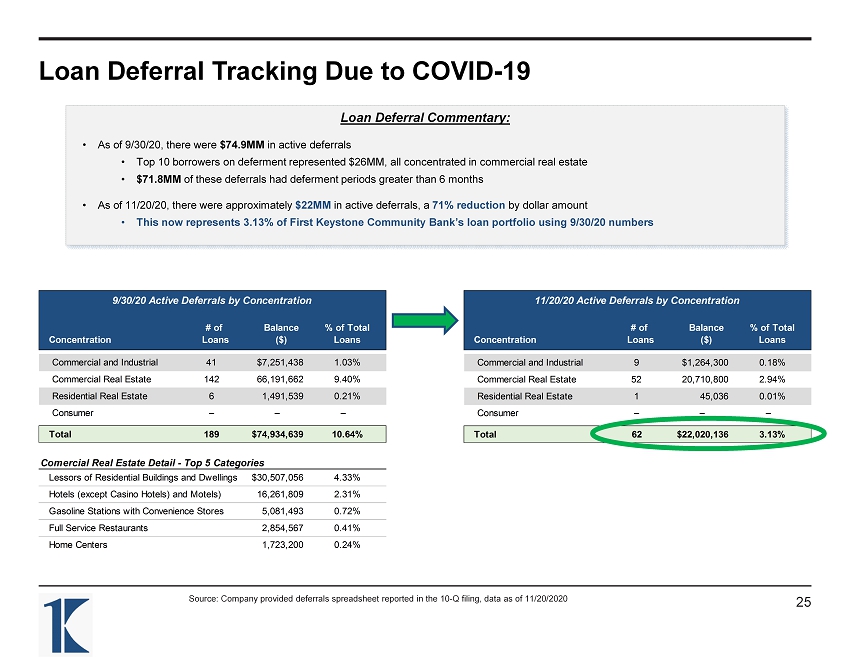
Loan Deferral Tracking Due to COVID - 19 Source: Company provided deferrals spreadsheet reported in the 10 - Q filing, data as of 11/20/2020 25 Loan Deferral Commentary: • As of 9/30/20, there were $74.9MM in active deferrals • Top 10 borrowers on deferment represented $26MM, all concentrated in commercial real estate • $71.8MM of these deferrals had deferment periods greater than 6 months • As of 11/20/20, there were approximately $22MM in active deferrals, a 71% reduction by dollar amount • This now represents 3.13% of First Keystone Community Bank’s loan portfolio using 9/30/20 numbers 9/30/20 Active Deferrals by Concentration 11/20/20 Active Deferrals by Concentration # of Balance % of Total Concentration Loans ($) Loans Commercial and Industrial 41 $7,251,438 1.03% Commercial Real Estate 142 66,191,662 9.40% Residential Real Estate 6 1,491,539 0.21% Consumer – – – Total 189 $74,934,639 10.64% Comercial Real Estate Detail - Top 5 Categories Lessors of Residential Buildings and Dwellings $30,507,056 4.33% Hotels (except Casino Hotels) and Motels) 16,261,809 2.31% Gasoline Stations with Convenience Stores 5,081,493 0.72% Full Service Restaurants 2,854,567 0.41% Home Centers 1,723,200 0.24% 11/20/20 Active Deferrals by Concentration # of Balance % of Total Concentration Loans ($) Loans Commercial and Industrial 9 $1,264,300 0.18% Commercial Real Estate 52 20,710,800 2.94% Residential Real Estate 1 45,036 0.01% Consumer – – – Total 62 $22,020,136 3.13%

Non - performing Assets Details Source: S&P Global Market Intelligence Bank Non - Accrual Loans by Type Bank Commentary Asset Quality Detail as of September 30, 2020 : • Total non - accrual loans of $6.84MM • Loans 90+ days past due of $542K • OREO to total assets of 0.01% Non - Accrual Loan Detail as of September 30, 2020 : • 27 Non - Accrual Loans of only $6.84MM • Represents 0.97% of loans Top 3 Non - Accrual Loans: Loan #1: Book Balance: $3.18MM • Loan Type: Multifamily Loan #2: Book Balance: $829K • Loan Type: Own Occupied CRE Loan #3: Book Balance: $590K • Loan Type: Commercial and Industrial 26 Owner Occ. CRE , 26.2% 1 - 4 Family , 16.4% C&I , 11.0% Multifam , 46.4%

Asset Quality & Reserve Coverage Ratios Source: S&P Global Market Intelligence Note: Bank level financials shown for the year - to - date ended or as of September 30, 2020. (1) NPA’s excluding loans past - due 90 days or more and still accruing interest; calculated as the sum of nonaccrual loans and OR EO as a percent of total assets (2) Excludes $31.7MM of PPP loans; 1.08% inclusive of PPP loans Loan Loss Reserves / NPLs NCOs / Avg. Loans Loan Loss Reserves / Total Loans NPAs / Assets (1) 27 0.62% 0.50% 0.45% 0.61% 0.00% 1.00% 2.00% 3.00% 4.00% 2017Y 2018Y 2019Y 2020YTD 0.03% 0.16% 0.03% 0.02% 0.00% 0.50% 1.00% 1.50% 2.00% 2017Y 2018Y 2019Y 2020YTD 55% 40% 55% 55% 0% 50% 100% 150% 200% 2017Y 2018Y 2019Y 2020YTD 1.34% 1.11% 1.08% 1.13% 0.00% 0.50% 1.00% 1.50% 2.00% 2017Y 2018Y 2019Y 2020YTD (2)
IV. Liabilities Highlights 28
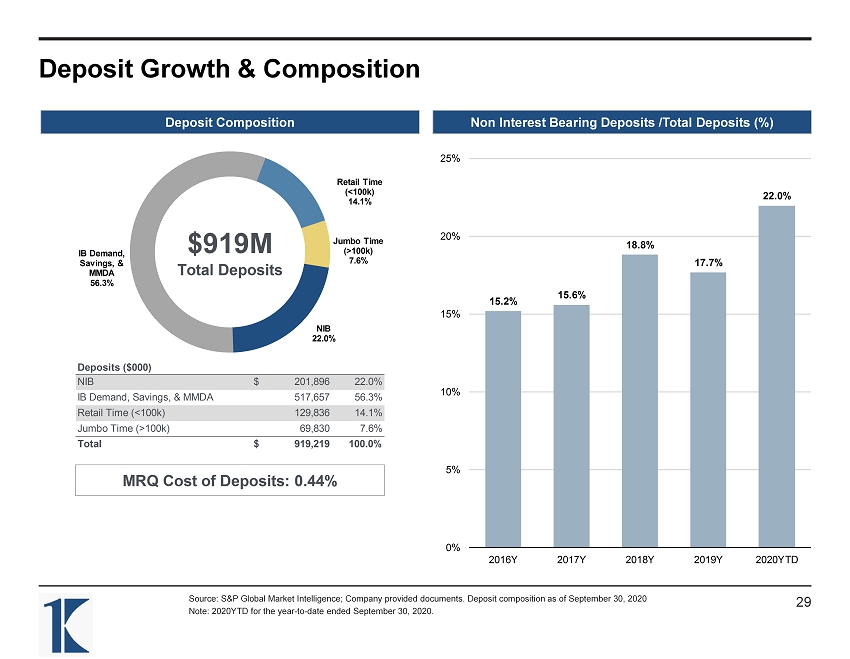
Deposit Growth & Composition Source: S&P Global Market Intelligence; Company provided documents. Deposit composition as of September 30, 2020 Note: 2020YTD for the year - to - date ended September 30, 2020. Non Interest Bearing Deposits /Total Deposits (%) Deposit Composition 15.2% 15.6% 18.8% 17.7% 22.0% 0% 5% 10% 15% 20% 25% 2016Y 2017Y 2018Y 2019Y 2020YTD 29 $919M $10.5B Total Deposits Total Deposits Deposits ($000) NIB 201,896$ 22.0% IB Demand, Savings, & MMDA 517,657 56.3% Retail Time (<100k) 129,836 14.1% Jumbo Time (>100k) 69,830 7.6% Total 919,219$ 100.0% MRQ Cost of Deposits: 0.44% MRQ Cost of Deposits: 0.61% NIB 22.0% IB Demand, Savings, & MMDA 56.3% Retail Time (<100k) 14.1% Jumbo Time (>100k) 7.6%
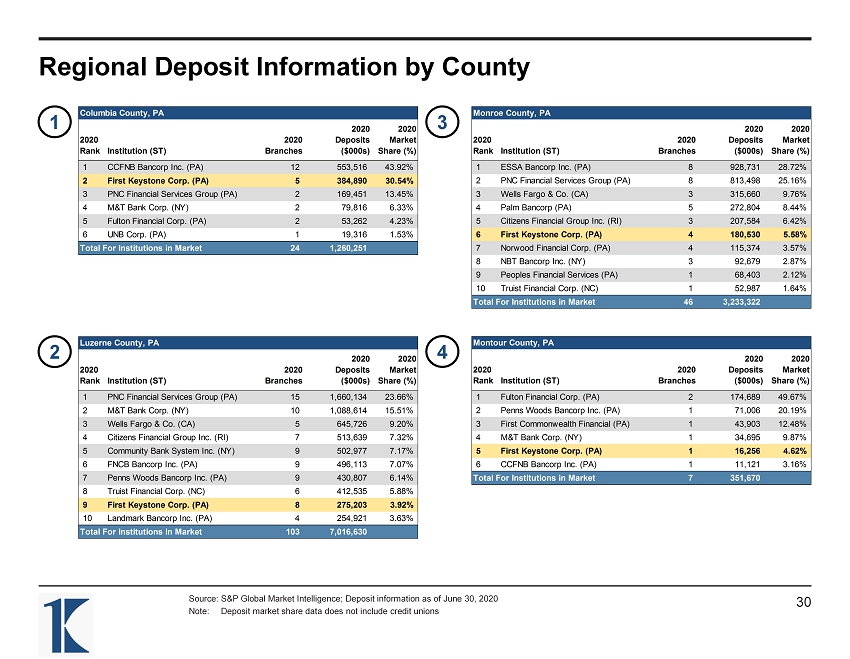
Regional Deposit Information by County Source: S&P Global Market Intelligence; Deposit information as of June 30, 2020 Note: Deposit market share data does not include credit unions Columbia County, PA 2020 2020 2020 2020 Deposits Market Rank Institution (ST) Branches ($000s) Share (%) 1 CCFNB Bancorp Inc. (PA) 12 553,516 43.92% 2 First Keystone Corp. (PA) 5 384,890 30.54% 3 PNC Financial Services Group (PA) 2 169,451 13.45% 4 M&T Bank Corp. (NY) 2 79,816 6.33% 5 Fulton Financial Corp. (PA) 2 53,262 4.23% 6 UNB Corp. (PA) 1 19,316 1.53% Total For Institutions in Market 24 1,260,251 Luzerne County, PA 2020 2020 2020 2020 Deposits Market Rank Institution (ST) Branches ($000s) Share (%) 1 PNC Financial Services Group (PA) 15 1,660,134 23.66% 2 M&T Bank Corp. (NY) 10 1,088,614 15.51% 3 Wells Fargo & Co. (CA) 5 645,726 9.20% 4 Citizens Financial Group Inc. (RI) 7 513,639 7.32% 5 Community Bank System Inc. (NY) 9 502,977 7.17% 6 FNCB Bancorp Inc. (PA) 9 496,113 7.07% 7 Penns Woods Bancorp Inc. (PA) 9 430,807 6.14% 8 Truist Financial Corp. (NC) 6 412,535 5.88% 9 First Keystone Corp. (PA) 8 275,203 3.92% 10 Landmark Bancorp Inc. (PA) 4 254,921 3.63% Total For Institutions in Market 103 7,016,630 Monroe County, PA 2020 2020 2020 2020 Deposits Market Rank Institution (ST) Branches ($000s) Share (%) 1 ESSA Bancorp Inc. (PA) 8 928,731 28.72% 2 PNC Financial Services Group (PA) 8 813,498 25.16% 3 Wells Fargo & Co. (CA) 3 315,660 9.76% 4 Palm Bancorp (PA) 5 272,804 8.44% 5 Citizens Financial Group Inc. (RI) 3 207,584 6.42% 6 First Keystone Corp. (PA) 4 180,530 5.58% 7 Norwood Financial Corp. (PA) 4 115,374 3.57% 8 NBT Bancorp Inc. (NY) 3 92,679 2.87% 9 Peoples Financial Services (PA) 1 68,403 2.12% 10 Truist Financial Corp. (NC) 1 52,987 1.64% Total For Institutions in Market 46 3,233,322 1 2 3 30 Montour County, PA 2020 2020 2020 2020 Deposits Market Rank Institution (ST) Branches ($000s) Share (%) 1 Fulton Financial Corp. (PA) 2 174,689 49.67% 2 Penns Woods Bancorp Inc. (PA) 1 71,006 20.19% 3 First Commonwealth Financial (PA) 1 43,903 12.48% 4 M&T Bank Corp. (NY) 1 34,695 9.87% 5 First Keystone Corp. (PA) 1 16,256 4.62% 6 CCFNB Bancorp Inc. (PA) 1 11,121 3.16% Total For Institutions in Market 7 351,670 4

CD Repricing Opportunities Source: Company provided financial information; CD balances as of September 30, 2020 31 $26,788 $84,763 $39,230 $25,302 $15,268 $8,224 $91 – $10,000 $20,000 $30,000 $40,000 $50,000 $60,000 $70,000 $80,000 $90,000 2020 2021 2022 2023 2024 2025 2026 Balance Avg. Rate Maturity ($000s) (%) 2020 $26,788 1.31% 2021 84,763 1.00% 2022 39,230 1.81% 2023 25,302 1.00% 2024 15,268 1.00% 2025 8,224 1.21% 2026 91 2.13% Total $199,666 1.21% ($ in thousands)
V. Capital Highlights 32
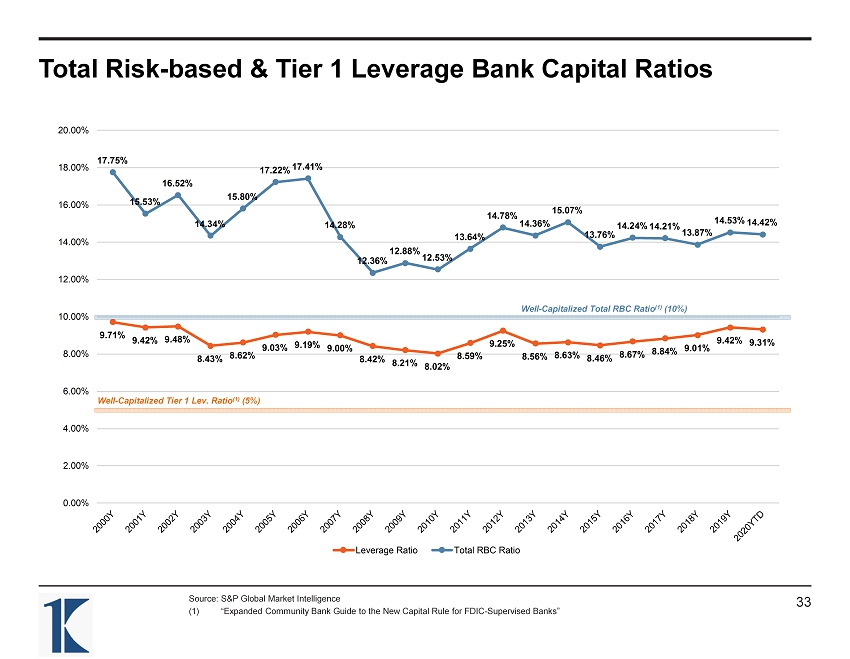
Total Risk - based & Tier 1 Leverage Bank Capital Ratios Source: S&P Global Market Intelligence (1) “Expanded Community Bank Guide to the New Capital Rule for FDIC - Supervised Banks” 9.71% 9.42% 9.48% 8.43% 8.62% 9.03% 9.19% 9.00% 8.42% 8.21% 8.02% 8.59% 9.25% 8.56% 8.63% 8.46% 8.67% 8.84% 9.01% 9.42% 9.31% 17.75% 15.53% 16.52% 14.34% 15.80% 17.22% 17.41% 14.28% 12.36% 12.88% 12.53% 13.64% 14.78% 14.36% 15.07% 13.76% 14.24% 14.21% 13.87% 14.53% 14.42% 0.00% 2.00% 4.00% 6.00% 8.00% 10.00% 12.00% 14.00% 16.00% 18.00% 20.00% Leverage Ratio Total RBC Ratio Well - Capitalized Tier 1 Lev. Ratio (1) (5%) Well - Capitalized Total RBC Ratio (1) (10%) 33

Historical Regulatory Bank Capital Ratios Source: S&P Global Market Intelligence Note: 2020YTD as of September 30, 2020 (1) “Expanded Community Bank Guide to the New Capital Rule for FDIC - Supervised Banks” Tier 1 Risk Based Ratio CET1 Ratio Total Risk Based Ratio Tier 1 Leverage Ratio 34 8.84% 9.01% 9.42% 9.31% 3.00% 5.00% 7.00% 9.00% 11.00% 13.00% 15.00% 2017Y 2018Y 2019Y 2020YTD Well - Capitalized Tier 1 Lev. Ratio (1) (5%) 13.06% 12.88% 13.50% 13.36% 6.00% 8.00% 10.00% 12.00% 14.00% 16.00% 18.00% 2017Y 2018Y 2019Y 2020YTD Well - Capitalized CET1 Ratio (1) (6.5%) 13.06% 12.88% 13.50% 13.36% 6.00% 8.00% 10.00% 12.00% 14.00% 16.00% 18.00% 2017Y 2018Y 2019Y 2020YTD Well - Capitalized Tier 1 Risk - Based Ratio (1) (8%) 14.21% 13.87% 14.53% 14.42% 6.00% 8.00% 10.00% 12.00% 14.00% 16.00% 18.00% 2017Y 2018Y 2019Y 2020YTD Well - Capitalized Total Risk - Based Ratio (1) (10%)
VI. Income Statement Highlights 35
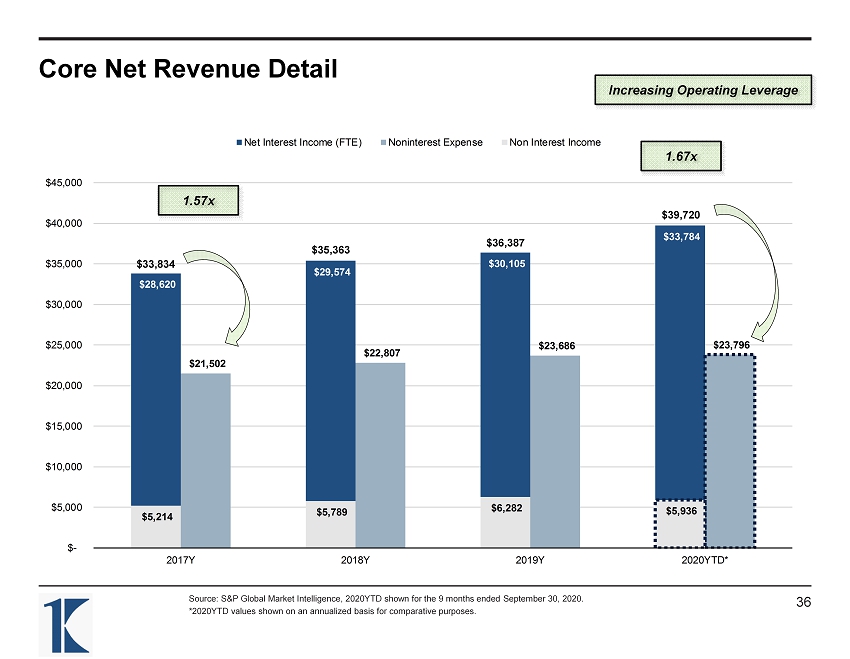
Core Net Revenue Detail Source: S&P Global Market Intelligence, 2020YTD shown for the 9 months ended September 30, 2020. *2020YTD values shown on an annualized basis for comparative purposes. 36 $28,620 $29,574 $30,105 $33,784 $21,502 $22,807 $23,686 $23,796 $5,214 $5,789 $6,282 $5,936 $- $5,000 $10,000 $15,000 $20,000 $25,000 $30,000 $35,000 $40,000 $45,000 2017Y 2018Y 2019Y 2020YTD* Net Interest Income (FTE) Noninterest Expense Non Interest Income 1.57x $33,834 $35,363 $36,387 $39,720 1.67x Increasing Operating Leverage
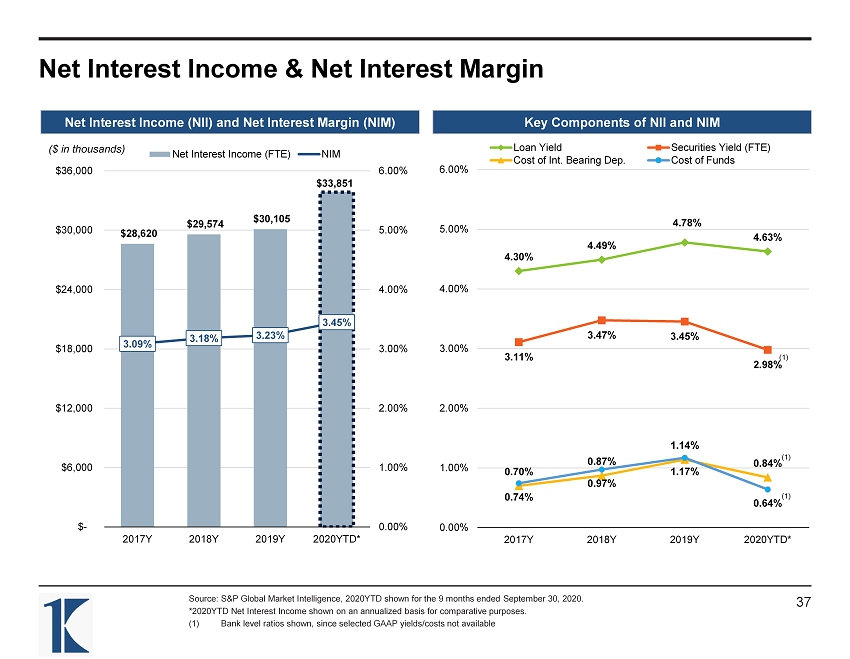
Net Interest Income & Net Interest Margin Source: S&P Global Market Intelligence, 2020YTD shown for the 9 months ended September 30, 2020. *2020YTD Net Interest Income shown on an annualized basis for comparative purposes. (1) Bank level ratios shown, since selected GAAP yields/costs not available $28,620 $29,574 $30,105 $33,851 3.09% 3.18% 3.23% 3.45% 0.00% 1.00% 2.00% 3.00% 4.00% 5.00% 6.00% $- $6,000 $12,000 $18,000 $24,000 $30,000 $36,000 2017Y 2018Y 2019Y 2020YTD* Net Interest Income (FTE) NIM ($ in thousands) Key Components of NII and NIM Net Interest Income (NII) and Net Interest Margin (NIM) 4.30% 4.49% 4.78% 4.63% 3.11% 3.47% 3.45% 2.98% 0.70% 0.87% 1.14% 0.84% 0.74% 0.97% 1.17% 0.64% 0.00% 1.00% 2.00% 3.00% 4.00% 5.00% 6.00% 2017Y 2018Y 2019Y 2020YTD* Loan Yield Securities Yield (FTE) Cost of Int. Bearing Dep. Cost of Funds 37 (1) (1) (1)

Profitability & Expense Controls Source: S&P Global Market Intelligence, 2020YTD shown for the 9 months ended September 30, 2020. 63.2% 63.6% 63.6% 59.7% 2.15% 2.27% 2.35% 2.25% 0.00% 1.50% 3.00% 4.50% 6.00% 0.0% 20.0% 40.0% 60.0% 80.0% 2017Y 2018Y 2019Y 2020YTD Noninterest Expense / Avg. Assets Efficiency Ratio Efficiency Ratio (FTE) Noninterest Expense / Avg. Assets Pre - Tax ROATCE & ROAA Efficiency Ratio Consistently low efficiency ratio and controlled noninterest expense base 38 10.6% 10.1% 10.7% 11.3% 1.01% 0.96% 1.13% 1.23% 0.60% 0.80% 1.00% 1.20% 1.40% 1.60% 1.80% 4.0% 6.0% 8.0% 10.0% 12.0% 14.0% 16.0% 2017Y 2018Y 2019Y 2020YTD Pre - Tax ROAA Pre - Tax ROATCE Pre-Tax ROATCE Pre-Tax ROAA Robust pre - tax ROA & ROE ratios

Net Interest Margin vs. Net Non - interest Expense Source: S&P Global Market Intelligence 3.19% 3.26% 3.33% 3.28% 3.48% 3.59% 1.66% 1.69% 1.79% 1.76% 1.60% 1.72% 2.05% 1.98% 2.02% 2.03% 1.90% 1.78% 0.00% 1.00% 2.00% 3.00% 4.00% 5.00% 2019Q2 2019Q3 2019Q4 2020Q1 2020Q2 2020Q3 Net Interest Margin Net Noninterest Expense /AA PA Banks < $2B Net Noninterest Expense/ AA Net NIE / AA = (Noninterest Expense – Noninterest Income) / Avg. Assets 39

VII. Appendix 40
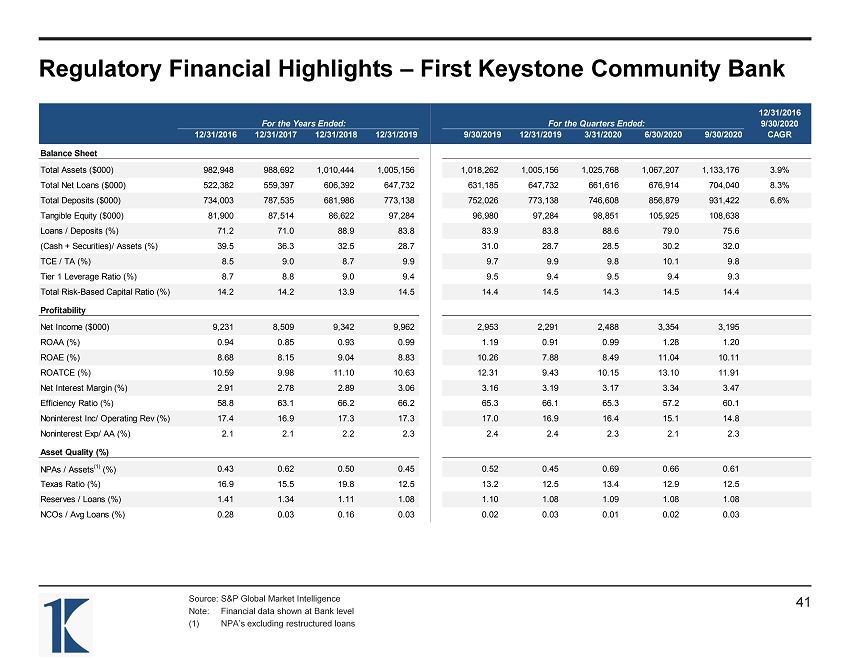
Regulatory Financial Highlights – First Keystone Community Bank Source: S&P Global Market Intelligence Note: Financial data shown at Bank level (1) NPA’s excluding restructured loans 12/31/2016 For the Years Ended: For the Quarters Ended: 9/30/2020 12/31/2016 12/31/2017 12/31/2018 12/31/2019 9/30/2019 12/31/2019 3/31/2020 6/30/2020 9/30/2020 CAGR Balance Sheet Total Assets ($000) 982,948 988,692 1,010,444 1,005,156 1,018,262 1,005,156 1,025,768 1,067,207 1,133,176 3.9% Total Net Loans ($000) 522,382 559,397 606,392 647,732 631,185 647,732 661,616 676,914 704,040 8.3% Total Deposits ($000) 734,003 787,535 681,986 773,138 752,026 773,138 746,608 856,879 931,422 6.6% Tangible Equity ($000) 81,900 87,514 86,622 97,284 96,980 97,284 98,851 105,925 108,638 Loans / Deposits (%) 71.2 71.0 88.9 83.8 83.9 83.8 88.6 79.0 75.6 (Cash + Securities)/ Assets (%) 39.5 36.3 32.5 28.7 31.0 28.7 28.5 30.2 32.0 TCE / TA (%) 8.5 9.0 8.7 9.9 9.7 9.9 9.8 10.1 9.8 Tier 1 Leverage Ratio (%) 8.7 8.8 9.0 9.4 9.5 9.4 9.5 9.4 9.3 Total Risk-Based Capital Ratio (%) 14.2 14.2 13.9 14.5 14.4 14.5 14.3 14.5 14.4 Profitability Net Income ($000) 9,231 8,509 9,342 9,962 2,953 2,291 2,488 3,354 3,195 ROAA (%) 0.94 0.85 0.93 0.99 1.19 0.91 0.99 1.28 1.20 ROAE (%) 8.68 8.15 9.04 8.83 10.26 7.88 8.49 11.04 10.11 ROATCE (%) 10.59 9.98 11.10 10.63 12.31 9.43 10.15 13.10 11.91 Net Interest Margin (%) 2.91 2.78 2.89 3.06 3.16 3.19 3.17 3.34 3.47 Efficiency Ratio (%) 58.8 63.1 66.2 66.2 65.3 66.1 65.3 57.2 60.1 Noninterest Inc/ Operating Rev (%) 17.4 16.9 17.3 17.3 17.0 16.9 16.4 15.1 14.8 Noninterest Exp/ AA (%) 2.1 2.1 2.2 2.3 2.4 2.4 2.3 2.1 2.3 Asset Quality (%) NPAs / Assets (1) (%) 0.43 0.62 0.50 0.45 0.52 0.45 0.69 0.66 0.61 Texas Ratio (%) 16.9 15.5 19.8 12.5 13.2 12.5 13.4 12.9 12.5 Reserves / Loans (%) 1.41 1.34 1.11 1.08 1.10 1.08 1.09 1.08 1.08 NCOs / Avg Loans (%) 0.28 0.03 0.16 0.03 0.02 0.03 0.01 0.02 0.03 41
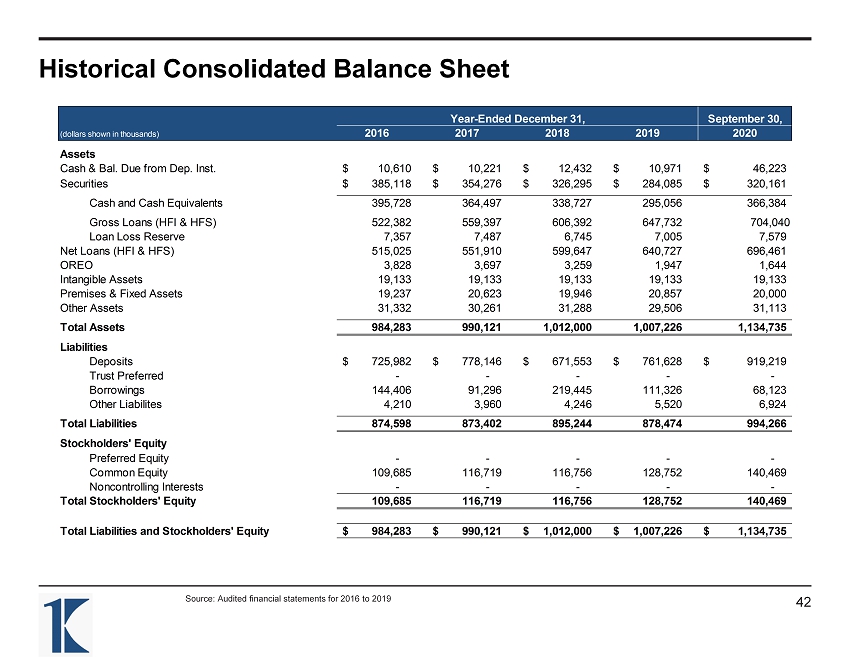
Historical Consolidated Balance Sheet Source: Audited financial statements for 2016 to 2019 Year-Ended December 31, September 30, (dollars shown in thousands) 2016 2017 2018 2019 2020 Assets Cash & Bal. Due from Dep. Inst. 10,610$ 10,221$ 12,432$ 10,971$ 46,223$ Securities 385,118$ 354,276$ 326,295$ 284,085$ 320,161$ Cash and Cash Equivalents 395,728 364,497 338,727 295,056 366,384 Gross Loans (HFI & HFS) 522,382 559,397 606,392 647,732 704,040 Loan Loss Reserve 7,357 7,487 6,745 7,005 7,579 Net Loans (HFI & HFS) 515,025 551,910 599,647 640,727 696,461 OREO 3,828 3,697 3,259 1,947 1,644 Intangible Assets 19,133 19,133 19,133 19,133 19,133 Premises & Fixed Assets 19,237 20,623 19,946 20,857 20,000 Other Assets 31,332 30,261 31,288 29,506 31,113 Total Assets 984,283 990,121 1,012,000 1,007,226 1,134,735 Liabilities Deposits 725,982$ 778,146$ 671,553$ 761,628$ 919,219$ Trust Preferred - - - - - Borrowings 144,406 91,296 219,445 111,326 68,123 Other Liabilites 4,210 3,960 4,246 5,520 6,924 Total Liabilities 874,598 873,402 895,244 878,474 994,266 Stockholders' Equity Preferred Equity - - - - - Common Equity 109,685 116,719 116,756 128,752 140,469 Noncontrolling Interests - - - - - Total Stockholders' Equity 109,685 116,719 116,756 128,752 140,469 Total Liabilities and Stockholders' Equity 984,283$ 990,121$ 1,012,000$ 1,007,226$ 1,134,735$ 42

Historical Consolidated Income Statement YTD Year-Ended December 31, September 30, (dollars shown in thousands) 2016 2017 2018 2019 2020 Total Interest Income 31,643$ 32,268$ 35,573$ 38,527$ 29,251$ Total Interest Expense 5,282 6,548 8,620 10,243 5,136 Net Interest Income 26,361 25,720 26,953 28,284 24,115 Provision for Loan Losses 2,083 267 200 450 682 Net Interest Income after Provision for Loan Losses 24,278 25,453 26,753 27,834 23,433 Total Noninterest Income 5,361 5,214 5,789 6,282 4,431 Realized Gains on Securities 1,764 938 (65) 911 (312) Nonrecurring Revenue 458 - - - - Total Noninterest Expense 20,544 21,502 22,807 23,686 17,826 Pre-Tax Net Income 11,317$ 10,103$ 9,670$ 11,341$ 9,726$ Income Tax Expense 1,845 1,455 459 1,114 1,155 Net Income 9,472$ 8,648$ 9,211$ 10,227$ 8,571$ Source: Audited financial statements for 2016 to 2019 43