Exhibit 99.1

First Keystone Corporation Annual Stockholders’ Meeting May 5, 2016
Matthew Prosseda President and CEO This presentation contains certain forward - looking statements, which are included pursuant to the “safe harbor” provisions of the Private Securities Litigation Reform Act of 1995, and reflect management’s beliefs and expectations based on information currently available. These forward - looking statements are inherently subject to significant risks and uncertainties, including changes in general economic and financial market conditions, the Corporation’s ability to effectively carry out its business plans and changes in regulatory or legislative requirements. Other factors that could cause or contribute to such differences are changes in competitive conditions, and pending or threatened litigation. Although management believes the expectations reflected in such forward - looking statements are reasonable, actual results may differ materially. Welcome


Matthew Prosseda President and CEO Welcome
Diane Rosler Senior Vice President CFO

$ Amounts in thousands
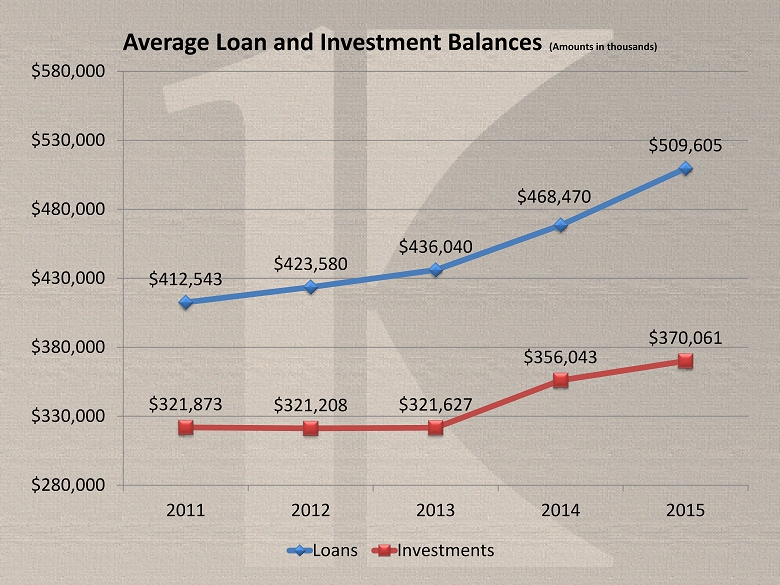
$412,543 $423,580 $436,040 $468,470 $509,605 $321,873 $321,208 $321,627 $356,043 $370,061 $280,000 $330,000 $380,000 $430,000 $480,000 $530,000 $580,000 2011 2012 2013 2014 2015 Average Loan and Investment Balances (Amounts in thousands) Loans Investments

5.75% 5.45% 4.83% 4.51% 4.35% 4.83% 4.58% 3.85% 3.28% 3.14% 3.00% 3.50% 4.00% 4.50% 5.00% 5.50% 6.00% 2011 2012 2013 2014 2015 Loan and Investment Yields (tax equivalent) Loan Yields Investment Yields

$23,738 $23,103 $21,081 $21,127 $22,143 $15,564 $14,493 $12,252 $11,663 $11,638 $10,000 $15,000 $20,000 $25,000 2011 2012 2013 2014 2015 Loan and Investment Income (tax equivalent) (Amounts in thousands) Loan Income Investment Income
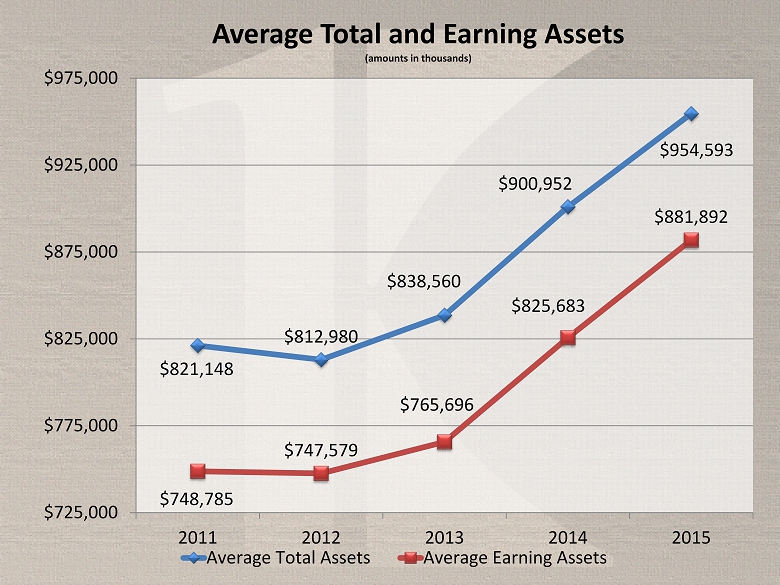
$821,148 $812,980 $838,560 $900,952 $954,593 $748,785 $747,579 $765,696 $825,683 $881,892 $725,000 $775,000 $825,000 $875,000 $925,000 $975,000 2011 2012 2013 2014 2015 Average Total and Earning Assets (amounts in thousands) Average Total Assets Average Earning Assets
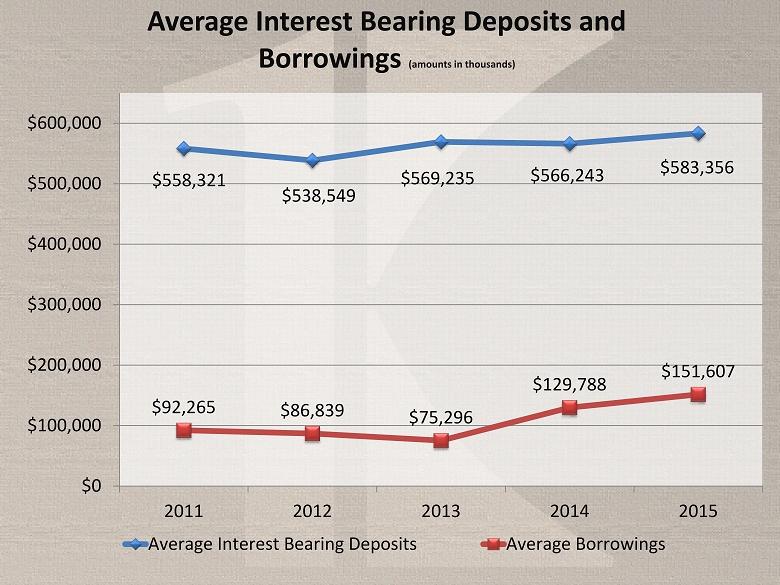
$558,321 $538,549 $569,235 $566,243 $583,356 $92,265 $86,839 $75,296 $129,788 $151,607 $0 $100,000 $200,000 $300,000 $400,000 $500,000 $600,000 2011 2012 2013 2014 2015 Average Interest Bearing Deposits and Borrowings (amounts in thousands) Average Interest Bearing Deposits Average Borrowings
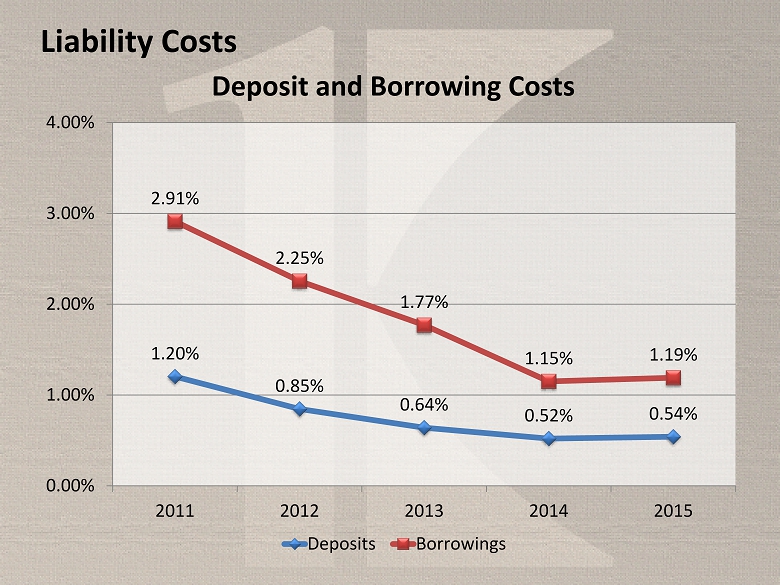
Liability Costs 1.20% 0.85% 0.64% 0.52% 0.54% 2.91% 2.25% 1.77% 1.15% 1.19% 0.00% 1.00% 2.00% 3.00% 4.00% 2011 2012 2013 2014 2015 Deposit and Borrowing Costs Deposits Borrowings
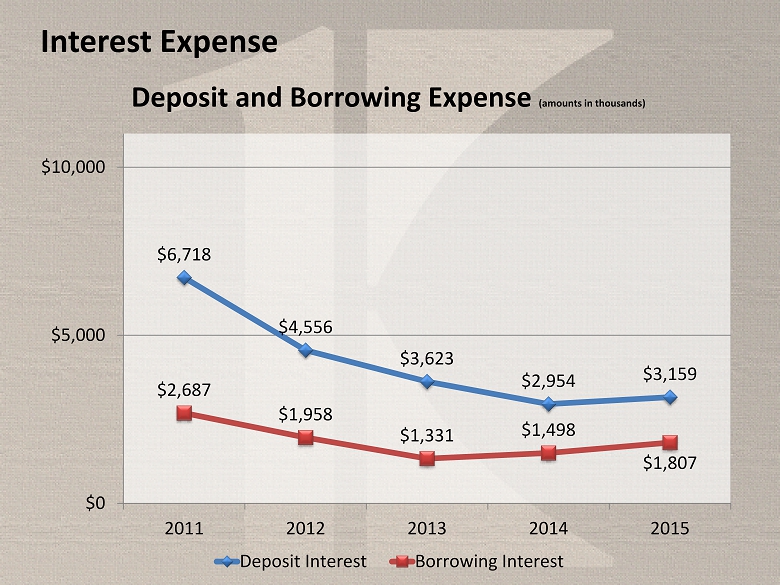
Interest Expense $6,718 $4,556 $3,623 $2,954 $3,159 $2,687 $1,958 $1,331 $1,498 $1,807 $0 $5,000 $10,000 2011 2012 2013 2014 2015 Deposit and Borrowing Expense (amounts in thousands) Deposit Interest Borrowing Interest
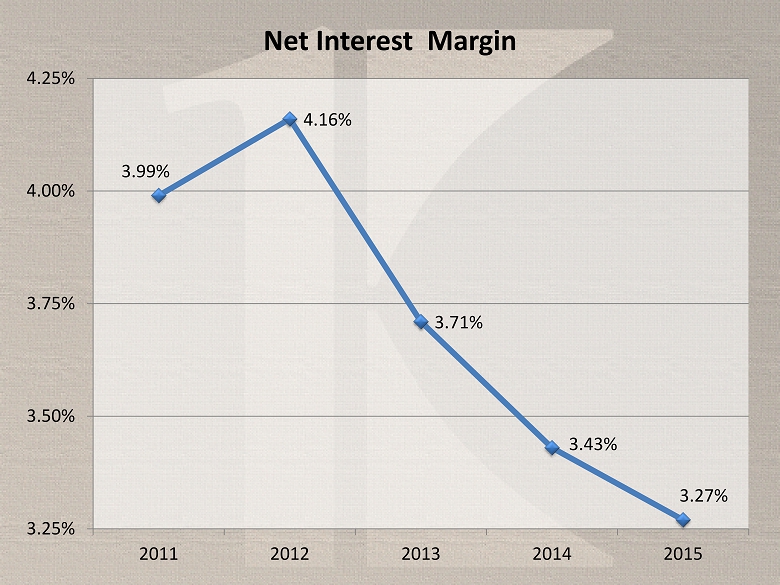
3.99% 4.16% 3.71% 3.43% 3.27% 3.25% 3.50% 3.75% 4.00% 4.25% 2011 2012 2013 2014 2015 Net Interest Margin
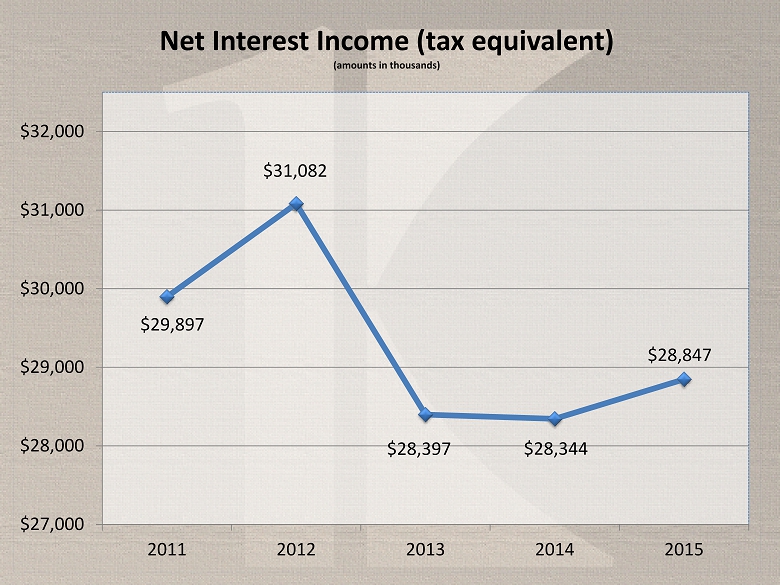
$29,897 $31,082 $28,397 $28,344 $28,847 $27,000 $28,000 $29,000 $30,000 $31,000 $32,000 2011 2012 2013 2014 2015 Net Interest Income (tax equivalent) (amounts in thousands)
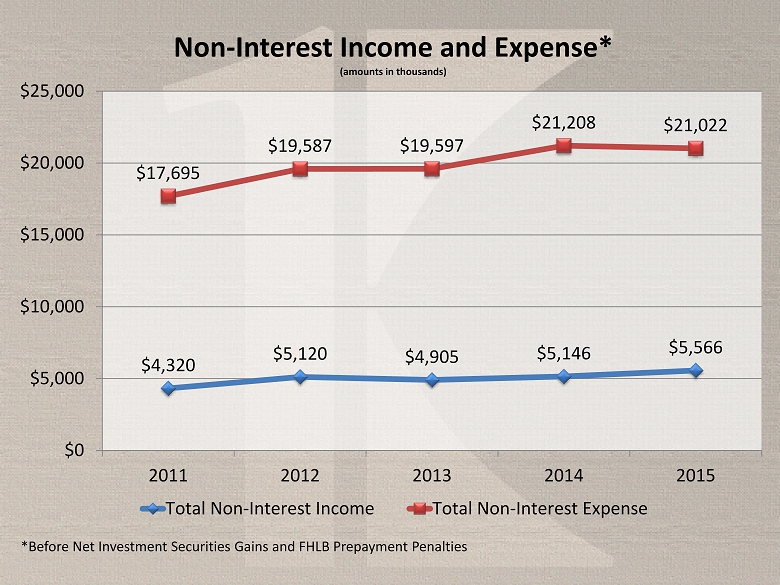
$4,320 $5,120 $4,905 $5,146 $5,566 $17,695 $19,587 $19,597 $21,208 $21,022 $0 $5,000 $10,000 $15,000 $20,000 $25,000 2011 2012 2013 2014 2015 Non - Interest Income and Expense* (amounts in thousands) Total Non-Interest Income Total Non-Interest Expense *Before Net Investment Securities Gains and FHLB Prepayment Penalties

$9,907 $10,170 $10,273 $10,211 $9,172 $8,000 $9,000 $10,000 $11,000 2011 2012 2013 2014 2015 Net Income After Taxes (amounts in thousands)
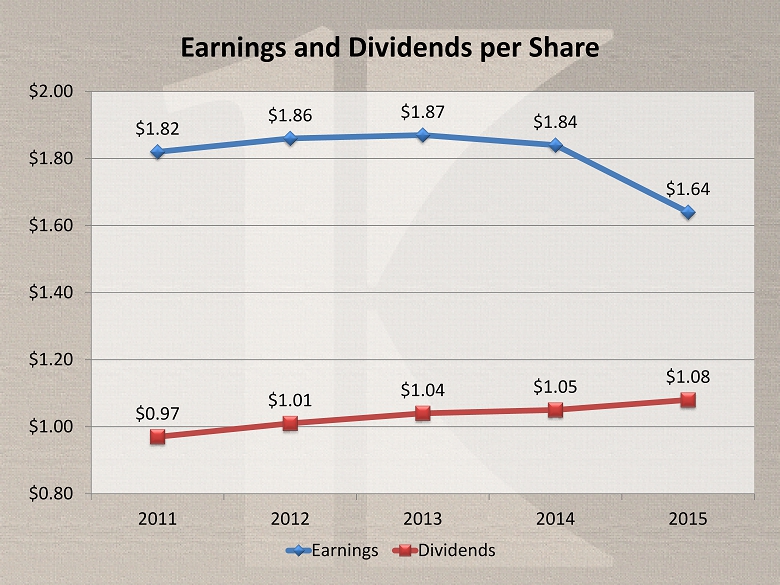
$1.82 $1.86 $1.87 $1.84 $1.64 $0.97 $1.01 $1.04 $1.05 $1.08 $0.80 $1.00 $1.20 $1.40 $1.60 $1.80 $2.00 2011 2012 2013 2014 2015 Earnings and Dividends per Share Earnings Dividends

Income Statement ($ in thousands, except per share data) Net Interest Income +Non - Interest Income =Operating Revenue - Loan Loss Provision =Pre - Tax Income - Income Tax Expense =Net Income Earnings Per Share 3 Months Ended March 31, 2016 3 Months Ended March 31, 2015 %Change $6,659 1,300 $7,959 283 5,140 $2,536 360 $2,176 ( 0.9) (30.0) ( 7.2) 33.5 ( 2.7) ( 17.6) ( 42.9) ( 11.1) - Non - Interest Expense $0.39 ( 11.4) $6,717 1,857 $8,574 212 5,283 $3,079 630 $2,449 $0.44 Unaudited

Balance Sheet ($ in thousands) Cash & Cash Equivalents Investment Securities Net Loans Premises & Equip., Net Other Assets Total Assets Non - Interest Bearing Deposits Interest Bearing Deposits Total Deposits Borrowings Other Liabilities Stockholders’ Equity Liabilities and Stockholders’ Equity $ 9,811 386,834 512,848 19,827 51,506 $980,826 19.4 11.2 2.3 (3.8) 6.4 5 .9 March 31, 2016 March 31, 2015 % Change $ 116,349 609,550 $725,899 135,953 5,393 113,581 $980,826 9.9 9.8 9.8 (8.4) (33.9) 4.6 5.9 $ 8,217 347,984 501,169 20,614 48,402 $926,386 $ 105,842 555,352 $661,194 148,401 8,156 108,635 $926,386 Unaudited
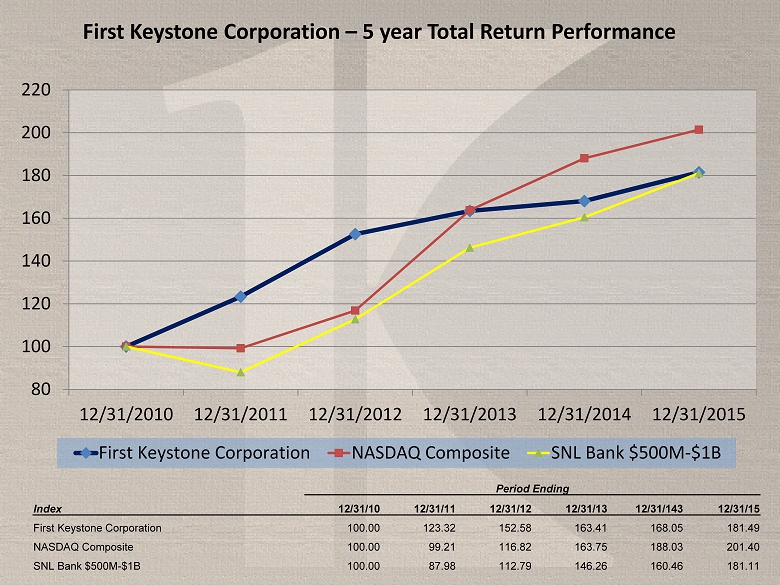
80 100 120 140 160 180 200 220 12/31/2010 12/31/2011 12/31/2012 12/31/2013 12/31/2014 12/31/2015 First Keystone Corporation NASDAQ Composite SNL Bank $500M-$1B Period Ending Index 12/31/10 12/31/11 12/31/12 12/31/13 12/31/143 12/31/15 First Keystone Corporation 100.00 123.32 152.58 163.41 168.05 181.49 NASDAQ Composite 100.00 99.21 116.82 163.75 188.03 201.40 SNL Bank $500M - $1B 100.00 87.98 112.79 146.26 160.46 181.11 First Keystone Corporation – 5 year Total Return Performance

Matthew Prosseda President and CEO
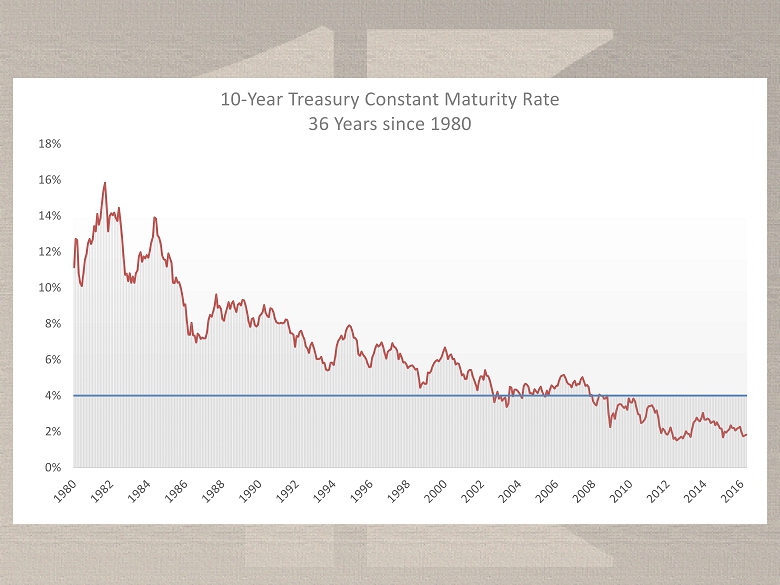
0% 2% 4% 6% 8% 10% 12% 14% 16% 18% 10 - Year Treasury Constant Maturity Rate 36 Years since 1980
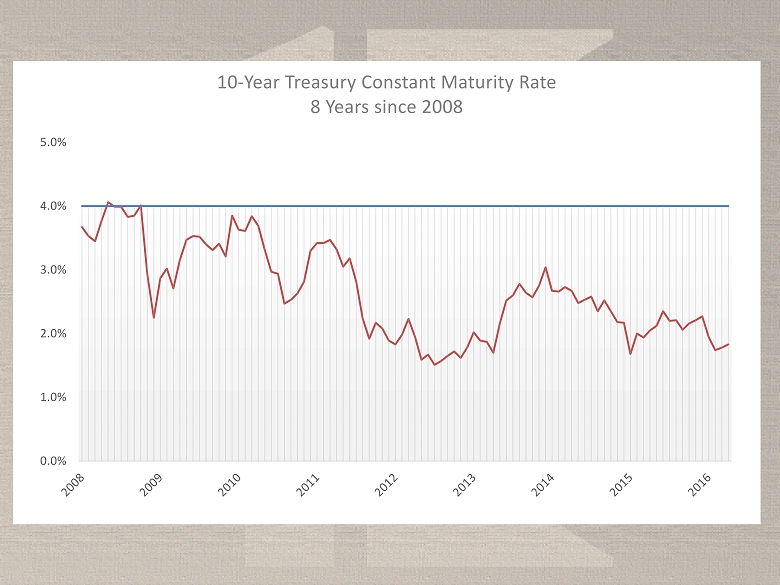
0.0% 1.0% 2.0% 3.0% 4.0% 5.0% 10 - Year Treasury Constant Maturity Rate 8 Years since 2008

Net Interest Income 76% Non Interest Income 24% Total Revenue
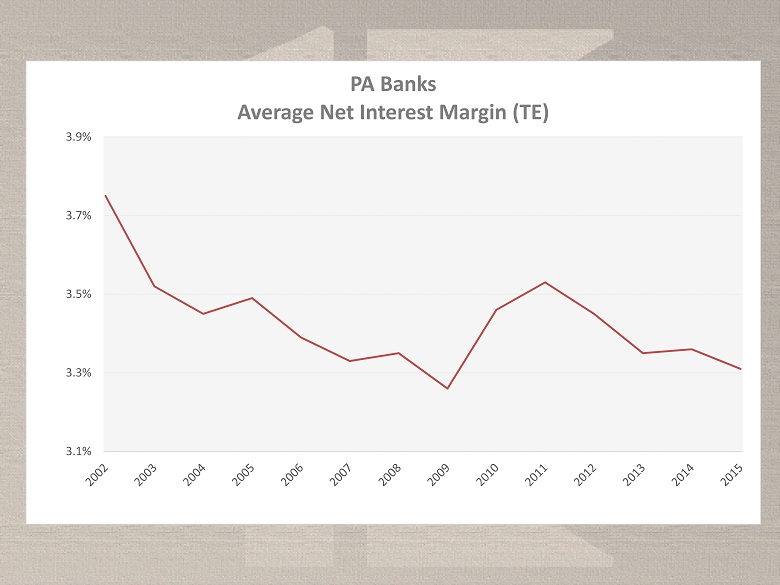
3.1% 3.3% 3.5% 3.7% 3.9% PA Banks Average Net Interest Margin (TE)
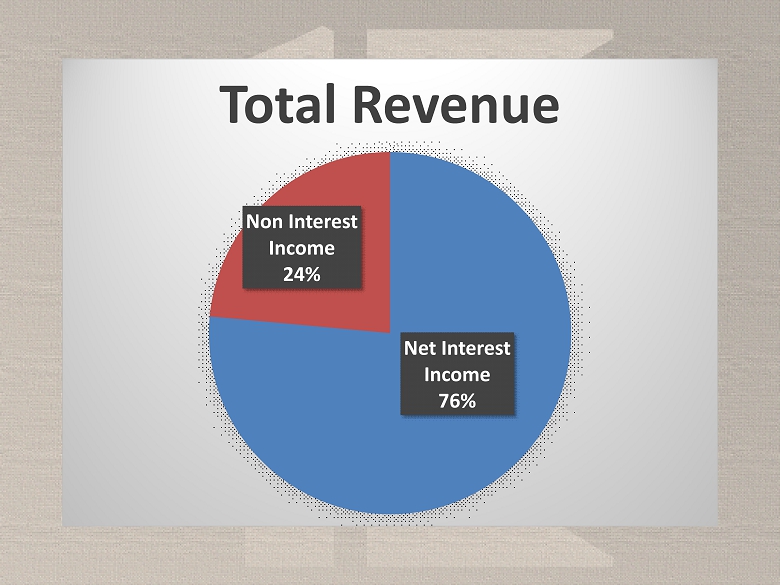
Net Interest Income 76% Non Interest Income 24% Total Revenue
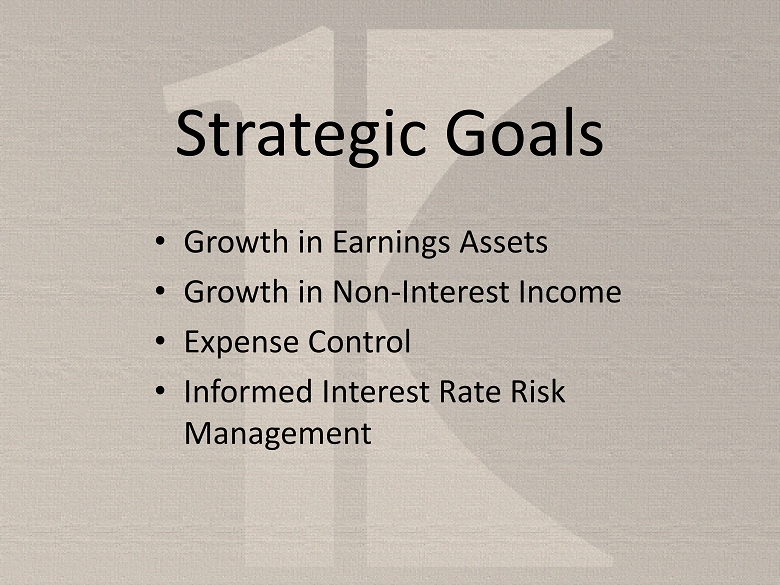
Strategic Goals • Growth in Earnings Assets • Growth in Non - Interest Income • Expense Control • Informed Interest Rate Risk Management

Relationship Development • Small Business Banking • Residential Mortgage Lending • Wealth Management • Depositor Segmentation
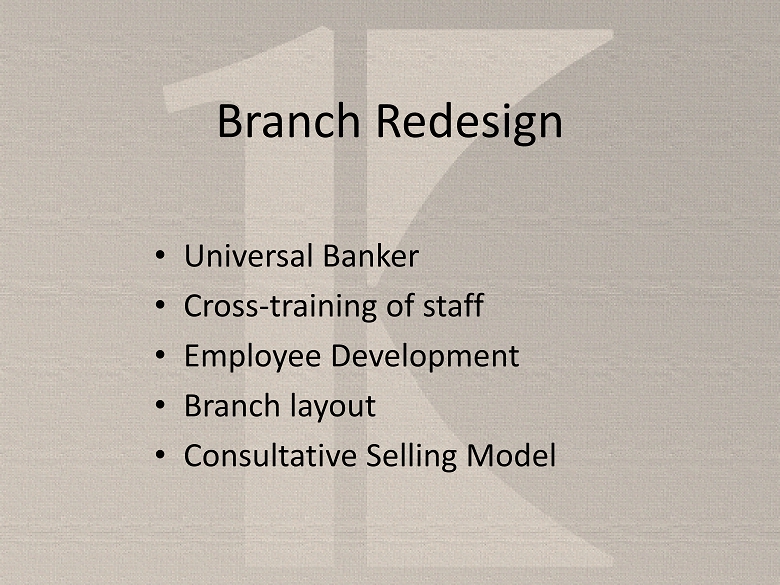
Branch Redesign • Universal Banker • Cross - training of staff • Employee Development • Branch layout • Consultative Selling Model
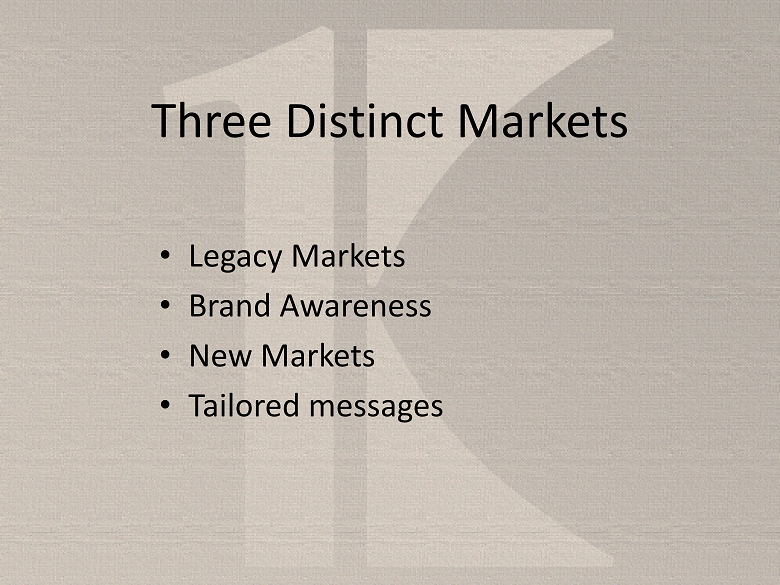
Three Distinct Markets • Legacy Markets • Brand Awareness • New Markets • Tailored messages
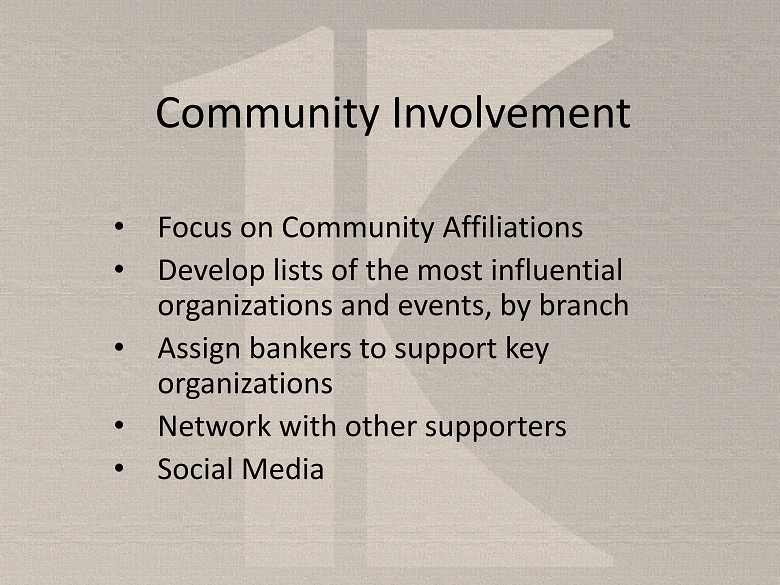
Community Involvement • Focus on Community Affiliations • Develop lists of the most influential organizations and events, by branch • Assign bankers to support key organizations • Network with other supporters • Social Media
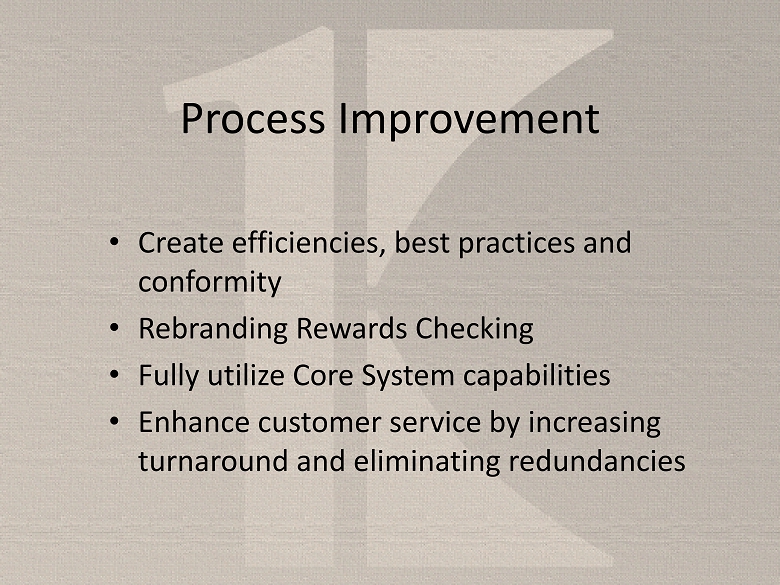
Process Improvement • Create efficiencies, best practices and conformity • Rebranding Rewards Checking • Fully utilize Core System capabilities • Enhance customer service by increasing turnaround and eliminating redundancies
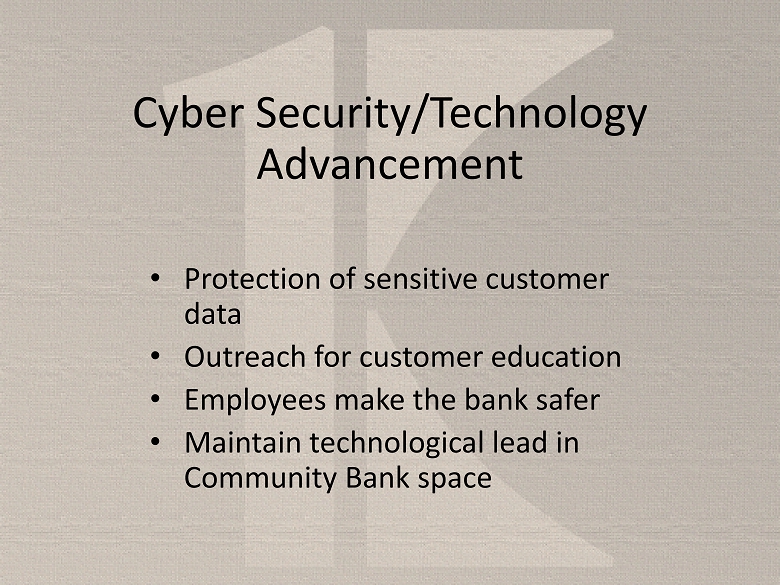
Cyber Security/Technology Advancement • Protection of sensitive customer data • Outreach for customer education • Employees make the bank safer • Maintain technological lead in Community Bank space

Strategic Goals • Growth in Earnings Assets • Growth in Non - Interest Income • Expense Control • Informed Interest Rate Risk Management

THANK YOU FOR ATTENDING! Our Key To a great bank is you!