UNITED STATES SECURITIES AND EXCHANGE COMMISSION
Washington, D.C. 20549
| Form 10-Q | ||||
| þ | QUARTERLY REPORT PURSUANT TO SECTION 13 OR 15(d) OF THE SECURITIES EXCHANGE ACT OF 1934 |
| For the quarterly period ended June 30, 2013 | |
OR
| o | TRANSITION REPORT PURSUANT TO SECTION 13 OR 15(d) OF THE SECURITIES EXCHANGE ACT OF 1934 |
| For the transition period from to | |
| Commission File Number 001-31617 | ||||
| Bristow Group Inc. | ||||
| (Exact name of registrant as specified in its charter) | ||||
| Delaware | 72-0679819 | |
(State or other jurisdiction of incorporation or organization) | (IRS Employer Identification Number) | |
2103 City West Blvd., 4th Floor Houston, Texas | 77042 (Zip Code) | |
| (Address of principal executive offices) | ||
Registrant’s telephone number, including area code:
(713) 267-7600
None | ||||
(Former name, former address and former fiscal year, if changed since last report)
Indicate by check mark whether the registrant: (1) has filed all reports required to be filed by Section 13 or 15(d) of the Securities Exchange Act of 1934 during the preceding 12 months (or for such shorter period that the registrant was required to file such reports), and (2) has been subject to such filing requirements for the past 90 days. Yes þ No ¨
Indicate by check mark whether the registrant has submitted electronically and posted on its corporate Web site, if any, every Interactive Data File required to be submitted and posted pursuant to Rule 405 of Regulation S-T during the preceding 12 months (or for such shorter period that the registrant was required to submit and post such files). Yes þ No ¨
Indicate by check mark whether the registrant is a large accelerated filer, an accelerated filer, a non-accelerated filer, or a smaller reporting company. See definitions of “large accelerated filer,” “accelerated filer” and “smaller reporting company” in Rule 12b-2 of the Exchange Act.
Large accelerated filer þ | Accelerated filer o | Non-accelerated filer o | Smaller reporting company o | |
| (Do not check if a smaller reporting company) | ||||
| Indicate by check mark whether the registrant is a shell company (as defined in Rule 12b-2 of the Exchange Act). | ||||
o Yes þ No | ||||
Indicate the number shares outstanding of each of the issuer’s classes of Common Stock, as of August 2, 2013.
36,355,089 shares of Common Stock, $.01 par value
BRISTOW GROUP INC.
INDEX — FORM 10-Q
| Page | ||
| PART I | ||
| Item 1. | ||
| Item 2. | ||
| Item 3. | ||
| Item 4. | ||
| PART II | ||
| Item 1. | ||
| Item 1A. | ||
| Item 2. | ||
| Item 3. | ||
| Item 4. | ||
| Item 5. | ||
| Item 6. | ||
PART I — FINANCIAL INFORMATION
Item 1. Financial Statements.
BRISTOW GROUP INC. AND SUBSIDIARIES
Condensed Consolidated Statements of Income
| Three Months Ended June 30, | |||||||||
| 2013 | 2012 | ||||||||
(Unaudited) (In thousands, except per share amounts) | |||||||||
| Gross revenue: | |||||||||
| Operating revenue from non-affiliates | $ | 336,248 | $ | 314,849 | |||||
| Operating revenue from affiliates | 23,299 | 5,805 | |||||||
| Reimbursable revenue from non-affiliates | 39,382 | 41,954 | |||||||
| Reimbursable revenue from affiliates | 65 | — | |||||||
| 398,994 | 362,608 | ||||||||
| Operating expense: | |||||||||
| Direct cost | 255,256 | 222,768 | |||||||
| Reimbursable expense | 36,743 | 40,172 | |||||||
| Depreciation and amortization | 22,819 | 21,372 | |||||||
| General and administrative | 40,308 | 34,977 | |||||||
| 355,126 | 319,289 | ||||||||
| Loss on disposal of assets | (1,721 | ) | (5,315 | ) | |||||
| Earnings from unconsolidated affiliates, net of losses | 13,972 | 1,989 | |||||||
| Operating income | 56,119 | 39,993 | |||||||
| Interest income | 119 | 88 | |||||||
| Interest expense | (20,370 | ) | (8,774 | ) | |||||
| Other income (expense), net | (1,366 | ) | (931 | ) | |||||
| Income before provision for income taxes | 34,502 | 30,376 | |||||||
| Provision for income taxes | (7,590 | ) | (6,180 | ) | |||||
| Net income | 26,912 | 24,196 | |||||||
| Net income attributable to noncontrolling interests | (26 | ) | (534 | ) | |||||
| Net income attributable to Bristow Group | $ | 26,886 | $ | 23,662 | |||||
| Earnings per common share: | |||||||||
| Basic | $ | 0.74 | $ | 0.66 | |||||
| Diluted | $ | 0.74 | $ | 0.65 | |||||
| Cash dividends declared per common share | $ | 0.25 | $ | 0.20 | |||||
The accompanying notes are an integral part of these condensed consolidated financial statements.
1
BRISTOW GROUP INC. AND SUBSIDIARIES
Condensed Consolidated Statements of Comprehensive Income
| Three Months Ended June 30, | ||||||||
| 2013 | 2012 | |||||||
(Unaudited) (In thousands) | ||||||||
| Net income | $ | 26,912 | $ | 24,196 | ||||
| Other comprehensive income (loss): | ||||||||
| Currency translation adjustments | (4,429 | ) | 506 | |||||
| Other comprehensive income | 22,483 | 24,702 | ||||||
| Net income attributable to noncontrolling interests | (26 | ) | (534 | ) | ||||
| Currency translation adjustments attributable to noncontrolling interests | (130 | ) | (201 | ) | ||||
| Total comprehensive income attributable to noncontrolling interests | (156 | ) | (735 | ) | ||||
| Total comprehensive income attributable to Bristow Group | $ | 22,327 | $ | 23,967 | ||||
The accompanying notes are an integral part of these condensed consolidated financial statements.
2
BRISTOW GROUP INC. AND SUBSIDIARIES
Condensed Consolidated Balance Sheets
| June 30, 2013 | March 31, 2013 | |||||||
| (Unaudited) | ||||||||
| (In thousands) | ||||||||
| ASSETS | ||||||||
| Current assets: | ||||||||
| Cash and cash equivalents | $ | 159,992 | $ | 215,623 | ||||
| Accounts receivable from non-affiliates | 260,719 | 254,520 | ||||||
| Accounts receivable from affiliates | 7,937 | 8,261 | ||||||
| Inventories | 157,946 | 153,969 | ||||||
| Assets held for sale | 13,627 | 8,290 | ||||||
| Prepaid expenses and other current assets | 32,266 | 35,095 | ||||||
| Total current assets | 632,487 | 675,758 | ||||||
| Investment in unconsolidated affiliates | 276,997 | 272,123 | ||||||
| Property and equipment – at cost: | ||||||||
| Land and buildings | 109,125 | 108,593 | ||||||
| Aircraft and equipment | 2,461,555 | 2,306,054 | ||||||
| 2,570,680 | 2,414,647 | |||||||
| Less – Accumulated depreciation and amortization | (507,390 | ) | (493,575 | ) | ||||
| 2,063,290 | 1,921,072 | |||||||
| Goodwill | 28,845 | 28,897 | ||||||
| Other assets | 56,868 | 52,842 | ||||||
| Total assets | $ | 3,058,487 | $ | 2,950,692 | ||||
| LIABILITIES AND STOCKHOLDERS’ INVESTMENT | ||||||||
| Current liabilities: | ||||||||
| Accounts payable | $ | 73,138 | $ | 69,821 | ||||
| Accrued wages, benefits and related taxes | 47,709 | 56,084 | ||||||
| Income taxes payable | 6,839 | 11,659 | ||||||
| Other accrued taxes | 8,128 | 7,938 | ||||||
| Deferred revenue | 23,916 | 21,646 | ||||||
| Accrued maintenance and repairs | 15,506 | 15,391 | ||||||
| Accrued interest | 6,475 | 14,249 | ||||||
| Other accrued liabilities | 20,251 | 20,714 | ||||||
| Deferred taxes | 3,911 | — | ||||||
| Short-term borrowings and current maturities of long-term debt | 6,950 | 22,323 | ||||||
| Total current liabilities | 212,823 | 239,825 | ||||||
| Long-term debt, less current maturities | 882,823 | 764,946 | ||||||
| Accrued pension liabilities | 121,476 | 126,647 | ||||||
| Other liabilities and deferred credits | 53,532 | 57,196 | ||||||
| Deferred taxes | 159,926 | 151,121 | ||||||
| Commitments and contingencies (Note 5) | ||||||||
| Stockholders’ investment: | ||||||||
| Common stock, $.01 par value, authorized 90,000,000; outstanding: 36,353,802 as of June 30 and 36,150,639 as of March 31 (exclusive of 1,291,741 treasury shares) | 369 | 367 | ||||||
| Additional paid-in capital | 737,070 | 731,883 | ||||||
| Retained earnings | 1,112,644 | 1,094,803 | ||||||
| Accumulated other comprehensive loss | (204,242 | ) | (199,683 | ) | ||||
| Treasury shares, at cost (551,604 shares) | (26,304 | ) | (26,304 | ) | ||||
| Total Bristow Group stockholders’ investment | 1,619,537 | 1,601,066 | ||||||
| Noncontrolling interests | 8,370 | 9,891 | ||||||
| Total stockholders’ investment | 1,627,907 | 1,610,957 | ||||||
| Total liabilities and stockholders’ investment | $ | 3,058,487 | $ | 2,950,692 | ||||
The accompanying notes are an integral part of these condensed consolidated financial statements.
3
BRISTOW GROUP INC. AND SUBSIDIARIES
Condensed Consolidated Statements of Cash Flows
| Three Months Ended June 30, | ||||||||
| 2013 | 2012 | |||||||
(Unaudited) (In thousands) | ||||||||
| Cash flows from operating activities: | ||||||||
| Net income | $ | 26,912 | $ | 24,196 | ||||
| Adjustments to reconcile net income to net cash provided by operating activities: | ||||||||
| Depreciation and amortization | 22,819 | 21,372 | ||||||
| Deferred income taxes | 11,768 | (6,071 | ) | |||||
| Write-off of deferred financing fees | 12,733 | — | ||||||
| Discount amortization on long-term debt | 921 | 870 | ||||||
| Loss on disposal of assets | 1,721 | 5,315 | ||||||
| Stock-based compensation | 2,869 | 2,848 | ||||||
| Equity in earnings from unconsolidated affiliates (in excess of) less than dividends received | (4,974 | ) | 4,129 | |||||
| Tax benefit related to stock-based compensation | (2,522 | ) | (404 | ) | ||||
| Increase (decrease) in cash resulting from changes in: | ||||||||
| Accounts receivable | (6,949 | ) | (10,081 | ) | ||||
| Inventories | (4,112 | ) | (1,869 | ) | ||||
| Prepaid expenses and other assets | (791 | ) | 3,816 | |||||
| Accounts payable | 4,339 | 960 | ||||||
| Accrued liabilities | (18,782 | ) | 11,212 | |||||
| Other liabilities and deferred credits | (9,539 | ) | (881 | ) | ||||
| Net cash provided by operating activities | 36,413 | 55,412 | ||||||
| Cash flows from investing activities: | ||||||||
| Capital expenditures | (179,532 | ) | (86,555 | ) | ||||
| Proceeds from asset dispositions | 1,893 | 20,227 | ||||||
| Investment in unconsolidated affiliate | — | (850 | ) | |||||
| Net cash used in investing activities | (177,639 | ) | (67,178 | ) | ||||
| Cash flows from financing activities: | ||||||||
| Proceeds from borrowings | 103,357 | — | ||||||
| Debt issuance costs | (12,733 | ) | — | |||||
| Repayment of debt | (1,733 | ) | (21,800 | ) | ||||
| Partial prepayment of put/call obligation | (14 | ) | (17 | ) | ||||
| Common stock dividends paid | (9,045 | ) | (7,145 | ) | ||||
| Issuance of common stock | 3,004 | 311 | ||||||
| Tax benefit related to stock-based compensation | 2,522 | 404 | ||||||
| Net cash provided by (used in) financing activities | 85,358 | (28,247 | ) | |||||
| Effect of exchange rate changes on cash and cash equivalents | 237 | 5,713 | ||||||
| Net decrease in cash and cash equivalents | (55,631 | ) | (34,300 | ) | ||||
| Cash and cash equivalents at beginning of period | 215,623 | 261,550 | ||||||
| Cash and cash equivalents at end of period | $ | 159,992 | $ | 227,250 | ||||
| Supplemental disclosure of non-cash investing activities: | ||||||||
| Cash paid during the period for: | ||||||||
| Interest | $ | 17,348 | $ | 3,124 | ||||
| Income taxes | $ | 10,081 | $ | 6,498 | ||||
The accompanying notes are an integral part of these condensed consolidated financial statements.
4
BRISTOW GROUP INC. AND SUBSIDIARIES
NOTES TO CONDENSED CONSOLIDATED FINANCIAL STATEMENTS
(Unaudited)
Note 1 — BASIS OF PRESENTATION, CONSOLIDATION AND SUMMARY OF SIGNIFICANT ACCOUNTING POLICIES
The condensed consolidated financial statements include the accounts of Bristow Group Inc. and its consolidated entities (“Bristow Group,” the “Company,” “we,” “us,” or “our”) after elimination of all significant intercompany accounts and transactions. Our fiscal year ends March 31, and we refer to fiscal years based on the end of such period. Therefore, the fiscal year ending March 31, 2014 is referred to as “fiscal year 2014.” Pursuant to the rules and regulations of the U.S. Securities and Exchange Commission (the “SEC”), the information contained in the following notes to condensed consolidated financial statements is condensed from that which would appear in the annual consolidated financial statements; accordingly, the condensed consolidated financial statements included herein should be read in conjunction with the consolidated financial statements and related notes thereto contained in our fiscal year 2013 Annual Report (the “fiscal year 2013 Financial Statements”). Operating results for the interim period presented are not necessarily indicative of the results that may be expected for the entire fiscal year.
The condensed consolidated financial statements included herein are unaudited; however, they include all adjustments of a normal recurring nature which, in the opinion of management, are necessary for a fair presentation of the consolidated financial position of the Company as of June 30, 2013, the consolidated results of operations for the three months ended June 30, 2013 and 2012, and the consolidated cash flows for the three months ended June 30, 2013 and 2012.
5
BRISTOW GROUP INC. AND SUBSIDIARIES
NOTES TO CONDENSED CONSOLIDATED FINANCIAL STATEMENTS — (Continued)
(Unaudited)
Foreign Currency
See “Foreign Currency” in Note 1 to the fiscal year 2013 Financial Statements for a discussion of the related accounting policies. During the three months ended June 30, 2013 and 2012, our primary foreign currency exposure was to the British pound sterling, the euro, the Australian dollar and the Nigerian naira. The value of these currencies has fluctuated relative to the U.S. dollar as indicated in the following table:
| Three Months Ended June 30, | |||||||||
| 2013 | 2012 | ||||||||
| One British pound sterling into U.S. dollars | |||||||||
| High | 1.57 | 1.62 | |||||||
| Average | 1.54 | 1.58 | |||||||
| Low | 1.50 | 1.53 | |||||||
| At period-end | 1.52 | 1.57 | |||||||
| One euro into U.S. dollars | |||||||||
| High | 1.34 | 1.33 | |||||||
| Average | 1.31 | 1.28 | |||||||
| Low | 1.28 | 1.24 | |||||||
| At period-end | 1.30 | 1.27 | |||||||
| One Australian dollar into U.S. dollars | |||||||||
| High | 1.07 | 1.04 | |||||||
| Average | 1.00 | 1.01 | |||||||
| Low | 0.92 | 0.97 | |||||||
| At period-end | 0.92 | 1.03 | |||||||
| One Nigerian naira into U.S. dollars | |||||||||
| High | 0.0065 | 0.0065 | |||||||
| Average | 0.0064 | 0.0063 | |||||||
| Low | 0.0062 | 0.0061 | |||||||
| At period-end | 0.0062 | 0.0062 | |||||||
______
Source: Bank of England and Oanda.com
Other income (expense), net, in our condensed consolidated statements of income includes foreign currency transaction losses of $1.4 million and $0.9 million for the three months ended June 30, 2013 and 2012, respectively.
Our earnings from unconsolidated affiliates, net of losses, are also affected by the impact of changes in foreign currency exchange rates on the reported results of our unconsolidated affiliates. During the three months ended June 30, 2013 and 2012, earnings from unconsolidated affiliates, net of losses, were decreased by $0.4 million and $3.1 million, respectively, as a result of the impact of changes in foreign currency exchange rates on the results of our unconsolidated affiliates, primarily the impact of changes in the Brazilian real and U.S. dollar exchange rate on results for our affiliate in Brazil. The value of the Brazilian real has fluctuated relative to the U.S. dollar as indicated in the following table (in thousands):
| Three Months Ended June 30, | ||||||||
| 2013 | 2012 | |||||||
| One Brazilian real into U.S. dollars | ||||||||
| High | 0.5123 | 0.5488 | ||||||
| Average | 0.4857 | 0.5125 | ||||||
| Low | 0.4434 | 0.4811 | ||||||
| At period-end | 0.4492 | 0.4816 | ||||||
______
Source: Oanda.com
6
BRISTOW GROUP INC. AND SUBSIDIARIES
NOTES TO CONDENSED CONSOLIDATED FINANCIAL STATEMENTS — (Continued)
(Unaudited)
We estimate that the fluctuation of currencies versus the same period in the prior fiscal year had the following effect on our financial condition and results of operations (in thousands):
| Three Months Ended June 30, 2013 | ||||||
| Revenue | $ | (2,988 | ) | |||
| Operating expense | 1,673 | |||||
| Earnings from unconsolidated affiliates, net of losses | 2,729 | |||||
| Non-operating expense | (342 | ) | ||||
| Income before provision for income taxes | 1,072 | |||||
| Provision for income taxes | (236 | ) | ||||
| Net income | 836 | |||||
| Cumulative translation adjustment | (4,559 | ) | ||||
| Total stockholders’ investment | $ | (3,723 | ) | |||
Accounts Receivable
As of June 30 and March 31, 2013, the allowance for doubtful accounts for non-affiliates was $5.0 million and $5.1 million, respectively, primarily related to amounts due from ATP Oil and Gas Corporation, a client in the U.S. Gulf of Mexico, as a result of its filing for bankruptcy. As of June 30 and March 31, 2013, there were no allowances for doubtful accounts related to accounts receivable due from affiliates. See “Summary of Significant Accounting Policies” in Note 1 to the fiscal year 2013 Financial Statements for further information related to our accounting policies for accounts receivable.
Inventories
During the three months ended June 30, 2013, we increased our inventory allowance by $0.8 million related to an aircraft type we ceased ownership of in June 2013. See "Summary of Significant Accounting Policies" in Note 1 to the fiscal year 2013 Financial Statements for further information related to our accounting policies for inventories.
Prepaid Expenses and Other Current Assets
As of March 31, 2013, prepaid expenses and other current assets included $12.7 million in fees related to a potential financing in connection with our bid to provide search and rescue ("SAR") services in the U.K. During the three months ended June 30, 2013, we increased our borrowing capacity on our revolving credit facility from $200 million to $350 million ("Revolving Credit Facility") and cancelled the potential financing. During the three months ended June 30, 2013, we included the $12.7 million of unamortized deferred financing fees as interest expense on our condensed consolidated statement of income.
Property and Equipment and Assets Held for Sale
During the three months ended June 30, 2013 and 2012, we recorded impairment charges of $1.2 million and $1.9 million to reduce the carrying value of two and seven aircraft held for sale, respectively. These impairment charges are included in loss on disposal of assets on the condensed consolidated statement of income. We sold four aircraft and other equipment during the three months ended June 30, 2013 for proceeds of $1.9 million resulting in a loss of $0.5 million. We sold four aircraft and other equipment during the three months ended June 30, 2012 for proceeds of $20.2 million resulting in a loss of $3.4 million. See “Summary of Significant Accounting Policies” in Note 1 to the fiscal year 2013 Financial Statements for further information related to our accounting policies for property and equipment and assets held for sale.
7
BRISTOW GROUP INC. AND SUBSIDIARIES
NOTES TO CONDENSED CONSOLIDATED FINANCIAL STATEMENTS — (Continued)
(Unaudited)
Recent Accounting Pronouncement
In February 2013, the Financial Accounting Standards Board (the “FASB”) issued accounting guidance on the presentation of reclassifications of items out of accumulated other comprehensive income. This guidance amends existing guidance by requiring that additional information be disclosed about items reclassified out of accumulated other comprehensive income. The additional information includes separately stating the total change for each component of other comprehensive income (for example unrealized gains or losses on available-for-sale securities or foreign currency items) and separately disclosing both current-period other comprehensive income and reclassification adjustments. Entities are also required to present, either on the face of the statement of income or in the notes to the financial statements, significant amounts reclassified out of accumulated other comprehensive income as separate line items of net income but only if the entire amount reclassified must be reclassified to net income in the same reporting period. For amounts that are not required to be reclassified in their entirety to net income, an entity must cross-reference to other disclosures that provide additional detail about those amounts. This pronouncement was effective for interim and annual periods beginning after December 15, 2012. We adopted this pronouncement for our fiscal year 2014 beginning April 1, 2013, and it did not have an impact on our financial statements.
Note 2 — VARIABLE INTEREST ENTITIES AND OTHER INVESTMENTS IN SIGNIFICANT AFFILIATES
VIEs
A Variable Interest Entity (“VIE”) is an entity that either (i) has insufficient equity to permit the entity to finance its activities without additional subordinated financial support or (ii) has equity investors who lack the characteristics of a controlling financial interest. A VIE is consolidated by its primary beneficiary. The primary beneficiary has both the power to direct the activities that most significantly impact the entity’s economic performance and the obligation to absorb losses or the right to receive benefits from the entity that could potentially be significant to the VIE. If we determine that we have operating power and the obligation to absorb losses or receive benefits, we consolidate the VIE as the primary beneficiary, and if not, we do not consolidate.
As of June 30, 2013, we had interests in three VIEs of which we are the primary beneficiary, which are described below, and had no interests in VIEs of which we are not the primary beneficiary. See Note 3 to the fiscal year 2013 Financial Statements for a description of other investments in significant affiliates.
Bristow Aviation Holdings Limited — We own 49% of Bristow Aviation Holdings Limited’s (“Bristow Aviation”) common stock and a significant amount of its subordinated debt. Bristow Aviation is incorporated in England and holds all of the outstanding shares in Bristow Helicopter Limited (“Bristow Helicopters”). Bristow Aviation's subsidiaries provide helicopter services to clients primarily in the U.K, Norway, Australia, Nigeria and Trinidad. Bristow Aviation is organized with three different classes of ordinary shares having disproportionate voting rights. The Company, Caledonia Investments plc (“Caledonia”) and a European Union investor (the “E.U. Investor”) own 49%, 46% and 5%, respectively, of Bristow Aviation’s total outstanding ordinary shares, although Caledonia has voting control over the E.U. Investor’s shares.
In addition to our ownership of 49% of Bristow Aviation’s outstanding ordinary shares, in May 2004, we acquired eight million shares of deferred stock, essentially a subordinated class of stock with no voting rights, from Bristow Aviation for £1 per share ($14.4 million in total). We also have £91.0 million ($138.0 million) principal amount of subordinated unsecured loan stock (debt) of Bristow Aviation bearing interest at an annual rate of 13.5% and payable semi-annually. Payment of interest on such debt has been deferred since its incurrence in 1996. Deferred interest accrues at an annual rate of 13.5% and aggregated $1.2 billion as of June 30, 2013.
The Company, Caledonia, the E.U. Investor and Bristow Aviation have entered into a shareholder agreement respecting, among other things, the composition of the board of directors of Bristow Aviation. On matters coming before Bristow Aviation’s board, Caledonia’s representatives have a total of three votes and the two other directors have one vote each. In addition, Caledonia has the right to nominate two persons to our board of directors and to replace any such directors so nominated.
Caledonia, the Company and the E.U. Investor also have entered into a put/call agreement under which, upon giving specified prior notice, we have the right to buy all the Bristow Aviation shares held by Caledonia and the E.U. Investor, who, in turn, each have the right to require us to purchase such shares. Under current English law, we would be required, in order for Bristow Aviation to retain its operating license, to find a qualified E.U. investor to own any Bristow Aviation shares we have the right to acquire under the put/call agreement. The only restriction under the put/call agreement limiting our ability to exercise the put/call option is a requirement to consult with the Civil Aviation Authority (“CAA”) in the U.K. regarding the suitability of the new holder of the Bristow Aviation shares. The put/call agreement does not contain any provisions should the CAA not approve the new E.U. investor. However, we would work diligently to find an E.U. investor suitable to the CAA. The amount by which we could purchase
8
BRISTOW GROUP INC. AND SUBSIDIARIES
NOTES TO CONDENSED CONSOLIDATED FINANCIAL STATEMENTS — (Continued)
(Unaudited)
the shares of the other investors holding 51% of the equity of Bristow Aviation is fixed under the terms of the call option, and we have reflected this amount on our condensed consolidated balance sheets as noncontrolling interest.
Furthermore, the call option provides a mechanism whereby the economic risk for the other investors is limited should the financial condition of Bristow Aviation deteriorate. The call option price is the nominal value of the ordinary shares held by the noncontrolling shareholders (£1.0 million as of June 30, 2013) plus an annual guaranteed rate of return less any prepayments of such call option price and any dividends paid on the shares concerned. We can elect to pre-pay the guaranteed return element of the call option price wholly or in part without exercising the call option. No dividends have been paid. We have accrued the annual return due to the other shareholders at a rate of sterling LIBOR plus 3% (prior to May 2004, the rate was fixed at 12%) by recognizing noncontrolling interest expense on our condensed consolidated statements of income, with a corresponding increase in noncontrolling interest on our condensed consolidated balance sheets. Prepayments of the guaranteed return element of the call option are reflected as a reduction in noncontrolling interest on our condensed consolidated balance sheets. The other investors have an option to put their shares in Bristow Aviation to us. The put option price is calculated in the same way as the call option price except that the guaranteed rate for the period to April 2004 was 10% per annum. If the put option is exercised, any pre-payments of the call option price are set off against the put option price.
Bristow Aviation and its subsidiaries are exposed to similar operational risks and are therefore monitored and evaluated on a similar basis by management. Accordingly, the financial information reflected on our condensed consolidated balance sheets and statements of income for Bristow Aviation and subsidiaries is presented in the aggregate, including intercompany amounts with other consolidated entities, as follows (in thousands):
| June 30, 2013 | March 31, 2013 | |||||||||
| Assets | ||||||||||
| Cash and cash equivalents | $ | 74,913 | $ | 93,227 | ||||||
| Accounts receivable | 227,502 | 240,861 | ||||||||
| Inventories | 103,391 | 100,115 | ||||||||
| Prepaid expenses and other current assets | 17,968 | 20,575 | ||||||||
| Total current assets | 423,774 | 454,778 | ||||||||
| Investment in unconsolidated affiliates | 8,493 | 9,092 | ||||||||
| Property and equipment, net | 154,278 | 157,066 | ||||||||
| Goodwill | 12,796 | 12,810 | ||||||||
| Other assets | 30,179 | 26,575 | ||||||||
| Total assets | $ | 629,520 | $ | 660,321 | ||||||
| Liabilities | ||||||||||
| Accounts payable | $ | 111,575 | $ | 128,591 | ||||||
| Accrued liabilities | 1,244,497 | 1,214,209 | ||||||||
| Deferred taxes | 6,761 | 7,907 | ||||||||
| Current maturities of long-term debt | 1,184 | 448 | ||||||||
| Total current liabilities | 1,364,017 | 1,351,155 | ||||||||
| Long-term debt, less current maturities | 138,147 | 138,147 | ||||||||
| Accrued pension liabilities | 121,476 | 126,647 | ||||||||
| Other liabilities and deferred credits | 1,354 | 1,755 | ||||||||
| Total liabilities | $ | 1,624,994 | $ | 1,617,704 | ||||||
| Three Months Ended June 30, | ||||||||||
| 2013 | 2012 | |||||||||
| Revenue | $ | 311,801 | $ | 284,780 | ||||||
| Operating income | 9,131 | 3,879 | ||||||||
| Net loss | 32,350 | 35,493 | ||||||||
9
BRISTOW GROUP INC. AND SUBSIDIARIES
NOTES TO CONDENSED CONSOLIDATED FINANCIAL STATEMENTS — (Continued)
(Unaudited)
Bristow Helicopters Nigeria Ltd. — Bristow Helicopters Nigeria Ltd. (“BHNL”) is a joint venture in Nigeria with local partners, in which we own a 40% interest. BHNL provides helicopter services to clients in Nigeria.
In order to have a presence in the Nigerian market, we were required to identify local citizens to participate in the ownership of entities domiciled in the region. However, these owners do not have extensive knowledge of the aviation industry and have historically deferred to our expertise in the overall management and day-to-day operation of BHNL (including the establishment of operating and capital budgets and strategic decisions regarding the potential expansion of BHNL’s operations). We have also historically provided subordinated financial support to BHNL and will need to continue to do so unless and until BHNL acquires sufficient equity to permit itself to finance its activities without that additional support from us. Thus, because we have the power to direct the most significant activities affecting the economic performance and ongoing success of BHNL and hold a variable interest in the entity in the form of our equity investment and working capital infusions, we consolidate BHNL as the primary beneficiary.
BHNL is an indirect subsidiary of Bristow Aviation; therefore, financial information for this entity is included within the amounts for Bristow Aviation and its subsidiaries presented above.
Pan African Airlines Nigeria Ltd. — Pan African Airlines Nigeria Ltd. (“PAAN”) is a joint venture in Nigeria with local partners, in which we own a 50.17% interest. PAAN provides helicopter services to clients in Nigeria.
The activities that most significantly impact PAAN’s economic performance relate to the day-to-day operation of PAAN, setting the operating and capital budgets, and strategic decisions regarding the potential expansion of PAAN’s operations. Throughout the history of PAAN, our representation on the board and our secondment to PAAN of its managing director has enabled us to direct the key operational decisions of PAAN (without objection from the other board members). We have also historically provided subordinated financial support to PAAN. As we have the power to direct the most significant activities affecting the economic performance and ongoing success of PAAN and hold a variable interest in the form of our equity investment and working capital infusions, we consolidate PAAN as the primary beneficiary. However, as long as we own a majority interest in PAAN, the separate presentation of financial information in a tabular format for PAAN is not required.
Other Significant Affiliates — Unconsolidated
FB Entities — As of June 30 and March 31, 2013, we owned a 50% interest in each of FBS Limited, FB Heliservices Limited and FB Leasing Limited, collectively referred to as the FB Entities, U.K. corporations which principally provide pilot training, maintenance and support services to the British military under a contract that runs through March 2016 with two possible one year extensions. The FB Entities own and operate a total of 64 aircraft. The FB Entities are accounted for under the equity method. On July 14, 2013, we sold our 50% interest in the FB entities for £74 million, or approximately $112.0 million. We expect to record a pre-tax gain on sale of investment of approximately $104 million during the three months ended September 30, 2013 on our condensed consolidated statement of income.
Note 3 — DEBT
Debt as of June 30 and March 31, 2013 consisted of the following (in thousands):
| June 30, 2013 | March 31, 2013 | |||||||||
| 6¼% Senior Notes due 2022 | $ | 450,000 | $ | 450,000 | ||||||
| Term Loan | 229,472 | 230,625 | ||||||||
| 3% Convertible Senior Notes due 2038, including $7.9 million and $8.8 million of unamortized discount, respectively | 107,117 | 106,196 | ||||||||
| Revolving Credit Facility | 102,000 | — | ||||||||
| Other | 1,184 | 448 | ||||||||
| Total debt | 889,773 | 787,269 | ||||||||
| Less short-term borrowings and current maturities of long-term debt | (6,950 | ) | (22,323 | ) | ||||||
| Total long-term debt | $ | 882,823 | $ | 764,946 | ||||||
10
BRISTOW GROUP INC. AND SUBSIDIARIES
NOTES TO CONDENSED CONSOLIDATED FINANCIAL STATEMENTS — (Continued)
(Unaudited)
The balances of the debt and equity components of the 3% Convertible Senior Notes due 2038 (the “3% Convertible Senior Notes”) as of each period presented are as follows (in thousands):
| June 30, 2013 | March 31, 2013 | |||||||||
| Equity component – net carrying value | $ | 14,905 | $ | 14,905 | ||||||
| Debt component: | ||||||||||
| Face amount due at maturity | $ | 115,000 | $ | 115,000 | ||||||
| Unamortized discount | (7,883 | ) | (8,804 | ) | ||||||
| Debt component – net carrying value | $ | 107,117 | $ | 106,196 | ||||||
The remaining debt discount is being amortized into interest expense over the expected remaining life of the 3% Convertible Senior Notes to June 2015 (the first put date) using the effective interest rate. The effective interest rate for the three months ended June 30, 2013 and 2012 was 6.9%. Interest expense related to our 3% Convertible Senior Notes for the three months ended June 30, 2013 and 2012 was as follows (in thousands):
| Three Months Ended June 30, | ||||||||||
| 2013 | 2012 | |||||||||
| Contractual coupon interest | $ | 863 | $ | 863 | ||||||
| Amortization of debt discount | 921 | 870 | ||||||||
| Total interest expense | $ | 1,784 | $ | 1,733 | ||||||
On April 29, 2013, we entered into the third amendment to the revolving credit and term loan agreement (the “Third Amendment”). The Third Amendment (a) increased the commitments under the Revolving Credit Facility from $200 million to $350 million and (b) extended the maturity date of the Revolving Credit Facility and the five year, $250 million term loan ("Term Loan") from December 2016 to April 2018. For further details on the Revolving Credit Facility and Term Loan, see Note 5 to the fiscal year 2013 Financial Statements. During the three months ended June 30, 2013, we borrowed $102.0 million under the Revolving Credit Facility. Additionally, we paid $1.2 million to reduce our borrowings under the Term Loan. As of June 30, 2013, we had $0.6 million in letters of credit.
Note 4 — FAIR VALUE DISCLOSURES
Assets and liabilities subject to fair value measurement are categorized into one of three different levels depending on the observability of the inputs employed in the measurement, as follows:
| • | Level 1 – observable inputs that reflect quoted prices (unadjusted) for identical assets or liabilities in active markets. |
| • | Level 2 – inputs reflect quoted prices for identical assets or liabilities in markets that are not active; quoted prices for similar assets or liabilities in active markets; inputs other than quoted prices that are observable for the asset or liability; or inputs that are derived principally from or corroborated by observable market data by correlation or other means. |
| • | Level 3 – unobservable inputs reflecting the Company’s own assumptions incorporated in valuation techniques used to determine fair value. These assumptions are required to be consistent with market participant assumptions that are reasonably available. |
Non-recurring Fair Value Measurements
The majority of our non-financial assets, which include inventories, property and equipment, assets held for sale, goodwill and other intangible assets, are not required to be carried at fair value on a recurring basis. However, if certain triggering events occur such that a non-financial asset is required to be evaluated for impairment and deemed to be impaired, the impaired non-financial asset is recorded at its fair value.
11
BRISTOW GROUP INC. AND SUBSIDIARIES
NOTES TO CONDENSED CONSOLIDATED FINANCIAL STATEMENTS — (Continued)
(Unaudited)
The following table summarizes the assets as of June 30, 2013, which are valued at fair value on a non-recurring basis (in thousands):
| Quoted Prices in Active Markets for Identical Assets (Level 1) | Significant Other Observable Inputs (Level 2) | Significant Unobservable Inputs (Level 3) | Balance as of June 30, 2013 | Total Loss for the Three Months Ended June 30, 2013 | ||||||||||||||||
| Inventories | $ | — | $ | 1,100 | $ | — | $ | 1,100 | $ | (825 | ) | |||||||||
| Assets held for sale | — | 2,300 | — | 2,300 | (1,230 | ) | ||||||||||||||
| Total assets | $ | — | $ | 3,400 | $ | — | $ | 3,400 | $ | (2,055 | ) | |||||||||
The following table summarizes the assets as of June 30, 2012, which are valued at fair value on a non-recurring basis (in thousands):
| Quoted Prices in Active Markets for Identical Assets (Level 1) | Significant Other Observable Inputs (Level 2) | Significant Unobservable Inputs (Level 3) | Balance as of June 30, 2012 | Total Loss for the Three Months Ended June 30, 2012 | ||||||||||||||||
| Assets held for sale | $ | — | $ | 3,646 | $ | — | $ | 3,646 | $ | (1,889 | ) | |||||||||
| Total assets | $ | — | $ | 3,646 | $ | — | $ | 3,646 | $ | (1,889 | ) | |||||||||
The fair value of inventories using Level 2 inputs is determined by evaluating the current economic conditions for sale and disposal of spare parts, which includes estimates as to the recoverability of the carrying value of the parts based on historical experience with sales and disposal of similar spare parts, the expected timeframe of sales or disposals, the location of the spare parts to be sold and the condition of the spare parts to be sold or otherwise disposed of. The fair value of assets held for sale using Level 2 inputs is determined through evaluation of expected sales proceeds for aircraft. This analysis includes estimates based on historical experience with sales, recent transactions involving similar assets, quoted market prices for similar assets and condition and location of aircraft to be sold or otherwise disposed of. The loss for the three months ended June 30, 2013 related to two aircraft held for sale and the loss for the three months ended June 30, 2012 related to seven aircraft held for sale.
Recurring Fair Value Measurements
The following table summarizes the financial instruments we had as of June 30, 2013, which are valued at fair value on a recurring basis (in thousands):
| Quoted Prices in Active Markets for Identical Assets (Level 1) | Significant Other Observable Inputs (Level 2) | Significant Unobservable Inputs (Level 3) | Balance as of June 30, 2013 | Balance Sheet Classification | ||||||||||||||
| Rabbi Trust investments | $ | 4,891 | $ | — | $ | — | $ | 4,891 | Other assets | |||||||||
| Total assets | $ | 4,891 | $ | — | $ | — | $ | 4,891 | ||||||||||
| Contingent consideration | $ | — | $ | — | $ | 35,942 | $ | 35,942 | Other liabilities and deferred credits | |||||||||
| Total liabilities | $ | — | $ | — | $ | 35,942 | $ | 35,942 | ||||||||||
12
BRISTOW GROUP INC. AND SUBSIDIARIES
NOTES TO CONDENSED CONSOLIDATED FINANCIAL STATEMENTS — (Continued)
(Unaudited)
The following table summarizes the financial instruments we had as of March 31, 2013, which are valued at fair value on a recurring basis (in thousands):
| Quoted Prices in Active Markets for Identical Assets (Level 1) | Significant Other Observable Inputs (Level 2) | Significant Unobservable Inputs (Level 3) | Balance as of March 31, 2013 | Balance Sheet Classification | ||||||||||||||
| Rabbi Trust investments | $ | 4,837 | $ | — | $ | — | $ | 4,837 | Other assets | |||||||||
| Total assets | $ | 4,837 | $ | — | $ | — | $ | 4,837 | ||||||||||
| Contingent consideration | $ | — | $ | — | $ | 35,625 | $ | 35,625 | Other liabilities and deferred credits | |||||||||
| Total liabilities | $ | — | $ | — | $ | 35,625 | $ | 35,625 | ||||||||||
The rabbi trust investments consist of mutual funds whose fair value is based on quoted prices in active markets for identical assets, and are designated as Level 1 within the valuation hierarchy. The rabbi trust holds investments related to our non-qualified deferred compensation plan for our senior executives.
The contingent consideration relates to our acquisition of an investment in Cougar Helicopters Inc. ("Cougar"). The Cougar purchase agreement includes a potential earn-out of $40 million payable over three years based on Cougar achieving certain agreed performance targets. For further details on the Cougar acquisition, see Note 3 to the fiscal year 2013 Financial Statements.
The following table provides a rollforward of the contingent consideration liability Level 3 fair value measurements during the three months ended June 30, 2013:
| Significant Unobservable Inputs (Level 3) | ||||||
| Contingent consideration: | ||||||
| Balance as of March 31, 2013 | $ | 35,625 | ||||
| Additions: | ||||||
| Change in fair value of contingent consideration | 317 | |||||
| Balance as of June 30, 2013 | $ | 35,942 | ||||
We assess the estimated fair value of the contractual obligation to pay the contingent consideration on a quarterly basis and any changes in estimated fair value are recorded as accretion expense included in depreciation and amortization on our condensed consolidated statements of income. Fluctuations in the fair value of contingent consideration are impacted by two unobservable inputs, management's estimate of the probability of Cougar achieving certain agreed performance targets and the estimated discount rate. As of June 30 and March 31, 2013, the discount rate approximated 4%.
13
BRISTOW GROUP INC. AND SUBSIDIARIES
NOTES TO CONDENSED CONSOLIDATED FINANCIAL STATEMENTS — (Continued)
(Unaudited)
Fair Value of Financial Instruments
The fair value of our financial instruments has been estimated in accordance with the accounting standard regarding fair value. The fair value of our fixed rate long-term debt is estimated based on quoted market prices. The carrying and fair value of our long-term debt, including the current portion, are as follows (in thousands):
| June 30, 2013 | March 31, 2013 | |||||||||||||||
Carrying Value | Fair Value | Carrying Value | Fair Value | |||||||||||||
| 6¼% Senior Notes | $ | 450,000 | $ | 461,250 | $ | 450,000 | $ | 484,875 | ||||||||
| Term Loan | 229,472 | 229,472 | 230,625 | 230,625 | ||||||||||||
| 3% Convertible Senior Notes | 107,117 | 136,376 | 106,196 | 131,819 | ||||||||||||
| Revolving Credit Facility | 102,000 | 102,000 | — | — | ||||||||||||
| Other | 1,184 | 1,184 | 448 | 448 | ||||||||||||
| $ | 889,773 | $ | 930,282 | $ | 787,269 | $ | 847,767 | |||||||||
Other
The fair values of our cash and cash equivalents, accounts receivable and accounts payable approximate their carrying values due to the short-term nature of these items.
14
BRISTOW GROUP INC. AND SUBSIDIARIES
NOTES TO CONDENSED CONSOLIDATED FINANCIAL STATEMENTS — (Continued)
(Unaudited)
Note 5 — COMMITMENTS AND CONTINGENCIES
Aircraft Purchase Contracts — As shown in the table below, we expect to make additional capital expenditures over the next five fiscal years to purchase additional aircraft. As of July 11, 2013, we had 58 aircraft on order and options to acquire an additional 70 aircraft. Although a similar number of our existing aircraft may be sold during the same period, the additional aircraft on order will provide incremental fleet capacity in terms of revenue and operating income. As discussed in the fiscal year 2013 Financial Statements, we were awarded a contract to provide civilian SAR services for all of the U.K. (the "U.K. SAR contract"). The SAR configured aircraft on order in the table below are intended to service this contract.
| Nine Months Ending March 31, 2014 | Fiscal Year Ending March 31, | |||||||||||||||||||||||
| 2015 | 2016 | 2017 | 2018 and thereafter | Total | ||||||||||||||||||||
Commitments as of July 11, 2013: (1)(2) | ||||||||||||||||||||||||
| Number of aircraft: | ||||||||||||||||||||||||
| Medium | 9 | 5 | — | — | — | 14 | ||||||||||||||||||
Large (3) | 11 | 7 | 7 | 1 | — | 26 | ||||||||||||||||||
| SAR configured | — | 10 | 8 | — | — | 18 | ||||||||||||||||||
| 20 | 22 | 15 | 1 | — | 58 | |||||||||||||||||||
Related expenditures (in thousands)(4)(5) | ||||||||||||||||||||||||
| Medium and large | $ | 318,197 | $ | 177,456 | $ | 87,332 | $ | 13,771 | $ | — | $ | 596,756 | ||||||||||||
| SAR configured | 151,337 | 172,483 | 113,079 | — | — | 436,899 | ||||||||||||||||||
| $ | 469,534 | $ | 349,939 | $ | 200,411 | $ | 13,771 | $ | — | $ | 1,033,655 | |||||||||||||
Options as of July 11, 2013: (3) | ||||||||||||||||||||||||
| Number of aircraft: | ||||||||||||||||||||||||
| Medium | 1 | 8 | 9 | 5 | 3 | 26 | ||||||||||||||||||
Large (3) | — | 9 | 12 | 15 | 8 | 44 | ||||||||||||||||||
| 1 | 17 | 21 | 20 | 11 | 70 | |||||||||||||||||||
Related expenditures (in thousands)(4) | $ | 114,341 | $ | 392,553 | $ | 399,476 | $ | 372,541 | $ | 134,555 | $ | 1,413,466 | ||||||||||||
______
(1) | Signed client contracts are currently in place that will utilize 31 of these aircraft. |
(2) | On July 11, 2013, we entered into an agreement to order 11 AW189 large aircraft which are reflected in this table. These aircraft orders have delivery dates in fiscal years 2015 and 2016 with total payments of approximately $209.3 million. |
(3) | Twenty-two aircraft on order and thirteen aircraft under options are expected to enter service between fiscal years 2014 and 2018 are subject to the successful development and certification of the aircraft. |
(4) | Includes progress payments on aircraft scheduled to be delivered in future periods. |
(5) | Expenditures for the nine months ending March 31, 2014 include payments made during the period from July 1 to July 11, 2013. |
The following chart presents an analysis of our aircraft orders and options during fiscal year 2014:
| July 1 to | Three Months Ended | |||||||||||
| July 11, 2013 | June 30, 2013 | |||||||||||
| Orders | Options | Orders | Options | |||||||||
| Beginning of period | 47 | 70 | 45 | 70 | ||||||||
| Aircraft delivered | — | — | (5 | ) | — | |||||||
| Aircraft ordered | 11 | — | 7 | — | ||||||||
| End of period | 58 | 70 | 47 | 70 | ||||||||
We periodically purchase aircraft for which we have no orders.
15
BRISTOW GROUP INC. AND SUBSIDIARIES
NOTES TO CONDENSED CONSOLIDATED FINANCIAL STATEMENTS — (Continued)
(Unaudited)
Operating Leases — We have non-cancelable operating leases in connection with the lease of certain equipment, land and facilities, including leases for aircraft. Rental expense incurred under all operating leases, except for those with terms of a month or less that were not renewed, was $23.1 million and $16.3 million for the three months ended June 30, 2013 and 2012, respectively, which includes rental expense incurred under operating leases for aircraft of $18.1 million and $11.2 million, respectively.
The aircraft leases range from base terms of 60 to 84 months with renewal options of up to 108 months in some cases, include purchase options upon expiration and some include early purchase options. The leases contain terms customary in transactions of this type, including provisions that allow the lessor to repossess the aircraft and require us to pay a stipulated amount if we default on our obligations under the agreements. The following is a summary of the terms related to aircraft leased under operating leases with original or remaining terms in excess of one year:
| End of Lease Term | Number of Aircraft | Monthly Lease Payments (in thousands) | ||||||
| Nine months ending March 31, 2014 to fiscal year 2015 | 3 | $ | 224 | |||||
| Fiscal year 2016 to fiscal year 2018 | 17 | 3,523 | ||||||
| Fiscal year 2019 to fiscal year 2024 | 16 | 1,485 | ||||||
| 36 | $ | 5,232 | ||||||
Employee Agreements — Approximately 55% of our employees are represented by collective bargaining agreements and/or unions. These agreements generally include annual escalations of up to 12%. Periodically, certain groups of our employees who are not covered by a collective bargaining agreement consider entering into such an agreement.
During the three months ended June 30, 2012, we recognized $2.2 million in compensation expense included in direct cost related to severance costs as a result of the termination of a contract in the Southern North Sea. Also, during the three months ended June 30, 2012, we recognized approximately $2.0 million in compensation expense (including expenses recorded for the acceleration of unvested stock options and restricted stock) included in general and administrative expense related to the separation between us and an officer.
Nigerian Litigation — In November 2005, two of our consolidated foreign affiliates were named in a lawsuit filed with the High Court of Lagos State, Nigeria by Mr. Benneth Osita Onwubalili and his affiliated company, Kensit Nigeria Limited, which allegedly acted as agents of our affiliates in Nigeria. The claimants allege that an agreement between the parties was terminated without justification and seek damages of $16.3 million. We responded to this claim in early 2006. There has been minimal activity on this claim since then.
Environmental Contingencies — The U.S. Environmental Protection Agency, also referred to as the EPA, has in the past notified us that we are a potential responsible party, or PRP, at three former waste disposal facilities that are on the National Priorities List of contaminated sites. Under the federal Comprehensive Environmental Response, Compensation and Liability Act, also known as the Superfund law, persons who are identified as PRPs may be subject to strict, joint and several liability for the costs of cleaning up environmental contamination resulting from releases of hazardous substances at National Priorities List sites. Although we have not yet obtained a formal release of liability from the EPA with respect to any of the sites, we believe that our potential liability in connection with the sites is not likely to have a material adverse effect on our business, financial condition or results of operations.
Other Matters — Although infrequent, aircraft accidents have occurred in the past, and the related losses and liability claims have been covered by insurance subject to deductible, self-insured retention and loss sensitive factors.
On October 5, 2012, a Bell 407 helicopter operated by a U.S. subsidiary of ours was involved in an accident in which the pilot was fatally injured. There were no other passengers onboard. We are currently working with authorities in their investigation.
On October 22, 2012, an incident occurred with a Eurocopter EC225 Super Puma helicopter operated by another helicopter company, which resulted in a controlled ditching on the North Sea, south of the Shetland Isles, U.K. Following the ditching, all 19 passengers and crew were recovered safely and without injuries.
Related to this incident, the CAAs in the U.K. and Norway issued safety directives in October 2012, requiring operators to suspend operations of the affected aircraft. As a result, we ceased operating a total of sixteen large Eurocopter aircraft until further notice: twelve in the U.K., three in Australia and one in Norway.
16
BRISTOW GROUP INC. AND SUBSIDIARIES
NOTES TO CONDENSED CONSOLIDATED FINANCIAL STATEMENTS — (Continued)
(Unaudited)
In order to mitigate the impact on our clients, we have increased utilization of other in-region aircraft, returned to service previously idle Eurocopter AS332L helicopters not affected by the CAA safety directives and purchased ten Sikorsky S-92 large aircraft with options for 16 more.
Eurocopter, the manufacturer of the EC225 Super Puma aircraft, has indicated that they have determined the root causes of the gear shaft failure in the EC225 that occurred in 2012. This determination has been reviewed and verified by airworthiness authorities and independent third parties. The definitive solution to the problem will be a redesign of the gear shaft with earliest possible availability being in the middle of calendar year 2014. However, in July 2013 the European Aviation Safety Authority (the "EASA") issued an airworthiness directive providing for interim solutions involving minor aircraft modifications and new maintenance/operating procedures for mitigating shaft failure and enhancing early detection.
The CAAs in the U.K. and Norway have issued safety directives, which superseded and revoked the safety directive of October 2012 and now permits a return to service of the EC225 aircraft over harsh environments conditional upon compliance with the EASA airworthiness directive. We have commenced the required modifications and are carrying out the required inspections on our EC225 fleet in the U.K., Norway and Australia.
Currently, no client contracts have been cancelled in connection with the suspension in operations of the EC225 aircraft and we believe we have the contractual right to continue to receive monthly standing charges billed to our clients. In certain instances we have agreed to reduced monthly standing charge billings for the affected aircraft. We have been able to substantially replace the lost utilization from the EC225 aircraft with other aircraft, mitigating the impact on our results of operations for three months ended June 30, 2013.
The current situation will continue until the necessary modifications are made to the EC225 fleet and we are confident that the interim modifications will allow us to operate the aircraft safely, which could result in our return to revenue service for the EC225 aircraft in the third quarter of our fiscal year 2014. Until then, this situation could have a material adverse effect on our future business, financial condition and results of operations.
On October 27, 2012, in the course of routine operations, a Bell 206 performed a controlled sea ditching in Nigeria. All four people on board were uninjured and safe and the aircraft has been recovered. We are currently working with authorities in their investigation.
We are a defendant in certain claims and litigation arising out of operations in the normal course of business. In the opinion of management, uninsured losses, if any, will not be material to our financial position, results of operations or cash flows.
Note 6 — TAXES
Our effective income tax rates were 22.0% and 20.3% for the three months ended June 30, 2013 and 2012, respectively. Our effective tax rate was impacted by the permanent reinvestment outside the U.S. of foreign earnings, upon which no U.S. tax has been provided, and by the amount of our foreign source income and our ability to realize foreign tax credits. As of June 30, 2013, there were $1.7 million of unrecognized tax benefits, all of which would have an impact on our effective tax rate, if recognized.
17
BRISTOW GROUP INC. AND SUBSIDIARIES
NOTES TO CONDENSED CONSOLIDATED FINANCIAL STATEMENTS — (Continued)
(Unaudited)
Note 7 — EMPLOYEE BENEFIT PLANS
Pension Plans
The following table provides a detail of the components of net periodic pension cost (in thousands):
| Three Months Ended June 30, | ||||||||||
| 2013 | 2012 | |||||||||
| Service cost for benefits earned during the period | $ | 2,051 | $ | 2,057 | ||||||
| Interest cost on pension benefit obligation | 6,538 | 6,433 | ||||||||
| Expected return on assets | (7,102 | ) | (7,281 | ) | ||||||
| Amortization of unrecognized losses | 1,877 | 1,657 | ||||||||
| Net periodic pension cost | $ | 3,364 | $ | 2,866 | ||||||
We pre-funded our contributions of £12.5 million ($19.0 million) to our U.K. Staff pension plan for fiscal year 2014 in the last quarter of fiscal year 2013. The current estimate of our cash contributions to our Norwegian pension plan and U.K. expatriate plan for fiscal year 2014 are $8.1 million and $0.3 million, respectively, $2.7 million and $0.1 million, respectively, of which were paid during the three months ended June 30, 2013.
Incentive Compensation
Stock–based awards are currently made under the Bristow Group Inc. 2007 Long-Term Incentive Plan (the “2007 Plan”). A maximum of 5,400,000 shares of common stock, par value $.01 per share (“Common Stock”), are reserved. Awards granted under the 2007 Plan may be in the form of stock options, stock appreciation rights, shares of restricted stock, other stock-based awards (payable in cash or Common Stock) or performance awards, or any combination thereof, and may be made to outside directors, employees or consultants. As of June 30, 2013, 3,013,210 shares remained available for grant under the 2007 Plan.
We have a number of other incentive and stock option plans which are described in Note 10 to our fiscal year 2013 Financial Statements.
Total stock-based compensation expense, which includes stock options, restricted stock units and restricted stock, totaled $2.9 million and $2.8 million for the three months ended June 30, 2013 and 2012, respectively. Stock-based compensation expense has been allocated to our various business units.
During the three months ended June 30, 2013, we awarded 163,396 shares of restricted stock at an average grant date fair value of $62.66 per share. Also during the three months ended June 30, 2013, 302,678 stock options were granted. The following table shows the assumptions used to compute the stock-based compensation expense for stock options granted during the three months ended June 30, 2013:
| Risk free interest rate | 1.01% | ||
| Expected life (years) | 5 | ||
| Volatility | 48.7% | ||
| Dividend yield | 1.60% | ||
| Weighted average exercise price of options granted | $62.66 per option | ||
| Weighted average grant-date fair value of options granted | $23.77 per option | ||
18
BRISTOW GROUP INC. AND SUBSIDIARIES
NOTES TO CONDENSED CONSOLIDATED FINANCIAL STATEMENTS — (Continued)
(Unaudited)
Performance cash awards vest and pay out in cash three years after the date of grant at varying levels depending on our performance in Total Shareholder Return against a peer group of companies. These awards were designed to tie a significant portion of total compensation to performance. One of the effects of this type of compensation is that it requires liability accounting which can result in volatility in earnings. The liability recorded for these awards as of June 30 and March 31, 2013 was $10.2 million and $13.4 million, respectively, and represents an accrual based on the fair value of the awards on those dates. The decrease in the liability during the three months ended June 30, 2013 resulted from the payout in June 2013 of the awards granted in June 2010, partially offset by the value of the new awards granted in June 2013. Any changes in fair value of the awards in future quarters will increase or decrease the liability and impact results in those periods. The affect, either positive or negative, on future period earnings can vary based on factors including changes in our stock price or the stock prices of the peer group companies, as well as changes in other market and company-specific assumptions that are factored into the calculation of fair value of the performance cash awards.
Compensation expense recorded related to the performance cash awards during the three months ended June 30, 2013 and 2012 was $1.8 million and $0.9 million, respectively.
Note 8 — DIVIDENDS AND EARNINGS PER SHARE
Dividends
On August 1, 2013, our board of directors approved dividends of $0.25 per share of Common Stock, payable on September 13, 2013 to shareholders of record on August 30, 2013, respectively. See discussion of our dividends in Note 11 to our fiscal year 2013 Financial Statements. The declaration of future dividends is at the discretion of our board of directors and subject to our results of operations, financial condition, cash requirements and other factors and restrictions under applicable law and our debt instruments.
Earnings per Share
Basic earnings per common share is computed by dividing income available to common stockholders by the weighted average number of shares of Common Stock outstanding during the period. Diluted earnings per common share excludes options to purchase shares, restricted stock units and restricted stock awards, which were outstanding during the period but were anti-dilutive, as follows:
| Three Months Ended June 30, | ||||||||||
| 2013 | 2012 | |||||||||
| Options: | ||||||||||
| Outstanding | 396,801 | 376,490 | ||||||||
| Weighted average exercise price | $ | 47.40 | $ | 43.65 | ||||||
| Restricted stock units: | ||||||||||
| Outstanding | — | 72,592 | ||||||||
| Weighted average price | $ | — | $ | 46.59 | ||||||
| Restricted stock awards: | ||||||||||
| Outstanding | 43,077 | — | ||||||||
| Weighted average price | $ | 62.65 | $ | — | ||||||
19
BRISTOW GROUP INC. AND SUBSIDIARIES
NOTES TO CONDENSED CONSOLIDATED FINANCIAL STATEMENTS — (Continued)
(Unaudited)
The following table sets forth the computation of basic and diluted earnings per share:
| Three Months Ended June 30, | ||||||||||
| 2013 | 2012 | |||||||||
| Net income available to common stockholders (in thousands): | ||||||||||
| Income available to common stockholders – basic | $ | 26,886 | $ | 23,662 | ||||||
Interest expense on assumed conversion of 3% Convertible Senior Notes, net of tax (1) | — | — | ||||||||
| Income available to common stockholders – diluted | $ | 26,886 | $ | 23,662 | ||||||
| Shares: | ||||||||||
| Weighted average number of common shares outstanding – basic | 36,182,708 | 35,789,700 | ||||||||
Assumed conversion of 3% Convertible Senior Notes outstanding during the period (1) | — | — | ||||||||
| Net effect of dilutive stock options, restricted stock units and restricted stock awards based on the treasury stock method | 393,577 | 659,888 | ||||||||
| Weighted average number of common shares outstanding – diluted | 36,576,285 | 36,449,588 | ||||||||
| Basic earnings per common share | $ | 0.74 | $ | 0.66 | ||||||
| Diluted earnings per common share | $ | 0.74 | $ | 0.65 | ||||||
_____________
(1) | Diluted earnings per common share for the three months ended June 30, 2013 and 2012 excludes approximately 1.5 million of potentially dilutive shares initially issuable upon the conversion of our 3% Convertible Senior Notes. The 3% Convertible Senior Notes will be convertible, under certain circumstances, using a net share settlement process, into a combination of cash and our Common Stock. As of June 30, 2013, the base conversion price of the notes was approximately $74.81, based on the base conversion rate of 13.3666 shares of Common Stock per $1,000 principal amount of convertible notes (subject to adjustment in certain circumstances, including the payment of dividends). In general, upon conversion of a note, the holder will receive cash equal to the principal amount of the note and Common Stock to the extent of the note’s conversion value in excess of such principal amount. In addition, if at the time of conversion the applicable price of our Common Stock exceeds the base conversion price, holders will receive up to an additional 8.6882 shares of our Common Stock per $1,000 principal amount of notes, as determined pursuant to a specified formula. Such shares did not impact our calculation of diluted earnings per share for the three ended June 30, 2013 and 2012 as our stock price did not meet or exceed the base conversion price. |
20
BRISTOW GROUP INC. AND SUBSIDIARIES
NOTES TO CONDENSED CONSOLIDATED FINANCIAL STATEMENTS — (Continued)
(Unaudited)
Note 9 — SEGMENT INFORMATION
We conduct our business in one segment: Helicopter Services. The Helicopter Services segment operations are conducted primarily through five business units: Europe, West Africa, North America, Australia, and Other International. Additionally, we operate a training business unit, Bristow Academy, and provide technical services to clients in the U.S. and U.K.
The following shows reportable segment information for the three months ended June 30, 2013 and 2012 and as of June 30 and March 31, 2013, where applicable, reconciled to consolidated totals, and prepared on the same basis as our condensed consolidated financial statements (in thousands):
| Three Months Ended June 30, | ||||||||||
| 2013 | 2012 | |||||||||
| Business unit gross revenue from external clients: | ||||||||||
| Europe | $ | 166,709 | $ | 153,957 | ||||||
| West Africa | 79,381 | 70,454 | ||||||||
| North America | 58,582 | 52,710 | ||||||||
| Australia | 43,998 | 44,502 | ||||||||
| Other International | 32,975 | 33,475 | ||||||||
| Corporate and other | 17,349 | 7,510 | ||||||||
| Total business unit gross revenue | $ | 398,994 | $ | 362,608 | ||||||
| Intra-business unit gross revenue: | ||||||||||
| Europe | $ | — | $ | 63 | ||||||
| West Africa | — | — | ||||||||
| North America | (16 | ) | 196 | |||||||
| Australia | — | — | ||||||||
| Other International | — | — | ||||||||
| Corporate and other | 863 | 120 | ||||||||
| Total intra-business unit gross revenue | $ | 847 | $ | 379 | ||||||
| Consolidated gross revenue reconciliation: | ||||||||||
| Europe | $ | 166,709 | $ | 154,020 | ||||||
| West Africa | 79,381 | 70,454 | ||||||||
| North America | 58,566 | 52,906 | ||||||||
| Australia | 43,998 | 44,502 | ||||||||
| Other International | 32,975 | 33,475 | ||||||||
| Corporate and other | 18,212 | 7,630 | ||||||||
| Intra-business unit eliminations | (847 | ) | (379 | ) | ||||||
| Total consolidated gross revenue | $ | 398,994 | $ | 362,608 | ||||||
21
BRISTOW GROUP INC. AND SUBSIDIARIES
NOTES TO CONDENSED CONSOLIDATED FINANCIAL STATEMENTS — (Continued)
(Unaudited)
| Three Months Ended June 30, | ||||||||||
| 2013 | 2012 | |||||||||
| Earnings from unconsolidated affiliates, net of losses – equity method investments: | ||||||||||
| Europe | $ | 3,040 | $ | 2,006 | ||||||
| North America | (8 | ) | — | |||||||
| Other International | 8,940 | (17 | ) | |||||||
| Total earnings from unconsolidated affiliates, net of losses – equity method investments | $ | 11,972 | $ | 1,989 | ||||||
| Consolidated operating income (loss) reconciliation: | ||||||||||
| Europe | $ | 20,021 | $ | 21,876 | ||||||
| West Africa | 19,253 | 16,131 | ||||||||
| North America | 8,123 | 6,475 | ||||||||
| Australia | 3,280 | 6,509 | ||||||||
| Other International | 18,442 | 7,387 | ||||||||
| Corporate and other | (11,279 | ) | (13,070 | ) | ||||||
| Loss on disposal of assets | (1,721 | ) | (5,315 | ) | ||||||
| Total consolidated operating income | $ | 56,119 | $ | 39,993 | ||||||
| Depreciation and amortization: | ||||||||||
| Europe | $ | 7,248 | $ | 7,564 | ||||||
| West Africa | 3,260 | 3,142 | ||||||||
| North America | 6,139 | 3,266 | ||||||||
| Australia | 1,889 | 2,483 | ||||||||
| Other International | 3,630 | 4,033 | ||||||||
| Corporate and other | 653 | 884 | ||||||||
| Total depreciation and amortization | $ | 22,819 | $ | 21,372 | ||||||
| June 30, 2013 | March 31, 2013 | |||||||||
| Identifiable assets: | ||||||||||
| Europe | $ | 865,295 | $ | 808,568 | ||||||
| West Africa | 373,840 | 390,402 | ||||||||
| North America | 540,480 | 527,710 | ||||||||
| Australia | 223,168 | 245,757 | ||||||||
| Other International | 580,349 | 589,361 | ||||||||
| Corporate and other | 475,355 | 388,894 | ||||||||
Total identifiable assets (1) | $ | 3,058,487 | $ | 2,950,692 | ||||||
| Investments in unconsolidated affiliates – equity method investments: | ||||||||||
Europe (2) | $ | 7,942 | $ | 8,569 | ||||||
| North America | 60,509 | 60,517 | ||||||||
| Other International | 202,260 | 196,751 | ||||||||
| Total investments in unconsolidated affiliates – equity method investments | $ | 270,711 | $ | 265,837 | ||||||
______
(1) | Includes $311.4 million and $222.8 million, respectively, of construction in progress within property and equipment on our condensed consolidated balance sheets as of June 30 and March 31, 2013, respectively, which primarily represents progress payments on aircraft to be delivered in future periods. |
(2) | On July 14, 2013, we sold our 50% interest in the FB Entities for £74 million, or approximately $112.0 million. See Note 2 for further discussion. |
22
BRISTOW GROUP INC. AND SUBSIDIARIES
NOTES TO CONDENSED CONSOLIDATED FINANCIAL STATEMENTS — (Continued)
(Unaudited)
Note 10 — SUPPLEMENTAL CONDENSED CONSOLIDATING FINANCIAL INFORMATION
In connection with the issuance of the 71/2% Senior Notes due 2017 (which we redeemed during the fiscal year 2013), the 61/4% Senior Notes due 2022 and the 3% Convertible Senior Notes, the Guarantor Subsidiaries fully, unconditionally, jointly and severally guaranteed the payment obligations under these notes. The following supplemental financial information sets forth, on a consolidating basis, the balance sheet, statement of income, comprehensive income and cash flow information for Bristow Group Inc. (“Parent Company Only”), for the Guarantor Subsidiaries and for our other subsidiaries (the “Non-Guarantor Subsidiaries”). We have not presented separate financial statements and other disclosures concerning the Guarantor Subsidiaries because management has determined that such information is not material to investors.
The supplemental condensed consolidating financial information has been prepared pursuant to the rules and regulations for condensed financial information and does not include all disclosures included in annual financial statements, although we believe that the disclosures made are adequate to make the information presented not misleading. The principal eliminating entries eliminate investments in subsidiaries, intercompany balances and intercompany revenue and expense.
The allocation of the consolidated income tax provision was made using the with and without allocation method.
23
BRISTOW GROUP INC. AND SUBSIDIARIES
NOTES TO CONDENSED CONSOLIDATED FINANCIAL STATEMENTS — (Continued)
(Unaudited)
Supplemental Condensed Consolidating Statement of Income
Three Months Ended June 30, 2013
Parent Company Only | Guarantor Subsidiaries | Non- Guarantor Subsidiaries | Eliminations | Consolidated | ||||||||||||||||
| (In thousands) | ||||||||||||||||||||
| Revenue: | ||||||||||||||||||||
| Gross revenue | $ | — | $ | 76,643 | $ | 322,351 | $ | — | $ | 398,994 | ||||||||||
| Intercompany revenue | 374 | 20,366 | — | (20,740 | ) | — | ||||||||||||||
| 374 | 97,009 | 322,351 | (20,740 | ) | 398,994 | |||||||||||||||
| Operating expense: | ||||||||||||||||||||
| Direct cost and reimbursable expense | — | 57,444 | 234,555 | — | 291,999 | |||||||||||||||
| Intercompany expenses | — | — | 20,740 | (20,740 | ) | — | ||||||||||||||
| Depreciation and amortization | 717 | 10,683 | 11,419 | — | 22,819 | |||||||||||||||
| General and administrative | 11,790 | 7,585 | 20,933 | — | 40,308 | |||||||||||||||
| 12,507 | 75,712 | 287,647 | (20,740 | ) | 355,126 | |||||||||||||||
| Gain (loss) on disposal of assets | — | 1,388 | (3,109 | ) | — | (1,721 | ) | |||||||||||||
| Earnings from unconsolidated affiliates, net of losses | 31,750 | — | 13,972 | (31,750 | ) | 13,972 | ||||||||||||||
| Operating income | 19,617 | 22,685 | 45,567 | (31,750 | ) | 56,119 | ||||||||||||||
| Interest income | 28,196 | — | 116 | (28,193 | ) | 119 | ||||||||||||||
| Interest expense | (20,595 | ) | (31 | ) | (27,937 | ) | 28,193 | (20,370 | ) | |||||||||||
| Other income (expense), net | 2 | 14 | (1,382 | ) | — | (1,366 | ) | |||||||||||||
| Income before provision for income taxes | 27,220 | 22,668 | 16,364 | (31,750 | ) | 34,502 | ||||||||||||||
| Allocation of consolidated income taxes | (317 | ) | (525 | ) | (6,748 | ) | — | (7,590 | ) | |||||||||||
| Net income | 26,903 | 22,143 | 9,616 | (31,750 | ) | 26,912 | ||||||||||||||
| Net income attributable to noncontrolling interests | (17 | ) | — | (9 | ) | — | (26 | ) | ||||||||||||
| Net income attributable to Bristow Group | $ | 26,886 | $ | 22,143 | $ | 9,607 | $ | (31,750 | ) | $ | 26,886 | |||||||||
24
BRISTOW GROUP INC. AND SUBSIDIARIES
NOTES TO CONDENSED CONSOLIDATED FINANCIAL STATEMENTS — (Continued)
(Unaudited)
Supplemental Condensed Consolidating Statement of Income
Three Months Ended June 30, 2012
Parent Company Only | Guarantor Subsidiaries | Non- Guarantor Subsidiaries | Eliminations | Consolidated | ||||||||||||||||
| (In thousands) | ||||||||||||||||||||
| Revenue: | ||||||||||||||||||||
| Gross revenue | $ | — | $ | 69,512 | $ | 293,096 | $ | — | $ | 362,608 | ||||||||||
| Intercompany revenue | 578 | 17,299 | — | (17,877 | ) | — | ||||||||||||||
| 578 | 86,811 | 293,096 | (17,877 | ) | 362,608 | |||||||||||||||
| Operating expense: | ||||||||||||||||||||
| Direct cost and reimbursable expense | — | 49,772 | 213,168 | — | 262,940 | |||||||||||||||
| Intercompany expenses | — | — | 17,877 | (17,877 | ) | — | ||||||||||||||
| Depreciation and amortization | 1,069 | 8,075 | 12,228 | — | 21,372 | |||||||||||||||
| General and administrative | 8,929 | 6,851 | 19,197 | — | 34,977 | |||||||||||||||
| 9,998 | 64,698 | 262,470 | (17,877 | ) | 319,289 | |||||||||||||||
| Loss on disposal of assets | — | (1,419 | ) | (3,896 | ) | — | (5,315 | ) | ||||||||||||
| Earnings from unconsolidated affiliates, net of losses | 17,739 | — | 1,989 | (17,739 | ) | 1,989 | ||||||||||||||
| Operating income | 8,319 | 20,694 | 28,719 | (17,739 | ) | 39,993 | ||||||||||||||
| Interest income | 27,940 | 9 | — | (27,861 | ) | 88 | ||||||||||||||
| Interest expense | (8,850 | ) | — | (27,785 | ) | 27,861 | (8,774 | ) | ||||||||||||
| Other income (expense), net | 51 | 57 | (1,039 | ) | — | (931 | ) | |||||||||||||
| Income before provision for income taxes | 27,460 | 20,760 | (105 | ) | (17,739 | ) | 30,376 | |||||||||||||
| Allocation of consolidated income taxes | (3,779 | ) | (1,758 | ) | (643 | ) | — | (6,180 | ) | |||||||||||
| Net income | 23,681 | 19,002 | (748 | ) | (17,739 | ) | 24,196 | |||||||||||||
| Net income attributable to noncontrolling interests | (19 | ) | — | (515 | ) | — | (534 | ) | ||||||||||||
| Net income attributable to Bristow Group | $ | 23,662 | $ | 19,002 | $ | (1,263 | ) | $ | (17,739 | ) | $ | 23,662 | ||||||||
25
BRISTOW GROUP INC. AND SUBSIDIARIES
NOTES TO CONDENSED CONSOLIDATED FINANCIAL STATEMENTS — (Continued)
(Unaudited)
Supplemental Condensed Consolidating Statement of Comprehensive Income
Three Months Ended June 30, 2013
| Parent Company Only | Guarantor Subsidiaries | Non- Guarantor Subsidiaries | Eliminations | Consolidated | ||||||||||||||||
| (In thousands) | ||||||||||||||||||||
| Net income | $ | 26,903 | $ | 22,143 | $ | 9,616 | $ | (31,750 | ) | $ | 26,912 | |||||||||
| Other comprehensive income (loss): | ||||||||||||||||||||
| Currency translation adjustments | 920 | — | (6,947 | ) | 1,598 | (4,429 | ) | |||||||||||||
| Total comprehensive income | 27,823 | 22,143 | 2,669 | (30,152 | ) | 22,483 | ||||||||||||||
| Net income attributable to noncontrolling interests | (17 | ) | — | (9 | ) | — | (26 | ) | ||||||||||||
| Currency translation adjustments attributable to noncontrolling interests | — | — | (130 | ) | — | (130 | ) | |||||||||||||
| Total comprehensive income attributable to noncontrolling interests | (17 | ) | — | (139 | ) | — | (156 | ) | ||||||||||||
| Total comprehensive income attributable to Bristow Group | $ | 27,806 | $ | 22,143 | $ | 2,530 | $ | (30,152 | ) | $ | 22,327 | |||||||||
26
BRISTOW GROUP INC. AND SUBSIDIARIES
NOTES TO CONDENSED CONSOLIDATED FINANCIAL STATEMENTS — (Continued)
(Unaudited)
Supplemental Condensed Consolidating Statement of Comprehensive Income
Three Months Ended June 30, 2012
| Parent Company Only | Guarantor Subsidiaries | Non- Guarantor Subsidiaries | Eliminations | Consolidated | ||||||||||||||||
| (In thousands) | ||||||||||||||||||||
| Net income | $ | 23,681 | $ | 19,002 | $ | (748 | ) | $ | (17,739 | ) | $ | 24,196 | ||||||||
| Other comprehensive income (loss): | ||||||||||||||||||||
| Currency translation adjustments | 2,673 | — | (5,044 | ) | 2,877 | 506 | ||||||||||||||
| Total comprehensive income | 26,354 | 19,002 | (5,792 | ) | (14,862 | ) | 24,702 | |||||||||||||
| Net income attributable to noncontrolling interests | (19 | ) | — | (515 | ) | — | (534 | ) | ||||||||||||
| Currency translation adjustments attributable to noncontrolling interests | — | — | (201 | ) | — | (201 | ) | |||||||||||||
| Total comprehensive income attributable to noncontrolling interests | (19 | ) | — | (716 | ) | — | (735 | ) | ||||||||||||
| Total comprehensive income attributable to Bristow Group | $ | 26,335 | $ | 19,002 | $ | (6,508 | ) | $ | (14,862 | ) | $ | 23,967 | ||||||||
27
BRISTOW GROUP INC. AND SUBSIDIARIES
NOTES TO CONDENSED CONSOLIDATED FINANCIAL STATEMENTS — (Continued)
(Unaudited)
Supplemental Condensed Consolidating Balance Sheet
As of June 30, 2013
Parent Company Only | Guarantor Subsidiaries | Non- Guarantor Subsidiaries | Eliminations | Consolidated | ||||||||||||||||
| (In thousands) | ||||||||||||||||||||
| ASSETS | ||||||||||||||||||||
| Current assets: | ||||||||||||||||||||
| Cash and cash equivalents | $ | 861 | $ | 3,259 | $ | 155,872 | $ | — | $ | 159,992 | ||||||||||
| Accounts receivable | 16,918 | 65,990 | 233,727 | (47,979 | ) | 268,656 | ||||||||||||||
| Inventories | — | 52,481 | 105,465 | — | 157,946 | |||||||||||||||
| Assets held for sale | — | 5,800 | 7,827 | — | 13,627 | |||||||||||||||
| Prepaid expenses and other current assets | 2,547 | 9,695 | 21,493 | (1,469 | ) | 32,266 | ||||||||||||||
| Total current assets | 20,326 | 137,225 | 524,384 | (49,448 | ) | 632,487 | ||||||||||||||
| Intercompany investment | 1,198,003 | 111,435 | — | (1,309,438 | ) | — | ||||||||||||||
| Investment in unconsolidated affiliates | — | 150 | 276,847 | — | 276,997 | |||||||||||||||
| Intercompany notes receivable | 1,526,557 | — | — | (1,526,557 | ) | — | ||||||||||||||
| Property and equipment—at cost: | ||||||||||||||||||||
| Land and buildings | 977 | 48,936 | 59,212 | — | 109,125 | |||||||||||||||
| Aircraft and equipment | 36,652 | 1,314,760 | 1,110,143 | — | 2,461,555 | |||||||||||||||
| 37,629 | 1,363,696 | 1,169,355 | — | 2,570,680 | ||||||||||||||||
| Less: Accumulated depreciation and amortization | (11,359 | ) | (208,841 | ) | (287,190 | ) | — | (507,390 | ) | |||||||||||
| 26,270 | 1,154,855 | 882,165 | — | 2,063,290 | ||||||||||||||||
| Goodwill | — | 4,755 | 24,090 | — | 28,845 | |||||||||||||||
| Other assets | 41,464 | 1,292 | 152,280 | (138,168 | ) | 56,868 | ||||||||||||||
| Total assets | $ | 2,812,620 | $ | 1,409,712 | $ | 1,859,766 | $ | (3,023,611 | ) | $ | 3,058,487 | |||||||||
| LIABILITIES AND STOCKHOLDERS’ INVESTMENT | ||||||||||||||||||||
| Current liabilities: | ||||||||||||||||||||
| Accounts payable | $ | 5,311 | $ | 35,004 | $ | 78,726 | $ | (45,903 | ) | $ | 73,138 | |||||||||
| Accrued liabilities | 15,015 | 21,177 | 99,073 | (6,441 | ) | 128,824 | ||||||||||||||
| Current deferred taxes | (4,850 | ) | (230 | ) | 8,991 | — | 3,911 | |||||||||||||
| Short-term borrowings and current maturities of long-term debt | 5,766 | — | 1,184 | — | 6,950 | |||||||||||||||
| Total current liabilities | 21,242 | 55,951 | 187,974 | (52,344 | ) | 212,823 | ||||||||||||||
| Long-term debt, less current maturities | 882,823 | — | — | — | 882,823 | |||||||||||||||
| Intercompany notes payable | — | 578,726 | 972,295 | (1,551,021 | ) | — | ||||||||||||||
| Accrued pension liabilities | — | — | 121,476 | — | 121,476 | |||||||||||||||
| Other liabilities and deferred credits | 7,946 | 7,959 | 178,279 | (140,652 | ) | 53,532 | ||||||||||||||
| Deferred taxes | 137,311 | 8,499 | 14,116 | — | 159,926 | |||||||||||||||
| Stockholders’ investment: | ||||||||||||||||||||
| Common stock | 369 | 4,996 | 22,876 | (27,872 | ) | 369 | ||||||||||||||
| Additional paid-in-capital | 737,070 | 9,291 | 270,905 | (280,196 | ) | 737,070 | ||||||||||||||
| Retained earnings | 1,112,644 | 744,290 | 72,209 | (816,499 | ) | 1,112,644 | ||||||||||||||
| Accumulated other comprehensive income (loss) | (61,972 | ) | — | 12,757 | (155,027 | ) | (204,242 | ) | ||||||||||||
| Treasury shares | (26,304 | ) | — | — | — | (26,304 | ) | |||||||||||||
| Total Bristow Group stockholders’ investment | 1,761,807 | 758,577 | 378,747 | (1,279,594 | ) | 1,619,537 | ||||||||||||||
| Noncontrolling interests | 1,491 | — | 6,879 | — | 8,370 | |||||||||||||||
| Total stockholders’ investment | 1,763,298 | 758,577 | 385,626 | (1,279,594 | ) | 1,627,907 | ||||||||||||||
| Total liabilities and stockholders’ investment | $ | 2,812,620 | $ | 1,409,712 | $ | 1,859,766 | $ | (3,023,611 | ) | $ | 3,058,487 | |||||||||
28
BRISTOW GROUP INC. AND SUBSIDIARIES
NOTES TO CONDENSED CONSOLIDATED FINANCIAL STATEMENTS — (Continued)
(Unaudited)
Supplemental Condensed Consolidating Balance Sheet
As of March 31, 2013
Parent Company Only | Guarantor Subsidiaries | Non- Guarantor Subsidiaries | Eliminations | Consolidated | ||||||||||||||||
| (In thousands) | ||||||||||||||||||||
| ASSETS | ||||||||||||||||||||
| Current assets: | ||||||||||||||||||||
| Cash and cash equivalents | $ | 31,853 | $ | 5,370 | $ | 178,400 | $ | — | $ | 215,623 | ||||||||||
| Accounts receivable | 18,498 | 80,615 | 246,612 | (82,944 | ) | 262,781 | ||||||||||||||
| Inventories | — | 51,970 | 101,999 | — | 153,969 | |||||||||||||||
| Assets held for sale | — | 1,268 | 7,022 | — | 8,290 | |||||||||||||||
| Prepaid expenses and other current assets | 16,071 | 12,415 | 23,263 | (16,654 | ) | 35,095 | ||||||||||||||
| Total current assets | 66,422 | 151,638 | 557,296 | (99,598 | ) | 675,758 | ||||||||||||||
| Intercompany investment | 1,163,935 | 111,435 | — | (1,275,370 | ) | — | ||||||||||||||
| Investment in unconsolidated affiliates | — | 150 | 271,973 | — | 272,123 | |||||||||||||||
| Intercompany notes receivable | 1,401,680 | — | — | (1,401,680 | ) | — | ||||||||||||||
| Property and equipment—at cost: | ||||||||||||||||||||
| Land and buildings | 939 | 48,907 | 58,747 | — | 108,593 | |||||||||||||||
| Aircraft and equipment | 31,310 | 1,170,531 | 1,104,213 | — | 2,306,054 | |||||||||||||||
| 32,249 | 1,219,438 | 1,162,960 | — | 2,414,647 | ||||||||||||||||
| Less: Accumulated depreciation and amortization | (10,680 | ) | (205,746 | ) | (277,149 | ) | — | (493,575 | ) | |||||||||||
| 21,569 | 1,013,692 | 885,811 | — | 1,921,072 | ||||||||||||||||
| Goodwill | — | 4,756 | 24,141 | — | 28,897 | |||||||||||||||
| Other assets | 40,877 | 1,341 | 149,544 | (138,920 | ) | 52,842 | ||||||||||||||
| Total assets | $ | 2,694,483 | $ | 1,283,012 | $ | 1,888,765 | $ | (2,915,568 | ) | $ | 2,950,692 | |||||||||
| LIABILITIES AND STOCKHOLDERS’ INVESTMENT | ||||||||||||||||||||
| Current liabilities: | ||||||||||||||||||||
| Accounts payable | $ | 4,049 | $ | 44,017 | $ | 101,021 | $ | (79,266 | ) | $ | 69,821 | |||||||||
| Accrued liabilities | 29,534 | 22,404 | 115,112 | (19,369 | ) | 147,681 | ||||||||||||||
| Current deferred taxes | (4,184 | ) | 115 | 4,069 | — | — | ||||||||||||||
| Short-term borrowings and current maturities of long-term debt | 21,875 | — | 448 | — | 22,323 | |||||||||||||||
| Total current liabilities | 51,274 | 66,536 | 220,650 | (98,635 | ) | 239,825 | ||||||||||||||
| Long-term debt, less current maturities | 764,946 | — | — | — | 764,946 | |||||||||||||||
| Intercompany notes payable | — | 463,184 | 963,687 | (1,426,871 | ) | — | ||||||||||||||
| Accrued pension liabilities | — | — | 126,647 | — | 126,647 | |||||||||||||||
| Other liabilities and deferred credits | 10,761 | 8,530 | 178,525 | (140,620 | ) | 57,196 | ||||||||||||||
| Deferred taxes | 128,153 | 8,328 | 14,640 | — | 151,121 | |||||||||||||||
| Stockholders’ investment: | ||||||||||||||||||||
| Common stock | 367 | 4,996 | 22,876 | (27,872 | ) | 367 | ||||||||||||||
| Additional paid-in-capital | 731,883 | 9,291 | 270,905 | (280,196 | ) | 731,883 | ||||||||||||||
| Retained earnings | 1,094,803 | 722,147 | 62,602 | (784,749 | ) | 1,094,803 | ||||||||||||||
| Accumulated other comprehensive income (loss) | (62,892 | ) | — | 19,834 | (156,625 | ) | (199,683 | ) | ||||||||||||
| Treasury shares | (26,304 | ) | — | — | — | (26,304 | ) | |||||||||||||
| Total Bristow Group stockholders’ investment | 1,737,857 | 736,434 | 376,217 | (1,249,442 | ) | 1,601,066 | ||||||||||||||
| Noncontrolling interests | 1,492 | — | 8,399 | — | 9,891 | |||||||||||||||
| Total stockholders’ investment | 1,739,349 | 736,434 | 384,616 | (1,249,442 | ) | 1,610,957 | ||||||||||||||
| Total liabilities and stockholders’ investment | $ | 2,694,483 | $ | 1,283,012 | $ | 1,888,765 | $ | (2,915,568 | ) | $ | 2,950,692 | |||||||||
29
BRISTOW GROUP INC. AND SUBSIDIARIES
NOTES TO CONDENSED CONSOLIDATED FINANCIAL STATEMENTS — (Continued)
(Unaudited)
Supplemental Condensed Consolidating Statement of Cash Flows
Three Months Ended June 30, 2013
Parent Company Only | Guarantor Subsidiaries | Non- Guarantor Subsidiaries | Eliminations | Consolidated | ||||||||||||||||
| (In thousands) | ||||||||||||||||||||
| Net cash provided by (used in) operating activities | $ | (11,746 | ) | $ | 33,434 | $ | 14,725 | $ | — | $ | 36,413 | |||||||||
| Cash flows from investing activities: | ||||||||||||||||||||
| Capital expenditures | (5,283 | ) | (168,239 | ) | (6,010 | ) | — | (179,532 | ) | |||||||||||
| Proceeds from asset dispositions | — | 1,893 | — | — | 1,893 | |||||||||||||||
| Net cash used in investing activities | (5,283 | ) | (166,346 | ) | (6,010 | ) | — | (177,639 | ) | |||||||||||
| Cash flows from financing activities: | ||||||||||||||||||||
| Proceeds from borrowings | 102,000 | — | 1,357 | — | 103,357 | |||||||||||||||
| Debt issuance costs | (12,733 | ) | — | — | — | (12,733 | ) | |||||||||||||
| Repayment of debt | (1,153 | ) | — | (580 | ) | — | (1,733 | ) | ||||||||||||
| Dividends paid | (9,045 | ) | — | — | — | (9,045 | ) | |||||||||||||
| Increases (decreases) in cash related to intercompany advances and debt | (98,544 | ) | 130,801 | (32,257 | ) | — | — | |||||||||||||
| Partial prepayment of put/call obligation | (14 | ) | — | — | — | (14 | ) | |||||||||||||
| Issuance of Common Stock | 3,004 | — | — | — | 3,004 | |||||||||||||||
| Tax benefit related to stock-based compensation | 2,522 | — | — | — | 2,522 | |||||||||||||||
| Net cash provided by (used in) financing activities | (13,963 | ) | 130,801 | (31,480 | ) | — | 85,358 | |||||||||||||
| Effect of exchange rate changes on cash and cash equivalents | — | — | 237 | — | 237 | |||||||||||||||
| Net decrease in cash and cash equivalents | (30,992 | ) | (2,111 | ) | (22,528 | ) | — | (55,631 | ) | |||||||||||
| Cash and cash equivalents at beginning of period | 31,853 | 5,370 | 178,400 | — | 215,623 | |||||||||||||||
| Cash and cash equivalents at end of period | $ | 861 | $ | 3,259 | $ | 155,872 | $ | — | $ | 159,992 | ||||||||||
30
BRISTOW GROUP INC. AND SUBSIDIARIES
NOTES TO CONDENSED CONSOLIDATED FINANCIAL STATEMENTS — (Continued)
(Unaudited)
Supplemental Condensed Consolidating Statement of Cash Flows
Three Months Ended June 30, 2012
Parent Company Only | Guarantor Subsidiaries | Non- Guarantor Subsidiaries | Eliminations | Consolidated | ||||||||||||||||
| (In thousands) | ||||||||||||||||||||
| Net cash provided by (used in) operating activities | $ | (10,350 | ) | $ | 58,170 | $ | 7,592 | $ | — | $ | 55,412 | |||||||||
| Cash flows from investing activities: | ||||||||||||||||||||
| Capital expenditures | (445 | ) | (35,698 | ) | (50,412 | ) | — | (86,555 | ) | |||||||||||
| Proceeds from asset dispositions | — | 9,621 | 10,606 | — | 20,227 | |||||||||||||||
| Investment in unconsolidated affiliate | (850 | ) | — | — | — | (850 | ) | |||||||||||||
| Net cash used in investing activities | (1,295 | ) | (26,077 | ) | (39,806 | ) | — | (67,178 | ) | |||||||||||
| Cash flows from financing activities: | ||||||||||||||||||||
| Repayment of debt | (21,800 | ) | — | — | — | (21,800 | ) | |||||||||||||
| Dividends paid | 4,410 | (9,755 | ) | (1,800 | ) | — | (7,145 | ) | ||||||||||||
| Increases (decreases) in cash related to intercompany advances and debt | 5,884 | (21,432 | ) | 15,548 | — | — | ||||||||||||||
| Partial prepayment of put/call obligation | (17 | ) | — | — | — | (17 | ) | |||||||||||||
| Issuance of Common Stock | 311 | — | — | — | 311 | |||||||||||||||
| Tax benefit related to stock-based compensation | 404 | — | — | — | 404 | |||||||||||||||
| Net cash provided by (used in) financing activities | (10,808 | ) | (31,187 | ) | 13,748 | — | (28,247 | ) | ||||||||||||
| Effect of exchange rate changes on cash and cash equivalents | — | — | 5,713 | — | 5,713 | |||||||||||||||
| Net increase (decrease) in cash and cash equivalents | (22,453 | ) | 906 | (12,753 | ) | — | (34,300 | ) | ||||||||||||
| Cash and cash equivalents at beginning of period | 76,609 | 3,155 | 181,786 | — | 261,550 | |||||||||||||||
| Cash and cash equivalents at end of period | $ | 54,156 | $ | 4,061 | $ | 169,033 | $ | — | $ | 227,250 | ||||||||||
31
Report of Independent Registered Public Accounting Firm
To the Board of Directors and Stockholders
Bristow Group Inc.:
We have reviewed the condensed consolidated balance sheet of Bristow Group Inc. and subsidiaries ("the Company") as of June 30, 2013, the related condensed consolidated statements of income and comprehensive income for the three-month periods ended June 30, 2013 and 2012, and the related condensed consolidated statements of cash flows for the three-month periods ended June 30, 2013 and 2012. These condensed consolidated financial statements are the responsibility of the Company’s management.
We conducted our reviews in accordance with the standards of the Public Company Accounting Oversight Board (United States). A review of interim financial information consists principally of applying analytical procedures and making inquiries of persons responsible for financial and accounting matters. It is substantially less in scope than an audit conducted in accordance with the standards of the Public Company Accounting Oversight Board (United States), the objective of which is the expression of an opinion regarding the financial statements taken as a whole. Accordingly, we do not express such an opinion.
Based on our reviews, we are not aware of any material modifications that should be made to the condensed consolidated financial statements referred to above for them to be in conformity with U.S. generally accepted accounting principles.
We have previously audited, in accordance with standards of the Public Company Accounting Oversight Board (United States), the consolidated balance sheet of the Company as of March 31, 2013, and the related consolidated statements of income, comprehensive income, stockholders’ investment, and cash flows for the year then ended (not presented herein); and in our report dated May 22, 2013 we expressed an unqualified opinion on those consolidated financial statements. In our opinion, the information set forth in the accompanying condensed consolidated balance sheet as of March 31, 2013 is fairly stated, in all material respects, in relation to the consolidated balance sheet from which it has been derived.
| /s/ KPMG LLP | ||
Houston, Texas
August 5, 2013
32
Item 2. Management’s Discussion and Analysis of Financial Condition and Results of Operations
Management’s Discussion and Analysis of Financial Condition and Results of Operations, or MD&A, should be read in conjunction with the accompanying unaudited condensed consolidated financial statements and the notes thereto as well as our Annual Report on Form 10-K for the fiscal year ended March 31, 2013 (the “fiscal year 2013 Annual Report”) and the MD&A contained therein. In the discussion that follows, the terms “Current Quarter” and “Comparable Quarter” refer to the three months ended June 30, 2013 and 2012, respectively. Our fiscal year ends March 31, and we refer to fiscal years based on the end of such period. Therefore, the fiscal year ending March 31, 2014 is referred to as “fiscal year 2014.”
Forward-Looking Statements
This Quarterly Report contains “forward-looking statements” within the meaning of Section 27A of the Securities Act of 1933 and Section 21E of the Securities Exchange Act of 1934 (the “Exchange Act”). Forward-looking statements are statements about our future business, strategy, operations, capabilities and results; financial projections; plans and objectives of our management; expected actions by us and by third parties, including our clients, competitors, vendors and regulators; and other matters. Some of the forward-looking statements can be identified by the use of words such as “believes”, “belief”, “expects”, “plans”, “anticipates”, “intends”, “projects”, “estimates”, “may”, “might”, “would”, “could” or other similar words; however, all statements in this Quarterly Report, other than statements of historical fact or historical financial results, are forward-looking statements.
Our forward-looking statements reflect our views and assumptions on the date we are filing this Quarterly Report regarding future events and operating performance. We believe that they are reasonable, but they involve known and unknown risks, uncertainties and other factors, many of which may be beyond our control, that may cause actual results to differ materially from any future results, performance or achievements expressed or implied by the forward-looking statements. Accordingly, you should not put undue reliance on any forward-looking statements.
You should consider the following key factors when evaluating these forward-looking statements:
•the possibility of political instability, war or acts of terrorism in any of the countries where we operate;
•fluctuations in worldwide prices of and demand for oil and natural gas;
•fluctuations in levels of oil and natural gas exploration and development activities;
•fluctuations in the demand for our services;
•the existence of competitors;
| • | the existence of operating risks inherent in our business, including the possibility of declining safety performance; |
•the possibility of changes in tax and other laws and regulations;
•the possibility that the major oil companies do not continue to expand internationally;
•the possibility of significant changes in foreign exchange rates and controls;
•general economic conditions including the capital and credit markets;
| • | the possibility that we may be unable to acquire additional aircraft due to limited availability or unable to exercise aircraft purchase options; |
•the possibility that we may be unable to dispose of older aircraft through sales into the aftermarket;
•the possibility that we may be unable to obtain financing or we may be unable to draw on our credit facilities;
•the possibility that segments of our fleet may be grounded for extended periods of time or indefinitely;
•the possibility that we may be unable to re-deploy our aircraft to regions with greater demand;
33
| • | the possibility that reductions in spending on helicopter services by governmental agencies could lead to modifications of search and rescue ("SAR") contract terms or delays in receiving payments; and |
| • | the possibility that we do not achieve the anticipated benefit from the addition of new-technology aircraft to our fleet. |
The above description of risks and uncertainties is by no means all-inclusive, but is designed to highlight what we believe are important factors to consider. For a more detailed description of risk factors, please see the risks and uncertainties described under Item 1A. “Risk Factors” included in the fiscal year 2013 Annual Report.
All forward-looking statements in this Quarterly Report are qualified by these cautionary statements and are only made as of the date of this Quarterly Report. We do not undertake any obligation, other than as required by law, to update or revise any forward-looking statements, whether as a result of new information, future events or otherwise.
Executive Overview
This Executive Overview only includes what management considers to be the most important information and analysis for evaluating our financial condition and operating performance. It provides the context for the discussion and analysis of the financial statements that follow and does not disclose every item impacting our financial condition and operating performance.
General
We are the leading provider of helicopter services to the worldwide offshore energy industry based on the number of aircraft operated and one of two helicopter service providers to the offshore energy industry with global operations. We have a long history in the helicopter services industry through Bristow Helicopters Limited ("Bristow Helicopters") and Offshore Logistics, Inc., having been founded in 1955 and 1969, respectively. We have major transportation operations in the North Sea, Nigeria and the U.S. Gulf of Mexico, and in most of the other major offshore energy producing regions of the world, including Alaska, Australia, Brazil, Canada, Russia and Trinidad. We provide civilian SAR services in Australia, Brazil, Canada, Cyprus, Dutch Antilles, the Netherlands, Norway, Russia and Trinidad, and we started providing SAR services for North Scotland during the Current Quarter. Additionally, we were recently awarded a new contract to provide civilian SAR services for all of the U.K. We generated 79%, 88% and 85% of our consolidated operating revenue, business unit operating income and business unit adjusted EBITDAR, respectively, from operations outside of the U.S. during the Current Quarter. Adjusted EBITDAR is calculated by taking our net income and adjusting for interest expense, depreciation and amortization, rent expense (included as components of direct cost and general and administrative expense), provision for income taxes, gain (loss) on disposal of assets and any special items during the reported periods.
We conduct our business in one segment: Helicopter Services. The Helicopter Services segment operations are conducted primarily through five business units:
| • | Europe, |
| • | West Africa, |
| • | North America, |
| • | Australia, and |
| • | Other International. |
We provide helicopter services to a broad base of major integrated, national and independent offshore energy companies. Our clients charter our helicopters primarily to transport personnel between onshore bases and offshore production platforms, drilling rigs and other installations. To a lesser extent, our clients also charter our helicopters to transport time-sensitive equipment to these offshore locations. These clients' operating expenditures in the production sector are the principle source of our revenue, while their exploration and development capital expenditures provide a lesser portion of our revenue. The clients for SAR services include both the oil and gas industry, where our revenue is primarily dependent on our client's operating expenditures, and governmental agencies, where our revenue is dependent on a country's desire to privatize SAR and enter into long-term contracts. In addition to our primary Helicopter Services operations, we also operate a training business unit, Bristow Academy, and provide technical services to clients in the U.S. and U.K. As of June 30, 2013, we operated 353 aircraft (including 281 owned aircraft and 72 leased aircraft; 12 of the owned aircraft are held for sale) and our unconsolidated affiliates operated 198 aircraft in addition to those aircraft leased from us.
34
The chart below presents (1) the number of helicopters in our fleet and their distribution among the business units of our Helicopter Services segment as of June 30, 2013; (2) the number of helicopters which we had on order or under option as of July 11, 2013; and (3) the percentage of operating revenue which each of our business units provided during the Current Quarter. For additional information regarding our commitments and options to acquire aircraft, see Note 5 in the “Notes to Condensed Consolidated Financial Statements” included elsewhere in this Quarterly Report.
| Aircraft in Consolidated Fleet | |||||||||||||||||||||||||||
Percentage of Current Quarter Operating Revenue | Helicopters | ||||||||||||||||||||||||||
| Small | Medium | Large | Training | Fixed Wing | Unconsolidated Affiliates (3) | ||||||||||||||||||||||
Total (1)(2) | Total | ||||||||||||||||||||||||||
| Europe | 38 | % | — | 10 | 52 | — | — | 62 | 64 | 126 | |||||||||||||||||
| West Africa | 21 | % | 9 | 26 | 6 | — | 3 | 44 | — | 44 | |||||||||||||||||
| North America | 16 | % | 62 | 24 | 11 | — | — | 97 | — | 97 | |||||||||||||||||
| Australia | 11 | % | 2 | 7 | 15 | — | — | 24 | — | 24 | |||||||||||||||||
| Other International | 9 | % | 3 | 30 | 13 | — | — | 46 | 134 | 180 | |||||||||||||||||
| Corporate and other | 5 | % | — | — | — | 80 | — | 80 | — | 80 | |||||||||||||||||
| Total | 100 | % | 76 | 97 | 97 | 80 | 3 | 353 | 198 | 551 | |||||||||||||||||
Aircraft not currently in fleet: (4) | |||||||||||||||||||||||||||
| On order | — | 14 | 44 | — | — | 58 | |||||||||||||||||||||
| Under option | — | 26 | 44 | — | — | 70 | |||||||||||||||||||||
(1) | Includes 12 aircraft held for sale and 72 leased aircraft as follows: |
| Held for Sale Aircraft in Consolidated Fleet | ||||||||||||||||||
| Helicopters | ||||||||||||||||||
| Small | Medium | Large | Training | Fixed Wing | Total | |||||||||||||
| Europe | — | — | — | — | — | — | ||||||||||||
| West Africa | — | — | — | — | — | — | ||||||||||||
| North America | 7 | — | — | — | — | 7 | ||||||||||||
| Australia | — | — | — | — | — | — | ||||||||||||
| Other International | 1 | 4 | — | — | — | 5 | ||||||||||||
| Corporate and other | — | — | — | — | — | — | ||||||||||||
| Total | 8 | 4 | — | — | — | 12 | ||||||||||||
| Leased Aircraft in Consolidated Fleet | ||||||||||||||||||
| Helicopters | ||||||||||||||||||
| Small | Medium | Large | Training | Fixed Wing | Total | |||||||||||||
| Europe | — | 1 | 17 | — | — | 18 | ||||||||||||
| West Africa | — | 1 | — | — | — | 1 | ||||||||||||
| North America | 1 | 12 | 2 | — | — | 15 | ||||||||||||
| Australia | 2 | — | 3 | — | — | 5 | ||||||||||||
| Other International | — | — | — | — | — | — | ||||||||||||
| Corporate and other | — | — | — | 33 | — | 33 | ||||||||||||
| Total | 3 | 14 | 22 | 33 | — | 72 | ||||||||||||
(2) | The average age of our fleet, excluding training aircraft, was 11 years as of June 30, 2013. |
(3) | The 198 aircraft operated by our unconsolidated affiliates do not include those aircraft leased from us. Includes 57 helicopters (primarily medium) and 32 fixed wing aircraft owned and managed by Líder, our unconsolidated affiliate in Brazil, which is included in our Other International business unit. On July 14, 2013, we sold our interest in the unconsolidated affiliates operating 64 aircraft in Europe. See Note 2 in the "Notes to Condensed Consolidated Financial Statements" included elsewhere in this Quarterly Report. |
(4) | This table does not reflect aircraft which our unconsolidated affiliates may have on order or under option. On July 11, 2013, we entered into an agreement to order 11 AW189 large aircraft which are reflected in this table. These aircraft orders have delivery dates in fiscal years 2015 and 2016. |
35
The commercial aircraft in our consolidated fleet represented in the above chart are our primary source of revenue. To normalize the consolidated operating revenue of our fleet for the different revenue productivity and cost of our commercial aircraft, we developed a common weighted factor that combines large, medium and small aircraft into a combined standardized number of revenue producing commercial aircraft assets. We call this measure Large AirCraft Equivalent (“LACE”). Our large, medium and small aircraft, including owned and leased, are weighted as 100%, 50%, and 25%, respectively, to arrive at a single LACE number, which excludes Bristow Academy aircraft, fixed wing aircraft, unconsolidated affiliate aircraft, aircraft held for sale and aircraft construction in process. We divide our operating revenue from commercial contracts, which excludes operating revenue from affiliates and reimbursable revenue, by LACE to develop a LACE rate, which is a standardized rate. Our current number of LACE aircraft is 161 and our historical LACE and LACE rate is as follows:
| Current Quarter | Fiscal Year Ended March 31, | |||||||||||||||||||||||
| 2013 | 2012 | 2011 | 2010 | 2009 | ||||||||||||||||||||
| LACE | 161 | 158 | 149 | 153 | 159 | 164 | ||||||||||||||||||
| LACE Rate (in millions) | $ | 8.78 | $ | 8.35 | $ | 7.89 | $ | 7.15 | $ | 6.49 | $ | 6.14 | ||||||||||||
The following table presents the percentage of LACE leased as of June 30, 2013:
| Europe | 31 | % | ||
| West Africa | 2 | % | ||
| North America | 22 | % | ||
| Australia | 18 | % | ||
| Other International | — | % | ||
| Total | 19 | % | ||
Our Strategy
Our goal is to strengthen our position as a leading helicopter services provider to the offshore energy industry and for civilian SAR. We intend to employ the following well defined business/commercial and capital allocation strategies to achieve this goal:
Business/Commercial Strategy
| • | Be the preferred provider of helicopter services. We position our business to be the preferred provider of helicopter services by maintaining strong relationships with our clients and providing safe and high-quality service. In order to create further differentiation and add value to our clients, we focus on enhancing our value to our clients through key components of our “Operational Excellence” initiative and our “Bristow Client Promise” program, which are the initiatives of “Target Zero Accidents,” “Target Zero Downtime” and “Target Zero Complaints.” These programs are designed to deliver continuous improvement in all these important areas and demonstrate our commitment to providing higher hours of zero-accident flight time with on-time and up-time helicopter transportation service. We maintain relationships with our clients’ field operations, corporate management and contacts at governmental agencies that we believe help us better anticipate client needs and provide our clients with the right aircraft in the right place at the right time, which in turn allows us to better manage our fleet utilization and capital investment program. We also leverage our close relationships with our clients to establish mutually beneficial operating practices and safety standards worldwide. By applying standardized first-rate operating and safety practices across our global operations, we seek to provide our clients with consistent, high-quality service in each of their areas of operation. By better understanding and delivering on our clients’ needs with our global operations and safety standards, we believe we effectively compete against other helicopter service providers based on aircraft availability, client service, safety and reliability, and not just price. |
36
| • | Grow our business while managing our assets. We plan to continue to grow our business globally and increase our revenue and profitability over time, while managing through cyclical downturns in the energy industry or governmental spending reductions or modifications. We conduct flight operations in most major oil and gas producing regions of the world, and through our strong relationships with our existing clients we are aware of future business opportunities in the markets we currently serve that would allow us to grow through new contracts. We anticipate these new opportunities will result in the deployment of new or existing aircraft into markets where we expect they will earn desirable rates of return. Additionally, new opportunities may result in growth through acquisitions and investments in existing or new markets, which may include increasing our role and participation with existing unconsolidated affiliates, investing in new companies, or creating partnerships and alliances with existing industry participants. We believe the combination of growth in existing and new markets will deliver improved shareholder returns. |
Capital Allocation Strategy
Our capital allocation strategy is based on three principles as follows:
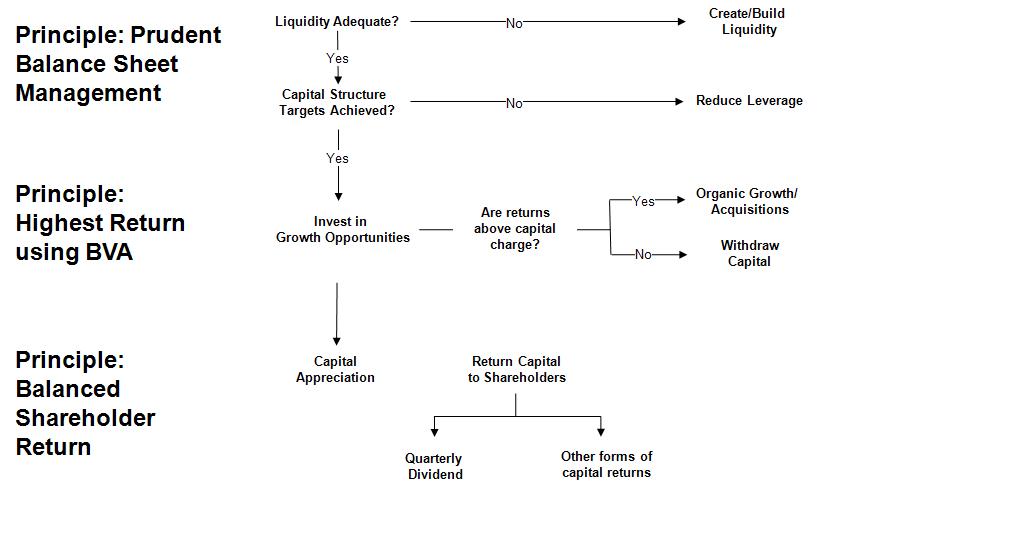
| • | Prudent balance sheet management. Throughout our corporate and business unit management, we proactively manage our capital allocation plan with a focus on achieving business growth and improving rates of return, within the dictates of prudent balance sheet management. In addition to cash flow generated from operations, we intend to maintain adequate liquidity and manage our capital structure relative to our commitments with external financings when necessary and through the use of operating leases for 20-30% of our LACE. As of June 30, 2013, aircraft under operating leases account for 19% of our LACE. Our adjusted debt to total equity ratio and total liquidity were 81.7% and $407.4 million, respectively, as of June 30, 2013 and 75.6% and $415.0 million, respectively, as of March 31, 2013. Adjusted debt includes the net present value of operating leases totaling $315.7 million and $301.9 million, respectively, letters of credit, bank guarantees and financial guarantees totaling $2.5 million and $2.6 million, respectively, and the unfunded pension liability of $121.5 million and $126.6 million, respectively, as of June 30 and March 31, 2013. |
| • | Highest return. Our internal financial management framework, called Bristow Value Added (“BVA”), focuses on the returns we deliver across our organization. BVA is computed by subtracting a capital charge for the use of gross invested capital from after tax operating cash flow. Our goal is to achieve strong improvements in BVA over time by (1) improving the returns we earn throughout our organization via cost and capital efficiency improvements as well as through better pricing based on the differentiated value we deliver to clients via aircraft safety, availability, client service and reliability; (2) deploying more capital into commercial opportunities where management believes we can deliver strong returns and when we believe it will benefit us and our shareholders, including making strategic acquisitions or strategic equity investments; and (3) withdrawing capital from areas where returns are deemed inadequate and unable to be sufficiently improved. When appropriate, we may divest parts of the Company. Improvements in BVA are the primary financial measure in our management incentive plan, which is designed to align the interests of management with shareholders. |
37
| • | Balanced shareholder return. We believe our liquidity position and cash flows from operations will be adequate to finance operating and maintenance expenditures, so we have considered our capital deployment alternatives for the future to deliver a more balanced return to our shareholders. On August 1, 2013, our board of directors approved our tenth consecutive quarterly dividend. Additionally, our board of directors approved a dividend policy with a goal of an annualized quarterly dividend payout ratio of 20-30% of forward adjusted earnings per share, although actual dividend payments are at the discretion of the board and may not meet this ratio. Also, our board of directors has authorized the expenditure of up to $100 million to repurchase shares of common stock, par value $.01 per share (“Common Stock”), through November 2, 2013, of which $1.2 million has been spent. For additional information on our repurchases of Common Stock, see “Share Repurchases” in Note 11 to the financial statements in our fiscal year 2013 Annual Report. The timing and method of any repurchases under the program will depend on a variety of factors, is subject to our results of operations, financial condition, cash requirements, and other factors and restrictions under applicable law and our debt instruments, and may be suspended or discontinued at any time. |
Market Outlook
Our core business is providing helicopter services to the worldwide oil and gas industry. Our global operations and critical mass of helicopters provide us with geographic and client diversity which helps mitigate risks associated with a single market or client.
The business environment during calendar year 2013 has remained positive, despite short-term operational challenges. The overall contractual environment has been strong and underlying commodity prices have been stable, which has fostered an environment where our clients continue to seek long-term contracts. We are currently experiencing significant demand for our helicopter services. Based on our current contract level and discussions with our clients about their needs for aircraft related to their oil and gas production and exploration plans, we anticipate the demand for aircraft services will continue at a high level for the near term. Further, based on the projects planned by our clients in the markets in which we currently operate, we anticipate global demand for our services will grow in the long-term and exceed the transportation capacity of the aircraft we and our competitors currently have in our fleets and on order. This high level of demand has allowed us to increase the rates we charge for our services over the past several years.
The SAR market is continuing to evolve and we believe further outsourcing of civilian SAR services to the private sector will continue as it is successfully deployed for governments. The clients for SAR services include both the oil and gas industry where our revenue is primarily dependent on our client’s operating expenditures as discussed above and governmental agencies where our revenue is dependent on a country’s desire to privatize SAR and enter into long-term contracts. Civilian SAR services opportunities not related to the oil and gas industry include: previously awarded work involving seven aircraft for U.K. Gap SAR, five aircraft in Ireland, two aircraft in the Dutch Antilles and 18 additional aircraft for the U.K. SAR contract (the “U.K. SAR contract”), as well as other opportunities yet to be awarded in the future for three aircraft in the Falklands, two aircraft in Svalbard, Norway, three aircraft in the Netherlands, 18 other aircraft in Norway and two aircraft in Nigeria.
While we are cautiously optimistic that economic conditions will continue to recover throughout fiscal year 2014, we continue to seek ways to operate more efficiently and work with our clients to improve the efficiency of their operations within our “Operational Excellence” initiative and “Bristow Client Promise” program. These efficiency gains combined with continued economic recovery should lead to expansion of our business with increased demand in many of our core markets.
Recent Events
On July 14, 2013, we sold our 50% interest in each of FBS Limited, FB Heliservices Limited and FB Leasing Limited, collectively referred to as the FB Entities, for £74 million, or approximately $112.0 million. The FB entities are U.K. corporations that own and operate a total of 64 aircraft and principally provide pilot training, maintenance and support services to the British military. We expect to record a pre-tax gain on sale of investment of approximately $104 million during the three months ended September 30, 2013 on our condensed consolidated statement of income.
On March 26, 2013, Bristow Helicopters was awarded a new contract with the U.K. Department for Transport (“DfT”) to provide civilian SAR services for all of the U.K. The U.K. SAR contract has a phased-in transition period beginning in April 2015 and continuing to July 2017 and a contract length of approximately ten years. Under the terms of the U.K. SAR contract, Bristow Helicopters will provide 11 Sikorsky S-92 and 11 AgustaWestland AW189 helicopters that will be located at ten bases across the U.K. Each SAR base will operate either two S-92s or two AW189s. In addition to the ten bases with 20 aircraft, two fully SAR-equipped training aircraft will be available to be deployed to any base as needed. Four of the aircraft that will operate at two bases under the U.K. SAR contract commenced operations under an interim SAR contract with the DfT (“U.K. Gap SAR”) during June and July 2013, and will transition to the U.K. SAR contract in fiscal year 2018. We expect the U.K. SAR contract to generate operating revenue, EBITDAR and BVA of approximately $2.5 billion, $1.1 billion and $300 million, respectively, over the contract term with anticipated capital requirements of approximately $825 million.
38
On October 22, 2012, an incident occurred with a Eurocopter EC225 Super Puma helicopter operated by another helicopter company, which resulted in a controlled ditching on the North Sea, south of the Shetland Isles, U.K. Following the ditching, all 19 passengers and crew were recovered safely and without injuries.
Related to this incident, the CAAs in the U.K. and Norway issued safety directives in October 2012, requiring operators to suspend operations of the affected aircraft. As a result, we ceased operating a total of sixteen large Eurocopter aircraft until further notice: twelve in the U.K., three in Australia and one in Norway.
In order to mitigate the impact on our clients, we have increased utilization of other in-region aircraft, returned to service previously idle Eurocopter AS332L helicopters not affected by the CAA safety directives and purchased ten Sikorsky S-92 large aircraft with options for 16 more.
Eurocopter, the manufacturer of the EC225 Super Puma aircraft, has indicated that they have determined the root causes of the gear shaft failure in the EC225 that occurred in 2012. This determination has been reviewed and verified by airworthiness authorities and independent third parties. The definitive solution to the problem will be a redesign of the gear shaft with earliest possible availability being in the middle of calendar year 2014. However, in July 2013 the European Aviation Safety Authority (the "EASA") issued an airworthiness directive providing for interim solutions involving minor aircraft modifications and new maintenance/operating procedures for mitigating shaft failure and enhancing early detection.
The CAAs in the U.K. and Norway have issued safety directives, which superseded and revoked the safety directive of October 2012 and now permits a return to service of the EC225 aircraft over harsh environments conditional upon compliance with the EASA airworthiness directive. We have commenced the required modifications and are carrying out the required inspections on our EC225 fleet in the U.K., Norway and Australia.
Currently, no client contracts have been cancelled in connection with the suspension in operations of the EC225 aircraft and we believe we have the contractual right to continue to receive monthly standing charges billed to our clients. In certain instances we have agreed to reduced monthly standing charge billings for the affected aircraft. We have been able to substantially replace the lost utilization from the EC225 aircraft with other aircraft, mitigating the impact on our results of operations for three months ended June 30, 2013.
The current situation will continue until the necessary modifications are made to the EC225 fleet and we are confident that the interim modifications will allow us to operate the aircraft safely, which could result in our return to revenue service for the EC225 aircraft in the third quarter of our fiscal year 2014. Until then, this situation could have a material adverse effect on our future business, financial condition and results of operations.
The management of our global aircraft fleet involves a careful evaluation of the expected demand for helicopter services across global energy markets, including the type of aircraft needed to meet this demand. As offshore oil and gas drilling and production globally moves to deeper water, more medium and large aircraft and newer technology aircraft may be required. As older aircraft models come off of current contracts and are replaced by new aircraft, our management evaluates our future needs for these aircraft models and ultimately the ability to recover our remaining investments in these aircraft through sales into the aftermarket. We depreciate our aircraft over their expected useful life to the expected salvage value to be received for the aircraft at the end of that life; however, depending on the market for aircraft or changes in the expected future use of aircraft within our fleet, we may record gains or losses on aircraft sales, impairment charges for aircraft operating or held for sale or accelerate depreciation on aircraft used in our operations. In certain instances where a cash return can be made on newer aircraft in excess of the expected return available through the provision of helicopter services, we may sell newer aircraft. The number of aircraft sales and the amount of gains and losses recorded on these sales is unpredictable. While aircraft sales are common in our business and are reflected in our operating results, gains and losses on aircraft sales may result in our operating results not reflecting the ordinary operating performance of our primary business, which is providing helicopter services to our clients. The gains and losses on aircraft sales are not included in the calculation of adjusted earnings per share or gross cash flows for purposes of calculating BVA.
The limited availability of some new aircraft models and the need throughout the industry to retire many of the older aircraft in the worldwide fleet is a driver for our industry. Currently manufacturers have some available aircraft; however, there are also some constraints on supply of new large aircraft. These constraints are further complicated by the October 22, 2012 incident and actions taken related to the EC225 helicopters discussed above.
39
Selected Regional Perspectives
In July 2012, we announced that we secured several major new multi-year contracts for the provision of a total of 20 large aircraft that are expected to generate in excess of $2 billion in revenue in Europe, Australia and Brazil. This contract work, with higher pricing and improved terms, is expected to continue to commence through fiscal year 2015.
Included in the July 2012 announcement discussed above is an award by INPEX Corporation (“INPEX”) of a ten-year contract for up to six large helicopters to support drilling, development and production operations on the Ichthys Project in Australia. INPEX also has an option to add a long-term SAR aircraft. This new contract is scheduled to begin the fourth quarter of fiscal year 2014 and reinforces our long term commitment to the Australian market.
Brazil continues to represent a significant part of our positive growth outlook. The ongoing growth in the pre-salt deepwater fields in Brazil will necessitate investment in infrastructure and associated services, particularly the addition of more offshore drilling rigs and production platforms. Aircraft being procured in this market tend to be newer and more sophisticated which is aligned with both our “Client Promise” and Líder Avição Holding S.A.'s (“Líder”) “Decolar” service differentiation programs. Continuing the fleet growth plan, Petrobras is expected to release new tenders for multiple medium and large aircraft expected to commence in the second half of calendar year 2014 and early calendar year 2015. In addition, recent new licensing rounds have been very well attended and several international oil companies have gained new blocks which will result in additional aircraft demand beyond the Petrobras requirements. Líder also has significant business in the general aviation sector and recently announced that it has secured a new position as the exclusive dealer for Bombardier jet aircraft sales in Brazil. This will add to Líder's aircraft sales business and will supplement Líder's Beechcraft turboprop dealership position.
As expected, Líder performed better during the second half of fiscal year 2013 and in the Current Quarter as new aircraft began operating, as evidenced by improved earnings from unconsolidated affiliates. However, currency fluctuations continue to make it difficult to predict the earnings from our Líder investment. Earnings from unconsolidated affiliates, net of losses, on our condensed consolidated statements of income, is included in calculating adjusted net income and adjusted EBITDAR.
As discussed in “Item 1A. Risk Factors” in the fiscal year 2013 Annual Report, we are subject to competition and the political environment in the countries where we operate. In Nigeria, we have seen a recent increase in competitive pressure and new regulation that could impact our ability to win future work at levels previously anticipated. In order to properly and fully embrace new regulations, we have agreed in principle to make a number of key changes to our operating model in Nigeria, while maintaining safety as our number one priority at all times. These changes are still being finalized, with the objectives being (a) allowing each of Bristow Helicopters Nigeria Ltd. (��BHNL”) and Pan African Airlines Nigeria Ltd. (“PAAN”) to operate competitively in the market place, each as a completely separate entity with its own distinct identity, management and workforce, (b) providing technical aviation maintenance services through a wholly-owned Bristow Group entity, BGI Aviation Technical Services (“BATS”), and(c) each of BHNL, PAAN and BATS committing to continue to apply and use all key Bristow Group standards and policies, including without limitation our Target Zero safety program, our Code of Business Integrity and our Operations Manuals. As a result of these changes, our ability to continue to consolidate BHNL and PAAN under the current accounting requirements could change.
We conduct business in various foreign countries, and as such, our cash flows and earnings are subject to fluctuations and related risks from changes in foreign currency exchange rates. During the Current Quarter, our primary foreign currency exposure was related to the British pound sterling, the euro, the Australian dollar, the Nigerian naira and the Brazilian real. For details on this exposure and the related impact on our results of operations, see “Item 3. Quantitative and Qualitative Disclosures about Market Risk” and Note 1 in the “Notes to Condensed Consolidated Financial Statements” included elsewhere in this Quarterly Report.
40
Results of Operations
The following table presents our operating results and other statement of income information for the applicable periods:
| Three Months Ended June 30, | Favorable (Unfavorable) | |||||||||||||||||||
| 2013 | 2012 | |||||||||||||||||||
(In thousands, except per share amounts, percentages and flight hours) | ||||||||||||||||||||
| Gross Revenue: | ||||||||||||||||||||
| Operating revenue | $ | 359,547 | $ | 320,654 | $ | 38,893 | 12.1 | % | ||||||||||||
| Reimbursable revenue | 39,447 | 41,954 | (2,507 | ) | (6.0 | )% | ||||||||||||||
| Total gross revenue | 398,994 | 362,608 | 36,386 | 10.0 | % | |||||||||||||||
| Operating expense: | ||||||||||||||||||||
| Direct cost | 255,256 | 222,768 | (32,488 | ) | (14.6 | )% | ||||||||||||||
| Reimbursable expense | 36,743 | 40,172 | 3,429 | 8.5 | % | |||||||||||||||
| Depreciation and amortization | 22,819 | 21,372 | (1,447 | ) | (6.8 | )% | ||||||||||||||
| General and administrative | 40,308 | 34,977 | (5,331 | ) | (15.2 | )% | ||||||||||||||
| 355,126 | 319,289 | (35,837 | ) | (11.2 | )% | |||||||||||||||
| Loss on disposal of assets | (1,721 | ) | (5,315 | ) | 3,594 | 67.6 | % | |||||||||||||
| Earnings from unconsolidated affiliates, net of losses | 13,972 | 1,989 | 11,983 | * | ||||||||||||||||
| Operating income | 56,119 | 39,993 | 16,126 | 40.3 | % | |||||||||||||||
| Interest expense, net | (20,251 | ) | (8,686 | ) | (11,565 | ) | (133.1 | )% | ||||||||||||
| Other income (expense), net | (1,366 | ) | (931 | ) | (435 | ) | (46.7 | )% | ||||||||||||
| Income before provision for income taxes | 34,502 | 30,376 | 4,126 | 13.6 | % | |||||||||||||||
| Provision for income taxes | (7,590 | ) | (6,180 | ) | (1,410 | ) | (22.8 | )% | ||||||||||||
| Net income | 26,912 | 24,196 | 2,716 | 11.2 | % | |||||||||||||||
| Net income attributable to noncontrolling interests | (26 | ) | (534 | ) | 508 | 95.1 | % | |||||||||||||
| Net income attributable to Bristow Group | $ | 26,886 | $ | 23,662 | $ | 3,224 | 13.6 | % | ||||||||||||
| Diluted earnings per common share | $ | 0.74 | $ | 0.65 | $ | 0.09 | 13.8 | % | ||||||||||||
Operating margin (1) | 15.6 | % | 12.5 | % | 3.1 | % | 24.8 | % | ||||||||||||
Flight hours (2) | 50,091 | 55,128 | (5,037 | ) | (9.1 | )% | ||||||||||||||
Non-GAAP financial measures: (3) | ||||||||||||||||||||
| Adjusted operating income | $ | 57,840 | $ | 47,470 | $ | 10,370 | 21.8 | % | ||||||||||||
Adjusted operating margin (1) | 16.1 | % | 14.8 | % | 1.3 | % | 8.8 | % | ||||||||||||
| Adjusted EBITDAR | $ | 102,473 | $ | 84,273 | $ | 18,200 | 21.6 | % | ||||||||||||
Adjusted EBITDAR margin (1) | 28.5 | % | 26.3 | % | 2.2 | % | 8.4 | % | ||||||||||||
| Adjusted net income | $ | 36,504 | $ | 29,618 | $ | 6,886 | 23.2 | % | ||||||||||||
| Adjusted diluted earnings per share | $ | 1.00 | $ | 0.81 | $ | 0.19 | 23.5 | % | ||||||||||||
______
* percentage change not meaningful
(1) | Operating margin is calculated as operating income divided by operating revenue. Adjusted operating margin is calculated as adjusted operating income divided by operating revenue. Adjusted EBITDAR margin is calculated as adjusted EBITDAR divided by operating revenue. |
(2) | Excludes flight hours from Bristow Academy and unconsolidated affiliates. |
41
(3) | These financial measures have not been prepared in accordance with generally accepted accounting principles (“GAAP”) and have not been audited or reviewed by our independent auditor. These financial measures are therefore considered non-GAAP financial measures. Adjusted EBITDAR is calculated by taking our net income and adjusting for interest expense, depreciation and amortization, rent expense (included as a component of direct cost and general and administrative expense), provision for income taxes, loss on disposal of assets and any special items during the reported periods. See further discussion of our use of the adjusted EBITDAR metric below. Adjusted operating income, adjusted net income and adjusted diluted earnings per share are each adjusted for loss on disposal of assets and any special items during the reported periods. As discussed below, management believes these non-GAAP financial measures provide meaningful supplemental information regarding our results of operations. A description of the adjustments to and reconciliations of these non-GAAP financial measures to the most comparable GAAP financial measures is as follows: |
| Three Months Ended June 30, | ||||||||||
| 2013 | 2012 | |||||||||
| (In thousands, except per share amounts) | ||||||||||
| Adjusted operating income | $ | 57,840 | $ | 47,470 | ||||||
| Loss on disposal of assets | (1,721 | ) | (5,315 | ) | ||||||
Special items (i) | — | (2,162 | ) | |||||||
| Operating income | $ | 56,119 | $ | 39,993 | ||||||
| Adjusted EBITDAR | $ | 102,473 | $ | 84,273 | ||||||
| Loss on disposal of assets | (1,721 | ) | (5,315 | ) | ||||||
Special items (i) | — | (2,162 | ) | |||||||
| Depreciation and amortization | (22,819 | ) | (21,372 | ) | ||||||
| Rent expense | (23,061 | ) | (16,274 | ) | ||||||
| Interest expense | (20,370 | ) | (8,774 | ) | ||||||
| Provision for income taxes | (7,590 | ) | (6,180 | ) | ||||||
| Net income | $ | 26,912 | $ | 24,196 | ||||||
| Adjusted net income | $ | 36,504 | $ | 29,618 | ||||||
Loss on disposal of assets (ii) | (1,342 | ) | (4,234 | ) | ||||||
Special items (i) (ii) | (8,276 | ) | (1,722 | ) | ||||||
| Net income attributable to Bristow Group | $ | 26,886 | $ | 23,662 | ||||||
| Adjusted diluted earnings per share | $ | 1.00 | $ | 0.81 | ||||||
Loss on disposal of assets (ii) | (0.04 | ) | (0.12 | ) | ||||||
Special items (i) (ii) | (0.23 | ) | (0.05 | ) | ||||||
| Diluted earnings per share | 0.74 | 0.65 | ||||||||
______
(i) | See information about special items during the Current Quarter and Comparable Quarter under "Current Quarter Compared to Comparable Quarter" below. |
(ii) | These amounts are presented after applying the appropriate tax effect to each item and dividing by the weighted average shares outstanding during the related period to calculate the earnings per share impact. |
Management believes that adjusted operating income, adjusted EBITDAR, adjusted net income and adjusted diluted earnings per share (collectively, the “Non-GAAP measures”) provide relevant and useful information, which is widely used by analysts, investors and competitors in our industry as well as by our management in assessing both consolidated and business unit performance.
Adjusted operating income provides us with an understanding of the results from the primary operations of our business by excluding asset disposition effects and special items that do not reflect the ordinary earnings of our helicopter services operations. We believe that this measure is a useful supplemental measure because operating income includes asset disposition effects and special items, and inclusion of these items does not reflect the ongoing operational earnings of our business.
Adjusted EBITDAR provides us with an understanding of one aspect of earnings before the impact of investing and financing transactions and income taxes. Additionally, we believe that adjusted EBITDAR provides us with a useful supplemental measure of our operational performance by excluding the financing decisions we make regarding aircraft purchases or leasing. Adjusted EBITDAR should not be considered a measure of discretionary cash available to us for investing in the growth of our business.
42
Adjusted net income and adjusted diluted earnings per share present our consolidated results excluding asset dispositions and special items that do not reflect the ordinary earnings of our helicopter services operations. We believe that these measures are useful supplemental measures because net income and diluted earnings per share include asset disposition effects and special items, and inclusion of these items does not reflect the predictive ongoing operational earnings of our business.
The Non-GAAP measures are not calculated or presented in accordance with GAAP and other companies in our industry may calculate these measures differently than we do. As a result, these financial measures have limitations as analytical and comparative tools and you should not consider these measures in isolation, or as a substitute for analysis of our results as reported under GAAP. In calculating these financial measures, we make certain adjustments that are based on assumptions and estimates that may prove to be inaccurate. In addition, in evaluating these financial measures, you should be aware that in the future we may incur expenses similar to those eliminated in this presentation. Our presentation of the Non-GAAP measures should not be construed as an inference that our future results will be unaffected by unusual or special items.
Adjusted EBITDAR has limitations as an analytical tool, and should not be considered in isolation, or as a substitute for analysis of our results reported under GAAP. Some of the limitations are:
| • | Adjusted EBITDAR does not reflect our current or future cash requirements for capital expenditures; |
| • | Adjusted EBITDAR does not reflect changes in, or cash requirements for, our working capital needs; |
| • | Adjusted EBITDAR does not reflect the significant interest expense or the cash requirements necessary to service interest or principal payments on our debts; |
| • | Although depreciation and amortization are non-cash charges, the assets being depreciated and amortized will often have to be replaced in the future, and adjusted EBITDAR does not reflect any cash requirements for such replacements; and |
| • | Other companies in our industry may calculate adjusted EBITDAR differently than we do, limiting its usefulness as a comparative measure. |
The following presents business unit adjusted EBITDAR and adjusted EBITDAR margin discussed in “Business Unit Operating Results,” and consolidated adjusted EBITDAR and adjusted EBITDAR margin for the three months ended June 30, 2013 and 2012:
| Three Months Ended June 30, | |||||||||||
| 2013 | 2012 | ||||||||||
(In thousands, except percentages) | |||||||||||
| Europe | $ | 41,492 | $ | 39,664 | |||||||
| West Africa | 23,720 | 21,163 | |||||||||
| North America | 17,023 | 12,200 | |||||||||
| Australia | 6,774 | 10,325 | |||||||||
| Other International | 22,185 | 12,014 | |||||||||
| Corporate and other | (8,721 | ) | (11,093 | ) | |||||||
| Consolidated adjusted EBITDAR | $ | 102,473 | $ | 84,273 | |||||||
| Europe | 30.3 | % | 32.2 | % | |||||||
| West Africa | 31.3 | % | 31.9 | % | |||||||
| North America | 29.2 | % | 23.2 | % | |||||||
| Australia | 17.7 | % | 27.0 | % | |||||||
| Other International | 67.4 | % | 36.2 | % | |||||||
| Consolidated adjusted EBITDAR margin | 28.5 | % | 26.3 | % | |||||||
43
Current Quarter Compared to Comparable Quarter
Our results for the Current Quarter included a $36.4 million, or 10.0%, increase in gross revenue over the Comparable Quarter primarily resulting from:
| • | Increased operating revenue from the addition of new contracts with improved pricing and improvements in flight activity in our Europe ($13.9 million) and West Africa ($9.4 million) business units, and |
| • | The addition of eight aircraft operating in Canada that contributed $16.1 million ($8.2 million in North America and $7.9 million in Corporate and other), which was partially offset by: |
| • | A $2.5 million decrease in reimbursable revenue (primarily in Europe and Australia), and |
| • | An unfavorable impact from changes in foreign currency rates that decreased gross revenue by $3.0 million (primarily in Europe and Australia). |
Our results for the Current Quarter also included a $35.8 million, or 11.2%, increase in operating expense over the Comparable Quarter primarily resulting from:
| • | A $26.2 million increase in maintenance, compensation and training costs primarily driven by growth in our business, |
| • | A $6.8 million increase in rent expense resulting from increased leasing of aircraft under operating leases as discussed under “— Executive Overview — Our Strategy — Capital Allocation Strategy” included elsewhere in this Quarterly Report, and |
| • | A $5.3 million increase in general and administrative expense primarily resulting from an increase in compensation and information technology expenses, which was partially offset by: |
| • | A $3.4 million decrease in reimbursable expense (primarily in Europe and Australia), |
| • | A $3.1 million decrease in fuel costs (primarily in Europe), and |
| • | A favorable impact from changes in foreign currency exchange rates that decreased operating expense by $1.7 million. |
Despite these increases in operating costs, operating income increased $16.1 million, or 40.3%, driven by a $12.0 million increase in earnings from unconsolidated affiliates, net of losses and a $3.6 million decrease in loss on disposal of assets. These items resulted in an increase in operating margin from 12.5% in the Comparable Quarter to 15.6% in the Current Quarter.
The increase in earnings from unconsolidated affiliates, net of losses, primarily resulted from higher earnings of $8.6 million from our investment in Líder in Brazil and $2.0 million of dividends received from our cost method investment in Egypt. $2.7 million of the improvement from Líder resulted from the impact of foreign currency exchange rate changes as the value of the Brazilian real has fluctuated significantly relative to the U.S. dollar. The remaining increase in earnings from Líder is primarily due to additional aircraft on contract and better cost management in the Current Quarter.
The loss on disposal of assets in the Current Quarter included a loss of $0.5 million from the sale of four aircraft and other equipment and impairment charges totaling $1.2 million related to two held for sale aircraft. During the Comparable Quarter, the loss on disposal of assets included a loss of $3.4 million from the sale of four aircraft and other equipment and impairment charges totaling $1.9 million related to seven held for sale aircraft.
Net income and diluted earnings per share increased during the Current Quarter by 13.6% and 13.8%, respectively, driven primarily by the improvement in earnings from unconsolidated affiliates and the decrease in loss on disposal of assets.
Results for the Current Quarter and Comparable Quarter were also impacted by the following special items:
| • | $12.7 million of additional interest expense related to the cancellation of a potential financing, which decreased net income by $8.3 million and earnings per share by $0.23 during the Current Quarter, and |
| • | $2.2 million of severance costs related to the termination of a contract in the Southern North Sea, which decreased operating income by $2.2 million, net income by $1.7 million and earnings per share by $0.05 during the Comparable Quarter. |
44
After adjusting for the loss on disposal of assets and for special items in the Current Quarter and Comparable Quarter, we saw an improvement in the financial measures used by management to assess and measure our financial performance, including a 21.8% improvement in adjusted operating income, an improvement in adjusted operating margin from 14.8% to 16.1%, a 21.6% improvement in adjusted EBITDAR, an improvement in adjusted EBITDAR margin from 26.3% to 28.5%, a 23.2% improvement in adjusted net income and a 23.5% improvement in adjusted diluted earnings per share. This improvement was driven by strong revenue performance and the increase in earnings from unconsolidated affiliates in the Current Quarter, partially offset by the increases in salaries and benefits, maintenance expense, general and administrative expense and rent expense discussed above.
Despite the significant increase in operating revenue across most of our business units, adjusted EBITDAR margin decreased compared to the Comparable Quarter for all business units except North America and Other International, where the addition of aircraft operating for Cougar Helicopters, Inc. (“Cougar”) in Canada and earnings from Líder in Brazil significantly benefitted results. This margin decline is primarily related to additional maintenance and labor costs incurred in the Current Quarter in support of the previously idle Eurocopter AS332L aircraft returned to service after we ceased operating Eurocopter EC225 aircraft in October 2012. Included in these support costs were costs incurred for major maintenance activities on certain of the aircraft previously held for sale. Additionally, we are incurring costs in Europe and Australia in anticipation of new contract start-ups in these markets later in fiscal year 2014, including the Gap SAR contract in the U.K. and INPEX contract in Australia. A significant portion of the costs related to the AS332L aircraft and contract additions are non-recurring; therefore, we expect adjusted EBITDAR margin to improve across most of these markets over the remainder of fiscal year 2014.
45
Business Unit Operating Results
The following tables set forth certain operating information for the business units comprising our Helicopter Services segment. Intercompany lease revenue and expense are eliminated from our segment reporting, and depreciation expense of aircraft is presented in the segment that operates the aircraft.
Current Quarter Compared to Comparable Quarter
Set forth below is a discussion of the operations of our business units. Our consolidated results are discussed under “Results of Operations” above.
Europe
| Three Months Ended June 30, | Favorable (Unfavorable) | ||||||||||||||||
| 2013 | 2012 | ||||||||||||||||
| (In thousands, except percentages) | |||||||||||||||||
| Operating revenue | $ | 137,159 | $ | 123,235 | $ | 13,924 | 11.3 | % | |||||||||
| Reimbursable revenue | $ | 29,550 | $ | 30,785 | $ | (1,235 | ) | (4.0 | )% | ||||||||
| Earnings from unconsolidated affiliates, net of losses | $ | 3,040 | $ | 2,006 | $ | 1,034 | 51.5 | % | |||||||||
| Operating income | $ | 20,021 | $ | 21,876 | $ | (1,855 | ) | (8.5 | )% | ||||||||
| Operating margin | 14.6 | % | 17.8 | % | (3.2 | )% | (18.0 | )% | |||||||||
| Adjusted EBITDAR | $ | 41,492 | $ | 39,664 | $ | 1,828 | 4.6 | % | |||||||||
| Adjusted EBITDAR margin | 30.3 | % | 32.2 | % | (1.9 | )% | (5.9 | )% | |||||||||
The operations of our Europe business unit have continued to expand since the Comparable Quarter with the addition of nine large aircraft. These new aircraft, as well as an overall increase in activity with existing clients and under new contracts primarily in the Northern North Sea in the U.K. resulted in $21.4 million of increased operating revenue and was the primary contributor to the revenue growth in Europe in the Current Quarter. These increases were partially offset by the loss of a contract in the Southern North Sea resulting in a $10.2 million decrease in operating revenue. Additionally, gross revenue was negatively impacted by changes in exchange rates that decreased gross revenue by $2.3 million. The current restrictions on EC225 Super Puma helicopters did not have a material impact on our results in Europe for the Current Quarter. For further discussion of the EC225 Super Puma helicopters operating in the U.K. and Norway, see “Executive Overview – Market Outlook” discussed elsewhere in this Quarterly Report.
Despite the revenue growth in the Current Quarter, operating income and operating margin decreased primarily due to an increase in rental expense of $6.0 million. Other expenses also increased as a result of activity levels and timing of maintenance activities, including maintenance expense ($5.9 million) and salaries ($2.0 million). See discussion of the impact of costs incurred to return idle AS332L aircraft to service under “– Current Quarter Compared to Comparable Quarter” discussed elsewhere in this Quarterly Report. We expect our results in Europe to continue to be strong in future periods and for adjusted EBITDAR margins to improve as a result of additional new contracts commencing and possible major contract awards. However, we are currently unable to determine the impact that could result from the restrictions on these EC225 Super Puma helicopters.
Adjusted EBITDAR improved by 4.6% and adjusted EBITDAR margin decreased from 32.2% in the Comparable Quarter to 30.3% in the Current Quarter. Adjusted EBITDAR excludes the impact of the increase in the number of aircraft on lease in the Current Quarter and reflects the overall growth in this business unit in terms of new contracts, increased pricing and utilization. The decrease in margins was driven primarily by higher maintenance and salary costs discussed above.
On July 14, 2013, we sold our 50% interest in the FB entities which were accounted for under the equity method and included in our Europe business unit operating results. The FB entities generated $3.0 million and $2.0 million of operating income and adjusted EBITDAR for the Current Quarter and Comparable Quarter, respectively. For further discussion, see “Executive Overview – Market Outlook” discussed elsewhere in this Quarterly Report.
46
West Africa
| Three Months Ended June 30, | Favorable (Unfavorable) | ||||||||||||||||
| 2013 | 2012 | ||||||||||||||||
| (In thousands, except percentages) | |||||||||||||||||
| Operating revenue | $ | 75,779 | $ | 66,355 | $ | 9,424 | 14.2 | % | |||||||||
| Reimbursable revenue | $ | 3,602 | $ | 4,099 | $ | (497 | ) | (12.1 | )% | ||||||||
| Operating income | $ | 19,253 | $ | 16,131 | $ | 3,122 | 19.4 | % | |||||||||
| Operating margin | 25.4 | % | 24.3 | % | 1.1 | % | 4.5 | % | |||||||||
| Adjusted EBITDAR | $ | 23,720 | $ | 21,163 | $ | 2,557 | 12.1 | % | |||||||||
| Adjusted EBITDAR margin | 31.3 | % | 31.9 | % | (0.6 | )% | (1.9 | )% | |||||||||
Operating revenue for West Africa in the Current Quarter increased primarily due to $5.4 million from improved pricing, $2.4 million from increased ad hoc flying and flying under new contracts and $1.1 million from increased activity under existing contracts.
Operating income, operating margin and adjusted EBITDAR increased in the Current Quarter due to the increase in revenue partially offset by an increase in maintenance expense of $3.1 million. Adjusted EBITDAR margin decreased by 1.9% due to the increase in maintenance expense.
As previously discussed, we have seen recent changes in the West Africa market as a result of new competitors entering this market. Additionally, increasingly active trade unions, changing regulations and the changing political environment have made and are expected to continue to make our operating results from Nigeria unpredictable.
North America
| Three Months Ended June 30, | Favorable (Unfavorable) | ||||||||||||||||
| 2013 | 2012 | ||||||||||||||||
| (In thousands, except percentages) | |||||||||||||||||
| Operating revenue | $ | 58,235 | $ | 52,625 | $ | 5,610 | 10.7 | % | |||||||||
| Reimbursable revenue | $ | 331 | $ | 281 | $ | 50 | 17.8 | % | |||||||||
| Earnings from unconsolidated affiliates, net of losses | $ | (8 | ) | $ | — | $ | (8 | ) | * | ||||||||
| Operating income | $ | 8,123 | $ | 6,475 | $ | 1,648 | 25.5 | % | |||||||||
| Operating margin | 13.9 | % | 12.3 | % | 1.6 | % | 13.0 | % | |||||||||
| Adjusted EBITDAR | $ | 17,023 | $ | 12,200 | $ | 4,823 | 39.5 | % | |||||||||
| Adjusted EBITDAR margin | 29.2 | % | 23.2 | % | 6.0 | % | 25.9 | % | |||||||||
______
* percentage change not meaningful
In early October 2012, we acquired eight large aircraft that are operated by Cougar in Canada, which resulted in an $8.2 million increase in operating revenue in the Current Quarter. Also, an increase medium and large aircraft on contract resulted in an increase of $0.5 million of operating revenue in the Current Quarter. These increases were partially offset by a decline in the number of small aircraft on contract in the U.S Gulf of Mexico which reduced operating revenue by $1.9 million in the Current Quarter.
The revenue increase, combined with success by our management team in containing costs in this market, translated into a continuation of improvement in operating income, operating margin, adjusted EBITDAR and adjusted EBITDAR margin in the Current Quarter.
For further discussion of our investment in Cougar, see “Executive Overview – Market Outlook” discussed in our fiscal year 2013 Annual Report.
47
Australia
| Three Months Ended June 30, | Favorable (Unfavorable) | ||||||||||||||||
| 2013 | 2012 | ||||||||||||||||
| (In thousands, except percentages) | |||||||||||||||||
| Operating revenue | $ | 38,213 | $ | 38,171 | $ | 42 | 0.1 | % | |||||||||
| Reimbursable revenue | $ | 5,785 | $ | 6,331 | $ | (546 | ) | (8.6 | )% | ||||||||
| Operating income | $ | 3,280 | $ | 6,509 | $ | (3,229 | ) | (49.6 | )% | ||||||||
| Operating margin | 8.6 | % | 17.1 | % | (8.5 | )% | (49.7 | )% | |||||||||
| Adjusted EBITDAR | $ | 6,774 | $ | 10,325 | $ | (3,551 | ) | (34.4 | )% | ||||||||
| Adjusted EBITDAR margin | 17.7 | % | 27.0 | % | (9.3 | )% | (34.4 | )% | |||||||||
Operating revenue for Australia remained flat due an increase in operating revenue from new contracts of $6.8 million and ad hoc work of $6.3 million, offset by a decrease in revenue from the ending of certain short-term contracts of $12.5 million and the negative impact of foreign currency exchange rate changes of $0.7 million. Additionally, reimbursable revenue decreased $0.5 million in the Current Quarter.
Operating income, operating margin, adjusted EBITDAR and adjusted EBITDAR margin declined primarily due to the ending of certain short-term contracts discussed above and an increase in salaries of $2.2 million. During the Current Quarter, we incurred costs, including salaries and benefits, depreciation, insurance, training and lease costs in anticipation of contracts that start during the fourth quarter of fiscal year 2014, including the INPEX contract. For further details about the INPEX contract award, see “Executive Overview – Market Outlook” included elsewhere in this Quarterly Report.
We have EC225 Super Puma helicopters operating in Australia affected by the restrictions discussed under “Executive Overview – Market Outlook” included elsewhere in this Quarterly Report.
Other International
| Three Months Ended June 30, | Favorable (Unfavorable) | ||||||||||||||||
| 2013 | 2012 | ||||||||||||||||
| (In thousands, except percentages) | |||||||||||||||||
| Operating revenue | $ | 32,893 | $ | 33,227 | $ | (334 | ) | (1.0 | )% | ||||||||
| Reimbursable revenue | $ | 82 | $ | 248 | $ | (166 | ) | (66.9 | )% | ||||||||
| Earnings from unconsolidated affiliates, net of losses | $ | 10,940 | $ | (17 | ) | $ | 10,957 | * | |||||||||
| Operating income | $ | 18,442 | $ | 7,387 | $ | 11,055 | 149.7 | % | |||||||||
| Operating margin | 56.1 | % | 22.2 | % | 33.9 | % | 152.7 | % | |||||||||
| Adjusted EBITDAR | $ | 22,185 | $ | 12,014 | $ | 10,171 | 84.7 | % | |||||||||
| Adjusted EBITDAR margin | 67.4 | % | 36.2 | % | 31.2 | % | 86.2 | % | |||||||||
______
* percentage change not meaningful
Operating revenue for Other International decreased slightly in the Current Quarter due to the end of short-term contracts in Guyana ($2.1 million) and the Baltic Sea ($0.4 million) and a decline in aircraft on contract in Mexico ($0.6 million), partially offset by increased activity in Russia ($1.4 million) and Brazil ($1.3 million).
Operating income, operating margin, adjusted EBITDAR and adjusted EBITDAR margin increased primarily due to an increase of $11.0 million in earnings from unconsolidated affiliates, net of losses, partially offset by an increase in training costs for new aircraft operating in Trinidad.
Earnings from unconsolidated affiliates, net of losses, increased primarily due to an increase in earnings from our investment in Líder of $8.6 million in the Current Quarter compared to a small loss in the Comparable Quarter. Additionally, we received $2.0 million in dividends from our cost method investment in Egypt during the Current Quarter. See further discussion of our investment in Líder and expected market growth in Brazil in “Executive Overview – Market Outlook” and “– Current Quarter Compared to Comparable Quarter” included elsewhere in this Quarterly Report.
48
Corporate and Other
| Three Months Ended June 30, | Favorable (Unfavorable) | ||||||||||||||||
| 2013 | 2012 | ||||||||||||||||
| (In thousands, except percentages) | |||||||||||||||||
| Operating revenue | $ | 18,115 | $ | 7,420 | $ | 10,695 | 144.1 | % | |||||||||
| Reimbursable revenue | $ | 97 | $ | 210 | $ | (113 | ) | (53.8 | )% | ||||||||
| Operating loss | $ | (11,279 | ) | $ | (13,070 | ) | $ | 1,791 | 13.7 | % | |||||||
| Adjusted EBITDAR | $ | (8,721 | ) | $ | (11,093 | ) | $ | 2,372 | 21.4 | % | |||||||
Corporate and other includes our Bristow Academy business unit, technical services business and corporate costs that have not been allocated out to other business units.
Operating revenue increased primarily due to the addition of support fees for new helicopters operating in Canada of $7.9 million and an increase in revenue at Bristow Academy of $1.4 million resulting from an increase in military training.
Corporate operating expense primarily represents costs of our corporate office and other general and administrative costs not allocated to our business units. Operating loss decreased primarily due to the increase in operating revenue partially offset by an increase in information technology expense and rent expense during the Current Quarter.
Interest Expense, Net
| Three Months Ended June 30, | Favorable (Unfavorable) | ||||||||||||||||
| 2013 | 2012 | ||||||||||||||||
| (In thousands, except percentages) | |||||||||||||||||
| Interest income | $ | 119 | $ | 88 | $ | 31 | 35.2 | % | |||||||||
| Interest expense | (9,360 | ) | (9,055 | ) | (305 | ) | (3.4 | )% | |||||||||
| Amortization of debt discount | (921 | ) | (870 | ) | (51 | ) | (5.9 | )% | |||||||||
| Amortization of debt fees | (13,336 | ) | (437 | ) | (12,899 | ) | * | ||||||||||
| Capitalized interest | 3,247 | 1,588 | 1,659 | 104.5 | % | ||||||||||||
| Interest expense, net | $ | (20,251 | ) | $ | (8,686 | ) | $ | (11,565 | ) | (133.1 | )% | ||||||
______
* percentage change not meaningful
The increase in interest expense, net in the Current Quarter is primarily due to the write-off of $12.7 million of deferred financing fees related to a potential financing in connection with our bid to provide SAR services in the U.K. During the Current Quarter, we increased our borrowing capacity on our Revolving Credit Facility from $200 million to $350 million and cancelled the potential financing.
49
Other Income (Expense), Net
| Three Months Ended June 30, | Favorable (Unfavorable) | ||||||||||||||||
| 2013 | 2012 | ||||||||||||||||
| (In thousands, except percentages) | |||||||||||||||||
| Foreign currency losses | $ | (1,366 | ) | $ | (931 | ) | $ | (435 | ) | (46.7 | )% | ||||||
| Other | — | — | — | — | % | ||||||||||||
| Other income (expense), net | $ | (1,366 | ) | $ | (931 | ) | $ | (435 | ) | (46.7 | )% | ||||||
Other income (expense), net decreased primarily due to the impact of changes in foreign currency exchange rates.
Taxes
| Three Months Ended June 30, | Favorable (Unfavorable) | |||||||||||||||
| 2013 | 2012 | |||||||||||||||
| (In thousands, except percentages) | ||||||||||||||||
| Effective tax rate | 22.0 | % | 20.3 | % | (1.7 | )% | (8.4 | )% | ||||||||
| Net foreign tax on non-U.S. earnings | $ | 5,332 | $ | 6,714 | $ | 1,382 | 20.6 | % | ||||||||
| Benefit of foreign earnings indefinitely reinvested abroad | (10,573 | ) | (7,050 | ) | 3,523 | 50.0 | % | |||||||||
| Change in valuation allowance for contingency | 30 | (122 | ) | (152 | ) | (124.6 | )% | |||||||||
| Realization of foreign tax credits | (1,908 | ) | (1,507 | ) | 401 | 26.6 | % | |||||||||
Our effective tax rate for the Current Quarter and Comparable Quarter were reduced by the permanent investment outside the U.S. of foreign earnings, upon which no U.S. tax has been provided, and by the amount of our foreign source income and our ability to realize foreign tax credits.
50
Liquidity and Capital Resources
Cash Flows
Operating Activities
Net cash flows provided by operating activities totaled $36.4 million during the Current Quarter compared to $55.4 million during the Comparable Quarter. Changes in non-cash working capital used $26.3 million and generated $4.0 million in cash flows from operating activities for the Current Quarter and Comparable Quarter, respectively. The decline in changes from non-cash working capital is primarily due to an increase in interest payments of $14.3 million due to the timing of payments for our 6¼% Senior Notes due 2022 as well as cash payments made related to the U.K. SAR contract award and annual compensation payments.
Investing Activities
Cash flows used in investing activities were $177.6 million and $67.2 million for the Current Quarter and Comparable Quarter, respectively. Cash was used for capital expenditures as follows:
| Three Months Ended June 30, | |||||||||
| 2013 | 2012 | ||||||||
| Number of aircraft delivered: | |||||||||
| Large | 3 | 3 | |||||||
| Medium | 3 | — | |||||||
| Total aircraft | 6 | 3 | |||||||
| Capital expenditures (in thousands): | |||||||||
| Aircraft and related equipment | $ | 167,227 | $ | 79,969 | |||||
| Other | 12,305 | 6,586 | |||||||
| Total capital expenditures | $ | 179,532 | $ | 86,555 | |||||
In addition to these capital expenditures, investing cash flows were impacted by aircraft sales. During the Current Quarter, we received proceeds of $1.9 million primarily from the sale or disposal of four aircraft and certain other equipment. During the Comparable Quarter, we received $20.2 million in proceeds from the sale of four aircraft and certain other equipment.
Financing Activities
Cash flows generated from financing activities were $85.4 million during the Current Quarter and cash flows used in financing activities were $28.2 million during the Comparable Quarter. During the Current Quarter, we received $102.0 million from borrowings on our Revolving Credit Facility and cash was used for the repayment of debt totaling $1.7 million, payment of deferred financing fees of $12.7 million for a potential financing and payment of a dividend on our Common Stock totaling $9.0 million. See further discussion of the potential financing in “– Current Quarter Compared to Comparable Quarter” included elsewhere in this Quarterly Report. During the Comparable Quarter, we used $21.8 million for the repayment of debt and $7.1 million for payment of a dividend on our Common Stock.
Future Cash Requirements
Contractual Obligations, Commercial Commitments and Off Balance Sheet Arrangements
We have various contractual obligations that are recorded as liabilities on our condensed consolidated financial statements. Other items, such as certain purchase commitments, interest payments and other executory contracts are not recognized as liabilities on our condensed consolidated financial statements but are included in the table below. For example, we are contractually committed to make certain minimum lease payments for the use of property and equipment under operating lease agreements.
51
The following tables summarize our significant contractual obligations and other commercial commitments on an undiscounted basis as of June 30, 2013 and the future periods in which such obligations are expected to be settled in cash. In addition, the table reflects the timing of principal and interest payments on outstanding borrowings as of June 30, 2013. Additional details regarding these obligations are provided in Note 8 in the “Notes to Consolidated Financial Statements” included in the fiscal year 2013 Annual Report and in Note 5 in the “Notes to Condensed Consolidated Financial Statements” included elsewhere in this Quarterly Report.
| Payments Due by Period | ||||||||||||||||||||
Nine Months Ending March 31, 2014 | Fiscal Year Ending March 31, | |||||||||||||||||||
| Total | 2015— 2016 | 2017— 2018 | 2019 and beyond | |||||||||||||||||
| (In thousands) | ||||||||||||||||||||
| Contractual obligations: | ||||||||||||||||||||
| Long-term debt and short-term borrowings: | ||||||||||||||||||||
Principal (1) | $ | 897,656 | $ | 4,643 | $ | 27,675 | $ | 153,891 | $ | 711,447 | ||||||||||
Interest (2) | 379,991 | 28,400 | 77,394 | 75,550 | 198,647 | |||||||||||||||
Aircraft operating leases (3) | 317,450 | 47,905 | 125,115 | 93,912 | 50,518 | |||||||||||||||
Other operating leases (4) | 69,542 | 6,977 | 13,731 | 10,019 | 38,815 | |||||||||||||||
Pension obligations (5) | 139,785 | 14,859 | 48,605 | 20,086 | 56,235 | |||||||||||||||
Aircraft purchase obligations (6) | 824,371 | 456,084 | 354,516 | 13,771 | — | |||||||||||||||
Other purchase obligations (7) | 41,408 | 41,408 | — | — | — | |||||||||||||||
| Total contractual cash obligations | $ | 2,670,203 | $ | 600,276 | $ | 647,036 | $ | 367,229 | $ | 1,055,662 | ||||||||||
| Other commercial commitments: | ||||||||||||||||||||
| Letters of credit | $ | 2,539 | $ | 1,131 | $ | 1,408 | $ | — | $ | — | ||||||||||
Contingent consideration (8) | 40,000 | 6,000 | 34,000 | — | — | |||||||||||||||
Other commitments (9) | 46,000 | — | 46,000 | — | — | |||||||||||||||
| Total commercial commitments | $ | 88,539 | $ | 7,131 | $ | 81,408 | $ | — | $ | — | ||||||||||
______
(1) | Excludes unamortized discount on the 3% Convertible Senior Notes of $7.9 million. |
(2) | Interest payments for variable interest debt are based on interest rates as of June 30, 2013. |
(3) | Represents separate operating leases for aircraft. During the three months ended June 30, 2013, we entered into two new aircraft operating leases. For further details, see Note 5 in the “Notes to Condensed Consolidated Financial Statements” included elsewhere in this Quarterly Report. |
(4) | Represents minimum rental payments required under operating leases that have initial or remaining non-cancelable lease terms in excess of one year. |
(5) | Represents expected funding for pension benefits in future periods. These amounts are undiscounted and are based on the expectation that the U.K. and Norway pensions will be fully funded in approximately four and three years, respectively. As of June 30, 2013, we had recorded on our balance sheet a $121.5 million pension liability associated with these obligations. The timing of the funding is dependent on actuarial valuations and resulting negotiations with the plan trustees. |
(6) | On July 11, 2013, we entered into an agreement to order 11 AW189 large aircraft with delivery dates in fiscal years 2015 and 2016 and total payment of approximately $209.3 million that are not included in this table. For further details on our aircraft purchase obligations, see Note 5 in the “Notes to Condensed Consolidated Financial Statements” included elsewhere in this Quarterly Report. |
(7) | Other purchase obligations primarily represent unfilled purchase orders for aircraft parts, commitments associated with upgrading facilities at our bases and non-cancelable power-by-the-hour maintenance commitments. |
(8) | The Cougar purchase agreement includes a potential earn-out of $40 million payable over three years based on Cougar achieving certain agreed performance targets. The fair value of the earn-out is $35.9 million as of June 30, 2013 and is included in other liabilities and deferred credits on our condensed consolidated balance sheet. See Note 3 in the “Notes to Condensed Consolidated Financial Statements” included in the fiscal year 2013 Annual Report. |
(9) | In connection with the Bristow Norway acquisition in fiscal year 2009 (see “Part I. Item I. Business — Overview” included in the fiscal year 2013 Annual Report), we granted the former partner in this joint venture an option that if exercised would require us to acquire up to five aircraft at fair value upon the expiration of the lease terms for such aircraft. One of the options was exercised in December 2009 and two of the options expired. The remaining aircraft leases expire in June and August 2014. |
52
Capital Commitments and Other Uses of Cash
We have commitments and options to make capital expenditures over the next five fiscal years to purchase additional aircraft, including aircraft associated with the commitments reflected in the table above. Although a similar number of our existing aircraft may be sold during the same period, the additional aircraft on order are expected to provide incremental fleet capacity in terms of revenue, operating margin and adjusted EBITDAR margin. See Note 5 in the “Notes to Condensed Consolidated Financial Statements” included elsewhere in this Quarterly Report for a detail of the number of aircraft under commitments and options expected to be delivered in the current and subsequent five fiscal years by aircraft size along with the related expenditures, and for a rollforward of aircraft commitments and options through July 11, 2013. During fiscal year 2014, we expect to invest approximately $90 million in various infrastructure enhancements, including aircraft facilities, training centers and technology. Through June 30, 2013, we had incurred approximately $20 million towards these projects.
As discussed under "— Executive Overview — Our Strategy — Capital Allocation Strategy", cash may also be used for dividend payments and repurchases of Common Stock. Additionally, cash may be used in future periods to repurchase debt, including our 3% Convertible Senior Notes.
Financial Condition and Sources of Liquidity
We actively manage our liquidity through generation of cash from operations while assessing our funding needs on an ongoing basis. While we have generated significant cash from operations, our principal source of liquidity over the past several years has been financing cash flows. The significant factors that affect our overall liquidity include capital expenditure commitments, pension funding, operating leases, adequacy of bank lines of credit and our ability to attract long-term capital on satisfactory terms.
We expect that our cash on deposit as of June 30, 2013 of $160.0 million, cash flow from operations and proceeds from aircraft sales, as well as available borrowing capacity under our Revolving Credit Facility will be sufficient to satisfy our capital commitments, including our remaining aircraft purchase commitments of $824.4 million as of June 30, 2013 and our anticipated capital requirements of approximately $825 million in connection with our U.K. SAR contract. The available borrowing capacity under our Revolving Credit Facility was $247.4 million as of June 30, 2013. While we plan to continue to be disciplined concerning future capital commitments, we also intend to continue managing our capital structure and liquidity position with external financings as needed. Our strategy will involve funding our short-term liquidity requirements with borrowings under our Revolving Credit Facility and funding our long-term financing needs, while maintaining a prudent capital structure, among the following alternatives: operating leases, bank debt, private and public debt and/or equity offerings and export credit agency-supported financings.
Critical Accounting Policies and Estimates
See Item 7. “Management’s Discussion and Analysis of Financial Condition and Results of Operations — Critical Accounting Policies and Estimates” in the fiscal year 2013 Annual Report for a discussion of our critical accounting policies. There have been no material changes to our critical accounting policies and estimates provided in the fiscal year 2013 Annual Report.
Recent Accounting Pronouncements
See Note 1 in the “Notes to Condensed Consolidated Financial Statements” included elsewhere in this Quarterly Report for a discussion of recent accounting pronouncements.
Item 3. Quantitative and Qualitative Disclosures about Market Risk.
We are subject to certain market risks arising from the use of financial instruments in the ordinary course of business. This risk arises primarily as a result of potential changes in the fair market value of financial instruments that would result from adverse fluctuations in foreign currency exchange rates, credit risk, and interest rates as discussed in “Item 7A. Quantitative and Qualitative Disclosures About Market Risk” in the fiscal year 2013 Annual Report and Note 1 in the “Notes to Condensed Consolidated Financial Statements” included elsewhere in this Quarterly Report.
Item 4. Controls and Procedures.
Evaluation of Disclosure Controls and Procedures
We carried out an evaluation, under the supervision of and with the participation of our management, including William E. Chiles, our Chief Executive Officer (“CEO”) and Jonathan E. Baliff, our Chief Financial Officer (“CFO”), of the effectiveness of the Company’s disclosure controls and procedures (as defined in Rule 13a-15(e) of the Exchange Act) as of June 30, 2013. Based on that evaluation, our CEO and CFO concluded that such disclosure controls and procedures were effective to ensure that information required to be disclosed in our periodic reports filed under the Exchange Act is recorded, processed, summarized and reported within the time periods specified by the Securities and Exchange Commission’s rules and forms and such information is
53
accumulated and communicated to our management as appropriate to allow for timely decisions regarding required disclosure under the Exchange Act.
Changes in Internal Control Over Financial Reporting
There have been no changes in our internal control over financial reporting during the quarter ended June 30, 2013 that have materially affected or are reasonably likely to materially affect our internal control over financial reporting.
PART II — OTHER INFORMATION
Item 1. Legal Proceedings.
We have certain actions or claims pending that have been discussed and previously reported in Part I. Item 3. “Legal Proceedings” in the fiscal year 2013 Annual Report. Developments in these previously reported matters are described in Note 5 in the “Notes to Condensed Consolidated Financial Statements” included elsewhere in this Quarterly Report.
Item 1A. Risk Factors.
There have been no material changes during the three months ended June 30, 2013 in our “Risk Factors” as discussed in the fiscal year 2013 Annual Report.
Item 2. Unregistered Sales of Equity Securities and Use of Proceeds and Issuer Repurchases of Equity Securities
None.
Item 3. Defaults Upon Senior Securities
Not applicable.
Item 4. Mine Safety Disclosures
Not applicable.
Item 5. Other Information
None.
54
Item 6. Exhibits
The following exhibits are filed as part of this Quarterly Report:
Exhibit Number | Description of Exhibit | ||
| 10.1 | Form of 2013 Employee and Officer Stock Option Award Letter (incorporated by reference to Exhibit 10.1 to the Company's Current Report on Form 8-K dated June 10, 2013). | ||
| 10.2 | Form of 2013 Officer Restricted Stock Unit Award Letter (incorporated by reference to Exhibit 10.2 to the Company's Current Report on Form 8-K dated June 10, 2013). | ||
| 10.3 | Form of 2013 Officer Performance Cash Award Letter (incorporated by reference to Exhibit 10.3 to the Company's Current Report on Form 8-K dated June 10, 2013). | ||
| 10.4 | Bristow Group Inc. Fiscal Year 2014 Annual Incentive Compensation Plan (incorporated by reference to Exhibit 10.4 to the Company's Current Report on Form 8-K dated June 10, 2013). | ||
| 10.5 | Supplement to Bristow Group Inc. Fiscal Year 2014 Annual Incentive Compensation Plan (incorporated by reference to Exhibit 10.5 to the Company's Current Report on Form 8-K dated June 10, 2013). | ||
| 10.6 | Third Amendment to Amended and Restated Revolving Credit and Term Loan as of April 29, 2013 (incorporated by reference to Exhibit 10.1 to the Company's Current Report on Form 8-K dated April 29, 2013). | ||
| 15.1* | Letter from KPMG LLP dated August 5, 2013, regarding unaudited interim information. | ||
| 31.1** | Rule 13a-14(a) Certification by Chief Executive Officer of Registrant. | ||
| 31.2** | Rule 13a-14(a) Certification by Chief Financial Officer of Registrant | ||
| 32.1** | Certification of Chief Executive Officer of Registrant pursuant to 18 U.S.C. Section 1350, as adopted pursuant to Section 906 of the Sarbanes-Oxley Act of 2002. | ||
| 32.2** | Certification of Chief Financial Officer of Registrant pursuant to 18 U.S.C. Section 1350, as adopted pursuant to Section 906 of the Sarbanes-Oxley Act of 2002. | ||
| 101.INS | XBRL Instance Document. | ||
| 101.SCH | XBRL Taxonomy Extension Schema Document. | ||
| 101.CAL | XBRL Taxonomy Extension Calculation Linkbase Document. | ||
| 101.DEF | XBRL Taxonomy Extension Definition Linkbase Document. | ||
| 101.LAB | XBRL Taxonomy Extension Labels Linkbase Document. | ||
| 101.PRE | XBRL Taxonomy Extension Presentation Linkbase Document. | ||
| * | Filed herewith. | ||
| ** | Furnished herewith. | ||
55
SIGNATURES
Pursuant to the requirements of the Securities Exchange Act of 1934, the registrant has duly caused this report to be signed on its behalf by the undersigned thereunto duly authorized.
| BRISTOW GROUP INC. | ||
| By: | /s/ Jonathan E. Baliff | |
Jonathan E. Baliff Senior Vice President and Chief Financial Officer | ||
| By: | /s/ Brian J. Allman | |
Brian J. Allman Vice President, Chief Accounting Officer | ||
August 5, 2013
56
Index to Exhibits.
Exhibit Number | Description of Exhibit | |
| 10.1 | Form of 2013 Employee and Officer Stock Option Award Letter (incorporated by reference to Exhibit 10.1 to the Company's Current Report on Form 8-K dated June 10, 2013). | |
| 10.2 | Form of 2013 Officer Restricted Stock Unit Award Letter (incorporated by reference to Exhibit 10.2 to the Company's Current Report on Form 8-K dated June 10, 2013). | |
| 10.3 | Form of 2013 Officer Performance Cash Award Letter (incorporated by reference to Exhibit 10.3 to the Company's Current Report on Form 8-K dated June 10, 2013). | |
| 10.4 | Bristow Group Inc. Fiscal Year 2014 Annual Incentive Compensation Plan (incorporated by reference to Exhibit 10.4 to the Company's Current Report on Form 8-K dated June 10, 2013). | |
| 10.5 | Supplement to Bristow Group Inc. Fiscal Year 2014 Annual Incentive Compensation Plan (incorporated by reference to Exhibit 10.5 to the Company's Current Report on Form 8-K dated June 10, 2013). | |
| 10.5 | Third Amendment to Amended and Restated Revolving Credit and Term Loan as of April 29, 2013 (incorporated by reference to Exhibit 10.1 to the Company's Current Report on Form 8-K dated April 29, 2013). | |
| 15.1* | Letter from KPMG LLP dated August 5, 2013, regarding unaudited interim information. | |
| 31.1** | Rule 13a-14(a) Certification by Chief Executive Officer of Registrant. | |
| 31.2** | Rule 13a-14(a) Certification by Chief Financial Officer of Registrant | |
| 32.1** | Certification of Chief Executive Officer of Registrant pursuant to 18 U.S.C. Section 1350, as adopted pursuant to Section 906 of the Sarbanes-Oxley Act of 2002. | |
| 32.2** | Certification of Chief Financial Officer of Registrant pursuant to 18 U.S.C. Section 1350, as adopted pursuant to Section 906 of the Sarbanes-Oxley Act of 2002. | |
| 101.INS | XBRL Instance Document. | |
| 101.SCH | XBRL Taxonomy Extension Schema Document. | |
| 101.CAL | XBRL Taxonomy Extension Calculation Linkbase Document. | |
| 101.DEF | XBRL Taxonomy Extension Definition Linkbase Document. | |
| 101.LAB | XBRL Taxonomy Extension Labels Linkbase Document. | |
| 101.PRE | XBRL Taxonomy Extension Presentation Linkbase Document. | |
| * | Filed herewith. | |
| ** | Furnished herewith. | |
57