 First Quarter FY 2012 Earnings Presentation Bristow Group Inc. August 9, 2011 Exhibit 99.1 |
 2 First quarter earnings call agenda Introduction CEO remarks and operational highlights Current and future financial performance - FY12 Q1 Financial discussion - Introduction of Client Promise, LACE rate and BVA Closing remarks Questions and answers Linda McNeill, Director Investor Relations Bill Chiles, President and CEO Jonathan Baliff, SVP and CFO Bill Chiles, President and CEO |
 3 Forward-looking statements This presentation may contain “forward-looking statements” within the meaning of the Private Securities Litigation Reform Act of 1995. Forward-looking statements include statements about our future business, operations, capital expenditures, fleet composition, capabilities and results; modeling information, earnings guidance, expected operating margins and other financial projections; future dividends; plans, strategies and objectives of our management, including our plans and strategies to grow earnings and our business, our general strategy going forward and our business model; expected actions by us and by third parties, including our customers, competitors and regulators; our use of excess cash; the valuation of our company and its valuation relative to relevant financial indices; assumptions underlying or relating to any of the foregoing, including assumptions regarding factors impacting our business, financial results and industry; and other matters. Our forward-looking statements reflect our views and assumptions on the date of this presentation regarding future events and operating performance. They involve known and unknown risks, uncertainties and other factors, many of which may be beyond our control, that may cause actual results to differ materially from any future results, performance or achievements expressed or implied by the forward-looking statements. These risks, uncertainties and other factors include those discussed under the captions “Risk Factors” and “Management’s Discussion and Analysis of Financial Condition and Results of Operations” in our Annual Report on Form 10-K for the fiscal year ended March 31, 2011 and our Quarterly Report on Form 10-Q for the quarter ended June 30, 2011. We do not undertake any obligation, other than as required by law, to update or revise any forward-looking statements, whether as a result of new information, future events or otherwise. |
 4 Chief Executive comments Bill Chiles, President and CEO |
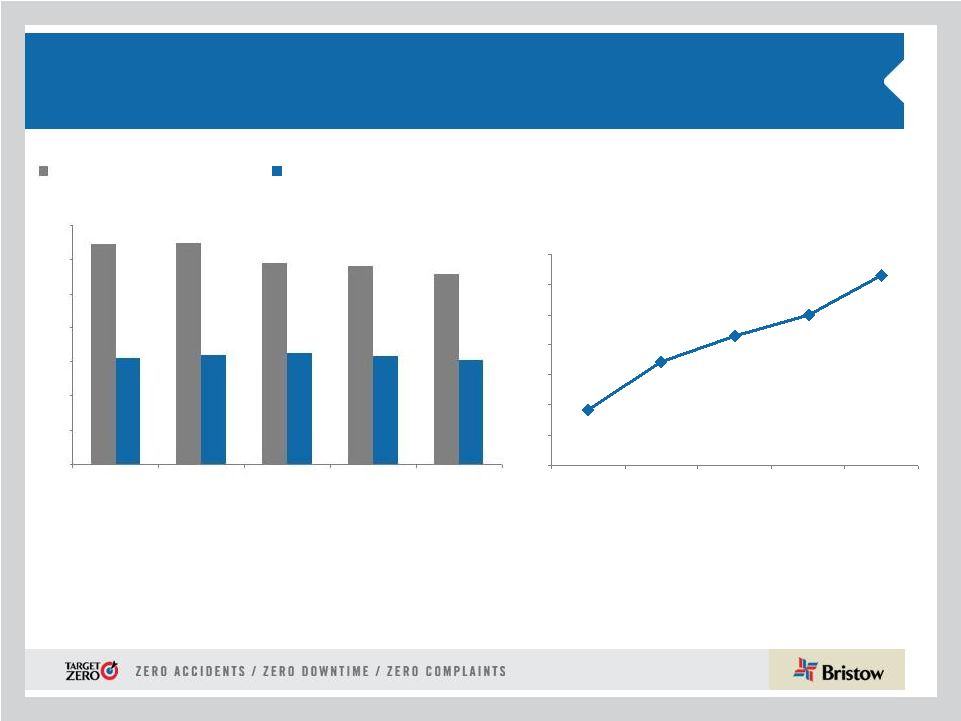
 5 Operational safety review 0.40 0.32 0.38 0.33 0.34 0.34 0.31 0.28 0.43 0.00 0.00 0.25 0.00 0.50 1.00 J A S O N D J F M A M J 1.17 0.78 0.78 0.00 0.00 0.00 0.54 0.00 1.00 2.00 2006 2007 2008 2009 2010 2011 Q1 2012 * Includes consolidated commercial operations only 0.16 0.13 0.16 0.14 0.13 0.15 0.14 0.13 0.23 0.00 0.00 0.25 0.00 0.10 0.20 0.30 0.40 0.50 J A S O N D J F M A M J Total Reportable Injury Rate per 200,000 man- hours (cumulative) Lost Work Case Rate per 200,000 man-hours (cumulative) Air Accident Rate* per 100,000 Flight Hours (Fiscal Year) FY11 FY12 FY11 FY12 |
 6 Q1 FY12 highlights • Quarterly performance similar to Q1 FY11 and was impacted by front- loaded costs primarily due to compensation • Bristow reaffirms earnings per share guidance for the full FY12 of $3.55 to $3.90 • FY12 LACE Rate guidance range initiated at $7.20 - $7.50M per Large AirCraft Equivalent (LACE) aircraft • Significant Other International Business Unit (OIBU) growth plus new contracts worldwide highlight strength in FY12 and beyond • Q1 Operating revenue of $286.8M (5% increase from Q1 FY11, 5% increase from Q4 FY11) • Q1 adjusted EPS * of $0.54 (same as Q1 FY11, 37% decrease from Q4 FY11) • Q1 GAAP EPS of $0.57 (same as Q1 FY11, 32% decrease from Q4 FY11) • Q1 adjusted operating income * of $35M (8% decrease from Q1 FY11, 30% decrease from Q4 FY11) • Q1 adjusted EBITDA * of $58.1M (same as Q1 FY11, 21% decrease from Q4 FY11) • Q1 Operating cash flow of $52.9M (106% increase from Q1 FY11, 47% increase from Q4 FY11) * Adjusted EPS, adjusted operating income and adjusted EBITDA amounts exclude gains and losses on dispositions of assets and any special items during the period. See reconciliation of these items to GAAP in our earnings release for the quarter ended June 30 , 2011 th |
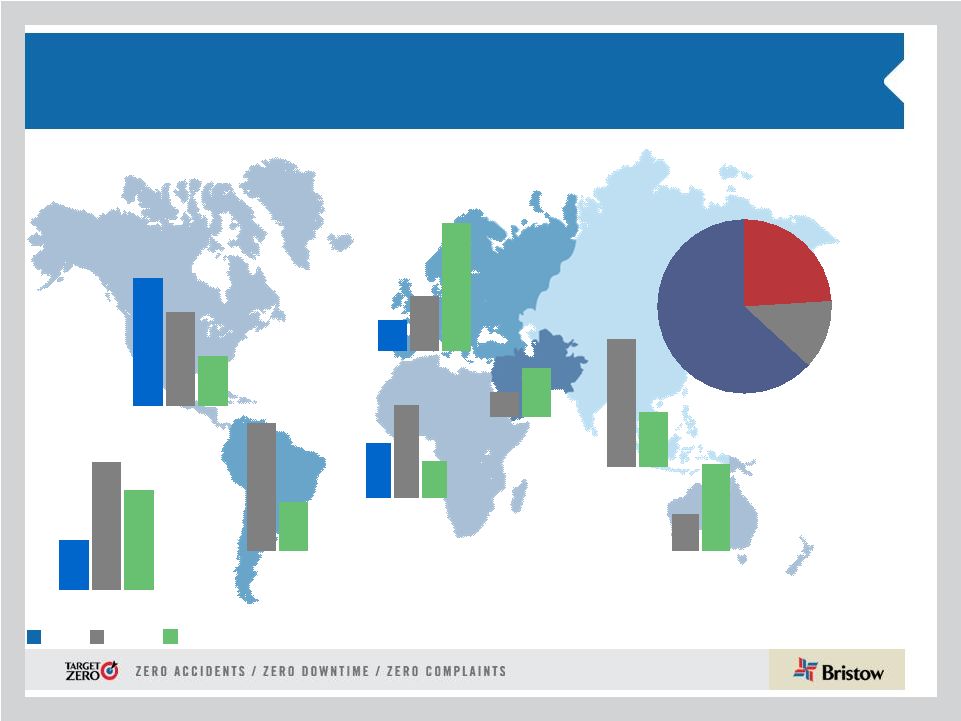
 7 • Brent remains above $100 in the face of EIA (U.S. Energy Information Administration) reserve release in April 2011 and the weak global economy • By the end of 2011, Global Exploration & Production (E&P) spending will have reached the 2008 pre-recession level of $500 billion • This E&P confidence is reflected in improved helicopter tender activity, principally for FY12/13 work and gives us a positive outlook for our business • More than 80 % of global E&P spending is Non-US, with Brazil, West Africa and Southeast Asia as the front runners with a growth rate of 11% • 55% of our fleet and 86% of our operating revenue comes from international markets Current market environment Source: Barclays Capital Research and PFC Energy June 2011 |
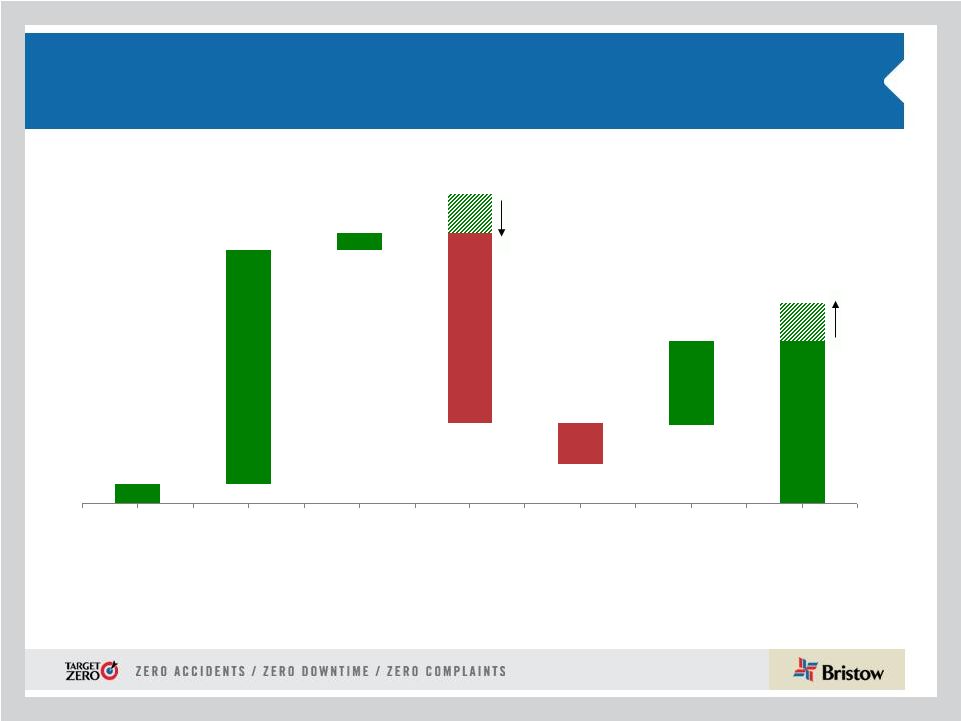
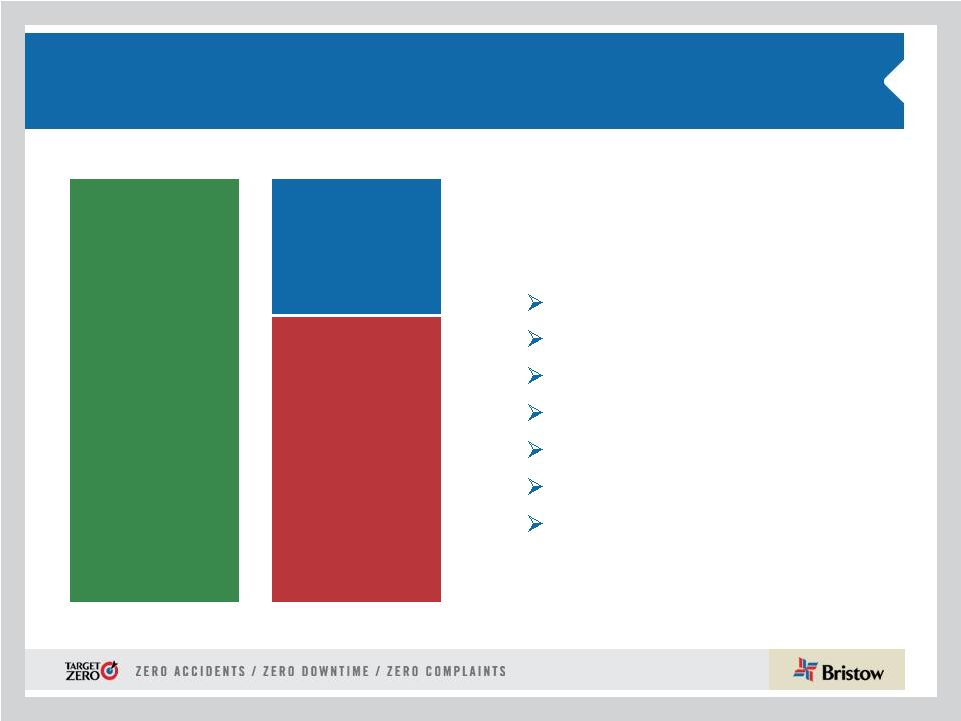
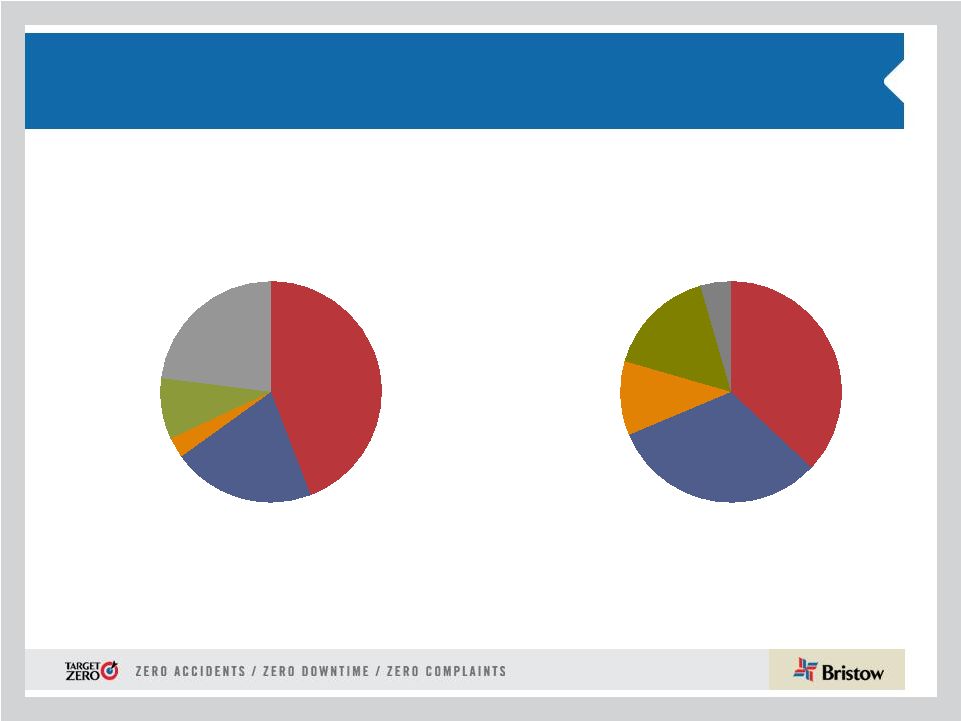 8 Operating Income* Q1 FY11 Australia 16% North America 11% West Africa 32% Europe 37% Other International 4% Operating Income* Q1 FY12 North America 3% West Africa 21% Europe 44% Other International 23% Australia 9% Quarter-over-quarter changes in Operating Income Total Operating income for Q1 FY12 is $36.4M Total operating income for Q1 FY11 is $39.7M * Excludes centralized operations, corporate, gain on disposals of assets, and Bristow Academy |
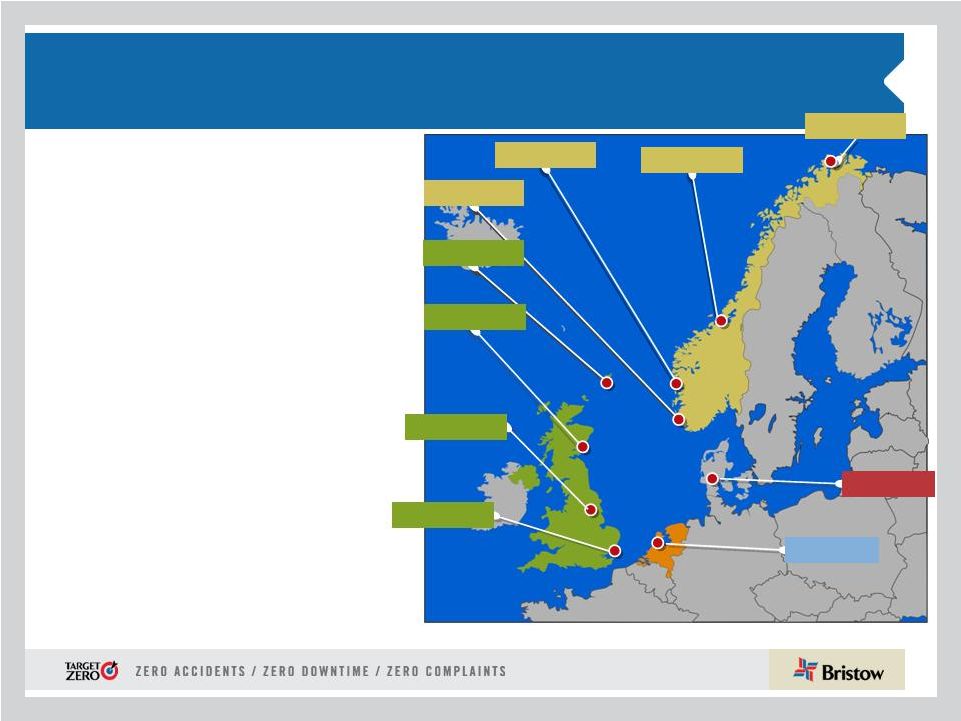 9 • Europe represents 38% of total operating revenue in Q1 FY12 and 44% of operating income • Operating margin of 21.5% vs 21.4% in prior year quarter • European oil and gas continues to grow with new entrants, despite experts predictions that a rapid decline would set in • Front-loaded compensation costs • Salary costs in Norway and labor costs associated with hard landing in NNS Outlook: • New incremental work • UK Gap SAR and SARH • Norway SAR • FBH contracts Operating margin expected for FY12 to be ~ low twenties Europe (EBU) UK Netherlands Norway Norwich Aberdeen Scasta Stavanger Den Helder Bergen Hammerfest Esbjerg Humberside Kristiansund |
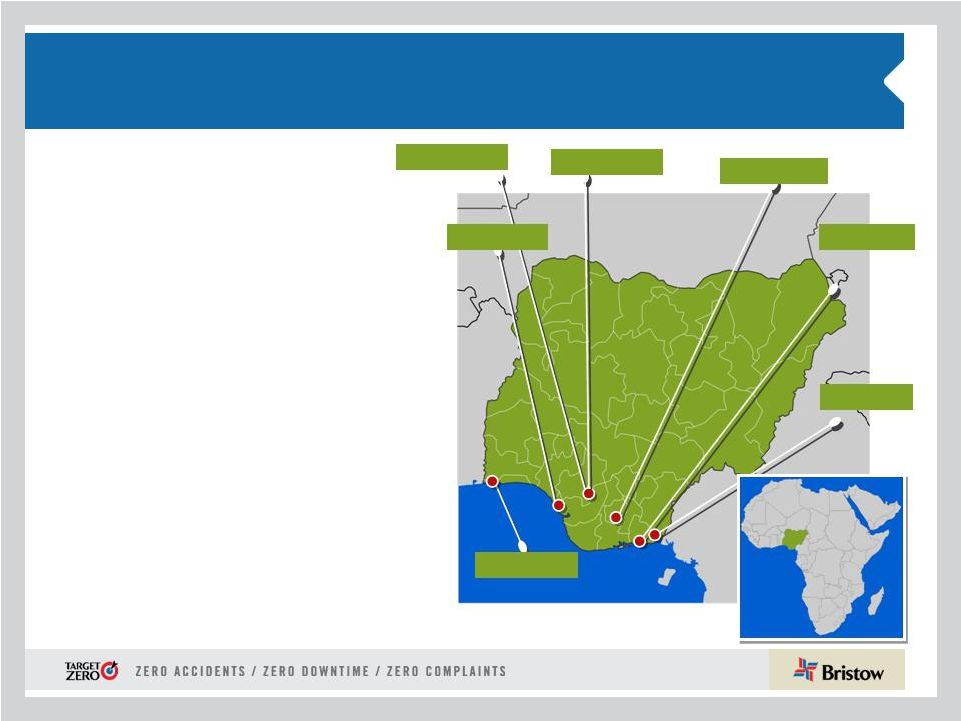 10 West Africa (WASBU) Nigeria Lagos Escravos Port Harcourt Warri Osubi Eket Calabar • Nigeria represents 18% of total operating revenue in Q1 FY12 and 21% of operating income • Operating revenue of $52.3M decreased from $57.7M in Q1 FY11 • Operating income decreased to $11.2M from $15.6M • Operating margin of 21.5% vs 27.1% in prior year quarter • Increased operating expense in Q1 FY12 related to compensation, new a/c depreciation, and other expenses. Outlook: • Introduction of large new technology aircraft to market place • Restructuring continues Operating margin expected in FY12 to be back in the ~ low to mid twenties Warri Texaco |
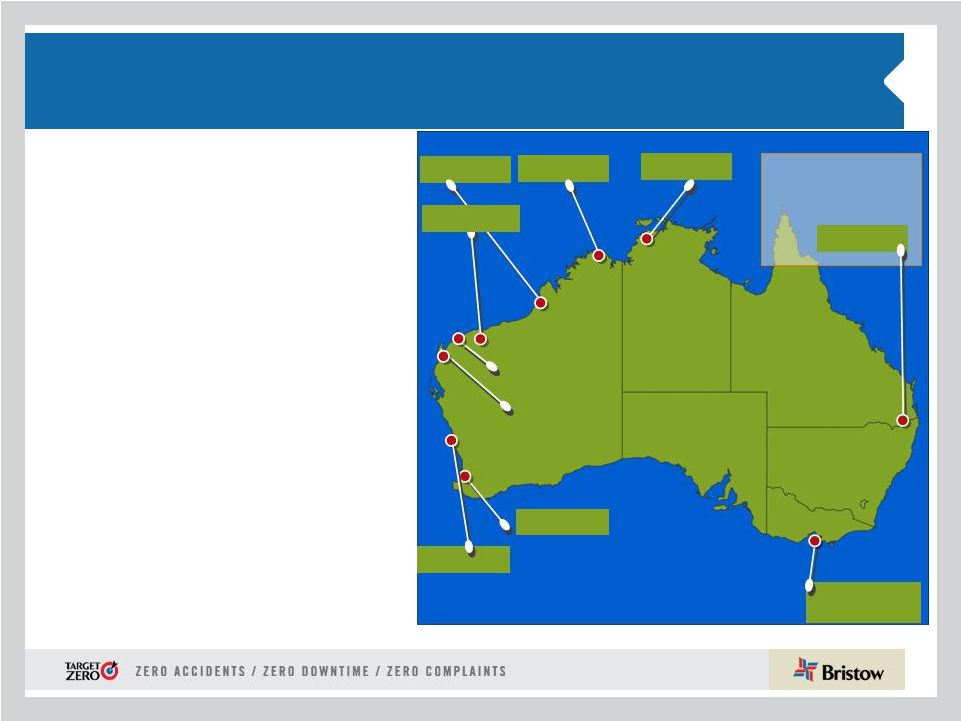 11 Exmouth Learmonth Varanus Is Barrow Is Australia (AUSBU) Australia Perth Dongara Essendon Tooradin Broome Truscott Darwin BDI provide support to the Republic of Singapore Air Force Oakey • Australia represented 14% of total operating revenue in Q1 FY12 and 9% of operating income • Operating revenue of $40.9M increased from $33.8M primarily due to a favorable currency exchange rate • Operating income decreased from $8M in Q1 FY11 to $4.5M in Q1 FY12 • Introduction of new a/c type • Increase in training and salary costs • Operating margin 11.1% vs 23.6% for the prior year quarter • Training costs which are not expected to recur on the same level and increase in depreciation Outlook: • Work shifted toward the second half of the fiscal year Operating margin expected for FY12 to be ~ low teens Karratha |
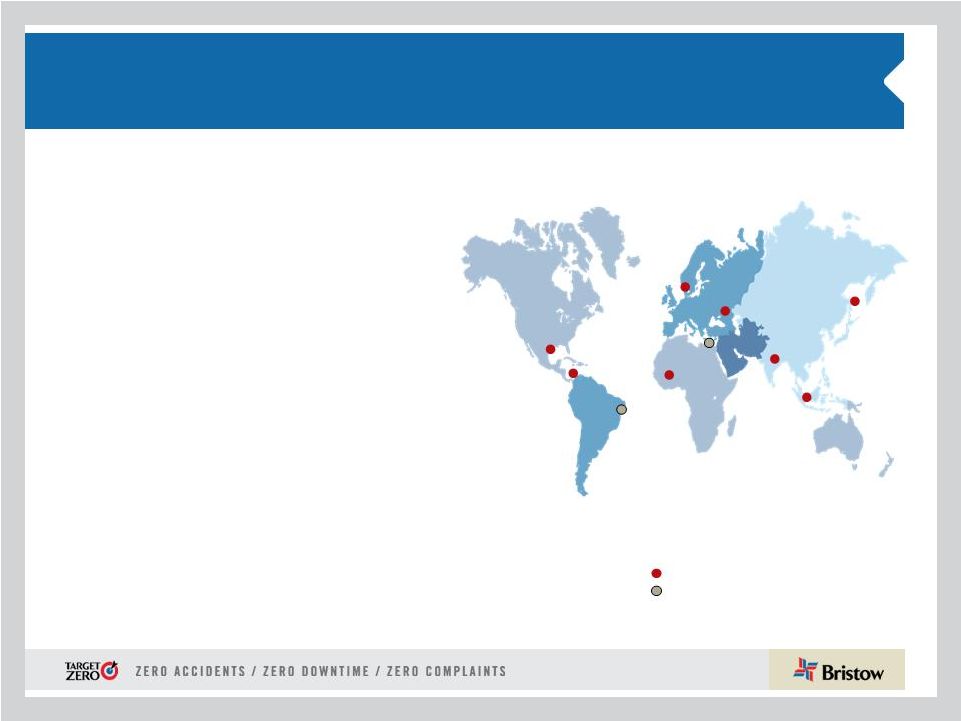 12 Other International (OIBU) Consolidated in OIBU Unconsolidated Affiliate • OIBU represented 12% of total operating revenue and 23% of operating income for Q1 FY12 • Operating revenue increased to $34.5M from $32.6M • Operating income increased to $11.9M from $2.3M • Operating margin increased to 34.5% vs 6.9% in the prior year quarter • Significant increased revenue from Suriname, Brazil, Ghana, Trinidad and Russia • The remaining interest in Heliservicio was sold in July but we will continue to dry lease aircraft Outlook: • Africa is flourishing market on the activity forefront • Potential expansion to Indonesia • LIDER has been officially qualified by Petrobras as best bid on 14 medium a/c, with 7 a/c starting work September 2011 Expect operating margin in FY12 to be ~mid twenties |
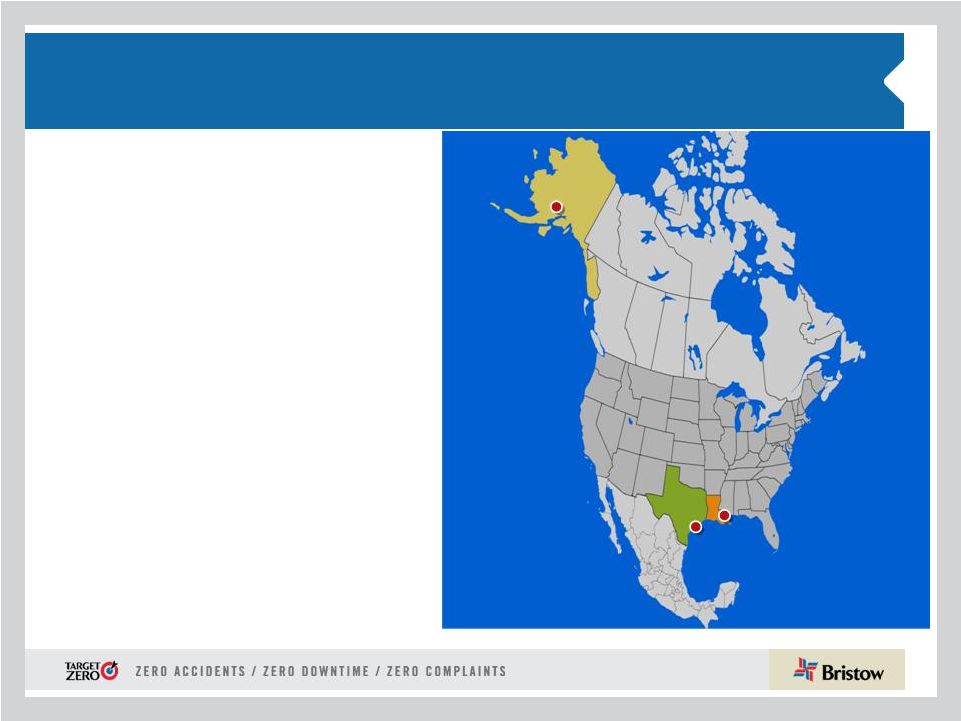 13 North America (NABU) • Operating revenue fell to $43.9M from $52.1M and represented 15% of total operating revenue; • Operating income of $1.6M vs. $5.3M in the prior year quarter • Operating margin of 3.6% declined from 10.2% in the prior year quarter • 22% sequential flight hour increase (from 16,741 hours in Q4 FY11 to 20,434 in Q1 FY12) • We achieved price increases on contract renewals Outlook: • Permits beginning to be issued resulting in additional aircraft requests from clients • Large aircraft demand slowly increasing • Continued restructuring to bring down the fixed costs Expect operating margins for remainder of FY12 to remain in the single digits |
 14 Financial discussion Jonathan Baliff, SVP and CFO |
 15 Financial highlights - Adjusted EPS & EBITDA* Summary Q1 FY11 to Q1 FY12 adjusted EPS bridge Q1 FY11 to Q1 FY12 adjusted EBITDA bridge (in millions) * Adjusted EPS, adjusted operating income and adjusted EBITDA amounts exclude gains and losses on dispositions of assets and any special items during the period. See reconciliation of these items to GAAP in our earnings release for the quarter ended June 30 , 2011 th $0.54 $0.54 $0.01 $0.04 $0.05 $0.10 Q1FY2011 Operations Corporate and Other Taxes FX Changes Q1FY2012 $58.1 $58.1 $4.7 $2.1 $6.8 Q1FY2011 Operations Corporate and Other FX Changes Q1FY2012 |
 16 56 27 19 5 24 9 6 6 14 29 9 4 8 North America Brazil, Colombia Mexico, Trinidad Nigeria, Ghana Equatorial Guinea Europe Caspian, Mid-East Libya, East Africa Malaysia, Thailand Indonesia Australia Small Medium Large Total Opportunities * 113 Wider scope of Bristow five year growth opportunities… 442 aircraft Chart shows specific customer opportunities identified by Bristow as of May 2011 30 42 26 77 24 56 162 224 Total Aircraft Opportunities New replacement aircraft Existing aircraft New growth aircraft 107 56 279 |
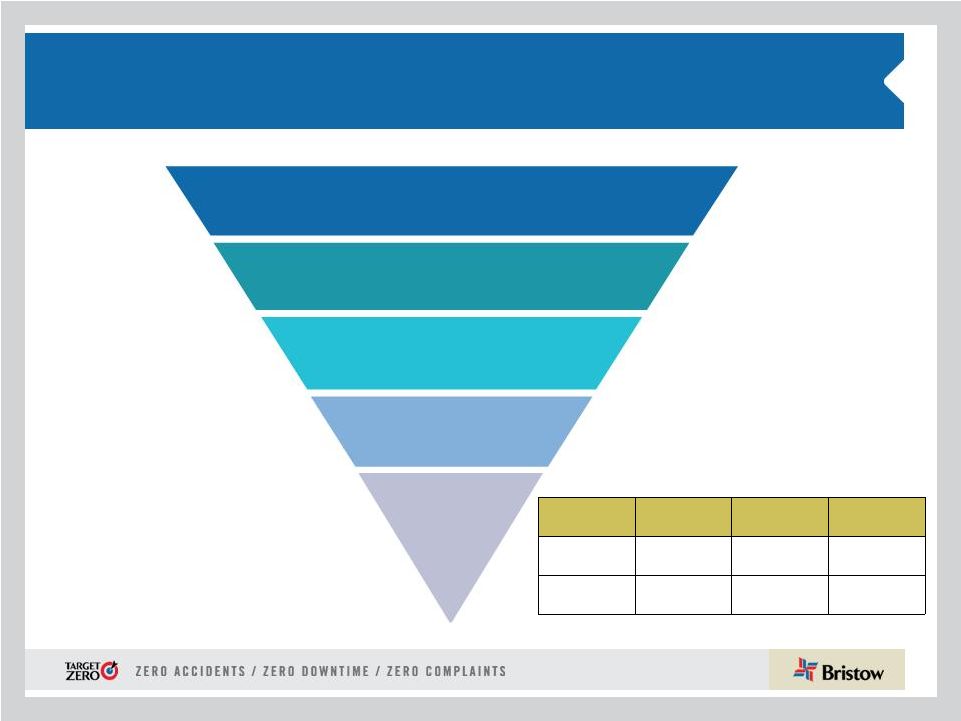 17 Identified opportunities for the next five years while maximizing optionality large medium small Orders* 11 0 0 Options* 24 15 0 *As of June 30, 2011 442 aircraft opportunities identified 67 built into 5 year plan 11 on order 335 demand for New aircraft 112 expected win rate based on market share |
 18 116 497 103 1,378 238 1,121 735 FY11 balance Operating cash flow Asset sales Aircraft purchases Other capex Maintain optimal capital structure Available for dividend/ growth/other capital return Five year cumulative cash projection with over $700 million available for further growth and capital return Operating leases Operating leases |
 19 Introduction of Client Promise, LACE & BVA Jonathan Baliff, SVP and CFO |
 20 We Have Enhanced Our Focus on Value Client Promise LACE Rate Bristow Value Added Creating client value through differentiation Driving and communicating utilization and revenue productivity Delivering shareholder return above our cost of capital |
 21 The Client Promise: value through differentiation Target Zero accidents, downtime and complaints programs deliver value to operators. More zero-accident flight hours than anyone, more uptime than anyone, and hassle-free service creates confidence in flight. Worldwide. Lowers client’s offshore operating costs and improves productivity. Earns us more business to improve BVA. |
 22 Introduction to LACE and the LACE Rate – Large Aircraft Equivalent (LACE) – “LACE” normalizes revenue and is functionally similar to BOE in the E&P business – “LACE” combines Large, Medium and Small aircraft into a simple and similar form of revenue producing asset – “LACE Rate”, Revenue/LACE, will become the “Day Rate” equivalent for our business LACE Math 100% per # of Large Aircraft +50% per # of Medium Aircraft +25% per # of Small Aircraft = Total # of LACE Aircraft x LACE Rate (Revenue/LACE) = Revenue |
 23 LACE and LACE Rate Historical Trends LACE and LACE Rate excludes Bristow Academy, affiliate aircraft, aircraft held for sale, aircraft construction in progress, and reimbursable revenue *LACE calculated for end of year LACE Rate (Annual) (in millions) $4.92 $5.72 $6.14 $6.49 $7.15 $4.00 $4.50 $5.00 $5.50 $6.00 $6.50 $7.00 $7.50 FY07 FY08 FY09 FY10 FY11 323 324 295 290 279 156 161 164 159 153 0 50 100 150 200 250 300 350 FY07 FY08 FY09 FY10 FY11 Conslidated commercial aircraft Large Aircraft Equivalent (LACE*) |
 24 Phase II guidance roll out * Guidance is for average yearly LACE and excludes Bristow Academy, A/C held for sale, CIP, and reimbursable revenue Phase I • EPS guidance range (as of May 11, 2011; reaffirmed today) $3.55 - $3.90, excluding effects of asset dispositions and special items • Depreciation and amortization expense ~$85 – $90 million • SG & A expense ~ $135 - $140 million • Interest expense ~ $37 - $42 million • Tax ~ 20% - 24 % (assuming revenue earned in same regions and same mix) Phase II • FY12 LACE* (Large Aircraft Equivalent) = 156 • FY12 LACE Rate = Revenue/LACE* = $7.20 to $7.50 million per LACE aircraft per year |
 25 Introducing BVA, Bristow Value Added • BVA is the key measure to define financial success. • BVA is robust enough to capture: Revenue/Pricing After Tax Margins Asset Intensity Reinvestment Rate Differentiation Sustainability Risk Gross Cash Flow Adjusted After Tax Operating Cash Flow Bristow Value Added Capital Charge Gross Operating Assets X Required Return % |
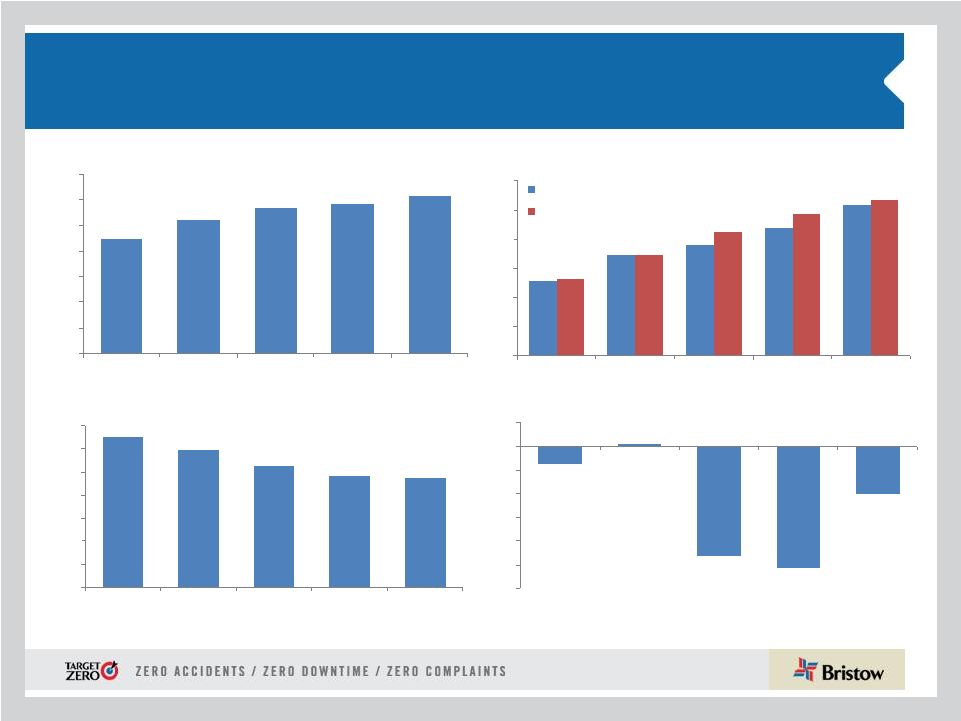 Financial Indicators and BVA Trends Gross Operating Asset Intensity ($ of revenue/$ of asset) 0.47 0.49 0.53 0.59 0.65 0.00 0.10 0.20 0.30 0.40 0.50 0.60 0.70 FY07 FY08 FY09 FY10 FY11 Gross Revenue (in millions) $898 $1,040 $1,134 $1,168 $1,233 $0 $200 $400 $600 $800 $1,000 $1,200 $1,400 FY07 FY08 FY09 FY10 FY11 Gross Cash Flow and Capital Charge (in millions) $128 $174 $189 $218 $257 $132 $173 $212 $244 $267 $0 $50 $100 $150 $200 $250 $300 FY07 FY08 FY09 FY10 FY11 GCF Capital Charge Bristow Value Added (BVA) (in millions) ($3.6) $0.5 ($23.1) ($25.6) ($10.1) ($30.0) ($25.0) ($20.0) ($15.0) ($10.0) ($5.0) $0.0 $5.0 FY07 FY08 FY09 FY10 FY11 26 Note: BVA for Bristow Consolidated excluding the impact of Strategic Equity Investments (e.g. Lider etc). BVA is the sum of the four fiscal quarters in each year. Presentation of gross cash flow and gross operating asset data is in the Appendix |
 27 Driving BVA… Driving Shareholder Value The Client Promise Investing in Fleet Expansion Cost Efficiency Capital Productivity Strategic Initiative Changes in BVA ($) Shareholder Total Return ($) LACE Rate ($ per aircraft per year) LACE (aircraft) Gross Cash Flow Margin (%) Asset Intensity (%) Revenue ($) BVA Margin ($) = Lace = Large A/C Equivalents LACE Rate = Revenue per LACE Gross Cash Flow Margin Asset Intensity Charge = (EBITDAR less Tax) over Revenue = (Required Return times Gross Operating Assets) over Revenue |
 28 Conclusions • Front-loaded compensation, professional, and training costs in the first quarter masked significant growth in the Other International Business Unit • Reaffirmation of annual EPS guidance of $3.55 - $3.90 for this fiscal year • Dividend of $0.15 approved for payment on September 12, 2011 • Client Promise, LACE and BVA initiatives demonstrate our commitment and innovation with our clients and shareholders to create value Analyst Day on November 10, 2011 in New York |
 29 Appendix |
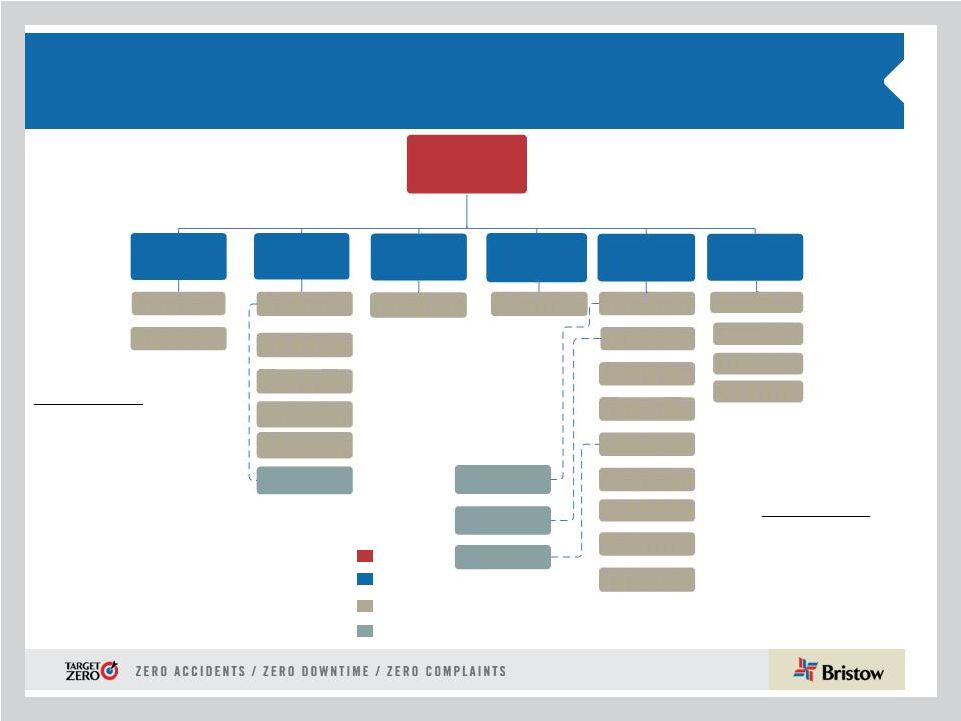 30 Organizational Chart - as of June 30, 2011 Business Unit Corporate Region Joint Venture Key Operated Aircraft Bristow owns and/or operates 372 aircraft as of June 30, 2011 Bristow NABU 15%* AUSBU 14% EBU 38% WASBU 18% OIBU 12% BRS Academy 2% (* % of Q1 FY12 Total Operating Revenue) U.S. GoM – 81/7 Alaska – 14/3 UK – 35/4 Netherlands – 5/1 Norway – 14/3 Denmark – 1/1 Ireland – 1/1 FBH - 64 Nigeria – 49/7 HC - 13 Lider - 77 PAS - 45 Australia – 32/10 Mexico – 18/5 Brazil – 6/9 Trinidad – 8/1 Russia – 7/3 Egypt – –/– India – 1/2 Turkmenistan – 2/1 Malaysia – 5/2 Other –19/1 Florida – 52/1 Louisiana – 13/1 California – 6/1 U.K. – 3/1 Affiliated Aircraft Bristow affiliates and joint ventures operate 199 aircraft as of June 30, 2011 ( # of Aircraft / # of Locations) (No. of aircraft) |
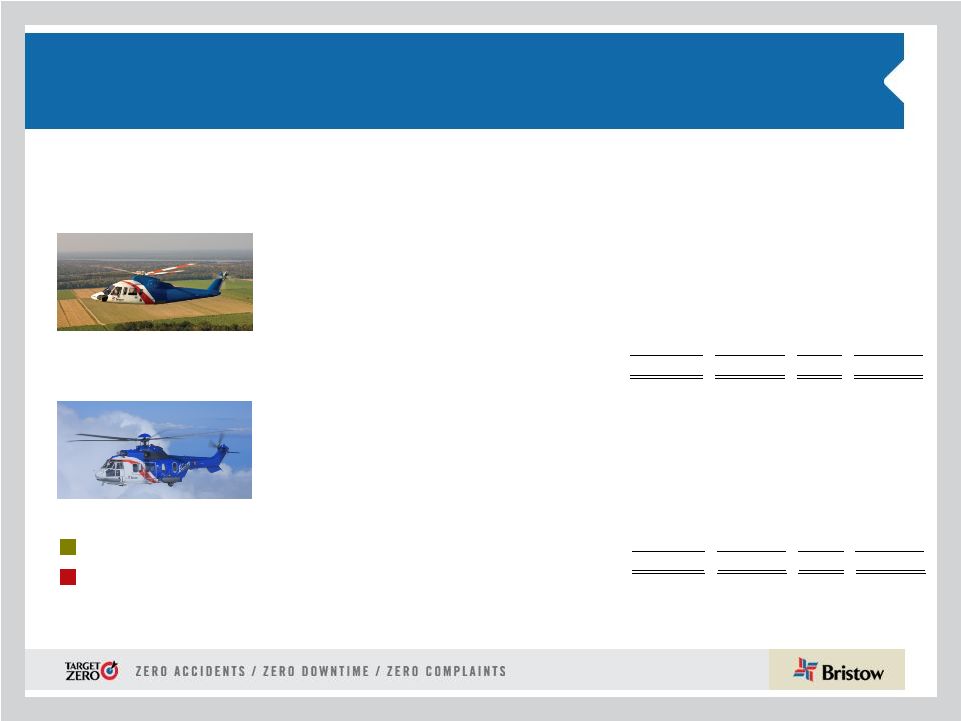 31 Aircraft Fleet – Medium and Large As of June 30, 2011 Next Generation Aircraft Medium capacity 12-16 passengers Large capacity 18-25 passengers Mature Aircraft Models Aircraft Type No. of PAX Engine Consl Unconsl Total Ordered Large Helicopters AS332L Super Puma 18 Twin Turbine 30 - 30 - Bell 214ST 18 Twin Turbine - - - - EC225 25 Twin Turbine 17 - 17 3 Mil MI 8 20 Twin Turbine 7 - 7 - Sikorsky S-61 18 Twin Turbine 2 - 2 - Sikorsky S-92 19 Twin Turbine 23 1 24 8 79 1 80 11 LACE 73 Medium Helicopters AW139 12 Twin Turbine 7 2 9 - Bell 212 12 Twin Turbine 3 14 17 - Bell 412 13 Twin Turbine 39 31 70 - EC155 13 Twin Turbine 4 - 4 - Sikorsky S-76 A/A++ 12 Twin Turbine 20 7 27 - Sikorsky S-76 C/C++ 12 Twin Turbine 54 27 81 - 127 81 208 - LACE 59 |
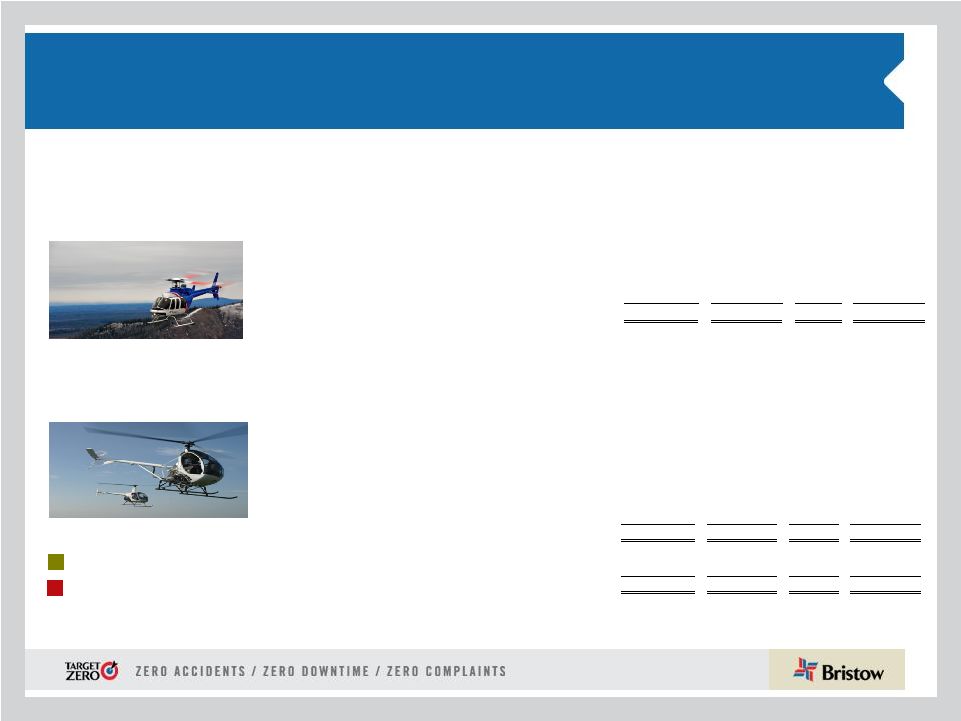 32 Aircraft Fleet – Small, Training and Fixed As of June 30, 2011 (continued) Next Generation Aircraft Mature Aircraft Models Small capacity 4-7 passengers Training capacity 2-6 passengers Aircraft Type No. of PAX Engine Consl Unconsl Total Ordered Small Helicopters Bell 206B 4 Turbine 2 2 4 - Bell 206 L-3 6 Turbine 4 6 10 - Bell 206 L-4 6 Turbine 31 2 33 - Bell 407 6 Turbine 42 1 43 - BK 117 7 Twin Turbine 2 - 2 - BO-105 4 Twin Turbine 2 - 2 - EC135 7 Twin Turbine 6 3 9 - 89 14 103 - LACE 22 * LACE does not include held for sale, training and fixed wing helicopters Training Helicopters AS355 4 Twin Turbine 3 - 3 - Bell 206B 6 Single Engine 8 - 8 - Robinson R22 2 Piston 12 - 12 - Robinson R44 2 Piston 2 - 2 - Sikorsky 300CB/Cbi 2 Piston 48 - 48 - AS350BB 4 Turbine - 36 36 - Agusta 109 8 Twin Turbine - 2 2 - AW139 12 Twin Turbine - 3 3 - Bell 212 12 Twin Turbine - 8 8 - Bell 412 13 Twin Turbine - 15 15 - Fixed Wing 1 - 1 - 74 64 138 - - Fixed Wing 3 39 42 - Total 372 199 571 11 TOTAL LACE (Large Aircraft Equivalent)* 154 11 |
 33 Consolidated Fleet Changes and Aircraft Sales for Q1 FY12 # of A/C Sold Cash Received* Gain/ Loss* Q1 FY 12 3 2,478 1,525 Totals 3 2,478 1,525 * Amounts stated in thousands Q 1 FY12 Total Fleet Count Beginning Period 373 373 Delivered EC225 2 2 0 Total Delivered 2 2 Removed Sales (3) (3) Other* - Total Removed (3) (3) 372 372 * Includes net lease returns and commencements |
 34 Gross Cash Flow Presentation (in millions) Gross Cash Flow Reconciliation FY2007 FY2008 FY2009 FY2010 FY2011 Net Income 74 104 123 112 132 Depreciation and Amortization 43 54 66 75 91 Interest Expense 11 24 35 42 46 Interest Income (9) (13) (6) (1) (1) Rent 19 23 21 18 29 Other Income/expense-net 9 (2) (3) (3) 4 Earnings of Discontinued Operations 0 4 0 0 0 Gain/loss on Asset Sale (11) (9) (45) (19) (10) Tax Effect from Special Items 2 2 10 4 (15) Earnings (losses) from Unconsolidated Affiliates, Net (11) (13) (13) (12) (20) Non-controlling Interests 1 (0) 2 1 1 Gross Cash Flow $128 $174 $189 $218 $257 |
 35 Gross Operating Asset Presentation (in millions) Adjusted Gross Operating Assets Reconciliation FY2007 FY2008 FY2009 FY2010 FY2011 Total Assets 1,506 1,977 2,335 2,495 2,663 Accumulated Depreciation 300 317 351 404 446 Capitalized Operating Leases 61 63 90 97 132 Cash and Cash Equivalents (184) (290) (301) (78) (116) Assets from Discontinued Operations (26) 0 0 0 0 Investment in Unconsolidated Entities (47) (52) (20) (205) (209) Goodwill (7) (16) (45) (32) (32) Prepaid Pension Cost 0 0 0 0 0 Intangibles (3) (3) (10) (9) (7) Assets Held for Sale: Net (8) (6) (4) (17) (32) Assets Held for Sale: Gross 13 11 11 39 71 Accounts Payable (40) (50) (45) (49) (57) Accrued Maintenance and Repairs (12) (13) (10) (11) (16) Other Accrued Taxes (9) (2) (3) (3) (4) Accrued Wages, Benefits and Related Taxes (36) (36) (40) (36) (35) Other Accrued Liabilities (17) (22) (20) (15) (20) Income Taxes Payable (3) (6) 0 (2) (3) Deferred Revenue (16) (15) (18) (19) (10) ST Deferred Taxes (18) (9) (6) (10) (12) LT Deferred Taxes (76) (92) (120) (143) (148) Adjusted Gross Operating Assets before Lider $1,376 $1,757 $2,144 $2,408 $2,611 |
 36 Operating margin trend As reported in prior periods (operating income/gross revenue) 2008 2009 2012 Full Year Full Year Full Year Q1 Q2 Q3 Q4 FY Q1 EBU 23.6% 19.3% 17.0% 18.0% 18.4% 19.6% 18.8% 18.8% 17.3% WASBU 17.9% 21.5% 28.5% 26.5% 29.5% 29.8% 24.0% 27.4% 20.6% NABU 14.5% 12.1% 6.1% 10.1% 16.1% 4.2% -4.0% 7.5% 3.6% AUSBU 17.2% 5.9% 23.2% 22.5% 16.3% 17.2% 17.4% 18.2% 10.0% OIBU 17.3% 27.0% 19.2% 6.9% 30.6% 27.7% 45.8% 28.4% 33.6% Consolidated 16.0% 17.8% 15.5% 13.6% 17.1% 14.7% 16.1% 15.4% 11.3% New methodology (operating income/operating revenue) 2008 2009 2012 Full Year Full Year Full Year Q1 Q2 Q3 Q4 FY Q1 EBU 29.2% 24.3% 20.8% 21.4% 22.1% 25.4% 23.6% 23.6% 21.5% WASBU 19.4% 22.8% 29.9% 27.1% 30.5% 30.4% 26.1% 28.6% 21.5% NABU 14.5% 12.2% 6.2% 10.2% 16.4% 4.2% -4.0% 7.6% 3.6% AUSBU 17.9% 6.3% 24.3% 23.6% 17.8% 18.8% 19.1% 19.8% 11.1% OIBU 17.4% 27.3% 19.4% 6.9% 30.9% 28.2% 47.1% 28.8% 34.5% Consolidated 17.6% 19.6% 17.0% 14.6% 18.7% 16.5% 18.2% 17.0% 12.7% 2010 2011 2010 2011 |
 37 Leverage Reconciliation *Adjusted EBITDAR exclude gains and losses on dispositions of assets Debt Investment Capital Leverage (a) (b) (c) = (a) + (b) (a) / (c) (in millions) As of June 30, 2011 732.4 $ 1,538.7 $ 2,271.1 $ 32.2% Adjust for: Unfunded Pension Liability 98.1 98.1 NPV of GE and Norsk Lease Obligations 39.6 39.6 Adjusted 870.1 $ (d) 1,538.7 $ 2,408.8 $ 36.1% Calculation of debt to adjusted EBITDAR multiple Adjusted EBITDAR*: FY 2012 271.9 $ (e) Annualized 362.5 $ = (d) / (e) 3.2:1 |
 38 Bristow Group Inc. (NYSE: BRS) 2000 West Sam Houston Parkway South Suite 1700, Houston, Texas 77042 t 713.267.7600 f 713.267.7620 bristowgroup.com Contact Us |