 Howard Weil Energy Conference Bristow Group Inc. March 26, 2012 Exhibit 99.1 |
 2 Forward-looking statements This presentation may contain “forward-looking statements” within the meaning of the Private Securities Litigation Reform Act of 1995. Forward-looking statements include statements about our future business, operations, capital expenditures, fleet composition, capabilities and results; modeling information, earnings guidance, expected operating margins and other financial projections; future dividends, share repurchase and other uses of excess cash; plans, strategies and objectives of our management, including our plans and strategies to grow earnings and our business, our general strategy going forward and our business model; expected actions by us and by third parties, including our customers, competitors and regulators; the valuation of our company and its valuation relative to relevant financial indices; assumptions underlying or relating to any of the foregoing, including assumptions regarding factors impacting our business, financial results and industry; and other matters. Our forward-looking statements reflect our views and assumptions on the date of this presentation regarding future events and operating performance. They involve known and unknown risks, uncertainties and other factors, many of which may be beyond our control, that may cause actual results to differ materially from any future results, performance or achievements expressed or implied by the forward-looking statements. These risks, uncertainties and other factors include those discussed under the captions “Risk Factors” and “Management’s Discussion and Analysis of Financial Condition and Results of Operations” in our Annual Report on Form 10-K for the fiscal year ended March 31, 2011 and our Quarterly Report on Form 10-Q for the quarter ended December 31, 2011. We do not undertake any obligation, other than as required by law, to update or revise any forward-looking statements, whether as a result of new information, future events or otherwise. |
 3 Bristow is the leading provider of helicopter transportation services to the global offshore industry • ~20 countries • 550 aircraft • ~3,400 employees • Ticker: BRS • Stock price * : $48.15 • Market cap * : ~$1.8 billion • Secured Ratings: BBB- / Ba1 $67 * Based on 36.8 million fully diluted weighted average shares outstanding as of 12/31/2011 and stock price as of 03/16/2012. Bristow flies crews and light cargo to production platforms, vessels and rigs |
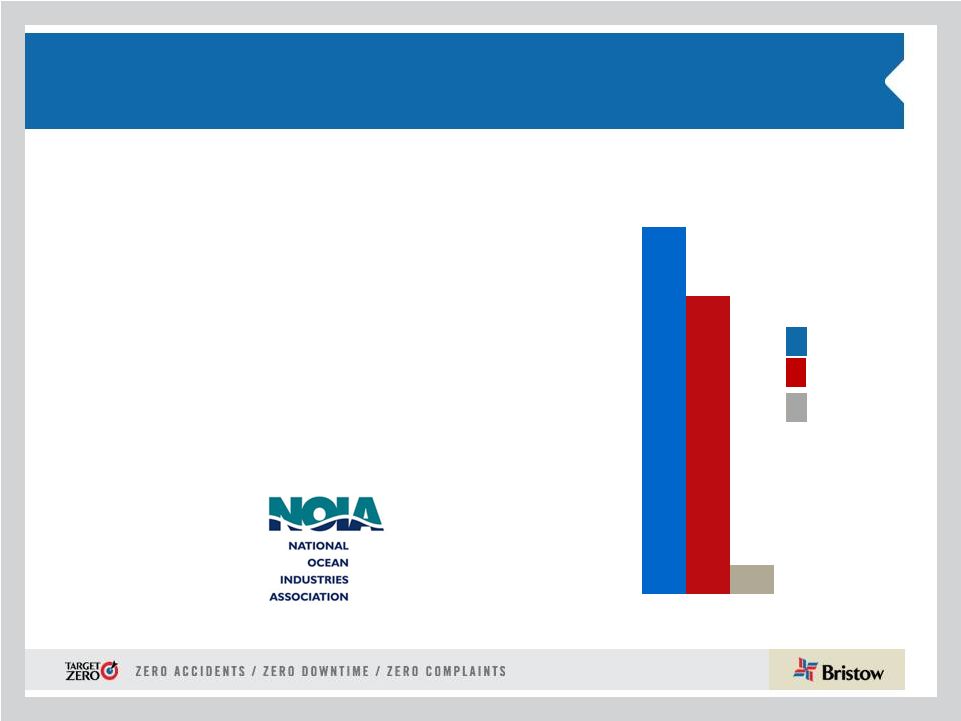 4 2.79 2.27 0.58 Industry leading safety record creates marketing and cost advantage • Safety is our primary core value • Bristow’s ‘Target Zero’ program is now the leading example emulated industry-wide • Bristow accident rate is less than one fifth the average rates for the oil and gas industry and all civil helicopters • Safety Performance accounts for 25% of management incentive compensation • 2011 National Ocean Industries Association (NOIA) Safety and Seas Award Winner * Averages for most recently available three-year period: Helicopter Association International 2007-2009, International Oil & Gas Producers 2005-2007, Bristow Group, 2009- 2011, excluding Bristow Academy 3-year average air accident rates * per 100K flight hours Bristow Oil & Gas industry All civil helicopters |
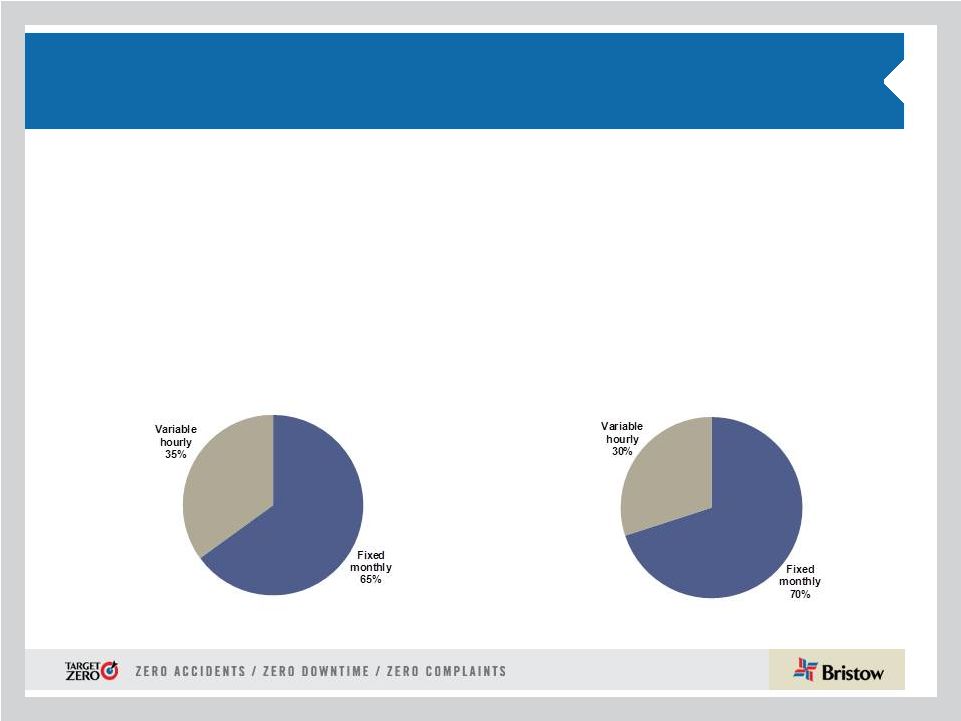 5 Bristow’s contract and operations structure results in a more predictable income with significant operating leverage Revenue sources • Largest share of revenues (>60%) relates to oil and gas production, ensuring stability and growth • Bristow contracts earn 65% of revenue without flying in most markets with a two tier contract structure that includes both: – Fixed or monthly standing charge to reserve helicopter capacity – Variable fees based on hours flown Operating income |
 6 • Global spending on E&P is expected to increase 10% to $600 billion in 2012 versus $544 billion in 2011; forecast to top $800 billion by 2015 • The top 20 E&P spenders globally account for nearly 57% of total spending. Of these companies, five of them are our top revenue contributors • Continued cost pressure across the oil field service sector • Increasing international helicopter demand and recovery in the Gulf of Mexico will cause tightness in the helicopter supply market • 34% of five-year projected opportunities are in Latin America, with large helicopter demand expected to almost double next year and then again by 2020 • Bristow’s order and option book is aligned to meet this market growth; however we also will need market signals that confirm this potential revenue growth before investing significantly in new aircraft Current market environment Source: Barclays Capital Research December 2011 |
 7 What clients are saying? • Newer assets will be required • Pursuing highest operational standard and will require that of contractors • Higher levels of inspection required to award contracts • Certification of training and personnel competency needed • Bids will call for higher specs than needed to perform the actual job • “Every bid now seems to need partner approvals” Our clients have sharply increased their focus on risk related to contractor capabilities, personnel and equipment These requirements favor Bristow’s business model because of its financial strength and demonstrated premier service |
 8 Bristow’s Client Promise is in response to this client focus: Creating value through differentiation Target Zero accidents, downtime and complaints programs deliver value to operators. More zero-accident flight hours than anyone, more uptime than anyone, and hassle-free service creates confidence in flight. Worldwide. Lowers client’s offshore operating costs and improves productivity. Earns us more business to improve BVA. |
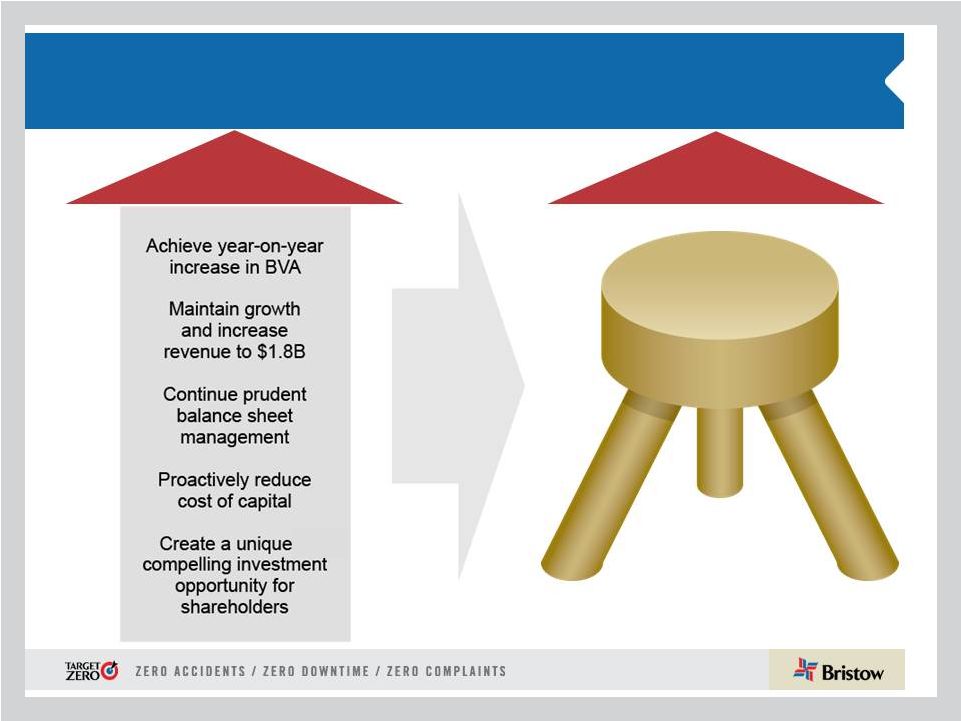 9 Understanding our unique investment thesis and commitment to our shareholders for the next 5 years Commitment: FY 2012 - 2016 Prudent Balance Sheet Management Growth Capital Return and Investment: FY 2012 - 2016 Our New Balanced and Unique Investment Thesis |
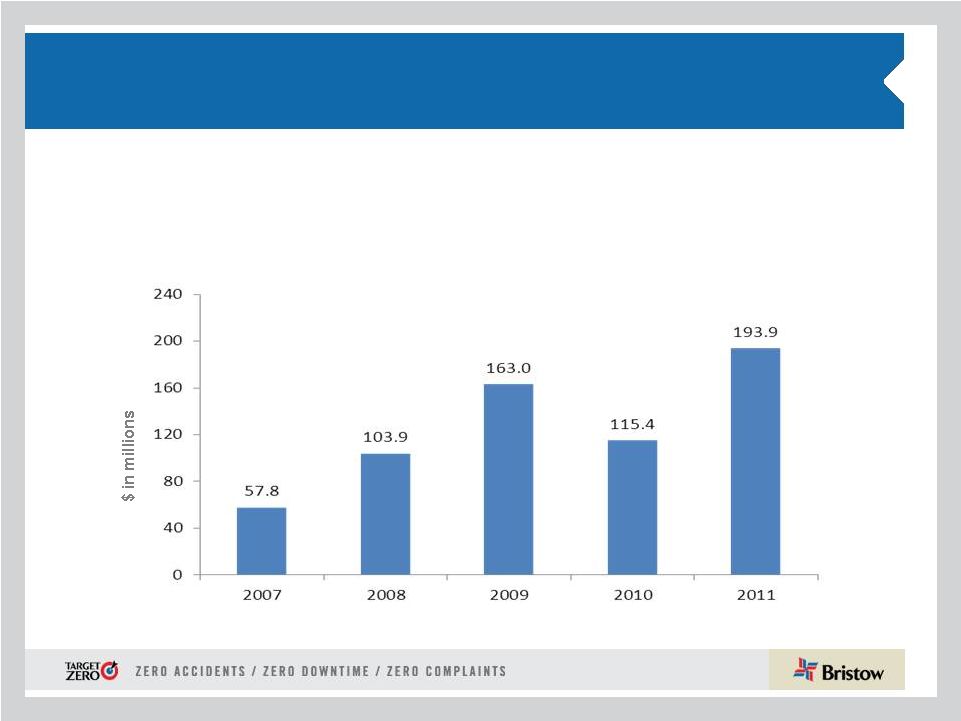 10 Although this years EPS did not meet our initial expectations, we have significant and growing operating cash flow We generated 68% more operating cash flow through Q3 FY12 compared to the same period last year Nine months ended December 31 Net cash provided by operating activities |
 11 Understanding the capital structure/allocation changes as part of our unique investment • Minimum total liquidity of $200M (cash + undrawn revolver) • Quarterly dividend growth of 10-15% per annum • Excess cash may be distributed to shareholders with specifics approved by Board of Directors • Balance use of operating cash flow + a/c sales with leases for a/c purchases and other capex • Leases used for initially no more than 20-30% of total Bristow LACE • Adjusted Debt/Capital Ratio less than 45% Capex vs Leases Capital Structure Liquidity Capital Return |
 12 Understanding Bristow’s unique, balanced investment thesis Understanding Bristow’s unique, balanced investment thesis Our “Organic Growth Signal” is provided by the commercial markets using outlooks for ANNUAL EPS Growth. Currently: = OCF + A/C sales – Depreciation Market Capitalization We will aim to provide a balanced return, but some years we will “hit the gas” depending on price signals Our “Capital Return Price Signal” is provided by the financial markets using our current free cash flow yield. Currently: Today this equals 7.8% 2.9 % = 1) For the nine months ended December 31 2) Trailing twelve months Bristow Cash Flow Yield FY07 – FY11 EPS Growth 2 1 |
 13 Today’s Key Takeaways WE ARE FOCUSED ON EXECUTION Target Zero will remain a top priority Client Promise ensures differentiation Unique investment in oilfield services Premier service provider with excellent secular expansion opportunities Growth to be executed with care and discipline Deepen client relationships with premium market share with the premium clients Expand margins and revenue growth through differentiation Bristow maintains its commitment to prudent balance sheet management Bristow intends to grow the dividend Bristow will demonstrate a balanced return for our investors by using market price signals to grow or harvest our businesses |
 14 Bristow Group Inc. (NYSE: BRS) 2103 City West Blvd., 4th Floor Houston, Texas 77042 t 713.267.7600 f 713.267.7620 bristowgroup.com/investorrelations Contact Us |
 15 Appendix Appendix |
 16 Organizational Chart - as of December 31, 2011 Business Unit Corporate Region ( # of Aircraft / # of Locations) Joint Venture Key Operated Aircraft Bristow owns and/or operates 364 aircraft as of December 31, 2011 Affiliated Aircraft Bristow affiliates and joint ventures operate 186 aircraft as of December 31, 2011 (* % of YTD FY12 Operating Revenue) (No. of aircraft) Bristow NABU 15%* AUSBU 12% EBU 37% WASBU 21% OIBU 12% BRS Academy 3% U.S. GoM – 80/7 Trinidad – 10/1 Alaska – 13/3 Mexico – 16/5 Brazil –10/9 Lider - 77 UK –38/4 Netherlands – 4/1 Norway – 14/3 FBH - 64 Nigeria – 48/7 Australia –30/10 Other – 14/1 Russia – 7/3 Egypt – –/ – India – 1/2 Turkmenistan – 2/1 PAS - 45 Florida – 54/1 Louisiana – 15/1 Malaysia – 5/2 Denmark – 1/1 U.K. – 2/1 |
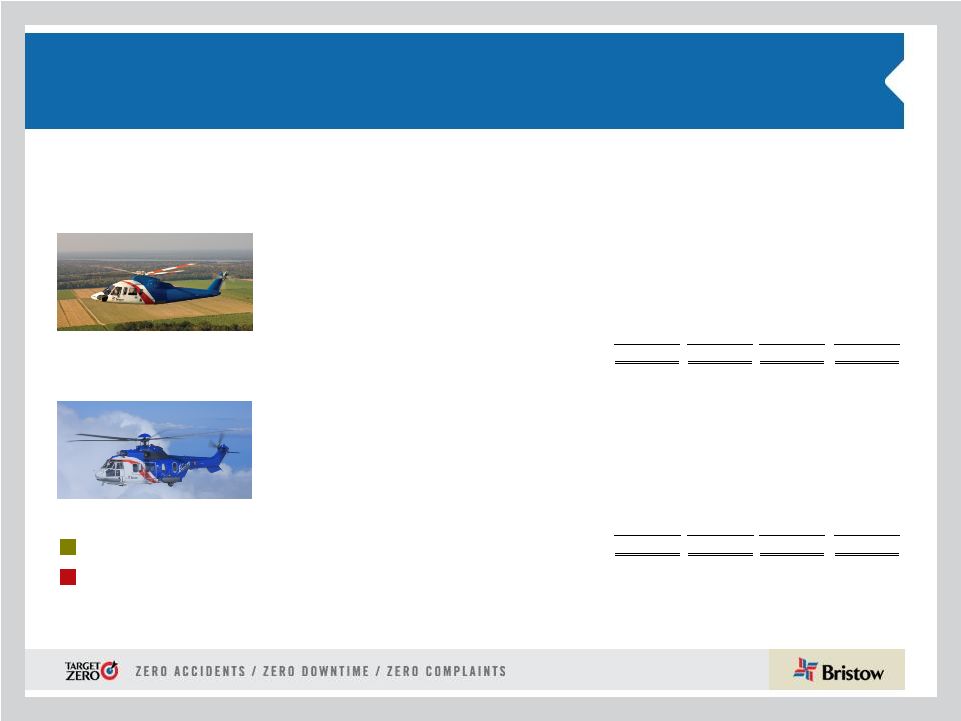 17 Aircraft Fleet – Medium and Large As of December 31, 2011 Next Generation Aircraft Medium capacity 12-16 passengers Large capacity 18-25 passengers Mature Aircraft Models Aircraft Type No. of PAX Engine Consl Unconsl Total Ordered Large Helicopters AS332L Super Puma 18 Twin Turbine 30 - 30 - AW189 16 Twin Turbine - - - 6 EC225 25 Twin Turbine 18 - 18 - Mil MI 8 20 Twin Turbine 7 - 7 - Sikorsky S-61 18 Twin Turbine 2 - 2 - Sikorsky S-92 19 Twin Turbine 28 2 30 10 85 2 87 16 LACE 79 Medium Helicopters AW139 12 Twin Turbine 7 2 9 - Bell 212 12 Twin Turbine 2 14 16 - Bell 412 13 Twin Turbine 35 20 55 - EC155 13 Twin Turbine 3 - 3 - Sikorsky S-76A/A++ 12 Twin Turbine 17 6 23 - Sikorsky S-76C/C++ 12 Twin Turbine 54 28 82 - 118 70 188 - LACE 55 |
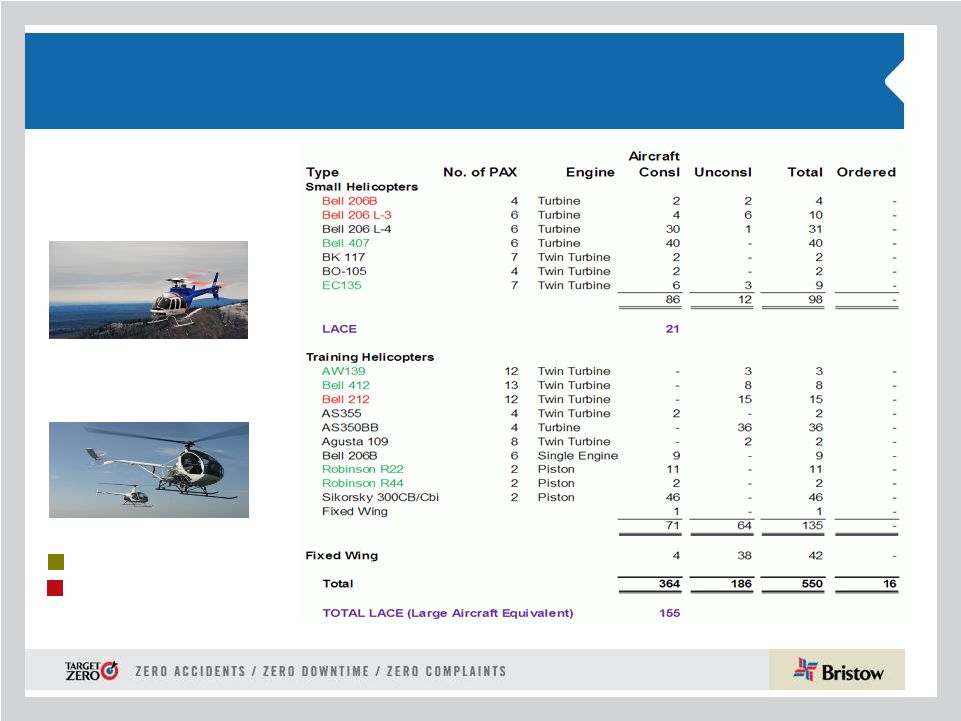 18 Aircraft Fleet – Small, Training and Fixed As of December 31, 2011 (continued) Next Generation Aircraft Mature Aircraft Models Small capacity 4-7 passengers Training capacity 2-6 passengers •LACE does not include held for sale, training and fixed wing helicopters |
 19 Consolidated Fleet Changes and Aircraft Sales for Q3 FY12 EBU WASBU AUSBU OIBU NABU Total Large 3 - 3 - - 6 Medium 2 1 1 3 1 8 Small - 2 - - - 2 Total 5 3 4 3 1 16 Aircraft held for sale by BU * Amounts stated in thousands; In Q3 FY12 two aircraft were sold for $47.9 million and entered into lease back agreements and two aircraft interest previously included in CIP were sold for $23.4 million. Q 1 FY12 Q 2 FY12 Q 3 FY12 YTD Fleet Count Beginning Period 373 372 366 373 Delivered EC225 2 1 3 S-92 2 3 5 Citation XLS 1 1 Total Delivered 2 3 4 9 Removed Sales (3) (5) (7) (15) Other* (4) 1 (3) Total Removed (3) (9) (6) (18) 372 366 364 364 * Includes destroyed aircraft, lease returns and commencements Fleet changes EBU WASBU AUSBU OIBU NABU BA Total Large 3 - - - 2 - 5 Medium - - - - 9 - 9 Small - - 2 - 1 - 3 Fixed - 1 - - - - 1 Training - - - - - 23 23 Total 3 1 2 - 12 23 41 Leased aircraft in consolidated fleet # of A/C Sold Cash Received* Q1 FY12 3 2,478 Q2 FY12 5 10,674 Q3 FY12 9 81,248 Totals 17 94,400 |
 20 # Helicopter Class Delivery Date Location Contracted # Helicopter Class Delivery Date Location 1 Large March 2012 EBU 1 of 1 4 Medium June 2012 EBU 1 Large June 2012 OIBU 1 of 1 1 Medium December 2012 OIBU 1 Large June 2012 WASBU 1 of 1 1 Medium March 2013 OIBU 4 Large December 2012 EBU 1 of 4 2 Medium June 2013 OIBU 3 Large March 2013 EBU 3 of 3 1 Medium September 2013 OIBU 1 Large September 2014 NABU 1 Medium September 2013 AUSBU 1 Large December 2014 OIBU 1 Large September 2013 AUSBU 1 Large March 2015 OIBU 2 Medium December 2013 AUSBU 1 Large June 2015 EBU 4 Large December 2013 EBU 1 Large March 2016 EBU 1 Large December 2013 AUSBU 1 Large June 2016 AUSBU 1 Large March 2014 AUSBU 16 7 of 16 1 Large June 2014 AUSBU 1 Large September 2014 AUSBU * Six large ordered aircraft expected to enter service late 1 Large December 2014 AUSBU calendar 2014 are subject to the successful development 1 Large March 2015 AUSBU and certification of the aircraft. 1 Large June 2015 AUSBU Order book does not include two large leased aircraft 1 Large June 2015 NABU under contract with delivery dates in June and September 1 Large September 2015 OIBU 2012 quarters. 1 Large September 2015 EBU 1 Large December 2015 OIBU 1 Large December 2015 EBU 1 Large March 2016 OIBU 2 Large June 2016 EBU 1 Large September 2016 OIBU 1 Large September 2016 EBU 1 Large December 2016 EBU 1 Large December 2016 AUSBU 1 Large March 2017 OIBU 1 Large June 2017 EBU 1 Large September 2017 OIBU 1 Large December 2017 OIBU 40 ORDER BOOK* OPTIONS BOOK Order and options book as of December 31, 2011 Fair market value of our fleet is ~$1.9 billion as of December 31, 2011. |
 21 Adjusted EBITDAR margin trend 1) Calculated by taking adjusted EBITDAR divided by operating revenue 2) Adjusted EBITDAR excludes special items and asset dispositions |
 22 Adjusted EBITDAR reconciliation ($ in millions) 2006 2007 2008 2009 Income from continuing operations $54.5 $72.5 $107.7 $125.5 Income tax expense $14.7 $38.8 $44.5 $50.5 Interest expense $14.7 $10.9 $23.8 $35.1 Gain on disposal of assets ($0.1) ($10.6) ($9.4) ($9.1) Depreciation and amortization 42.1 42.5 54.1 65.5 Special items – – (1.4) (42) EBITDA Subtotal 125.8 154.1 219.3 225.6 Rental expense 12.1 18.8 22.8 21.1 Adjusted EBITDAR $137.9 $172.9 $242.1 $246.7 ($ in millions) 2010 2011 Income from continuing operations $113.5 $133.3 Income tax expense $29.0 $7.1 Interest expense $42.4 $46.2 Gain on disposal of assets (18.7) (10.2) Depreciation and amortization 74.7 90.9 Special items – 1.2 EBITDA Subtotal 240.9 268.5 Rental expense 27.3 29.2 Adjusted EBITDAR $268.2 $297.7 ($ in millions) YTD FY11 YTD FY12 TTM as of 12/31/2011 12/31/2011 12/31/2011 Income from continuing operations $102.1 $50.7 $81.9 Income tax expense 0.0 11.8 18.9 Interest expense 36.3 28.2 38.1 Gain on disposal of assets (3.6) 3.1 (3.5) Depreciation and amortization 61.6 70.8 100.1 Special items (1.2) 24.6 27.1 EBITDA Subtotal 195.2 189.1 262.4 Rental expense 21.4 30.9 38.6 Adjusted EBITDAR $216.7 $220.0 $301.1 March 31, March 31, |
 23 Operating margin trend Bristow Group Operating Margin Trend Actual 2008 2009 2010 2011 2012 As Reported Full Year Full Year Q1 Q2 Q3 Q4 FY Q1 Q2 Q3 Q4 FY Q1 Q2 Q3 EBU 23.6% 19.3% 17.2% 16.7% 16.1% 18.1% 17.0% 18.0% 18.4% 19.6% 18.8% 18.8% 17.3% 16.8% 15.5% WASBU 17.9% 21.5% 24.9% 29.3% 25.4% 34.7% 28.5% 26.5% 29.5% 29.8% 24.0% 27.4% 20.6% 25.2% 25.9% NABU 14.5% 12.1% 8.9% 9.7% 3.3% 2.2% 6.1% 10.1% 16.1% 4.2% -4.0% 7.5% 3.6% 5.3% 4.3% AUSBU 17.2% 5.9% 20.1% 23.1% 24.5% 24.5% 23.2% 22.5% 16.3% 17.2% 17.4% 18.2% 10.0% 1.7% 8.7% OIBU 17.3% 27.0% 21.8% 35.1% 15.5% 1.8% 19.2% 6.9% 30.6% 27.7% 45.8% 28.4% 33.6% 5.8% 32.6% Consolidated 16.0% 17.8% 15.4% 18.4% 13.1% 15.2% 15.5% 13.6% 17.1% 14.7% 16.1% 15.4% 11.3% 2.9% 13.1% New methodology (operating income/operating revenue) 2008 2009 2010 2011 2012 Revised * Full Year Full Year Q1 Q2 Q3 Q4 FY Q1 Q2 Q3 Q4 FY Q1 Q2 Q3 EBU 29.2% 24.3% 20.9% 20.5% 19.8% 22.4% 20.8% 21.4% 22.1% 25.4% 23.6% 23.6% 21.5% 20.7% 19.5% WASBU 19.4% 22.8% 26.8% 30.0% 27.3% 35.7% 29.9% 27.1% 30.5% 30.4% 26.1% 28.6% 21.5% 26.4% 27.1% NABU 14.5% 12.2% 8.9% 9.7% 3.3% 2.2% 6.2% 10.2% 16.4% 4.2% -4.0% 7.6% 3.6% 11.0% 4.3% AUSBU 17.9% 6.3% 21.0% 24.5% 25.5% 25.6% 24.3% 23.6% 17.8% 18.8% 19.1% 19.8% 11.1% 1.9% 9.4% OIBU 17.4% 27.3% 21.9% 35.9% 15.3% 1.9% 19.4% 6.9% 30.9% 28.2% 47.1% 28.8% 34.5% 5.9% 33.5% Consolidated ** 16.4% 14.7% 15.9% 17.4% 14.2% 13.9% 15.3% 14.0% 18.0% 15.3% 18.3% 16.4% 12.2% 13.0% 15.6% * - All amounts revised to exclude reimbursable revenue from denominator. ** - Revised to exclude aircraft sales from numerator. |
 24 GAAP reconciliation Adjusted EBITDA Gain (loss) on disposal of assets Special items Interest expense Depreciation and amortization Benefit (provision) for income taxes Net income Adjusted operating income Gain (loss) on disposal of assets Special items Adjusted net income Gain (loss) on disposal of assets Special items Net income attributable to Bristow Group Adjusted earnings per share Gain (loss) on disposal of assets Special items Earnings per share Operating income Three Months Ended Months Ended December 31, December 31, 2011 2010 2011 2010 Nine (In thousands, except per share amounts) 68,933 64,435 189,132 195,221 $ $ $ $ (2,865) (33) (3,060) 3,582 1,200 (24,610) 1,200 (9,756) (13,773) (28,170) (36,263) (22,709) (21,338) (70,848) (61,637) 11,823 (33) (7,118) (11,779) 26,485 42,314 50,665 102,070 $ $ $ $ 46,418 43,172 119,900 132,795 (2,865) (33) (3,060) 3,582 — — 3,500 (27,287) 3,500 $ 43,553 $ 46,639 $ 89,553 $ 139,877 $ 27,790 $ 26,285 71,089 $ 82,133 $ (2,258) (27) 2,972 — 15,501 (19,319) 16,342 (2,482) 25,532 41,759 $ $ $ $ 101,447 $ 0.76 $ 0.71 $ 1.93 $ 2.24 (0.06) — (0.07) 0.08 — 0.42 (0.53) 0.45 0.70 1.13 1.34 2.77 49,288 $ $ $ $ |
 25 Special items reconciliation Three Months Ended December 31, 2010 Adjusted Operating Income Adjusted EBITDA Adjusted Net Income Adjusted Diluted Earnings Per Share (In thousands, except per share amounts) 3,500 $ 3,500 $ 2,894 $ 0.08 0.11) 0.45 0.42 ( — 2,300) 3,966) 16,573 ( 2,300) — — ( $ 3,500 $ 1,200 $ 15,501 Nine Months Ended December 31, 2011 Adjusted Operating Income Adjusted EBITDA Adjusted Net Income Adjusted Diluted Earnings Per Share (In thousands, except per share amounts) 24,610) $ 24,610) $ 17,579) $ 0.48) 2,677) — 1,740) 0.05) 0.53) $ ( ( ( ( ( ( ( ( $ 27,287) $ 24,610) $ 19,319) ( ( ( Nine Months Ended December 31, 2010 Adjusted Operating Income Adjusted EBITDA Adjusted Net Income Adjusted Diluted Earnings Per Share (In thousands, except per share amounts) $ 3,500 $ 3,500 2,904 $ $ 0.08 — 2,300) 3,900) 0.11) — — 17,338 0.47 0.45 ( ( ( $ 3,500 $ 1,200 $ 16,342 Retirement of 6 1/8% Senior Notes Tax items Total special items Impairment of inventories Impairment of assets in Creole, Louisiana Total special items Retirement of 6 1/8% Senior Notes Tax items Total special items $ Power-by-the-hour credit Power-by-the-hour credit |
 26 Leverage Reconciliation *Adjusted EBITDAR exclude gains and losses on dispositions of assets Debt Investment Capital Leverage (a) (b) (c) = (a) + (b) (a) / (c) (in millions) As of December 31, 2011 $ $ 1,523.5 $ 2,356.3 35.3% Adjust for: Unfunded Pension Liability 97.2 NPV of Lease Obligations 165.0 Guarantees 15.5 Letters of credit 1.7 Adjusted $ (d) $ 1,523.5 $ 2,635.6 42.2% Calculation of debt to adjusted EBITDAR multiple Adjusted EBITDAR*: FY 2012 $ (e) Annualized $ 401.4 = (d) / (e) 832.8 97.2 165.0 15.5 1.7 1,112.1 301.1 3.69:1 |
 27 Bristow Group Inc. (NYSE: BRS) 2103 City West Blvd., 4 th Floor Houston, Texas 77042 t 713.267.7600 f 713.267.7620 bristowgroup.com Contact Us |