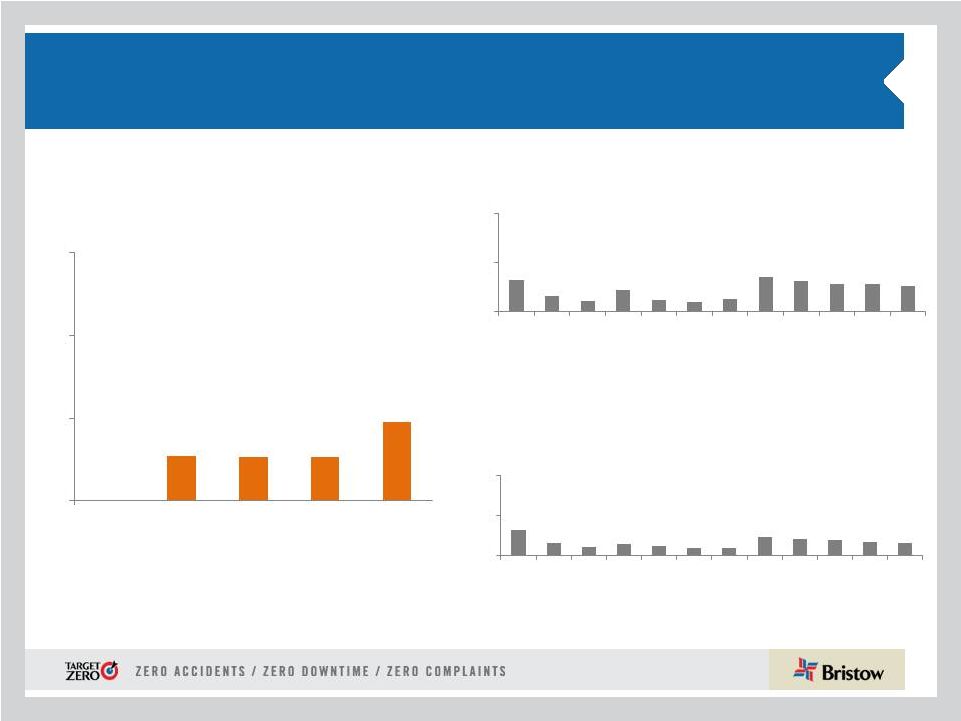
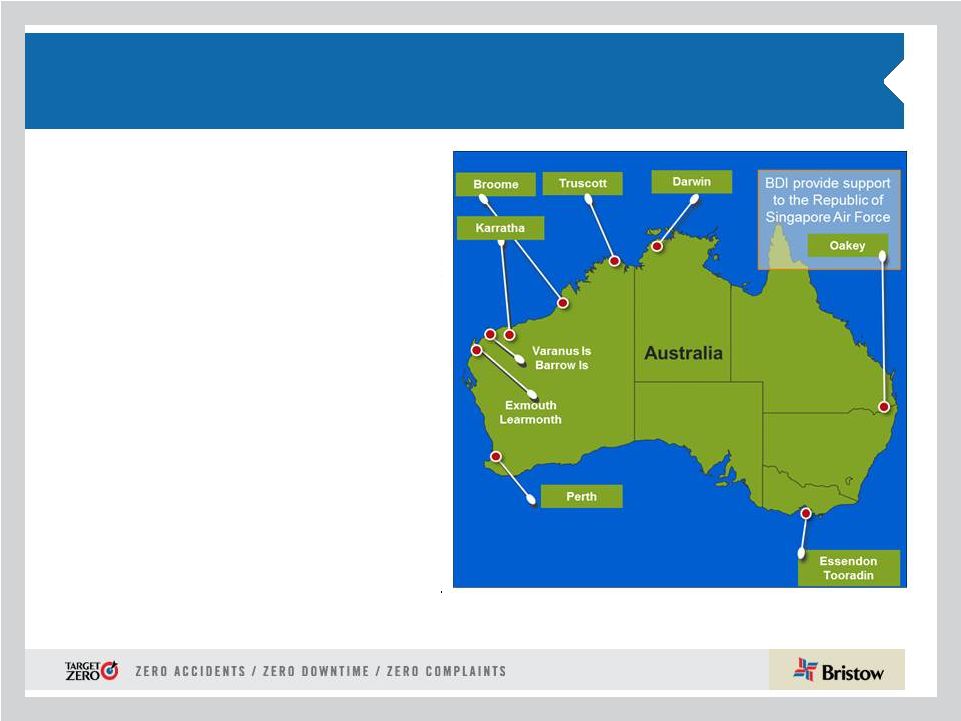
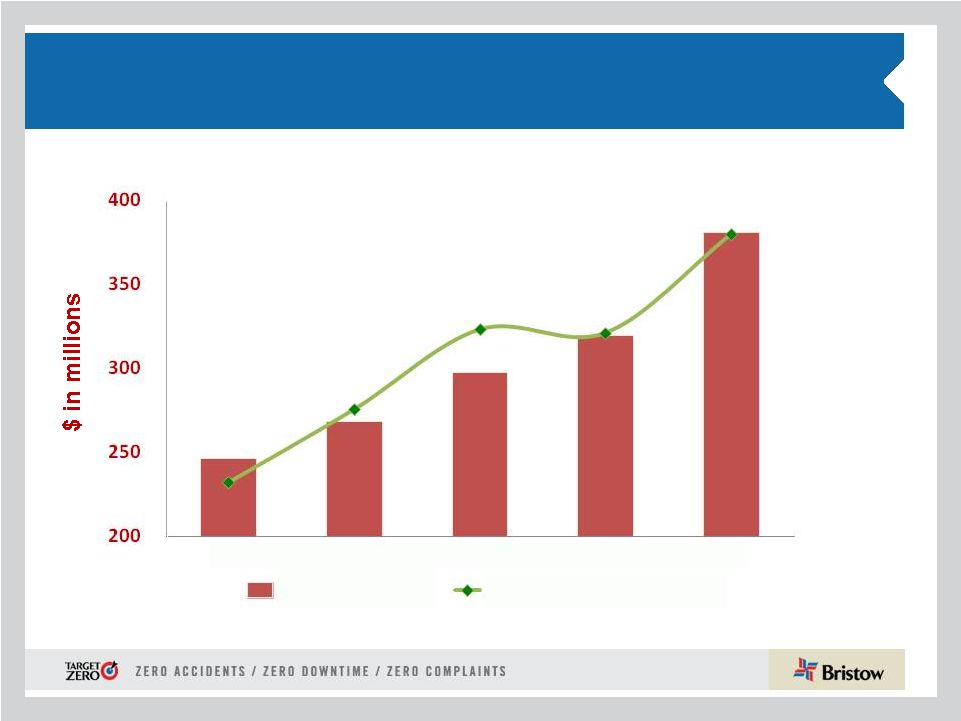
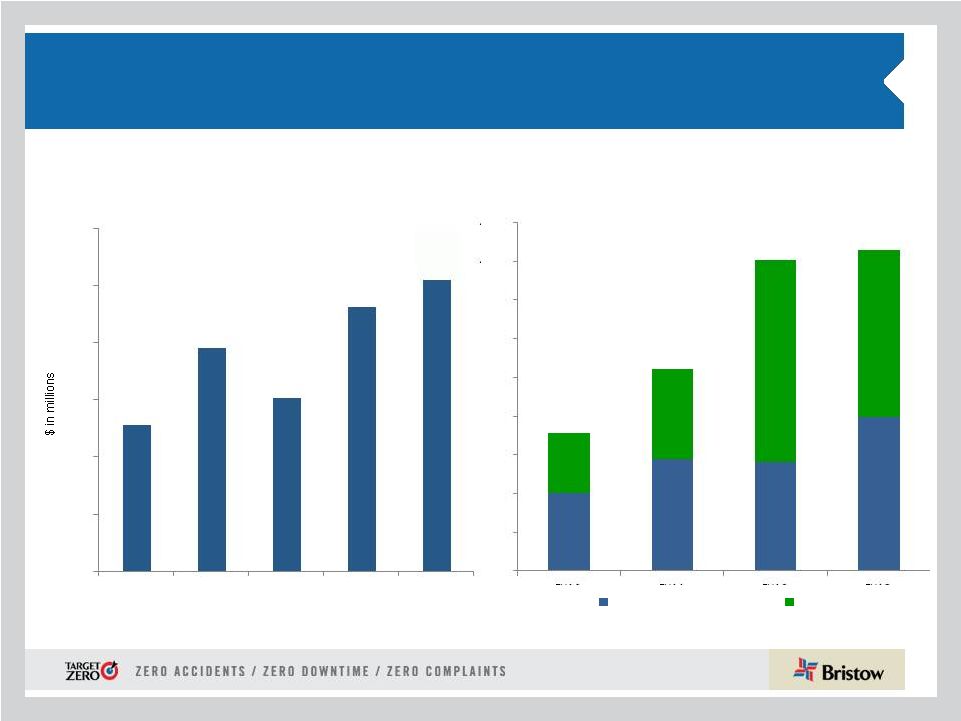
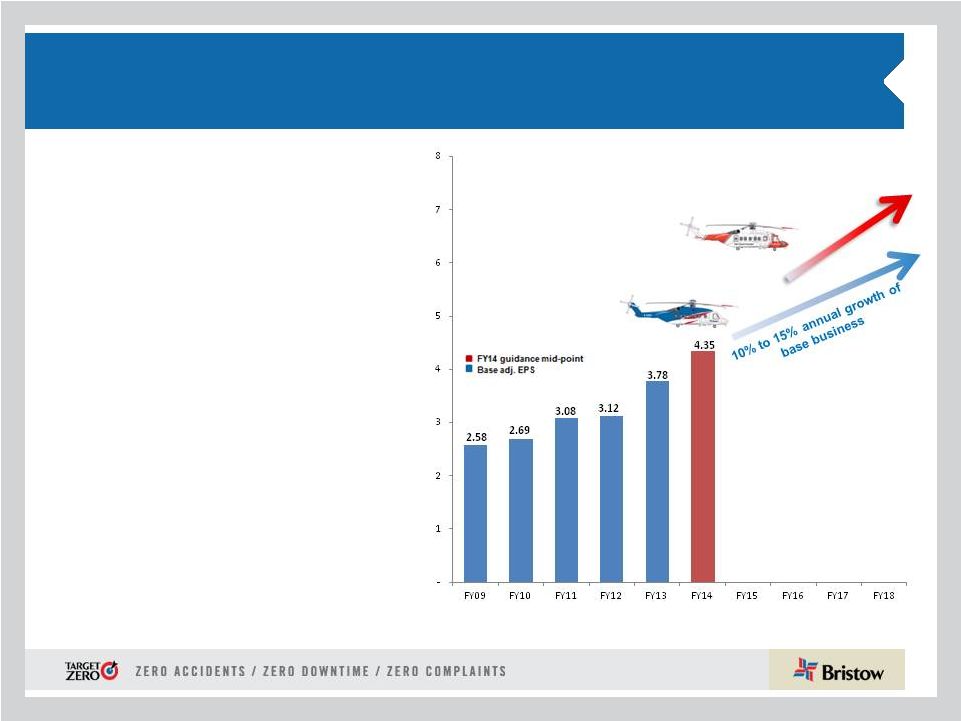
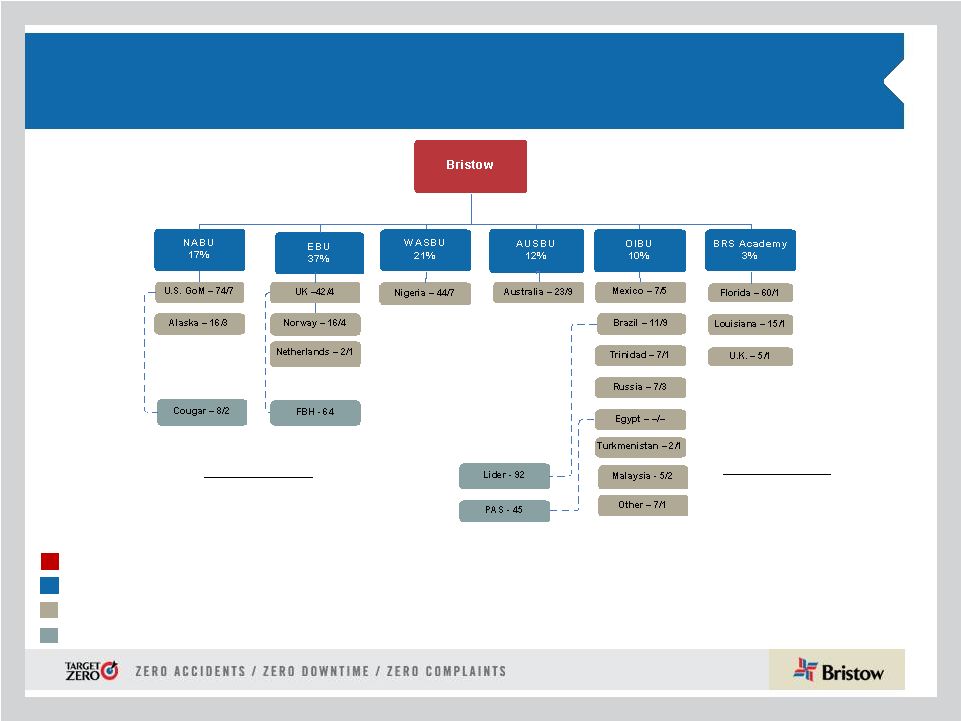
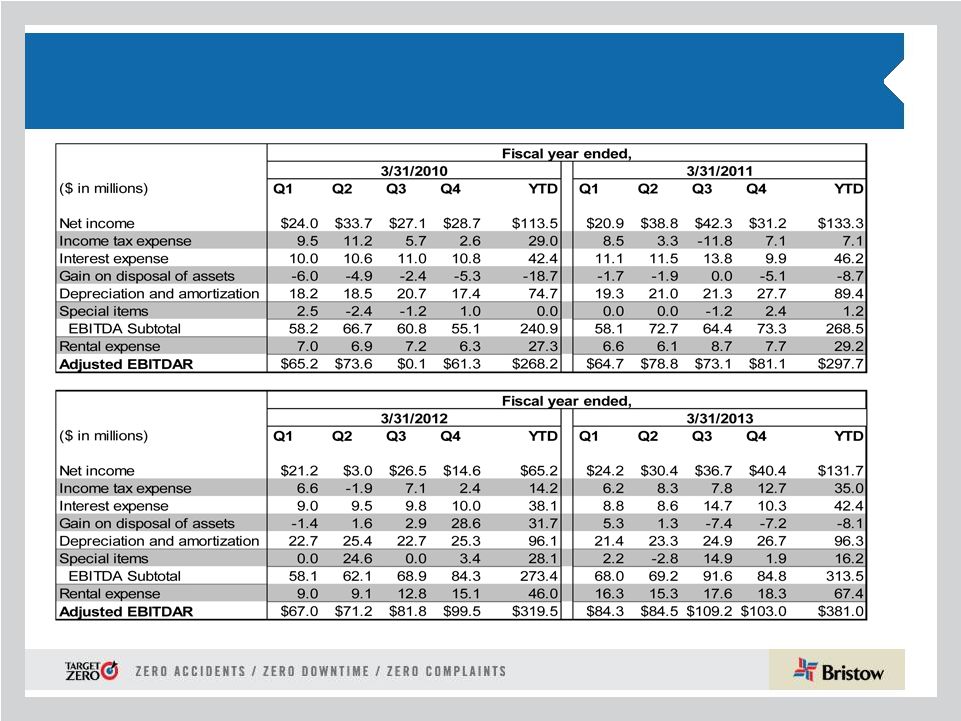
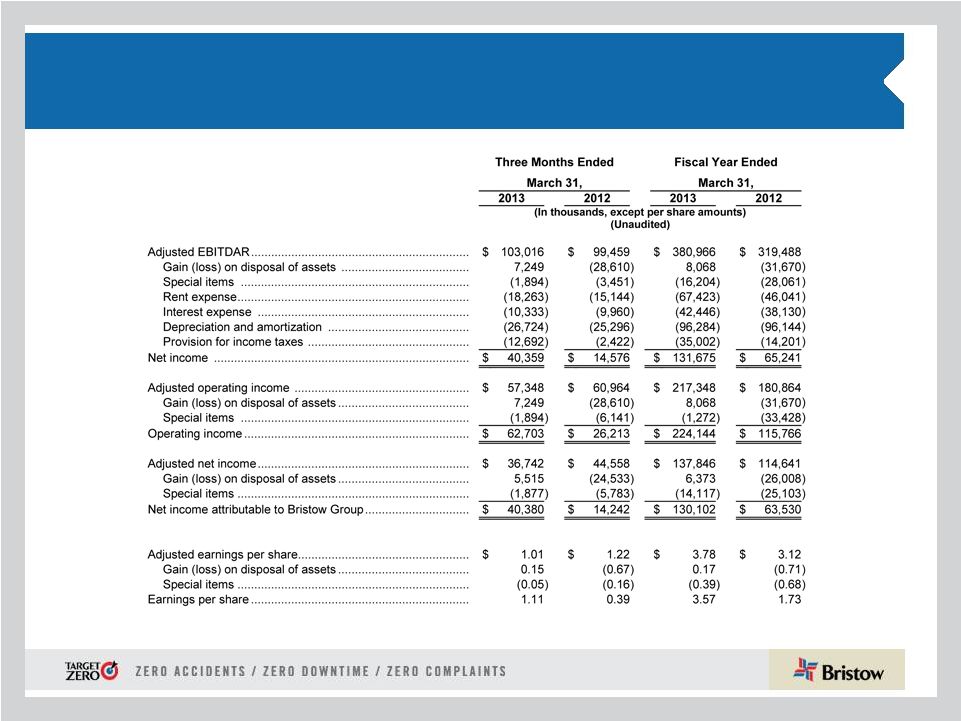
7 Q4 and FY13 highlights * Adjusted EPS and adjusted EBITDAR amounts exclude gains and losses on dispositions of assets and any special items during the period. See reconciliation of these items to GAAP measures in the appendix hereto and in our earnings release for the quarter and fiscal year ended March 31, 2013. ** Bristow Value Added (BVA) is calculated by taking Gross Cash Flow less the product of Gross Operating Assets times a capital charge of 10.5%. Example calculation can be found in the appendix hereto. *** Please see our earnings release for more information regarding earnings guidance. • Q4 operating revenue of $350.7M (10% increase from Q4 FY12, 1.2% increase from Q3 FY13) • Q4 GAAP EPS of $1.11 (184.6% increase from Q4 FY12, 11% increase from Q3 FY13) • Q4 adjusted EPS* of $1.01 (17.2% decrease from Q4 FY12, 13.7% decrease from Q3 FY13) • Q4 adjusted EBITDAR* of $103.0M (3.6% increase from Q4 FY12, 5.7% decrease from Q3 FY13) • FY13 operating revenue of $1.3B (12.1% increase from FY12) • FY13 GAAP EPS of $3.57 (106.4% increase from FY12) • FY13 adjusted EPS* of $3.78 (21.2% increase from FY12) • FY13 adjusted EBITDAR* of $381.0M (19.2% increase from FY12) Strong operating performance in FY13 with record operating revenue of $351 million and $1.3 billion for the quarter and fiscal year period Fourth quarter and FY13 adj. EPS were $1.01 per share and $3.78 per share, respectively, which excludes the impact of special items and asset dispositions and includes charges related to a client’s bankruptcy of $0.02 per share for Q4 FY13 and $0.11 per share for FY13 Record BVA with cash flow from operations of $267 million up ~ 15% year-over-year** 25% quarterly dividend increase to $0.25 per share Guidance range for FY14 adjusted EPS is $4.20 - $4.50*** |