Exhibit 99

Creating Shareholder Value
Ohio Casualty Corporation
September 2005
Welcome/Purpose of Today’s Meeting
Dennis McDaniel
Vice President – Investor Relations

Forward Looking Statements
Certain of the statements contained in these materials, including all financial forecasts and projections, are forward-looking statements within the meaning of the Private Securities Litigation Reform Act. Forward-looking statements are typically identified herein by words or phrases such as “expect,” “project,” “forecast,” “plan,” “goal,” and similar expressions of future or conditional verbs such as “will,” “should,” and “would.” Future premium levels, loss experience, operating expenses and profits are all influenced by a number of factors, including those identified below, all of which are inherently difficult to forecast. Consequently, actual results may differ materially from those included in the forward-looking statements. Among the factors that could cause actual results to differ materially from the forward-looking statements are the following:
General Industry Factors
Pricing environment for the Corporation’s insurance products and general competition
Changes in governmental regulation
Acts of war and terrorist activities
Fluctuations in interest rates and performance of the financial markets
General economic and market conditions
Corporation-Specific Factors
Ability of the Corporation to successfully execute its Corporate Strategic Plan
Ability of the Corporation to maintain appropriate lines of credit
Ability of the Corporation to achieve and maintain planned price increases for its insurance products
Ability of the Corporation to achieve and maintain planned expense savings
Ability of the Corporation to retain key employees and agents having the experience and skills necessary to execute the Corporation’s Strategic Plan
Ability of the Corporation to attain planned benefits from technology initiatives
Ability of the Corporation to maintain sufficient financial strength ratings
Adequacy of the Corporation’s property and casualty reserves
Catastrophe losses and other adverse claims experience
Availability and pricing of reinsurance
Litigation and administrative proceedings
Other factors that could cause actual results to differ include those matters set forth in the Corporation’s Annual Report on Form 10-K for the fiscal year ended December 31, 2004 as well as those matters set forth in the Corporation’s subsequent periodic filings with the Securities and Exchange Commission. The Corporation disclaims any obligation or intention to publicly update or revise any of the forward-looking statements contained in these materials, whether as a result of new information, future events or otherwise.

Introductions & Progress
On Our Strategic Plan
Dan Carmichael
Chief Executive Officer

Agenda
Strategic Overview Dan Carmichael
Operations Review
Competitive Position and Trends Mike Michael
Commercial Lines Mike Sullivan
Personal Lines Derrick Shannon
Specialty Lines John Busby
Lunch with Management and Agents
Technology John Kellington
Agents’ Roundtable Tom Cassady – USI Midwest
Bill Dillhoff – Kneflin-Dillhoff-Hils & Kruse
Jack Massey – Putnam Agency
Investments Paul Gerard
Financial Highlights Mike Winner
Concluding Remarks/Discussion Dan Carmichael

Execution Against Successful Strategy
A Year Ago, We Promised
Achieve improved profitability
Focus organization on process improvements
Deliver superior easy to use processes
Earn higher financial ratings
Deliver greater shareholder value
Results Since Then
95.5% CR 6 points better than 1H04, 1st half ‘05 operating net up 44%
Expense ratio run rate approx. 32%, cost structure initiatives continuing
P.A.R.I.S.SM delivering results, rollout continues
S&P rating improved, capital continues to strengthen
Cash dividend restored, share repurchase program authorized, stock price up 29% * since 9/14/04
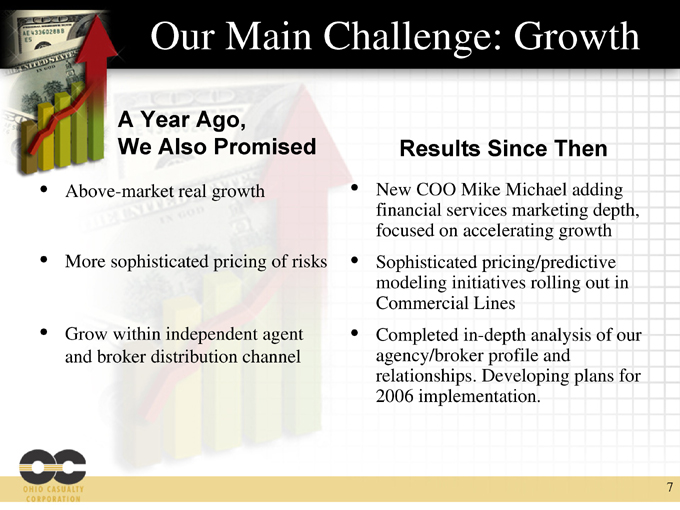
Our Main Challenge: Growth
A Year Ago,
We Also Promised
Above-market real growth
More sophisticated pricing of risks
Grow within independent agent and broker distribution channel
Results Since Then
New COO Mike Michael adding financial services marketing depth, focused on accelerating growth
Sophisticated pricing/predictive modeling initiatives rolling out in Commercial Lines
Completed in-depth analysis of our agency/broker profile and relationships. Developing plans for 2006 implementation.

Then and Now
Greater Scale and Strength
Surplus
$812M
$929M
Equity
$1,117M
$1,411M
Restructured and Reduced Debt
Debt
$215M
Short
$200M
Long
Debt / Capital Ratio
16.5%
12.5%
Better Leverage and Flexibility
Operating Leverage
1.9X
1.6X
Holding Co. Liquidity
$44M
$250M
Improved Underwriting Profitability
Combined Ratio
118.4%
95.5%
GAAP basis
Expense Ratio
34.4%
31.5%
New management began in December 2000.
12/31/2000
6/30/2005

Positioned For Future Success
Since 2000, we have substantially repositioned 23% of our book of business
Retention ratios remain strong, with adequate pricing
2005 reflects benefits of expense reduction initiatives
Overall reserve adequacy has been demonstrated, and investment portfolio is high quality
Strong capitalization and financial flexibility at holding company
Effective, highly efficient workforce, down 37% from 2000
P.A.R.I.S.SM technology is leading-edge, agent-focused, easy to use
9

Operations Review
Ohio Casualty Corporation
Building On Our Successes
Mike Michael
Chief Operating Officer
11

A Banker???
What does he know about insurance??
12

Industry Comparison
Commercial Banks and P&C Insurance
Commoditized
Competitive
Consolidating
Yet the sector has produced very attractive returns
13
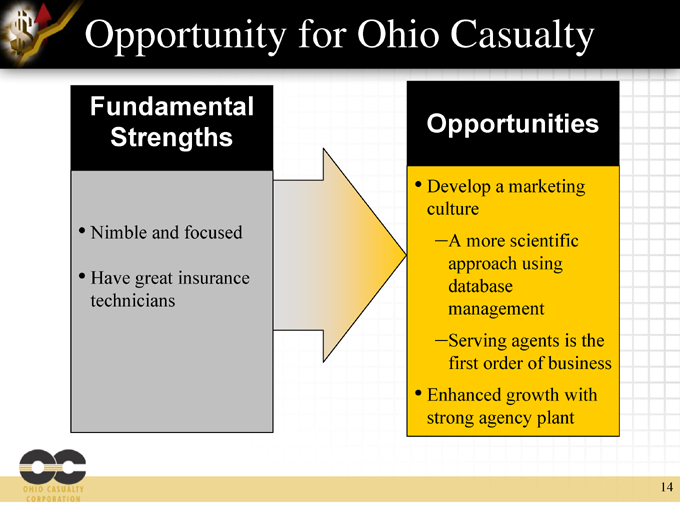
Opportunity for Ohio Casualty
Fundamental
Strengths
Nimble and focused
Have great insurance technicians
Opportunities
Develop a marketing culture
A more scientific approach using database management
Serving agents is the first order of business
Enhanced growth with strong agency plant
14
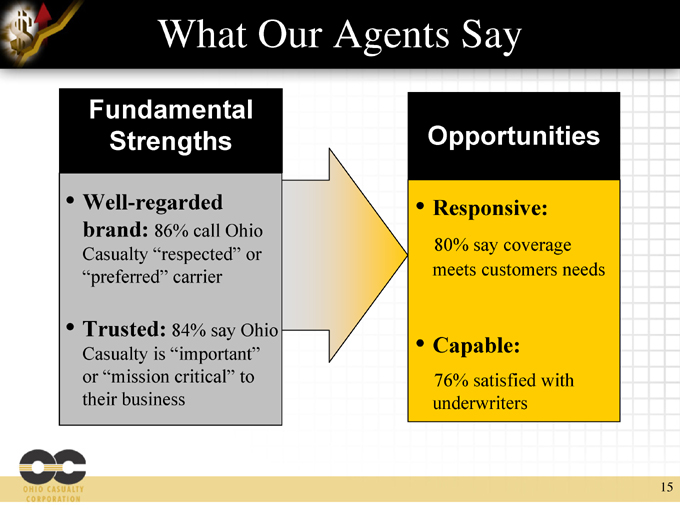
What Our Agents Say
Fundamental
Strengths
Well-regarded brand: 86% call Ohio Casualty “respected” or “preferred” carrier
Trusted: 84% say Ohio Casualty is “important” or “mission critical” to their business
Opportunities
Responsive:
80% say coverage meets customers needs
Capable:
76% satisfied with underwriters
15
Establishing A Marketing Culture
Become “mission critical” partner for more agents, raising average premium volume per agent
Better agency segmentation, recognizing agency life cycle
Strengthen ties with key agents
Develop a world-class marketing operation
Apply technology both for easy use by agents and improved targeted marketing
Walk the talk—align management practices with selling, growth, and service
16
Commercial Lines Overview
Presented by:
Mike Sullivan
Senior Vice President, Commercial Lines
17

Operating Results Improving
Commercial Lines Combined Ratio
Calendar Year Statutory Basis
116.2%
115.1%
112.3%
99.3%
103.3%
Expense Ratio
Loss + LAE Ratio
36.4
36.3
36.4
34.3
32.8
79.8
78.8
75.9
65.0
70.5
2001
2002
2003
2004
1H05
Accident year combined ratio: 100.0% 103.7% 100.3% 99.1%
Workers’ compensation adverse prior year reserve development added 5.7 points to the 1H05 calendar year combined ratio above.
Accident years 2005 and 2004 evaluated as of June 30, 2005. Accident years 2003 and 2002 evaluated as of December 31, 2004.
18

Competitive Environment
Current Trends
Carriers are focused on renewal retention
Price decreases are common on medium and large accounts
Competition is intense for new business
Service, agency automation, and relationships can be leveraged
Our Price Adequacy and Profitability Actions
Pricing goals are communicated to underwriters at policy/account level
Monthly reports monitor performance to goal at various levels of detail
Reinsurers say our pricing controls are among the best
Enhanced underwriting quality control process
19

Growth Initiatives
Leverage underwriter-agency relationships
Incentives for underwriting staff
Agency segmentation and improved agency management
Agency automation to make it easier for agents
Policy quote, issuance, and endorsement capabilities through P.A.R.I.S. ExpressSM
Rapid quote
Navigation improvements
Commercial Lines Service Center
Increased pricing sophistication
20
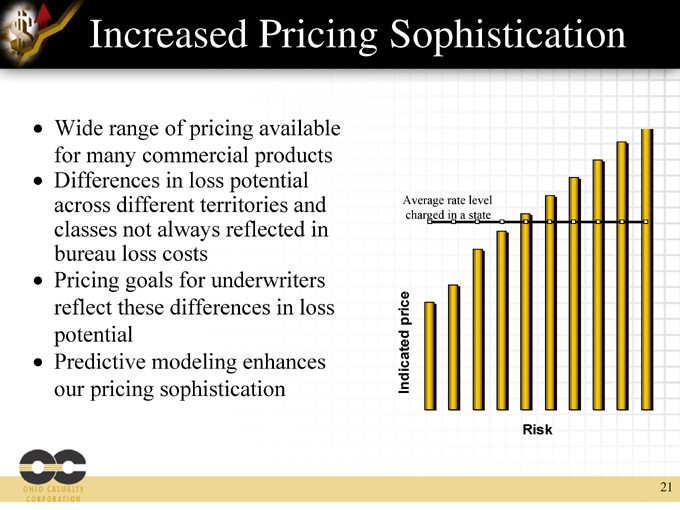
Increased Pricing Sophistication
Wide range of pricing available for many commercial products
Differences in loss potential across different territories and classes not always reflected in bureau loss costs
Pricing goals for underwriters reflect these differences in loss potential
Predictive modeling enhances our pricing sophistication
Average rate level
charged in a state
Indicated price
Risk
21

Personal Lines Overview
Presented by:
Derrick Shannon
Senior Vice President, Personal Lines
22

Operating Results Improving
Personal Lines Combined Ratio
Calendar Year Statutory Basis
Expense Ratio
Loss + LAE Ratio
119.2%
114.1%
105.6%
97.6%
80.9%
33.7
29.6
27.1
28.9
24.1
85.5
84.5
78.5
68.7
56.8
2001
2002
2003
2004
1H05
Accident year combined ratio: 111.5% 101.4% 95.5% 89.0%
NJ personal auto transfer and guaranty fee impact on combined ratios above: 2001 +6.3 points, 2004 +3.2 points, 2005 -2.2 points.
Accident years 2005 and 2004 evaluated as of June 30, 2005. Accident years 2003 and 2002 evaluated as of December 31, 2004.
23
Competitive Environment
Industry pricing has remained rational
Moderate pricing decreases as declining frequency continues
Some evidence of substantial pricing decreases by class
Pricing sophistication has increased
Industry underwriting appetite increased due to rate adequacy
Increased incentives and advertising to spark growth
Workflow solutions have become increasingly important
Resurgence of reliance on comparative raters
Improved proprietary interfaces
24
Growth Initiatives
Focus on agency workflow to increase quote volume
Partner with comparative raters to ensure accurate quoting
Expand solutions allowing agents to work from their agency management systems
Expand underwriting appetite through improved pricing sophistication
Expand breadth of product to meet more consumers’ needs
Additional use of targeted incentives
Emphasis on marketing effectiveness
Price Adequacy and Profitability Actions
Pricing discipline through trend analysis
Predictive modeling/class plan reviews
25

Expanding Agency Workflow Solutions
Comparative Raters
Real time
Web-based
Upload/Download
Given relatively stable conversion rates, increased quote volume means increased premium volume
26
Specialty Lines Overview
Presented by:
John Busby
Executive Vice President & Chief Operating Officer, Specialty Lines
27

Positive Operating Results
Specialty Lines Combined Ratio
Calendar Year Statutory Basis
Expense Ratio
Loss + LAE Ratio
90.8%
94.0%
77.2%
97.2%
87.6%
38.4
44.1
43.5
49.7
36.4
52.4
49.9
33.7
47.5
51.2
2001
2002
2003
2004
1H05
Accident year combined ratio: 87.1% 88.5% 102.9% 93.7%
Bond calendar year combined ratio: 81.7% 68.1% 78.9% 76.8%
Reinsurance ceded premium adjustments reflected in ratios above: 2002 $5.3 million return ceded premium for bonds, 2003 $3.5 million
additional ceded premium for commercial umbrella, 2004 $6.1 million additional ceded premium for commercial umbrella.
Accident years 2005 and 2004 evaluated as of June 30, 2005. Accident years 2003 and 2002 evaluated as of December 31, 2004.
28

Competitive Environment
Bonds:
Contract Surety—four companies have left the market this year, underwriting standards maintained, focus on quality accounts with appropriate work program size
Commercial Surety—competition reasonable for license, public official, probate bonds
Financial Institution—extremely price competitive
Commercial Umbrella:
Regional carriers—expanding their umbrella appetite
National carriers—very aggressive pricing
Business switching back to retailers from wholesalers
Terms and conditions holding firm as pricing declines for several but not all business classifications
29

Bonds:
Identify potential new agent appointments, target agents for increased production
Automate agency bond issuance to enhance excellent service
Leverage local presence—20 strategically located offices
Commercial Umbrella:
Additional cross-selling for Commercial Lines accounts as business shifts to retail agents
Increasing price sophistication and product offerings
Emphasis on marketing/sales/relationship-building
Growth Initiatives
30

Price Adequacy and Profitability
Bonds:
Experienced staff—average bond manager has > 25 years
Loss ratio averaged 15.1% for past 15 years
Stable underwriting appetite with appropriate field authority
Commercial Umbrella:
Focus on low to medium severity with appropriate attachment points
Underwriting audit controls including reinsurer reviews
31

Katrina Update
Rapid claims response
Loss estimate
Ohio Casualty Corporation
32
Operations
Questions and Answers
33
Luncheon
Ohio Casualty Corporation

Technology Update
Ohio Casualty Corporation

Responding to Agents’ Needs
John Kellington
Senior Vice President & Chief Technology Officer
36
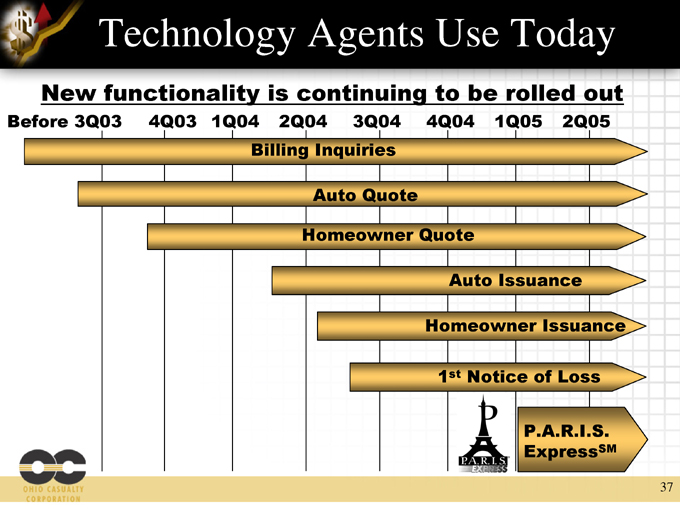
Technology Agents Use Today
New functionality is continuing to be rolled out
Before 3Q03
4Q03
1Q04
2Q04
3Q04
4Q04
1Q05
2Q05
Billing Inquiries
Auto Quote
Homeowner Quote
Homeowner Issuance
1st Notice of Loss
Auto Issuance
P.A.R.I.S.
ExpressSM
37

P.A.R.I.S.SM Access Via Our Website
P.A.R.I.S. ExpressSM provides P.A.R.I.S.SM functionality to the agents via the OCG Website
Currently quotes new business for businessowners, workers’ compensation, commercial auto, artisans, and inland marine
Issuance and endorsements is in pilot for businessowners, workers’ compensation and commercial auto
38

Transparent Connection for Agents
P.A.R.I.S. ConnectTM leverages P.A.R.I.S.SM functionality to provide interface capabilities to the agents via the agents management system
Currently quotes new business for businessowners & workers’ compensation for Applied users
Development under way for commercial auto and AMS users
39
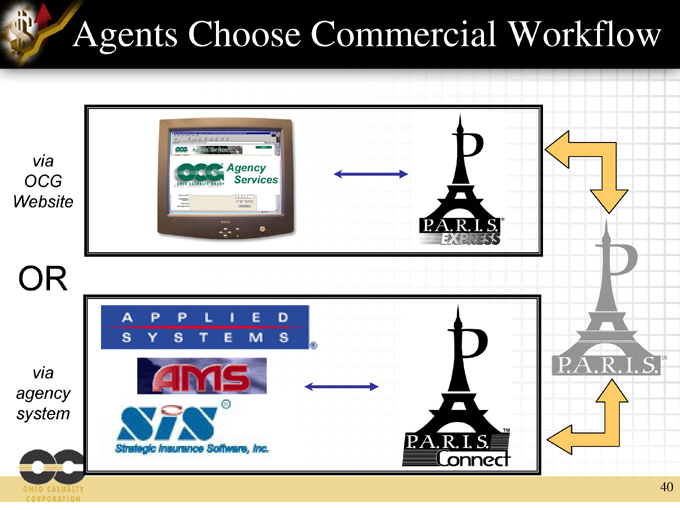
Agents Choose Commercial Workflow
via OCG Website
OR
via agency system
40
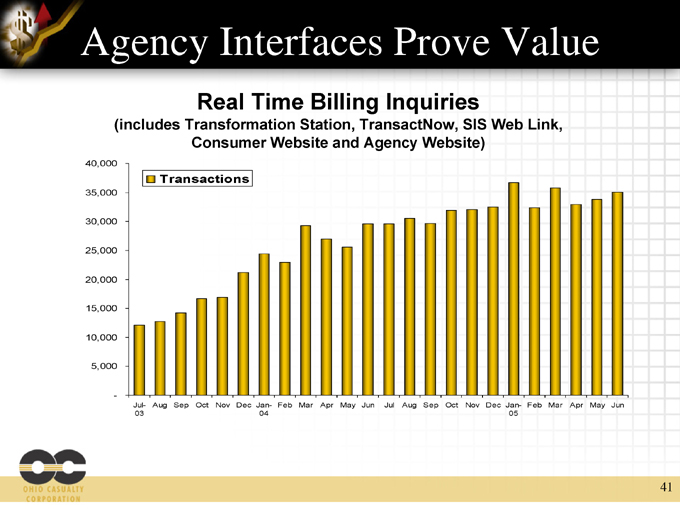
Agency Interfaces Prove Value
Real Time Billing Inquiries
(includes Transformation Station, TransactNow, SIS Web Link,
Consumer Website and Agency Website)
-
5,000
10,000
15,000
20,000
25,000
30,000
35,000
40,000
Jul-03
Aug
Sep
Oct
Nov
Dec
Jan-04
Feb
Mar
Apr
May
Jun
Jul
Aug
Sep
Oct
Nov
Dec
Jan-05
Feb
Mar
Apr
May
Jun
Transactions
41

Agency Interfaces Prove Value
Personal Lines SEMCI
(Quoting and Issuance)
-
500
1,000
1,500
2,000
2,500
3,000
3,500
Jul-03
Aug
Sep
Oct
Nov
Dec
Jan-04
Feb
Mar
Apr
May
Jun
Jul
Aug
Sep
Oct
Nov
Dec
Jan-05
Feb
Mar
Apr
May
Jun
Transactions
42

Best-practices Focus to Ensure Success
Software Industry Risks
In the Software Industry:
74% of all new projects fail
66% of all successful projects have significant cost and time over-runs
Failed projects result in:
Zero results for resource (dollars) investment
Missed business opportunities
Missed opportunity for other potential impact projects
Minimizing Our Exposure
Heavy emphasis on rigid project management disciplines
Enterprise prioritization of major projects
Implementation of structured development methodologies
Implementation of architectural governance and design patterns
“OCG Approved” software environments and platforms
Skill development and resource management
43

Our Technology At Work
Video Clip
How our technology is being used in our agencies’ offices
Ohio Casualty Corporation

Agents’ Roundtable
Ohio Casualty Corporation
Agents’ Perspectives
Panel of Independent Agents
Tom Cassady – USI Midwest
Bill Dillhoff – Kneflin-Dillhoff-Hils & Kruse Inc.
Jack Massey – Putnam Agency Inc.
46
Financial Update
Ohio Casualty Corporation

Maximizing Risk-Adjusted Returns
Paul Gerard
Senior Vice President, Investments
48
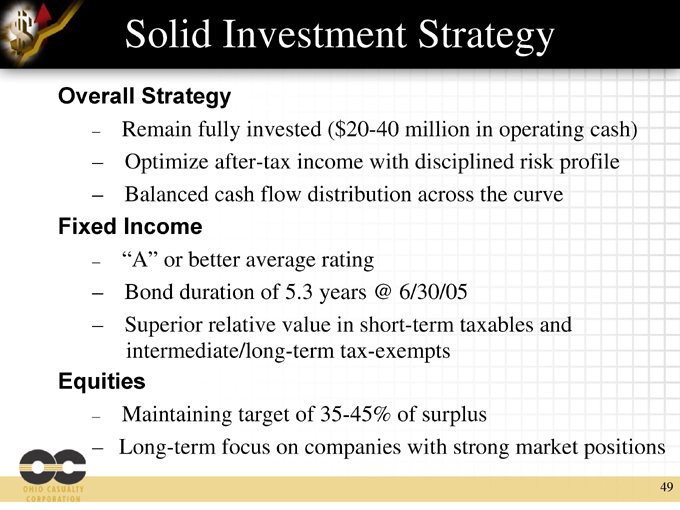
Solid Investment Strategy
Overall Strategy
Remain fully invested ($20-40 million in operating cash)
Optimize after-tax income with disciplined risk profile
Balanced cash flow distribution across the curve
Fixed Income
“A” or better average rating
Bond duration of 5.3 years @ 6/30/05
Superior relative value in short-term taxables and intermediate/long-term tax-exempts
Equities
Maintaining target of 35-45% of surplus
Long-term focus on companies with strong market positions
49

Quality with Tax-Exempt Emphasis
Total fixed income portfolio $3.8 billion
Fixed Income Credit Quality
NAIC 3 2.1%
NAIC 2 16.2%
NAIC 4 .3%
NAIC 1 81.4%
Total invested assets $4.2 billion
Invested Asset Allocation
Other 4%
Equity 9%
Mortgage & Asset Backed 16%
Tax Exempt 29%
Investment Grade Corporate 42%
Market value as of 6-30-05
50

Performance Attributes
Book yield focus
Duration and convexity considerations
Portfolio quality
Asset allocation
Maximizing after-tax investment income
Benchmark comparisons
51
Keys to Investment Success
Risk management processes in place, focused on credit analysis and portfolio modeling
Modeling operating cash flows and liability duration drive investment portfolio duration management
Ongoing review of tax position and strategies
Focus on maximizing risk-adjusted returns
52

Financial Highlights
Presented by:
Mike Winner
Executive Vice President & Chief Financial Officer
53

Strong Balance Sheet
Cash/securities at holding company of $250 million* for financial flexibility
High quality diversified investment portfolio
Reinsurance program with security emphasis
Diversified group of highly rated reinsurers
Funds held for reinsurance treaties secures 24%* of reinsurance recoverable
Favorable reserve development
$ millions
$2.5
$10.2
$3.1
$5.9
$3.8
$2.9
1Q04
2Q04
3Q04
4Q04
1Q05
2Q05
54

Outstanding Capital Adequacy
A.M. Best Capital Adequacy Ratio (BCAR) of 222.7% as of 12-31-04
Implied balance sheet strength rating is A++
A.M. Best Financial Strength rating also considers operating performance and business profile—ours has improved
S&P Capital Adequacy Ratio is 181.2%
Assessment of capital adequacy is extremely strong (quantitatively equivalent to AAA)
55

Parent Company Capital Strategy
Objectives:
Long-term common stock appreciation
Growth in EPS, ROE, and book value
Increase in price-to-book multiple
Underwriting profit to drive growth in capital, 10-12% ROE
Significant liquidity and ready access to capital
Conservative operating and financial leverage
Prudent approach to share repurchase and dividends
56
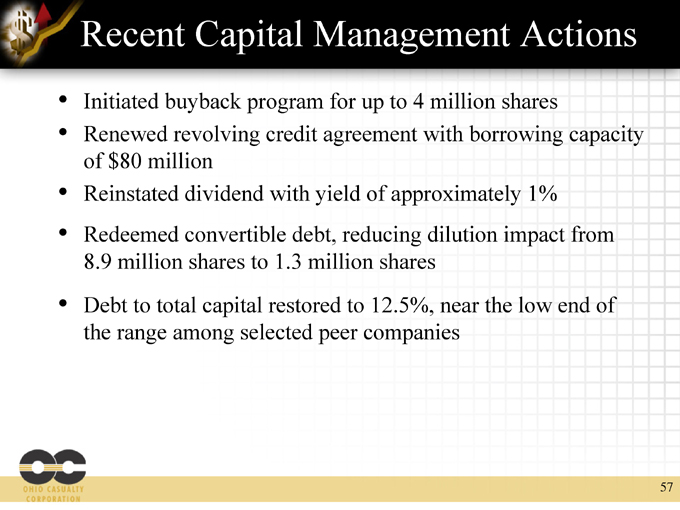
Recent Capital Management Actions
Initiated buyback program for up to 4 million shares
Renewed revolving credit agreement with borrowing capacity of $80 million
Reinstated dividend with yield of approximately 1%
Redeemed convertible debt, reducing dilution impact from 8.9 million shares to 1.3 million shares
Debt to total capital restored to 12.5%, near the low end of the range among selected peer companies
57

Execution Reflected In Results
Operating EPS*
36%
131%
275%
62%
68%
83%
** 31%
11%
Quarter over quarter Increase
$0.50
$0.28
$0.13
$0.12
$0.21
$0.38
$0.30
$0.45
$0.34
$0.64
$0.55
$0.59
4Q02
1Q03
2Q03
3Q03
4Q03
1Q04
2Q04
3Q04
4Q04
1Q05
2Q05
* | | Non-GAAP financial measure; see explanation and reconciliation in Ohio Casualty Corporation press release |
dated July 26, 2005. EPS for 2003 restated for adoption of EITF 04-8.
** Adjusted $.09 for after-tax charge related to retirement of convertible debt.
58
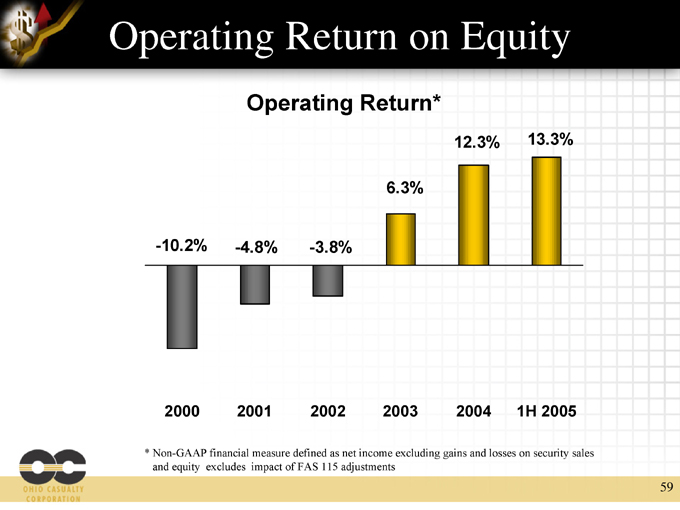
Operating Return*
Operating Return on Equity
-10.2%
-4.8%
-3.8%
6.3%
12.3%
13.3%
2000
2001
2002
2003
2004
1H 2005
* Non-GAAP financial measure defined as net income excluding gains and losses on security sales and equity excludes impact of FAS 115 adjustments
59

Narrowing the Gap
* | | As of June 30, 2005. Gross premiums written is on a rolling twelve month basis. |
Combined Ratio Improvement
YTD 2005 vs. Year 2000
23.3 Points
Ohio Casualty
15.2 Points
Selected Competitors
Selected competitors include CINF, ERIE, HGIC,HIG, SAFC, SIGI, STA, STFC.
Gross Premiums Written/Employee
Employee Count $517K $596K $733K $721K
2002 2003 2004 2005*
60

Expense Initiatives
2005 performance reflects positive impact of prior efforts
Process re-engineering
Benefit plan savings
Claims legal savings
Additional efforts under way
Procurement
Centralized processing
Efficiency from technology
Staff reductions of 37% since 2000
3,470 Employees
2,170 Employees
2000
2005
61

Overall Financial Excellence
Track record of consistently improving operating profitability
Significantly improved loss ratio since 2000
Permanent benefits from expense reduction initiatives
Investment in proven, industry-leading technology
Highly rated capital adequacy, strong loss reserves, conservative investment portfolio, ready access to capital markets
62

Where We’re Headed
Ohio Casualty Corporation
Conclusion/Discussion
Dan Carmichael
64

What’s Next for Ohio Casualty?
Management Remains Confident of Success
Cost reductions will continue to benefit future results
Targeted marketing, pricing sophistication and continued underwriting/pricing discipline for profitable growth
Superior service and technology attract and retain top agents, gain more of their business
Continued emphasis on improving financial strength, increasing book value
Reinstatement of shareholder dividend supports confident view of the future for Ohio Casualty Corporation
65

Price/Book Value per share
1.2
1.2
1.5
1.5
1.6
1.7
OCAS
CINF
SIGI
HIG
SAFC
STFC
A top market performer (up 101% since 2002), but only 1.2 times book vs. comparable average* of 1.5X
Midwest values, Midwest market focus
Results prove we can execute
Dedicated to maximizing shareholder return
* | | For selected competitors shown; all data as of 9-9-05 |
Still A Great Opportunity
66

Questions and Answers
67