SCHEDULE 14A
(RULE 14A – 101)
INFORMATION REQUIRED IN PROXY STATEMENT
SCHEDULE 14A INFORMATION
PROXY STATEMENT PURSUANT TO SECTION 14 (a) OF THE SECURITIES
EXCHANGE ACT OF 1934
(AMENDMENT NO. 5)
Filed by the Registrantþ Filed by a Party other than the Registrant¨
Check the appropriate box:
| ¨ | Preliminary Proxy Statement |
| ¨ | Definitive Proxy Statement |
| ¨ | Definitive Additional Materials |
| þ | Soliciting Material Pursuant to Rule 14a-11 (c) or Rule 14a-12 |
| ¨ | CONFIDENTIAL, FOR THE USE OF THE COMMISSION ONLY (AS PERMITTED BY RULE 14a-6 (e) (2) ) |
Ohio Casualty Corporation
(NAME OF REGISTRANT AS SPECIFIED IN ITS CHARTER)
(NAME OF PERSON (S) FILING PROXY STATEMENT, IF OTHER THAN THE REGISTRANT)
Payment of Filing Fee (Check the appropriate box):
| þ | No fee required. |
| ¨ | Fee computed on table below per Exchange Act Rules 14a-6 (i) (1) and 0-11. |
| (1) | Title of each class of securities to which transaction applies: |
| (2) | Aggregate number of securities to which transaction applies: |
| (3) | Per unit price or other underlying value of transaction computed pursuant to Exchange Act Rule 0-11 (Set forth the amount on which the filing fee is calculated and state how it was determined): |
| (4) | Proposed maximum aggregate value of transaction: |
| (5) | Total fee paid: |
| ¨ | Fee paid previously with preliminary materials. |
| ¨ | Check box if any part of the fee is offset as provided by Exchange Act Rule 0-11 (a) (2) and identify the filing for which the offsetting fee was paid previously. Identify the previous filing by registration statement number, or the Form or Schedule and the date of its filing. |
| (1) | Amount Previously Paid: |
| (2) | Form, Schedule or Registration Statement No.: |
| (3) | Filing Party: |
| (4) | Date Filed: |
Please Note
| · | Additional Information and Where to Find It |
This communication may be deemed to be solicitation material in respect of the proposed transaction. In connection with the proposed transaction, a proxy statement of Ohio Casualty and other materials have been filed with the SEC. WE URGE INVESTORS TO READ THE PROXY STATEMENT AND THESE OTHER MATERIALS CAREFULLY BECAUSE THEY CONTAIN IMPORTANT INFORMATION ABOUT OHIO CASUALTY CORPORATION AND THE PROPOSED TRANSACTION. Investors are able to obtain free copies of the proxy statement as well as other filed documents containing information about Ohio Casualty on the SEC’s website athttp://www.sec.gov. Free copies of Ohio Casualty’s SEC filings are also available from Ohio Casualty Corporation, 9450 Seward Road, Fairfield, Ohio 45014, Attention: Investor Relations.
| · | Participants in the Solicitation |
Ohio Casualty and its executive officers, directors, other members of management, employees and Liberty Mutual may be deemed, under SEC rules, to be participants in the solicitation of proxies from Ohio Casualty’s shareholders with respect to the proposed transaction. Information regarding the executive officers and directors of Ohio Casualty is set forth in its definitive proxy statement for its 2007 annual meeting filed with the SEC on April 4, 2007. More detailed information regarding the identity of potential participants, and their direct or indirect interests, by securities holdings or otherwise, is also set forth in the proxy statement filed with the SEC in connection with the proposed transaction and dated June 29, 2007.

Financial Highlights
[DOLLARS IN MILLIONS]
December 31, | 2006 | 2005 | 2004 | |||||||||||
Liberty Mutual | Revenues | $ | 23,520 | $ | 21,161 | $ | 19,641 | |||||||
Group | Pre-tax operating income | 1,640 | 399 | 766 | ||||||||||
| Net income | 1,626 | 1,027 | 1,245 | |||||||||||
| Cash Flow from operations | 3,895 | 3,464 | 3,237 | |||||||||||
| Total assets | 85,498 | 78,824 | 72,457 | |||||||||||
| GAAP combined ratio | 99.3 | % | 105.7 | % | 102.9 | % | ||||||||
Personal Markets | Revenues | $ | 6,695 | $ | 6,083 | $ | 5,931 | |||||||
| Pre-tax operating income | 782 | 636 | 613 | |||||||||||
| Cash Flow from operations, pre-tax | 1,551 | 869 | 990 | |||||||||||
| Total assets | 16,653 | 15,271 | 13,810 | |||||||||||
| GAAP combined ratio | 92.1 | % | 94.7 | % | 95.5 | % | ||||||||
Commercial Markets | Revenues | $ | 4,771 | $ | 4,437 | $ | 4,408 | |||||||
| Pre-tax operating income | 301 | 191 | 308 | |||||||||||
| Cash Flow from operations, pre-tax | 1,127 | 790 | 960 | |||||||||||
| Total assets | 23,646 | 22,354 | 21,428 | |||||||||||
| GAAP combined ratio | 105.4 | % | 108.7 | % | 105.3 | % | ||||||||
Agency Markets | Revenues | $ | 6,246 | $ | 5,830 | $ | 5,185 | |||||||
| Pre-tax operating income | 632 | 564 | 417 | |||||||||||
| Cash Flow from operations, pre-tax | 1,591 | 1,445 | 1,189 | |||||||||||
| Total assets | 15,893 | 14,471 | 13,281 | |||||||||||
| GAAP combined ratio | 97.8 | % | 98.3 | % | 100.6 | % | ||||||||
International | Revenues | $ | 4,900 | $ | 3,908 | $ | 3,620 | |||||||
| Pre-tax operating income | 467 | (244 | ) | 273 | ||||||||||
| Cash Flow from operations, pre-tax | 848 | 967 | 768 | |||||||||||
| Total assets | 17,687 | 14,515 | 12,680 | |||||||||||
| GAAP combined ratio | 97.2 | % | 117.0 | % | 97.9 | % | ||||||||
Other | Revenues | $ | 908 | $ | 903 | $ | 497 | |||||||
| Pre-tax operating income | (542 | ) | (748 | ) | (845 | ) | ||||||||
| Cash Flow from operations | (1,222 | ) | (607 | ) | (670 | ) | ||||||||
Pre-tax operating income is defined as net income in accordance with Generally Accepted Accounting Principles (GAAP) excluding net realized gains (losses), results from private equity investments, federal and foreign income taxes, extraordinary items, discontinued operations and cumulative effect of changes in accounting principles. Investment income is allocated to the major businesses on a total return basis and differs from the methodology utilized in the Company’s recent debt offering memorandum and its financial reporting on the Company’s website. Pre-tax operating income is the basis used by management for measuring operating performance internally. However, analysis of the Company’s results should be used only in conjunction with data presented in accordance with GAAP.
Other includes discontinued operations (including asbestos and environmental), interest expense, internal reinsurance programs, net investment income after allocations to business units, certain expenses not allocated to the business units, net realized gains and losses from domestic operations and other revenues from corporate subsidiaries.
Personal Markets reported above includes Individual Life, which differs from the financial reporting on the Company’s website where Individual Life is included in Corporate and Other. Each business unit is reported in accordance with GAAP.
Contents | Policyholder Message 3 | Company Overview 7 | Strategic Business Units 11 | Worldwide Office and Company Locations 26 | Financial Statements 27
If you were to ask Liberty Mutual employee Adriana Prado (on cover) or the other three individuals featured in this report about their actions, they’d say “we were just doing our jobs.” To their delighted customers, however, they far exceeded expectations. That’s what high-quality service is all about – honoring a promise of service even when the solution isn’t easy.
Thousands of Liberty Mutual employees put this belief into action every day – going that extra mile to make sure that we meet our policyholders’ needs. Why? Because it’s our responsibility, and it’s the right thing to do.

1

2
LIBERTY MUTUAL GROUP | POLICYHOLDER MESSAGE
What a difference a year–and the weather–makes. One year ago, I wrote you about the negative effect of a devastating Atlantic and Gulf Coast hurricane season. In 2006, except for a few smaller, but locally costly, hailstorm events, we had a mild year as far as natural catastrophes went. The result: Liberty Mutual Group and its industry peers reported record profits.
Ironically, the lack of storms in 2006 may have a more significant, long-term impact on the industry than a hurricane-heavy year – more on that later.
Looking at the numbers, 2006 was a very, very successful year for Liberty Mutual Group. While we felt some competitive pressure on prices, we grew all lines of business, experiencing 11 percent growth in total revenue, a growth rate well ahead of the industry. While growing substantially, we produced net income of $1.6 billion, a number that exceeds last year’s total by 58 percent, and the company’s previous record by 31 percent. Contributing significantly to these results, as it has for several years now, was our investment activity, as our private equity and energy investments continued to produce exceptional results.
While pleased with our earnings, our primary emphasis continued to be the quality of our balance sheet, which is rock solid. Nothing is more important to our policyholders, and the longer-term health of the company, than the confidence that our reserves are sufficient to satisfy all legitimate claims.
While our aggregate numbers were over-and-above expectations, perhaps more revealing are the numbers for our Strategic Business Units: Personal Markets, Agency Markets, Commercial Markets and Liberty International.
In Personal Markets, which sells direct under the Liberty Mutual brand, we were a major beneficiary of the lack of significant storm events, and reported very satisfactory earnings. We expanded our affinity marketing programs and continued to be the leader in this good source of high-quality business. Voluntary policies inforce grew by 2.5 and 3.5 percent in auto and homeowners, respectively.
3
LIBERTY MUTUAL GROUP | POLICYHOLDER MESSAGE
Looking longer term, we began to surgically reduce our exposure in areas of more extreme weather risk. We refrained, however, from widespread cancellations, staying consistent with our philosophy of carefully managing risk, and providing affordable insurance to our policyholders while maintaining our profit levels.
In Agency Markets, our organization of regional and national property and casualty insurers that distribute their products and services through brokers and agents, each of the franchises had a successful year. Our more than 6,600 independent agency partners continue to demonstrate an ability to meet customer needs, particularly those of small to mid-size businesses.
In 2005, lacking a heavy concentration of property business in hurricane-prone areas, Agency Markets was for the most part sheltered from major weather events. That was not the case in 2006, as the hailstorms and similar events in the Midwest affected our Agency Markets’ policyholders. Still, Agency Markets had an exceptional year overall, with revenue growth of 7 percent and a 12 percent increase in pre-tax operating income.
In Commercial Markets, each operating unit had an excellent year. Liberty Mutual Property benefited from the combination of solid underwriting, strong pricing and lack of significant storm events. Business Market, which sells to the middle market, added significantly to its direct sales force and showed great growth and retention. Despite some downward pressure on prices, we are extremely pleased with business quality, as exceptional coverage and service continue to sell well in the market. The National Market, focused on large companies with more than $2.5 million in annual cost of risk, now has 20 Fortune 100 accounts. Overall, Commercial Markets grew revenue and pre-tax operating income by 8 and 58 percent, respectively.
Liberty International’s country-by-country operations continued to expand. We received a general insurance license in Vietnam, and established a branch of our Spanish company in Poland. We expect to begin issuing our first policies by mid-year 2007. We also entered Turkey with the acquisition of Seker Sigorta A.S. Overall, our existing country operations in Europe, South America and Southeast Asia continued to thrive with overall growth and pre-tax operating income of 15 percent and $239 million, respectively.
4
Liberty International’s global specialty lines insurance and reinsurance business, Liberty International Underwriters (LIU), produced growth and pre-tax operating income of 42 percent and $228 million, respectively. In London, we are significantly reducing our writings of U.S. property catastrophe insurance, as the pricing for the risk is not adequate, even with a significant increase over the prior year. Elsewhere, we opportunistically grew LIU, which opened new offices in Houston, Los Angeles, Puerto Rico, Dubai and Hong Kong, and now operates 31 offices worldwide.
Earlier I said the long-term impact of a “no-hurricane” year may prove more detrimental to the industry than a year with multiple hurricanes. The challenge involves regulatory politics. While rate increases in Florida, for example, have been substantial, they are still inadequate for the risk. However, because of the lack of storms, the political process only looked at the industry’s 2006 profit, not the huge cumulative losses for prior years. The upshot has been the legislature putting the risk on the taxpayer, a vast increase in scope for the state-run Citizens Property Insurance Corp., and a mandated rate rollback. All in all, not a recipe for long-term stability and availability of insurance. In Connecticut, legislation that would bar insurers from requiring that policyholders institute certain risk reduction measures, such as the installation of hurricane shutters, is under consideration.
We will continue to grapple with these and other legislative and regulatory matters, as we see somewhat a reemergence of legislative behaviors that led to a crisis in insurance availability and cost in the 1980s. This trend obviously bears some watching.
On the competitive front, the market has been surprisingly benign. Downward pressure on prices clearly exists, although we anticipated more pressure than has actually emerged. This downward pressure will increase as the industry has plenty of capital and many of our competitors missed their growth targets in 2006, and we will monitor our pricing and underwriting standards carefully. For our policyholders in aggregate, we must not let marginal risks negatively impact the company’s overall financial position. That said, we are very optimistic that we can grow our book of business in 2007 while maintaining an acceptable level of quality.
A very public change in 2006 was the introduction of our new advertising campaign. Its “responsibility” theme, drawn from interviews with Liberty Mutual employees at all levels of the organization, has struck a chord with our customers, our employees and the broader community. We are very pleased with the response to this theme, which captures our feeling about our business and the people with whom we deal every day.
As part of the responsibility positioning, we established, in conjunction with the College Football Hall of Fame, the Liberty Mutual Coach of the Year Award. This award recognizes, not just a coach’s professional competence and achievement on the field, but also a coach’s commitment to the well-being and development of athletes, high ethical standards, and civic and charitable stewardship. I want to congratulate Coach Greg Schiano of Rutgers University, the first recipient of this annual honor.
5
LIBERTY MUTUAL GROUP | POLICYHOLDER MESSAGE
I would also like to highlight the 2006 Liberty Mutual National Firemark Award recipients. In October, Oscar-winning actress Marcia Gay Harden, who experienced a personal fire-related tragedy, presented the awards to firefighters Bonnie Lopez of Acton, Mass., and Omar Shareef and Albert Jason Boyd of Baltimore, Md.
This year also marked the launch of the Liberty Mutual Chairman’s Community Service Award, which recognizes the great work of so many Liberty employees with not-for-profit agencies around the country. While I was aware that many of our employees are involved in community activities, I was astounded, while reviewing the nominations, at how much, and how deeply, our employees commit themselves to improving the communities in which they live and work.
In closing, it is with some sadness that I say goodbye to Liberty Mutual board member Glenn Strehle, Treasurer Emeritus of the Massachusetts Institute of Technology, after 28 years of service. Glenn has been a great advisor and, as chair of the Audit Committee, has helped us immeasurably as we voluntarily (not being a public company) adopted an internal control attestation process consistent with public companies’ Sarbanes-Oxley attestations. We are a better company for Glenn’s service. We wish Glenn and his wife Kathie well, and we thank him again for all he has done for Liberty.
I also thank our board of directors for their continued guidance, our various distribution partners—affinity, independent agents, brokers—for their support, and our 39,000 employees worldwide for their expertise and dedication to our policyholders and our company.
Most importantly, I thank our policyholders and customers for their business, and for continuing to place your confidence in us.
 |
| Edmund F. Kelly |
| Chairman, President and Chief Executive Officer |
6
LIBERTY MUTUAL GROUP | COMPANY OVERVIEW
Liberty Mutual Group is a diversified global insurer whose largest line of business is private passenger auto, based on 2006 net written premium.
On December 31, 2006, Liberty Mutual Group had $85.5 billion in consolidated assets. Liberty Mutual is the 8th-largest personal lines writer and 4th-largest commercial lines writer in the U.S. based on 2006 direct written premium.
| REVENUE GROWTH | PRE-TAX INCOME GROWTH | |
| IN BILLIONS | IN MILLIONS | |
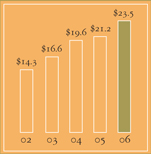 | 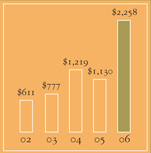 | |
7
LIBERTY MUTUAL GROUP | COMPANY OVERVIEW
Headquartered in Boston, Mass., Liberty Mutual Group employs more than 39,000 people in nearly 900 offices in 24 countries throughout the world.
Liberty Mutual Group has four strategic business units – Personal Markets, Commercial Markets, Agency Markets and Liberty International – with no single unit contributing more than 30 percent of net written premium. The company offers a wide range of insurance products and services, including private passenger automobile, homeowners, workers compensation, commercial multiple peril/fire, commercial automobile, general liability, assumed reinsurance, global specialty products, group disability and surety.
Liberty Mutual Group’s revenue for 2006 was $23.5 billion, an increase of $2.4 billion from 2005. Net investment income increased by $234 million to $2.3 billion, and cash flow from operations was $3.9 billion. Pre-tax operating income for 2006 was $1.6 billion, an increase of $1.2 billion from 2005. The Group’s GAAP property and casualty combined ratio decreased to 99.3 percent in 2006 from 105.7 percent in 2005, and policyholders’ equity increased by over $2.0 billion to $10.9 billion.
| David H. LongPresident, | J. Paul Condrin IIIPresident, | |
| Commercial Markets | Personal Markets | |
 |  | |
8
| STRATEGIC BUSINESS UNITS | SIGNIFICANT LINES OF BUSINESS | |
| $20.6 B NET WRITTEN PREMIUM | $20.6 B NET WRITTEN PREMIUM | |
 | 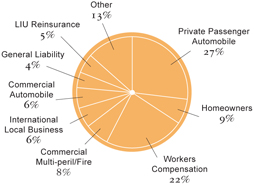 | |
| DIVERSIFICATION BY DISTRIBUTION CHANNEL | MIX OF BUSINESS | |
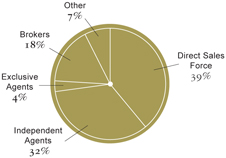 |  | |
| Gary R. GreggPresident, | Thomas C. RameyPresident, | A. Alexander FontanesExecutive | ||
| Agency Markets | Liberty International | Vice President & Chief Investment Officer | ||
 |  |  | ||
9

10
PERSONAL MARKETS | SALT LAKE CITY, UTAH
Beyond the Call
The storm seemed to take aim that morning at Erna Huck’s home at the base of the Wasatch Range, overlooking Salt Lake City. One moment the sun was shining; the next, pitch darkness. Within 15 minutes, the mini-storm’s winds destroyed her deck, downed trees and ripped out electrical service.
The damage was bad enough but, coming just days before Erna’s long-planned 95th birthday celebration, with 100 friends and family arriving from around the world, it was a personal catastrophe. Or so she thought.
In tears, the normally plucky woman – she stopped skiing at age 94 – called her son Rainer, also a Liberty Mutual policyholder, who lived nearby. “Call the insurance company and see if they can help,” she pleaded.
“I called Liberty Mutual, but I didn’t expect much to happen. Perhaps a check to cover damage expenses, but that’s about all,” said Rainer, who had rushed over to console his mother. “She had planned this party down to the smallest detail and cleaned the house top to bottom. She was even picking up individual leaves from the lawn!”
Rainer quickly found himself speaking with Andy Low, a Liberty Mutual claims adjuster. “I explained the situation to Andy and, amazingly, he had a crew of seven working that afternoon,” he said. “They removed all the crushed materials, cut the fallen trees to pieces and worked until 11 p.m. installing new electrical service. All this was clearly beyond the call of duty.”
But not to Andy. “I didn’t do anything out of the ordinary with this claim,” he said. “The timing of the storm was unfortunate, and I just lined up someone who could accelerate the repairs. Nothing I wouldn’t do for any insured. We simply provided the service she paid for, and deserved, and it was nice to know her birthday party proceeded as planned.”
11

12
PERSONAL MARKETS | AT A GLANCE
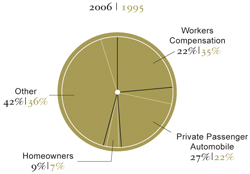
PRODUCT MIX (% 2006 NET WRITTEN PREMIUM) | 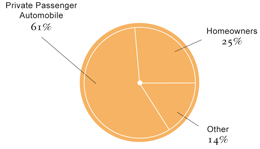 |
Liberty Mutual’s Personal Markets provides full lines of coverage for private passenger automobile, homeowners, valuable possessions, identity theft and personal liability through its own sales force in more than 350 offices throughout the U.S., two direct response centers, appointed Prudential agents and the internet. It also offers a wide range of traditional and variable life insurance and annuity products. Personal Markets’ largest source of new business is its more than 9,800 sponsored affinity group relationships, including employers, credit unions, and professional and alumni associations. Liberty Mutual’s affinity program is the industry’s most-sponsored voluntary auto and home insurance benefit.
Financial Results
| 2006 | 2005 | 2004 | ||||||||||
Revenues | $ | 6.7 billion | $ | 6.1 billion | $ | 5.9 billion | ||||||
Pre-tax operating income | $ | 782 million | $ | 636 million | $ | 613 million | ||||||
Cash flow from operations | $ | 1.6 billion | $ | 869 million | $ | 990 million | ||||||
GAAP combined ratio | 92.1 | % | 94.7 | % | 95.5 | % | ||||||
Policies in force | 4,812,921 | 4,670,548 | 4,563,142 | |||||||||
Distribution Channels
| • | Direct Sales Force |
| • | Direct Response Centers |
| • | Internet |
| • | Prudential Agents |
By The Numbers
| • | 4.4 million auto and home policies |
| • | 11,200 employees |
| • | 9,800 affinity relationships |
| • | 1,600 field sales representatives |
| • | 370 telesales counselors |
| • | 1,260 Prudential insurance agents |
13
COMMERCIAL MARKETS | GLENDALE, CALIFORNIA
What Matters Most
Kaleen Osendorf, a Liberty Mutual account service representative in Glendale, Calif., wasn’t out to save the environment. But in her own small way, that’s what she did.
Her story begins in Fall 2006 when San Bernardino County asked one of Kaleen’s customers, Anaheim-based West Coast Arborists (WCA), to clear bark beetle-infested trees in the county forest. The 34-year-old business provides various forestry services, such as tree pruning, removal and planting.
Over the past three years, drought and bark beetles had destroyed hundreds of thousands of trees, primarily on government-owned land, to such a degree that then-Governor Gray Davis proclaimed a State of Emergency in three counties. To help contain future fires, San Bernardino County asked WCA to create a firebreak to spare the healthy trees.
For WCA to proceed with the work, the County required proof of insurance, including an endorsement document called a “Loggers Broad Form.” “This was not a commonly used form, at least in California, and nobody knew what it included,” Kaleen said. To track it down, she contacted her local and national counterparts in underwriting, county and state forestry departments, and the International Risk Management Institute, but to no avail. “Nobody had heard of it,” she said.
But that didn’t stop her. After more than 50 phone calls and 90-plus emails, Kaleen gathered enough information for underwriting to draft an acceptable endorsement that incorporated elements from forms used in other states. And she did this while handling her regular $20 million customer service workload, whether it be renewing business, rolling out a new system or sitting in on claims meetings.
Meanwhile, the customer, WCA, which began work in December, had little knowledge of the lengths Kaleen went to in order to provide the required document. “That’s fine with me,” she said. “What matters most is they were able to begin work.”
14

15

16
COMMERCIAL MARKETS | AT A GLANCE
PRODUCT MIX (% 2006 NET WRITTEN PREMIUM) | 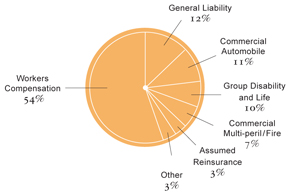 |
Liberty Mutual’s Commercial Markets provides risk and disability management and risk transfer products and services to buyers and buyers’ representatives through five business units:
| • | National Market, which serves the complex needs of large companies; |
| • | Business Market, which serves mid-sized businesses that prefer a direct relationship; |
| • | Liberty Mutual Property, which provides property insurance programs, loss control and claims services for both large and mid-sized companies; |
| • | Group Market, which provides short- and long-term disability products, integrated disability management, group life insurance, AD&D and FMLA administration for large and mid-sized businesses; and, |
| • | Liberty Mutual Reinsurance, which provides property and casualty reinsurance to insurance carriers worldwide. |
Financial Results
| 2006 | 2005 | 2004 | ||||||||||
Revenues | $ | 4.8 billion | $ | 4.4 billion | $ | 4.4 billion | ||||||
Pre-tax operating income | $ | 301 million | $ | 191 million | $ | 308 million | ||||||
Cash flow from operations | $ | 1.1 billion | $ | 0.8 billion | $ | 1.0 billion | ||||||
GAAP combined ratio | 105.4 | % | 108.7 | % | 105.3 | % | ||||||
Distribution Channels
| • | Direct Sales Force |
| • | National and Regional Brokers |
| • | Benefit and Risk Management Consulting Firms |
By The Numbers
| • | 8,960 employees |
| • | 540 account executives |
| • | 546,000 claims call center calls |
| • | 1,780 national customers |
| • | 8,100 middle-market customers |
| • | 370 loss prevention consultants |
| • | $1.2 billion in medical bill review savings |
17
AGENCY MARKETS | COLDWATER, OHIO
No Brainer
It was an exciting time for the Coldwater, Ohio, village school system. A long-awaited, $35 million renovation and expansion of the rural town’s K-12 public school, serving 1,500 students from a 40-square-mile area, was soon to begin.
But Sherry Shaffer, the school’s Treasurer and Chief Financial Officer (pictured on opposite page with Carolee Roberts, a senior loss prevention consultant with Indiana Insurance, a Liberty Mutual Agency Markets company), had a nagging concern. How do you hold classes safely during the school’s anticipated, three-year construction period? “We couldn’t just stop teaching,” she said, “but we had to make sure we drew on all of our resources so that staff and students were safe.”
For help, Sherry turned to the school’s insurance agency, Phelan Insurance of nearby Versailles, Ohio, one of the independent insurance agencies that distributes Indiana Insurance products and services. They put Sherry in touch with Carolee for expert construction loss prevention advice. “Construction safety can be both exciting and challenging,” Carolee said. “Whenever you deal with human behavior, especially a seven- or eight-year-old’s behavior, you have to be ready for anything.”
During the next two years of construction, Carolee visited the school regularly, meeting with Sherry, the architect, and the contractor. Nothing escaped her notice, from the need to install exterior barricading and fencing to the proper placement of gas shut-off switches in the science labs. She even helped one of the school’s maintenance professionals earn Playground Safety Inspector certification. “She didn’t just do the inspections,” Shaffer said. “She took it as a personal mission to ensure that no one would get hurt during construction.”
Coldwater completed its school renovation in the fall of 2006, with no severe, or even reportable, injuries. Today, Carolee, at Sherry Shaffer’s request, continues her regular visits, making sure the school follows her recommendations, and even testing the school’s preparedness for an incidence of school violence.
When it came time to put the school’s insurance coverage out for bid, as required by the Board of Education, the final decision was a “no brainer.” “Carolee made that decision easy,” Sherry said.
18

19

20
AGENCY MARKETS | AT A GLANCE
PRODUCT MIX (% 2006 NET WRITTEN PREMIUM) | 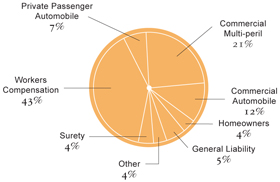 |
Liberty Mutual Agency Markets consists of property and casualty, and specialty insurance carriers that distribute their products and services through agents and brokers.
Core Property and Casualty Products
Core property and casualty products, including a comprehensive set of personal and commercial coverages, are available in most states from the following companies:
| • | America First Insurance (Gulf Region) |
| • | Colorado Casualty (Mountain Region) |
| • | Golden Eagle Insurance (Pacific Region) |
| • | Hawkeye-Security Insurance (North Central Region) |
| • | Indiana Insurance (Midwest Region) |
| • | Liberty Northwest (Pacific Northwest Region) |
| • | Montgomery Insurance (Southeast Region) |
| • | Peerless Insurance (Northeast Region) |
| • | Wausau Insurance Companies (National) |
Agency Markets also includes Summit Holding Southeast, Inc., a specialty insurer offering workers compensation products and services in Florida and nine Southeast states, and Liberty Mutual Surety, offering contract surety bonds for construction firms, manufacturers and suppliers, and commercial surety bonds for corporations and individuals.
Financial Results
| 2006 | 2005 | 2004 | ||||||||||
Revenues | $ | 6.2 billion | $ | 5.8 billion | $ | 5.2 billion | ||||||
Pre-tax operating income | $ | 632 million | $ | 564 million | $ | 417 million | ||||||
Cash flow from operations | $ | 1.6 billion | $ | 1.4 billion | $ | 1.2 billion | ||||||
GAAP combined ratio | 97.8 | % | 98.3 | % | 100.6 | % | ||||||
By The Numbers
| • | More than 6,900 employees |
| • | More than 6,600 appointed independent agents and brokers |
| • | 822,600 personal lines and 474,500 commercial lines Regional Company policies in force, with average premium of $900 and $5,900, respectively |
| • | 24,500 Summit policies in force with average premium of $34,300 |
| • | 11,800 Wausau Insurance accounts in force, averaging $156,000 in account size |
21

22
LIBERTY INTERNATIONAL | UBERLANDIA, BRAZIL
Being Human
It was a vacation turned nightmare. That’s how Liberty Seguros (Brazil) policyholder Joao Klinger Ribeiro describes what happened on March 1, 2006, as he and two family members were driving about 550 miles from home in the Bahia region of Brazil.
“One moment I’m changing the CD, the next we’re off the road and bouncing down a steep hillside,” he said. When the car hit a pole and finally came to rest, he knew he and his sister, judging from her screams, were badly injured. “Passersby could do little more than cool us off with towels. They knew they shouldn’t move us.”
With no cellphone service in rural northeast Brazil, someone flagged down a passing army truck, which radioed for an ambulance. Surgeons at a nearby hospital operated on his lower back, and placed him in a cast that jutted his legs away in a V shape. Eight days after the accident, the doctor wanted to release him.
But there was a problem: transport out of rural, uneven terrain with a broken back would not be easy. “Mr. Ribeiro called his auto insurance agent at Romap Seguros, which sells Liberty Seguros policies, in his hometown of Uberlandia, and the agent soon called me for help,” said Adriana Corsari Prado in Sao Paulo, who manages external service providers for Liberty Seguros.
Compounding the problem, according to Adriana, was that Mr. Ribeiro’s policy entitled him to an economy class plane ticket home but, because of his cast, a commercial jet’s seating couldn’t accommodate him. An ambulance was also out of the question as the bumpy, 500-mile ride home could cause more serious harm, even paralysis.
“I knew we had to get him home, and after analyzing all potential risk to our company and the policyholder, I researched other transport options, including private jets,” Adriana said. Finally, working with Mondial Assistance, she negotiated the release of an ambulance plane to transport Mr. Ribeiro and his sister, who had suffered two broken vertebrae, home to Uberlandia.
After four months in a cast and two months of physical therapy, a grateful Mr. Ribeiro (pictured outside his home on the opposite page) is fully recovered. Writing to Liberty Seguros, he said: “In one of the most difficult moments of my life, you were there. Please, go on with this beautiful professionalism but, above all, go on being human.”
23

24
LIBERTY INTERNATIONAL | AT A GLANCE
PRODUCT MIX (% 2006 NET WRITTEN PREMIUM) | 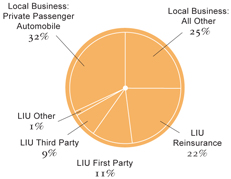 |
Liberty International provides personal and small commercial lines insurance through operations in 14 countries. Additionally, Liberty International Underwriters, a global specialty commercial lines insurance and reinsurance business, provides casualty, specialty casualty, marine, energy, engineering and aviation insurance products through 31 offices in Asia, Australia, Europe, the Middle East and North America. Liberty Syndicate 4472 at Lloyd���s of London writes on a worldwide basis.
Financial Results
| 2006 | 2005 | 2004 | ||||||||||
Revenues | $ | 4.9 billion | $ | 3.9 billion | $ | 3.6 billion | ||||||
Pre-tax operating income | $ | 467 million | $ | (244) million | $ | 273 million | ||||||
Cash flow from operations | $ | 848 million | $ | 967 million | $ | 768 million | ||||||
GAAP combined ratio | 97.2 | % | 117.0 | % | 97.9 | % | ||||||
By The Numbers
| • | 2nd largest U.S.-based international property and casualty insurance company |
| • | 7,300 employees worldwide |
| • | offices in 24 countries |
| • | number one ranking in Colombia and Venezuela |
| • | a top ten property and casualty company in Argentina, Chile, Portugal, Spain, Singapore and Thailand |
| • | net written premium grew 24 percent in 2006 with sustained compound annual growth rate of 18 percent since 1998 |
Country Operations(57 percent of International Net Written Premium)
Asia
Liberty Mutual Insurance Company (China), Liberty International Insurance Ltd. (Hong Kong), Liberty Insurance Pte. Ltd. (Singapore), LMG Insurance (Thailand), Liberty Insurance Ltd. (Vietnam)
Europe
Liberty Direct (Poland), Liberty Seguros (Portugal), Liberty Seguros and Genesis (Spain), Seker Sigorta A.S. (Turkey)
Latin America
Liberty ART S.A. (Argentina), Liberty Seguros Argentina S.A., Liberty Paulista Seguros (Brazil), Liberty Seguros (Chile), Liberty Seguros (Colombia), Seguros Caracas de Liberty Mutual C.A. (Venezuela)
Liberty International Underwriters
(LIU) (43 percent of International Net Written Premium)
Liberty Syndicate Management (Lloyd’s), Liberty Mutual Insurance Europe, LIU Australia, LIU Canada, LIU Dubai, LIU Hong Kong, LIU Singapore, LIU U.S.
25
LIBERTY MUTUAL GROUP | WORLDWIDE PRESENCE
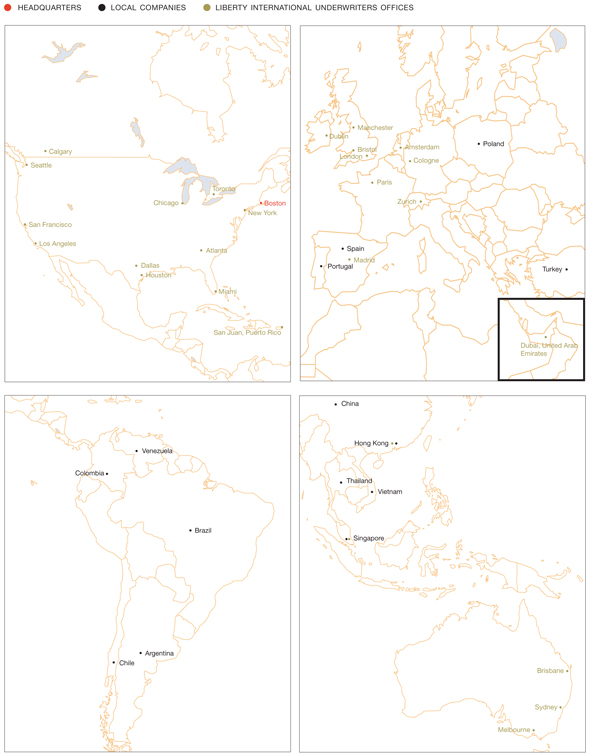
26
LIBERTY MUTUAL HOLDING COMPANY INC.
Financial Statements
Consolidated Statements of Income 28 | Consolidated Balance Sheets 29 | Consolidated Statements of Cash Flows 30 | Consolidated Statements of Changes in Policyholders’ Equity 31 | Notes to Consolidated Financial Statements 32 | Report of Independent Auditors 54 | Report of Management 55 | Independent Auditors’ Opinion on Management’s Assessment 56 | Board of Directors 57 | Officers 57 | Operating Management 58 | Advisory Boards 60 | Annual Meeting Inside Back Cover
27
LIBERTY MUTUAL HOLDING COMPANY INC.
Consolidated Statements of Income
[DOLLARS IN MILLIONS]
Years Ended December 31, | 2006 | 2005 | 2004 | ||||||||
Revenues | |||||||||||
Premiums earned | $ | 19,867 | $ | 17,631 | $ | 16,563 | |||||
Net investment income | 2,548 | 2,247 | 2,102 | ||||||||
Net realized investment gains | 343 | 523 | 312 | ||||||||
Fee and other revenues | 762 | 760 | 664 | ||||||||
Total revenues | 23,520 | 21,161 | 19,641 | ||||||||
Claims, Benefits and Expenses | |||||||||||
Benefits, claims and claim adjustment expenses | 14,609 | 14,272 | 13,084 | ||||||||
Insurance operating costs and expenses | 3,425 | 2,912 | 2,666 | ||||||||
Amortization of deferred policy acquisition costs | 2,827 | 2,480 | 2,349 | ||||||||
Other expenses | 401 | 367 | 323 | ||||||||
Total claims, benefits and expenses | 21,262 | 20,031 | 18,422 | ||||||||
Income from continuing operations before income tax expense | 2,258 | 1,130 | 1,219 | ||||||||
Federal and foreign income tax expense | 632 | 91 | — | ||||||||
Income from continuing operations before extraordinary loss and discontinued operations | 1,626 | 1,039 | 1,219 | ||||||||
Extraordinary loss, net of tax | — | — | (3 | ) | |||||||
Discontinued operations, net of tax | — | (12 | ) | 29 | |||||||
Net income | $ | 1,626 | $ | 1,027 | $ | 1,245 | |||||
See accompanying notes to the audited consolidated financial statements.
28
LIBERTY MUTUAL HOLDING COMPANY INC.
Consolidated Balance Sheets
[DOLLARS IN MILLIONS]
December 31, | 2006 | 2005 | ||||
Assets: | ||||||
Investments: | ||||||
Fixed maturities, available for sale, at fair value (amortized cost of $40,981 and $36,962) | $ | 41,102 | $ | 37,391 | ||
Equity securities, available for sale, at fair value (cost of $1,664 and $1,077) | 2,619 | 1,812 | ||||
Trading securities, at fair value (cost of $14 and $13) | 22 | 20 | ||||
Other investments | 1,646 | 1,220 | ||||
Short-term investments | 1,550 | 1,430 | ||||
Mortgage loans | 322 | — | ||||
Total investments | 47,261 | 41,873 | ||||
Cash and cash equivalents | 3,512 | 3,155 | ||||
Premium and other receivables (net of allowance of $ 101 and $131) | 6,075 | 5,976 | ||||
Reinsurance recoverables (net of allowance of $315 and $324) | 15,564 | 16,302 | ||||
Deferred income taxes (net of valuation allowance of $101 and $99) | 1,490 | 1,627 | ||||
Deferred policy acquisition costs | 1,662 | 1,476 | ||||
Goodwill and intangible assets | 907 | 810 | ||||
Prepaid reinsurance premiums | 1,230 | 1,224 | ||||
Property, plant and equipment, net | 1,660 | 1,109 | ||||
Other assets | 3,088 | 2,702 | ||||
Separate account assets | 3,049 | 2,570 | ||||
Total assets | $ | 85,498 | $ | 78,824 | ||
Liabilities: | ||||||
Unpaid claims and claim adjustment expenses and future policy benefits: | ||||||
Property and casualty | $ | 38,606 | $ | 38,067 | ||
Life | 5,591 | 4,751 | ||||
Other policyholder funds and benefits payable | 2,658 | 2,491 | ||||
Unearned premiums | 9,343 | 8,454 | ||||
Funds held under reinsurance treaties | 1,823 | 1,826 | ||||
Short-term debt | 171 | 145 | ||||
Long-term debt | 3,175 | 2,555 | ||||
Other liabilities | 10,187 | 9,107 | ||||
Separate account liabilities | 3,049 | 2,570 | ||||
Total liabilities | 74,603 | 69,966 | ||||
Policyholders’ equity: | ||||||
Unassigned equity | 10,092 | 8,466 | ||||
Accumulated other comprehensive income | 803 | 392 | ||||
Total policyholders’ equity | 10,895 | 8,858 | ||||
Total liabilities and policyholders’ equity | $ | 85,498 | $ | 78,824 | ||
See accompanying notes to the audited consolidated financial statements.
29
LIBERTY MUTUAL HOLDING COMPANY INC.
Consolidated Statements of Cash Flows
[DOLLARS IN MILLIONS]
Years Ended December 31, | 2006 | 2005 | 2004 | |||||||||
Cash flows from operating activities: | ||||||||||||
Net income from continuing operations | $ | 1,626 | $ | 1,039 | $ | 1,219 | ||||||
Adjustments to reconcile net income to net cash provided by operating activities: | ||||||||||||
Depreciation and amortization | 238 | 217 | 191 | |||||||||
Realized investment gains | (343 | ) | (523 | ) | (312 | ) | ||||||
Undistributed private equity investment gains | (275 | ) | (208 | ) | (141 | ) | ||||||
Premium, other receivables, and reinsurance recoverables | 669 | (2,545 | ) | (2,586 | ) | |||||||
Deferred policy acquisition costs and distribution costs | (154 | ) | (144 | ) | (232 | ) | ||||||
Liabilities for insurance reserves | 1,865 | 5,153 | 5,187 | |||||||||
Taxes payable, net of deferred | 169 | (195 | ) | (233 | ) | |||||||
Other, net | 100 | 912 | 114 | |||||||||
Total adjustments | 2,269 | 2,667 | 1,988 | |||||||||
Net cash provided by operating activities | 3,895 | 3,706 | 3,207 | |||||||||
Cash flows from investing activities: | ||||||||||||
Purchases of investments | (20,952 | ) | (20,273 | ) | (21,467 | ) | ||||||
Sales and maturities of investments | 16,508 | 16,955 | 18,858 | |||||||||
Property and equipment purchased, net | (762 | ) | (306 | ) | (208 | ) | ||||||
Payment for purchase of companies, net of cash acquired | (48 | ) | (13 | ) | — | |||||||
Other investing activities | 317 | (143 | ) | (253 | ) | |||||||
Net cash from acquisitions and dispositions | — | (15 | ) | (79 | ) | |||||||
Net cash used in investing activities | (4,937 | ) | (3,795 | ) | (3,149 | ) | ||||||
Cash flows from financing activities: | ||||||||||||
Net activity in policyholder accounts | 69 | 20 | 109 | |||||||||
Debt financing, net | 646 | 373 | 534 | |||||||||
Net securities lending activity and other financing activities | 684 | 297 | (146 | ) | ||||||||
Net cash provided by financing activities | 1,399 | 690 | 497 | |||||||||
Net cash (used in) provided by discontinued operations, principally operating activities | — | (36 | ) | 36 | ||||||||
Net increase in cash and cash equivalents | 357 | 565 | 591 | |||||||||
Cash and cash equivalents, beginning of year | 3,155 | 2,590 | 1,999 | |||||||||
Cash and cash equivalents, end of year | $ | 3,512 | $ | 3,155 | $ | 2,590 | ||||||
Supplemental disclosure of cash flow information: | ||||||||||||
Income taxes paid | $ | 496 | $ | 264 | $ | 185 | ||||||
See accompanying notes to the audited consolidated financial statements.
30
LIBERTY MUTUAL HOLDING COMPANY INC.
Consolidated Statements of Changes in Policyholders’ Equity
[DOLLARS IN MILLIONS]
| Unassigned Equity | Accumulated Other Comprehensive Income | Policyholders’ Equity | |||||||||
Balance, January 1, 2004 | $ | 6,194 | $ | 1,187 | $ | 7,381 | |||||
Comprehensive income | |||||||||||
Net income | 1,245 | — | 1,245 | ||||||||
Other comprehensive income, net of taxes: | |||||||||||
Unrealized gains on securities | — | 189 | 189 | ||||||||
Less: reclassification adjustment for gains and losses included in net income | — | (203 | ) | (203 | ) | ||||||
Minimum pension liability | — | (1 | ) | (1 | ) | ||||||
Foreign currency translation adjustments | — | 86 | 86 | ||||||||
Other comprehensive income, net of taxes | — | 71 | 71 | ||||||||
Total comprehensive income | 1,316 | ||||||||||
Balance, December 31, 2004 | $ | 7,439 | $ | 1,258 | $ | 8,697 | |||||
Comprehensive income | |||||||||||
Net income | 1,027 | — | 1,027 | ||||||||
Other comprehensive loss, net of taxes: | |||||||||||
Unrealized losses on securities | — | (171 | ) | (171 | ) | ||||||
Less: reclassification adjustment for gains and losses included in net income | — | (340 | ) | (340 | ) | ||||||
Minimum pension liability | — | (306 | ) | (306 | ) | ||||||
Foreign currency translation adjustments | — | (49 | ) | (49 | ) | ||||||
Other comprehensive loss, net of taxes | — | (866 | ) | (866 | ) | ||||||
Total comprehensive income | 161 | ||||||||||
Balance, December 31, 2005 | $ | 8,466 | $ | 392 | $ | 8,858 | |||||
Comprehensive income | |||||||||||
Net income | 1,626 | — | 1,626 | ||||||||
Other comprehensive income, net of taxes: | |||||||||||
Unrealized gains on securities | — | 211 | 211 | ||||||||
Less: reclassification adjustment for gains and losses included in net income | — | (223 | ) | (223 | ) | ||||||
Minimum pension liability | — | 312 | 312 | ||||||||
Foreign currency translation adjustments | — | 111 | 111 | ||||||||
Other comprehensive income, net of taxes | — | 411 | 411 | ||||||||
Total comprehensive income | 2,037 | ||||||||||
Balance, December 31, 2006 | $ | 10,092 | $ | 803 | $ | 10,895 | |||||
See accompanying notes to the audited consolidated financial statements.
31
LIBERTY MUTUAL HOLDING COMPANY INC.
Notes to Consolidated Financial Statements
[DOLLARS IN MILLIONS]
(1) SUMMARY OF SIGNIFICANT ACCOUNTING POLICIES
Basis of Presentation
The accompanying consolidated financial statements include the accounts of Liberty Mutual Holding Company Inc. and its subsidiaries (collectively “LMHC” or the “Company”). Certain reclassifications have been made to the 2005 and 2004 consolidated financial statements to conform with the 2006 presentation. All material intercompany transactions and balances have been eliminated.
The accompanying consolidated financial statements have been prepared in conformity with accounting principles generally accepted in the United States (“GAAP”). The preparation of financial statements in conformity with GAAP requires management to make estimates and assumptions that affect the reported amounts of assets and liabilities and disclosure of contingent assets and liabilities at the date of the financial statements, and the reported amounts of revenues and expenses during the reporting period. The Company’s principal estimates include (1) unpaid losses and loss expense reserves, including asbestos and environmental reserves, (2) allowance for uncollectible reinsurance and policyholder receivables, (3) other than temporary impairments in the fair value of the investment portfolio, (4) deferred acquisition costs, (5) the valuation of goodwill and intangible assets, and (6) valuation allowance on deferred taxes. While management believes that the amounts included in the consolidated financial statements reflect their best estimates and assumptions, these amounts could ultimately be materially different from the amounts currently provided for in the consolidated financial statements.
Nature of Operations
The Company conducts substantially all of its business through four strategic business units: Personal Markets, Commercial Markets, Agency Markets and International.
The Company’s Personal Markets business unit writes virtually all types of property and casualty insurance covering personal risks, primarily personal automobile and homeowners.
The Commercial Markets business unit is organized into separate marketing and underwriting groups, each of which focuses on a particular customer base, product grouping, or distribution channel to provide tailored products and services that specifically address customers’ needs. The Commercial Markets business unit includes National Market, Business Market, Liberty Mutual Property and Group Market. The Commercial Markets coverages include workers compensation, commercial automobile, general liability, including product liability, multiple peril, group disability and life insurance, property, and a variety of other coverages. Commercial Markets is also a servicing carrier for workers compensation and commercial automobile involuntary market pools.
Agency Markets is composed of eight regionally-branded insurance companies that focus on the small commercial market and personal market. It also includes Wausau Insurance, which specializes in larger, commercial accounts, and the specialty operations, Liberty Mutual Surety (nationwide contract and commercial surety) and Summit Holding Southeast, Inc., (mono-line workers compensation in the Southeast, primarily Florida). Agency Markets companies distribute their products and services primarily through independent agents and brokers.
The Company’s International business unit consists of the global specialty business, known as Liberty International Underwriters (“LIU”), and local personal and commercial businesses, primarily property and casualty. LIU is composed of global specialty commercial insurance and reinsurance with operations principally based in the U.S., Canada, Australia, Singapore, Hong Kong, Dubai, London and European markets. London and European operations consist of Liberty Mutual Insurance Europe Ltd. with branches in Dublin, Paris and Cologne and Lloyd’s of London, Syndicate 4472, (formerly known as Syndicates 190 and 282) with branches in Paris and Cologne. International distributes its LIU global specialty commercial insurance and reinsurance products exclusively through brokers. LIU provides a variety of specialty products including casualty, marine, engineering, energy, directors and officers, errors and omissions, aviation, property and professional liability insurance together with multi-line insurance and reinsurance including property catastrophe reinsurance, written through Lloyd’s of London. International also operates local insurance operations consisting of local companies selling traditional property, casualty and life insurance products to individuals and businesses in nations with a large and growing middle class, primarily in South America, Asia and Southern Europe.
32
Adoption of New Accounting Standards
In January 2003, the FASB issued Interpretation No. 46,“Consolidation of Variable Interest Entities, an Interpretation of ARB No. 51” (“FIN 46”). FIN 46 requires certain variable interest entities (“VIEs”) to be consolidated by the primary beneficiary of the entity if the equity investors in the entity do not have the characteristics of a controlling financial interest or the entity does not have sufficient equity at risk for the entity to finance its activities without additional subordinated financial support from other parties. FIN 46 was revised in late 2003 (FIN 46(R)) and was effective January 1, 2004 for the Company for all new VIEs created or acquired after December 31, 2003. The provisions of FIN 46 were applied in 2005 for VIEs created or acquired by the Company prior to December 31, 2003 and they did not materially impact the Company’s financial position or results of operations.
Effective January 1, 2006, the Company adopted Financial Accounting Standards Board (FASB) Statement of Position No. FAS 115-1 and FAS 124-1,“Meaning of Other-Than-Temporary Impairments and Its Application to Certain Investments”(“FSP FAS 115-1 and FAS 124-1”),which provides guidance on determining whether investment impairment is other-than-temporary regardless of the intent to sell and when a security is impaired due to fluctuations in interest rates. The adoption of the statement did not have a material impact on the Company’s consolidated financial statements.
Effective April 1, 2006, the Company adopted Statement of Financial Accounting Standards No. 123(R),“Share-Based Payments” (“SFAS 123(R)”). The Company has elected to continue to measure its awards at their intrinsic value. Compensation cost related to these plans is determined in accordance with plan formulas and recorded ratably over the years the employee service is provided. The adoption of SFAS 123(R) did not impact the Company’s consolidated financial statements.
Future Adoption of New Accounting Standards
In September 2005, the Accounting Standards Executive Committee of the American Institute of Certified Public Accountants (“AcSEC”) issued Statement of Position No. 05-1,“Accounting by Insurance Enterprises for Deferred Acquisition Costs in Connection with Modifications or Exchanges of Insurance Contracts” (“SOP 05-1”). This SOP provides guidance on accounting by insurance enterprises for deferred acquisition costs on internal replacements of insurance and investment contracts other than those specifically described in FASB Statement No. 97,“Accounting and Reporting by Insurance Enterprises for Certain Long-Duration Contracts and for Realized Gains and Losses from the Sale of Investments” (“FAS 97”). As defined by the SOP, an internal replacement is a modification in product benefits, features, rights, or coverage that occurs by exchange of a contract for a new contract, or by amendment, endorsement, rider, or by election of a feature or coverage within an existing contract. The guidance in this SOP is effective for internal replacements occurring in fiscal years beginning after December 15, 2006, with earlier adoption encouraged. This statement is effective for the Company on January 1, 2007, and its adoption is not expected to materially impact the Company’s consolidated financial statements.
In June 2006, the FASB issued Interpretation No. 48,“Accounting for Uncertainty in Income Taxes, an Interpretation of FASB Statement No. 109” (“FIN 48”). The interpretation requires companies to recognize the tax benefits of uncertain tax positions only where the position is “more likely than not” to be sustained assuming examination by tax authorities. The amount recognized would be the amount that represents the largest amount of tax benefit that is greater than 50% likely of being ultimately realized. A liability would be recognized for any benefit claimed, or expected to be claimed, in a tax return in excess of the benefit recorded in the financial statements, along with any interest and penalty (if applicable) on the excess. FIN 48 will require a tabular reconciliation of the change in the aggregate unrecognized tax benefits claimed, or expected to be claimed, in tax returns and disclosure relating to accrued interest and penalties for unrecognized tax benefits. Discussion will also be required for those uncertain tax positions where it is reasonably possible that the estimate of the tax benefit will change significantly in the next 12 months. The Company is required to adopt FIN 48 effective January 1, 2007. Adoption of FIN 48 is not expected to have a material impact on the Company’s consolidated financial statements.
In February 2006, the FASB released Statement of Financial Accounting Standards No. 155,“Accounting for Certain Hybrid Financial Instruments - an Amendment of FASB Statements No. 133 and 140” (“SFAS 155”). SFAS 155 nullifies the guidance in the FASB’s Derivatives Implementation Group Issue D1“Application of Statement 133 to Beneficial Interests in Securitized Assets”, which had deferred the bifurcation requirements of Statement of Financial Accounting Standards No. 133, “Accounting for Derivative Instruments and Hedging Activities” (“SFAS 133”), for certain beneficial interests in securitized financial assets. SFAS 155 requires beneficial interests in securitized financial assets be analyzed to determine whether they are freestanding derivatives or hybrid instruments that contain an embedded derivative requiring bifurcation. SFAS 155 is effective for all financial instruments acquired, issued or subject to a re-measurement (new basis) event occurring after the beginning of an entity’s fiscal year that begins after September 15, 2006. The Company is required to adopt SFAS 155 effective January 1, 2007. In January 2007, the FASB issued Derivative Implementation Group Issue No. B40,“Embedded Derivatives: Application of Paragraph 13(b) to Securitized Interests in Prepayable Financial Assets” (“DIG B40”). DIG B40 provided limited exemption from bifurcation of embedded derivatives as required by paragraph 13(b) of SFAS 133. Management has concluded the exemption applies for the Company’s investment in its mortgage backed securities and as a result, SFAS 155 is not expected to have a material impact to the Company’s consolidated financial statements.
33
| Notes to Consolidated Financial Statements | LIBERTY MUTUAL HOLDING COMPANY INC. | |
[CONTINUED] |
In September 2006, the FASB issued SFAS No. 157,“Fair Value Measurements” (“SFAS 157”). This statement defines fair value, establishes a framework for measuring fair value under accounting principles generally accepted in the United States, and enhances disclosures about fair value measurements. SFAS 157 provides guidance on how to measure fair value when required under existing accounting standards. The statement establishes a fair value hierarchy that prioritizes the inputs to valuation techniques used to measure fair value into three broad levels (“Level 1, 2 and 3”). Level 1 inputs are observable inputs that reflect quoted prices for identical assets or liabilities in active markets the Company has the ability to access at the measurement date. Level 2 inputs are observable inputs, other than quoted prices included in Level 1, for the asset or liability. Level 3 inputs are unobservable inputs reflecting the reporting entity’s estimates of the assumptions that market participants would use in pricing the asset or liability (including assumptions about risk). Quantitative and qualitative disclosures will focus on the inputs used to measure fair value for both recurring and non-recurring fair value measurements and the effects of the measurements in the financial statements. The Company is required to adopt SFAS 157 effective January 1, 2008. The Company is in the process of evaluating the impact of adoption.
In September 2006, the FASB issued SFAS No. 158,“Employers’ Accounting for Defined Benefit Pension and Other Post-retirement Plans, an Amendment of FASB Statements No. 87, 88, 106 and 132(R)” (“SFAS 158”). This statement requires an entity to: (a) recognize an asset for the funded status of defined benefit plans that are over-funded and a liability for plans that are under-funded, measured as of the employer’s fiscal year end; and (b) recognize changes in the funded status of defined benefit plans, other than for the net periodic benefit cost included in net income, in accumulated other comprehensive income. For pension plans the funded status must be based on the projected benefit obligation, which includes an assumption for future salary increases. For postretirement plans the funded status is based on the accumulated postretirement benefit obligation. The Company is required to adopt SFAS 158 effective December 31, 2007. The actual impact to the Company will depend on the discount rate, other valuation assumptions, and the actual value of plan assets as of December 31, 2007. The impact is expected to be less than 5% of equity.
In February 2007, the FASB issued SFAS No. 159,“The Fair Value Option for Financial Assets and Financial Liabilities, Including an Amendment of SFAS 115” (“SFAS 159”). SFAS 159 permits all entities to choose, at specified election dates, to measure eligible items at fair value (the “fair value option”). An entity shall report unrealized gains and losses on items for which the fair value option has been elected in earnings at each subsequent reporting date eliminating complex hedge accounting provisions. The decision about whether to elect the fair value option is applied on an instrument by instrument basis and is irrevocable unless a new election date occurs and is applied only to an entire instrument. SFAS 159 also provides guidance on disclosure requirements designed to facilitate comparisons between entities that choose different measurement attributes for similar types of assets and liabilities. SFAS 159 is effective for the Company January 1, 2008. The Company is in the process of evaluating the impact of adoption.
In September 2006, the Emerging Issues Task Force (EITF) released, issue No. 06-4,“Accounting for Deferred Compensation and Postretirement Benefit Aspects of Endorsement Split-Dollar Life Insurance Arrangements” (“EITF 06-4”). This issue requires a company to recognize a liability for future life insurance benefits in accordance with SFAS 106 or Opinion 12. EITF 06-4 is effective for the Company for fiscal years beginning after December 15, 2007. The Company is in the process of evaluating the impact of adoption but it is not expected to be material.
Investments
Fixed maturity securities classified as available for sale are debt securities that have fixed or variable principal payment schedules, held for indefinite periods of time, and are used as a part of the Company’s asset/liability strategy or sold in response to risk/reward characteristics, liquidity needs or similar economic factors. These securities are carried at fair value with the corresponding unrealized investment gains or losses, net of deferred income taxes, reported in accumulated other comprehensive income.
Equity securities classified as available for sale include common equities and non-redeemable preferred stocks and are reported at quoted market values. Changes in the market values of these securities, net of deferred income taxes, are reflected as unrealized investment gains or losses in accumulated other comprehensive income.
Trading securities are securities bought principally for the purpose of sale in the near term and are reported at market value. Changes in market value are recognized in income as realized gains or losses in the current period.
Realized gains and losses on sales of investments are recognized in income using the specific identification method. Unrealized losses that are other-than-temporary are recognized as realized losses. The Company reviews fixed income and public equity securities for impairment on a quarterly basis and private equity and co-investment securities on a semi-annual basis. Securities are reviewed for both quantitative and qualitative considerations including, but not limited to, (1) the
34
extent of the decline in fair value below book value, (2) the duration of the decline, (3) significant adverse changes in the financial condition or near term prospects for the investment or issuer, (4) significant changes in the business climate or credit ratings of the issuer, (5) general market conditions and volatility, (6) industry factors, and (7) the past impairment history of the security holding or the issuer. All mortgage-backed securities and asset-backed securities are reviewed for other-than-temporary impairment treatment in accordance with the guidance of EITF Issue No. 99-20,“Recognition of Interest Income and Impairment on Purchased and Retained Beneficial Interests in Securitized Financial Assets”. In addition, for securities expected to be sold, an other-than-temporary impairment charge is recognized if the Company does not expect the fair value of a security to recover to cost or amortized cost prior to the expected date of sale.
For mortgage-backed fixed maturity securities, the Company recognizes income using a constant effective yield based on anticipated prepayments over the economic life of the security. The mortgage-backed portfolio is accounted for under the retrospective method and prepayment assumptions are based on market expectations. When actual prepayments differ significantly from anticipated prepayments, the effective yield is recalculated to reflect actual payments to date and anticipated future payments and any resulting adjustment is included in net investment income.
Cash equivalents are short-term, highly liquid investments that are both readily convertible into known amounts of cash and so near to maturity that they present insignificant risk of changes in value due to changing interest rates. The Company’s cash equivalents include debt securities purchased with maturities of three months or less at acquisition and are carried at amortized cost that approximates fair value.
Short-term investments are debt securities with maturities at acquisition between three months and one year, are considered available for sale and are carried at amortized cost, which approximates fair value.
All Variable Interest Entities (VIEs) for which the Company is the primary beneficiary are consolidated into the Company’s financial statements.
Other investments, principally investments in limited partnerships, are accounted for using the equity method. Equity investments in privately held businesses are accounted for under the cost method where market value data is unavailable for the underlying investment.
Mortgage loans are stated at amortized cost less a valuation allowance for potentially uncollectible amounts.
Derivatives
All derivatives are recognized on the balance sheet at fair value. On the date a contract is entered into, the Company designates the derivative as either (1) a hedge of a fair value of a recognized asset (“fair value hedge”) or (2) an economic hedge (“non-designated derivative”). Changes in the fair value of a derivative that is highly effective and is designated and qualifies as a fair value hedge, along with the loss or gain on the hedged asset attributable to the hedged risk, are recorded in current period operations as a component of net investment income. Changes in the fair value of non-designated derivatives are reported in current period operations as a component of net realized gains and losses and the derivative is included in other assets or liabilities. The Company owns fixed maturity securities which have an option to convert to equity. The derivative features embedded are ancillary to the overall investment. This type of activity is unrelated to hedging. The Company uses various derivative instruments to hedge exposure against interest rates and equity market returns guaranteed by certain life products. In addition, there may be call, put or conversion options embedded in certain bonds it has purchased. The fair value of these derivative instruments is based on broker quotations. These derivatives are not material to the Company’s financial statements.
Securities Lending
The Company participates in a securities lending program to generate additional income, whereby certain domestic fixed income securities are loaned for a short period of time from the Company’s portfolio to qualifying third parties via a lending agent. Terms of the agreement are for borrowers of these securities to provide collateral of at least 102% of the market value of the loaned securities. Acceptable collateral may be in the form of cash or U.S. government securities. The market value of the loaned securities is monitored and additional collateral is obtained if the market value of the collateral falls below 100% of the market value of the loaned securities. Under the terms of the securities lending program, the lending agent indemnifies the Company against borrower defaults. The loaned securities remain a recorded asset of the Company; however, the Company records a liability for the amount of cash collateral held, representing its obligation to return the collateral related to the loaned securities.
Goodwill and Intangible Assets
Goodwill and intangible assets are tested for impairment at least annually using a two-step process. The first step is performed to identify potential impairment and, if necessary, the second step is performed for the purpose of measuring the amount of impairment, if any. Impairment is recognized only if the carrying amount is not recoverable from its undiscounted cash flows and is measured as the difference between the carrying amount and the implied fair value. Other changes in the carrying amount of goodwill are primarily caused as a result of foreign currency translation adjustments and adjustments to valuation allowances for acquired tax losses. Intangible assets are amortized over their useful lives.
35
| Notes to Consolidated Financial Statements | LIBERTY MUTUAL HOLDING COMPANY INC. | |
[CONTINUED] |
Deferred Policy Acquisition Costs
Costs that vary with and are primarily related to the acquisition of new insurance and investment contracts are deferred and amortized over the respective policy terms. Deferred policy acquisition costs are reviewed annually for recoverability. Investment income is considered in the recoverability assessment. For short-duration contracts, acquisition costs include commissions, underwriting expenses and premium taxes. For long-duration insurance contracts, these costs include first year commissions in excess of annual renewal commissions and variable sales, underwriting and administrative expenses.
For short-duration contracts, acquisition costs are amortized in proportion to earned premiums. For traditional long-duration contracts, acquisition costs are amortized over the premium paying period of the related policies using assumptions consistent with those used in computing policy benefit reserves. For universal life insurance, annuity, and investment products, acquisition costs are amortized in relation to expected gross profits.
For long-duration contracts, to the extent unrealized gains or losses on fixed income securities carried at fair value would result in an adjustment of estimated gross profits had those gains or losses actually been realized, the related unamortized deferred policy acquisition costs are recorded net of tax as a reduction of the unrealized capital gains or losses and included in accumulated other comprehensive income.
Real Estate and Other Fixed Assets
The costs of buildings, furniture, and equipment are depreciated, principally on a straight-line basis, over their estimated useful lives (a maximum of 39.5 years for buildings, 10 years for furniture, and 5 years for equipment). Expenditures for maintenance and repairs are charged to income as incurred while expenditures for improvements are capitalized and depreciated.
Separate Account Assets and Liabilities
Separate and variable accounts represent funds for which investment income and investment gains and losses accrue directly to the policyholders who predominantly bear the investment risk. Each account has specific investment objectives, and the assets are carried at fair value. The assets of each account are legally segregated and are not subject to claims that arise out of any other business of the Company. The liabilities of these accounts are equal to the account assets. Investment income, realized investment gains (losses), and policyholder account deposits and withdrawals related to separate accounts are excluded from the consolidated statements of income. The fees earned for administrative and contract holder maintenance services performed for these separate accounts are included in fee and other revenue.
Insurance Liabilities and Reserves
For short-duration contracts, the Company establishes reserves for unpaid insurance claims and claim adjustment expenses covering events that occurred in 2006 and prior years. These reserves reflect estimates of the total cost of claims reported but not yet paid and the cost of claims not yet reported, as well as the estimated expenses necessary to settle the claims. Reserve estimates are based on past loss experience modified for current claim trends, as well as prevailing social, economic and legal conditions. Final claim payments, however, may ultimately differ from the established reserves, since these payments might not occur for several years. Reserve estimates are continually reviewed and updated, and any resulting adjustments are reflected in current operating results. The Company does not discount reserves other than tabular discounting on the long-term indemnity portion of workers compensation claims, the long-term disability portion of group accident and health claims as permitted by insurance regulations in certain states, and specific asbestos structured settlements. Reserves are reduced for estimated amounts of salvage and subrogation and deductibles recoverable from policyholders.
For long-duration contracts, measurement of liabilities is based on generally accepted actuarial techniques but requires assumptions about mortality, lapse rates, and assumptions about future returns on related investments. Annuity and structured settlement contracts without significant mortality or morbidity risk are accounted for as investment contracts, whereby the premium received plus interest credited less policyholder withdrawals represents the investment contract liability. Implied credited interest rates for domestic structured settlement contracts in force averaged 5.9%, 6.2%, and 6.3% for 2006, 2005, and 2004, respectively. Implied credited interest rates for foreign structured settlement contracts in force were between 2.5% and 6.0% in 2006, 2005 and 2004. Credited rates for domestic universal life contracts in force were between 4.0% and 6.3% in 2006, 3.5% and 7.0% in 2005, and 4.0% and 8.0% in 2004. Credited rates for foreign universal life contracts in force were between 2.0% and 6.0% in 2006 and 1.0% and 6.0% in 2005 and 2004. Liabilities for future policy benefits for traditional life policies have been computed using the net level premium method based upon estimated future investment yields (between 4.5% and 10.3% in 2006 and 2005 and 4.1% and 10.3% in 2004), mortality assumptions (based on the Company’s experience relative to standard industry mortality tables) and withdrawal assumptions (based on the Company’s experience).
36
Policyholder Dividends
Policyholder dividends are accrued using an estimate of the ultimate amount to be paid in relation to premiums earned based on the underlying contractual obligations.
For domestic property-casualty insurance, certain insurance contracts, primarily workers compensation policies, are issued with dividend plans to be paid subject to approval by the insurer’s board of directors. Such policies approximated 2% of domestic property-casualty insurance premiums written for the years ended December 31, 2006, 2005, and 2004.
For life insurance, dividends to participating policyholders are calculated as the sum of the difference between the assumed mortality, interest and loading, and the actual experience of the Company relating to participating policyholders. As a result of statutory regulations, the major portion of earnings from participating policies inures to the benefit of the participating policy-holders and is excluded from the consolidated net income and policyholders’ equity. Participating policies approximate 36% of ordinary life insurance in force at December 31, 2006, and 2005, and 37% of premium for the years ended December 31, 2006, and 2005.
Long-Term Incentive and Performance Based Incentive Plans
The Company maintains short-and long-term incentive compensation plans. Long-term plans that vest over the requisite service period and are based upon notional units are accounted for under SFAS 123(R). Additionally, the Company provides various performance based incentive compensation to the majority of employees meeting the participation requirements of the respective plans. Compensation cost related to these plans is determined in accordance with plan formulas and recorded ratably over the years the employee service is provided.
Revenue Recognition
For short-duration insurance contracts, premiums are reported as earned income generally on a pro-rata basis over the terms of the related policies. For retrospectively rated policies and contracts, premium estimates are continually reviewed and updated and any resulting adjustments are reflected in current operating results. For traditional long-duration insurance contracts (including term and whole life contracts and annuities), premiums are earned when due. For annuities and structured settlements without significant mortality or morbidity risk (investment contracts) and universal life contracts (long-duration contracts with terms that are not fixed or guaranteed), revenues represent investment income earned on the related assets. Universal life and annuity contract revenues also include mortality, surrender, and administrative fees charged to policyholders.
Reinsurance
All assets and liabilities related to reinsurance ceded contracts are reported on a gross basis in the consolidated balance sheets. Prospective reinsurance premiums, losses, and loss adjustment expenses are accounted for on a basis consistent with the terms of the reinsurance contracts. The consolidated statements of income reflect premiums, benefits, and settlement expenses net of reinsurance ceded.
Transactions that do not transfer risk are included in other assets or other liabilities. Ceded transactions that transfer risk but are retroactive are included in reinsurance recoverables. The excess of estimated liabilities for claims and claim costs over the consideration paid net of experience adjustments is established as a deferred credit at inception. The deferred amounts are subsequently amortized using the effective interest method over the expected settlement period. The periodic amortization is reflected in the accompanying consolidated statements of income through operating costs and expenses.
Amounts recoverable from reinsurers are estimated in a manner consistent with the claim liabilities associated with the reinsured business. The Company evaluates reinsurance collectibility and a provision for uncollectible reinsurance is recorded.
Translation of Foreign Currencies
The Company translates the financial statements of its foreign operations into U.S. dollars from the functional currency designated for each foreign unit, generally the currency of the primary economic environment in which it does its business. Assets and liabilities are translated into U.S. dollars at period-end exchange rates, while income and expenses are translated using average rates for the period. Deferred tax positions are not established for adjustments arising from foreign operations whose earnings are considered to be permanently reinvested (See Note 10). Translation adjustments are recorded as a separate component of accumulated other comprehensive income.
For subsidiaries operating in highly inflationary economies, monetary assets and liabilities are translated at the rate of exchange as of the balance sheet date and non-monetary items are translated at historical rates. Gains and losses from balance sheet translation adjustments and foreign currency transactions are included in net income.
The aggregate exchange (losses) and gains included in income from continuing operations for the years ended December 31, 2006, 2005, and 2004 were $(5), $23, and $24, respectively. These amounts have been included in insurance operating costs and expenses in the accompanying consolidated statements of income.
Income Taxes
The income tax provision is calculated under the liability method. Deferred tax assets and liabilities are recorded based on the difference between the financial statement and tax basis of assets and liabilities at the enacted tax rates. The principal assets and liabilities giving rise to such differences are unrealized
37
| Notes to Consolidated Financial Statements | LIBERTY MUTUAL HOLDING COMPANY INC. | |
[CONTINUED] |
capital gains and losses on investments, insurance reserves, unearned premiums, retroactive deferred gains, tax credits, deferred policy acquisition costs, certain employee benefits expenses, and net operating losses.
Service Revenues and Expenses
Service revenues consist primarily of fees generated from processing business for involuntary assigned risk pools and are earned on a pro-rata basis over the term of the related policies and are included in fee and other revenues in the consolidated statements of income. Qualifying acquisition expenses are deferred and amortized over the period in which the related revenues are earned.
Accumulated Other Comprehensive Income
Other comprehensive income consists principally of unrealized gains and losses on certain investments in debt and equity securities, foreign currency translation adjustments, and minimum pension liability.
The components of accumulated other comprehensive income, net of related deferred acquisition costs and taxes, for the years ending December 31, 2006, 2005, and 2004 are as follows:
| 2006 | 2005 | 2004 | ||||||||||
Unrealized gains on securities | $ | 644 | $ | 656 | $ | 1,167 | ||||||
Foreign currency translation adjustments | 179 | 68 | 117 | |||||||||
Minimum pension liability | (20 | ) | (332 | ) | (26 | ) | ||||||
Accumulated other comprehensive income | $ | 803 | $ | 392 | $ | 1,258 | ||||||
Catastrophe Exposure
The Company writes insurance and reinsurance contracts that cover catastrophic events. The Company’s policies cover unpredictable natural and other disasters, such as hurricanes, windstorms, earthquakes, floods, fires, terrorist attacks, and explosions. Although the Company carries reinsurance to mitigate its exposure to certain catastrophic events, claims from catastrophic events could cause substantial volatility in its financial results for any fiscal year and have a material adverse effect on its financial condition.
The Terrorism Risk Insurance Extension Act (the “Terrorism Act”), effective January 1, 2006, requires all commercial property and casualty insurers writing business in the U.S. to make terrorism coverage available to commercial policyholders and provides a Federal backstop for certain terrorist acts which result in losses above individual insurance company deductible amounts. The Terrorism Act directly applies to the Company’s U.S. property and casualty insurance business. In 2007, on eligible lines of business, participating insurers will receive reimbursement from the Federal government for 85% of paid losses in excess of the insurer’s deductible, provided the aggregate industry losses exceed $100 to a maximum industry loss of $100,000, subject to further Congressional review. The Company estimates its deductible for commercial policies subject to the Terrorism Act (the amount the Company will have to pay before the Federal backstop becomes available) to be $1,602 in 2007. This amounts to 20% of the Company’s direct earned premium from commercial lines of business subject to the Terrorism Act and approximately 9.6% on a net of tax basis of policyholders’ equity of the Company at December 31, 2006, prior to consideration of terrorism reinsurance that the Company has purchased for 2007. The Terrorism Act is in effect until December 31, 2007. There can be no assurance that the Terrorism Act will be extended beyond that expiration date. The Terrorism Act does not protect the Company from losses insured by the Company that are not certified pursuant to the Terrorism Act, such as acts of domestic terrorism, like the Oklahoma City disaster. Damage outside the U.S. is not covered except in limited circumstances, such as damage to a U.S. airplane. Therefore, future losses from terrorist attacks could prove to be material to the Company’s business, financial condition, and results of operations.
(2) DIVESTITURES AND DISCONTINUED OPERATIONS
Divestitures
On April 1, 2004, the Company completed the sale of its Canadian personal lines business, consisting of private passenger automobile, homeowners and personal property insurance, to Meloche Monnex, Inc., a member of TD Bank Financial Group (“Meloche Monnex”). The transaction resulted in the transfer of approximately 350,000 automobile and homeowners insurance policies and approximately $300 (C$390) in direct written premiums to Meloche Monnex. Neither party has disclosed the financial terms of the transaction, which the Company believes is not material to its business, financial condition or results of operations.
Canadian Personal Lines Property and Casualty Operations
| 2004 | ||||
Revenues | $ | 82 | ||
Income before income taxes and minority interest | 12 | |||
Federal and foreign income tax benefit | (6 | ) | ||
Net income | $ | 18 | ||
38
Discontinued Operations
In December 2004, the Company’s management approved a plan to sell the pension externalization business of Seguros Genesis S.A. operations. The Company completed the disposition in December 2005.
| 2005 | 2004 | ||||||
Revenues | $ | — | $ | 31 | |||
Operating expenses | (1 | ) | 14 | ||||
Income before realized loss and income tax (benefit) expense | 1 | 17 | |||||
Realized loss | (19 | ) | — | ||||
Income tax (benefit) expense | (6 | ) | 6 | ||||
Net (loss) income | $ | (12 | ) | $ | 11 | ||
(3) ACQUISITIONS AND GOODWILL
Effective April 12, 2005, the Company acquired the insurance operations of ING Seguros Generales in Chile. The transaction resulted in goodwill of $14.
On September 5, 2006, and during the course of the fourth quarter of 2006, the Company, through its Spanish subsidiary, Liberty Seguros Compania de Seguros y Reaseguros S.A. (“Liberty Seguros”), acquired 90.425% of Seker Sigorta A.S., a mid-sized insurer located in Istanbul, Turkey. Goodwill recognized from the transaction was $71. The Company is in the process of finalizing the fair value of the acquired business. Therefore, the allocation of the purchase price is subject to refinement. The results of operations for the acquired business, which are not material, are included in the financial statements subsequent to September 2006.
(4) INVESTMENTS
Components of Net Investment Income
| Years Ended December 31, | 2006 | 2005 | 2004 | |||||||||
Interest income | $ | 2,289 | $ | 2,103 | $ | 1,944 | ||||||
Dividends | 52 | 53 | 81 | |||||||||
Limited partnerships and limited liability companies | 304 | 227 | 146 | |||||||||
Other investment income | 20 | 16 | 14 | |||||||||
Gross investment income | 2,665 | 2,399 | 2,185 | |||||||||
Investment expenses | (117 | ) | (152 | ) | (83 | ) | ||||||
Net investment income | $ | 2,548 | $ | 2,247 | $ | 2,102 | ||||||
| Components of Net Realized Investment Gains | ||||||||||||
| Years Ended December 31, | 2006 | 2005 | 2004 | |||||||||
Fixed maturities | ||||||||||||
Gross realized gains | $ | 105 | $ | 263 | $ | 404 | ||||||
Gross realized losses | (110 | ) | (92 | ) | (100 | ) | ||||||
Equities | ||||||||||||
Gross realized gains | 112 | 101 | 87 | |||||||||
Gross realized losses | (19 | ) | (39 | ) | (61 | ) | ||||||
Other | ||||||||||||
Gross realized gains | 273 | 301 | 76 | |||||||||
Gross realized losses | (18 | ) | (11 | ) | (94 | ) | ||||||
Net realized investment gains | $ | 343 | $ | 523 | $ | 312 | ||||||
During the years ended December 31, 2006, 2005, and 2004, other-than-temporary impairments recognized were $50, $18, and $35, respectively.
During the years ended December 31, 2006, 2005, and 2004, proceeds from sales of fixed maturities available for sale were $5,432, $8,385, and $9,219, respectively. The gross realized gains and (losses) on such sales totaled $60 and $(47) in 2006, $220 and $(68) in 2005, and $344 and $(38) in 2004. The net realized gains related to trading securities held as of the end of the year amounted to $8, $7, and $10 for the years ended December 31, 2006, 2005, and 2004.
Components of Change in Net Unrealized Investment Gains
| 2006 | 2005 | 2004 | ||||||||||
Fixed maturities | $ | (308 | ) | $ | (893 | ) | $ | (92 | ) | |||
Equities | 220 | 77 | 127 | |||||||||
Other | (1 | ) | 3 | 24 | ||||||||
Adjustments to deferred policy acquisition costs | 71 | 26 | (80 | ) | ||||||||
Net change in unrealized investment losses | (18 | ) | (787 | ) | (21 | ) | ||||||
Deferred income taxes | 6 | 276 | 7 | |||||||||
Net change in unrealized investment losses, net of tax | $ | (12 | ) | $ | (511 | ) | $ | (14 | ) | |||
Available for Sale Investments
The gross unrealized gains and losses and fair values of available for sale investments at December 31, 2006, and 2005, are as follows:
| December 31, 2006 | Amortized Cost | Gross Unrealized Gains | Gross Unrealized Losses | Fair Value | |||||||||
U.S. government and agency securities | $ | 4,625 | $ | 113 | $ | (80 | ) | $ | 4,658 | ||||
Mortgage and asset-backed securities of government and corporate agencies | 12,386 | 105 | (224 | ) | 12,267 | ||||||||
U.S. state and municipal | 6,533 | 110 | (31 | ) | 6,612 | ||||||||
Corporate and other | 15,267 | 355 | (268 | ) | 15,354 | ||||||||
Foreign government securities | 2,170 | 54 | (13 | ) | 2,211 | ||||||||
Total fixed maturities | 40,981 | 737 | (616 | ) | 41,102 | ||||||||
Total equity securities | 1,664 | 975 | (20 | ) | 2,619 | ||||||||
Total securities available for sale | $ | 42,645 | $ | 1,712 | $ | (636 | ) | $ | 43,721 | ||||
| December 31, 2005 | Amortized Cost | Gross Unrealized Gains | Gross Unrealized Losses | Fair Value | |||||||||
U.S. government and agency securities | $ | 4,494 | $ | 142 | $ | (66 | ) | $ | 4,570 | ||||
Mortgage and asset-backed securities of government and corporate agencies | 12,596 | 127 | (181 | ) | 12,542 | ||||||||
U.S. state and municipal | 3,971 | 61 | (27 | ) | 4,005 | ||||||||
Corporate and other | 14,108 | 499 | (207 | ) | 14,400 | ||||||||
Foreign government securities | 1,793 | 89 | (8 | ) | 1,874 | ||||||||
Total fixed maturities | 36,962 | 918 | (489 | ) | 37,391 | ||||||||
Total equity securities | 1,077 | 753 | (18 | ) | 1,812 | ||||||||
Total securities available for sale | $ | 38,039 | $ | 1,671 | $ | (507 | ) | $ | 39,203 | ||||
39
| Notes to Consolidated Financial Statements | LIBERTY MUTUAL HOLDING COMPANY INC. | |
[CONTINUED] |
At December 31, 2006, and 2005, securities carried at $2,813 and $3,982, respectively, were on deposit with regulatory authorities as required by law.
At December 31, 2006, and 2005, the fair values of fixed maturities loaned were approximately $1,257 and $890, respectively. Cash and short-term investments received as collateral in connection with the loaned securities were approximately $1,066 and $486 as of December 31, 2006, and 2005, respectively. Non-cash and short-term investments collateral received in connection with the loaned securities was approximately $218 and $424 as of December 31, 2006, and 2005, respectively.
The amortized cost and fair value of fixed maturities at December 31, 2006, by contractual maturity are as follows:
| Amortized Cost | Fair Value | |||||
Due to mature: | ||||||
One year or less | $ | 1,944 | $ | 1,946 | ||
Over one year through five years | 7,698 | 7,679 | ||||
Over five years through ten years | 7,980 | 7,937 | ||||
Over ten years | 10,973 | 11,273 | ||||
Mortgage and asset-backed securities of government and corporate agencies | 12,386 | 12,267 | ||||
| $ | 40,981 | $ | 41,102 | |||
Expected maturities may differ from contractual maturities as borrowers may have the right to call or prepay obligations with or without call or prepayment penalties.
The following table shows a schedule of the Company’s unrealized losses and fair value by security type by duration that individual securities have been in a continuous unrealized loss position at December 31, 2006, that are not deemed to be other-than-temporarily impaired.
| Less Than 12 Months | Greater Than 12 Months | |||||||||||||
| Unrealized Losses | Fair Value of Investments with Unrealized Losses | Unrealized Losses | Fair Value of Investments with Unrealized Losses | |||||||||||
U.S. government and agency securities | $ | (10 | ) | $ | 1,416 | $ | (70 | ) | $ | 2,233 | ||||
Mortgage and asset-backed securities of government and corporate agencies | (21 | ) | 2,633 | (203 | ) | 6,118 | ||||||||
U.S. state and municipal | (16 | ) | 1,657 | (15 | ) | 179 | ||||||||
Corporate and other | (55 | ) | 3,599 | (213 | ) | 4,852 | ||||||||
Foreign government securities | (8 | ) | 635 | (5 | ) | 268 | ||||||||
Equities | (16 | ) | 281 | (4 | ) | 38 | ||||||||
Total | $ | (126 | ) | $ | 10,221 | $ | (510 | ) | $ | 13,688 | ||||
The following table shows a schedule of the Company’s unrealized losses and fair value by security type by duration that individual securities have been in a continuous unrealized loss position at December 31, 2005, that are not deemed to be other-than-temporarily impaired.
| Less Than 12 Months | Greater Than 12 Months | |||||||||||||
| Unrealized Losses | Fair Value of Investments with Unrealized Losses | Unrealized Losses | Fair Value of Investments with Unrealized Losses | |||||||||||
U.S. government and agency securities | $ | (40 | ) | $ | 2,608 | $ | (26 | ) | $ | 754 | ||||
Mortgage and asset-backed securities of government and corporate agencies | (121 | ) | 7,406 | (60 | ) | 1,214 | ||||||||
U.S. state and municipal | (24 | ) | 1,587 | (3 | ) | 77 | ||||||||
Corporate and other | (154 | ) | 5,808 | (53 | ) | 1,134 | ||||||||
Foreign government securities | (7 | ) | 571 | (1 | ) | 19 | ||||||||
Equities | (11 | ) | 121 | (7 | ) | 51 | ||||||||
Total | $ | (357 | ) | $ | 18,101 | $ | (150 | ) | $ | 3,249 | ||||
The above table for 2006 includes $283 of unrealized losses related to securities issued and guaranteed by the United States government, its agencies, government sponsored enterprises and state and municipal governments. There was $600, or approximately 95%, of the unrealized losses as of December 31, 2006, on securities where the market value of the security was 10% or less below the book value for the security. The increase in unrealized losses is indicative of the increase in long-term interest rates from December 31, 2005, to December 31, 2006. The unrealized losses as of December 31, 2006, involve approximately 12,000 lots across more than approximately 3,900 different securities within the holdings of the Company.
The Company employs a systematic methodology to evaluate declines in fair value below the book value for equity securities and other investments. The methodology utilizes a quantitative and qualitative process ensuring that available evidence concerning the declines in fair value below carrying value is evaluated in a disciplined manner. Based on that evaluation and the Company’s ability and intent to hold these investments for a reasonable period of time sufficient for a recovery of fair value, the Company views the decline in market value of these investments as being temporary in accordance with the Company’s impairment policy.
Variable Interest Entities
The Company’s exposure to investment structures subject to analysis under FIN 46(R) relates primarily to investments in energy and private equity limited partnerships that are accounted for under the equity method. Two VIEs in the energy investment sector have been consolidated in the Company’s 2006 and 2005 financial statements as the Company has been deemed to be the primary beneficiary. In addition, the Company has investments in 31 VIEs for which it is not the primary beneficiary
40
at December 31, 2006. The Company’s investments in VIEs were $208 and $151 at December 31, 2006, and 2005, respectively. The Company’s maximum exposure to losses from VIEs is $481 and $292 as of December 31, 2006, and 2005, respectively, and there is no recourse provision to the general credit of the Company beyond the full amount of the Company’s loss exposure.
Investments in Mortgage Loans
In December 2006, the Company acquired $322 in participation certificates in commercial mortgage loans as a result of a distribution of assets in the dissolution of a limited partnership investment. The loans received from the partnership were originated and underwritten by the general partner, who is a third-party commercial loan manager that continues to originate and underwrite commercial mortgage loans in which the Company participates. The Company’s participation in any one commercial mortgage loan acquired does not exceed 49% of the loan value.
(5) DEFERRED POLICY ACQUISITION COSTS
The following reflects the policy acquisition costs deferred for amortization against future income and related amortization charged to income:
| Years Ended December 31, | 2006 | 2005 | 2004 | |||||||||
Balance at beginning of year | $ | 1,476 | $ | 1,354 | $ | 1,104 | ||||||
Acquisition costs deferred | 3,013 | 2,602 | 2,601 | |||||||||
Amortization charged to continuing income | (2,827 | ) | (2,480 | ) | (2,349 | ) | ||||||
Amortization included in discontinued operations | — | — | (2 | ) | ||||||||
Balance at end of year | $ | 1,662 | $ | 1,476 | $ | 1,354 | ||||||
(6) ASBESTOS AND ENVIRONMENTAL RESERVES
The Company has exposure to asbestos and environmental claims that emanate principally from general liability policies written prior to the mid-1980’s. In establishing the Company’s asbestos and environmental reserves, the Company estimates case basis reserves for anticipated losses and bulk reserves for loss adjustment expenses and IBNR losses. The Company maintained casualty excess of loss reinsurance during the relevant periods. The reserves are reported net of cessions to reinsurers and include any reserves reported by ceding reinsurers on assumed reinsurance contracts.
Upon their de-affiliation from the Nationwide Group and affiliation with the Company, Employers Insurance Company of Wausau (“EICOW”), Wausau Business Insurance Company (“WBIC”), Wausau General Insurance Company (“WGIC”), and Wausau Underwriters Insurance Company (“WUIC”) entered into ceded reinsurance contracts whereby Nationwide Indemnity Company assumed full responsibility for obligations on certain policies with effective dates prior to January 1, 1986, including all asbestos and environmental exposures.
The process of establishing reserves for asbestos and environmental claims is subject to greater uncertainty than the establishment of reserves for liabilities relating to other types of insurance claims. A number of factors contribute to this greater uncertainty surrounding the establishment of asbestos and environmental reserves, including, without limitation: (i) the lack of available and reliable historical claims data as an indicator of future loss development, (ii) the long waiting periods between exposure and manifestation of any bodily injury or property damage, (iii) the difficulty in identifying the source of asbestos or environmental contamination, (iv) the difficulty in properly allocating liability for asbestos or environmental damage, (v) the uncertainty as to the number and identity of insureds with potential exposure, (vi) the cost to resolve claims, and (vii) the collectibility of reinsurance.
The uncertainties associated with establishing reserves for asbestos and environmental losses and loss adjustment expenses are compounded by the differing, and at times inconsistent, court rulings on environmental and asbestos coverage issues involving: (i) the differing interpretations of various insurance policy provisions and whether asbestos and environmental losses are or were ever intended to be covered, (ii) when the loss occurred and what policies provide coverage, (iii) whether there is an insured obligation to defend, (iv) whether a compensable loss or injury has occurred, (v) how policy limits are determined, (vi) how policy exclusions are applied and interpreted, (vii) the impact of entities seeking bankruptcy protection as a result of asbestos-related liabilities, (viii) whether clean-up costs are covered as insured property damage, and (ix) applicable coverage defenses or determinations, if any, including the determination as to whether or not an asbestos claim is a products/completed operation claim subject to an aggregate limit and the available coverage, if any, for that claim. The uncertainties cannot be reasonably estimated, but could have a material impact on the Company’s future operating results and financial condition.
In the last two years the Company, as well as the industry generally, has seen decreases in the number of asbestos claims being filed. This turn to a more favorable trend is due to a number of factors. Screening activity used by some lawyers to find new plaintiffs has been as a result of questionable practices discovered in the Federal Silica Multi District Litigation. Court decisions in several key states (e.g., Mississippi) have been favorable to defendants. Most importantly, several states have enacted legislation in the past few years that contain medical criteria provisions aimed at reducing the number of lawsuits filed by unimpaired plaintiffs and providing prompt and fair compensation to those who meet the criteria.
41
| Notes to Consolidated Financial Statements | LIBERTY MUTUAL HOLDING COMPANY INC. | |
[CONTINUED] |
In the third quarter of 2005, a multi-disciplined team of internal claims, legal, reinsurance and actuarial personnel completed their comprehensive review of the Company’s asbestos exposure on a direct, assumed, and ceded basis. As part of the internal review, potential exposures of large policyholders were individually evaluated using the Company’s proprietary stochastic model, which is consistent with a recent published actuarial paper on asbestos reserving. Among the factors reviewed in depth by the team of specialists were the type of business, level of exposure, coverage limits, geographic distribution of products, types of injury, state jurisdictions, legal defenses, and reinsurance potential. Small policyholders were evaluated using aggregate methods that utilized information developed from the large policyholders. Additionally, a provision of pure incurred but not reported losses was established for the potential emergence of first-time filers of future asbestos claims. As a result of the comprehensive study, the Company increased net loss and allocated loss adjustment expense reserves by $203. In 2006, an internal study of asbestos activity subsequent to the 2005 study affirmed the reasonableness of the conclusions reached in the 2005 study.
During 2004, the Company completed a comprehensive study of its environmental reserves. The study was performed with the assistance of an independent actuarial firm, and focused on the implications of claim and litigation trends and other significant developments. The study encompassed the Company’s liabilities with respect to both National Priority List (NPL) claims and direct site claims involving the presence of hazardous waste at sites owned or operated by the insured. As a result of the comprehensive study, the Company increased net loss and allocated loss adjustment expense reserves by $316. In 2005 and 2006, internal studies of environmental claims have affirmed the reasonableness of the 2004 study conclusions.
As a result of the significant uncertainty inherent in determining a company’s asbestos and environmental liabilities and establishing related reserves, the amount of reserves required to adequately fund the Company’s asbestos and environmental claims cannot be accurately estimated using conventional reserving methodologies based on historical data and trends. As a result, the use of conventional reserving methodologies frequently has to be supplemented by subjective considerations including managerial judgment. In that regard, the estimation of asbestos claims and associated liabilities and the analysis of environmental claims considered prevailing applicable law and certain inconsistencies of court decisions as to coverage, plaintiffs’ expanded theories of liability, and the risks inherent in major litigation and other uncertainties, the Company believes that in future periods it is possible that the outcome of the continued uncertainties regarding asbestos and environmental related claims could result in an aggregate liability that differs from current reserves by an amount that could be material to the Company’s future operating results and financial condition.
The following tables summarize the activity for the Company’s asbestos and environmental claims and claim adjustment expenses, a component of the Company’s unpaid claims and claim adjustment expenses, for the years ended December 31, 2006, 2005, and 2004:
| 2006 | 2005 | 2004 | |||||||
Gross Asbestos: | |||||||||
January 1 reserves | $ | 2,720 | $ | 2,399 | $ | 2,039 | |||
Acquisitions | — | — | — | ||||||
Incurred activity | 152 | 614 | 683 | ||||||
Paid activity | 331 | 293 | 323 | ||||||
Ending reserves | $ | 2,541 | $ | 2,720 | $ | 2,399 | |||
Net Asbestos: | |||||||||
January 1 reserves | $ | 1,066 | $ | 961 | $ | 1,120 | |||
Acquisitions | — | — | — | ||||||
Incurred activity | 25 | 238 | 20 | ||||||
Paid activity | 219 | 133 | 179 | ||||||
Ending reserves | $ | 872 | $ | 1,066 | $ | 961 | |||
Allowance for reinsurance on unpaid losses | 100 | 110 | 127 | ||||||
Total unpaid losses including allowance for unpaid reinsurance | $ | 972 | $ | 1,176 | $ | 1,088 | |||
Included in gross asbestos incurred for 2006, 2005, and 2004 are significant amounts attributable to claims against 1985 and prior policies issued by EICOW and its affiliates, which are 100% ceded to Nationwide Indemnity Company and guaranteed by Nationwide Mutual Insurance Company. In addition, the Company’s 2003 acquisition of Prudential Property and Casualty Insurance Company, Prudential General Insurance Company, and Prudential Commercial Insurance Company (collectively referred to as “Pru Pac”) included $175 and $118 of gross and net asbestos reserves, respectively. Any increase in asbestos reserves related to PruPac is reinsured by Vantage Casualty Insurance Company and guaranteed by Prudential Financial, Inc. The Company had paid losses associated with these reserves of $60 and $1 in 2006 and 2005, respectively.
| 2006 | 2005 | 2004 | |||||||
Gross Environmental: | |||||||||
January 1 reserves | $ | 775 | $ | 816 | $ | 410 | |||
Acquisitions | — | — | — | ||||||
Incurred activity | 52 | 155 | 484 | ||||||
Paid activity | 242 | 196 | 78 | ||||||
Ending reserves | $ | 585 | $ | 775 | $ | 816 | |||
Net Environmental: | |||||||||
January 1 reserves | $ | 452 | $ | 553 | $ | 287 | |||
Acquisitions | — | — | — | ||||||
Incurred activity | 22 | 5 | 316 | ||||||
Paid activity | 60 | 106 | 50 | ||||||
Ending reserves | $ | 414 | $ | 452 | $ | 553 | |||
42
The Company’s 2003 acquisition of PruPac included $15 and $12 of gross and net environmental reserves, respectively. Any increase in environmental reserves related to PruPac is reinsured by Vantage Casualty Insurance Company and guaranteed by Prudential Financial, Inc. The Company had paid losses associated with these reserves of $1 in both 2006 and 2005.
(7) UNPAID CLAIMS AND CLAIM ADJUSTMENT EXPENSES
The Company establishes reserves for payment of claims and claim adjustment expenses that arise from the policies issued. As required by applicable accounting rules, no reserves are established until a loss, including a loss from a catastrophe, occurs. The Company’s reserves are segmented into three major categories: reserves for reported claims (estimates made by claims adjusters); incurred but not reported claims reserves (“IBNR”) representing reserves for unreported claims and supplemental reserves for reported claims; and reserves for the costs to settle claims. The Company establishes its reserves net of salvage and subrogation by line of business or coverage and year in which losses occur.
Establishing loss reserves, including loss reserves for catastrophic events that have occurred, is an estimation process. Many factors can ultimately affect the final settlement of a claim and, therefore, the necessary reserve. Changes in the law, results of litigation, medical costs, the costs of repair materials, and labor rates can all affect ultimate claim costs. In addition, time can be a critical part of reserving determinations since the longer the span between the incidence of a loss and the payment or settlement of the claim, the more variable the ultimate settlement can be. Accordingly, “short-tail” claims, such as property damage claims, tend to be easier to estimate than “long-tail” claims, such as workers compensation or general liability claims.
As information develops that varies from past experience, provides additional data, or in some cases, augments data that previously was not considered sufficient for use in determining reserves, changes in the Company’s estimate of ultimate liabilities may be required. The effects of these changes are reflected in current operating results.
Catastrophes are an inherent risk of the property-casualty insurance business and have contributed to material period-to-period fluctuations in the Company’s results of operations and financial position. The level of catastrophe losses experienced in any period cannot be predicted and can be material to the results of operations and financial position of the Company. Catastrophe losses incurred during the years ended December 31, 2006, 2005, and 2004, were $558, $1,560, and $858, respectively.
Please see Note 6 for a discussion of incurred attributable to prior years for asbestos and environmental reserves.
Activity in property and casualty unpaid claims and claim adjustment expenses of the Company is summarized as follows:
| 2006 | 2005 | 2004 | |||||||||
Balance as of January 1 | $ | 38,067 | $ | 33,897 | $ | 29,952 | |||||
Less: unpaid reinsurance recoverables(1) | 13,516 | 11,548 | 9,671 | ||||||||
Net balance as of January 1 | 24,551 | 22,349 | 20,281 | ||||||||
Balance attributable to dispositions, acquisitions, and affiliations | 25 | 7 | (236 | ) | |||||||
Incurred attributable to: | |||||||||||
Current year | 12,854 | 13,082 | 11,732 | ||||||||
Prior years: | |||||||||||
Asbestos and environmental | 35 | 232 | 324 | ||||||||
All other | 376 | 83 | 262 | ||||||||
Discount accretion | 109 | 118 | 98 | ||||||||
Total incurred | 13,374 | 13,515 | 12,416 | ||||||||
Paid attributable to: | |||||||||||
Current year | 6,050 | 6,026 | 5,155 | ||||||||
Prior years | 6,027 | 5,192 | 5,109 | ||||||||
Total paid | 12,077 | 11,218 | 10,264 | ||||||||
Amortization of deferred retroactive reinsurance gain | 97 | 97 | 47 | ||||||||
Net adjustment due to foreign exchange | 174 | (199 | ) | 105 | |||||||
Add: unpaid reinsurance recoverables(1) | 12,462 | 13,516 | 11,548 | ||||||||
Balance as of December 31 | $ | 38,606 | $ | 38,067 | $ | 33,897 | |||||
(1) | In addition to the unpaid reinsurance recoverable balances noted above, and as a result of retroactive reinsurance agreements discussed in Note 8, the Company has recorded retroactive reinsurance recoverable balances of $2,292, $2,247, and $2,225 at December 31, 2006, 2005, and 2004, respectively. |
In 2006, incurred attributable to prior years, excluding asbestos and environmental, is primarily related to the workers compensation and assumed non-proportional liability lines of business, partially offset by personal auto and commercial auto lines of business. In 2005 and 2004, incurred attributable to prior years, excluding asbestos and environmental, is primarily related to the workers compensation line of business, partially offset by personal auto and homeowners lines of business.
The Company has not discounted unpaid property and casualty insurance claims and claim adjustment expenses other than tabular discounting on the long-term indemnity portion of workers compensation claims, the Company’s disability claims as permitted by insurance regulations in certain states and specific asbestos structured settlements.
The tabular discounting on these workers compensation claims is based on Unit Statistical Plan tables as approved by the respective states and ranges from 3.5% to 4.0% for the years ended December 31, 2006, and 2005. Unpaid workers compensation claims and claim adjustment expenses at December 31, 2006, and 2005, include liabilities of $4,822 and $4,609 at discounted values of $3,395 and $3,214, respectively. The discounting of the disability claims is based on the 1987 Commissioners Group Disability Table (CGDT) at annual discount rates varying from 4.5% to 7.0% in 2006 and 2005. Unpaid disability claims and claim adjustment expenses at December 31, 2006, and 2005, include liabilities of $1,019 and $954 carried at discounted values of $768 and $712, respectively.
43
| Notes to Consolidated Financial Statements | LIBERTY MUTUAL HOLDING COMPANY INC. | |
[CONTINUED] |
For certain commercial lines of insurance, the Company offers experience-rated insurance contracts whereby the ultimate premium is dependent upon the claims incurred. At December 31, 2006, and 2005, the Company held $3,763 and $3,695, respectively, of unpaid claims and claim adjustment expenses related to experience-rated contracts. Premiums receivable included accrued retrospective and unbilled audit premiums of $818 and $823 at December 31, 2006, and 2005, respectively. For the years ended December 31, 2006, 2005, and 2004, the Company recognized a (decrease) and increase in premium income of $(28), $86, and $93, respectively, relating to prior years.
Unpaid claims and claim adjustment expenses are recorded net of anticipated salvage and subrogation of $534 and $493 as of December 31, 2006, and 2005, respectively.
At December 31, 2006, and 2005, the reserve for unpaid claim reserves was reduced by $4,414 and $4,183, respectively, for large dollar deductibles. Large dollar deductibles billed and recoverable were $261 and $260 at December 31, 2006, and 2005, respectively.
(8) REINSURANCE
In the ordinary course of business, the Company assumes reinsurance and also cedes reinsurance to other insurers to reduce overall risk, including exposure to large losses and catastrophic events. The Company is also a member of various involuntary pools and associations and serves as a servicing carrier for residual market organizations.
A summary of reinsurance financial data reflected within the consolidated statements of income is presented below:
2006 | 2005 | 2004 | ||||||||||||||||
| Written | Earned | Written | Earned | Written | Earned | |||||||||||||
Direct | $ | 23,231 | $ | 22,526 | $ | 20,569 | $ | 20,242 | $ | 19,812 | $ | 19,059 | ||||||
Assumed | 1,341 | 1,328 | 1,473 | 1,426 | 1,314 | 1,333 | ||||||||||||
Ceded | 3,944 | 3,987 | 3,966 | 4,037 | 3,805 | 3,829 | ||||||||||||
Net premiums | $ | 20,628 | $ | 19,867 | $ | 18,076 | $ | 17,631 | $ | 17,321 | $ | 16,563 | ||||||
The following table summarizes the Company’s reinsurance recoverables by reinsurers’ Standard & Poor’s (“S&P”) rating (or the rating of any guarantor) as of December 31, 2006.
| S&P Rating | Reinsurance Recoverables | ||
AAA | $ | 1,371 | |
AA+, AA, AA- | 5,084 | ||
A+, A, A- | 3,763 | ||
BBB+, BBB, BBB- | 69 | ||
BB+ or below | 10 | ||
Involuntary Pools | 3,024 | ||
Voluntary Pools | 352 | ||
Other(1) | 2,206 | ||
Gross Recoverables | 15,879 | ||
Less: allowance | 315 | ||
Net Recoverables | $ | 15,564 | |
| (1) | Includes $973, $907, and $326 of recoverables from non-rated reinsurers, captive insurers, and fronted companies, respectively. |
The Company remains contingently liable in the event reinsurers are unable to meet their obligations for paid and unpaid reinsurance recoverables and unearned premiums ceded under reinsurance agreements. As of December 31, 2006, the Company holds $4,802 of collateral as security under related reinsurance agreements in the form of funds, securities and/or letters of credit.
The Company has an aggregate reinsurance recoverable from Nationwide Indemnity Company in the amount of $2,113 and $2,120 as of December 31, 2006, and 2005, respectively. The reinsurance recoverable is guaranteed by Nationwide Mutual Insurance Company. Additionally, the Company has significant reinsurance recoverable concentrations with Swiss Reinsurance Group, Berkshire Hathaway Group, Everest Re Group and Munich Re totaling $1,726, $742, $571, and $428 respectively, as of December 31, 2006, net of offsetting collateral under the contracts.
The reinsurance recoverables from state mandated involuntary pools and associations represent the Company’s servicing carrier business. As a servicing carrier, the Company retains no direct underwriting risk but instead cedes 100% of the involuntary market premium and losses back to the pool. Payment of losses is shared by the pool participants in proportion to their pool participation. Credit risk with respect to this servicing carrier business is the composite of the cumulative creditworthiness of all participants in their respective pools.
The Company is party to retroactive reinsurance arrangements where a significant portion of the consideration was retained on a “funds held” basis and interest is credited on the balance at a weighted average rate of approximately 7.7% annually. These contracts resulted in deferred gains (including experience related profit accruals of $195) that are amortized into income using the effective interest method over the estimated settlement periods.
44
At December 31, 2006, and 2005, deferred gains related to these reinsurance arrangements were $839 and $878, respectively, and are included in other liabilities within the consolidated balance sheets. Interest credited to the funds held balances for the years ended December 31, 2006, 2005, and 2004 was $125, $113, and $103, respectively. Deferred gain amortization was $95, $89, and $47 for the years ended December 31, 2006, 2005, and 2004, respectively. Reinsurance recoverables related to these transactions including experience related profit accruals were $2,258 and $2,211 as of December 31, 2006, and 2005, respectively.
Additionally, the Company has an aggregate stop loss program covering substantially all of Commercial Markets and Wausau voluntary workers compensation business from the fourth quarter 2000 through the fourth quarter 2002 accident year periods. Under these contracts, losses in excess of a specified loss ratio are reinsured up to a maximum loss ratio and were accounted for as prospective reinsurance at inception. However, due to a material contract change at the January 1, 2002, renewal, any premium and loss activity subsequent to December 31, 2001, is accounted for as retroactive reinsurance for coverage provided from the fourth quarter 2000 through the fourth quarter 2001 covered accident year periods. The retroactive portion of the aggregate stop loss program is included in the preceding paragraph. Approximately $45 and $32 of additional losses were ceded to these retroactive and prospective contracts, respectively, during the year ended December 31, 2006, with additional premium of $29 and $23, respectively. Approximately $38 and $31 of additional losses were ceded to these retroactive and prospective contracts, respectively, during the year ended December 31, 2005, with additional premium of $24 and $22, respectively. Approximately $68 and $78 of additional losses were ceded to these retroactive and prospective contracts, respectively, during the year ended December 31, 2004, with additional premium of $38 and $45, respectively. The income statement impact of ceding the additional losses and premium on the fourth quarter 2000 through fourth quarter 2001 covered accident year periods was deferred for GAAP purposes and is amortized into income using the effective interest method over the estimated settlement period.
In 2006, Liberty Mutual Insurance Company (“LMIC”) entered into multi-year property catastrophe reinsurance agreements with Mystic Re Ltd. (“Mystic Re”), a Cayman Islands domiciled reinsurer, to provide $525 of additional reinsurance coverage for LMIC and its affiliates in the event of a Northeast hurricane. The reinsurance agreements are fully collateralized by proceeds received by Mystic Re from the issuance of catastrophe bonds and provide coverage for hurricane-related losses from Washington, D.C., to Maine based on industry insured losses as reported by Property Claim Services. The reinsurance covers the 2007-2008 hurricane seasons and $200 was in force for the 2006 hurricane season. The Company has not recorded any recoveries under this program. Mystic Re has no other reinsurance in force.
(9) DEBT OUTSTANDING
Debt outstanding at December 31, 2006, and 2005, includes the following:
Short-term debt:
| 2006 | 2005 | |||||
Commercial paper | $ | — | $ | 100 | ||
Revolving credit facilities | 50 | 35 | ||||
Current maturities of long-term debt | 121 | 10 | ||||
Total short-term debt | $ | 171 | $ | 145 | ||
Long-term debt:
| 2006 | 2005 | |||||||
8.20% Surplus Notes, due 2007 | $ | — | $ | 121 | ||||
6.75% Notes, due 2008 | 15 | 15 | ||||||
5.00% Notes, due 2008 | 4 | 4 | ||||||
8.00% Notes, due 2013 | 260 | 260 | ||||||
5.75% Notes, due 2014 | 500 | 500 | ||||||
6.70% Notes, due 2016 | 250 | — | ||||||
8.50% Surplus Notes, due 2025 | 150 | 150 | ||||||
7.875% Surplus Notes, due 2026 | 250 | 250 | ||||||
7.63% Notes, due 2028 | 3 | 3 | ||||||
7.00% Notes, due 2034 | 250 | 250 | ||||||
6.50% Notes, due 2035 | 500 | 500 | ||||||
7.50% Notes, due 2036 | 500 | — | ||||||
7.697% Surplus Notes, due 2097 | 500 | 500 | ||||||
7.10% – 7.86% Medium Term Notes, with various maturities | 27 | 27 | ||||||
| 3,209 | 2,580 | |||||||
Unamortized discount | (34 | ) | (25 | ) | ||||
Total long-term debt excluding current maturities | $ | 3,175 | $ | 2,555 | ||||
Short-term Debt
The Company issues commercial paper to meet short-term operating needs. The total facility was $600 at December 31, 2006, and 2005, and is supported by a $750 line of credit facility. Commercial paper issued and outstanding at December 31, 2006, and 2005, was $0 and $100, respectively. Interest rates ranged from 4.43% to 5.50% in 2006 and 2.31% to 4.45% in 2005.
Long-term Debt
Payments of interest and principal of the surplus notes are expressly subordinate to all policyholder claims and other obligations of LMIC. Accordingly, interest and principal payments are contingent upon prior approval of the Commissioner of Insurance of the Commonwealth of Massachusetts.
45
| Notes to Consolidated Financial Statements | LIBERTY MUTUAL HOLDING COMPANY INC. | |
[CONTINUED] |
At December 31, 2006, the principal maturity schedule of long-term borrowings is as follows:
2007 | $ | — | ||
2008 | 21 | |||
2009 | — | |||
2010 | — | |||
Thereafter | 3,188 | |||
Less: discount | (34 | ) | ||
Total long-term debt | $ | 3,175 | ||
Capital lease obligations as of December 31, 2006, and 2005, were $103 and $106, respectively, and are included in other liabilities in the accompanying consolidated balance sheets.
In 2006, 2005, and 2004, the Company entered into an arrangement to sell and leaseback certain furniture and equipment. The Master Leasing Agreement was amended on December 15, 2006, to change the interest rate on 60-month basic term for new equipment. The weighted average interest rate on the lease is LIBOR plus 107 basis points. The transactions are accounted for as capital leases. As of December 31, 2006, the Company’s amortization of the lease obligation under the sale-leaseback agreement through maturity is approximately $23 for 2007, $21 for 2008, $17 for 2009, $10 for 2010, and $6 for 2011.
Interest
The Company paid $188, $173, and $146 of interest in 2006, 2005, and 2004, respectively, and incurred $212, $184, and $157 of interest expense in 2006, 2005, and 2004, respectively, for all indebtedness.
(10) FEDERAL AND FOREIGN INCOME TAXES
The Company files a consolidated U.S. federal income tax return for substantially all of its operations. Pursuant to intercompany Federal income tax allocation agreements among each of these companies and their respective subsidiaries, the consolidated tax liabilities are allocated to each company based on its separate return tax liability. Tax benefits are allocated to each company for its portion of net operating losses and tax credit carry forwards in the year they are used by the consolidated group. Intercompany tax balances are settled quarterly. A provision is made, where applicable, for taxes on foreign operations.
The components of Federal and foreign income tax expense (benefit) related to continuing operations are:
| Years ended December 31, | 2006 | 2005 | 2004 | |||||||||
Current tax expense (benefit): | ||||||||||||
United States Federal | $ | 530 | $ | 286 | $ | 111 | ||||||
United States Federal benefit of net operating losses | (18 | ) | (34 | ) | (140 | ) | ||||||
Foreign | 125 | 74 | 31 | |||||||||
Total current tax expense | 637 | 326 | 2 | |||||||||
Deferred tax expense (benefit): | ||||||||||||
United States Federal | (7 | ) | (85 | ) | (30 | ) | ||||||
Foreign | 2 | (150 | ) | 28 | ||||||||
Total deferred tax benefit | (5 | ) | (235 | ) | (2 | ) | ||||||
Total Federal and foreign income tax expense | $ | 632 | $ | 91 | $ | — | ||||||
A reconciliation of the income tax expense attributable to continuing operations computed at U.S. Federal statutory tax rates to the income tax expense as included in the consolidated statements of income follows:
| Years ended December 31, | 2006 | 2005 | 2004 | |||||||||
Expected Federal income tax expense | $ | 790 | $ | 396 | $ | 427 | ||||||
Tax effect of: | ||||||||||||
Nontaxable investment income | (67 | ) | (35 | ) | (25 | ) | ||||||
Change in valuation allowance | — | (256 | ) | (389 | ) | |||||||
Goodwill | (15 | ) | (16 | ) | (20 | ) | ||||||
IRS Settlement | (10 | ) | — | (18 | ) | |||||||
Foreign | (53 | ) | 45 | 4 | ||||||||
Other | (13 | ) | (43 | ) | 21 | |||||||
Actual Federal and foreign income tax expense | $ | 632 | $ | 91 | $ | — | ||||||
The significant components of the deferred income tax assets and liabilities at December 31, are summarized as follows:
| 2006 | 2005 | |||||||
Deferred tax assets: | ||||||||
Unpaid claims discount | $ | 616 | $ | 577 | ||||
Unearned premium reserves | 509 | 470 | ||||||
Net operating losses | 342 | 350 | ||||||
Employee benefits | 355 | 463 | ||||||
Retroactive reinsurance deferred gain | 301 | 321 | ||||||
Credits | 73 | 76 | ||||||
Other | 160 | 247 | ||||||
| 2,356 | 2,504 | |||||||
Less: valuation allowance | (101 | ) | (99 | ) | ||||
Total deferred tax assets | 2,255 | 2,405 | ||||||
Deferred tax liabilities: | ||||||||
Deferred acquisition costs | 425 | 380 | ||||||
Net unrealized gains and other-than-temporary declines in investments | 318 | 383 | ||||||
Other | 22 | 15 | ||||||
Total deferred tax liabilities | 765 | 778 | ||||||
Net deferred tax assets | $ | 1,490 | $ | 1,627 | ||||
The total decrease in valuation allowance differs from no change reflected in income from continuing operations primarily due to foreign currency translation adjustments. Based on the assumption that future levels of income will be achieved,
46
management believes it is more likely than not that the net deferred tax assets will be realized.
The Company’s subsidiaries had net operating loss carry forwards of $977, alternative minimum tax credit carry forwards of $1 and foreign tax credit carry forwards of $72 as of December 31, 2006. The net operating losses available in the U.S. and various non-U.S. tax jurisdictions will begin to expire, if not utilized, as follows:
2007 | $ | 3 | |
2008 | 7 | ||
2009 | 7 | ||
2010 | 12 | ||
2011 | 17 | ||
Thereafter | 931 | ||
Total | $ | 977 | |
The foreign tax credits will begin to expire, if not utilized, in 2011 and the alternative minimum tax credits do not expire.
The Company has not provided for deferred taxes on unremitted earnings of subsidiaries outside the United States where such earnings are permanently reinvested. At December 31, 2006, unremitted earnings of foreign subsidiaries were $588. If these earnings were distributed in the form of dividends or otherwise, the Company would be subject to U.S. income taxes less an adjustment for applicable foreign tax credits.
The American Jobs Creation Act of 2004 (“the AJC Act”) introduced a special 85% dividends received deduction on the repatriation of certain foreign earnings to a United States taxpayer, provided certain criteria are met. The maximum amount of foreign earnings eligible for the deduction is limited to the greater of $500 or the amount shown in the Company’s most recent audited financial statements prior to June 30, 2003, as earnings permanently reinvested outside of the United States. In 2005, the Company repatriated a total of $161 from its foreign subsidiaries and recorded a related tax expense of $18.
The IRS has completed its review of the Company’s federal income tax returns through the 1998 tax year and is currently reviewing income tax returns for the 1999 through 2003 tax years. Any adjustments that may result from the IRS examinations of these income tax returns are not expected to have a material impact on the financial position, liquidity, or results of operations of the Company.
(11) BENEFIT PLANS
The Company sponsors non-contributory defined benefit pension plans (“the Plans”) covering substantially all U.S. and Canadian employees. The benefits and eligibility are based on age, years of service, and the employee’s compensation, as more fully described in the Plans. Some foreign subsidiaries sponsor pension plans (principally non-contributory) which provide benefits based on final pay.
The Company sponsors supplemental retirement plans to provide pension benefits above the levels provided by the pension plans without regard to the statutory earnings limitations of qualified defined benefit pension plans. The supplemental plans are unfunded.
The Company also provides certain healthcare and life insurance benefits (“Postretirement”) covering substantially all U.S. and Canadian employees. Life insurance benefits are based on a participant’s final compensation subject to the plan maximum.
Assets of the defined benefit pension and postretirement plans consist primarily of investments in a subsidiary life insurance company’s separate accounts that invest primarily in fixed income and Standard and Poor’s 500 Index of equity securities. At December 31, 2006, and 2005, assets of the Plans totaling $2,882 and $2,433, respectively, were held in separate accounts of the Company.
The Company sponsors defined contribution savings plans for substantially all U.S. (a 401(k) plan) and Canadian (a Deferred Profit Sharing Plan) employees who meet certain eligibility requirements. During 2006, 2005, and 2004, employees could contribute a percentage of their annual compensation on a before and after-tax basis, subject to Federal limitations. The benefits are based on the employee’s contribution amount and Company profitability. In 2006, 2005, and 2004, the Company made matching contributions of $88, $76, and $68, respectively, including the supplemental defined contribution plans.
Compensation expense related to the Company’s long-term and short-term incentive compensation plans was $488, $355, and $389, for the years ended December 31, 2006, 2005, and 2004, respectively.
47
| Notes to Consolidated Financial Statements | LIBERTY MUTUAL HOLDING COMPANY INC. | |
[CONTINUED] |
The following table sets forth the assets, obligations, and assumptions associated with the various U.S., Canadian, and certain foreign subsidiary pension and postretirement benefits. The amounts are recognized in the accompanying consolidated balance sheets as of December 31, 2006, and 2005, and consolidated statements of income for the years ended December 31, 2006, 2005, and 2004.
| Pension | Supplemental Pension | Postretirement | ||||||||||||||||||||||
| 2006 | 2005 | 2006 | 2005 | 2006 | 2005 | |||||||||||||||||||
Change in benefit obligations: | ||||||||||||||||||||||||
Benefit obligation at beginning of year | $ | 3,368 | $ | 2,829 | $ | 233 | $ | 219 | $ | 508 | $ | 608 | ||||||||||||
Service costs | 154 | 127 | 10 | 9 | 19 | 14 | ||||||||||||||||||
Interest costs | 184 | 173 | 13 | 13 | 28 | 27 | ||||||||||||||||||
Amendments | — | (23 | ) | — | — | — | (9 | ) | ||||||||||||||||
Actuarial (gains)/losses | (245 | ) | 362 | (17 | ) | 10 | (24 | ) | (105 | ) | ||||||||||||||
Currency exchange rate change | 1 | (4 | ) | — | — | — | — | |||||||||||||||||
Benefits paid | (110 | ) | (108 | ) | (15 | ) | (18 | ) | (23 | ) | (27 | ) | ||||||||||||
Other | 3 | 12 | — | — | 4 | — | ||||||||||||||||||
Benefit obligations at end of year | $ | 3,355 | $ | 3,368 | $ | 224 | $ | 233 | $ | 512 | $ | 508 | ||||||||||||
Accumulated benefit obligations | $ | 2,830 | $ | 2,827 | $ | 172 | $ | 168 | $ | 512 | $ | 508 | ||||||||||||
Change in plan assets: | ||||||||||||||||||||||||
Fair value of plan assets at beginning of year | $ | 2,526 | $ | 2,339 | $ | — | $ | — | $ | 19 | $ | 20 | ||||||||||||
Actual return on plan assets | 352 | 139 | — | — | 2 | 1 | ||||||||||||||||||
Currency exchange rate change | 1 | (2 | ) | — | — | — | — | |||||||||||||||||
Employer contribution | 225 | 153 | — | — | 20 | 25 | ||||||||||||||||||
Benefits paid | (110 | ) | (108 | ) | — | — | (23 | ) | (27 | ) | ||||||||||||||
Other | (7 | ) | 5 | — | — | — | — | |||||||||||||||||
Fair value of plan assets at end of year | $ | 2,987 | $ | 2,526 | $ | — | $ | — | $ | 18 | $ | 19 | ||||||||||||
Reconciliation of funded status: | ||||||||||||||||||||||||
Funded status of the plan | $ | (368 | ) | $ | (842 | ) | $ | (224 | ) | $ | (233 | ) | $ | (494 | ) | $ | (489 | ) | ||||||
Unrecognized net (gain)/loss | 604 | 1,051 | 73 | 98 | (22 | ) | (1 | ) | ||||||||||||||||
Unrecognized prior service cost | (3 | ) | (2 | ) | 11 | 13 | (35 | ) | (38 | ) | ||||||||||||||
Unrecognized net transition (asset)/obligation | (21 | ) | (29 | ) | — | — | 86 | 95 | ||||||||||||||||
Net amount recognized | $ | 212 | $ | 178 | $ | (140 | ) | $ | (122 | ) | $ | (465 | ) | $ | (433 | ) | ||||||||
| �� | ||||||||||||||||||||||||
Amounts recognized in the consolidated balance sheets consist of: | ||||||||||||||||||||||||
Prepaid benefit cost | $ | 214 | $ | 181 | $ | — | $ | — | $ | — | $ | — | ||||||||||||
Accrued benefit liability | (10 | ) | (486 | ) | (177 | ) | (168 | ) | (465 | ) | (433 | ) | ||||||||||||
Intangible asset | 7 | 7 | 8 | 13 | — | — | ||||||||||||||||||
Accumulated other comprehensive income | 1 | 476 | 29 | 33 | — | — | ||||||||||||||||||
Net amounts recognized at year end | $ | 212 | $ | 178 | $ | (140 | ) | $ | (122 | ) | $ | (465 | ) | $ | (433 | ) | ||||||||
Additional information: | ||||||||||||||||||||||||
(Decrease)/increase in additional minimum liability included in other comprehensive income | $ | (475 | ) | $ | 476 | $ | (4 | ) | $ | (5 | ) | $ | — | $ | — | |||||||||
The expected long-term rate of return assumption is primarily driven by two factors: (1) the asset allocation targets and (2) the expected long-run returns associated with each asset class. The starting point for generating long-run expected asset class returns for large-cap equities, small-cap equities, private equities and high-yield bonds is an analysis of historic asset class returns and risk premiums relative to the 5-year U.S. Treasury. Investment grade bonds and cash are expected to earn returns that are generally consistent with prevailing market yields.
48
This approach is not entirely formulaic as professional judgment is used to make modest adjustments to these numbers in cases where the Company believes that certain data are at abnormal levels relative to long-run averages. For example, the spread between Treasury yields and inflation appeared low relative to long-run averages at the end of 2005. The 5-year U.S. Treasury was approximately 4.4% and inflation (as measured by the CPI-U) was 3.4%, resulting in a difference of 1.0%. Over the past ten and twenty years, this difference has averaged approximately 2.5% and 3.2%, respectively. Based on this information, the Company assumed a modest increase in future 5-year Treasury yields in generating its expected long-run return estimates.
The net benefit costs for the years ended December 31, 2006, 2005, and 2004, include the following components:
December 31, 2006 | Pension | Supplemental Pension | Post retirement | ||||||||
Components of net periodic benefit costs | |||||||||||
Service costs | $ | 154 | $ | 10 | $ | 19 | |||||
Interest costs | 184 | 13 | 28 | ||||||||
Expected return on plan assets | (199 | ) | — | (2 | ) | ||||||
Settlement charge | (2 | ) | — | — | |||||||
Amortization of unrecognized: | |||||||||||
Net loss | 59 | 8 | — | ||||||||
Prior service cost | 1 | 2 | (3 | ) | |||||||
Net transition (assets)/obligation | (6 | ) | — | 9 | |||||||
Net periodic benefit costs | $ | 191 | $ | 33 | $ | 51 | |||||
December 31, 2005 | |||||||||||
Components of net periodic benefit costs | |||||||||||
Service costs | $ | 127 | $ | 9 | $ | 14 | |||||
Interest costs | 173 | 13 | 27 | ||||||||
Expected return on plan assets | (201 | ) | — | (1 | ) | ||||||
Settlement charge | — | — | — | ||||||||
Amortization of unrecognized: | |||||||||||
Net loss/(gain) | 18 | 6 | (1 | ) | |||||||
Prior service cost | 3 | 2 | (3 | ) | |||||||
Net transition (assets)/obligation | (5 | ) | — | 10 | |||||||
Net periodic benefit costs | �� | $ | 115 | $ | 30 | $ | 46 | ||||
December 31, 2004 | |||||||||||
Components of net periodic benefit costs | |||||||||||
Service costs | $ | 125 | $ | 7 | $ | 18 | |||||
Interest costs | 161 | 12 | 30 | ||||||||
Expected return on plan assets | (208 | ) | — | (1 | ) | ||||||
Settlement charge | — | 15 | (1 | ) | |||||||
Amortization of unrecognized: | |||||||||||
Net loss/(gain) | — | 6 | (1 | ) | |||||||
Prior service cost | 5 | 2 | (3 | ) | |||||||
Net transition (assets)/obligation | (5 | ) | — | 9 | |||||||
Net periodic benefit costs | $ | 78 | $ | 42 | $ | 51 | |||||
The measurement date used to determine pension and other postretirement measurements is December 31, 2006.
Weighted-average actuarial assumptions for benefit obligations are set forth in the following table:
December 31, | 2006 | 2005 | ||||
Pension | ||||||
Discount rate | 6.00 | % | 5.50 | % | ||
Rate of compensation increase | 4.70 | % | 4.70 | % | ||
Supplemental Pension | ||||||
Discount rate | 6.00 | % | 5.50 | % | ||
Rate of compensation increase | 4.90 | % | 4.90 | % | ||
Postretirement | ||||||
Discount rate | 6.00 | % | 5.50 | % |
Weighted-average actuarial assumptions for net periodic benefit costs are set forth in the following table:
December 31, | 2006 | 2005 | 2004 | ||||||
Pension | |||||||||
Discount rate | 5.50 | % | 6.25 | % | 6.50 | % | |||
Expected return on plan assets | 7.50 | % | 8.00 | % | 8.50 | % | |||
Rate of compensation increase | 4.70 | % | 5.20 | % | 5.20 | % | |||
Supplemental Pension | |||||||||
Discount rate | 5.50 | % | 6.25 | % | 6.50 | % | |||
Rate of compensation increase | 4.90 | % | 4.90 | % | 4.90 | % | |||
Postretirement | |||||||||
Discount rate | 5.50 | % | 6.25 | % | 6.50 | % | |||
Expected return on plan assets | 7.15 | % | 7.15 | % | 7.15 | % |
The weighted-average healthcare cost trend rates are expected to be 9.4% in 2007 graded down to 5.2% in 2012. Healthcare cost trend rate assumptions have a material impact on the postretirement benefit obligation. A one-percentage point change in assumed healthcare cost trend rates would have the following effects:
| 1% point increase | 1% point decrease | ||||||
Effect on Postretirement Benefit Obligation | $ | 49 | $ | (45 | ) | ||
Effect on total service and interest costs | $ | 6 | $ | (5 | ) | ||
Plan Assets
The pension plan’s weighted-average asset allocation by asset category is as follows:
Asset Category | 2006 | 2005 | ||||
Equity Investments | 58 | % | 57 | % | ||
Debt Investments | 24 | % | 27 | % | ||
Other | 18 | % | 16 | % | ||
Total | 100 | % | 100 | % | ||
The fundamental investment policies of the Plans have been formulated so they balance the primary objectives of (1) achieving long-term growth sufficient to fund, as fully practicable, future obligations and (2) supporting the short-term requirement of meeting current benefit payments, all after giving due consideration to the underlying characteristics of the Company’s employment base. Overall, the Plans’ policies have traditionally emphasized the maximization of long-term returns in a manner that is consistent with an asset base that: consists of high quality investments as a means of enhancing capital preservation; is broadly diversified; generates a relatively high level of investment
49
| Notes to Consolidated Financial Statements | LIBERTY MUTUAL HOLDING COMPANY INC. | |
[CONTINUED] |
income in accordance with the level of risk incurred; and is generally, highly marketable.
Asset allocation and selection guidelines for the Plans have been developed around the aforementioned fundamental policies. Equities have been considered the most appropriate asset class for the Plan given their record of superior, long-term, real rates of return and the Plan’s ability to accommodate the shorter-term volatility typically associated with equity investments. The guidelines for equity investing have historically focused on high quality stocks and the diversification of risk. The Plans’ target allocation for equity investments is 65%, with a range of 45% to 80%.
The other major component of the Plans’ assets consists of fixed income securities. The primary investment objective for this class of assets is to balance the pursuit of total return and the generation of a relatively high level of investment income. Emphasis is placed on high quality investments and the diversification of risk. The Plans’ target allocation for debt investments is 29%, with a range of 17% to 42%.
The remaining assets of the Plans are maintained in cash or invested in limited partnerships, which are principally engaged in venture capital investing and other so-called “non-traditional” forms of investment. The Plans’ target allocation for other investments is 6%, with a range of 3% to 12%. The increase in Other from the target is primarily attributable to an increase in money market assets and short-term securities.
The Postretirement Plan weighted-average asset allocations by asset category are as follows:
Asset Category | 2006 | 2005 | ||||
Equity Investments | 34 | % | 29 | % | ||
Debt Investments | 14 | % | 13 | % | ||
Other | 52 | % | 58 | % | ||
Total | 100 | % | 100 | % | ||
The Postretirement Plan maintains assets in an insurance contract used to pay current life insurance premiums for certain retirees. These amounts are classified as other assets. The investment strategy for this portion of the assets places a greater emphasis on funding current benefits and a lesser emphasis on long-term growth.
Cash Flows
Contributions
The Company contributed $225 to the qualified plans, and directly funded $15 to retirees in the supplemental pension plans in 2006. In addition, the Company directly funded $20 to the postretirement benefit plans in 2006.
The Company expects to contribute approximately $150 to $200 to the qualified plan, and directly fund $15 to retirees in the supplemental pension plan in 2007. In addition, the Company expects to directly fund $28 to the postretirement benefit plan gross of the Medicare Subsidy in 2007.
Expected Future Benefit Payments
The following benefit payments, which reflect expected future service, as appropriate are expected to be paid:
| Pension | Supplemental Pension | Postretirement Welfare Plans | Postretirement Medicare Subsidy | ||||||||||
2007 | $ | 109 | $ | 15 | $ | 28 | $ | (4 | ) | ||||
2008 | 112 | 15 | 29 | (4 | ) | ||||||||
2009 | 116 | 15 | 30 | (5 | ) | ||||||||
2010 | 122 | 15 | 32 | (6 | ) | ||||||||
2011 | 129 | 16 | 34 | (6 | ) | ||||||||
2012-2016 | 840 | 72 | 208 | (43 | ) | ||||||||
50
(12) FAIR VALUE OF FINANCIAL INSTRUMENTS
Statement of Financial Accounting Standards No. 107,“Disclosures about Fair Value of Financial Instruments” (“FAS 107”) requires disclosure of fair value information about financial instruments, as defined therein, for which it is practicable to estimate such fair value. FAS 107 excludes certain financial instruments, including those related to certain insurance contracts. In the measurement of the fair value of certain financial instruments, quoted market prices were not available and other valuation techniques were utilized. These derived fair value estimates are significantly affected by the assumptions used. The following methods and assumptions were used to estimate the fair value of the financial instruments presented:
Fixed maturities: Fair values for fixed maturities were generally based on quoted market prices. For certain fixed-maturity securities for which quoted market prices were not available, fair values were estimated using values obtained from independent pricing services, or in the case of private placements, were determined by discounting expected future cash flows using a current market rate applicable to the yield, credit quality, and maturity of the securities.
Equity and trading securities: Fair values for equity and trading securities were based upon quoted market prices.
Other investments: Fair values represent the Company’s equity in the partnerships’ net assets as determined by the respective general partners and equity investments in privately held businesses where fair value approximates cost where market value data is unavailable for the underlying investment.
Mortgage loans:The fair values of commercial mortgage loans were estimated using option adjusted valuation discount rates.
Cash, cash equivalents, and short-term investments: The carrying amounts reported in the consolidated balance sheets for these instruments approximate fair values.
Individual and group annuities:Fair values for deferred annuity contracts are equal to current net surrender value. Fair values of liabilities under investment-type insurance contracts, including individual and group annuities, are estimated using discounted cash flow calculations at pricing rates at December 31, 2006, and 2005.
Debt outstanding: Fair values of commercial paper and short-term borrowings approximate carrying value. Fair values of long-term debt were based on either quoted market prices or estimated using discounted cash flow analyses based on the Company’s incremental borrowing rate at December 31, 2006, and 2005.
The fair values and carrying values of the Company’s financial instruments at December 31, 2006, and 2005, are as follows:
| 2006 | 2005 | |||||||||||
| Carrying Value | Fair Value | Carrying Value | Fair Value | |||||||||
Fixed maturity securities | $ | 41,102 | $ | 41,102 | $ | 37,391 | $ | 37,391 | ||||
Equity securities | 2,619 | 2,619 | 1,812 | 1,812 | ||||||||
Trading securities | 22 | 22 | 20 | 20 | ||||||||
Other investments | 1,646 | 1,646 | 1,220 | 1,220 | ||||||||
Short-term investments | 1,550 | 1,550 | 1,430 | 1,430 | ||||||||
Mortgage loans | 322 | 313 | — | — | ||||||||
Cash and cash equivalents | 3,512 | 3,512 | 3,155 | 3,155 | ||||||||
Individual and group annuities | 938 | 999 | 927 | 1,049 | ||||||||
Debt | 3,346 | 3,554 | 2,700 | 2,863 | ||||||||
(13) COMMITMENTS AND CONTINGENT LIABILITIES
Various lawsuits against the Company have arisen in the normal course of business. Contingent liabilities arising from litigation, income taxes, and other matters are not considered material in relation to the financial position of the Company.
The Company has been in various insurance coverage disputes with Armstrong World Industries (“Armstrong”) for over twenty years relating to asbestos liabilities and insurance covering the period of 1973 to 1981. In July 2004, the Company prevailed in a favorable arbitration ruling before an appellate panel regarding Armstrong’s available insurance coverage. Armstrong filed a Chapter 11 Bankruptcy petition in the United States Bankruptcy Court for the District of Delaware in December 2000. A plan of reorganization was confirmed in August 2006, and Armstrong formally emerged from bankruptcy as of October 2, 2006. A declaratory judgment action, filed against the Company by Armstrong in 2002, is pending in the United States District Court for the Eastern District of Pennsylvania seeking coverage for asbestos claims under insurance policies issued to Armstrong during the period of 1973 to 1981, including, but not limited to, damages and a declaration regarding the availability, applicability, and scope of alleged non-product coverage not subject to the aggregate limits of the policies. Armstrong contends that a significant portion of its asbestos liability arises from operations that would entitle Armstrong to insurance coverage under the disputed policies without regard to the aggregate limit of liability. The Pennsylvania action is currently in the initial pleading stages and is inactive by agreement of the parties. Armstrong also filed, in the same Pennsylvania District Court, a motion to vacate the 2004 appellate arbitration award that was favorable to the Company. The Company has filed a cross-motion seeking to confirm the award. Both motions remain pending at this time. The Company intends to vigorously defend its position in all coverage litigation that may follow the bankruptcy proceedings, including any argument that coverage issues were finally determined in the bankruptcy
51
| Notes to Consolidated Financial Statements | LIBERTY MUTUAL HOLDING COMPANY INC. | |
| [CONTINUED] |
proceedings. Management believes that the ultimate liability, if any, to Armstrong will not be resolved for at least one year and very likely may not be known for several years. In the opinion of management, the outcome of these pending matters is difficult to predict and an adverse outcome could have a material adverse effect on the Company’s business, financial condition, and results of operations.
The Company leases certain office facilities and equipment under operating leases expiring in various years through 2016. Rental expense amounted to $185, $175, and $167, for the years ended December 31, 2006, 2005, and 2004, respectively. In addition, the Company is party to two land leases expiring in 2025 and 2101. The Company also owns certain office facilities and receives rental income from tenants under operating leases expiring in various years through 2022. Rental income amounted to $36, $3, and $3 for the years ended December 31, 2006, 2005, and 2004, respectively.
Future minimum rental payments and receipts under non-cancelable leases with terms in excess of one year are estimated as follows:
| Operating Leases | Land Leases | Rental Income | Net Lease Obligations | ||||||||||
2007 | $ | 140 | $ | 1 | $ | 28 | $ | 113 | |||||
2008 | 131 | 1 | 27 | 105 | |||||||||
2009 | 104 | 1 | 27 | 78 | |||||||||
2010 | 81 | 1 | 27 | 55 | |||||||||
2011 | 46 | 1 | 16 | 31 | |||||||||
2012 - 2031 | 59 | 20 | 82 | (3 | ) | ||||||||
2032 - 2051 | — | 16 | — | 16 | |||||||||
2052 - 2101 | — | 78 | — | 78 | |||||||||
Total | $ | 561 | $ | 119 | $ | 207 | $ | 473 | |||||
The Company entered into arrangements to sell and leaseback certain equipment through 2010. The transactions are accounted for as operating leases. Rental expense amounted to $13, $12, and $12 for the years ended December 31, 2006, 2005, and 2004. Future minimum rental payments under these leases are estimated as follows:
2007 | $ | 13 | |
2008 | 13 | ||
2009 | 13 | ||
2010 | 10 | ||
Total | $ | 49 | |
It is expected that as leases expire they will be replaced.
At December 31, 2006, the Company had unfunded capital commitments to private equity, commercial mortgages, and energy investments of $1,673.
At December 31, 2006, the Company had commitments to purchase various mortgage-backed securities settling in 2007, at a cost of $60 with a fair value of $60, which are included as fixed maturities in the consolidated balance sheets.
At December 31, 2006, and 2005, the Company had $579 and $595, respectively, in assigned structured settlement annuities in connection with the Prudential transaction. The asset and annuity liability of the same amount are correspondingly classified as other assets and other liabilities in the consolidated balance sheets.
At December 31, 2006, the Company had $1,013 of undrawn letters of credit outstanding secured by assets of $891.
Liabilities for guaranty fund and other insurance-related assessments are accrued when an assessment is probable, when it can be reasonably estimated, and when the event obligating the entity to pay an imposed or probable assessment has occurred (based on past premiums for life lines and future premiums for property and casualty lines). Liabilities for guaranty funds and other insurance-related assessments are not discounted and are included as part of other liabilities in the consolidated balance sheets. As of December 31, 2006, and 2005, the liability balance was $212 and $175, respectively. As of December 31, 2006, and 2005, included in other assets were $12 and $15, respectively, of related assets for premium tax offsets or policy surcharges. The related asset is limited to the amount that is determined based on future premium collections or policy surcharges from policies in force. Current assessments are expected to be paid out over the next five years, while premium tax offsets are expected to be realized within one year.
The Company has reinsurance funds held balances of approximately $1,631, which are subject to ratings triggers whereby if any of the Company’s insurance financial strength ratings (with the three major rating agencies) fall below the A- or A3 categories, the funds may be required to be placed in trust and invested in assets acceptable to the Company. The Company has no additional material ratings triggers.
(14) POLICYHOLDERS’ EQUITY
Statutory Surplus
The Statutory surplus of the Company’s domestic insurance companies was $12,131 and $9,869 at December 31, 2006, and 2005, respectively. The Company’s domestic insurance subsidiaries prepare the statutory basis financial statements in accordance with the National Association of Insurance Commissioners’ Accounting Practices and Procedures Manual (“NAIC APP”), subject to any deviations prescribed or permitted by the insurance commissioners of the various insurance
52
companies’ states of domicile. The Company does not have any material permitted practices that deviate from the NAIC APP.
Dividends
The insurance subsidiaries’ ability to pay dividends is restricted under applicable insurance law and regulations. Under the insurance laws of the domiciliary states of the insurance subsidiaries, an insurer may make an ordinary dividend payment if its surplus as regards to policyholders, following such dividend, is reasonable in relation to its outstanding liabilities and adequate to its financial needs. However, no insurer may pay an extraordinary dividend without the approval or non-disapproval of the domiciliary insurance regulatory authority. Under the insurance laws of Massachusetts, the domiciliary state of Liberty Mutual Insurance Company (“LMIC”), an extraordinary dividend is defined as a dividend whose fair market value, together with other dividends made within the preceding 12 months, exceeds the greater of 10% of the insurer’s surplus as regards policyholders as of the preceding December 31, or the insurer’s net income for the 12-month period ending on the preceding December 31. Under the insurance laws of Wisconsin, the domiciliary state of Liberty Mutual Fire Insurance Company (“LMFIC”) and EICOW, an extraordinary dividend is defined as a dividend whose fair market value, together with other dividends paid within the preceding 12 months, exceeds the lesser of (a) 10% of the insurer’s surplus as regards policyholders as of the preceding December 31, or (b) the greater of (1) the insurer’s net income for the preceding calendar year, minus realized capital gains for that calendar year, or (2) the aggregate of the insurer’s net income for the three preceding calendar years minus realized capital gains for those calendar years and minus dividends paid within the first two of the preceding three calendar years. Changes in the extraordinary dividend regulation of the domiciliary states of LMIC, LMFIC, and EICOW could negatively affect LMGI’s ability to pay principal and interest on the Notes, as could a redomestication, merger, or consolidation of LMIC, LMFIC, or EICOW to a different domiciliary state. Additionally, in connection with the Company’s reorganization in 2001 into a mutual holding company structure, the Company entered into a Keep Well Agreement with the Massachusetts Commissioner of Insurance, LMFIC, and certain other affiliates which effectively limit LMFIC from paying any dividends to the Company when the “total adjusted capital” of LMFIC is below 300% of the “authorized control level,” as such terms are defined in the Massachusetts risk-based capital regulations as of September 13, 2001. The Keep Well Agreement will terminate automatically upon the earlier of (i) the date that is five years from the effective date of the reorganization (March 19, 2007), or (ii) the date upon which the Company, LMFIC, or LMHC Massachusetts Holdings, Inc., becomes subject to the public reporting requirements of the Securities and Exchange Commission. The maximum dividend payout in 2007 that may be made prior to regulatory approval is $1,197.
53
Report of Independent Auditors
The Board of Directors
Liberty Mutual Holding Company Inc.
We have audited the accompanying consolidated balance sheets of Liberty Mutual Holding Company Inc. (the Company) as of December 31, 2006 and 2005, and the related consolidated statements of income, changes in policyholders’ equity, and cash flows for each of the three years in the period ended December 31, 2006. These financial statements are the responsibility of the Company’s management. Our responsibility is to express an opinion on these financial statements based on our audits.
We conducted our audits in accordance with the auditing standards of the Public Company Accounting Oversight Board (United States). Those standards require that we plan and perform the audit to obtain reasonable assurance about whether the financial statements are free of material misstatement. An audit includes examining, on a test basis, evidence supporting the amounts and disclosures in the financial statements. An audit also includes assessing the accounting principles used and significant estimates made by management, as well as evaluating the overall financial statement presentation. We believe that our audits provide a reasonable basis for our opinion.
In our opinion, the financial statements referred to above present fairly, in all material respects, the consolidated financial position of Liberty Mutual Holding Company Inc. at December 31, 2006 and 2005, and the consolidated results of its operations and its cash flows for each of the three years in the period ended December 31, 2006, in conformity with U.S. generally accepted accounting principles.
We also have audited, in accordance with the auditing standards of the Public Company Accounting Oversight Board (United States), the effectiveness of Liberty Mutual Holding Company Inc.’s internal control over financial reporting as of December 31, 2006, based on criteria established in Internal Control – Integrated Framework issued by the Committee of Sponsoring Organizations of the Treadway Commission and our report dated February 23, 2007 expressed an unqualified opinion thereon.
As discussed in Note 1 to the consolidated financial statements, in 2005, the Company adopted FASB Interpretation No. 46(R),Consolidation of Variable Interest Entities, an Interpretation of Accounting Research Bulletin No. 51.

Boston, Massachusetts
February 23, 2007
54
Management’s Report on Internal Control
Over Financial Reporting
The Board of Directors
Liberty Mutual Holding Company Inc.
Our management is responsible for establishing and maintaining adequate internal control over Liberty Mutual Holding Company Inc.’s financial reporting. Our internal control system was designed to provide reasonable assurance to our management and board of directors regarding the preparation and fair presentation of published financial statements. We assessed the effectiveness of Liberty Mutual Holding Company Inc.’s internal control over financial reporting as of December 31, 2006. In making this assessment, we used the criteria set forth by the Committee of Sponsoring Organizations of the Treadway Commission (COSO) in Internal Control — Integrated Framework.
Based on our assessment using those criteria, we conclude that Liberty Mutual Holding Company Inc.’s internal control over financial reporting is effective as of December 31, 2006 in providing reasonable assurance regarding the reliability of financial reporting and the preparation of financial statements in accordance with GAAP. Ernst & Young LLP, our independent auditors, have issued an audit report on our assessment of the Company’s internal control over financial reporting.

Edmund F. Kelly Chairman, President and Chief Executive Officer

Dennis J. Langwell Senior Vice President and Chief Financial Officer
55
Independent Auditors’ Opinion on Management’s Assessment and the
Effectiveness of Internal Control Over Financial Reporting
The Board of Directors
Liberty Mutual Holding Company Inc.
We have audited management’s assessment, included in the accompanying Management’s Report on Internal Control Over Financial Reporting, that Liberty Mutual Holding Company Inc. (the Company) maintained effective internal control over financial reporting as of December 31, 2006 based on criteria established in Internal Control – Integrated Framework issued by the Committee of Sponsoring Organizations of the Treadway Commission (the COSO criteria). The Company’s management is responsible for maintaining effective internal control over financial reporting and for its assessment of the effectiveness of internal control over financial reporting. Our responsibility is to express an opinion on management’s assessment and an opinion on the effectiveness of the Company’s internal control over financial reporting based on our audit.
We conducted our audit in accordance with the auditing standards of the Public Company Accounting Oversight Board (United States). Those standards require that we plan and perform the audit to obtain reasonable assurance about whether effective internal control over financial reporting was maintained in all material respects. Our audit included obtaining an understanding of internal control over financial reporting, evaluating management’s assessment, testing and evaluating the design and operating effectiveness of internal control, and performing such other procedures as we considered necessary in the circumstances. We believe that our audit provides a reasonable basis for our opinion.
A company’s internal control over financial reporting is a process designed to provide reasonable assurance regarding the reliability of financial reporting and the preparation of financial statements for external purposes in accordance with generally accepted accounting principles. A company’s internal control over financial reporting includes those policies and procedures that (1) pertain to the maintenance of records that, in reasonable detail, accurately and fairly reflect the transactions and dispositions of the assets of the company; (2) provide reasonable assurance that transactions are recorded as necessary to permit preparation of financial statements in accordance with generally accepted accounting principles, and that receipts and expenditures of the company are being made only in accordance with authorizations of management and directors of the company; and (3) provide reasonable assurance regarding prevention or timely detection of unauthorized acquisitions, use, or disposition of the company’s assets that could have a material effect on the financial statements.
Because of its inherent limitations, internal control over financial reporting may not prevent or detect misstatements. Also, projections of any evaluation of effectiveness to future periods are subject to the risk that controls may become inadequate because of changes in conditions, or that the degree of compliance with the policies or procedures may deteriorate.
In our opinion, management’s assessment that Liberty Mutual Holding Company Inc. maintained effective internal control over financial reporting as of December 31, 2006, is fairly stated, in all material respects, based on the COSO criteria. Also in our opinion, Liberty Mutual Holding Company Inc. maintained, in all material respects, effective internal control over financial reporting as of December 31, 2006, based on the COSO criteria.
We also have audited, in accordance with the auditing standards of the Public Company Accounting Oversight Board (United States), the consolidated balance sheets of Liberty Mutual Holding Company Inc. at December 31, 2006 and 2005, and the related consolidated statements of income, changes in policyholders’ equity, and cash flows for each of the three years in the period ended December 31, 2006, and our report dated February 23, 2007 expressed an unqualified opinion thereon.

Boston, Massachusetts
February 23, 2007
56
LIBERTY MUTUAL HOLDING COMPANY INC.
Board of Directors
MICHAEL J. BABCOCK
Private Investor
New York, New York
GARY C. BUTLER
President and Chief Executive Officer
Automatic Data Processing, Inc.
Roseland, New Jersey
CHARLES I. CLOUGH, JR.
Chairman and Chief Executive Officer
Clough Capital Partners, LP
Boston, Massachusetts
GARY L. COUNTRYMAN
Chairman Emeritus
Liberty Mutual Insurance Company
Liberty Mutual Fire Insurance Company
Boston, Massachusetts
PAUL J. DARLING, II
President and Chief Executive Officer
Corey Steel Company
Cicero, Illinois
FRANCIS A. DOYLE, III
President and Chief Executive Officer
Connell Limited Partnership
Boston, Massachusetts
JOHN P. HAMILL
Chairman
Sovereign Bank New England
Boston, Massachusetts
MARIAN L. HEARD
President and Chief Executive Officer
Oxen Hill Partners
Boston, Massachusetts
EDMUND F. KELLY
Chairman, President and
Chief Executive Officer
Liberty Mutual Holding Company Inc.
Boston, Massachusetts
JOHN P. MANNING
President and Chief Executive Officer
Boston Capital Corporaton
Boston, Massachusetts
THOMAS J. MAY
Chairman, President and
Chief Executive Officer
NSTAR
Boston, Massachusetts
STEPHEN F. PAGE
Retired Vice Chairman and
Chief Financial Officer
United Technologies Corporation
Hartford, Connecticut
DR. KENNETH L. ROSE
Retired Vice Chairman and
Co-Chief Executive Officer
Henkels & McCoy, Inc.
Blue Bell, Pennsylvania
ELLEN A. RUDNICK
Executive Director and Clinical Professor,
Polsky Center for Entrepreneurship
University of Chicago Graduate
School of Business
Chicago, Illinois
GLENN P. STREHLE
Treasurer Emeritus
Massachusetts Institute of Technology
Cambridge, Massachusetts
WILLIAM C. VAN FAASEN
Chairman
Blue Cross and Blue Shield of
Massachusetts, Inc.
Boston, Massachusetts
Corporate Officers
EDMUND F. KELLY
Chairman, President and
Chief Executive Officer
J. PAUL CONDRIN III
Executive Vice President
A. ALEXANDER FONTANES
Executive Vice President and
Chief Investment Officer
GARY R. GREGG
Executive Vice President
DAVID H. LONG
Executive Vice President
THOMAS C. RAMEY
Executive Vice President
DENNIS J. LANGWELL
Senior Vice President and
Chief Financial Officer
CHRISTOPHER C. MANSFIELD
Senior Vice President and
General Counsel
STUART M. McGUIGAN
Senior Vice President and
Chief Information Officer
ROBERT T. MULESKI
Senior Vice President and
Corporate Actuary
HELEN E.R. SAYLES
Senior Vice President
STEPHEN G. SULLIVAN
Senior Vice President
JOHN D. DOYLE
Vice President and Comptroller
DEXTER R. LEGG
Vice President and Secretary
LAURANCE H.S. YAHIA
Vice President and Treasurer
57
LIBERTY MUTUAL GROUP
Operating Management
PERSONAL MARKETS
J. Paul Condrin III
President
Gary DeGruttola
Senior Vice President and
Manager, Operations
Edward J. Gramer III
Senior Vice President and
Manager, Claims
Alan R. Ledbetter
Senior Vice President and
Chief Underwriting Officer
Himanshu I. Patel
Senior Vice President and
Manager, Regional Operations
Timothy M. Sweeney
Senior Vice President and
Manager, Sales and Marketing
Senior Vice Presidents and
Regional General Managers
Meryl S. Golden
Thomas M. Jones
Louis F. Knecht
James M. MacPhee
Stephen J. McAnena
Michael J. Reid
Marie A. Ward
Individual Life Market
Stephen M. Batza
Chief Operating Officer
COMMERCIAL MARKETS
David H. Long
President
Business Market
Deborah L. Michel
Chief Operating Officer
Thomas R. Rudder
Executive Vice President
and General Manager, Field
Operations
Senior Vice Presidents and
Division Managers
Robert J. Brautigam
Keith O. Burks
David R. Dwortz
John J. McNulty
Mark J. Moitoso
David Radakovich
Mark C. Touhey
E. Janney Wilson
National Market
Douglas M. Nelson
Chief Operating Officer
Mark A. Butler
Executive Vice President
and General Manager, Field
Operations
Donald J. Pickens
Executive Vice President and
Chief Underwriting Officer
Liberty Mutual Property
Timothy J. Rose
President
Group Market
Jean M. Scarrow
Chief Operating Officer
Liberty Mutual Reinsurance
J. Eric Brosius
Senior Vice President and
Manager
INTERNATIONAL
Thomas C. Ramey
President
Joe H. Hamilton
Chief Operating Officer
Europe
Victor A. Meintjes
Chief Operating Officer
Latin America
Luciano Suzuki
Chief Operating Officer
Asia Pacific
Mustafa Akan
Chief Executive Officer
Seker Sigorta
Turkey
Susana Augustin
President
Liberty ART SA and
Liberty Seguros
Argentina
Pablo Barahona
President
Liberty Seguros
Chile
Luis Bonell
President
Liberty Seguros
Spain
A.K. Cher
Managing Director
Liberty Citystate Insurance
PTE, Ltd.
Singapore
John Fu
President
LMG Insurance
Thailand
Mauricio Garcia
President
Liberty Seguros SA
Colombia
Nick Helms
Chief Executive Officer
Liberty International
Insurance, Ltd.
Hong Kong
Michal Kwiecinski
President
Liberty Poland
Luis Maurette
President
Liberty Paulista Seguros
Brazil
Thomas O’Dore
Chief Representative
Vietnam
Roberto Salas
President
Seguros Caracas de
Liberty Mutual
Venezuela
Jose Antonio de Sousa
President
Liberty Seguros
Portugal
Eric Stephanus
Chief Representative
Liberty Mutual Insurance
Company
China
Jackson Tang
Managing Director
Liberty Mutual Insurance
Company
China
58
LIBERTY MUTUAL GROUP
Operating Management
Liberty International
Underwriters
Daniel T.N. Forsythe
Chief Executive Officer
Gordon J. McBurney
President and Chief
Underwriting Officer
Michael J. Abdallah
Regional President
Asia Pacific
Brian Fitzgerald
Chief Executive Officer
Liberty Syndicate
Management
Mike Molony
Regional President
Canada
Sean Rocks
Regional President
Europe
LIBERTY MUTUAL AGENCY
MARKETS
Gary R. Gregg
President
Joseph A. Gilles
Executive Vice President and
Manager
Operations
Scott R. Goodby
Executive Vice President and
Chief Operating Officer
Regional Companies
Mark E. Fiebrink
President and
Chief Operating Officer
Employers Insurance of
Wausau
Susan M. Tuthill
Senior Vice President and
Manager
Claims
Regional Company
Presidents
Dwight W. Bowie
Peerless Insurance
Philip J. Broughton
America First Insurance
Michael D. Connell
Indiana Insurance
Donald E. Frette
Colorado Casualty
Frank J. Kotarba
Golden Eagle Insurance
David L. Lancaster
Hawkeye-Security Insurance
Matthew D. Nickerson
Liberty Northwest
Michael J. Plavnicky
Montgomery Insurance
Specialty Company
Presidents
Ricky T. Hodges
Summit
Dennis S. Perler
Liberty Mutual Surety
59
LIBERTY MUTUAL INSURANCE COMPANY
Advisory Boards
CALIFORNIA (NORTHERN)
Michael J. Bodell
President and
Chief Executive Officer
Bodell Construction Company
Salt Lake City, Utah
Robert C. Cookson
President and
Chief Executive Officer
The Cookson Company, Inc.
Phoenix, Ariz.
Ronald M. Fedrick
President, Owner and
Chief Executive Officer
Nova Group, Inc.
Napa, Calif.
Jonathan R. Long
Chairman and
Chief Executive Officer
J.E. Higgins Lumber
Company
Livermore, Calif.
Herman G. Rowland, Sr.
Chairman of the Board
Jelly Belly Candy
Company, Inc.
Fairfield, Calif.
CALIFORNIA (SOUTHERN)
Harold C. Bennett
President
Utility Trailer Manufacturing
Company
City of Industry, Calif.
Robert Roullier
Chief Executive Officer
Davis Transport, Inc.
Missoula, Mont.
Anthony P. Souza
La Mirada, Calif.
Andrew G. Stein
Chief Executive Officer
TST, Inc.
Fontana, Calif.
Frank S. Wyle
Founder and
Chairman – Retired
Wyle Electronics
Marina del Rey, Calif.
DELAWARE
John S. Bonk
President
M. Davis & Sons, Inc.
Wilmington, Del.
Robert D. Burris
President
Burris Logistics
Milford, Del.
Ron Stewart
President
Star Building Services
New Castle, Del.
FLORIDA
Richard W. Ebsary
President
Ebsary Foundation
Company, Inc.
Miami, Fla.
H. Britt Landrum, Jr.
President
Landrum Companies
Pensacola, Fla.
Robert A. Lopez
President
General Asphalt
Company, Inc.
Miami, Fla.
Eugene McNichols
President
McNichols Company
Tampa, Fla.
Martin E. Murphy
President and
Chief Executive Officer
Murphy Construction
Company, Inc.
West Palm Beach, Fla.
George Pantuso
President and Owner
Circle H Citrus Company
Ft. Pierce, Fla.
Kenneth N. Schulz
President
Polk Nursery Company, Inc.
Auburndale, Fla.
Charles W. Stiefel
Chairman of the Board,
Chief Executive Officer and
President
Stiefel Laboratories, Inc.
Coral Gables, Fla.
Kenneth N. Trask
President and
Chief Executive Officer
Conshor, Inc.
Bonita Springs, Fla.
GEORGIA
Frank A. DeAngelo
President and
Chief Executive Officer
AppleJam, Inc.
Duluth, Ga.
Edgar Cameron Hickman
President
Hickman Transport Co.
Valdosta, Ga.
Fred R. Keith
President
Atlanta Bonded Warehouse
Corporation
Kennesaw, Ga.
Harry P. Moats
President
L.M. Scofield Company
Douglasville, Ga.
Benjamin J. Morgan
President and
Chief Executive Officer
Ruby-Collins, Inc.
Smyrna, Ga.
Howell W. Newton
President
Trio Manufacturing Company
Forsyth, Ga.
Robert P. Shapard, III
President – Retired
American Knitting Mills
Griffin, Ga.
INDIANA
Robert R. Baylor
President
Baylor Trucking, Inc.
Milan, Ind.
Mike Mount
President
Real World Testing, LLC
Columbus, Ind.
Dean W. Pfister
Chief Financial Officer –
Retired
Franklin Electric Company
Ft. Wayne, Ind.
Michael E. Thomas
Chairman, President and
Chief Executive Officer –
Retired
Chromcraft Revington, Inc.
Delphi, Ind.
Terry L. Tucker
Chairman of the Board
Maple Leaf Farms, Inc.
Milford, Ind.
KENTUCKY
Robert W. Byrd
Chairman of the Board of
Directors – Retired
The Keller Manufacturing
Company, Inc.
Prospect, Ky.
William H. Harrison, Jr.
President
Number Fourteen
Corporation
Louisville, Ky.
60
David Merrick
President
Merrick Industries, Inc.
Louisville, Ky.
MARYLAND
Wayne Gaumer
President
Lightning Transportation
Company
Hagerstown, Md.
Joseph A. Hunt
President
Westat, Inc.
Rockville, Md.
T. Kenneth Joy
President
B. Frank Joy, LLC
Hyattsville, Md.
Richard McGee
President
Abacus Corporation
Baltimore, Md.
Carl A. Ressa
President
A. S. Johnson Company, Inc.
Forestville, Md.
MASSACHUSETTS
Ara Aykanian
Former Chairman and
Chief Executive Officer
Boston Digital Corporation
Framingham, Mass.
Wayne J. Griffin
President
Wayne J. Griffin Electric, Inc.
Holliston, Mass.
Charles B. Housen
Chairman of the Board
Erving Industries, Inc.
Erving, Mass.
Robert M. Kennedy
Executive Director
Mechanics Hall
Worcester, Mass.
Edward O. Owens
President
Henry F. Owens, Inc.
Everett, Mass.
Peter B. Ramsden
President
M.F. Foley Company, Inc.
New Bedford, Mass.
Sidney D. Wolk
Chairman and
Chief Executive Officer
Cross Country Group
Medford, Mass.
James Zampell
President
Zampell Companies
Newburyport, Mass.
MICHIGAN
Jeffrey A. Coolsaet
President
R. L. Coolsaet Construction
Company
Taylor, Mich.
Fred H. May
President
Saginaw Control &
Engineering, Inc.
Saginaw, Mich.
David M. Moxlow
President
Trenton Forging Company, Inc.
Trenton, Mich.
Jeffrey S. Padnos
President
Louis Padnos Iron & Metal
Company
Holland, Mich.
Joseph Schneider
President
Madison Electric Company
Warren, Mich.
MIDDLE WEST
William J. Darley
Chief Executive Officer and
Chairman of the Board
William S. Darley & Company
Melrose Park, III.
Paul J. Darling II
President and
Chief Executive Officer
Corey Steel Company
Chicago, III.
Alfred F. Krumholz, Jr.
President
Chicago Boiler Company
Gurnee, III.
MINNESOTA
John S. Elder
President
Elder Jones, Inc.
Bloomington, Minn.
Ralph E. Gross
President
SPS Companies, Inc.
Minneapolis, Minn.
John Roswick
President
Midwest Motor Express, Inc.
Bismarck, N.D.
Gary B. Sauer
President
Tiller Corporation
Maple Grove, Minn.
James Shapiro
President
Lessors, Inc.
Eagan, Minn.
MISSOURI
Ronald L. Brink
President
R.L. Brink Corporation
Quincy, III.
Joseph Burstein
Chairman of the Board
Leonard’s Metal, Inc.
Creve Coeur, Mo.
Todd J. Korte
President
Korte Construction Company
Highland, III.
Thom Kuhn
Executive Vice President and
Chief Administrative Officer
Millstone Bangert, Inc.
St. Charles, Mo.
Robert Millwee
President and
Chief Executive Officer
Garney Construction
Kansas City, Mo.
Katherine Platten
Partner
Solomon Corporation
Solomon, Kan.
Zsolt Rumy
Chairman, Chief Executive
Officer and President
Zoltek Companies, Inc.
St. Louis, Mo.
Michael C. Welch
President
BRB Contractors, Inc.
Topeka, Kan.
NEW JERSEY
Candida C. Aversenti
President and
Chief Operating Officer
General Magnaplate
Corporation
Linden, N.J.
Edward C. Hoeflich
Moorestown, N.J.
Richard W. Kanter
President
Miller Construction Company
Jersey City, N.J.
Steven Nislick
Chief Executive Officer
Edison Properties, LLC
Newark, N.J.
Theodore J. Reiss
President
Reiss Corporation
Englishtown, N.J.
Thomas Rogers
President
Rogers Transfer, Inc./John E.
Rogers, Inc.
Great Meadows, N.J.
NEW YORK
Robert W. Bannon
President
Roadway Contracting, Inc.
Brooklyn, N.Y.
Robert C. Goldsmith
Associate Executive Director
and Chief Operating Officer
Association for the Help of
Retarded Children
New York, N.Y.
Richard G. Kirschner
Chief Operating Officer
Jetro Cash & Carry
College Point, N.Y.
61
LIBERTY MUTUAL INSURANCE COMPANY
Advisory Boards
William G. Murphy
Vice President
Halmar Contracting, Inc.
Newburgh, N.Y.
Todd Nugent
President
T.F. Nugent
New York, N.Y.
Howard E. Wallack
President and
Chief Executive Officer
Jonrob Leasing Corporation
Park City, Utah
Ronald A. Yakin
President
American Pecco Corporation
Millwood, N.Y.
NEW YORK STATE
Paul J. DeCarolis
President
DeCarolis Truck Rental, Inc.
Rochester, N.Y.
Michael Dranichak
Chairman
LB Furniture Industries, LLC
Hudson, N.Y.
Frederic J. Durkin
Chairman of the Board
Transportation
Consultants, Inc.
Syracuse, N.Y.
Marianne W. Gaige
President and
Chief Operating Officer
Cathedral Corporation
Rome, N.Y.
Kirk B. Hinman
President
Rome Strip Steel Co., Inc.
Rome, N.Y.
Craig Painter
President and
Chief Executive Officer
Kinney Drugs, Inc.
Gouverneur, N.Y.
NORTH CAROLINA
Jerome W. Bolick
President
Southern Furniture Company
of Conover, Inc.
Conover, N.C.
J.M. Carstarphen, III
President,
Chief Executive Officer and
Chairman of the Board
Pharr Yarns
McAdenville, N.C.
Otis A. Crowder
President and
Chief Executive Officer
Crowder Construction
Company
Charlotte, N.C.
Ron E. Doggett
Former Chairman and
Chief Executive Officer
GoodMark Foods, Inc.
Raleigh, N.C.
Parks C. Underdown, Jr.
Chairman,
Board of Directors – Retired
Hickory Springs
Manufacturing Company
Hickory, N.C.
NORTHERN NEW ENGLAND
Kevin C. Baack, Ph.D.
Executive Director and
Chief Executive Officer
Goodwill Industries of
Northern New England
Portland, Maine
Michael Dolan, Jr.
Sr. Sales Representative
Busy Bee Janitorial Service
Somersworth, N.H.
Alvin D. Felgar
Chief Executive Officer
Frisbee Memorial Hospital
Rochester, N.H.
Douglas Goldsmith
President and
Chief Operating Officer
Rock of Ages Quarries
Barre, Vt.
Robert L. Gustafson
President
Thompson Center Arms
Rochester, N.H.
William R. Lochhead
President and
General Manager – Retired
Lochhead Realty
Company, Inc.
Amherst, N.H.
William D. Purington
President
Maine Drilling and
Blasting, Inc.
Gardiner, Maine
Dr. Thomas H. Reynolds
President – Retired
University of New England
The Villages, Fla.
Alvan A. Traffie
President
Hutter Construction
Corporation
New Ipswich, N.H.
OHIO
Robert E. Alspaugh
President
SCT Corporation
Alden, Mich.
Bruce C. Gilbert
Chairman
The Great Lakes
Construction Company
Key Largo, Fla.
Jon E. Jenson
President Emeritus
Precision Metal Forming
Association
Independence, Ohio
Jefferson W. Keener, Jr.
Chairman and
Chief Executive Officer
The Chardon Rubber
Company
Chardon, Ohio
Lee R. Radcliffe
President
Jefferson Trucking Company
Loraine, Ohio
PENNSYLVANIA
Christine A. McNichol
President
Dennis Trucking Company, Inc.
Philadelphia, Pa.
Ray B. Mundt
Rosemont, Pa.
Robert W. Palaima
President
Delaware River
Stevedores, Inc.
Philadelphia, Pa.
John W. Rex
President
Rex Heat Treat
Lansdale, Pa.
Henry L. Rosenberger
President
Rosenberger Companies, LTD
Blooming Glen, Pa.
62
Jay S. Weitzman
President
Park America, Inc.
Ardmore, Pa.
PITTSBURGH
Richard L. Carrara
President
Amthor Steel
Erie, Pa.
Charles J. Hora Jr.
President – Retired
Lord Corporation
Cary, N.C.
Robert A. Paul
President and
Chief Executive Officer
Ampco-Pittsburgh
Corporation
Pittsburgh, Pa.
Steven B. Stein
Pittsburgh, Pa.
Thomas Philip Stout
Chairman
Atlas Services Corporation
Washington, Pa.
ROCKY MOUNTAIN
Demetrios C. Daskalos
President
Atlas Resources, Inc.
Albuquerque, N.M.
Edward Routzon
President
Guy’s Floor Service, Inc.
Denver, Colo.
Dave True
Partner
True Oil Company/True
Companies
Casper, Wyo.
SOUTH CAROLINA
MacFarlane L. Cates, Jr.
President and Treasurer
Arkwright Mills
Spartanburg, S.C.
Robert H. Chapman
President
Inman Holding
Inman, S.C.
Peter E. Frohlich
President
Bommer Industries, Inc.
Landrum, S.C.
H. Morgan Haskell
Former President and
Treasurer
Brunswick Worsted Mills, Inc.
Hilton Head, S.C.
Richard H. Pennell
Executive Chairman
Metromont Corporation
Greenville, S.C.
Danny T. Phillips
President
J. Frank Blakely Company
Spartanburg, S.C.
SOUTHERN NEW ENGLAND
Joseph Arborio
President
Arborio Corporation
Cromwell, Conn.
Gordon M. Clark
Chief Executive Officer and
Treasurer
The W.I. Clark Company/
WICO Aviation, Inc.
Wallingford, Conn.
Edward M. Crowley
President
Dichello Distributors, Inc.
Orange, Conn.
Glen A. Harper
Chairman of the Board
The Waterbury Plating
Company
Milford, Conn.
Penfield Jarvis
President
Penco Corporation
Hartford, Conn.
Robert W. Parsons
President and
Chief Executive Officer
A. H. Harris & Sons, Inc.
Newington, Conn.
Daniel Sabia
President
BKM Enterprises, Inc.
East Hartford, Conn.
David T. Shopis
President and
Chief Executive Officer
The FIP Corporation
Cheshire, Conn.
SOUTHWEST (NORTHERN)
Timothy W. Byrne
President and
Chief Executive Officer
United States Lime &
Minerals, Inc.
Dallas, Texas
George R. Frymire
Chairman and President
Frymire Engineering Co., Inc.
Dallas, Texas
Robert D. Gillikin
President and
Chief Executive Officer
Cummins Southern
Plains, Ltd.
Arlington, Texas
Richard N. Gussoni
Chief Executive Officer
Culinaire International, Inc.
Dallas, Texas
J.S.B. Jenkins
President and
Chief Executive Officer
Tandy Brands
Accessories, Inc.
Arlington, Texas
Randall L. Kressler
President and
Chief Executive Officer
Lubrication Engineers, Inc.
Fort Worth, Texas
Charles E. Lawson
President and
Chief Executive Officer
Bright Truck Leasing, L.P.
Garland, Texas
Roger Mashore
President
Midwest Trophy
Manufacturing Company, Inc.
Del City, Okla.
A.H. McElroy II, P.E.
President and
Chief Executive Officer
McElroy Manufacturing, Inc.
Tulsa, Okla.
Dr. Vincent F. Orza, Jr.
Chairman Emeritus
Eateries, Inc.
Edmond, Okla.
Jerry D. Rohane P.E.
President
Western Builders of
Amarillo, Inc.
Amarillo, Texas
Michael T. Tonti
President
Tonti Properties
Dallas, Texas
SOUTHWEST (SOUTHERN)
Robert A. Beeley
Chairman of the Board
Dixie USA, Inc.
Tomball, Texas
Wallace Brasuell P.E.
President and
Chief Executive Officer
I.A. Naman + Associates, Inc.
Houston, Texas
David Dacus
President
Troy Construction, LLP
Houston, Texas
Terry W. Davis
Chairman and President
TD Rowe Amusements, Inc.
Houston, Texas
Max E. Foote
President
Max Foote Construction
Company, Inc.
Mandeville, La.
Jon G. Ford
President
Todd-Ford, Inc.
San Antonio, Texas
63
LIBERTY MUTUAL INSURANCE COMPANY
Advisory Boards
Dennis J. Hayden
President
Houston Tubulars, Inc.
Pearland, Texas
Jack M. Introligator
Vice President
Plant & Machinery, Inc.
Houston, Texas
Franklin J. Kneller, Jr.
President and
Chief Executive Officer
CL Support Services, LLC
Houston, Texas
Mark T. Scully
President
T.A.S. Commercial Concrete
Construction LP
Spring, Texas
Christopher T. Seaver
President and
Chief Executive Officer
Hydril Company
Houston, Texas
TENNESSEE
Gregory D. Brown
President
B.R. Williams Trucking
Oxford, Ala.
Stanley K. Dunbar
President and
Chief Executive Officer
Moody Dunbar, Inc.
Johnson City, Tenn.
Robert W. Klyce
President and
Chief Executive Officer
Car and Truck Rental, Inc.
Birmingham, Ala.
Paul A. Martin
Chairman of the Board and
Chief Executive Officer
DWC Construction
Company, Inc.
Nashville, Tenn.
Leroy McAbee, Sr.
Chief Executive Officer
McAbee Construction, Inc.
Tuscaloosa, Ala.
William L. Schaff
President
The Mapes Piano String
Company
Elizabethton, Tenn.
John E. Seward, Jr.
Chairman of the Board and
Chief Executive Officer
PLC, Inc.
Johnson City, Tenn.
VIRGINIA
Hubert Jackson Deaton, III P.E.
President
Schnabel Foundation
Sterling, Va.
J. Spencer Frantz, Sr.
Vice Chairman
Graham-White Mfg.
Company
Salem, Va.
Robert Hedrick
President and
Chief Executive Officer
Sprinkle Masonry, Inc.
Chesapeake, Va.
Lloyd U. Noland, III
Chairman and President
Noland Company
Newport News, Va.
Harry G. Norris
President
Howell’s Motor Freight, Inc.
Roanoke, Va.
Edward J. Reed
President
Givens, Inc. and Givens
Transportation
Chesapeake, Va.
Robert H. Spilman
Chairman of the Board –
Retired
Bassett Furniture
Industries, Inc.
Bassett, Va.
C. Kenneth Wright
Chairman of the Board
Basic Auto Sales, LP
Glen Allen, Va.
WISCONSIN
David W. Aragon, III
President
The SITE Group
Milwaukee, Wis.
Joseph A. Daniels
President
Joe Daniels Construction
Company
Madison, Wis.
Ronald Deabler
President
American Technical
Services, Inc.
Deabco/U.S. Tech Force, Inc.
Brookfield, Wis.
Franklyn Esenberg
Chairman of the Board
Interstate Forging
Industries, Inc.
Menomonee Falls, Wis.
Alan W. McBride
President and
Chief Executive Officer
Dawes Transport, Inc.
Milwaukee, Wis.
64
Liberty Mutual Holding Company Inc. holds its annual meeting on the second Wednesday of April at 10 a.m. at the headquarters in Boston.
Policyholders of Liberty Mutual Insurance Company (a stock insurance company), Liberty Mutual Fire Insurance Company (a stock insurance company) and Employers Insurance Company of Wausau (a stock insurance company) are members of Liberty Mutual Holding Company Inc. If you are a policyholder of any of these entities at the time of such meetings, you are entitled to vote, either in person or by proxy. You may obtain a proxy form by writing to the Secretary of Liberty Mutual Holding Company Inc. at 175 Berkeley Street, Boston, MA 02117.
 | LIBERTY MUTUAL GROUP
175 BERKELEY STREET | BOSTON, MA 02117
WWW.LIBERTYMUTUAL.COM |
Liberty Mutual Agency Markets
Markets and Products Guide
 | Liberty Mutual Agency Markets |
Liberty Mutual Agency Markets At a Glance
www.libertymutualagencymarkets.com
Liberty Mutual Agency Markets, a unique business unit of Liberty Mutual Group, consists of property and casualty, and specialty insurance carriers that distribute their products and services primarily through independent agents and brokers.
Core property and casualty products, including a comprehensive set of personal and commercial coverages, are available in most states from the following companies:
Regional Companies:
America First InsuranceTM (Gulf Region)
Colorado CasualtyTM (Mountain Region)
Golden Eagle InsuranceTM (Pacific Region)
Hawkeye-Security InsuranceTM (North Central Region)
Indiana InsuranceTM (Midwest Region)
Liberty NorthwestTM (Pacific Northwest Region)
Montgomery InsuranceTM(Southeast Region)
Peerless InsuranceTM (Northeast Region)
National Companies and Specialty Operations:
Wausau Insurance Companies(middle-market commercial products and services)
Liberty Mutual SuretyTM (contract and commercial surety)
Summit Holding Southeast, Inc.TM (mono-line workers’ compensation)
Liberty Mutual Group ranks 95 on the Fortune 500 list of the largest U.S. corporations based on 2006 revenues. The company has financial strength ratings of “Excellent” (A) from the A.M. Best Company, “Good” (A2) from Moody’s Investors Service, and “Strong” (A) from Standard & Poor’s.
 | Liberty Mutual Agency Markets |
Agency Markets: By the Numbers
| • | More than 6,900 employees |
| • | Top-three carrier with 70 percent of its appointed agencies (regional companies) |
| • | More than 6,600 appointed agencies and brokerages |
| • | 822,632 regional company personal lines policies and 498,974 commercial lines policies in force, with average premium of $900 and $5,937, respectively |
| • | 11,777 Wausau Insurance accounts in force, averaging $156,037 in size |
Product Mix: Percentage 2006 Net Written Premium
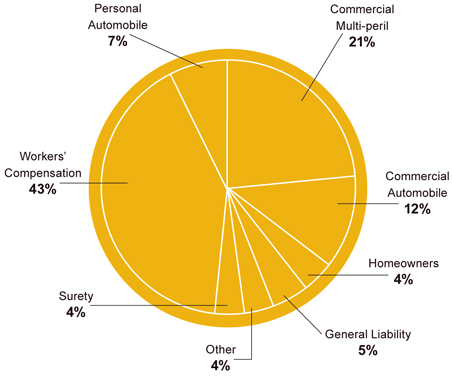
Financial Results
| 2006 | 2005 | 2004 | ||||||||||
Revenues | $ | 6.2 billion | $ | 5.8 billion | $ | 5.2 billion | ||||||
Pre-tax Operating Income | $ | 632 million | $ | 564 million | $ | 417 million | ||||||
Cash Flow from Operations | $ | 1.6 billion | $ | 1.4 billion | $ | 1.2 billion | ||||||
GAAP Combined Ratio | 97.8 | % | 98.3 | % | 100.6 | % | ||||||
Liberty Mutual Agency Markets Regional Companies
America First Insurance
3400 Waterview Parkway
Suite 200
Richardson, TX 75080
Phone: 972-231-7175
www.americafirst-ins.com
Colorado Casualty
10700 East Geddes Avenue
Suite 300
Englewood, CO 80112
Phone: 720-873-9200
www.coloradocasualty-ins.com
Golden Eagle Insurance
525 B Street
San Diego, CA 92101
Phone: 619-744-6000
www.goldeneagle-ins.com
Hawkeye-Security Insurance
1245 Jordan Creek Parkway
West Des Moines, IA 50266
Phone: 515-471-3600
www.hawkeyesecurity-ins.com
The Regional Companies of Liberty Mutual Agency Markets include the following companies that offer commercial and workers’ compensation products and services to small to middle-market customers, and personal lines products to individuals. These companies operate in the following core states. Products may vary by state:
Regional Companies’ Headquarters and Operating Territories:
| • | America First Insurance,Richardson, Texas (Gulf Region): Arkansas, Louisiana, Oklahoma, Texas |
| • | Colorado Casualty,Englewood, Colorado (Mountain Region): Arizona, Colorado, Nevada, New Mexico, Utah, Wyoming |
| • | Golden Eagle Insurance,San Diego, California: primarily California |
| • | Hawkeye-Security Insurance,West Des Moines, Iowa (North Central Region): Iowa, Kansas, Minnesota, Missouri, Nebraska, North Dakota, South Dakota, Wisconsin |
| • | Indiana Insurance,Loveland, Ohio (Midwest Region): Illinois, Indiana, Kentucky, Michigan, Ohio, Tennessee |
| • | Liberty Northwest,Portland, Oregon (Pacific Northwest Region): Alaska, Idaho, Montana, Oregon, Washington |
| • | Montgomery Insurance,Charlotte, North Carolina (Southeast Region): Delaware, District of Columbia, Georgia, Maryland, North Carolina, South Carolina, Virginia |
| • | Peerless Insurance, Keene, New Hampshire (Northeast Region): Connecticut, Maine, Massachusetts, New Hampshire, New Jersey, New York, Pennsylvania, Rhode Island, Vermont |
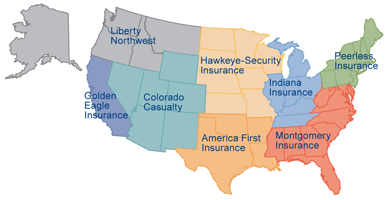
Distribution Channel
Products and services are distributed primarily through independent agents and brokers. Each regional company determines agency appointments within its operating territory.
Products and Services
Agency Markets offers core property and casualty products, including a comprehensive set of personal and commercial coverages. The commercial property and liability coverages are designed to specifically meet the needs of the small to medium-sized business. Personal lines products provide individuals and families comprehensive coverage and services to meet their unique needs.
Technology
The Regional Companies are committed to offering agents and policyholders technology solutions to make doing business easier, faster and more efficient. Evolving the technology capabilities available through the proprietary Agents’ Portals and other means is a major focus.
Technology for Agents
We offer real-time capability for personal lines quoting, commercial lines quoting and policy inquiry as well as billing and claims inquiry and First Notice of Loss (FNOL) submission for both personal and commercial lines.
Personal IQ™
Personal IQ provides system-to-system, real-time personal lines quote capability for participating third-party providers and agents. It delivers Personal IQ functions and features as a service that can be extended to anyone supporting standard XML transactional input. The starting point for transactions will be the agent’s management system or the platform of a third-party intermediary.
Personal IQ SmartRisk™
SmartRisk is an enhancement to Personal IQ. It is a sophisticated pricing tool that delivers competitive, consistent rates for a broad range of exposures. Agents use Personal IQ SmartRisk to request quotes and submit new business online with a next day return and 98 percent acceptance rate. It’s fast, easy and consistent with up to 43 price points, simplified eligibility guidelines, and electronic inquiry and endorsement submission capability. Personal IQ SmartRisk provides the right price for the right risk, enabling agents to broaden their markets, grow their businesses, and generate more revenues.
Commercial IQ™
Similarly, Commercial IQ provides system-to-system, real-time commercial lines quote capability for agents using Applied’s TAM (The Agency Manager) system. It allows for real-time upload of Commercial IQ quick-quote data directly from the agent’s management system.
Commercial IQ SmartRisk™
Commercial IQ SmartRisk is a state-of-the-art program that greatly improves our risk selection process and pricing capabilities, while leveraging our existing eligibility guidelines through Commercial IQ. Commercial IQ SmartRisk provides a significantly expanded pricing feature, simplified eligibility and referral rules, and instant issuance of a quote with up to 100 price points and far less need for underwriting referrals. This innovative risk-insight modeling program seamlessly delivers our best price for qualifying risks and enables us to provide more customers with more competitive prices, and therefore, offers agents increased opportunity to grow their agency revenue.
Online Billing Service Center
The Online Billing Service Center enables policyholders1 to:
• | Pay their invoices online using Electronic Funds Transfer (EFT), credit cards2 or debit cards2; |
• | Make a single payment or set-up automated recurring payments3; |
| • | View their account status with current invoice, payment history and bill payment options; |
• | Eliminate late fees with the automatic payment option3; |
• | Reduce installment fee expense2; and |
| • | Opt out of the service at any time. |
1 | Colorado Casualty only allows online payment for their personal lines policyholders at this time. |
2 | Credit card and debit card payment is not available for America First Insurance or Golden Eagle Insurance policyholders. |
3 | Recurring EFT is only available for personal lines direct bill policyholders at this time. |
Indiana Insurance
6281 Tri-Ridge Boulevard
Loveland, OH 45140
Phone: 513-576-3200
www.indiana-ins.com
Liberty Northwest
650 NE Holladay Street
Portland, OR 97232
Phone: 503-239-5800
www.libertynorthwest.com
Montgomery Insurance
4600 Park Road
Suite 500
Charlotte, NC 28209
Phone: 704-523-2731
www.montgomery-ins.com
Peerless Insurance
62 Maple Avenue
Keene, NH 03431
Phone: 800-542-5385
www.peerless-ins.com
Liberty Mutual Surety
www.libertymutualsurety.com
National Headquarters
Interchange Corporate Center
450 Plymouth Road, Suite 400
Plymouth Meeting, PA 19462
Phone: 610-832-8240
Fax: 610-832-8261
surety@libertymutual.com
www.libertymutualsurety.com
Liberty Mutual Surety specializes in providing contract surety for construction firms, manufacturers and suppliers, and commercial surety bonds for corporations and individuals on an account and transactional basis. Liberty Mutual Surety has 270 full-time employees across domestic and foreign offices, is among the largest surety writers in the United States, and is licensed to write surety in all 50 states. The Liberty Mutual Group’s certified U.S. Treasury underwriting limitation is among the highest in the industry.
Through its partnership with surety specialty professional agents and brokers, Liberty Mutual Surety is committed to delivering smart business solutions and professional, consistent, and responsive service. Liberty Mutual Surety’s extensive network of experienced field office underwriters knows the surety industry and has the demonstrated expertise in commercial surety and construction underwriting to service any corporate or construction bonding need. This expertise is also reflected in Liberty Mutual Surety’s ongoing commitment to agents and clients to provide superior claims service.
Products and Services
Liberty Mutual Surety provides expertise in commercial surety and construction underwriting, providing clients surety bonds in the United States and abroad. We specialize in providing:
| • | Construction performance, payment and bid bonds |
| • | Commercial license and permit, compliance, court, bankruptcy and public official bonds |
Target Markets/Industry Expertise
Contract
| • | Well-capitalized, liquid construction, manufacturing and supply risks |
| • | Programs of $200 million or less |
Commercial Account
| • | Fortune 1000 investment grade risks |
| • | Programs of $100 million or less |
Commercial Transactional
| • | $10 million and under single/aggregate bond programs |
| • | Probate and Public Official — All sizes and types |
| • | License and Permit programs |
International Reverse Flow
| • | Well-capitalized, liquid, U.S.-domiciled foreign-owned construction, manufacturing and supply risks |
| • | Programs of $200 million or less |
International Foreign
| • | Well-capitalized, liquid, foreign-owned construction, manufacturing and supply risks |
| • | Programs of $75 million or less |
Liberty Mutual Surety builds mutually profitable relationships by providing smart business solutions and professional, consistent and responsive service.
Technology
Liberty Mutual Surety’s website, www.libertymutualsurety.com, offers further information on Surety and offers an e-mail link for inquiries.
Summit Holding Southeast, Inc.
www.summitholdings.com
Summit®— which includes Summit Consulting, Inc., and Summit Holding Southeast, Inc., and their affiliates — is a leading provider of workers’ compensation insurance products and services to employers and self-insured employer groups in the Southeast. Summit markets products through independent insurance agents. In the late 1970s, Summit entered the world of workers’ compensation as a third-party administrator for self-insurance funds in Florida and Louisiana. It now provides workers’ compensation programs to more than 38,000 employers in Alabama, Arkansas, Florida, Georgia, Kentucky, Louisiana, Mississippi, North Carolina, South Carolina and Tennessee. Headquartered in Lakeland, Fla., Summit employs more than 1,000 office and field associates at its main location and at regional offices in Baton Rouge, La., and Gainesville, Ga.
Our Services
| • | Back2Work™, Summit’s free return-to-work program, can help lower workers’ compensation costs and boost employee morale for insured employers. This user-friendly program is designed to get workers back to productive employment following job-related injuries. On-site consultations are available for agents and their clients. |
| • | Safety consultations |
| • | Drug-free workplace assistance |
| • | Safety education and training materials |
| • | Monthly loss reports |
| • | Toll-free hotline to report injuries (24 hours a day, 7 days a week) |
| • | Comprehensive claims-management services |
| • | Statewide workers’ compensation medical provider networks available in Florida and Kentucky |
| • | Specialized units for medical cost containment, fraud investigation and subrogation |
| • | Out-of-state coverage available |
Third-Party Administration
Summit provides workers’ compensation loss control, claims management, managed care and policy administration services on a contractual basis for self-insured businesses and municipalities.
Technology
| • | Online Business Center — An online resource for agencies and insureds that is available by password only on www.summitholdings.com. |
| • | Agency Business Center — Allows agencies to obtain details about their clients’ policies, print Certificates of Insurance (COIs), access loss histories, view Summit products and services and get the latest news and information — and much more. Agents and CSRs also enjoy the ease of directly uploading submissions online via Summit’s agency interface. |
| • | Insured Business Center — Insureds can obtain details about their policies, print COIs, access loss information and more. |
Target Markets
Summit’s key underwriting focus areas are:
| • | Restaurants |
| • | Hotels, motels |
| • | Automobile dealerships |
| • | Special trade construction contractors, such as electricians, carpenters and painters |
| • | General automotive repair shops |
| • | Golf courses |
| • | Country clubs |
| • | Travel-related businesses |
| • | Grocery stores |
| • | Machine shops |
| • | Manufacturers |
| • | Professional service companies, such as law and accounting firms |
National Headquarters
2310 Commerce Point Drive
Lakeland, FL 33801-6880
Phone: 800-282-7648
Fax: 863-667-1528
www.summitholdings.com
Wausau Insurance Companies
www.wausau.com
Wausau Insurance is a leading business insurance carrier, known for its loss prevention and claims-management services, which help to lower the overall cost of insurance by lowering the total cost of risk and improving bottom lines. With 1,500 full-time employees and offices across the country, Wausau meets the needs of the middle market, companies with annual premiums in excess of $100,000, across a full product line. Wausau has over $1 billion in premiums.
Products and Services
Wausau offers a full line of insurance products to meet the needs of the mid sized company: commercial auto, general liability, property, umbrella and workers’ compensation.
Wausau offers exceptional customer service in claims and loss prevention. Our unique Wausau SolutionsSM approach delivers outstanding answers to policyholders’ risk-management issues. We use both technology and responsive customer care to offer value-added services such as 24/7 telephone claims reporting, Internet claims reporting, electronic loss reports, Risk Management Information Systems and cost-saving return-to-work programs, to name a few. Our complete range of state-of-the-art loss prevention services help policyholders prevent and reduce the severity of loss. Wausau service providers are dedicated to helping customers reduce loss and insurance costs.
Target Markets/Industry Expertise
Wausau’s underwriting is structured across key vertical industries, providing the ability to customize products and services and respond to unique industry needs.
Wausau’s key underwriting focus areas are:
| • | Construction |
| • | Dining |
| • | Food Products Manufacturing |
| • | Health Care |
| • | Hospitality |
| • | Manufacturing |
| • | Retail |
| • | Service |
| • | Wholesale |
Additional underwriting areas:
| • | Machinery Manufacturing |
| • | Metal Industries |
| • | Real Estate Management |
| • | Groceries —Retail/Wholesale |
| • | Plastic Products Manufacturing |
| • | Beverage |
| • | Building Materials |
| • | Lumber and Wood |
Technology
Wausau has integrated technology into all aspects of its product and service delivery, and remains ahead of the industry for its adoption of technology that improves efficiency and service levels.
Key technology offerings include:
Producer Portal
An online resource available by password only on www.wausau.com that provides agents and brokers with one source to obtain information on their individual insureds, Wausau products and services, and their relationship with Wausau.
Producer Interface
An integrated interface that allows agents and brokers to electronically submit commercial auto, general liability, property, umbrella and workers’ compensation new business applications directly from their agency management systems (AMS, Applied, etc.) to Wausau. Submissions are automatically entered into Wausau work flow, tasks are automatically assigned, underwriting alerts are created and initial quotes are presented to underwriting, all reducing paperwork and improving accuracy and response time.
myServices
A secure site that provides Wausau policyholders access to specific services that will enable them to more effectively manage their businesses. myServices allows policyholders to report claims electronically and provides access to essential information to manage their claims, including loss reports, claim status, location schedules and provider searches.
National Headquarters
2000 Westwood Drive
Wausau, WI 54401
Phone: 800-435-4401
Fax: 715-847-8740
corpinfo@wausau.com
www.wausau.com
 | Liberty Mutual Agency Markets | |
| 175 Berkeley Street, Boston, MA 02116 617-357-9500 | ||
| www.libertymutualagencymarkets.com | ||
| © 2007. Liberty Mutual Group. All rights reserved. 04/07 | ||
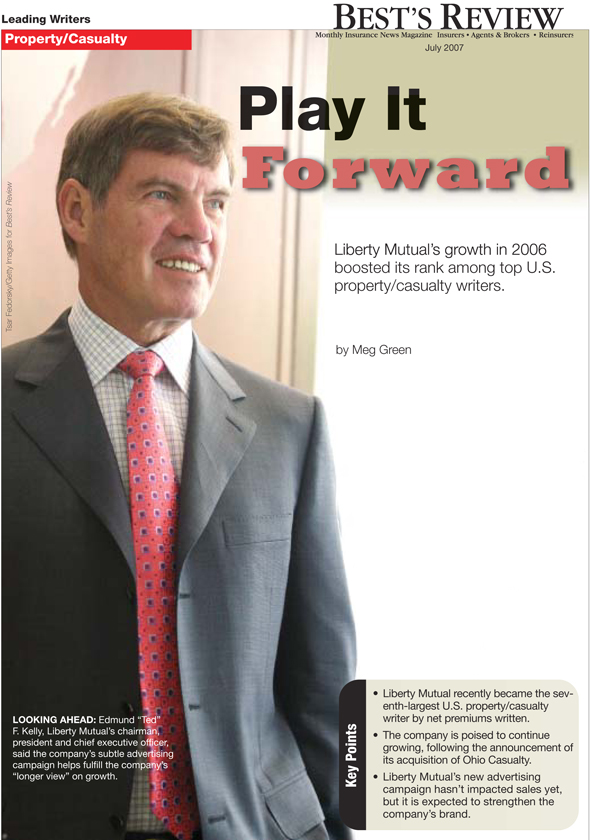
Movement is rare atop the U.S. property/casualty writers’ mountain, but in 2006 one Top 10 player advanced by growing 10% in net premiums written.
Liberty Mutual, which has held the No. 8 spot on the list since 2001, climbed to No. 7, according to A.M. Best Co.’s Top U.S. Property/Casualty Groups by net premiums written in 2006.
Edmund “Ted” F. Kelly, Liberty Mutual’s chairman, president and chief executive officer, credits the rise to organic growth, but notes the company has positioned itself to perhaps move even higher in 2007 with the recently announced acquisition of Ohio Casualty.
Copyright 2007 A.M. Best Company, Inc.; Published in Best’s Review, July 2007. All rights reserved. For web posting only.
A.M. Best prohibits the e-mailing of this file or making copies or reprints of this file. Under license from A. M. Best Company.
The $2.7 billion deal is expected to close in the third quarter. If Ohio Casualty’s $1.41 billion in net premiums written in 2006 was added to Liberty Mutual’s $15.37 billion, it would have pushed Liberty Mutual to the No. 6 position.
Kelly noted both the company’s U.S. and international growth were strong in 2006.
“We’ve added solid, not dramatic, growth in personal lines as a whole, and have had very good commercial U.S. growth,” Kelly said.
The company’s expansion from being primarily a direct writer 10 years ago to also writing business through independent agents and affinity markets today, has been key, he said.
“If a customer wants to do business with Liberty, they can choose the channel they like, and we are there to provide the services that they want,” Kelly said.
Another key to the company’s success with independent agents is its approach, he said. Liberty Mutual operates with regional companies providing independent agents local service with the financial and technical backbone of a national company. “We’re a mixed model. In certain areas we are national, but in other areas, we are regional,” Kelly said.
New View
Liberty Mutual recently rolled out a marketing campaign designed to raise the company’s profile long term. Responsibility-themed television commercials show people helping others, with the tag line: “When it’s people who do the right thing, they call it being responsible. When it’s an insurance company, they call it Liberty Mutual. Responsibility: What’s your policy? Liberty Mutual.”
It’s a subtle approach with the company name only mentioned twice. There’s no 800-number, or attempt to sell any specific product.
“It’s a hell of a campaign,” said Rodger Roeser, president of Eisen Management Group, a public relations firm in Cleveland. “I’ve used that ad with recent clients as a benchmark for good brand advertising.”
Roeser, who wasn’t involved with the Liberty Mutual campaign, said many insurance commercials are remembered for being “goofy or dumb”—like Geico ads with the gecko or caveman. “I think Geico will have problems continuing that momentum going forward, but what Liberty Mutual did will really strengthen their brand in the long term. What it says to me is that Liberty Mutual is standing behind making America a better place to live. It’s not ‘buy insurance;’ it’s ‘make this a better place to be.’”
Other marketing experts also lauded the campaign.
Harvey Hoffenberg, president of Propulsion, a marketing firm based in New Canaan, Conn., said, “I think it’s a nice departure from the ego/testosterone-laden, ‘big-is-oh-so-much-better’ campaigns of many insurance companies. It’s thoughtful, treats the consumer with respect and dignity as they would like you to think they would treat you as a Liberty Mutual customer.
“As a bonus,” Hoffenberg added, “my jaded 14-year-old, hardly their target, thinks they’re the best commercials on air. Clearly, it speaks with a voice that might connect with people.”
The company should be commended for trying to build an image around itself and “hopefully attract like-minded clients,” said Joseph Finora, principal, Joseph Finora & Associates, Laurel, N.Y. However, Finora warned Liberty Mutual had better follow through. “At the end of the day P/C insurance is a commodity product, and for many customers, they only focus on cost versus coverage. If [Liberty Mutual] fails to live up to its promise, then its (and reputation) will be a failure.”
Unusual Approach
“We have three audiences,” Kelly said. “One of our most critical audiences is our own employees. We want to reaffirm their belief in the company. We also have existing customers. We want them to feel good about their decision to do business with us. The third audience is the new customer. When it becomes time to make a decision, we hope they think of us.”
When designing the ad campaign, Liberty Mutual interviewed its employees to see how they view the company, and focused on marketing that view, which led to the focus on responsibility, Kelly said.
“That’s brilliant,” said Roeser of Eisen Management Group. “Whoever the marketing person is who came up with that should get a raise. Because when employees see the ad, and know they had a hand in that, they can take a lot of pride in it. It’s an unusual approach.”
Kelly acknowledged Liberty Mutual’s approach is very different from their competitors’ advertising, which seems to focus on getting consumers to pick up the phone and buy a policy.
“We’ve had a remarkable response to the advertising. As we expected, it had a limited impact on growth last year, but in the long run, we are very optimistic,” Kelly said.
As a mutual holding company, Liberty Mutual can afford to take a long-term view, in both reporting its quarterly earnings and in its advertising, he said.
“I believe if we had been public, it would have been much more difficult to grow. Clearly, we can take a longer view. We have a much more solid balance sheet than we’d be able to if we were public, because it’s less important for us to report stellar earnings all the time,” Kelly said. BR

Liberty Mutual Insurance Cos.
A.M. Best Company # 00060
Distribution:Direct, independent agents and brokers, captive agents
For ratings and other financial strength information about these companies, visitwww.ambest.com.
Copyright 2007 A.M. Best Company, Inc.; Published in Best’s Review, July 2007. All rights reserved. For web posting only.
A.M. Best prohibits the e-mailing of this file or making copies or reprints of this file. Under license from A. M. Best Company.

By Elisabeth Boone, CPCU
Why do so many independent agents like doing business with regional carriers?
Because, as a group, they’re responsive, stable, and knowledgeable about the markets they serve. In lean years as well as fat years, regional insurers do their utmost to accommodate the agents who rely on them, strengthening the bonds of mutual trust and respect.
What if you could marry these desirable traits of regional insurers with the market clout and financial stability of a major national carrier that’s a household name?
That’s exactly what happened in 1999 when the Liberty Mutual Group, a leading direct writer and the sixth largest property/casualty insurer in the United States, decided to expand its market reach by creating a distribution channel for the independent agency system. In that year, the insurer launched what was then known as Regional Agency Markets (RAM), which consisted of seven regional carriers plus two specialty companies. (See “National Power, Local Markets” in the September 2004 issue ofRough Notes.) RAM joined Liberty Mutual’s other strategic business units: Personal Markets, Commercial Markets, and Liberty International. By year-end 2004, RAM had grown to the point where it contributed almost 20% of Liberty Mutual’s total revenue of nearly $20 billion.
Liberty Mutual Agency Markets executives from left: Mark Fiebrink, Chief Operating Officer, Wausau Insurance Companies; Joe Gilles, General Manager, Agency Markets/Commercial Lines; Susan Tuthill, General Manager, Agency Markets/Claims; Gary Gregg, President, Agency Markets; Paula Hays, General Manager, Agency Markets/Personal Lines; and Scott Goodby, Chief Operating Officer, Regional Companies.
From good to better
The launch of Regional Agency Markets clearly established Liberty Mutual as a key player in the independent agency system that was able to offer agents the products of well-known, locally branded regional carriers. Pleased with the success of the new business unit, Liberty Mutual’s management saw a way to expand the scope of RAM to make it an even more attractive and profitable operation.
The new approach was the brainchild of Edmund (Ted) Kelly, Liberty Mutual’s chairman, president, and chief executive officer, and Gary Gregg, a Liberty Mutual veteran who had been serving as executive vice president and manager of the Commercial Market strategic business unit.
“Ted, Roger Jean (the former president of RAM) and I agreed that it was time to align all of our businesses that deal with independent agents into one group,” Gregg explains. “That included Regional Agency Markets plus Employers Insurance of Wausau and Liberty Mutual Surety.” Gregg was appointed president of the new unit, which is called Liberty Mutual Agency Markets, when Roger Jean retired in 2005.
“My career is in a sense a microcosm of our growth and success here at Liberty Mutual,” Gregg observes. “I started out running an insurance division in the early 1990s and then took over what was then called the business market, which was our commercial mid-market direct sales operation. In 1998 I assumed responsibility for Liberty Mutual Surety, which Liberty had purchased from CIGNA in 1994. That was my first exposure to independent agents and brokers.
“I led the acquisition of Wausau in 1999,” Gregg continues. “Wausau sells commercial insurance in the middle market through independent agents and brokers, and it has a captive-agent facility as well. In buying Wausau, our strategic thrust was to strengthen our presence in the middle market and to get distribution in the independent agent channel for larger accounts.”
After the acquisition of Wausau, Liberty Mutual brought together under Gregg’s leadership all of its commercial lines operations: the direct middle market business that Gregg had run previously; Liberty Mutual Surety; Wausau; Liberty Mutual Property; and its group disability and national accounts operations. Gregg ran the new strategic business unit, called Commercial Markets, until mid-2005 when he was named president of Liberty Mutual Agency Markets.
Growing and changing
Today the eight regional companies of Liberty Mutual Agency Markets collectively operate in all 50 states (see map on page 48), focusing on personal lines and small to mid-sized commercial accounts. Agency Market’s regional carriers are represented by some 3,500 appointed agencies nationwide which have access to sell the products and services offered by Wausau, Liberty Mutual Surety, and Summit, a Florida-based workers compensation specialty provider.

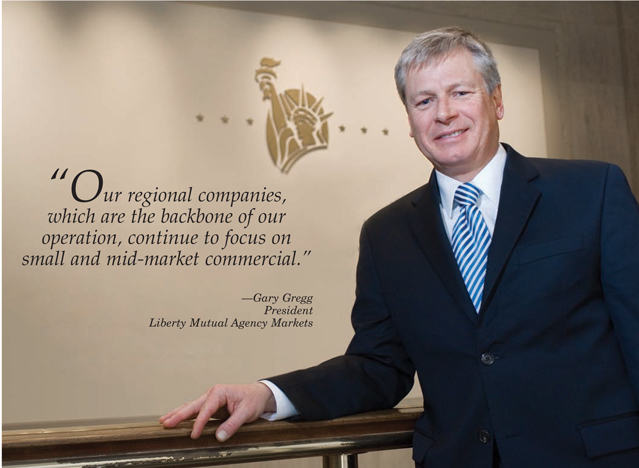
As part of the unification of operations, a decision was made to bring in Liberty Northwest, which had been a separately managed multi-line property/casualty insurer serving the five-state territory of Alaska, Oregon, Washington, Idaho, and Montana. “Because Liberty Northwest was an independently managed company, that left a blank spot on the map for us,” Gregg explains. “It’s now part of our regional company mix, and it’s an important and growing part of our operation.
“The reason we changed the name from Regional Agency Markets to Agency Markets is that we now have the base of eight regional companies plus the national capability of Wausau for larger accounts in the middle market and the surety facility, as well as our specialty workers compensation provider, Summit,” Gregg notes.
“What hasn’t changed is that our regional companies, which are the backbone of our operation, continue to focus on small and mid-market commercial,” Gregg comments. “Accounts of less than $15,000 in premium are considered small commercial, and our mid-commercial range is $15,000 to $150,000. Wausau is active in the $150,000 to $2.5 million market; it has a national footprint and service capability and can handle multi-location and multi-state risks. Its underwriting, loss prevention, and claims service are organized for those larger accounts,” Gregg says. “The regional companies are focused like a laser on independent agents and their customers on the personal and small to mid-commercial side.”
Technology is key
By consolidating support functions across the carriers that make up Liberty Mutual Agency Markets, Liberty Mutual is able to offer those carriers big-company advantages. Chief among these is access to a technology platform that is designed to facilitate ease of doing business with agents—Commercial IQ™ and Personal IQ™.
Because “ease of doing business” is a tenet of Agency Markets’ value proposition, agents can choose to do business online. On the personal lines side, Personal IQ allows agents to navigate among all the data fields and screens associated with a policy, including hot links between the new business and endorsement workflows. Several real-time functions are available for homeowners, auto, umbrella, and packages: endorsement quoting, submissions, and cancellation requests; policy inquiry search by policy number or policyholder name; access to and display of current, first, prior, and renewal terms’ policy data; current policy data modification capability for endorsement requests; motor vehicle registry report ordering for newly added drivers; and summary of policy transaction history.
Real-time services for comparative rating are available through vendors such as SETWrite™, PriorityRate®.com, Transformation Station™, EZLynx™, and TransactNOW™.
Agents who write businessowners coverage through Agency Markets insurers have access to Commercial IQ SmartRisk, an underwriting and pricing system that provides up to 100 price points and simplifies eligibility criteria.
Reprinted from the March 2007 issue ofRough Notesmagazine
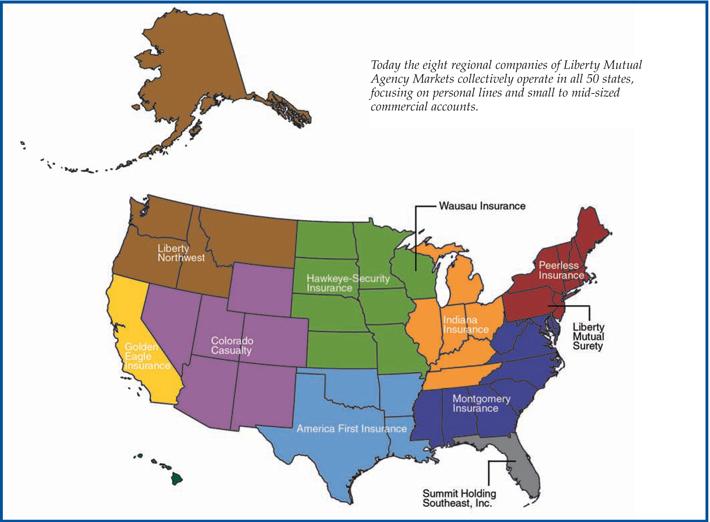
In September 2006, the eight regional companies were honored by Applied Systems and its client network, ASCnet, for their achievements in advancing interface technology. These Agency Markets companies received the 2006 Interface Leadership and Innovation Award, as well as the “Ease of Doing Business” Silver Award for implementing automation and service advancements for their appointed agents in both personal and commercial lines.
What’s more, Peerless Insurance, the Agency Markets carrier that serves nine northeastern states, placed sixth out of 200 property/casualty insurers for providing ease of doing business to its appointed independent agents. The survey, conducted by Deep Customer Connections, Inc., compiled responses from more than 6,000 agents around the country. Carriers were rated on 10 ease of doing business factors, including underwriting, claims service, and carrier-agency relations. Peerless posted a score of 92.7, the highest ranking it has achieved in the four years that the survey has been conducted.
Market trends
How has the property/casualty market changed in the last few years, and how is Liberty Mutual Agency Markets responding to new and emerging trends?
“Looking at recent patterns of change, I see an evolutionary rather than a revolutionary process,” Gregg responds. “I think back to when the pundits said that the Internet was going to disintermediate independent agents, and concern that agents were losing business to vertically integrated carriers on the personal lines side. Despite worries that the independent agency system was under tremendous stress, Gregg points out, “The system continues to successfully evolve, because there are 39,000 entrepreneurs—men and women working with their markets, working with their customers, innovating, and responding to myriad challenges.
“Looking at the larger picture, we see some polarization in the marketplace,” Gregg continues. “One of the key trends is the competition between national carriers and regional carriers, and the advantages each brings to the table. What hasn’t changed for us, and won’t change in the future, is that we pursue a unique path in which the core of our operation is our regional carriers plus Wausau, Liberty Mutual Surety, and Summit,” Gregg says. “We’ll continue to go to market with the best characteristics of the regionals—strong relationships with agents, local market knowledge, consistency in the marketplace—and combine those advantages with the power of a national company: the capital base to make investments in technology that can be shared across the carriers, and the ratings and financial strength of the Liberty Mutual Group.
“Looking at what’s happening in the marketplace; we’re well positioned to make that mix work and to be successful,” Gregg asserts. n