PENFORD CORPORATION
7094 S. Revere Parkway
Centennial, Colorado 80112
June 3, 2013
Mr. Karl Hiller
Branch Chief
United States Securities and Exchange Commission
Division of Corporation Finance
100 F Street, N.E.
Washington, D.C. 20549-4631
| Re: | Penford Corporation |
Form 10-K for the Fiscal Year Ended August 31, 2012
Filed November 8, 2012
Response Letter dated March 29, 2013
File No. 0-11488
Dear Mr. Hiller:
This letter sets forth the responses of Penford Corporation (the “Company”) to the comments relating to the Company’s Form 10-K for the fiscal year ended August 31, 2012 (the “Form 10-K”) contained in your letter dated May 10, 2013 (the “Comment Letter”). For ease of reference, the Staff’s comment is reproduced in full below.
Form 10-K for the Fiscal Year ended August 31, 2012
Financial Statements, page 31
Note 2 – Summary of Significant Accounting Policies, page 37
Inventories and Cost of Sales, page 38
| 1. | We note your response to comment one concerning your accounting for sales of various by-products. You describe the composition of prices charged to customers of your core products and clarify that you are not compensated by these customers for products sold to other parties. We understand that you have decreased the amounts shown as cost of sales by the proceeds received on sales of by-products, and that purchasers of these products are not also suppliers with whom you have any netting arrangements. |
Given that by-products arise in the course of your normal ongoing business operations, and although you may not consider them to be core products, we do not see adequate rationale for reporting sales of these products in a manner that is inconsistent with their nature, as if they had actually and directly lowered your cost of sales.
We have guidance with reference to characteristics of revenues, including criteria that should be applied in determining when recognition is appropriate, in SAB Topic 13.A.1. Please ensure that your accounting policy for sales of by-products is otherwise consistent with this literature. There is also guidance in Rule 5-03 of Regulation S-X applicable to the presentation. We have consulted with our Office of Chief Accountant, in the Division of Corporation Finance, and believe you will need to restate your financial statements in order to report sales of by-products, such as the germ, fiber, and gluten, as sales or revenues, and to correct the amounts previously reported as cost of sales.
Please file an amendment to your Form 10-K and subsequent interim reports with the disclosures prescribed by FASB ASC 250-10-50-7 through 11; also reflecting appropriate revisions to Quarterly Financial Data and all related narratives such as MD&A. You will need to update certifications in accordance with Rule 12b-15 of Regulation 12B.
Response:
In response to your comment, we have considered the guidance with reference to characteristics of revenues. Since we do not further process our by-products, we have never considered them a product that constitutes our ongoing major or central operations, nor have we marketed them as core products. We do however acknowledge that over time, as the price of corn has increased, the recovery from our by-products has increased and we do acknowledge that by-products are a result of a corn wet milling process which itself is a normal ongoing business operation. Notwithstanding that we do not view by-product sales as part of our core business, we will change our financial statement presentation and report by-product sales as a component of sales in future reporting periods, commencing with our third fiscal quarter of 2013 ended May 31, 2013.
We also have considered your request that we restate our most recently filed Form 10-K for fiscal 2012 and subsequent interim reports for fiscal 2013. In considering that request, management assessed whether the impact of such a reclassification is material to our previously issued financial statements taken as a whole and concluded it was not. That conclusion was concurred and approved by our Audit Committee. Accordingly, consistent with the SEC staff’s guidance “Staff Accounting Bulletin No. 108,” we propose to correct the classification error through a revision of our previously issued financial statements when we file our next Form 10-Q and corresponding Form 10-K for fiscal 2013. Specifically, the staff’s guidance provides, “correcting prior year financial statements for immaterial errors would not require previously filed reports to be amended. Such correction may be made the next time the registrant files the prior year financial statements.” To assist the staff in understanding the basis for our conclusion that an immaterial error correction would be appropriate, rather than a restatement of our previously filed 1934 Act filings, we have provided below for the staff’s consideration, the facts leading to our assessment and related conclusion.
2
Penford’s Consideration of Materiality:
Materiality Guidance:
Materiality concerns the significance of an item to users of a registrant’s financial statements. A matter is “material” if there is a substantial likelihood that a reasonable person would consider it important. In its Concepts Statement 2, Qualitative Characteristics of Accounting Information, the FASB stated the essence of the concept of materiality as follows:
The omission or misstatement of an item in a financial report is material if, in the light of surrounding circumstances, the magnitude of the item is such that it is probable that the judgment of a reasonable person relying upon the report would have been changed or influenced by the inclusion or correction of the item.
This formulation in the accounting literature is in substance identical to the formulation used by the courts in interpreting the federal securities laws. The Supreme Court has held that a fact is material if there is –
a substantial likelihood that the . . . fact would have been viewed by the reasonable investor as having significantly altered the “total mix” of information made available.
Under the governing principles, an assessment of materiality requires that one views the facts in the context of the “surrounding circumstances,” as the accounting literature puts it, or the “total mix” of information, in the words of the Supreme Court. In the context of a misstatement of a financial statement item, while the “total mix” includes the size in numerical or percentage terms of the misstatement, it also includes the factual context in which the user of financial statements would view the financial statement item. The shorthand in the accounting and auditing literature for this analysis is that financial management and the auditor must consider both “quantitative” and “qualitative” factors in assessing an item’s materiality. The resulting impact of these considerations may render a quantitatively small error material or a quantitatively large error immaterial.
Evaluation of Materiality :
In addition to the “total mix” of information, the SEC staff has enumerated several factors that should be considered when evaluating materiality that we have considered below.
| 1. | Whether the misstatement arises from an item capable of precise measurement or whether it arises from an estimate and, if so, the degree of imprecision inherent in the estimate. |
The amount of by-product sales in each period can be measured with precision and the presentation is not subject to management’s estimation. Beginning in the third quarter of fiscal 2012, the Company disclosed its accounting policy for and the dollar amounts of its by-product sales in its SEC filings. The actual amounts of the Company’s by-product sales are disclosed to investors in Note 2 of the Company’s Annual Report on Form 10-K for the fiscal year ended August 31, 2012. Further, the Company’s subsequent quarterly reports for fiscal 2013 include the respective disclosures for all periods presented.
3
| 2. | Whether the misstatement masks a change in earnings or other trends.Whether the misstatement affects company-specific trends and performance metrics that are important to investors. |
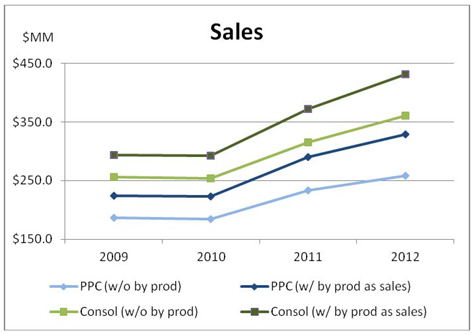
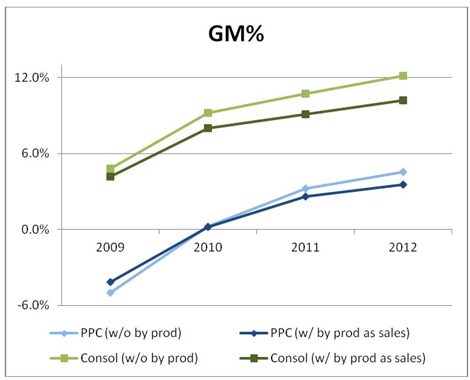
Classification of the by-product proceeds as sales as opposed to a reduction in cost of sales does not impact the Company’s reported amount of gross margin dollars, operating income, net income or earnings per share. The classification does impact the reported gross margin as a percent of sales (which is not disclosed in the primary financial statements). Classifying by-product recoveries as a reduction of cost of sales results in a slightly higher gross margin percentage than the gross margin percentage that would be reported if the by-product recoveries were classified as sales, however the trend in gross margin percentage is not different. While the dollar value of revenue would increase, the trend in revenue growth is unchanged. The Company does not consider these changes to be material as the changes in the percentage growth do not affect the trends of sales or the gross margin as presented below. The reclassification would have no impact on the consolidated balance sheets or the consolidated statements of cash flows, comprehensive income (loss) or shareholders’ equity reported in the fiscal 2012 Form 10-K and subsequent interim filings for fiscal 2013.
Presented below is a summary of both the consolidated and segment results based on previously reported amounts in the Company’s Exchange Act filings and the pro-forma consolidated and segment results for by-products presented as a component of sales. Following the tables is a further discussion of the materiality considerations as well as graphs demonstrating the impact on trends. The Company’s Food Ingredients segment does not have by-products and accordingly is not impacted.
Actual Consolidated Results, as Previously Reported:
| Year Ended August 31 | ||||||||||||||||
| 2012 | 2011 | 2010 | 2009 | |||||||||||||
| (Dollars in thousands) | ||||||||||||||||
Consolidated sales | $ | 361,363 | $ | 315,441 | $ | 254,274 | $ | 255,556 | ||||||||
Consolidated cost of sales | (317,453 | ) | (281,606 | ) | (230,820 | ) | (243,265 | ) | ||||||||
|
|
|
|
|
|
|
| |||||||||
Consolidated gross margin | $ | 43,910 | $ | 33,835 | $ | 23,454 | $ | 12,291 | ||||||||
Gross margin percentage | 12.2 | % | 10.7 | % | 9.2 | % | 4.8 | % | ||||||||
Increase in sales | 14.6 | % | 24.1 | % | -0.5 | % | ||||||||||
4
Pro Forma ConsolidatedResults – By-Products are Presented as Sales:
| Year Ended August 31 | ||||||||||||||||
| 2012 | 2011 | 2010 | 2009 | |||||||||||||
| (Dollars in thousands) | ||||||||||||||||
Consolidated sales | $ | 431,355 | $ | 372,213 | $ | 292,998 | $ | 291,532 | ||||||||
Consolidated cost of sales | (387,445 | ) | (338,378 | ) | (269,544 | ) | (279,241 | ) | ||||||||
|
|
|
|
|
|
|
| |||||||||
Consolidated gross margin | $ | 43,910 | $ | 33,835 | $ | 23,454 | $ | 12,291 | ||||||||
Gross margin percentage | 10.2 | % | 9.1 | % | 8.0 | % | 4.2 | % | ||||||||
Increase in sales | 15.9 | % | 27.0 | % | -0.1 | % | ||||||||||
Actual Industrial Ingredients Segment Results, as Previously Reported:
| Year Ended August 31 | ||||||||||||||||
| 2012 | 2011 | 2010 | 2009 | |||||||||||||
| (Dollars in thousands) | ||||||||||||||||
Industrial Ingredients sales | $ | 258,819 | $ | 233,201 | $ | 184,016 | $ | 186,526 | ||||||||
Industrial Ingredients cost of sales | (247,075 | ) | (225,678 | ) | (183,555 | ) | (195,853 | ) | ||||||||
|
|
|
|
|
|
|
| |||||||||
Industrial Ingredients gross margin | $ | 11,744 | $ | 7,523 | $ | 461 | $ | (9,327 | ) | |||||||
Gross margin percentage | 4.5 | % | 3.2 | % | 0.3 | % | -5.0 | % | ||||||||
Increase in sales | 11.0 | % | 26.7 | % | -1.3 | % | ||||||||||
Pro Forma Industrial Ingredients Segment Results– By-Products are Presented as Sales:
| Year Ended August 31 | ||||||||||||||||
| 2012 | 2011 | 2010 | 2009 | |||||||||||||
| (Dollars in thousands) | ||||||||||||||||
Industrial Ingredients sales | $ | 328,811 | $ | 289,973 | $ | 222,740 | $ | 222,502 | ||||||||
Industrial Ingredients cost of sales | (317,067 | ) | (282,450 | ) | (222,279 | ) | (231,829 | ) | ||||||||
|
|
|
|
|
|
|
| |||||||||
Industrial Ingredients gross margin | $ | 11,744 | $ | 7,523 | $ | 461 | $ | (9,327 | ) | |||||||
Gross margin percentage | 3.6 | % | 2.6 | % | 0.2 | % | -4.2 | % | ||||||||
Increase in sales | 13.4 | % | 30.2 | % | 0.1 | % | ||||||||||
Investors focus on the trends in revenue growth, expansion or contraction in gross margin, operating income, net income and earnings per share, as well as the non-GAAP metrics of EBIT (earnings before interest and taxes) and EBITDA (earnings before interest, taxes, depreciation and amortization). These are the same performance metrics, with the exception of non-GAAP EBIT and EBITDA, that are emphasized in the Company’s earnings releases and investor calls and also discussed in the Company’s periodic filings with the SEC.
5
Below are graphs showing the trends for Penford consolidated results and the Industrial Ingredients segment, for sales and gross margin as a percent of sales, with and without by-products included in sales. The reclassification of by-product sales to revenue from cost of sales does not affect the trends in the Company’s key performance metrics. The graphs labeled PPC represent the Industrial Ingredients segment of Penford Corporation.
6
| 3. | Whether the misstatement hides a failure to meet analysts’ consensus expectations for the enterprise. |
The presentation of by-products as a reduction of cost of sales does not hide a failure to meet analysts’ consensus expectations or have similar adverse consequences. The key measures that are a focus of analysts include product mix within the Industrial Ingredients’ segment with most questions focused on ethanol sales, new product introductions in both business segments, opportunities for increases in product sales of higher-end specialty starch products (industrial and food), and acknowledgment of the pass-through element of the corn cost and significantly competitive nature of the corn starch business. There has not been any change in investor or analyst focus since the disclosure of the by-product amounts and classification policy commencing with the Form 10-Q for the third quarter of fiscal 2012 and the Form 10-K for fiscal 2012 and subsequent quarterly reports for fiscal 2013. By-product proceeds have not been a component of management’s presentations or a subject of analyst inquiries. Analyst expectations for sales are based on the historical presentation for sales, which excludes by-product sales. Furthermore, there were no unusual changes in our stock price when the disclosure was made.
Since the disclosure of the by-product amounts in recent filings, management has not received questions or comments from shareholders or analysts centered upon the economics or accounting for by-products. The reports issued by an analyst who covers commodities in connection with the food industry regularly reports “Net Corn Costs” using assumed yields of corn gluten meal, corn gluten feed and corn oil from a bushel of corn.
During the 10 years that I have been Penford’s Chief Financial Officer, by-product sales have not been a focus of inquiry by analysts. That is the case because 1) industry publications and the institutional investors of Penford (80% of the Company’s investors are institutional investors, management and board members, and approximately 44% of Penford’s shares are owned by four institutional shareholders, management and board members) are aware of the fact that by-products are a component of the “net cost” of producing manufactured corn products, 2) the relationship between by-product proceeds and the cost of corn purchases has consistently tracked around the 32% to 38% range, and 3) there is an active market that absorbs consumption of the by-products and the active market has published by-product prices that are readily available. At any given period end, by-products in Penford’s ending inventory are insignificant and there has always been sufficient demand for by-products such that the risk of not recovering the inventory costs is remote.
| 4. | Whether the misstatement changes a loss into income or vice versa. |
There is no effect of by-product classification (component of revenue or reduction in cost of sales) on the amounts of gross margin, income from operations, income (loss) before income taxes, net income (loss) or earnings (loss) per share.
7
| 5. | Whether the misstatement concerns a segment or other portion of the registrant’s business that has been identified as playing a significant role in the registrant’s operations or profitability. |
The presentation of by-products impacts the Industrial Ingredients segment only. The proceeds from the by-products are significant quantitatively but do not have an impact on gross margin or net profitability of this segment or segment trends for revenue and gross margin as presented in the tables and graphs above.
| 6. | Whether the misstatement affects the registrant’s compliance with regulatory requirements. |
The presentation of by-products does not have an impact on compliance with regulatory requirements.
| 7. | Whether the misstatement affects the registrant’s compliance with loan covenants or other contractual requirements. |
The Company’s loan covenants are based on achieving certain ratios of earnings before interest, taxes, depreciation and amortization as defined in the Company’s credit agreement (“EBITDA”) to fixed charges and EBITDA to debt outstanding as well as the level of capital expenditures. A reclassification of by-product proceeds to revenues has no impact on these calculations.
| 8. | Whether the misstatement has the effect of increasing management’s compensation. |
There is no effect on the compensation of senior management. Senior management bonuses are at the discretion of the board of directors.
| 9. | Whether the misstatement involves concealment of an unlawful transaction. |
There is no concealment of any unlawful transaction.
Penford’s Materiality Assessment and Conclusion:
As indicated above, Penford considered whether a reclassification of by-products proceeds to sales in its previously filed fiscal 2012 Form 10-K and subsequent interim reports for fiscal 2013 is material if, in light of the surrounding circumstances, the magnitude of the item is such that it is probable that the judgment of a reasonable person relying upon the report would have been changed or influenced by the inclusion or correction of the item. We firmly believe, based on our assessment of the qualitative and quantitative considerations presented above, that a correction to reclassify by-products from a reduction in cost of sales to sales is not a material error correction. Based on management’s assessment above, we believe that an immaterial error correction rather than a restatement is appropriate under these circumstances.
8
Proposed Presentation and Disclosures for Penford’s Form 10-Q for the Quarter Ended May 31, 2013:
The disclosures the Company proposes to include in its Form 10-Q for the quarter ended May 31, 2013 to be filed on or about July 9, 2013, are as follows. The disclosure referencing the revision of the Company’s previously issued financial statements will also be included in the filing of the fiscal 2013 Form 10-K for the respective annual amounts.
Item 1: Notes to Condensed Consolidated Financial Statements:
In “Footnote 1 – Business”, the Company’s Quarterly Report on Form 10-Q for the quarter ended February 28, 2013 included the following paragraph:
The Company produces certain by-products from its corn starch manufacturing process. The proceeds from the sale of these by-products reduce the cost of corn and, accordingly, are included in cost of goods sold. Sales of by-products that reduced cost of goods sold were $20.5 million and $42.8 million for the three- and six-month periods ended February 28, 2013, respectively; and $17.0 million and $33.8 million for the three- and six-month periods ended February 29, 2012, respectively.
For the quarter ending May 31, 2013, Penford will change this paragraph to read as follows:
The Company produces certain by-products from its corn starch manufacturing process. The proceeds from the sale of these by-products have historically been classified as a reduction in the cost of corn and, accordingly, were reflected as a reduction in cost of sales. The Company has determined to include sales of by-products in sales rather than as amounts that directly reduce cost of sales. See Note 2 for further discussion regarding the change in classification for by-products.
The Company will add a new footnote prominently reflected as Note 2 to discuss the change in classification that will read as follows:
Note 2: Revision to Revenue Presentation for By-Products in Previously Issued Financial Statements
The Company historically classified proceeds it received from by-product sales as a reduction of cost of sales in its Consolidated Statements of Operations. That presentation for current and previous periods was revised to reflect proceeds received from by-product sales as sales. The Company has determined the revisions to the previously reported amounts are not material to those consolidated financial statements taken as a whole. Presented below are effects of those revisions, including the consolidated results for the three annual periods ending August 31, 2012 and subsequent interim periods for fiscal 2013.
| Year Ended August 31, | Three Months Ended November 30 | |||||||||||||||||||
| 2012 | 2011 | 2010 | 2012 | 2011 | ||||||||||||||||
| (Dollars in thousands) | ||||||||||||||||||||
Sales, as previously reported | $ | 361,363 | $ | 315,441 | $254,274 | $ | 94,859 | $ | 90,746 | |||||||||||
Sales, as revised | $ | 431,355 | $ | 372,213 | $292,998 | $ | 117,126 | $ | 107,618 | |||||||||||
Cost of sales, as previously reported | $ | 317,453 | $ | 281,606 | $230,820 | $ | 81,601 | $ | 78,938 | |||||||||||
Cost of sales, as revised | $ | 387,445 | $ | 338,378 | $269,544 | $ | 103,868 | $ | 95,810 | |||||||||||
| Three Months Ended | Six Months Ended | |||||||||||||||
| February 28, 2013 | February 29, 2012 | February 28, 2013 | February 29, 2012 | |||||||||||||
| (Dollars in thousands) | ||||||||||||||||
Sales, as previously reported | $ | 89,037 | $ | 86,188 | $183,896 | $ | 176,934 | |||||||||
Sales, as revised | $ | 109,556 | $ | 103,148 | $226,682 | $ | 210,766 | |||||||||
Cost of sales, as previously reported | $ | 78,036 | $ | 76,787 | $159,637 | $ | 155,725 | |||||||||
Cost of sales, as revised | $ | 98,555 | $ | 93,747 | $202,423 | $ | 189,557 | |||||||||
9
Presented below are the corrected amounts had the proceeds from the sales of by-products for the Industrial Ingredients segment been presented as sales in those prior filings, including the consolidated results for the three annual periods ending August 31, 2012 and subsequent interim periods for fiscal 2013.
| Year Ended August 31, | Three Months Ended November 30 | |||||||||||||||||||
| 2012 | 2011 | 2010 | 2012 | 2011 | ||||||||||||||||
| (Dollars in thousands) | ||||||||||||||||||||
As previously reported: | ||||||||||||||||||||
Sales | ||||||||||||||||||||
Industrial ingredients | ||||||||||||||||||||
Industrial Starch | $ | 156,945 | $ | 127,471 | $ | 115,681 | $ | 43,802 | $ | 32,386 | ||||||||||
Ethanol | 101,874 | 105,730 | 68,335 | 23,403 | 32,436 | |||||||||||||||
|
|
|
|
|
|
|
|
|
| |||||||||||
| $ | 258,819 | $ | 233,201 | $ | 184,016 | $ | 67,205 | $ | 64,822 | |||||||||||
Food ingredients | 102,544 | 82,240 | 70,258 | 27,654 | 25,924 | |||||||||||||||
|
|
|
|
|
|
|
|
|
| |||||||||||
| $ | 361,363 | $ | 315,441 | $ | 254,274 | $ | 94,859 | $ | 90,746 | |||||||||||
|
|
|
|
|
|
|
|
|
| |||||||||||
As revised: | ||||||||||||||||||||
Sales | ||||||||||||||||||||
Industrial ingredients | ||||||||||||||||||||
Industrial Starch | $ | 156,945 | $ | 127,471 | $ | 115,681 | $ | 43,802 | $ | 32,386 | ||||||||||
Ethanol | 101,874 | 105,730 | 68,335 | 23,403 | 32,436 | |||||||||||||||
By-products | 69,992 | 56,772 | 38,724 | 22,267 | 16,872 | |||||||||||||||
|
|
|
|
|
|
|
|
|
| |||||||||||
| $ | 328,811 | $ | 289,973 | $ | 222,740 | $ | 89,472 | $ | 81,694 | |||||||||||
Food ingredients | 102,544 | 82,240 | 70,258 | 27,654 | 25,924 | |||||||||||||||
|
|
|
|
|
|
|
|
|
| |||||||||||
| $ | 431,355 | $ | 372,213 | $ | 292,998 | $ | 117,126 | $ | 107,618 | |||||||||||
|
|
|
|
|
|
|
|
|
| |||||||||||
| Three Months Ended | Six Months Ended | |||||||||||||||
| February 28, 2013 | February 29, 2012 | February 28, 2013 | February 29, 2012 | |||||||||||||
| (Dollars in thousands) | ||||||||||||||||
As previously reported: | ||||||||||||||||
Sales | ||||||||||||||||
Industrial ingredients | ||||||||||||||||
Industrial Starch | $ | 44,237 | $ | 37,052 | $ | 88,039 | $ | 69,438 | ||||||||
Ethanol | 18,196 | 24,232 | 41,599 | 56,668 | ||||||||||||
|
|
|
|
|
|
|
| |||||||||
| $ | 62,433 | $ | 61,284 | $ | 129,638 | $ | 126,106 | |||||||||
Food ingredients | 26,604 | 24,904 | 54,258 | 50,828 | ||||||||||||
|
|
|
|
|
|
|
| |||||||||
| $ | 89,037 | $ | 86,188 | $ | 183,896 | $ | 176,934 | |||||||||
|
|
|
|
|
|
|
| |||||||||
As revised: | ||||||||||||||||
Sales | ||||||||||||||||
Industrial ingredients | ||||||||||||||||
Industrial Starch | $ | 44,237 | $ | 37,052 | $ | 88,039 | $ | 69,438 | ||||||||
Ethanol | 18,196 | 24,232 | 41,599 | 56,668 | ||||||||||||
By-products | 20,519 | 16,960 | 42,786 | 33,832 | ||||||||||||
|
|
|
|
|
|
|
| |||||||||
| $ | 82,952 | $ | 78,244 | $ | 172,424 | $ | 159,938 | |||||||||
Food ingredients | 26,604 | 24,904 | 54,258 | 50,828 | ||||||||||||
|
|
|
|
|
|
|
| |||||||||
| $ | 109,556 | $ | 103,148 | $ | 226,682 | $ | 210,766 | |||||||||
|
|
|
|
|
|
|
| |||||||||
10
The Company will also reference the correction of the error in the by-product sales classification in the footnote disclosure for segment reporting in the Quarterly Report on Form 10-Q for the quarter ended May 31, 2013.
I hereby acknowledge on behalf of the Company that (i) the Company is responsible for the adequacy and accuracy of the disclosure in its filings with the Commission; (ii) the comments of the Staff and disclosures by the Company in its filings with the Commission in response to comments of the Staff do not foreclose the Commission from taking any action with respect to the Company’s filings with the Commission; and (iii) the Company may not assert the Staff’s comments as a defense in any proceeding initiated by the Commission or any person under the federal securities laws of the United States.
If you have any further comments or questions regarding this letter, please contact me at (303) 649-1900.
Very truly yours,
/s/ Steven O. Cordier
Steven O. Cordier
Senior Vice President and Chief Financial Officer
| cc: | John Cannarella, Securities and Exchange Commission |
Jenifer Gallagher, Securities and Exchange Commission
Margaret Von der Schmidt, Corporate Controller
Christopher Lawlor, Vice President and General Counsel
Andrew Bor, Perkins Coie LLP
11