UNITED STATES
SECURITIES AND EXCHANGE COMMISSION
Washington, D.C. 20549
FORM N-CSR
CERTIFIED SHAREHOLDER REPORT OF REGISTERED MANAGEMENT
INVESTMENT COMPANIES
Investment Company Act file number | 811 - 3954 |
| |
| DREYFUS TAX EXEMPT CASH MANAGEMENT FUNDS | |
| (Exact name of Registrant as specified in charter) | |
| | |
| c/o The Dreyfus Corporation 200 Park Avenue New York, New York 10166 | |
| (Address of principal executive offices) (Zip code) | |
| | |
| Michael A. Rosenberg, Esq. 200 Park Avenue New York, New York 10166 | |
| (Name and address of agent for service) | |
|
Registrant's telephone number, including area code: | (212) 922-6000 |
| |
Date of fiscal year end: | 1/31 | |
Date of reporting period: | 7/31/10 | |
| | | | | | |
FORM N-CSR
Item 1. Reports to Stockholders.

Contents
| |
| The Funds | |
| Letter to Shareholders (Taxable) | 3 |
| Letter to Shareholders (Tax Exempt) | 5 |
| Understanding Your Fund’s Expenses | 7 |
| Comparing Your Fund’s Expenses | |
| With Those of Other Funds | 9 |
| Statements of Investments | 11 |
| Statements of Assets and Liabilities | 54 |
| Statements of Operations | 57 |
| Statements of Changes in Net Assets | 59 |
| Financial Highlights | 65 |
| Notes to Financial Statements | 77 |
| Proxy Results | 87 |
| Information About the Review | |
| and Approval of each Fund’s | |
| Management Agreement | 89 |
|
| For More Information |
| Back cover |
The views expressed in this report reflect those of the portfolio manager only through the end of the period covered and do not necessarily represent the views of Dreyfus or any other person in the Dreyfus organization. Any such views are subject to change at any time based upon market or other conditions and Dreyfus disclaims any responsibility to update such views. These views may not be relied on as investment advice and, because investment decisions for a Dreyfus fund are based on numerous factors, may not be relied on as an indication of trading intent on behalf of any Dreyfus fund.

Dreyfus Cash Management Funds
The Funds

LETTER TO
SHAREHOLDERS
Dear Shareholders:
This semiannual report for Dreyfus Cash Management Funds (Taxable) covers the six-month period ended July 31, 2010. Over the reporting period, the six Dreyfus Cash Management Funds (Taxable) listed below produced the following annualized yields and, taking into account the effects of compounding, the following annualized effective yields:1,2
| | |
| | | Annualized |
| | Annualized | Effective |
| | Yield (%) | Yield (%) |
| Dreyfus Cash Management | | |
| Institutional Shares | 0.12 | 0.12 |
| Investor Shares | 0.00 | 0.00 |
| Administrative Shares | 0.03 | 0.03 |
| Participant Shares | 0.00 | 0.00 |
| Agency Shares | 0.06 | 0.06 |
| Dreyfus Cash Management Plus, Inc. | |
| Institutional Shares | 0.17 | 0.17 |
| Investor Shares | 0.00 | 0.00 |
| Administrative Shares | 0.07 | 0.07 |
| Participant Shares | 0.00 | 0.00 |
| Service Shares | 0.00 | 0.00 |
| Select Shares | 0.00 | 0.00 |
| Agency Shares | 0.11 | 0.11 |
| Dreyfus Government Cash Management | |
| Institutional Shares | 0.03 | 0.03 |
| Investor Shares | 0.00 | 0.00 |
| Administrative Shares | 0.00 | 0.00 |
| Participant Shares | 0.00 | 0.00 |
| Agency Shares | 0.00 | 0.00 |
| Dreyfus Government Prime Cash Management | |
| Institutional Shares | 0.01 | 0.01 |
| Investor Shares | 0.00 | 0.00 |
| Administrative Shares | 0.00 | 0.00 |
| Participant Shares | 0.00 | 0.00 |
| Agency Shares | 0.00 | 0.00 |
| Dreyfus Treasury & Agency Cash Management | |
| Institutional Shares | 0.00 | 0.00 |
| Investor Shares | 0.00 | 0.00 |
| Administrative Shares | 0.00 | 0.00 |
| Participant Shares | 0.00 | 0.00 |
| Service Shares | 0.00 | 0.00 |
| Select Shares | 0.00 | 0.00 |
| Agency Shares | 0.00 | 0.00 |
| Premier Shares | 0.00 | 0.00 |
| | |
| | | Annualized |
| | Annualized | Effective |
| | Yield (%) | Yield (%) |
| Dreyfus Treasury Prime Cash Management | |
| Institutional Shares | 0.00 | 0.00 |
| Investor Shares | 0.00 | 0.00 |
| Administrative Shares | 0.00 | 0.00 |
| Participant Shares | 0.00 | 0.00 |
| Agency Shares | 0.00 | 0.00 |
Monetary Policy Unchanged in Muted Recovery
The reporting period began in the midst of an economic recovery that was fueled, in part, by an overnight federal funds rate that stood unchanged in a historically low range between 0.00% and 0.25%. As a result, money market yields remained near zero percent over the past six months.
In February 2010, the economic recovery appeared to remain on track. Retail sales had posted better-than-expected results just before the reporting period began, and job losses continued to moderate in February. In March, manufacturing activity rose for the eighth straight month, and it did so at the fastest rate in almost six years.
Nonetheless, U.S. GDP grew at a revised 3.7% annualized rate during the first quarter, a milder gain than similar stages of most previous recoveries. Moreover, the housing market continued to struggle, with existing home sales sliding –0.6% in March compared to the previous month.
In April and May, a sovereign debt crisis in Europe and inflationary pressures in China contributed to greater economic uncertainty worldwide, sparking heightened volatility in stock and bond markets. In the United States, the Consumer Price Index slid –0.1% in April, while retail sales and industrial production posted gains. However, government budget cutbacks in Europe created concerns that demand for goods and services, including those from U.S. companies, could suffer. Indeed, U.S. industrial production appeared to moderate in June, and pri-
LETTER TO SHAREHOLDERS (continued)
vate-sector job growth proved more anemic than many analysts expected.
In July,some positive data appeared to support analysts’ consensus view that the springtime slowdown was unlikely to lead to a double-dip recession. Industrial production posted a relatively robust 1.0% gain after June’s mild setback, and the manufacturing and service sectors of the U.S. economy expanded for the twelfth and seventh consecutive months, respectively. On the other hand, total nonfarm payroll employment fell by 131,000 jobs in July, reflecting the end of temporary hiring for the 2010 census and leaving the unemployment rate at 9.5%.
Also during the reporting period, the U.S. Securities and Exchange Commission (“SEC”) issued new regulations governing money market funds. These new regulations, many of which became effective in March 2010, had relatively little impact on the fund, which historically has been conservatively managed.
An Unwavering Focus on Quality
With few opportunities available in the short-term credit markets for significant levels of current income, it made little sense to incur the additional credit and interest-rate risks that longer-dated instruments typically entail. Therefore, we set the funds’ weighted average maturities in ranges that were roughly in line with or slightly longer than industry averages. As always, we focused exclusively on money market instruments meeting our stringent credit-quality criteria.
Although the mild economic recovery is maturing, inflationary pressures have remained low.The sub-par U.S. recovery, along with expectations of sustained economic weakness in Europe, has convinced many analysts that a shift to a more restrictive monetary policy is unlikely anytime soon.Therefore, as we have for some time, we intend to maintain the funds’ focus on credit quality and liquidity.

| |
| | An investment in the fund is not insured or guaranteed by the FDIC or |
| | any other government agency. Although the fund seeks to preserve the |
| | value of your investment at $1.00 per share, it is possible to lose money |
| | by investing in the fund. |
| | Short-term corporate, asset-backed securities holdings and municipal |
| | securities holdings (as applicable), while rated in the highest rating |
| | category by one or more NRSRO (or unrated, if deemed of comparable |
| | quality by Dreyfus), involve credit and liquidity risks and risk of |
| | principal loss. |
| 1 | Annualized effective yield is based upon dividends declared daily and |
| | reinvested monthly. Past performance is no guarantee of future results. |
| | Yields fluctuate. |
| 2 | Yields provided reflect the absorption of certain fund expenses by The |
| | Dreyfus Corporation pursuant to an undertaking, which is voluntary |
| | and temporary, not contractual, and can be terminated at any time |
| | without notice. Had these expenses not been absorbed, fund yields would |
| | have been lower, and in some cases, 7-day yields during the reporting |
| | period would have been negative absent the expense absorption. |
4

LETTER TO
SHAREHOLDERS
Dear Shareholder:
We are pleased to present the semiannual report for Dreyfus Cash Management Funds (Tax Exempt). For the six-month period ended July 31, 2010, the five tax-exempt money market portfolios that comprise Dreyfus Cash Management Funds (Tax Exempt) produced the following annualized yields and annualized effective yields:1,2
| | |
| | | Annualized |
| | Annualized | Effective |
| | Yield (%) | Yield (%) |
| Dreyfus Municipal Cash Management Plus | |
| Institutional Shares | 0.13 | 0.13 |
| Investor Shares | 0.00 | 0.00 |
| Administrative Shares | 0.04 | 0.04 |
| Participant Shares | 0.00 | 0.00 |
| Agency Shares | 0.06 | 0.06 |
| Dreyfus New York Municipal Cash Management | |
| Institutional Shares | 0.13 | 0.13 |
| Investor Shares | 0.01 | 0.01 |
| Administrative Shares | 0.03 | 0.03 |
| Participant Shares | 0.01 | 0.01 |
| Agency Shares | 0.07 | 0.07 |
| Dreyfus Tax Exempt Cash Management | |
| Institutional Shares | 0.10 | 0.10 |
| Investor Shares | 0.01 | 0.01 |
| Administrative Shares | 0.03 | 0.03 |
| Participant Shares | 0.01 | 0.01 |
| Agency Shares | 0.04 | 0.04 |
| Dreyfus California AMT-Free Municipal Cash Management |
| Institutional Shares | 0.14 | 0.14 |
| Investor Shares | 0.00 | 0.00 |
| Administrative Shares | 0.04 | 0.04 |
| Participant Shares | 0.00 | 0.00 |
| Agency Shares | 0.08 | 0.08 |
| Dreyfus New York AMT-Free Municipal Cash Management |
| Institutional Shares | 0.16 | 0.16 |
| Investor Shares | 0.01 | 0.01 |
| Administrative Shares | 0.06 | 0.06 |
| Participant Shares | 0.01 | 0.01 |
| Classic Shares | 0.01 | 0.01 |
With the overnight federal funds rate remaining unchanged in a range between 0.00% and 0.25% throughout the reporting period, yields of tax-exempt money market instruments stayed at historically low levels. However, municipal money market instruments generally provided yields that were more competitive than historical norms with the nominal yields produced by taxable money market funds.
Money Market Yields Hovered Near Historical Lows
Although unemployment remained stubbornly high, manufacturing activity continued to rebound early in the reporting period, helping to bolster confidence among consumers, businesses and investors. Still, the economic recovery throughout the reporting period proved to be milder than most previous recoveries. Indeed, the domestic economic growth rate, while still positive,moderated in the second quarter compared to the first quarter of the year.
The U.S. and global economies were constrained by several new influences during the reporting period, including turmoil in European sovereign debt markets and inflationary pressures in China.These developments added to ongoing economic concerns regarding lackluster consumer spending in the United States. In light of these challenges, the Federal Reserve Board (the “Fed”) retained the aggressively accommodative monetary policy it first established in December 2008.
In the municipal securities market, the supply of variable-rate demand notes and tender option bonds remained relatively low, due mainly to tighter lending restrictions and credit-rating downgrades. Instead, issuers continued to turn to longer-term bonds, including taxable securities through the federally subsidized Build America Bonds program. Meanwhile, demand for tax-exempt money market instruments remained robust, putting additional downward pressure on already low tax-exempt money market yields.
Finally, most states and municipalities continued to face fiscal challenges stemming from reduced tax receipts and greater demand for services, limiting the supply of instruments meeting our investment criteria. The states of California and NewYork both struggled
LETTER TO SHAREHOLDERS (continued)
with substantial revenue shortfalls, and while New York enacted a balanced budget a few days after the reporting period’s end, California’s state legislature so far has been unable to agree on measures to reduce spending and/or boost revenues.
In-House Research Supported Credit Quality
The in-depth, independent research conducted by our credit analysts into the issuers we consider led us to retain our focus on direct, high-quality municipal obligations during the reporting period. As we have for some time, we favored instruments backed by pledged tax appropriations or revenues from facilities providing essential services. We generally shied away from instruments issued by entities that depend heavily on state aid. We also avoided instruments that our credit analysts believe may be subject to credit-rating downgrades, including some that came to market with elevated yields to compensate investors for higher risks.
We set the funds’ weighted average maturities in ranges that were roughly in line with industry averages, which remained well below historical averages in the low interest-rate environment. In addition, we prepared the funds for new government regulations that took effect during the reporting period, including a reduction in the funds’ maximum weighted average maturity from 90 days to 60 days.
Safety and Liquidity Remain Paramount
The Fed repeatedly has indicated that it is likely to keep short-term interest rates near historical lows for an extended period.Therefore, we believe the prudent course continues to be an emphasis on preservation of capital and liquidity.
However, we expect the supply of newly issued tax-exempt money market instruments to trend higher in the months ahead, which could support higher yields. We also are mindful that, when the Fed eventually begins to raise the federal funds rate, a relatively defensive maturity-management strategy may enable the funds to capture higher yields more quickly as they become available.
| |
| | An investment in the funds is not insured or guaranteed by the |
| | FDIC or any other government agency. Although the funds seek to |
| | preserve the value of your investment at $1.00 per share, it is |
| | possible to lose money by investing in the funds. |
| | Short-term corporate, asset-backed securities holdings and municipal |
| | securities holdings (as applicable), while rated in the highest rating |
| | category by one or more NRSRO (or unrated, if deemed of |
| | comparable quality by Dreyfus), involve credit and liquidity risks |
| | and risk of principal loss. |
| 1 | Annualized effective yield is based upon dividends declared daily and |
| | reinvested monthly. Past performance is no guarantee of future results. |
| | Yields fluctuate. For the national funds, income may be subject to state |
| | and local taxes. For the NewYork and California funds, income may be |
| | subject to state and local taxes for out-of-state residents. For each non- |
| | AMT-Free fund, some income may be subject to the federal alternative |
| | minimum tax (AMT). |
| 2 | Yields provided reflect the absorption of certain fund expenses by The |
| | Dreyfus Corporation pursuant to an undertaking, which is voluntary |
| | and temporary, not contractual, and can be terminated at any time |
| | without notice. Had these expenses not been absorbed, funds’ yields |
| | would have been lower, and in some cases, 7-day yields during the |
| | reporting period would have been negative absent the expense absorption. |
6
UNDERSTANDING YOUR FUND’S EXPENSES (Unaudited)
As a mutual fund investor, you pay ongoing expenses, such as management fees and other expenses. Using the information below, you can estimate how these expenses affect your investment and compare them with the expenses of other funds.You also may pay one-time transaction expenses, including sales charges (loads) and redemptions fees, which are not shown in this section and would have resulted in higher total expenses. For more information, see your fund's prospectus or talk to your financial adviser.
Review your fund’s expenses
The table below shows the expenses you would have paid on a $1,000 investment in each class of each fund from February 1, 2010 to July 31, 2010. It also shows how much a $1,000 investment would be worth at the close of the period, assuming actual returns and expenses.
| | | | | | | | | |
| Expenses and Value of a $1,000 Investment | | | | | | | |
| assuming actual returns for the six months ended July 31, 2010 | | | | | | |
| | Institutional | Investor | Administrative | Participant | Service | Select | Agency | Premier | Classic |
| Dreyfus Cash | | | | | | | | | |
| Management | | | | | | | | | |
| Expenses paid | | | | | | | | | |
| per $1,000† | $ 1.04 | $ 1.59 | $ 1.49 | $ 1.64 | — | — | $ 1.34 | — | — |
| Ending value | | | | | | | | | |
| (after expenses) | $1,000.60 | $1,000.00 | $1,000.10 | $1,000.00 | �� | — | $1,000.30 | — | — |
| Dreyfus Cash | | | | | | | | | |
| Management | | | | | | | | | |
| Plus, Inc. | | | | | | | | | |
| Expenses paid | | | | | | | | | |
| per $1,000† | $ .74 | $ 1.59 | $ 1.24 | $ 1.59 | $ 1.49 | $ 1.59 | $ 1.04 | — | — |
| Ending value | | | | | | | | | |
| (after expenses) | $1,000.80 | $1,000.00 | $1,000.30 | $1,000.00 | $1,000.00 | $1,000.00 | $1,000.50 | — | — |
| Dreyfus | | | | | | | | | |
| Government Cash | | | | | | | | | |
| Management | | | | | | | | | |
| Expenses paid | | | | | | | | | |
| per $1,000† | $ 1.04 | $ 1.19 | $ 1.19 | $ 1.19 | — | — | $ 1.19 | — | — |
| Ending value | | | | | | | | | |
| (after expenses) | $1,000.20 | $1,000.00 | $1,000.00 | $1,000.00 | — | — | $1,000.00 | — | — |
| Dreyfus | | | | | | | | | |
| Government Prime | | | | | | | | | |
| Cash Management | | | | | | | | | |
| Expenses paid | | | | | | | | | |
| per $1,000† | $ .99 | $ 1.04 | $ 1.04 | $ 1.04 | — | — | $ .99 | — | — |
| Ending value | | | | | | | | | |
| (after expenses) | $1,000.00 | $1,000.00 | $1,000.00 | $1,000.00 | — | — | $1,000.00 | — | — |
| Dreyfus Treasury & | | | | | | | | | |
| Agency Cash | | | | | | | | | |
| Management | | | | | | | | | |
| Expenses paid | | | | | | | | | |
| per $1,000† | $ .94 | $ .99 | $ .94 | $ .94 | $ .94 | $ .94 | $ .94 | $ .94 | — |
| Ending value | | | | | | | | | |
| (after expenses) | $1,000.00 | $1,000.00 | $1,000.00 | $1,000.00 | $1,000.00 | $1,000.00 | $1,000.00 | $1,000.00 | — |
| Dreyfus | | | | | | | | | |
| Treasury Prime | | | | | | | | | |
| Cash Management | | | | | | | | | |
| Expenses paid | | | | | | | | | |
| per $1,000† | $ .64 | $ .64 | $ .64 | $ .64 | — | — | $ .55 | — | — |
| Ending value | | | | | | | | | |
| (after expenses) | $1,000.00 | $1,000.00 | $1,000.00 | $1,000.00 | — | — | $1,000.00 | — | — |
| Dreyfus | | | | | | | | | |
| Municipal Cash | | | | | | | | | |
| Management Plus | | | | | | | | | |
| Expenses paid | | | | | | | | | |
| per $1,000† | $ 1.19 | $ 1.79 | $ 1.64 | $ 1.83 | — | — | $ 1.49 | — | — |
| Ending value | | | | | | | | | |
| (after expenses) | $1,000.70 | $1,000.00 | $1,000.20 | $1,000.00 | — | — | $1,000.30 | — | — |
UNDERSTANDING YOUR FUND’S EXPENSES (Unaudited) (continued)
| | | | | | | | | |
| Expenses and Value of a $1,000 Investment (continued) | | | | | | |
| assuming actual returns for the six months ended July 31, 2010 | | | | | | |
| | Institutional | Investor | Administrative | Participant | Service | Select | Agency | Premier | Classic |
| Dreyfus | | | | | | | | | |
| New York | | | | | | | | | |
| Municipal Cash | | | | | | | | | |
| Management | | | | | | | | | |
| Expenses paid | | | | | | | | | |
| per $1,000† | $ 1.19 | $ 1.79 | $ 1.64 | $ 1.79 | — | — | $ 1.44 | — | — |
| Ending value | | | | | | | | | |
| (after expenses) | $1,000.60 | $1,000.00 | $1,000.20 | $1,000.00 | — | — | $1,000.30 | — | — |
| Dreyfus | | | | | | | | | |
| Tax Exempt Cash | | | | | | | | | |
| Management | | | | | | | | | |
| Expenses paid | | | | | | | | | |
| per $1,000† | $ 1.14 | $ 1.54 | $ 1.49 | $ 1.54 | — | — | $ 1.29 | — | — |
| Ending value | | | | | | | | | |
| (after expenses) | $1,000.50 | $1,000.10 | $1,000.10 | $1,000.10 | — | — | $1,000.20 | — | — |
| Dreyfus California | | | | | | | | | |
| AMT-Free | | | | | | | | | |
| Municipal Cash | | | | | | | | | |
| Management | | | | | | | | | |
| Expenses paid | | | | | | | | | |
| per $1,000† | $ 1.19 | $ 1.93 | $ 1.69 | $ 1.88 | — | — | $ 1.49 | — | — |
| Ending value | | | | | | | | | |
| (after expenses) | $1,000.70 | $1,000.00 | $1,000.20 | $1,000.00 | — | — | $1,000.40 | — | — |
| Dreyfus New York | | | | | | | | | |
| AMT-Free | | | | | | | | | |
| Municipal Cash | | | | | | | | | |
| Management | | | | | | | | | |
| Expenses paid | | | | | | | | | |
| per $1,000† | $ .99 | $ 1.74 | $ 1.49 | $ 1.74 | — | — | — | — | $ 1.69 |
| Ending value | | | | | | | | | |
| (after expenses) | $1,000.80 | $1,000.00 | $1,000.30 | $1,000.00 | — | — | — | — | $1,000.00 |
|
| † Expenses are equal to Dreyfus Cash Management’s annualized expense ratio of .21% for Institutional Shares, .32% for Investor Shares, .30% for Administrative Shares, .33% for |
| Participant Shares and .27% for Agency Shares, Dreyfus Cash Management Plus, Inc 15% for Institutional Shares, .32% for Investor Shares, .25% for Administrative Shares, .32% |
| for Participant Shares, .30% for Service Shares, .32% for Select Shares and .21% for Agency Shares, Dreyfus Government Cash Management .21% for Institutional Shares, .24% for |
| Investor Shares, .24% for Administrative Shares, .24% for Participant Shares and .24% for Agency Shares, Dreyfus Government Prime Cash Management .20% for Institutional |
| Shares, .21% for Investor Shares, .21% for Administrative Shares, .21% for Participant Shares and .20% for Agency Shares, Dreyfus Treasury & Agency Cash Management .19% for |
| Institutional Shares, .20% for Investor Shares, .19% for Administrative Shares, .19% for Participant Shares, 19% for Service Shares, .19% for Select Shares, .19% for Agency Shares |
| and .19% for Premier Shares, Dreyfus Treasury Prime Cash Management .13% for Institutional Shares, .13% for Investor Shares, .13% for Administrative Shares, .13% for |
| Participant Shares and .11% for Agency Shares, Dreyfus Municipal Cash Management Plus .24% for Institutional Shares, .36% for Investor Shares, .33% for Administrative Shares, |
| .37% for Participant Shares and .30% for Agency Shares, Dreyfus NewYork Municipal Cash Management .24% for Institutional Shares, .36% for Investor Shares, .33% for |
| Administrative Shares, .36% for Participant Shares and .29% for Agency Shares, Dreyfus Tax Exempt Cash Management .23% for Institutional Shares, .31% for Investor Shares, |
| .30% for Administrative Shares, .31% for Participant Shares and .26% for Agency Shares, Dreyfus California AMT-Free Municipal Cash Management .24% for Institutional Shares, |
| .39% for Investor Shares, .34% for Administrative Shares, .38% for Participant Shares and .30% for Agency Shares, Dreyfus NewYork AMT-Free Municipal Cash Management |
| .20% for Institutional Shares, .35% for Investor Shares, .30% for Administrative Shares, .35% for Participant Shares and .34% for Classic shares; multiplied by the respective fund’s |
| average account value over the period, multiplied by 181/365 (to reflect the one-half year period). |
8
COMPARING YOUR FUND’S EXPENSES
WITH THOSE OF OTHER FUNDS (Unaudited)
Using the SEC’s method to compare expenses
The Securities and Exchange Commission (SEC) has established guidelines to help investors assess fund expenses. Per these guidelines, the table below shows your fund's expenses based on a $1,000 investment, assuming a hypothetical 5% annualized return.You can use this information to compare the ongoing expenses (but not transaction expenses or total cost) of investing in the fund with those of other funds. All mutual fund shareholder reports will provide this information to help you make this comparison. Please note that you cannot use this information to estimate your actual ending account balance and expenses paid during the period.
| | | | | | | | | |
| Expenses and Value of a $1,000 Investment | | | | | | | |
| assuming a hypothetical 5% annualized return for the six months ended July 31, 2010 | | | | |
| | Institutional | Investor | Administrative | Participant | Service | Select | Agency | Premier | Classic |
| Dreyfus Cash | | | | | | | | | |
| Management | | | | | | | | | |
| Expenses paid | | | | | | | | | |
| per $1,000† | $ 1.05 | $ 1.61 | $ 1.51 | $ 1.66 | — | — | $ 1.35 | — | — |
| Ending value | | | | | | | | | |
| (after expenses) | $1,023.75 | $1,023.21 | $1,023.31 | $1,023.16 | — | — | $1,023.46 | — | — |
| Dreyfus Cash | | | | | | | | | |
| Management | | | | | | | | | |
| Plus, Inc. | | | | | | | | | |
| Expenses paid | | | | | | | | | |
| per $1,000† | $ .75 | $ 1.61 | $ 1.25 | $ 1.61 | $ 1.51 | $ 1.61 | $ 1.05 | — | — |
| Ending value | | | | | | | | | |
| (after expenses) | $1,024.05 | $1,023.21 | $1,023.55 | $1,023.21 | $1,023.31 | $1,023.21 | $1,023.75 | — | — |
| Dreyfus | | | | | | | | | |
| Government Cash | | | | | | | | | |
| Management | | | | | | | | | |
| Expenses paid | | | | | | | | | |
| per $1,000† | $ 1.05 | $ 1.20 | $ 1.20 | $ 1.20 | — | — | $ 1.20 | — | — |
| Ending value | | | | | | | | | |
| (after expenses) | $1,023.75 | $1,023.60 | $1,023.60 | $1,023.60 | — | — | $1,023.60 | — | — |
| Dreyfus | | | | | | | | | |
| Government Prime | | | | | | | | | |
| Cash Management | | | | | | | | | |
| Expenses paid | | | | | | | | | |
| per $1,000† | $ 1.00 | $ 1.05 | $ 1.05 | $ 1.05 | — | — | $ 1.00 | — | — |
| Ending value | | | | | | | | | |
| (after expenses) | $1,023.80 | $1,023.75 | $1,023.75 | $1,023.75 | — | — | $1,023.80 | — | — |
| Dreyfus Treasury & | | | | | | | | | |
| Agency Cash | | | | | | | | | |
| Management | | | | | | | | | |
| Expenses paid | | | | | | | | | |
| per $1,000† | $ .95 | $ 1.00 | $ .95 | $ .95 | $ .95 | $ .95 | $ .95 | $ .95 | — |
| Ending value | | | | | | | | | |
| (after expenses) | $1,023.85 | $1,023.80 | $1,023.85 | $1,023.85 | $1,023.85 | $1,023.85 | $1,023.85 | $1,023.85 | — |
| Dreyfus | | | | | | | | | |
| Treasury Prime | | | | | | | | | |
| Cash Management | | | | | | | | | |
| Expenses paid | | | | | | | | | |
| per $1,000† | $ .65 | $ .65 | $ .65 | $ .65 | — | — | $ .55 | — | — |
| Ending value | | | | | | | | | |
| (after expenses) | $1,024.15 | $1,024.15 | $1,024.15 | $1,024.15 | — | — | $1,024.25 | — | — |
| Dreyfus | | | | | | | | | |
| Municipal Cash | | | | | | | | | |
| Management Plus | | | | | | | | | |
| Expenses paid | | | | | | | | | |
| per $1,000† | $ 1.20 | $ 1.81 | $ 1.66 | $ 1.86 | — | — | $ 1.51 | — | — |
| Ending value | | | | | | | | | |
| (after expenses) | $1,023.60 | $1,023.01 | $1,023.16 | $1,022.96 | — | — | $1,023.31 | — | — |
COMPARING YOUR FUND’S EXPENSES WITH THOSE OF OTHER FUNDS (Unaudited) (continued)
| | | | | | | | | |
| Expenses and Value of a $1,000 Investment (continued) | | | | | | |
| assuming a hypothetical 5% annualized return for the six months ended July 31, 2010 | | | | | |
| | Institutional | Investor | Administrative | Participant | Service | Select | Agency | Premier | Classic |
| Dreyfus | | | | | | | | | |
| New York | | | | | | | | | |
| Municipal Cash | | | | | | | | | |
| Management | | | | | | | | | |
| Expenses paid | | | | | | | | | |
| per $1,000† | $ 1.20 | $ 1.81 | $ 1.66 | $ 1.81 | — | — | $ 1.45 | — | — |
| Ending value | | | | | | | | | |
| (after expenses) | $1,023.60 | $1,023.01 | $1,023.16 | $1,023.01 | — | — | $1,023.36 | — | — |
| Dreyfus | | | | | | | | | |
| Tax Exempt Cash | | | | | | | | | |
| Management | | | | | | | | | |
| Expenses paid | | | | | | | | | |
| per $1,000† | $ 1.15 | $ 1.56 | $ 1.51 | $ 1.56 | — | — | $ 1.30 | — | — |
| Ending value | | | | | | | | | |
| (after expenses) | $1,023.65 | $1,023.26 | $1,023.31 | $1,023.26 | — | — | $1,023.51 | — | — |
| Dreyfus California | | | | | | | | | |
| AMT-Free | | | | | | | | | |
| Municipal Cash | | | | | | | | | |
| Management | | | | | | | | | |
| Expenses paid | | | | | | | | | |
| per $1,000† | $ 1.20 | $ 1.96 | $ 1.71 | $ 1.91 | — | — | $ 1.51 | — | — |
| Ending value | | | | | | | | | |
| (after expenses) | $1,023.60 | $1,022.86 | $1,023.11 | $1,022.91 | — | — | $1,023.31 | — | — |
| Dreyfus New York | | | | | | | | | |
| AMT-Free | | | | | | | | | |
| Municipal Cash | | | | | | | | | |
| Management | | | | | | | | | |
| Expenses paid | | | | | | | | | |
| per $1,000† | $ 1.00 | $ 1.76 | $ 1.51 | $ 1.76 | — | — | — | — | $ 1.71 |
| Ending value | | | | | | | | | |
| (after expenses) | $1,023.80 | $1,023.06 | $1,023.31 | $1,023.06 | — | — | — | — | $1,023.11 |
|
| † Expenses are equal to Dreyfus Cash Management’s annualized expense ratio of .21% for Institutional Shares, .32% for Investor Shares, .30% for Administrative Shares, .33% for |
| Participant Shares and .27% for Agency Shares, Dreyfus Cash Management Plus, Inc 15% for Institutional Shares, .32% for Investor Shares, .25% for Administrative Shares, .32% |
| for Participant Shares, .30% for Service Shares, .32% for Select Shares and .21% for Agency Shares, Dreyfus Government Cash Management .21% for Institutional Shares, .24% for |
| Investor Shares, .24% for Administrative Shares, .24% for Participant Shares and .24% for Agency Shares, Dreyfus Government Prime Cash Management .20% for Institutional |
| Shares, .21% for Investor Shares, .21% for Administrative Shares, .21% for Participant Shares and .20% for Agency Shares, Dreyfus Treasury & Agency Cash Management .19% for |
| Institutional Shares, .20% for Investor Shares, .19% for Administrative Shares, .19% for Participant Shares, 19% for Service Shares, .19% for Select Shares, .19% for Agency Shares |
| and .19% for Premier Shares, Dreyfus Treasury Prime Cash Management .13% for Institutional Shares, .13% for Investor Shares, .13% for Administrative Shares, .13% for |
| Participant Shares and .11% for Agency Shares, Dreyfus Municipal Cash Management Plus .24% for Institutional Shares, .36% for Investor Shares, .33% for Administrative Shares, |
| .37% for Participant Shares and .30% for Agency Shares, Dreyfus NewYork Municipal Cash Management .24% for Institutional Shares, .36% for Investor Shares, .33% for |
| Administrative Shares, .36% for Participant Shares and .29% for Agency Shares, Dreyfus Tax Exempt Cash Management .23% for Institutional Shares, .31% for Investor Shares, |
| .30% for Administrative Shares, .31% for Participant Shares and .26% for Agency Shares, Dreyfus California AMT-Free Municipal Cash Management .24% for Institutional Shares, |
| .39% for Investor Shares, .34% for Administrative Shares, .38% for Participant Shares and .30% for Agency Shares, Dreyfus NewYork AMT-Free Municipal Cash Management |
| .20% for Institutional Shares, .35% for Investor Shares, .30% for Administrative Shares, .35% for Participant Shares and .34% for Classic shares; multiplied by the respective fund’s |
| average account value over the period, multiplied by 181/365 (to reflect the one-half year period). |
10
STATEMENT OF INVESTMENTS
July 31, 2010 (Unaudited)
| | |
| | Principal | |
| Dreyfus Cash Management | Amount ($) | Value ($) |
| Negotiable Bank Certificates of Deposit—46.3% | | |
| Banco Bilbao Vizcaya Argentaria | | |
| 0.43%, 8/16/10 | 55,000,000 a | 55,000,000 |
| Banco Bilbao Vizcaya Argentaria (Yankee) | | |
| 0.55%, 8/2/10 | 340,500,000 | 340,500,095 |
| Banco Santander SA (Yankee) | | |
| 0.75%—0.80%, 8/9/10—8/16/10 | 1,050,000,000 | 1,050,000,000 |
| Bank of Tokyo-Mitsubishi Ltd. (Yankee) | | |
| 0.40%—0.55%, 8/6/10—10/1/10 | 1,060,500,000 | 1,060,500,000 |
| Barclays Bank (Yankee) | | |
| 0.50%—0.70%, 8/23/10—1/18/11 | 835,000,000 | 835,000,000 |
| BNP Paribas (Yankee) | | |
| 0.60%, 9/2/10—10/12/10 | 950,000,000 | 950,000,000 |
| Canadian Imperial Bank of Commerce (Yankee) | | |
| 0.36%, 8/6/10 | 300,000,000 | 300,000,000 |
| Citibank N.A. | | |
| 0.35%, 8/25/10 | 500,000,000 | 500,000,000 |
| Credit Agricole CIB (Yankee) | | |
| 0.40%—0.66%, 8/6/10—10/8/10 | 1,300,000,000 | 1,300,000,000 |
| Fortis Bank SA/NV (Yankee) | | |
| 0.61%, 10/4/10 | 350,500,000 | 350,500,000 |
| ING Bank (London) | | |
| 0.52%, 10/25/10 | 160,000,000 | 160,000,000 |
| Lloyds TSB Bank (Yankee) | | |
| 0.50%, 8/19/10 | 670,000,000 | 670,000,000 |
| Natixis (Yankee) | | |
| 0.70%, 10/4/10—10/7/10 | 1,195,500,000 | 1,195,500,000 |
| Rabobank Nederland (Yankee) | | |
| 0.50%, 1/24/11 | 250,000,000 | 250,000,000 |
| Royal Bank of Scotland PLC (Yankee) | | |
| 0.50%—0.60%, 8/12/10—9/7/10 | 1,400,000,000 | 1,400,000,000 |
| Societe Generale (Yankee) | | |
| 0.40%—0.53%, 8/6/10—10/18/10 | 1,000,000,000 | 1,000,000,000 |
| Sumitomo Mitsui Banking Corporation (Yankee) | | |
| 0.54%, 9/7/10 | 300,000,000 b | 300,000,000 |
| UBS (Yankee) | | |
| 0.33%—0.75%, 8/5/10—1/27/11 | 1,150,000,000 | 1,150,000,000 |
| Unicredit Bank AG (Yankee) | | |
| 0.75%, 10/12/10 | 200,000,000 | 200,000,000 |
| Westpac Capital Corp. | | |
| 0.40%, 8/10/10 | 250,000,000 a | 250,000,000 |
| Total Negotiable Bank Certificates of Deposit | | |
| (cost $13,317,000,095) | | 13,317,000,095 |
| |
| Commercial Paper—8.2% | | |
| Abbey National NA | | |
| 0.20%, 8/2/10 | 250,000,000 | 249,998,611 |
| ANZ International Ltd. | | |
| 0.53%, 9/15/10 | 50,000,000 b | 49,966,875 |
STATEMENT OF INVESTMENTS (Unaudited) (continued)
| | |
| | Principal | |
| Dreyfus Cash Management (continued) | Amount ($) | Value ($) |
| |
| Commercial Paper (continued) | | |
| Bank of New Zealand | | |
| 0.51%, 8/20/10 | 250,000,000 | 249,932,708 |
| General Electric Capital Corp. | | |
| 0.30%—0.31%, 8/9/10—8/24/10 | 450,000,000 | 449,963,431 |
| General Electric Capital Services Inc. | | |
| 0.31%, 8/24/10 | 125,000,000 | 124,975,243 |
| NRW Bank | | |
| 0.49%—0.50%, 8/23/10—10/13/10 | 630,500,000 b | 630,189,521 |
| Skandinaviska Enskilda Banken AB | | |
| 0.59%, 10/13/10 | 100,000,000 b | 99,880,361 |
| Societe Generale N.A. Inc. | | |
| 0.50%—0.64%, 10/4/10—11/1/10 | 240,000,000 | 239,714,333 |
| Westpac Banking | | |
| 0.49%, 8/7/10 | 125,000,000 a,b | 125,008,888 |
| Westpac Securities NZ Ltd. | | |
| 0.35%, 8/6/10 | 150,000,000 b | 149,992,708 |
| Total Commercial Paper | | |
| (cost $2,369,622,679) | | 2,369,622,679 |
| |
| Asset-Backed Commercial Paper—4.9% | | |
| Atlantis One Funding Corp. | | |
| 0.20%—0.51%, 8/2/10—9/7/10 | 950,000,000 b | 949,916,930 |
| CHARTA | | |
| 0.50%, 8/23/10 | 35,000,000 b | 34,989,306 |
| CIESCO | | |
| 0.30%, 8/5/10 | 80,000,000 b | 79,997,333 |
| CRC Funding LLC | | |
| 0.30%—0.31%, 8/5/10—8/9/10 | 340,000,000 b | 339,981,556 |
| Total Asset-Backed Commercial Paper | | |
| (cost $1,404,885,125) | | 1,404,885,125 |
| |
| Corporate Notes—5.3% | | |
| Bank of America Securities LLC | | |
| 0.36%, 8/2/10 | 625,000,000 | 625,000,000 |
| Barclays Bank | | |
| 0.78%, 8/26/10 | 400,000,000 a | 400,000,000 |
| Credit Suisse | | |
| 0.68%, 8/19/10 | 500,000,000 a | 500,000,000 |
| Total Corporate Notes | | |
| (cost $1,525,000,000) | | 1,525,000,000 |
| |
| Short-Term Bank Notes—2.4% | | |
| Bank of America N.A. | | |
| 0.60%, 1/21/11 | 300,000,000 | 300,000,000 |
| Chase Bank USA NA | | |
| 0.35%, 8/13/10 | 400,000,000 | 400,000,000 |
| Total Short-Term Bank Notes | | |
| (cost $700,000,000) | | 700,000,000 |
12
| | |
| | Principal | |
| Dreyfus Cash Management (continued) | Amount ($) | Value ($) |
| |
| Time Deposits—16.8% | | |
| Allied Irish Banks (Grand Cayman) | | |
| 0.65%, 8/2/10 | 500,000,000 | 500,000,000 |
| Bank of Ireland (Dublin) | | |
| 0.65%, 8/2/10 | 350,000,000 | 350,000,000 |
| Commerzbank (Grand Cayman) | | |
| 0.22%, 8/2/10 | 1,000,000,000 | 1,000,000,000 |
| DZ Bank AG (Grand Cayman) | | |
| 0.22%, 8/2/10 | 700,000,000 | 700,000,000 |
| KBC Bank (Grand Cayman) | | |
| 0.16%, 8/2/10 | 500,000,000 | 500,000,000 |
| Landesbank Hessen-Thuringen | | |
| Girozentrale (Grand Cayman) | | |
| 0.22%, 8/2/10 | 200,000,000 | 200,000,000 |
| Nordea Bank Finland (Grand Cayman) | | |
| 0.20%, 8/2/10 | 400,000,000 | 400,000,000 |
| State Street Bank and Trust Co. (Grand Cayman) | | |
| 0.17%, 8/2/10 | 794,000,000 | 794,000,000 |
| Svenska Handelsbanken (Grand Cayman) | | |
| 0.19%, 8/2/10 | 400,000,000 | 400,000,000 |
| Total Time Deposits | | |
| (cost $4,844,000,000) | | 4,844,000,000 |
| |
| |
| U.S. Government Agencies—5.2% | | |
| Federal Home Loan Bank | | |
| 0.30%, 8/19/11 | 500,000,000 a | 500,000,000 |
| Federal Home Loan Mortgage Corp. | | |
| 0.51%, 10/16/10 | 1,000,000,000 a,c | 1,000,000,000 |
| Total U.S. Government Agencies | | |
| (cost $1,500,000,000) | | 1,500,000,000 |
| |
| |
| Repurchase Agreements—10.9% | | |
| Citigroup Global Markets Holdings Inc. | | |
| 0.36%, dated 7/30/10, due 8/2/10 in the amount of | | |
| $150,004,500 (fully collateralized by $170,332,848 | | |
| Corporate Bonds, 0%-12.75%, due 1/15/12-3/25/35, | | |
| value $156,215,414) | 150,000,000 | 150,000,000 |
| Credit Agricole | | |
| 0.20%, dated 7/30/10, due 8/2/10 in the amount of | | |
| $600,010,000 (fully collateralized by $464,593,000 | | |
| Federal Home Loan Mortgage Corp., 1.45%, due 8/3/10, | | |
| value $466,267,471 and $145,302,000 Federal National | | |
| Mortgage Association, 1.50%, due 6/1/12, value $145,732,578) | 600,000,000 | 600,000,000 |
| Credit Suisse Securities LLC | | |
| 0.20%-0.21%, dated 7/30/10, due 8/2/10 in the amount of | | |
| $270,004,558 (fully collateralized by $47,720,000 Federal Home | | |
| Loan Bank, 0%, due 8/2/10-9/29/10, value $47,715,847, $23,700,000 | | |
| Federal National Mortgage Association, 0%, due 11/22/10, | | |
| value $23,685,780 and $204,600,000 U.S. Treasury Bills, | | |
| due 7/28/11, value $204,002,574) | 270,000,000 | 270,000,000 |
STATEMENT OF INVESTMENTS (Unaudited) (continued)
| | |
| | Principal | |
| Dreyfus Cash Management (continued) | Amount ($) | Value ($) |
| |
| Repurchase Agreements (continued) | | |
| Deutsche Bank Securities Inc. | | |
| 0.20%-0.27%, dated 7/30/10, due 8/2/10 in the amount of | | |
| $1,100,018,917 (fully collateralized by $102,013,302 | | |
| Commercial Paper, 0%, due 8/2/10-9/1/10, value $102,000,000, | | |
| $158,906,000 Federal Farm Credit Bank, 1.375%-5.125%, | | |
| due 10/17/12-8/25/16, value $173,221,581, $634,387,000 | | |
| Federal Home Loan Bank, 0%-5.25%, due 9/30/10-6/17/13, | | |
| value $655,891,335 and $182,357,000 Federal National Mortgage | | |
| Association, 3%-4.875%, due 5/18/12-10/29/14, value $190,887,441) | 1,100,000,000 | 1,100,000,000 |
| HSBC USA Inc. | | |
| 0.33%, dated 7/30/10, due 8/2/10 in the amount of $80,002,200 | | |
| (fully collateralized by $88,827,000 Corporate Bonds, 0%-8.62%, | | |
| due 4/1/11-12/30/49, value $82,435,357) | 80,000,000 | 80,000,000 |
| RBC Capital Markets | | |
| 0.335%, dated 7/30/10, due 8/2/10 in the amount of $440,012,283 | | |
| (fully collateralized by $185,000,000 Certificates of Deposit, 0%-7%, | | |
| due 8/13/10-12/21/39, value $184,246,010, $80,962,044 Commercial | | |
| Paper, 0%, due 8/10/10-8/17/10, value $80,953,990 and $180,998,227 | | |
| Corporate Bonds, 1.69%-6.63%, due 4/1/11-12/15/65, value $185,446,213) | 440,000,000 | 440,000,000 |
| RBS Securities, Inc. | | |
| 0.21%, dated 7/30/10, due 8/2/10 in the amount of $500,008,750 | | |
| (fully collateralized by $458,050,000 U.S. Treasury Bonds, 4.625%, | | |
| due 2/15/40, value $510,002,418) | 500,000,000 | 500,000,000 |
| Total Repurchase Agreements | | |
| (cost $3,140,000,000) | | 3,140,000,000 |
| |
| Total Investments (cost $28,800,507,899) | 100.0% | 28,800,507,899 |
| |
| Cash and Receivables (Net) | .0% | 755,183 |
| |
| Net Assets | 100.0% | 28,801,263,082 |
|
| a Variable rate security—interest rate subject to periodic change. |
| b Securities exempt from registration under Rule 144A of the Securities Act of 1933.These securities may be resold in transactions exempt from registration, normally to qualified |
| institutional buyers. At July 31, 2010, these securities amounted to $2,759,923,478 or 9.6% of net assets. |
| c On September 7, 2008, the Federal Housing Finance Agency (“FHFA”) placed Federal National Mortgage Association and Federal Home Loan Mortgage Corporation into |
| conservatorship with FHFA as the conservator. As such, the FHFA will oversee the continuing affairs of these companies. |
| | | |
| Portfolio Summary (Unaudited)† | | | |
| |
| | Value (%) | | Value (%) |
| Banking | 79.1 | Asset-Backed/Multi-Seller Programs | 1.6 |
| Repurchase Agreements | 10.9 | Foreign/Governmental | 1.2 |
| U.S. Government Agencies | 5.2 | | |
| Finance | 2.0 | | 100.0 |
| |
| † Based on net assets. | | | |
| See notes to financial statements. | | | |
14
STATEMENT OF INVESTMENTS
July 31, 2010 (Unaudited)
| | |
| | Principal | |
| Dreyfus Cash Management Plus, Inc. | Amount ($) | Value ($) |
| Negotiable Bank Certificates of Deposit—42.1% | | |
| Banco Bilbao Vizcaya Argentaria (Yankee) | | |
| 0.55%, 8/2/10 | 200,000,000 | 200,000,056 |
| Banco Santander SA (Yankee) | | |
| 0.75%, 8/16/10 | 175,000,000 | 175,000,000 |
| Barclays Bank (Yankee) | | |
| 0.70%, 1/19/11 | 250,000,000 | 250,000,000 |
| Canadian Imperial Bank of Commerce (Yankee) | | |
| 0.36%, 8/6/10 | 200,000,000 | 200,000,000 |
| Citibank N.A. | | |
| 0.35%, 8/25/10 | 50,000,000 | 50,000,000 |
| Credit Agricole CIB (Yankee) | | |
| 0.40%, 8/6/10 | 250,000,000 | 250,000,000 |
| DZ Bank AG (Yankee) | | |
| 0.40%, 8/2/10 | 190,500,000 | 190,500,000 |
| Fortis Bank SA/NV (Yankee) | | |
| 0.45%, 10/22/10 | 100,000,000 | 100,000,000 |
| ING Bank (London) | | |
| 0.50%—0.52%, 8/23/10—10/25/10 | 250,000,000 | 250,000,000 |
| Lloyds TSB Bank (Yankee) | | |
| 0.50%—0.53%, 8/19/10—10/8/10 | 250,000,000 | 250,000,000 |
| Natixis (Yankee) | | |
| 0.70%, 10/4/10—10/7/10 | 150,000,000 | 150,000,000 |
| Royal Bank of Scotland PLC (Yankee) | | |
| 0.50%—0.51%, 8/12/10—10/25/10 | 250,000,000 | 250,000,000 |
| Societe Generale (Yankee) | | |
| 0.40%—0.53%, 8/6/10—10/18/10 | 125,000,000 | 125,000,000 |
| UBS (Yankee) | | |
| 0.75%, 1/27/11 | 200,000,000 | 200,000,000 |
| Total Negotiable Bank Certificates of Deposit | | |
| (cost $2,640,500,056) | | 2,640,500,056 |
| |
| Commercial Paper—21.5% | | |
| Abbey National North America LLC | | |
| 0.20%, 8/2/10 | 100,000,000 | 99,999,444 |
| ANZ International Ltd. | | |
| 0.53%, 9/15/10 | 250,000,000 a | 249,834,375 |
| BPCE | | |
| 0.40%, 8/4/10 | 100,000,000 | 99,996,667 |
| Commonwealth Bank of Australia | | |
| 0.48%, 9/1/10 | 150,000,000 a | 149,938,000 |
| Fortis Funding LLC | | |
| 0.65%, 9/13/10 | 150,000,000 a | 149,883,542 |
| General Electric Capital Corp. | | |
| 0.31%, 8/24/10 | 250,000,000 | 249,950,486 |
| Societe Generale N.A. Inc. | | |
| 0.50%—0.64%, 10/4/10—11/1/10 | 150,000,000 | 149,815,333 |
STATEMENT OF INVESTMENTS (Unaudited) (continued)
| | |
| | Principal | |
| Dreyfus Cash Management Plus, Inc. (continued) | Amount ($) | Value ($) |
| |
| Commercial Paper (continued) | | |
| Westpac Securities NZ Ltd. | | |
| 0.35%—0.52%, 8/6/10—9/3/10 | 200,000,000 a | 199,926,069 |
| Total Commercial Paper | | |
| (cost $1,349,343,916) | | 1,349,343,916 |
| |
| |
| Asset-Backed Commercial Paper—6.4% | | |
| Atlantis One Funding Corp. | | |
| 0.20%, 8/2/10 | 100,000,000 a | 99,999,444 |
| CHARTA | | |
| 0.50%, 8/23/10 | 100,000,000 a | 99,969,445 |
| Govco | | |
| 0.50%, 8/17/10 | 200,000,000 a | 199,955,556 |
| Total Asset-Backed Commercial Paper | | |
| (cost $399,924,445) | | 399,924,445 |
| |
| |
| Corporate Note—4.4% | | |
| Bank of America Securities LLC | | |
| 0.36%, 8/2/10 | | |
| (cost $275,000,000) | 275,000,000 | 275,000,000 |
| |
| |
| Time Deposits—7.2% | | |
| Commerzbank (Grand Cayman) | | |
| 0.22%, 8/2/10 | 250,000,000 | 250,000,000 |
| Nordea Bank Finland (Grand Cayman) | | |
| 0.20%, 8/2/10 | 200,000,000 | 200,000,000 |
| Total Time Deposits | | |
| (cost $450,000,000) | | 450,000,000 |
| |
| |
| Repurchase Agreements—18.2% | | |
| Barclays Capital, Inc. | | |
| 0.21%, dated 7/30/10, due 8/2/10 in the amount of $93,001,628 | | |
| (fully collateralized by $92,134,800 U.S. Treasury Notes, 3.13%, | | |
| due 5/15/19, value $94,860,037) | 93,000,000 | 93,000,000 |
| BNP Paribas | | |
| 0.19%, dated 7/30/10, due 8/2/10 in the amount of $200,003,167 | | |
| (fully collateralized by $171,462,900 U.S. Treasury Inflation Protected | | |
| Securities, 1.63%-3.88%, due 1/15/18-4/15/29, value $204,000,034) | 200,000,000 | 200,000,000 |
| Citigroup Global Markets Holdings Inc. | | |
| 0.36%, dated 7/30/10, due 8/2/10 in the amount of $100,003,000 | | |
| (fully collateralized by $191,351,396 Corporate Bonds, 0%-7.55%, | | |
| due 7/6/11-5/25/45, value $103,000,000) | 100,000,000 | 100,000,000 |
| Deutsche Bank Securities Inc. | | |
| 0.27%, dated 7/30/10, due 8/2/10 in the amount of $100,002,250 | | |
| (fully collateralized by $102,015,317 Commercial Paper, 0%, | | |
| due 8/9/10-8/18/10, value $102,000,000) | 100,000,000 | 100,000,000 |
16
| | |
| | Principal | |
| Dreyfus Cash Management Plus, Inc. (continued) | Amount ($) | Value ($) |
| |
| Repurchase Agreements (continued) | | |
| HSBC USA Inc. | | |
| 0.33%, dated 7/30/10, due 8/2/10 in the amount of $100,002,750 | | |
| (fully collateralized by $101,460,000 Corporate Bonds, 0%-2.80%, | | |
| due 4/22/13-12/2/14, value $103,002,779) | 100,000,000 | 100,000,000 |
| JPMorgan Chase & Co. | | |
| 0.33%, dated 7/30/10, due 8/2/10 in the amount of $250,006,875 | | |
| (fully collateralized by $360,068,000 Corporate Bonds, 0%-10.25%, | | |
| due 6/15/11-12/25/42, value $258,238,967) | 250,000,000 | 250,000,000 |
| RBC Capital Markets | | |
| 0.335%, dated 7/30/10, due 8/2/10 in the amount of $150,004,188 | | |
| (fully collateralized by $305,844,489 Corporate Bonds, 0%-13.24%, | | |
| due 9/14/12-8/1/75, value $154,500,000) | 150,000,000 | 150,000,000 |
| TD Securities (USA) LLC | | |
| 0.22%, dated 7/30/10, due 8/2/10 in the amount of $150,002,750 | | |
| (fully collateralized by $151,272,100 U.S. Treasury Notes, 1.38%-2%, | | |
| due 9/30/10-11/15/12, value $153,000,031) | 150,000,000 | 150,000,000 |
| Total Repurchase Agreements | | |
| (cost $1,143,000,000) | | 1,143,000,000 |
| |
| Total Investments (cost $6,257,768,417) | 99.8% | 6,257,768,417 |
| |
| Cash and Receivables (Net) | .2% | 13,495,342 |
| |
| Net Assets | 100.0% | 6,271,263,759 |
|
| a Securities exempt from registration under Rule 144A of the Securities Act of 1933.These securities may be resold in transactions exempt from registration, normally to qualified |
| institutional buyers. At July 31, 2010, these securities amounted to $1,149,506,431 or 18.3% of net assets. |
| | | |
| Portfolio Summary (Unaudited)† | | | |
| |
| | Value (%) | | Value (%) |
| Banking | 76.0 | Asset-Backed/Multi-Seller Programs | 1.6 |
| Repurchase Agreements | 18.2 | | |
| Finance | 4.0 | | 99.8 |
| |
| † Based on net assets. | | | |
| See notes to financial statements. | | | |
STATEMENT OF INVESTMENTS
July 31, 2010 (Unaudited)
| | | |
| | Annualized | | |
| | Yield on | | |
| | Date of | Principal | |
| Dreyfus Government Cash Management | Purchase (%) | Amount ($) | Value ($) |
| |
| U.S. Government Agencies—62.3% | | | |
| Federal Farm Credit Bank: | | | |
| 8/4/10 | 0.40 | 25,000,000 a | 24,945,910 |
| 2/6/12 | 0.44 | 80,000,000 a | 79,887,892 |
| Federal Home Loan Bank: | | | |
| 8/2/10 | 0.39 | 197,500,000 a | 197,500,000 |
| 8/2/10 | 0.44 | 500,000,000 a | 500,000,000 |
| 8/23/10 | 0.32 | 971,250,000 a | 971,191,493 |
| 10/15/10 | 0.44 | 650,000,000 a | 649,685,971 |
| 10/15/10 | 0.45 | 32,900,000 | 32,897,591 |
| 10/15/10 | 0.48 | 1,000,000,000 a | 1,000,000,000 |
| 10/22/10 | 0.19 | 20,000,000 | 19,991,344 |
| 10/28/10 | 0.35 | 100,000,000 | 100,023,366 |
| 11/2/10 | 0.22 | 225,000,000 | 227,281,978 |
| 11/10/10 | 0.32 | 879,000,000 | 878,886,301 |
| 11/10/10 | 0.32 | 25,000,000 | 24,996,707 |
| 11/15/10 | 0.47 | 50,000,000 | 50,082,812 |
| 12/15/10 | 0.28 | 96,492,000 | 96,389,933 |
| 12/22/10 | 0.25 | 200,000,000 | 199,801,389 |
| 1/18/11 | 0.42 | 200,000,000 | 200,296,811 |
| 1/19/11 | 0.24 | 518,000,000 | 517,409,480 |
| 5/25/11 | 0.25 | 560,000,000 a | 560,000,000 |
| 5/27/11 | 0.25 | 500,000,000 a | 500,000,000 |
| 8/17/11 | 0.30 | 500,000,000 a | 499,894,527 |
| Federal Home Loan Mortgage Corp.: | | | |
| 8/19/10 | 0.38 | 305,810,000 a,b | 305,529,552 |
| 9/21/10 | 0.22 | 250,000,000 b | 249,922,083 |
| 10/19/10 | 0.24 | 500,000,000 b | 499,736,667 |
| 10/25/10 | 0.27 | 25,000,000 b | 24,984,063 |
| 10/26/10 | 0.26 | 301,410,000 b | 301,224,929 |
| 10/27/10 | 0.28 | 336,000,000 b | 335,772,640 |
| 11/2/10 | 0.27 | 421,000,000 b | 420,709,207 |
| 11/16/10 | 0.31 | 500,000,000 b | 499,539,306 |
| 11/17/10 | 0.25 | 250,000,000 b | 249,812,500 |
| 11/23/10 | 0.32 | 352,000,000 b | 351,648,880 |
| 12/6/10 | 0.28 | 300,000,000 b | 299,708,958 |
| 12/8/10 | 0.26 | 150,000,000 b | 149,860,250 |
| 12/8/10 | 0.28 | 150,000,000 b | 149,852,188 |
| 12/21/10 | 0.30 | 200,000,000 b | 199,763,333 |
| Federal National Mortgage Association: | | | |
| 9/1/10 | 0.30 | 1,000,000,000 b | 999,741,667 |
| 9/20/10 | 0.25 | 975,000,000 b | 974,661,458 |
| 10/18/10 | 0.26 | 360,000,000 b | 359,797,200 |
| 10/20/10 | 0.27 | 50,000,000 b | 49,970,000 |
| 10/25/10 | 0.27 | 500,000,000 b | 499,681,250 |
| 11/15/10 | 0.33 | 550,000,000 b | 549,465,583 |
| 11/15/10 | 0.38 | 137,731,000 b | 140,222,120 |
| 12/20/10 | 0.25 | 250,000,000 b | 249,755,208 |
| 12/22/10 | 0.25 | 218,000,000 b | 217,783,514 |
| 12/29/10 | 0.25 | 376,442,000 b | 376,056,637 |
| 1/18/11 | 0.30 | 250,000,000 b | 249,645,833 |
| Total U.S. Government Agencies | | | |
| (cost $16,036,008,531) | | | 16,036,008,531 |
18
| | | |
| | Annualized | | |
| | Yield on | | |
| | Date of | Principal | |
| Dreyfus Government Cash Management (continued) | Purchase (%) | Amount ($) | Value ($) |
| |
| Asset-Backed Commercial Paper—6.5% | | | |
| Straight-A Funding LLC | | | |
| 8/2/10 | 0.30 | 125,000,000 c | 124,998,958 |
| 8/2/10 | 0.39 | 550,000,000 c | 549,994,042 |
| 9/1/10 | 0.43 | 125,000,000 c | 124,953,715 |
| 9/1/10 | 0.43 | 100,000,000 c | 99,962,972 |
| 9/7/10 | 0.41 | 194,000,000 c | 193,918,251 |
| 9/9/10 | 0.40 | 106,000,000 c | 105,954,067 |
| 10/4/10 | 0.36 | 150,000,000 c | 149,904,000 |
| 10/25/10 | 0.33 | 321,805,000 c | 321,554,260 |
| Total Asset-Backed Commercial Paper | | | |
| (cost $1,671,240,265) | | | 1,671,240,265 |
| |
| |
| Repurchase Agreements—30.8% | | | |
| Banc of America Securities LLC | | | |
| dated 7/30/10, due 8/2/10 in the amount of $700,011,083 | | | |
| (fully collateralized by $194,183,600 U.S. Treasury Bonds, 4.38%, | | | |
| due 5/15/40, value $205,647,292 and $466,244,500 U.S. Treasury Notes, | | | |
| 1.38%-5.13%, due 6/30/11-2/15/17, value $508,352,756) | 0.19 | 700,000,000 | 700,000,000 |
| Barclays Capital, Inc. | | | |
| dated 7/30/10, due 8/2/10 in the amount of $876,015,330 | | | |
| (fully collateralized by $850,873,400 U.S. Treasury Notes, | | | |
| 2.13%-3.38%, due 6/30/13-12/31/16, value $893,520,015) | 0.21 | 876,000,000 | 876,000,000 |
| BNP Paribas | | | |
| dated 7/30/10, due 8/2/10 in the amount of $1,200,019,000 | | | |
| (fully collateralized by $1,166,281,000 U.S. Treasury Notes, | | | |
| 1%-5%, due 7/31/11-3/31/16, value $1,224,000,110) | 0.19 | 1,200,000,000 | 1,200,000,000 |
| Citigroup Global Markets Holdings Inc. | | | |
| dated 7/30/10, due 8/2/10 in the amount of $100,001,750 | | | |
| (fully collateralized by $44,159,500 U.S. Treasury Inflation Protected | | | |
| Securities, 3.50%, due 1/15/11, value $56,218,691 and $44,835,000 | | | |
| U.S. Treasury Notes, 1.38%, due 2/15/13, value $45,781,344) | 0.21 | 100,000,000 | 100,000,000 |
| Credit Agricole | | | |
| dated 7/30/10, due 8/2/10 in the amount of $900,015,000 | | | |
| (fully collateralized by $645,000,000 Federal Home Loan Bank, | | | |
| 0.35%-0.54%, due 2/1/11-7/8/11, value $646,029,450 and | | | |
| $272,571,000 Federal National Mortgage Association, 0%, | | | |
| due 4/26/11-4/29/11, value $271,971,344) | 0.20 | 900,000,000 | 900,000,000 |
| Credit Suisse Securities LLC | | | |
| dated 7/30/10, due 8/2/10 in the amount of $900,015,000 (fully | | | |
| collateralized by $753,775,900 U.S. Treasury Inflation Protected | | | |
| Securities, 1.88%-2.38%, due 7/15/13-1/15/17, value $918,004,272) | 0.20 | 900,000,000 | 900,000,000 |
| Deutsche Bank Securities Inc. | | | |
| dated 7/30/10, due 8/2/10 in the amount of $1,000,016,667 (fully | | | |
| collateralized by $138,794,100 U.S. Treasury Bills, due 10/7/10-12/23/10, | | | |
| value $138,726,546, $251,038,900 U.S. Treasury Bonds, 4.63%-8.75%, | | | |
| due 5/15/17-2/15/40, value $335,865,235 and $522,364,800 U.S. Treasury | | | |
| Notes, 0.75%-5.75%, due 8/15/10-7/31/14, value $545,408,332) | 0.20 | 1,000,000,000 | 1,000,000,000 |
| Goldman, Sachs & Co. | | | |
| dated 7/30/10, due 8/2/10 in the amount of $36,000,420 (fully collateralized | | | |
| by $36,419,200 U.S. Treasury Notes, 1.13%, due 6/30/11, value $36,720,027) | 0.14 | 36,000,000 | 36,000,000 |
STATEMENT OF INVESTMENTS (Unaudited) (continued)
| | | |
| | Annualized | | |
| | Yield on | | |
| | Date of | Principal | |
| Dreyfus Government Cash Management (continued) | Purchase (%) | Amount ($) | Value ($) |
| |
| Repurchase Agreements (continued) | | | |
| Morgan Stanley | | | |
| dated 7/30/10, due 8/2/10 in the amount of $300,005,000 | | | |
| (fully collateralized by $299,526,600 U.S. Treasury Inflation | | | |
| Protected Securities, 0.50%, due 4/15/15, value $306,000,045) | 0.20 | 300,000,000 | 300,000,000 |
| RBC Capital Markets | | | |
| dated 7/30/10, due 8/2/10 in the amount of $450,007,500 (fully | | | |
| collateralized by $74,858,000 U.S. Treasury Bonds, 9.25%, due 2/15/16, | | | |
| value $107,050,803 and $340,633,300 U.S. Treasury Notes, 1%-7.13%, | | | |
| due 9/30/11-2/15/23, value $351,949,239) | 0.20 | 450,000,000 | 450,000,000 |
| RBS Securities, Inc. | | | |
| dated 7/30/10, due 8/2/10 in the amount of $200,003,333 (fully | | | |
| collateralized by $7,450,000 International Bank for Reconstruction and | | | |
| Development, 2%, due 4/2/12, value $7,653,873, $162,205,000 | | | |
| International Finance Corp., 2%, due 10/29/12, value $163,548,953 and | | | |
| $31,940,000 U.S. Treasury Notes, 1.88%, due 6/15/12, value $32,798,396) | 0.20 | 200,000,000 | 200,000,000 |
| Societe Generale | | | |
| dated 7/30/10, due 8/2/10 in the amount of $1,000,015,833 (fully | | | |
| collateralized by $10,000,000 Federal Home Loan Mortgage Corp., 4.50%, | | | |
| due 5/20/25, value $10,227,300, $50,216,000 Federal National Mortgage | | | |
| Association, 4%-5%, due 4/22/22-11/26/29, value $50,984,616, $33,992,000 | | | |
| U.S. Treasury Inflation Protected Securities, 2.38%, due 1/15/25, value | | | |
| $42,938,616, $375,127,300 U.S. Treasury Notes, 1.75%-3.13%, | | | |
| due 4/15/13-4/30/17, value $389,915,176 and $1,014,500,000 | | | |
| U.S. Treasury Strips, due 8/15/16-5/15/37, value $525,934,368) | 0.19 | 1,000,000,000 | 1,000,000,000 |
| UBS Securities LLC | | | |
| dated 7/30/10, due 8/2/10 in the amount of $250,004,167 (fully collateralized | | | |
| by $255,503,000 U.S. Treasury Bills, due 1/6/11-7/28/11, value $255,001,114) | 0.20 | 250,000,000 | 250,000,000 |
| Total Repurchase Agreements | | | |
| (cost $7,912,000,000) | | | 7,912,000,000 |
| |
| Total Investments (cost $25,619,248,796) | | 99.6% | 25,619,248,796 |
| |
| Cash and Receivables (Net) | | .4% | 93,980,223 |
| |
| Net Assets | | 100.0% | 25,713,229,019 |
|
| a Variable rate security—interest rate subject to periodic change. |
| b On September 7, 2008, the Federal Housing Finance Agency (“FHFA”) placed Federal National Mortgage Association and Federal Home Loan Mortgage Corporation into |
| conservatorship with FHFA as the conservator. As such, the FHFA will oversee the continuing affairs of these companies. |
| c Securities exempt from registration under Rule 144A of the Securities Act of 1933.These securities may be resold in transactions exempt from registration, normally to qualified |
| institutional buyers. At July 31, 2010, these securities amounted to $1,671,240,265 or 6.5% of net assets. |
| | | |
| Portfolio Summary (Unaudited)† | | | |
| |
| | Value (%) | | Value (%) |
| Repurchase Agreements | 30.8 | Asset-Backed/Commercial Paper | 6.5 |
| Federal Home Loan Bank | 28.1 | Federal Farm Credit Bank | .4 |
| Federal National Mortgage Association | 18.1 | | |
| Federal Home Loan Mortgage Corp. | 15.7 | | 99.6 |
| |
| † Based on net assets. | | | |
| See notes to financial statements. | | | |
20
STATEMENT OF INVESTMENTS
July 31, 2010 (Unaudited)
| | | |
| | Annualized | | |
| | Yield on | | |
| | Date of | Principal | |
| Dreyfus Government Prime Cash Management | Purchase (%) | Amount ($) | Value ($) |
| |
| U.S. Government Agencies—93.1% | | | |
| Federal Farm Credit Bank: | | | |
| 8/6/10 | 0.40 | 328,000,000 a | 328,037,573 |
| 8/9/10 | 0.18 | 15,000,000 | 14,999,400 |
| 8/10/10 | 0.21 | 25,000,000 | 24,998,687 |
| 8/23/10 | 0.32 | 100,000,000 a | 99,929,572 |
| 8/27/10 | 0.34 | 412,000,000 a | 411,982,637 |
| 9/28/10 | 0.25 | 50,000,000 | 49,979,861 |
| 12/15/10 | 0.32 | 50,000,000 | 49,939,556 |
| 12/17/10 | 0.21 | 25,500,000 a | 25,499,026 |
| 1/5/11 | 0.21 | 30,000,000 a | 29,998,696 |
| 2/6/12 | 0.44 | 75,000,000 a | 74,894,899 |
| Federal Home Loan Bank: | | | |
| 8/2/10 | 0.06 | 334,000,000 | 333,999,443 |
| 8/2/10 | 0.44 | 250,000,000 a | 250,000,000 |
| 8/5/10 | 0.11 | 130,175,000 | 130,173,409 |
| 8/10/10 | 0.11 | 99,275,000 | 99,272,270 |
| 8/18/10 | 0.18 | 300,000,000 | 299,975,208 |
| 9/15/10 | 0.16 | 50,000,000 | 49,990,313 |
| 9/17/10 | 0.15 | 100,000,000 | 99,980,417 |
| 9/29/10 | 0.19 | 300,000,000 | 299,909,042 |
| 10/15/10 | 0.19 | 249,500,000 | 249,403,323 |
| 10/22/10 | 0.19 | 80,000,000 | 79,965,378 |
| 11/10/10 | 0.28 | 125,000,000 | 124,998,106 |
| 11/24/10 | 0.32 | 287,000,000 | 287,155,308 |
| 11/26/10 | 0.32 | 100,000,000 | 99,994,277 |
| 12/9/10 | 0.31 | 150,000,000 | 149,999,893 |
| 12/10/10 | 0.27 | 77,715,000 | 78,957,041 |
| 12/17/10 | 0.25 | 16,345,000 | 16,551,928 |
| 12/22/10 | 0.26 | 200,000,000 | 199,797,417 |
| 1/18/11 | 0.36 | 200,000,000 | 200,352,645 |
| Total U.S. Government Agencies | | | |
| (cost $4,160,735,325) | | | 4,160,735,325 |
| |
| |
| U.S. Treasury Bills—6.7% | | | |
| 8/26/10 | | | |
| (cost $299,967,708) | 0.16 | 300,000,000 | 299,967,708 |
| |
| Total Investments (cost $4,460,703,033) | | 99.8% | 4,460,703,033 |
| |
| Cash and Receivables (Net) | | .2% | 7,946,795 |
| |
| Net Assets | | 100.0% | 4,468,649,828 |
| |
| a | Variable rate security—interest rate subject to periodic change. |
| | | |
| Portfolio Summary (Unaudited)† | | | |
| | Value (%) | | Value (%) |
| Federal Home Loan Bank | 68.3 | U.S. Treasury Bills | 6.7 |
| Federal Farm Credit Bank | 24.8 | | 99.8 |
|
| † Based on net assets. |
| See notes to financial statements. |
STATEMENT OF INVESTMENTS
July 31, 2010 (Unaudited)
| | | |
| | Annualized | | |
| | Yield on | | |
| | Date of | Principal | |
| Dreyfus Treasury & Agency Cash Management | Purchase (%) | Amount ($) | Value ($) |
| U.S. Treasury Bills—22.4% | | | |
| 8/12/10 | 0.13 | 700,000,000 | 699,971,583 |
| 9/9/10 | 0.20 | 250,000,000 | 249,945,833 |
| 10/7/10 | 0.26 | 430,000,000 | 429,795,929 |
| 10/14/10 | 0.24 | 500,000,000 | 499,758,472 |
| 12/2/10 | 0.20 | 400,000,000 | 399,726,667 |
| 1/13/11 | 0.20 | 250,000,000 | 249,776,563 |
| Total U.S. Treasury Bills | | | |
| (cost $2,528,975,047) | | | 2,528,975,047 |
| |
| U.S. Treasury Notes—47.0% | | | |
| 8/2/10 | 0.11 | 1,357,000,000 | 1,357,095,089 |
| 8/16/10 | 0.27 | 240,000,000 | 240,381,896 |
| 8/31/10 | 0.31 | 350,000,000 | 350,588,217 |
| 9/15/10 | 0.26 | 225,000,000 | 225,989,858 |
| 9/30/10 | 0.21 | 1,093,100,000 | 1,096,297,451 |
| 11/1/10 | 0.21 | 225,615,000 | 226,330,857 |
| 11/15/10 | 0.30 | 170,000,000 | 172,069,990 |
| 11/30/10 | 0.24 | 485,000,000 | 486,615,813 |
| 12/15/10 | 0.30 | 225,000,000 | 228,390,929 |
| 12/31/10 | 0.25 | 380,000,000 | 380,967,332 |
| 5/31/11 | 0.27 | 300,000,000 | 311,392,206 |
| 8/1/11 | 1.89 | 200,000,000 | 209,011,929 |
| Total U.S. Treasury Notes | | | |
| (cost $5,285,131,567) | | | 5,285,131,567 |
| |
| Repurchase Agreements—30.2% | | | |
| Banc of America Securities LLC | | | |
| dated 7/30/10, due 8/2/10 in the amount of $50,000,833 | | | |
| (fully collateralized by $51,821,925 Government National | | | |
| Mortgage Association, 4.50%-5%, due 7/15/39-8/15/39, | | | |
| value $51,000,000) | 0.20 | 50,000,000 | 50,000,000 |
| Barclays Capital, Inc. | | | |
| dated 7/30/10, due 8/2/10 in the amount of $657,011,498 | | | |
| (fully collateralized by $102,054,800 U.S. Treasury Bills, | | | |
| due 9/9/10-1/13/11, value $102,000,022 and $486,232,800 | | | |
| U.S. Treasury Notes, 4.50%-4.75%, due 2/15/17-8/15/17, | | | |
| value $568,140,077) | 0.21 | 657,000,000 | 657,000,000 |
| BNP Paribas | | | |
| dated 7/30/10, due 8/2/10 in the amount of $800,012,667 | | | |
| (fully collateralized by $79,806,300 U.S. Treasury Bills, | | | |
| due 1/13/11, value $79,739,263 and $719,020,100 | | | |
| U.S. Treasury Notes, 1%-2%, due 12/31/11-11/30/13, | | | |
| value $736,260,798) | 0.19 | 800,000,000 | 800,000,000 |
22
| | | |
| | Annualized | | |
| | Yield on | | |
| | Date of | Principal | |
| Dreyfus Treasury & Agency Cash Management (continued) | Purchase (%) | Amount ($) | Value ($) |
| |
| Repurchase Agreements (continued) | | | |
| Credit Agricole | | | |
| dated 7/30/10, due 8/2/10 in the amount of $500,008,333 (fully collateralized | | | |
| by $51,063,500 U.S. Treasury Bills, due 8/19/10-7/28/11, value $50,947,243, | | | |
| $7,863,000 U.S. Treasury Bonds, 4.38%-4.63%, due 2/15/40-5/15/40, | | | |
| value $8,661,828, $10,000,000 U.S. Treasury Inflation Protected Securities, | | | |
| 0.63%, due 4/15/13, value $10,559,515 and $417,732,700 U.S. Treasury Notes, | | | |
| 0.88%-4.88%, due 2/28/11-5/15/20, value $439,831,417) | 0.20 | 500,000,000 | 500,000,000 |
| Credit Suisse Securities LLC | | | |
| dated 7/30/10, due 8/2/10 in the amount of $100,001,667 | | | |
| (fully collateralized by $94,235,000 U.S. Treasury Bonds, | | | |
| 4.50%, due 5/15/38, value $102,002,174) | 0.20 | 100,000,000 | 100,000,000 |
| Deutsche Bank Securities Inc. | | | |
| dated 7/30/10, due 8/2/10 in the amount of $100,001,667 | | | |
| (fully collateralized by $404,529,376 Government National Mortgage | | | |
| Association, 4%-7%, due 4/15/19-6/15/50, value $102,000,000) | 0.20 | 100,000,000 | 100,000,000 |
| HSBC USA Inc. | | | |
| dated 7/30/10, due 8/2/10 in the amount of $400,006,000 (fully | | | |
| collateralized by $37,589,000 U.S. Treasury Bonds, 8.13%, due 5/15/21, | | | |
| value $55,305,072 and $334,911,000 U.S. Treasury Notes, 1.75%-4.13%, | | | |
| due 8/15/12-4/15/13, value $352,699,747) | 0.18 | 400,000,000 | 400,000,000 |
| JPMorgan Chase & Co. | | | |
| dated 7/30/10, due 8/2/10 in the amount of $200,003,167 | | | |
| (fully collateralized by $244,572,959 Government National Mortgage | | | |
| Association, 4%-12%, due 5/15/13-4/15/52, value $204,000,216) | 0.19 | 200,000,000 | 200,000,000 |
| RBC Capital Markets | | | |
| dated 7/30/10, due 8/2/10 in the amount of $200,003,333 (fully | | | |
| collateralized by $25,790,000 U.S. Treasury Bills, due 9/23/10, | | | |
| value $25,783,578 and $170,358,600 U.S. Treasury Notes, | | | |
| 1.38%-4.75%, due 2/28/11-3/31/16, value $178,216,516) | 0.20 | 200,000,000 | 200,000,000 |
| RBS Securities, Inc. | | | |
| dated 7/30/10, due 8/2/10 in the amount of $400,006,667 | | | |
| (fully collateralized by $392,826,700 U.S. Treasury Notes, | | | |
| 1.75%-3%, due 3/31/14-2/28/17, value $408,003,914) | 0.20 | 400,000,000 | 400,000,000 |
| Total Repurchase Agreements | | | |
| (cost $3,407,000,000) | | | 3,407,000,000 |
| |
| Total Investments (cost $11,221,106,614) | | 99.6% | 11,221,106,614 |
| |
| Cash and Receivables (Net) | | .4% | 47,668,489 |
| |
| Net Assets | | 100.0% | 11,268,775,103 |
| | | |
| Portfolio Summary (Unaudited)† | | | |
| | Value (%) | | Value (%) |
| U.S. Treasury Notes | 47.0 | U.S. Treasury Bills | 22.4 |
| Repurchase Agreements | 30.2 | | 99.6 |
| † Based on net assets. | | | |
| See notes to financial statements. | | | |
STATEMENT OF INVESTMENTS
July 31, 2010 (Unaudited)
| | | |
| | Annualized | | |
| | Yield on | | |
| | Date of | Principal | |
| Dreyfus Treasury Prime Cash Management | Purchase (%) | Amount ($) | Value ($) |
| U.S. Treasury Bills—76.2% | | | |
| 8/5/10 | 0.16 | 1,371,000,000 | 1,370,975,512 |
| 8/12/10 | 0.13 | 2,935,000,000 | 2,934,883,492 |
| 8/19/10 | 0.14 | 485,000,000 | 484,965,465 |
| 8/26/10 | 0.15 | 594,000,000 | 593,936,903 |
| 9/2/10 | 0.16 | 950,000,000 | 949,868,000 |
| 9/9/10 | 0.13 | 1,300,000,000 | 1,299,823,958 |
| 9/16/10 | 0.12 | 1,326,000,000 | 1,325,798,999 |
| 9/23/10 | 0.16 | 2,060,000,000 | 2,059,515,715 |
| 9/30/10 | 0.21 | 1,343,000,000 | 1,342,530,067 |
| 10/28/10 | 0.15 | 1,000,000,000 | 999,633,333 |
| 12/30/10 | 0.19 | 700,000,000 | 699,456,820 |
| 1/13/11 | 0.20 | 1,000,000,000 | 999,106,250 |
| 1/27/11 | 0.20 | 437,000,000 | 436,576,292 |
| Total U.S. Treasury Bills | | | |
| (cost $15,497,070,806) | | | 15,497,070,806 |
| |
| U.S. Treasury Notes—27.6% | | | |
| 8/2/10 | 0.12 | 860,000,000 | 860,060,109 |
| 8/16/10 | 0.18 | 573,000,000 | 573,924,956 |
| 8/16/10 | 0.19 | 765,000,000 | 766,743,522 |
| 8/31/10 | 0.17 | 490,000,000 | 490,877,844 |
| 9/15/10 | 0.14 | 723,000,000 | 726,295,680 |
| 9/30/10 | 0.16 | 1,546,000,000 | 1,550,639,749 |
| 10/15/10 | 0.14 | 75,000,000 | 75,630,203 |
| 11/30/10 | 0.16 | 400,000,000 | 401,430,692 |
| 1/31/11 | 0.22 | 176,000,000 | 176,543,777 |
| Total U.S. Treasury Notes | | | |
| (cost $5,622,146,532) | | | 5,622,146,532 |
| |
| Total Investments (cost $21,119,217,338) | | 103.8% | 21,119,217,338 |
| Liabilities, Less Cash and Receivables | | (3.8%) | (770,600,072) |
| Net Assets | | 100.0% | 20,348,617,266 |
| | | |
| Portfolio Summary (Unaudited)† | | | |
| | Value (%) | | Value (%) |
| U.S. Treasury Bills | 76.2 | U.S. Treasury Notes | 27.6 |
| | | | 103.8 |
|
| † Based on net assets. |
| See notes to financial statements. |
24
STATEMENT OF INVESTMENTS
July 31, 2010 (Unaudited)
| | | | |
| | Coupon | Maturity | Principal | |
| Dreyfus Municipal Cash Management Plus | Rate (%) | Date | Amount ($) | Value ($) |
| |
| Short-Term Investments—99.5% | | | | |
| Alabama—1.7% | | | | |
| Macon Trust Various Certificates (Spanish Fort Redevelopment | | | | |
| Authority, Revenue (Spanish Fort Town Center)) (Liquidity | | | | |
| Facility; Bank of America and LOC; Bank of America) | 0.40 | 8/7/10 | 20,750,000 a,b | 20,750,000 |
| Arizona—2.4% | | | | |
| Arizona Health Facilities Authority, Revenue | | | | |
| (La Loma Village) (LOC; Banco Santander) | 0.49 | 8/7/10 | 9,700,000 a | 9,700,000 |
| JPMorgan Chase Putters and Drivers Trust (Salt River Project | | | | |
| Agricultural Improvement and Power District, Salt River Project | | | | |
| Electric System Revenue) (Liquidity Facility; JPMorgan Chase Bank) | 0.28 | 8/7/10 | 8,500,000 a,b | 8,500,000 |
| Maricopa County Industrial Development Authority, MFHR (San Clemente | | | | |
| Apartments Project) (Liquidity Facility; FNMA and LOC; FNMA) | 0.34 | 8/7/10 | 1,010,000 a | 1,010,000 |
| Maricopa County Industrial Development Authority, | | | | |
| MFHR, Refunding (San Clemente Apartments Project) | | | | |
| (Liquidity Facility; FNMA and LOC; FNMA) | 0.29 | 8/7/10 | 7,600,000 a | 7,600,000 |
| Yavapai County Industrial Development Authority, HR (Northern | | | | |
| Arizona Healthcare System) (LOC; Banco Bilbao Vizcaya Argentaria) | 0.38 | 8/7/10 | 3,400,000 a | 3,400,000 |
| California—2.1% | | | | |
| California Infrastructure and Economic Development Bank, | | | | |
| Revenue (California Academy of Sciences, San Francisco, | | | | |
| California) (LOC; Allied Irish Banks) | 1.25 | 8/1/10 | 5,000,000 a | 5,000,000 |
| California Statewide Communities Development Authority, | | | | |
| MFHR (Liquidity Facility; FHLMC and LOC; FHLMC) | 0.37 | 8/7/10 | 13,995,000 a,b | 13,995,000 |
| Los Angeles Department of Water and Power, Revenue, CP | | | | |
| (Liquidity Facility; Banco Bilbao Vizcaya Argentaria) | 0.55 | 8/19/10 | 7,500,000 | 7,500,000 |
| Colorado—2.7% | | | | |
| Colorado, Revenue, TRAN (Education Loan Program) | 1.50 | 8/12/10 | 21,000,000 | 21,007,674 |
| Colorado Housing and Finance Authority, EDR | | | | |
| (Popiel Properties, LLC Project) (LOC; Wells Fargo Bank) | 0.54 | 8/7/10 | 2,915,000 a | 2,915,000 |
| Colorado Housing and Finance Authority, | | | | |
| EDR (Wanco Inc. Project) (LOC; U.S. Bank NA) | 0.54 | 8/7/10 | 2,635,000 a | 2,635,000 |
| Erie, COP (Lease Purchase Agreement) (LOC; Key Bank) | 1.00 | 8/7/10 | 4,070,000 a | 4,070,000 |
| Southglenn Metropolitan District, Special Revenue (LOC; BNP Paribas) | 0.30 | 8/7/10 | 2,950,000 a | 2,950,000 |
| Connecticut—.6% | | | | |
| Connecticut Health and Educational Facilities Authority, Revenue | | | | |
| (Yale University Issue) (Liquidity Facility; Wells Fargo Bank) | 0.28 | 8/7/10 | 7,300,000 a,b | 7,300,000 |
| District of Columbia—5.2% | | | | |
| District of Columbia, Revenue, CP | | | | |
| (National Academy of Sciences) (LOC; Bank of America) | 0.37 | 10/19/10 | 10,000,000 | 10,000,000 |
| Metropolitan Washington Airports Authority, Airport System | | | | |
| Revenue (Liquidity Facility; Landesbank Baden-Wurttemberg) | 0.45 | 8/7/10 | 15,000,000 a | 15,000,000 |
| Metropolitan Washington Airports Authority, Airport System | | | | |
| Revenue (Liquidity Facility; Landesbank Baden-Wurttemberg) | 0.45 | 8/7/10 | 25,000,000 a | 25,000,000 |
| Metropolitan Washington Airports Authority, | | | | |
| Airport System Revenue (LOC; Wachovia Bank) | 0.32 | 8/7/10 | 14,700,000 a | 14,700,000 |
| Florida—10.0% | | | | |
| Broward County Housing Finance Authority, MFHR | | | | |
| (Cypress Grove Apartments Project) (LOC; FNMA) | 0.33 | 8/7/10 | 13,230,000 a | 13,230,000 |
STATEMENT OF INVESTMENTS (Unaudited) (continued)
| | | | |
| Dreyfus Municipal | Coupon | Maturity | Principal | |
| Cash Management Plus (continued) | Rate (%) | Date | Amount ($) | Value ($) |
| Short-Term Investments (continued) | | | | |
| Florida (continued) | | | | |
| Citizens Property Insurance Corporation, | | | | |
| High-Risk Account Senior Secured Revenue | 2.00 | 4/21/11 | 20,000,000 | 20,102,432 |
| Escambia County Health Facilities Authority, Healthcare | | | | |
| Facilities Revenue, Refunding (Azalea Trace, Inc. | | | | |
| Obligated Group) (LOC; Bank of America) | 0.36 | 8/1/10 | 19,695,000 a | 19,695,000 |
| Florida Local Government Finance Commission, | | | | |
| Pooled Loan Program Revenue, CP (LOC; Bank of America) | 0.35 | 9/14/10 | 21,905,000 | 21,905,000 |
| Florida Local Government Finance Commission, | | | | |
| Pooled Loan Program Revenue, CP (LOC; Wachovia Bank) | 0.39 | 9/14/10 | 13,151,000 | 13,151,000 |
| Florida Local Government Finance Commission, | | | | |
| Pooled Loan Program Revenue, CP (LOC; Wachovia Bank) | 0.45 | 9/14/10 | 13,130,000 | 13,130,000 |
| Greater Orlando Aviation Authority, Airport Facility Revenue | | | | |
| (FlightSafety International Inc. Project) (Insured; | | | | |
| Berkshire Hathaway Assurance Corporation) | 0.25 | 8/7/10 | 6,700,000 a | 6,700,000 |
| Orange County Health Facilities Authority, HR | | | | |
| (Orlando Regional Healthcare System) | | | | |
| (Insured; Assured Guaranty Municipal Corp. | | | | |
| and Liquidity Facility; Dexia Credit Locale) | 0.43 | 8/1/10 | 15,850,000 a | 15,850,000 |
| Georgia—3.2% | | | | |
| Cobb County, GO Notes, TAN | 1.50 | 12/30/10 | 20,000,000 | 20,099,728 |
| Fulton County School District, Construction Notes | 1.50 | 12/30/10 | 15,000,000 | 15,075,500 |
| Gwinnett County Development Authority, IDR | | | | |
| (Suzanna’s Kitchen, Inc. Project) (LOC; Wachovia Bank) | 0.42 | 8/7/10 | 5,000,000 a | 5,000,000 |
| Illinois—1.4% | | | | |
| Illinois Finance Authority, IDR (Fitzpatrick Brothers, Inc. Project) | | | | |
| (Liquidity Facility; Northern Trust Company) | 0.27 | 8/7/10 | 5,000,000 a | 5,000,000 |
| Illinois Toll Highway Authority, Toll Highway Senior Revenue, | | | | |
| Refunding (Insured; Assured Guaranty Municipal Corp. and | | | | |
| Liquidity Facility; Dexia Credit Locale) | 0.31 | 8/7/10 | 3,700,000 a | 3,700,000 |
| Upper Illinois River Valley Development Authority, SWDR | | | | |
| (Exolon-ESK Company Project) (LOC; Bank of America) | 0.31 | 8/7/10 | 8,405,000 a | 8,405,000 |
| Indiana—4.4% | | | | |
| Elkhart County, EDR (Four Seasons Manufacturing | | | | |
| Project) (LOC; National City Bank) | 0.35 | 8/7/10 | 3,255,000 a | 3,255,000 |
| Fort Wayne, EDR (Park Center Project) (LOC; National City Bank) | 0.29 | 8/7/10 | 2,215,000 a | 2,215,000 |
| Indiana Finance Authority, EDR (JRL Leasing, Inc. and | | | | |
| LaSarre Co., LLC Project) (LOC; National City Bank) | 0.35 | 8/7/10 | 3,300,000 a | 3,300,000 |
| Indiana Finance Authority, Environmental Revenue, Refunding | | | | |
| (Duke Energy Indiana, Inc. Project) (LOC; Bank of America) | 0.32 | 8/7/10 | 6,000,000 a | 6,000,000 |
| Indianapolis Local Public Improvement Bond Bank, Revenue | | | | |
| (Insured; Assured Guaranty Municipal Corp. and | | | | |
| Liquidity Facility; Dexia Credit Locale) | 0.43 | 8/1/10 | 40,000,000 a | 40,000,000 |
| Iowa—.8% | | | | |
| Iowa Higher Education Loan Authority, Revenue, | | | | |
| BAN (William Penn University Project) | 1.50 | 12/1/10 | 5,000,000 | 5,008,289 |
| Ringgold County Hospital, HR, BAN | | | | |
| (Ringgold County Hospital Project) | 1.50 | 10/1/10 | 5,000,000 | 5,004,150 |
26
| | | | |
| Dreyfus Municipal | Coupon | Maturity | Principal | |
| Cash Management Plus (continued) | Rate (%) | Date | Amount ($) | Value ($) |
| Short-Term Investments (continued) | | | | |
| Kansas—.7% | | | | |
| Kansas Development Finance Authority, MFHR | | | | |
| (Tree House Apartments) (LOC; Bank of America) | 0.32 | 8/7/10 | 8,580,000 a | 8,580,000 |
| Kentucky—1.6% | | | | |
| Jefferson County, Retirement Home Revenue (Nazareth Literary | | | | |
| and Benevolent Institution Project) (LOC; JPMorgan Chase Bank) | 0.40 | 8/7/10 | 9,320,000 a | 9,320,000 |
| Kentucky Economic Development Finance Authority, Industrial Building | | | | |
| Revenue (Republic Services, Inc. Project) (LOC; Bank One) | 0.38 | 8/7/10 | 6,100,000 a | 6,100,000 |
| Kentucky Rural Water Finance Corporation, | | | | |
| Public Projects Construction Notes | 1.25 | 1/1/11 | 5,000,000 | 5,011,424 |
| Louisiana—1.3% | | | | |
| Louisiana Public Facilities Authority, Revenue | | | | |
| (Tiger Athletic Foundation Project) (LOC; FHLB) | 0.28 | 8/7/10 | 15,750,000 a | 15,750,000 |
| Maryland—2.3% | | | | |
| Anne Arundel County, EDR (Atlas Container | | | | |
| Corporation Project) (LOC; M&T Bank) | 0.41 | 8/7/10 | 6,475,000 a | 6,475,000 |
| Baltimore County Revenue Authority, | | | | |
| Golf System Revenue (LOC; M&T Bank) | 0.31 | 8/7/10 | 5,975,000 a | 5,975,000 |
| Frederick County, Revenue (Homewood, Inc. Facility) (LOC; M&T Bank) | 0.29 | 8/7/10 | 2,700,000 a | 2,700,000 |
| Maryland Health and Higher Educational Facilities Authority, Revenue | | | | |
| (Charles County Nursing Center) (Liquidity Facility; M&T Bank) | 0.33 | 8/7/10 | 3,705,000 a | 3,705,000 |
| Montgomery County, CP (Liquidity Facility; | | | | |
| State Street Bank and Trust Co.) | 0.32 | 9/1/10 | 10,000,000 | 10,000,000 |
| Massachusetts—1.9% | | | | |
| Macon Trust Various Certificates (Massachusetts Health | | | | |
| and Educational Facilities Authority—Harvard Vanguard | | | | |
| Medical Associates Issue) (Liquidity Facility; | | | | |
| Bank of America and LOC; Bank of America) | 0.33 | 8/7/10 | 10,250,000 a,b | 10,250,000 |
| Massachusetts Development Finance Agency, Multifamily Revenue | | | | |
| (Kennedy Lofts Project) (Liquidity Facility; FHLMC and LOC; FHLMC) | 0.38 | 8/7/10 | 4,000,000 a,b | 4,000,000 |
| Massachusetts Development Finance Agency, Revenue | | | | |
| (The Brimmer and May School Issue) (LOC; Comerica Bank) | 0.53 | 8/7/10 | 9,675,000 a | 9,675,000 |
| Michigan—5.6% | | | | |
| Michigan, GO Notes | 2.00 | 9/30/10 | 20,000,000 | 20,048,122 |
| Michigan Hospital Finance Authority, Revenue, CP (Trinity Health Ssytem) | 0.33 | 8/3/10 | 20,000,000 | 20,000,000 |
| Michigan Hospital Finance Authority, Revenue, CP (Trinity Health System) | 0.35 | 8/4/10 | 7,000,000 | 7,000,000 |
| Michigan Housing Development Authority, Rental Housing Revenue | | | | |
| (Liquidity Facility; Landesbank Hessen-Thuringen Girozentrale) | 0.28 | 8/7/10 | 5,800,000 a | 5,800,000 |
| Oakland County Economic Development Corporation, LOR | | | | |
| (Michigan Seamless Tube LLC Project) (LOC; ABN-AMRO) | 0.45 | 8/7/10 | 2,200,000 a | 2,200,000 |
| Pittsfield Township Economic Development Corporation, LOR, | | | | |
| Refunding (Arbor Project) (LOC; Comerica Bank) | 0.30 | 8/7/10 | 4,355,000 a | 4,355,000 |
| Waterford Charter Township Economic Development Corporation, | | | | |
| LOR, Refunding (Canterbury Health Care, Inc. Project) (LOC; FHLB) | 0.30 | 8/7/10 | 10,460,000 a | 10,460,000 |
| Minnesota—2.7% | | | | |
| Minnesota Housing Finance Agency, Residential Housing | | | | |
| Finance Revenue (Liquidity Facility; Lloyds TSB Bank PLC) | 0.27 | 8/7/10 | 3,245,000 a | 3,245,000 |
STATEMENT OF INVESTMENTS (Unaudited) (continued)
| | | | |
| Dreyfus Municipal | Coupon | Maturity | Principal | |
| Cash Management Plus (continued) | Rate (%) | Date | Amount ($) | Value ($) |
| Short-Term Investments (continued) | | | | |
| Minnesota (continued) | | | | |
| Minnesota Housing Finance Agency, Residential Housing | | | | |
| Finance Revenue (Liquidity Facility; FHLB) | 0.30 | 8/7/10 | 7,000,000 a | 7,000,000 |
| Minnesota Tax and Aid Anticipation Borrowing Program, COP | | | | |
| (GO Aid Anticipation Certificates of Indebtedness) | | | | |
| (Minnesota School District Credit Enhancement Program) | 2.00 | 9/10/10 | 6,000,000 | 6,011,316 |
| Southern Minnesota Municipal Power Agency, | | | | |
| Power Supply System Revenue, CP (Liquidity | | | | |
| Facility; Landesbank Hessen-Thuringen Girozentrale) | 0.52 | 8/3/10 | 10,000,000 | 10,000,000 |
| University of Minnesota, CP | 0.32 | 11/9/10 | 7,837,000 | 7,837,000 |
| Missouri—.6% | | | | |
| Missouri Health and Educational Facilities Authority, Health Facilities | | | | |
| Revenue (The Children’s Mercy Hospital) (LOC; UBS AG) | 0.25 | 8/7/10 | 6,850,000 a | 6,850,000 |
| Nebraska—1.2% | | | | |
| Lancaster County Hospital Authority Number 1, HR, Refunding | | | | |
| (BryanLGH Medical Center) (LOC; U.S. Bank NA) | 0.25 | 8/7/10 | 14,820,000 a | 14,820,000 |
| Nevada—2.3% | | | | |
| Clark County, Airport System Subordinate Lien | | | | |
| Revenue (LOC; Landesbank Baden-Wurttemberg) | 0.30 | 8/7/10 | 16,100,000 a | 16,100,000 |
| Clark County, Airport System Subordinate Lien | | | | |
| Revenue (LOC; Landesbank Baden-Wurttemberg) | 0.30 | 8/7/10 | 6,600,000 a | 6,600,000 |
| Director of Nevada Department of Business and Industry, Revenue | | | | |
| (Nevada Cancer Institute Project) (LOC; Bank of America) | 0.27 | 8/7/10 | 5,450,000 a | 5,450,000 |
| New Hampshire—.4% | | | | |
| New Hampshire Health and Education Facilities Authority, | | | | |
| Revenue (Kimball Union Academy) (LOC; RBS Citizens NA) | 0.42 | 8/7/10 | 5,000,000 a | 5,000,000 |
| New Jersey—.9% | | | | |
| East Brunswick Township, GO Notes, BAN | 2.50 | 4/27/11 | 10,500,000 | 10,648,499 |
| New York—4.8% | | | | |
| Metropolitan Transportation Authority, RAN | 2.00 | 12/31/10 | 10,000,000 | 10,066,935 |
| New York City, GO Notes (Liquidity Facility; Allied Irish Banks) | 0.65 | 8/1/10 | 21,000,000 a | 21,000,000 |
| New York City Housing Development Corporation, MFHR | | | | |
| (Liquidity Facility; JPMorgan Chase Bank) | 0.32 | 8/7/10 | 15,000,000 a | 15,000,000 |
| New York Liberty Development Corporation, Multi-Modal | | | | |
| Liberty Revenue (World Trade Center Project) | 0.50 | 1/18/11 | 10,000,000 | 10,000,000 |
| Port Authority of New York and New Jersey, Special Obligation Revenue | | | | |
| (Versatile Structure Obligations) (LOC; Bayerische Landesbank) | 0.36 | 8/1/10 | 4,000,000 a | 4,000,000 |
| North Carolina—4.0% | | | | |
| North Carolina Education Assistance Authority, Student Loan | | | | |
| Revenue, Refunding (LOC; Royal Bank of Canada) | 0.31 | 8/7/10 | 30,000,000 a | 30,000,000 |
| Raleigh-Durham Airport Authority, Airport Revenue, | | | | |
| Refunding (LOC; Wachovia Bank) | 0.27 | 8/7/10 | 19,200,000 a | 19,200,000 |
| Ohio—4.3% | | | | |
| Akron, Bath and Copley Joint Township Hospital District, Health Care | | | | |
| Facilities Revenue (Sumner on Ridgewood Project) (LOC; KBC Bank) | 0.29 | 8/7/10 | 5,055,000 a | 5,055,000 |
| Lorain County, IDR (Cutting Dynamics, Inc. | | | | |
| Project) (LOC; National City Bank) | 0.38 | 8/7/10 | 1,955,000 a | 1,955,000 |
28
| | | | |
| Dreyfus Municipal | Coupon | Maturity | Principal | |
| Cash Management Plus (continued) | Rate (%) | Date | Amount ($) | Value ($) |
| Short-Term Investments (continued) | | | | |
| Ohio (continued) | | | | |
| Montgomery County, Revenue, CP (Miami Valley Hospital) | 0.50 | 9/10/10 | 10,000,000 | 10,000,000 |
| Ohio Higher Educational Facilities, Revenue | | | | |
| (Cedarville University Project) (LOC; Key Bank) | 0.48 | 8/7/10 | 4,415,000 a | 4,415,000 |
| Ohio Water Development Authority, PCR, Refunding | | | | |
| (FirstEnergy Nuclear Generation Corporation Project) | | | | |
| (LOC; Bank of Nova Scotia) | 0.31 | 8/7/10 | 15,000,000 a | 15,000,000 |
| Ohio Water Development Authority, PCR, Refunding (FirstEnergy | �� | | | |
| Nuclear Generation Corporation Project) (LOC; Barclays Bank PLC) | 0.32 | 8/7/10 | 9,700,000 a | 9,700,000 |
| Puttable Floating Option Tax Exempt Receipts (Hamilton County, | | | | |
| Hospital Facilities Revenue (University Hospital)) (Liquidity | | | | |
| Facility; Bank of America and LOC; Bank of America) | 0.33 | 8/7/10 | 7,870,000 a,b | 7,870,000 |
| Oklahoma—.5% | | | | |
| Oklahoma Water Resources Board, State Loan Program | | | | |
| Revenue (Liquidity Facility; State Street Bank and Trust Co.) | 0.75 | 9/1/10 | 6,055,000 | 6,055,000 |
| Pennsylvania—4.4% | | | | |
| Blair County Industrial Development Authority, Revenue (Hollidaysburg | | | | |
| Area YMCA Project) (LOC; Citizens Bank of Pennsylvania) | 0.46 | 8/7/10 | 2,920,000 a | 2,920,000 |
| Chester County Health and Education Facilities Authority, Mortgage | | | | |
| Revenue (Tel Hai Obligated Group Project) (LOC; M&T Bank) | 0.33 | 8/7/10 | 10,405,000 a | 10,405,000 |
| Emmaus General Authority, Local Government | | | | |
| Revenue (Bond Pool Program) (LOC; U.S. Bank NA) | 0.26 | 8/7/10 | 2,400,000 a | 2,400,000 |
| Haverford Township School District, GO Notes (LOC; TD Bank) | 0.27 | 8/7/10 | 3,500,000 a | 3,500,000 |
| Horizon Hospital System Authority, Senior Health and Housing | | | | |
| Facilities Revenue (Saint Paul Homes Project) (LOC; M&T Bank) | 0.33 | 8/7/10 | 7,400,000 a | 7,400,000 |
| Pennsylvania Economic Development Financing Authority, Revenue | | | | |
| (Evergreen Community Power Facility) (LOC; M&T Bank) | 0.43 | 8/7/10 | 16,000,000 a | 16,000,000 |
| Philadelphia Authority for Industrial Development, | | | | |
| Revenue (The Pennsylvania School for the Deaf) | | | | |
| (LOC; Citizens Bank of Pennsylvania) | 0.46 | 8/7/10 | 2,400,000 a | 2,400,000 |
| University of Pittsburgh of the Commonwealth | | | | |
| System of Higher Education, CP | 0.28 | 9/8/10 | 10,000,000 | 10,000,000 |
| South Carolina—3.7% | | | | |
| Charleston County School District, GO Notes, TAN | 2.00 | 4/1/11 | 20,000,000 | 20,225,291 |
| South Carolina Association of Governmental Organizations, | | | | |
| COP (Evidencing Undivided Proportionate Interests in Tax | | | | |
| Anticipation Notes (General Obligations) of Certain | | | | |
| South Carolina School Districts) | 2.00 | 4/15/11 | 25,000,000 | 25,284,895 |
| South Dakota—.1% | | | | |
| South Dakota Housing Development Authority, Homeownership | | | | |
| Mortgage Revenue (Liquidity Facility; Citigroup) | 0.34 | 8/7/10 | 1,555,000 a,b | 1,555,000 |
| Tennessee—1.1% | | | | |
| Cleveland Health and Educational Facilities Board, Revenue | | | | |
| (Lee University Project) (LOC; Branch Banking and Trust Co.) | 0.26 | 8/7/10 | 3,600,000 a | 3,600,000 |
| Metropolitan Government of Nashville and Davidson County | | | | |
| Health and Educational Facilities Board, Revenue, | | | | |
| Refunding (Belmont University Project) (LOC; FHLB) | 0.26 | 8/7/10 | 6,700,000 a | 6,700,000 |
STATEMENT OF INVESTMENTS (Unaudited) (continued)
| | | | |
| Dreyfus Municipal | Coupon | Maturity | Principal | |
| Cash Management Plus (continued) | Rate (%) | Date | Amount ($) | Value ($) |
| Short-Term Investments (continued) | | | | |
| Tennessee (continued) | | | | |
| Sevier County Public Building Authority, Public Project | | | | |
| Construction Notes (Tennessee Association of Utility | | | | |
| Districts Interim Loan Program) | 1.25 | 3/1/11 | 3,000,000 | 3,009,581 |
| Texas—11.6% | | | | |
| Calhoun Port Authority, Environmental Facilities Revenue (Formosa | | | | |
| Plastics Corporation, Texas Project) (LOC; Bank of America) | 0.32 | 8/7/10 | 10,000,000 a | 10,000,000 |
| Collin County Housing Finance Corporation, Multifamily | | | | |
| Revenue (Carpenter-Oxford Development Housing) | | | | |
| (Liquidity Facility; FHLMC and LOC; FHLMC) | 0.31 | 8/7/10 | 5,000,000 a,b | 5,000,000 |
| DeSoto Industrial Development Authority, IDR, Refunding | | | | |
| (National Service Industries Inc. Project) (LOC; Wachovia Bank) | 0.35 | 8/7/10 | 3,660,000 a | 3,660,000 |
| El Paso Independent School District, Unlimited Tax School | | | | |
| Building Bonds (Liquidity Facility; JPMorgan Chase Bank | | | | |
| and LOC; Permanent School Fund Guarantee Program) | 0.35 | 8/2/10 | 15,000,000 | 15,000,000 |
| Harris County, GO Notes, TAN | 2.00 | 2/28/11 | 10,000,000 | 10,096,258 |
| Port of Port Arthur Navigation District, Revenue, CP (BASF Project) | 0.52 | 8/16/10 | 10,000,000 | 10,000,000 |
| Texas, GO Notes (Veterans’ Housing Assistance Program) | | | | |
| (Liquidity Facility; State Street Bank and Trust Co.) | 0.31 | 8/7/10 | 16,000,000 a | 16,000,000 |
| Texas, TRAN | 2.50 | 8/31/10 | 18,000,000 | 18,030,272 |
| Texas Department of Housing and Community Affairs, SFMR | 0.28 | 8/7/10 | 56,400,000 a | 56,400,000 |
| Utah—.9% | | | | |
| Murray City, HR (Intermountain Health Care Health Services, Inc.) | 0.23 | 8/7/10 | 7,300,000 a | 7,300,000 |
| Utah Housing Corporation, SFMR (LOC; Royal Bank of Canada) | 0.60 | 12/29/10 | 3,495,000 | 3,495,000 |
| Vermont—.9% | | | | |
| Vermont Economic Development Authority, Revenue, CP | | | | |
| (Economic Development Capital Program) (LOC; Credit Agricole) | 0.50 | 8/18/10 | 10,800,000 | 10,800,000 |
| Virginia—2.6% | | | | |
| Chesterfield County Economic Development Authority, Revenue | | | | |
| (Bon Secours Health System, Inc.) (Insured; Assured Guaranty | | | | |
| Municipal Corp. and Liquidity Facility; Dexia Credit Locale) | 0.33 | 8/7/10 | 18,770,000 a | 18,770,000 |
| Lynchburg Redevelopment and Housing Authority, Housing Revenue | | | | |
| (KHM Properties-Lynchburg, LLC Project) (LOC; M&T Bank) | 0.38 | 8/7/10 | 13,520,000 a | 13,520,000 |
| Washington—1.1% | | | | |
| Pierce County Economic Development Corporation, | | | | |
| Multi-Mode Industrial Revenue (SeaTac Packaging | | | | |
| Project) (LOC; HSBC Bank USA) | 0.41 | 8/7/10 | 4,960,000 a | 4,960,000 |
| Tacoma Housing Authority, Revenue | | | | |
| (Crown Assisted Living Project) (LOC; Key Bank) | 0.48 | 8/7/10 | 600,000 a | 600,000 |
| Washington Economic Development Finance Authority, SWDR | | | | |
| (CleanScapes, Inc. Project) (LOC; Bank of the West) | 0.33 | 8/7/10 | 7,895,000 a | 7,895,000 |
30
| | | | |
| Dreyfus Municipal | Coupon | Maturity | Principal | |
| Cash Management Plus (continued) | Rate (%) | Date | Amount ($) | Value ($) |
| Short-Term Investments (continued) | | | | |
| Wisconsin—3.1% | | | | |
| Jefferson School District, GO Notes, BAN | 1.80 | 6/1/11 | 4,500,000 | 4,512,210 |
| Wisconsin Health and Educational Facilities Authority, Revenue | | | | |
| (Mequon Jewish Campus, Inc. Project) (LOC; Bank One) | 0.40 | 8/7/10 | 6,250,000 a | 6,250,000 |
| Wisconsin Housing and Economic Development Authority, | | | | |
| Home Ownership Revenue (Liquidity Facility; Fortis Bank) | 0.32 | 8/7/10 | 20,860,000 a | 20,860,000 |
| Wisconsin Rural Water Construction Loan | | | | |
| Program Commission, Revenue, BAN | 1.50 | 11/15/10 | 7,000,000 | 7,015,111 |
| Wyoming—.4% | | | | |
| Wyoming Student Loan Corporation, Student Loan Revenue, | | | | |
| Refunding (Senior Series) (LOC; Royal Bank of Canada) | 0.31 | 8/7/10 | 5,000,000 a | 5,000,000 |
| |
| Total Investments (cost $1,235,705,687) | | | 99.5% | 1,235,705,687 |
| Cash and Receivables (Net) | | | .5% | 5,949,090 |
| Net Assets | | | 100.0% | 1,241,654,777 |
| |
| See footnotes on page 53. | | | | |
| See notes to financial statements. | | | | |
STATEMENT OF INVESTMENTS
July 31, 2010 (Unaudited)
| | | | |
| Dreyfus New York | Coupon | Maturity | Principal | |
| Municipal Cash Management | Rate (%) | Date | Amount ($) | Value ($) |
| |
| Short-Term Investments—99.8% | | | | |
| New York—98.9% | | | | |
| Albany County Airport Authority, Airport Revenue, | | | | |
| Refunding (LOC; Bank of America) | 0.34 | 8/7/10 | 7,560,000 a | 7,560,000 |
| Albany Industrial Development Agency, Civic Facility Revenue | | | | |
| (Albany Medical Center Hospital Project) (LOC; Bank of America) | 0.30 | 8/7/10 | 2,700,000 a | 2,700,000 |
| Albany Industrial Development Agency, Civic Facility Revenue | | | | |
| (Albany Medical Center Hospital Project) (LOC; Key Bank) | 0.38 | 8/7/10 | 4,985,000 a | 4,985,000 |
| Cattaraugus County Industrial Development Agency, | | | | |
| Civic Facility Revenue (Young Men’s Christian | | | | |
| Association of Olean, N.Y. Project) (LOC; Key Bank) | 0.48 | 8/7/10 | 3,280,000 a | 3,280,000 |
| Chautauqua County Industrial Development Agency, Civic Facility | | | | |
| Revenue (Gerry Homes Project) (LOC; HSBC Bank USA) | 0.45 | 8/7/10 | 11,340,000 a | 11,340,000 |
| Chemung County Industrial Development Agency, IDR | | | | |
| (MMARS 2nd Program) (Trayer Products, Inc. | | | | |
| Project) (LOC; HSBC Bank USA) | 0.45 | 8/7/10 | 655,000 a | 655,000 |
| Clarkstown Central School District, GO Notes, TAN | 0.75 | 11/5/10 | 6,500,000 | 6,506,704 |
| Clinton County Industrial Development Agency, | | | | |
| Civic Facility Revenue (Champlain Valley Physicians | | | | |
| Hospital Medical Center Project) (Liquidity Facility; Key Bank) | 0.38 | 8/7/10 | 7,700,000 a | 7,700,000 |
| Clinton County Industrial Development Agency, | | | | |
| Civic Facility Revenue (Champlain Valley Physicians | | | | |
| Hospital Medical Center Project) (LOC; Key Bank) | 0.38 | 8/7/10 | 10,140,000 a | 10,140,000 |
| Columbia County Capital Resource Corporation, Civic Facility Revenue | | | | |
| (The Columbia Memorial Hospital Project) (LOC; HSBC Bank USA) | 0.26 | 8/7/10 | 6,945,000 a | 6,945,000 |
| Columbia County Industrial Development Agency, Civic Facility Revenue | | | | |
| (The Columbia Memorial Hospital Project) (LOC; HSBC Bank USA) | 0.26 | 8/7/10 | 5,245,000 a | 5,245,000 |
| Dutchess County Industrial Development Agency, Civic Facility Revenue | | | | |
| (Anderson Foundation for Autism, Inc. Project) (LOC; M&T Bank) | 0.33 | 8/7/10 | 7,645,000 a | 7,645,000 |
| Dutchess County Industrial Development Agency, Civic Facility Revenue | | | | |
| (Anderson Foundation for Autism, Inc. Project) (LOC; M&T Bank) | 0.33 | 8/7/10 | 9,065,000 a | 9,065,000 |
| Dutchess County Industrial Development Agency, Civic Facility | | | | |
| Revenue (Arbor Ridge Brookmeade Inc.) (LOC; M&T Bank) | 0.33 | 8/7/10 | 14,375,000 a | 14,375,000 |
| Dutchess County Industrial Development Agency, | | | | |
| Civic Facility Revenue, Refunding (Lutheran Center | | | | |
| at Poughkeepsie, Inc. Project) (LOC; Key Bank) | 0.36 | 8/7/10 | 3,650,000 a | 3,650,000 |
| East Rochester Housing Authority, Housing Revenue (Park Ridge | | | | |
| Nursing Home, Inc. Project) (LOC; JPMorgan Chase Bank) | 0.29 | 8/7/10 | 5,000,000 a | 5,000,000 |
| Eastchester Union Free School District, GO Notes, TAN | 1.00 | 12/29/10 | 10,500,000 | 10,526,594 |
| Elmira City School District, GO Notes, BAN | 1.50 | 6/30/11 | 8,500,000 | 8,526,832 |
| Erie County Industrial Development Agency, Civic Facility | | | | |
| Revenue (Heritage Center Project) (LOC; Key Bank) | 0.53 | 8/7/10 | 1,540,000 a | 1,540,000 |
| Erie County Industrial Development Agency, | | | | |
| Civic Facility Revenue (YMCA of Greater | | | | |
| Buffalo Project) (LOC; HSBC Bank USA) | 0.45 | 8/7/10 | 450,000 a | 450,000 |
| Erie County Industrial Development Agency, | | | | |
| Civic Facility Revenue (YMCA of Greater | | | | |
| Buffalo Project) (LOC; HSBC Bank USA) | 0.45 | 8/7/10 | 3,365,000 a | 3,365,000 |
| Erie County Industrial Development Agency, IDR (Hydro-Air | | | | |
| Components Inc. Project) (LOC; HSBC Bank USA) | 0.41 | 8/7/10 | 2,900,000 a | 2,900,000 |
32
| | | | |
| Dreyfus New York | Coupon | Maturity | Principal | |
| Municipal Cash Management (continued) | Rate (%) | Date | Amount ($) | Value ($) |
| Short-Term Investments (continued) | | | | |
| New York (continued) | | | | |
| Forestville Central School District, GO Notes, BAN | 2.00 | 7/14/11 | 4,700,000 | 4,738,417 |
| Herkimer County Industrial Development Agency, IDR (F.E. Hale | | | | |
| Manufacturing Company Facility) (LOC; HSBC Bank USA) | 0.45 | 8/7/10 | 1,800,000 a | 1,800,000 |
| JPMorgan Chase Putters/Drivers Trust (New York State | | | | |
| Dormitory Authority, State Personal Income Tax Revenue | | | | |
| (Education)) (Liquidity Facility; JPMorgan Chase Bank) | 0.28 | 8/7/10 | 7,000,000 a,b | 7,000,000 |
| Lancaster Industrial Development Agency, IDR | | | | |
| (Sealing Devices Inc. Project) (LOC; HSBC Bank USA) | 0.41 | 8/7/10 | 2,255,000 a | 2,255,000 |
| Long Island Power Authority, CP (Long Island | | | | |
| Lighting Company) (LOC; JPMorgan Chase Bank) | 0.37 | 10/14/10 | 29,400,000 | 29,400,000 |
| Long Island Power Authority, Electric System General | | | | |
| Revenue (Insured; Assured Guaranty Municipal Corp. | | | | |
| and Liquidity Facility; Dexia Credit Locale) | 0.29 | 8/7/10 | 20,000,000 a | 20,000,000 |
| Mamaroneck Village, GO Notes, BAN | 1.00 | 8/18/10 | 3,514,000 | 3,515,054 |
| Metropolitan Transportation Authority, Dedicated Tax Fund | | | | |
| Revenue, Refunding (Insured; Assured Guaranty Municipal | | | | |
| Corp. and Liquidity Facility; Dexia Credit Locale) | 0.29 | 8/7/10 | 34,900,000 a | 34,900,000 |
| Metropolitan Transportation Authority, RAN | 2.00 | 12/31/10 | 25,000,000 | 25,167,338 |
| Metropolitan Transportation Authority, | | | | |
| Transportation Revenue (LOC; BNP Paribas) | 0.24 | 8/7/10 | 15,000,000 a | 15,000,000 |
| Metropolitan Transportation Authority, Transportation | | | | |
| Revenue, Refunding (Insured; Assured Guaranty | | | | |
| Municipal Corp. and Liquidity Facility; Dexia Credit Locale) | 0.33 | 8/7/10 | 19,860,000 a | 19,860,000 |
| Metropolitan Transportation Authority, Transportation | | | | |
| Revenue, Refunding (Insured; Assured Guaranty Municipal | | | | |
| Corp. and Liquidity Facility; Westdeutsche Landesbank) | 0.33 | 8/7/10 | 14,310,000 a | 14,310,000 |
| Monroe County Industrial Development Agency, Civic Facility | | | | |
| Revenue (DePaul Properties, Inc. Project) (LOC; Key Bank) | 0.38 | 8/7/10 | 2,815,000 a | 2,815,000 |
| Monroe County Industrial Development Agency, Civic Facility | | | | |
| Revenue (YMCA of Greater Rochester Project) (LOC; M&T Bank) | 0.33 | 8/7/10 | 2,280,000 a | 2,280,000 |
| Monroe County Industrial Development Agency, IDR | | | | |
| (Chaney Enterprise) (LOC; M&T Bank) | 0.48 | 8/7/10 | 2,100,000 a | 2,100,000 |
| Monroe County Industrial Development Agency, IDR | | | | |
| (Genesee Metal Stampings Inc. Facility) (LOC; HSBC Bank USA) | 0.45 | 8/7/10 | 310,000 a | 310,000 |
| Monroe County Industrial Development Agency, Revenue (HDF-RWC | | | | |
| Project 1, LLC— Robert Weslayan College Project) (LOC; M&T Bank) | 0.31 | 8/7/10 | 2,600,000 a | 2,600,000 |
| New York City, GO Notes | 5.00 | 8/1/10 | 3,000,000 | 3,000,000 |
| New York City, GO Notes (Liquidity Facility; Allied Irish Banks) | 0.65 | 8/1/10 | 37,500,000 a | 37,500,000 |
| New York City, GO Notes (LOC; Bank of Nova Scotia) | 0.22 | 8/7/10 | 6,785,000 a | 6,785,000 |
| New York City Housing Development Corporation, MFHR | 0.33 | 9/15/10 | 11,175,000 | 11,175,000 |
| New York City Housing Development Corporation, MFHR | 0.37 | 12/31/10 | 9,000,000 | 9,000,000 |
| New York City Housing Development Corporation, | | | | |
| MFHR (Liquidity Facility; Citibank NA) | 0.31 | 8/7/10 | 10,000,000 a,b | 10,000,000 |
| New York City Housing Development Corporation, | | | | |
| MFHR (Liquidity Facility; Dexia Credit Locale) | 0.32 | 8/1/10 | 6,280,000 a | 6,280,000 |
| New York City Housing Development Corporation, | | | | |
| MFHR (Liquidity Facility; JPMorgan Chase Bank) | 0.28 | 8/7/10 | 6,900,000 a | 6,900,000 |
STATEMENT OF INVESTMENTS (Unaudited) (continued)
| | | | |
| Dreyfus New York | Coupon | Maturity | Principal | |
| Municipal Cash Management (continued) | Rate (%) | Date | Amount ($) | Value ($) |
| |
| Short-Term Investments (continued) | | | | |
| New York (continued) | | | | |
| New York City Housing Development Corporation, | | | | |
| MFHR (Liquidity Facility; JPMorgan Chase Bank) | 0.32 | 8/7/10 | 14,360,000 a | 14,360,000 |
| New York City Housing Development Corporation, MFMR (The Crest | | | | |
| Project) (LOC; Landesbank Hessen-Thuringen Girozentrale) | 0.28 | 8/7/10 | 8,000,000 a | 8,000,000 |
| New York City Industrial Development Agency, Civic Facility Revenue | | | | |
| (French Institute-Alliance Francaise de New York—Federation | | | | |
| of French Alliances in the United States Project) (LOC; M&T Bank) | 0.53 | 8/7/10 | 1,860,000 a | 1,860,000 |
| New York City Industrial Development Agency, | | | | |
| Civic Facility Revenue (Jewish Community Center | | | | |
| on the Upper West Side, Inc. Project) (LOC; M&T Bank) | 0.33 | 8/7/10 | 4,900,000 a | 4,900,000 |
| New York City Industrial Development Agency, Civic Facility Revenue | | | | |
| (Sephardic Community Youth Center, Inc. Project) (LOC; M&T Bank) | 0.33 | 8/7/10 | 3,100,000 a | 3,100,000 |
| New York City Industrial Development Agency, Civic Facility | | | | |
| Revenue (Village Community School Project) (LOC; M&T Bank) | 0.53 | 8/7/10 | 2,400,000 a | 2,400,000 |
| New York City Municipal Water Finance Authority, CP (Liquidity | | | | |
| Facility: Bayerische Landesbank and Westdeutsche Landesbank) | 0.40 | 8/3/10 | 7,400,000 | 7,400,000 |
| New York City Municipal Water Finance Authority, Water and Sewer | | | | |
| System Revenue (Liquidity Facility; Dexia Credit Locale) | 0.33 | 8/1/10 | 2,400,000 a | 2,400,000 |
| New York City Municipal Water Finance Authority, | | | | |
| Water and Sewer System Revenue (Putters Program) | | | | |
| (Liquidity Facility; JPMorgan Chase Bank) | 0.28 | 8/7/10 | 2,095,000 a,b | 2,095,000 |
| New York City Transitional Finance Authority, | | | | |
| Future Tax Secured Subordinate Revenue | 2.50 | 11/1/10 | 6,975,000 | 7,013,502 |
| New York Liberty Development Corporation, Multi-Modal | | | | |
| Liberty Revenue (World Trade Center Project) | 0.50 | 1/18/11 | 15,000,000 | 15,000,000 |
| New York Local Government Assistance Corporation, GO Notes | | | | |
| (LOC: Bayerische Landesbank and Westdeutsche Landesbank) | 0.27 | 8/7/10 | 17,700,000 a | 17,700,000 |
| New York Local Government Assistance Corporation, GO Notes | | | | |
| (LOC: Bayerische Landesbank and Westdeutsche Landesbank) | 0.32 | 8/7/10 | 7,300,000 a | 7,300,000 |
| New York Local Government Assistance Corporation, Subordinate | | | | |
| Lien Revenue, Refunding (Insured; Assured Guaranty Municipal Corp. | | | | |
| and Liquidity Facility; Westdeutsche Landesbank) | 0.35 | 8/7/10 | 14,350,000 a | 14,350,000 |
| New York State Dormitory Authority, Insured Revenue | | | | |
| (The Culinary Institute of America) (LOC; TD Bank) | 0.25 | 8/7/10 | 6,925,000 a | 6,925,000 |
| New York State Dormitory Authority, Revenue | | | | |
| (F.F.T. Senior Communities, Inc.) (LOC; KBC Bank) | 0.26 | 8/7/10 | 4,420,000 a | 4,420,000 |
| New York State Dormitory Authority, Revenue | | | | |
| (Park Ridge Hospital, Inc.) (LOC; JPMorgan Chase Bank) | 0.29 | 8/7/10 | 2,625,000 a | 2,625,000 |
| New York State Dormitory Authority, Revenue | | | | |
| (The College of New Rochelle) (LOC; RBS Citizens NA) | 0.36 | 8/7/10 | 4,000,000 a | 4,000,000 |
| New York State Dormitory Authority, | | | | |
| Revenue (The Rockefeller University) | 0.22 | 8/7/10 | 25,175,000 a | 25,175,000 |
| New York State Housing Finance Agency, Housing | | | | |
| Revenue (350 West 37th Street) (LOC; Wachovia Bank) | 0.30 | 8/7/10 | 9,000,000 a | 9,000,000 |
34
| | | | |
| Dreyfus New York | Coupon | Maturity | Principal | |
| Municipal Cash Management (continued) | Rate (%) | Date | Amount ($) | Value ($) |
| |
| Short-Term Investments (continued) | | | | |
| New York (continued) | | | | |
| New York State Housing Finance Agency, Service Contract | | | | |
| Revenue, Refunding (LOC; Bank of America) | 0.24 | 8/7/10 | 4,200,000 a | 4,200,000 |
| New York State Mortgage Agency, Homeowner Mortgage | | | | |
| Revenue (Liquidity Facility; Bank of America) | 0.25 | 8/7/10 | 17,700,000 a | 17,700,000 |
| New York State Urban Development Corporation, | | | | |
| Service Contract Revenue, Refunding | 1.00 | 1/1/11 | 11,615,000 | 11,646,968 |
| New York State Urban Development Corporation, | | | | |
| Service Contract Revenue, Refunding | 1.00 | 1/1/11 | 7,990,000 | 8,011,991 |
| Newburgh City School District, GO Notes, BAN | 1.00 | 12/17/10 | 15,000,000 | 15,030,830 |
| Newburgh Industrial Development Agency, | | | | |
| Civic Facility Revenue (Community Development | | | | |
| Properties Dubois Street II, Inc. Project) (LOC; Key Bank) | 0.36 | 8/7/10 | 3,200,000 a | 3,200,000 |
| Onondaga County Industrial Development Agency, IDR | | | | |
| (ICM Controls Corporation Project) (LOC; M&T Bank) | 0.43 | 8/7/10 | 2,250,000 a | 2,250,000 |
| Ontario County Industrial Development Agency, | | | | |
| Civic Facility Revenue (Friends of the Finger Lakes | | | | |
| Performing Arts Center, Inc. Civic Facility) (LOC; FHLB) | 0.46 | 8/7/10 | 6,455,000 a | 6,455,000 |
| Ontario County Industrial Development Agency, IDR (Dixit | | | | |
| Enterprises/Newtex Industries, Inc. Facility) (LOC; HSBC Bank USA) | 0.45 | 8/7/10 | 2,540,000 a | 2,540,000 |
| Orange County Industrial Development Agency, Civic Facility | | | | |
| Revenue (Saint Luke’s Cornwall Hospital Project) (LOC; Key Bank) | 0.36 | 8/7/10 | 3,700,000 a | 3,700,000 |
| Otsego County Industrial Development Agency, Civic Facility | | | | |
| Revenue (Templeton Foundation Project) (LOC; Key Bank) | 0.48 | 8/7/10 | 3,025,000 a | 3,025,000 |
| Port Authority of New York and New Jersey, CP (Liquidity | | | | |
| Facility; Landesbank Hessen-Thuringen Girozentrale) | 0.37 | 8/10/10 | 20,050,000 | 20,050,000 |
| Port Authority of New York and New Jersey, CP (Liquidity | | | | |
| Facility; Landesbank Hessen-Thuringen Girozentrale) | 0.38 | 8/12/10 | 20,035,000 | 20,035,000 |
| Port Authority of New York and New Jersey, CP (Liquidity | | | | |
| Facility; Landesbank Hessen-Thuringen Girozentrale) | 0.38 | 8/16/10 | 20,740,000 | 20,740,000 |
| Port Authority of New York and New Jersey, Equipment Notes | 0.34 | 8/7/10 | 10,500,000 a | 10,500,000 |
| Port Authority of New York and New Jersey, | | | | |
| Special Obligation Revenue (Versatile Structure | | | | |
| Obligations) (LOC; Bayerische Landesbank) | 0.36 | 8/1/10 | 300,000 a | 300,000 |
| Putnam County Industrial Development Agency, | | | | |
| Civic Facility Revenue (United Cerebral Palsy of Putnam | | | | |
| and Southern Dutchess Project) (LOC; Commerce Bank NA) | 0.25 | 8/7/10 | 3,595,000 a | 3,595,000 |
| Saint Lawrence County Industrial Development Agency, | | | | |
| Civic Facility Revenue, Refunding (Claxton-Hepburn | | | | |
| Medical Center Project) (LOC; Key Bank) | 0.36 | 8/7/10 | 3,500,000 a | 3,500,000 |
| Schenectady, GO Notes, BAN | 1.50 | 5/20/11 | 5,000,000 | 5,009,829 |
| Schenectady Industrial Development Agency, Civic Facility | | | | |
| Revenue (Union Graduate College Project) (LOC; M&T Bank) | 0.33 | 8/7/10 | 5,535,000 a | 5,535,000 |
| South Country Central School District at Brookhaven, GO Notes, TAN | 1.50 | 6/30/11 | 3,500,000 c | 3,517,325 |
STATEMENT OF INVESTMENTS (Unaudited) (continued)
| | | | |
| Dreyfus New York | Coupon | Maturity | Principal | |
| Municipal Cash Management (continued) | Rate (%) | Date | Amount ($) | Value ($) |
| Short-Term Investments (continued) | | | | |
| New York (continued) | | | | |
| Syracuse Industrial Development Agency, Civic Facility | | | | |
| Revenue (Community Development Properties-Larned | | | | |
| Project) (LOC; M&T Bank) | 0.31 | 8/7/10 | 2,410,000 a | 2,410,000 |
| Syracuse Industrial Development Agency, Civic Facility Revenue | | | | |
| (Crouse Health Hospital, Inc. Project) (LOC; HSBC Bank USA) | 0.26 | 8/7/10 | 2,730,000 a | 2,730,000 |
| Syracuse Industrial Development Agency, Housing Revenue | | | | |
| (Masonic Lofts LLC Project) (LOC; Key Bank) | 0.60 | 8/7/10 | 4,050,000 a | 4,050,000 |
| Ticonderoga Central School District, GO Notes, BAN | 2.00 | 6/24/11 | 7,300,000 | 7,354,833 |
| Ulster County Industrial Development Agency, IDR | | | | |
| (Selux Corporation Project) (LOC; M&T Bank) | 0.43 | 8/7/10 | 1,205,000 a | 1,205,000 |
| Wappingers Central School District, GO Notes, TAN | 1.00 | 10/29/10 | 2,700,000 | 2,702,675 |
| Westchester County Health Care Corporation, CP (Liquidity | | | | |
| Facility; JPMorgan Chase Bank and LOC; Westchester County) | 0.40 | 8/13/10 | 13,255,000 | 13,255,000 |
| Yonkers Industrial Development Agency, MFHR | | | | |
| (Main Street Lofts Yonkers LLC Project) (LOC; M&T Bank) | 0.43 | 8/7/10 | 30,000,000 a | 30,000,000 |
| Yonkers Industrial Development Agency, Revenue | | | | |
| (Merlots Program) (11-23 Saint Casimir Avenue, LP Project) | | | | |
| (Liquidity Facility; Wachovia Bank and LOC; GNMA) | 0.33 | 8/7/10 | 5,715,000 a,b | 5,715,000 |
| U.S. Related—.9% | | | | |
| Puerto Rico Sales Tax Financing Corporation, | | | | |
| Sales Tax Revenue (Liquidity Facility; Citibank NA) | 0.29 | 8/7/10 | 7,000,000 a,b | 7,000,000 |
| |
| Total Investments (cost $819,778,892) | | | 99.8% | 819,778,892 |
| Cash and Receivables (Net) | | | .2% | 1,436,916 |
| Net Assets | | | 100.0% | 821,215,808 |
| |
| See footnotes on page 53. | | | | |
| See notes to financial statements. | | | | |
36
STATEMENT OF INVESTMENTS
July 31, 2010 (Unaudited)
| | | | |
| Dreyfus Tax Exempt | Coupon | Maturity | Principal | |
| Cash Management | Rate (%) | Date | Amount ($) | Value ($) |
| |
| Short-Term Investments—99.7% | | | | |
| Alabama—.1% | | | | |
| Alabama Public School and College Authority, | | | | |
| Capital Improvement Revenue | 5.00 | 12/1/10 | 5,000,000 | 5,077,843 |
| Arizona—1.2% | | | | |
| Arizona Health Facilities Authority, HR (Phoenix Children’s | | | | |
| Hospital) (Liquidity Facility; BNP Paribas and LOC; BNP Paribas) | 0.38 | 8/7/10 | 12,415,000 a,b,d | 12,415,000 |
| Arizona Health Facilities Authority, HR (Phoenix Children’s | | | | |
| Hospital) (Liquidity Facility; Merrill Lynch Capital | | | | |
| Services and LOC; Bank of America) | 0.40 | 8/7/10 | 9,620,000 a,b,d | 9,620,000 |
| Arizona Health Facilities Authority, Revenue | | | | |
| (La Loma Village) (LOC; Banco Santander) | 0.49 | 8/7/10 | 18,300,000 a,d | 18,300,000 |
| California—2.6% | | | | |
| Los Angeles Department of Water and Power, Revenue, CP | | | | |
| (Liquidity Facility; Banco Bilbao Vizcaya Argentaria) | 0.55 | 8/19/10 | 22,500,000 | 22,500,000 |
| Southern California Public Power Authority, Transmission | | | | |
| Project Revenue, Refunding (Southern Transmission | | | | |
| Project) (Insured; Assured Guaranty Municipal Corp. | | | | |
| and Liquidity Facility; Westdeutsche Landesbank) | 0.30 | 8/7/10 | 66,815,000 a | 66,815,000 |
| Colorado—4.8% | | | | |
| Colorado, Revenue, TRAN (Education Loan Program) | 1.50 | 8/12/10 | 77,000,000 | 77,028,305 |
| Denver Urban Renewal Authority, Stapleton Senior Tax | | | | |
| Increment Revenue (LOC; U.S. Bank NA) | 0.27 | 8/7/10 | 9,900,000 a | 9,900,000 |
| RBC Municipal Products Inc. Trust (Meridian Village Metropolitan | | | | |
| District Number One, Improvement Revenue) (Liquidity Facility; | | | | |
| Royal Bank of Canada and LOC; Royal Bank of Canada) | 0.28 | 8/7/10 | 17,600,000 a,b | 17,600,000 |
| Southern Ute Indian Tribe of the Southern Ute | | | | |
| Indian Reservation, Revenue | 0.28 | 8/7/10 | 55,300,000 a | 55,300,000 |
| Southglenn Metropolitan District, Special Revenue (LOC; BNP Paribas) | 0.30 | 8/7/10 | 8,000,000 a | 8,000,000 |
| Connecticut—.8% | | | | |
| Bridgeport, GO Notes, TAN | 1.50 | 8/12/10 | 10,000,000 | 10,002,857 |
| Connecticut Health and Educational Facilities Authority, | | | | |
| Revenue (The Jerome Home Issue) (LOC; Bank of America) | 0.27 | 8/7/10 | 4,560,000 a,d | 4,560,000 |
| Connecticut Health and Educational Facilities Authority, | | | | |
| Revenue (Yale University Issue) (Liquidity Facility; Citibank NA) | 0.28 | 8/7/10 | 11,850,000 a,b | 11,850,000 |
| Delaware—.7% | | | | |
| Delaware Economic Development Authority, Multi-Family | | | | |
| Revenue (School House Trust Project) (LOC; HSBC Bank USA) | 0.45 | 8/7/10 | 11,900,000 a | 11,900,000 |
| Delaware Economic Development Authority, Revenue (Connections | | | | |
| Community Support Programs, Inc. Project) (LOC; PNC Bank NA) | 0.26 | 8/7/10 | 2,645,000 a | 2,645,000 |
| Delaware Health Facilities Authority, Revenue | | | | |
| (Christiana Care Health Services) | 0.24 | 8/7/10 | 8,325,000 a,d | 8,325,000 |
| District of Columbia—1.4% | | | | |
| District of Columbia, Revenue (American Legacy Foundation Issue) | 0.27 | 8/7/10 | 14,000,000 a | 14,000,000 |
| District of Columbia, Revenue (American Public | | | | |
| Health Association Issue) (LOC; Bank of America) | 0.40 | 8/7/10 | 6,565,000 a,d | 6,565,000 |
| District of Columbia, Revenue, CP (National Academy | | | | |
| of Sciences) (LOC; Bank of America) | 0.37 | 10/5/10 | 1,000,000 | 1,000,000 |
STATEMENT OF INVESTMENTS (Unaudited) (continued)
| | | | |
| Dreyfus Tax Exempt | Coupon | Maturity | Principal | |
| Cash Management (continued) | Rate (%) | Date | Amount ($) | Value ($) |
| Short-Term Investments (continued) | | | | |
| District of Columbia (continued) | | | | |
| District of Columbia, Revenue, CP (National Academy | | | | |
| of Sciences) (LOC; Bank of America) | 0.37 | 10/19/10 | 26,220,000 | 26,220,000 |
| Florida—6.7% | | | | |
| Capital Trust Agency, MFHR (Brittany Bay Apartments— | | | | |
| Waterman’s Crossing) (Liquidity Facility; FHLMC and LOC; FHLMC) | 0.31 | 8/7/10 | 22,925,000 a,b | 22,925,000 |
| Citizens Property Insurance Corporation, | | | | |
| High-Risk Account Senior Secured Revenue | 2.00 | 4/21/11 | 68,000,000 | 68,348,267 |
| Escambia County Health Facilities Authority, Healthcare | | | | |
| Facilities Revenue, Refunding (Azalea Trace, Inc. | | | | |
| Obligated Group) (LOC; Bank of America) | 0.36 | 8/1/10 | 4,000,000 a,d | 4,000,000 |
| Florida Local Government Finance Commission, | | | | |
| Pooled Loan Program Revenue, CP (LOC; Wachovia Bank) | 0.39 | 9/14/10 | 15,000,000 | 15,000,000 |
| Highlands County Health Facilities Authority, HR | | | | |
| (Adventist Health System/Sunbelt Obligated Group) | 0.23 | 8/7/10 | 14,500,000 a,d | 14,500,000 |
| Jacksonville, Transportation Revenue (LOC; Wachovia Bank) | 0.25 | 8/7/10 | 10,600,000 a | 10,600,000 |
| Orlando-Orange County Expressway Authority, Revenue | | | | |
| (Insured; Assured Guaranty Municipal Corp. and | | | | |
| Liquidity Facility; Dexia Credit Locale) | 0.32 | 8/7/10 | 11,200,000 a | 11,200,000 |
| Port Orange, Revenue (Palmer College of | | | | |
| Chiropractic Florida Project) (LOC; ABN-AMRO) | 0.27 | 8/7/10 | 3,870,000 a | 3,870,000 |
| Sunshine State Government Financing Commission, | | | | |
| Revenue, CP (Liquidity Facility; JPMorgan Chase Bank) | 0.40 | 9/13/10 | 25,000,000 | 25,000,000 |
| Sunshine State Governmental Financing Commission, | | | | |
| Revenue (LOC; Dexia Credit Locale) | 0.34 | 8/7/10 | 14,500,000 a | 14,500,000 |
| Tohopekaliga Water Authority, Utility System Revenue | | | | |
| (LOC; Landesbank Hessen-Thuringen Girozentrale) | 0.29 | 8/7/10 | 44,525,000 a | 44,525,000 |
| Georgia—4.7% | | | | |
| Cobb County, GO Notes, TAN | 1.50 | 12/30/10 | 75,000,000 | 75,373,979 |
| Fulton County, General Fund TAN | 2.00 | 12/31/10 | 45,000,000 | 45,322,064 |
| Fulton County Development Authority, Educational Facilities | | | | |
| Revenue (Catholic Education of North Georgia, Inc. | | | | |
| Project) (LOC; Wachovia Bank) | 0.25 | 8/7/10 | 14,200,000 a | 14,200,000 |
| Fulton County Housing Authority, MFHR | | | | |
| (Liquidity Facility; FHLMC and LOC; FHLMC) | 0.31 | 8/7/10 | 25,365,000 a,b | 25,365,000 |
| Thomasville Hospital Authority, RAC (John D. Archbold Memorial | | | | |
| Hospital, Inc. Project) (LOC; Branch Banking and Trust Co.) | 0.26 | 8/7/10 | 5,040,000 a,d | 5,040,000 |
| Idaho—.6% | | | | |
| Idaho Health Facilities Authority, Revenue (Saint Luke’s | | | | |
| Regional Medical Center Project) (Insured; Assured Guaranty | | | | |
| Municipal Corp. and Liquidity Facility; Bank of Montreal) | 0.28 | 8/1/10 | 20,000,000 a,d | 20,000,000 |
| Illinois—6.3% | | | | |
| Chicago O’Hare International Airport, Revenue (Insured; Assured | | | | |
| Guaranty Municipal Corp. and Liquidity Facility; Citibank NA) | 0.30 | 8/7/10 | 5,470,000 a,b | 5,470,000 |
| Illinois Educational Facilities Authority, Revenue, CP | | | | |
| (Pooled Finance Program) (LOC; Northern Trust Company) | 0.35 | 10/13/10 | 81,200,000 | 81,200,000 |
| Illinois Finance Authority, Revenue (Hospice of | | | | |
| Northeastern Illinois Project) (LOC; Harris NA) | 0.30 | 8/7/10 | 6,500,000 a,d | 6,500,000 |
38
| | | | |
| Dreyfus Tax Exempt | Coupon | Maturity | Principal | |
| Cash Management (continued) | Rate (%) | Date | Amount ($) | Value ($) |
| Short-Term Investments (continued) | | | | |
| Illinois (continued) | | | | |
| Illinois Finance Authority, Revenue (Riverside Health | | | | |
| System) (LOC; JPMorgan Chase Bank) | 0.26 | 8/7/10 | 4,295,000 a,d | 4,295,000 |
| Illinois Finance Authority, Revenue (The Landing at | | | | |
| Plymouth Place Project) (LOC; Lloyds TSB Bank PLC) | 0.28 | 8/7/10 | 10,000,000 a | 10,000,000 |
| Illinois Health Facilities Authority, Revenue (Revolving Fund | | | | |
| Pooled Financing Program) (LOC; JPMorgan Chase Bank) | 0.28 | 8/7/10 | 4,450,000 a,d | 4,450,000 |
| Illinois Toll Highway Authority, Toll Highway Senior | | | | |
| Priority Revenue (Liquidity Facility; Dexia Credit Locale) | 0.29 | 8/7/10 | 80,000,000 a | 80,000,000 |
| Illinois Toll Highway Authority, Toll Highway Senior Revenue, | | | | |
| Refunding (Insured; Assured Guaranty Municipal Corp. | | | | |
| and Liquidity Facility; Dexia Credit Locale) | 0.32 | 8/7/10 | 23,000,000 a | 23,000,000 |
| Lake County, MFHR (Whispering Oaks | | | | |
| Apartments Project) (LOC; FHLMC) | 0.27 | 8/7/10 | 3,250,000 a | 3,250,000 |
| Indiana—2.8% | | | | |
| Indiana Bond Bank, Midyear Funding Program | | | | |
| Notes (LOC; JPMorgan Chase Bank) | 1.50 | 1/6/11 | 12,220,000 | 12,276,051 |
| Indiana Finance Authority, HR (Community Health | | | | |
| Network Project) (LOC; Bank of America) | 0.31 | 8/7/10 | 15,000,000 a,d | 15,000,000 |
| Indiana Finance Authority, Revenue | | | | |
| (Ascension Health Senior Credit Group) | 0.22 | 8/7/10 | 5,000,000 a,d | 5,000,000 |
| Indiana Finance Authority, Revenue, | | | | |
| Refunding (Trinity Health Credit Group) | 0.20 | 8/7/10 | 5,900,000 a,d | 5,900,000 |
| Indiana Health and Educational Facility Financing Authority, | | | | |
| Revenue (Ascension Health Senior Credit Group) | | | | |
| (Liquidity Facility; Citibank NA) | 0.28 | 8/7/10 | 59,000,000 a,b,d | 59,000,000 |
| Kentucky—.7% | | | | |
| Kentucky Property and Buildings Commission, Revenue, | | | | |
| Refunding (Project Number 84) (Liquidity Facility; | | | | |
| Dexia Credit Locale and LOC; Dexia Credit Locale) | 0.53 | 8/7/10 | 16,350,000 a,b | 16,350,000 |
| Madisonville, HR (The Trover Clinic Foundation, Inc.) | | | | |
| (Liquidity Facility; U.S. Bank NA) | 0.30 | 8/7/10 | 6,695,000 a,d | 6,695,000 |
| Louisiana—1.9% | | | | |
| Louisiana Local Government Environmental Facilities and Community | | | | |
| Development Authority, Healthcare Facilities Revenue, Refunding | | | | |
| (Saint James Place of Baton Rouge Project) (LOC; ABN-AMRO) | 0.30 | 8/7/10 | 11,520,000 a,d | 11,520,000 |
| Louisiana Municipal Natural Gas Purchasing and Distribution Authority, | | | | |
| Revenue (Putters Program) (Gas Project Number 1) (Liquidity Facility; | | | | |
| JPMorgan Chase Bank and LOC; JPMorgan Chase Bank) | 0.30 | 8/7/10 | 20,929,000 a,b | 20,929,000 |
| Louisiana Public Facilities Authority, HR (Touro Infirmary Project) | | | | |
| (Liquidity Facility; Merrill Lynch Bank and LOC; Bank of America) | 0.40 | 8/7/10 | 34,045,000 a,b,d | 34,045,000 |
| Maine—.3% | | | | |
| Maine Finance Authority, Revenue (Waynflete | | | | |
| School Issue) (LOC; JPMorgan Chase Bank) | 0.30 | 8/7/10 | 11,090,000 a | 11,090,000 |
| Maryland—2.6% | | | | |
| Baltimore County Revenue Authority, Golf System | | | | |
| Revenue (LOC; M&T Bank) | 0.31 | 8/7/10 | 3,500,000 a | 3,500,000 |
| Frederick County, Revenue (Homewood, Inc. Facility) (LOC; M&T Bank) | 0.29 | 8/7/10 | 12,900,000 a | 12,900,000 |
STATEMENT OF INVESTMENTS (Unaudited) (continued)
| | | | |
| Dreyfus Tax Exempt | Coupon | Maturity | Principal | |
| Cash Management (continued) | Rate (%) | Date | Amount ($) | Value ($) |
| Short-Term Investments (continued) | | | | |
| Maryland (continued) | | | | |
| Frederick County, Revenue, Refunding (Manekin-Frederick | | | | |
| Associates Facility) (LOC; M&T Bank) | 0.40 | 8/7/10 | 2,230,000 a | 2,230,000 |
| Maryland Economic Development Corporation, Revenue | | | | |
| (Easter Seals Facility) (LOC; M&T Bank) | 0.33 | 8/7/10 | 6,780,000 a | 6,780,000 |
| Maryland Economic Development Corporation, Revenue | | | | |
| (Legal Aid Bureau, Inc. Facility) (LOC; M&T Bank) | 0.35 | 8/7/10 | 1,965,000 a | 1,965,000 |
| Maryland Health and Higher Educational Facilities Authority, | | | | |
| Revenue (De Matha Catholic High School Issue) | | | | |
| (LOC; Branch Banking and Trust Co.) | 0.28 | 8/7/10 | 9,690,000 a | 9,690,000 |
| Maryland Health and Higher Educational Facilities Authority, | | | | |
| Revenue (Upper Chesapeake Hospitals Issue) | | | | |
| (LOC; Branch Banking and Trust Co.) | 0.26 | 8/7/10 | 5,700,000 a,d | 5,700,000 |
| Montgomery County, CP (Liquidity Facility; JPMorgan Chase Bank) | 0.27 | 8/23/10 | 47,500,000 | 47,500,000 |
| Massachusetts—.6% | | | | |
| Massachusetts, GO Notes, Refunding (Liquidity Facility; | | | | |
| Landesbank Hessen-Thuringen Girozentrale) | 0.29 | 8/7/10 | 20,000,000 a | 20,000,000 |
| Worcester, GO Notes, BAN | 1.75 | 11/5/10 | 2,000,000 | 2,005,735 |
| Michigan—7.6% | | | | |
| Jackson County Hospital Finance Authority, HR, Refunding | | | | |
| (W.A. Foote Memorial Hospital) (Insured; Assured Guaranty | | | | |
| Municipal Corp. and Liquidity Facility; Comerica Bank) | 0.35 | 8/7/10 | 7,950,000 a,d | 7,950,000 |
| Michigan, GO Notes | 2.00 | 9/30/10 | 80,000,000 | 80,192,490 |
| Michigan Hospital Finance Authority, Revenue, CP (Trinity Health System) | 0.35 | 8/4/10 | 10,000,000 d | 10,000,000 |
| Michigan Hospital Finance Authority, Revenue, CP (Trinity Health System) | 0.35 | 8/5/10 | 37,500,000 d | 37,500,000 |
| Michigan Hospital Finance Authority, Revenue, CP (Trinity Health System) | 0.40 | 10/4/10 | 37,500,000 d | 37,500,000 |
| Michigan Hospital Finance Authority, Revenue, CP (Trinity Health System) | 0.35 | 11/2/10 | 37,500,000 d | 37,500,000 |
| Michigan Hospital Finance Authority, Revenue, CP (Trinity Health System) | 0.30 | 11/9/10 | 15,000,000 d | 15,000,000 |
| Michigan Hospital Finance Authority, Revenue, CP (Trinity Health System) | 0.30 | 12/7/10 | 15,000,000 d | 15,000,000 |
| Michigan Housing Development Authority, Rental Housing Revenue | | | | |
| (Liquidity Facility; Landesbank Hessen-Thuringen Girozentrale) | 0.28 | 8/7/10 | 14,255,000 a | 14,255,000 |
| Michigan Municipal Bond Authority, State Aid | | | | |
| Revenue Notes (LOC; Bank of Nova Scotia) | 1.50 | 8/23/10 | 5,000,000 | 5,002,877 |
| University of Michigan, CP | 0.32 | 9/13/10 | 8,305,000 | 8,305,000 |
| Minnesota—1.4% | | | | |
| Minneapolis, GO Notes, Refunding | 3.00 | 12/1/10 | 2,500,000 | 2,522,646 |
| Rochester, Health Care Facilities Revenue, CP (Mayo Foundation) | 0.35 | 9/15/10 | 19,000,000 d | 19,000,000 |
| Southern Minnesota Municipal Power Agency, | | | | |
| Power Supply System Revenue, CP (Liquidity | | | | |
| Facility; Landesbank Hessen-Thuringen Girozentrale) | 0.52 | 8/3/10 | 8,000,000 | 8,000,000 |
| University of Minnesota, CP | 0.32 | 11/9/10 | 15,175,000 | 15,175,000 |
| University of Minnesota, CP | 0.32 | 11/9/10 | 4,250,000 | 4,250,000 |
| Mississippi—.3% | | | | |
| Mississippi Business Finance Corporation, Revenue, | | | | |
| Refunding (Renaissance at Colony Park, LLC | | | | |
| Refunding Project) (LOC; FHLB) | 0.27 | 8/7/10 | 10,000,000 a | 10,000,000 |
40
| | | | |
| Dreyfus Tax Exempt | Coupon | Maturity | Principal | |
| Cash Management (continued) | Rate (%) | Date | Amount ($) | Value ($) |
| Short-Term Investments (continued) | | | | |
| Missouri—.7% | | | | |
| Kansas City Industrial Development Authority, Revenue (Kansas City | | | | |
| Downtown Redevelopment District) (LOC; JPMorgan Chase Bank) | 0.28 | 8/7/10 | 25,800,000 a | 25,800,000 |
| Nebraska—.3% | | | | |
| Lancaster County Hospital Authority Number 1, HR, Refunding | | | | |
| (BryanLGH Medical Center) (LOC; U.S. Bank NA) | 0.25 | 8/7/10 | 9,745,000 a,d | 9,745,000 |
| Nevada—2.2% | | | | |
| Austin Trust (Clark County, GO Bond Bank Bonds) | | | | |
| (Liquidity Facility; Bank of America) | 0.28 | 8/7/10 | 9,770,000 a,b | 9,770,000 |
| Las Vegas Convention and Visitors Authority, Revenue, CP | | | | |
| (LOC: Bank of Nova Scotia, Fortis Bank and | | | | |
| State Street Bank and Trust Co.) | 0.37 | 11/2/10 | 20,000,000 | 20,000,000 |
| Las Vegas Valley Water District, CP (LOC; BNP Paribas) | 0.35 | 11/2/10 | 47,600,000 | 47,600,000 |
| New Hampshire—.5% | | | | |
| New Hampshire Health and Education Facilities Authority, HR | | | | |
| (Catholic Medical Center Issue) (LOC; FHLB) | 0.25 | 8/7/10 | 8,500,000 a,d | 8,500,000 |
| New Hampshire Higher Educational and Health Facilities Authority, | | | | |
| Revenue (Hunt Community Issue) (LOC; TD Bank) | 0.25 | 8/7/10 | 9,795,000 a,d | 9,795,000 |
| New Jersey—2.4% | | | | |
| New Jersey Economic Development Authority, School Facilities | | | | |
| Construction Revenue, Refunding (LOC; Dexia Credit Locale) | 0.30 | 8/7/10 | 82,745,000 a | 82,745,000 |
| New Mexico—.2% | | | | |
| Dona Ana County, Industrial Revenue | | | | |
| (Foamex Products, Inc. Project) (LOC; Wachovia Bank) | 0.34 | 8/7/10 | 6,000,000 a | 6,000,000 |
| New York—3.9% | | | | |
| Long Island Power Authority, Electric System General | | | | |
| Revenue (Insured; Assured Guaranty Municipal Corp. | | | | |
| and Liquidity Facility; Dexia Credit Locale) | 0.29 | 8/7/10 | 23,150,000 a | 23,150,000 |
| Metropolitan Transportation Authority, RAN | 2.00 | 12/31/10 | 15,000,000 | 15,100,403 |
| Metropolitan Transportation Authority, Transportation Revenue, | | | | |
| Refunding (Insured; Assured Guaranty Municipal Corp. and | | | | |
| Liquidity Facility; Westdeutsche Landesbank) | 0.33 | 8/7/10 | 26,000,000 a | 26,000,000 |
| New York City, GO Notes (Liquidity Facility; | | | | |
| Landesbank Hessen-Thuringen Girozentrale) | 0.31 | 8/1/10 | 9,200,000 a | 9,200,000 |
| New York City Housing Development Corporation, | | | | |
| MFHR (Liquidity Facility; Dexia Credit Locale) | 0.32 | 8/1/10 | 6,390,000 a | 6,390,000 |
| New York Liberty Development Corporation, | | | | |
| Multi-Modal Liberty Revenue (World Trade Center Project) | 0.50 | 1/18/11 | 15,000,000 | 15,000,000 |
| New York Local Government Assistance Corporation, | | | | |
| Subordinate Lien Revenue, Refunding (Insured; | | | | |
| Assured Guaranty Municipal Corp. and Liquidity | | | | |
| Facility; Westdeutsche Landesbank) | 0.35 | 8/7/10 | 40,000,000 a | 40,000,000 |
| North Carolina—1.6% | | | | |
| North Carolina Medical Care Commission, Health Care Facilities | | | | |
| First Mortgage Revenue (Carol Woods Project) (Liquidity | | | | |
| Facility; Branch Banking and Trust Co.) | 0.25 | 8/1/10 | 12,690,000 a,d | 12,690,000 |
STATEMENT OF INVESTMENTS (Unaudited) (continued)
| | | | |
| Dreyfus Tax Exempt | Coupon | Maturity | Principal | |
| Cash Management (continued) | Rate (%) | Date | Amount ($) | Value ($) |
| |
| Short-Term Investments (continued) | | | | |
| North Carolina (continued) | | | | |
| North Carolina Medical Care Commission, Health Care Facilities | | | | |
| First Mortgage Revenue (Deerfield Episcopal Retirement | | | | |
| Community) (LOC; Branch Banking and Trust Co.) | 0.26 | 8/7/10 | 5,000,000 a,d | 5,000,000 |
| North Carolina Medical Care Commission, Health Care | | | | |
| Facilities Revenue (WakeMed) (LOC; Wachovia Bank) | 0.25 | 8/7/10 | 9,300,000 a,d | 9,300,000 |
| North Carolina Medical Care Commission, HR | | | | |
| (Randolph Hospital) (LOC; Bank of America) | 0.28 | 8/1/10 | 18,820,000 a,d | 18,820,000 |
| Piedmont Triad Airport Authority, Airport | | | | |
| Revenue (LOC; Branch Banking and Trust Co.) | 0.27 | 8/7/10 | 3,400,000 a | 3,400,000 |
| Union County, GO Notes (Liquidity Facility; | | | | |
| Branch Banking and Trust Co.) | 0.25 | 8/7/10 | 6,200,000 a | 6,200,000 |
| Ohio—3.9% | | | | |
| Akron, Bath and Copley Joint Township Hospital District, | | | | |
| Health Care Facilities Revenue (Sumner on | | | | |
| Ridgewood Project) (LOC; KBC Bank) | 0.29 | 8/7/10 | 5,200,000 a,d | 5,200,000 |
| Cleveland, Airport System Revenue (LOC; KBC Bank) | 0.35 | 8/7/10 | 8,500,000 a | 8,500,000 |
| Franklin County, Hospital Facilities Revenue, Refunding | | | | |
| (OhioHealth Corporation) (Liquidity Facility; | | | | |
| Landesbank Hessen-Thuringen Girozentrale) | 0.30 | 8/7/10 | 59,400,000 a,d | 59,400,000 |
| Ohio Higher Educational Facility Commission, Revenue, CP | | | | |
| (Cleveland Clinic Health System Obligated Group) | 0.35 | 9/7/10 | 13,000,000 d | 13,000,000 |
| Ohio Higher Educational Facility Commission, Revenue, CP | | | | |
| (Cleveland Clinic Health System Obligated Group) | 0.35 | 9/15/10 | 20,000,000 d | 20,000,000 |
| Princeton City School District Board of Education, | | | | |
| BAN (School Improvement) | 2.00 | 11/24/10 | 16,000,000 | 16,080,351 |
| Puttable Floating Option Tax Exempt Receipts (Hamilton County, | | | | |
| Hospital Facilities Revenue (University Hospital)) (Liquidity | | | | |
| Facility; Bank of America and LOC; Bank of America) | 0.33 | 8/7/10 | 14,300,000 a,b,d | 14,300,000 |
| Oklahoma—1.4% | | | | |
| Oklahoma Development Finance Authority, Continuing | | | | |
| Care Retirement Community Revenue, Refunding | | | | |
| (Inverness Village Project) (LOC; KBC Bank) | 0.27 | 8/7/10 | 22,600,000 a,d | 22,600,000 |
| Oklahoma Development Finance Authority, | | | | |
| Revenue, CP (Integris Baptist Medical Center) | 0.31 | 8/13/10 | 24,500,000 d | 24,500,000 |
| Oregon—.4% | | | | |
| Salem Hospital Facility Authority, Revenue | | | | |
| (Capital Manor, Inc. Project) (LOC; Bank of America) | 0.30 | 8/7/10 | 5,370,000 a,d | 5,370,000 |
| Salem Hospital Facility Authority, Revenue, Refunding | | | | |
| (Capital Manor, Inc. Project) (LOC; Bank of America) | 0.30 | 8/7/10 | 8,475,000 a,d | 8,475,000 |
| Pennsylvania—13.8% | | | | |
| Berks County Municipal Authority, Revenue | | | | |
| (The Reading Hospital and Medical Center Project) | 0.48 | 1/13/11 | 5,000,000 d | 5,000,000 |
| Bucks County Industrial Development Authority, | | | | |
| Revenue (Pennswood Village Project) (LOC; Bank of America) | 0.30 | 8/7/10 | 7,300,000 a,d | 7,300,000 |
| Chester County Health and Education Facilities Authority, | | | | |
| Retirement Community Revenue (Kendal-Crosslands | | | | |
| Communities Project) (LOC; Wachovia Bank) | 0.25 | 8/7/10 | 20,935,000 a,d | 20,935,000 |
42
| | | | |
| Dreyfus Tax Exempt | Coupon | Maturity | Principal | |
| Cash Management (continued) | Rate (%) | Date | Amount ($) | Value ($) |
| |
| Short-Term Investments (continued) | | | | |
| Pennsylvania (continued) | | | | |
| East Hempfield Township Industrial Development Authority, | | | | |
| Revenue (The Mennonite Home Project) (LOC; M&T Bank) | 0.33 | 8/7/10 | 11,190,000 a | 11,190,000 |
| East Hempfield Township Industrial Development Authority, | | | | |
| Revenue (The Mennonite Home Project) (LOC; M&T Bank) | 0.33 | 8/7/10 | 7,240,000 a,d | 7,240,000 |
| Emmaus General Authority (Pennsylvania Variable Rate | | | | |
| Loan Program) (Insured; Assured Guaranty Municipal | | | | |
| Corp. and Liquidity Facility; Wachovia Bank) | 0.30 | 8/7/10 | 65,075,000 a | 65,075,000 |
| Emmaus General Authority, Local Government Revenue | | | | |
| (Bond Pool Program) (LOC; U.S. Bank NA) | 0.26 | 8/7/10 | 9,200,000 a | 9,200,000 |
| Emmaus General Authority, Local Government Revenue | | | | |
| (Bond Pool Program) (LOC; U.S. Bank NA) | 0.26 | 8/7/10 | 10,500,000 a | 10,500,000 |
| Emmaus General Authority, Local Government Revenue | | | | |
| (Bond Pool Program) (LOC; U.S. Bank NA) | 0.26 | 8/7/10 | 11,200,000 a | 11,200,000 |
| Emmaus General Authority, Local Government Revenue | | | | |
| (Bond Pool Program) (LOC; U.S. Bank NA) | 0.26 | 8/7/10 | 5,850,000 a | 5,850,000 |
| Emmaus General Authority, Local Government Revenue | | | | |
| (Bond Pool Program) (LOC; U.S. Bank NA) | 0.26 | 8/7/10 | 16,600,000 a | 16,600,000 |
| Emmaus General Authority, Local Government Revenue | | | | |
| (Bond Pool Program) (LOC; U.S. Bank NA) | 0.26 | 8/7/10 | 12,500,000 a | 12,500,000 |
| Emmaus General Authority, Local Government Revenue | | | | |
| (Bond Pool Program) (LOC; U.S. Bank NA) | 0.26 | 8/7/10 | 9,300,000 a | 9,300,000 |
| Emmaus General Authority, Local Government Revenue | | | | |
| (Bond Pool Program) (LOC; U.S. Bank NA) | 0.26 | 8/7/10 | 12,300,000 a | 12,300,000 |
| Emmaus General Authority, Local Government Revenue | | | | |
| (Bond Pool Program) (LOC; U.S. Bank NA) | 0.26 | 8/7/10 | 10,000,000 a | 10,000,000 |
| Emmaus General Authority, Local Government Revenue | | | | |
| (Bond Pool Program) (LOC; U.S. Bank NA) | 0.26 | 8/7/10 | 9,500,000 a | 9,500,000 |
| Emmaus General Authority, Local Government Revenue | | | | |
| (Bond Pool Program) (LOC; U.S. Bank NA) | 0.26 | 8/7/10 | 6,400,000 a | 6,400,000 |
| Emmaus General Authority, Local Government Revenue | | | | |
| (Bond Pool Program) (LOC; U.S. Bank NA) | 0.26 | 8/7/10 | 10,000,000 a | 10,000,000 |
| General Authority of South Central Pennsylvania, | | | | |
| Revenue (Lutheran Social Services of South Central | | | | |
| Pennsylvania Project) (LOC; M&T Bank) | 0.33 | 8/7/10 | 16,305,000 a | 16,305,000 |
| Lancaster County Hospital Authority, Health Center | | | | |
| Revenue (LUTHERCARE Project) (LOC; M&T Bank) | 0.28 | 8/7/10 | 33,406,000 a,d | 33,406,000 |
| Lancaster County Hospital Authority, Health System | | | | |
| Revenue (The Lancaster General Hospital | | | | |
| Refunding Project) (LOC; Bank of America) | 0.32 | 8/1/10 | 2,100,000 a,d | 2,100,000 |
| Lancaster County Hospital Authority, Revenue (Landis Home | | | | |
| Retirement Community Project) (LOC; M&T Bank) | 0.33 | 8/7/10 | 7,970,000 a,d | 7,970,000 |
| Montgomery County Higher Education and Health Authority, | | | | |
| Revenue (Pennsylvania Higher Education and Health | | | | |
| Loan Program) (LOC; M&T Bank) | 0.33 | 8/7/10 | 1,165,000 a | 1,165,000 |
| Pennsylvania Economic Development Financing Authority, | | | | |
| Exempt Facilities Revenue, CP (Pennsylvania Power | | | | |
| and Light Utilities Project) (LOC; Wachovia Bank) | 0.45 | 9/1/10 | 4,000,000 | 4,000,000 |
STATEMENT OF INVESTMENTS (Unaudited) (continued)
| | | | |
| Dreyfus Tax Exempt | Coupon | Maturity | Principal | |
| Cash Management (continued) | Rate (%) | Date | Amount ($) | Value ($) |
| |
| Short-Term Investments (continued) | | | | |
| Pennsylvania (continued) | | | | |
| Pennsylvania Economic Development Financing Authority, | | | | |
| Exempt Facilities Revenue, CP (Pennsylvania Power | | | | |
| and Light Utilities Project) (LOC; Wachovia Bank) | 0.62 | 9/1/10 | 12,000,000 | 12,000,000 |
| Philadelphia, GO Notes, TRAN | 2.00 | 6/30/11 | 52,000,000 | 52,612,483 |
| Pittsburgh Water and Sewer Authority, Water and Sewer | | | | |
| System First Lien Revenue (Insured; Assured Guaranty | | | | |
| Municipal Corp. and Liquidity Facility; JPMorgan Chase Bank) | 0.28 | 8/7/10 | 46,225,000 a | 46,225,000 |
| Pottstown Borough Authority, Educational Facilities | | | | |
| Revenue (The Hill School Project) (LOC; M&T Bank) | 0.28 | 8/7/10 | 7,000,000 a | 7,000,000 |
| Ridley School District, GO Notes (LOC; TD Bank) | 0.27 | 8/7/10 | 3,000,000 a | 3,000,000 |
| University of Pittsburgh of the Commonwealth | | | | |
| System of Higher Education, CP | 0.32 | 8/12/10 | 10,000,000 | 10,000,000 |
| University of Pittsburgh of the Commonwealth | | | | |
| System of Higher Education, CP | 0.28 | 9/8/10 | 15,000,000 | 15,000,000 |
| University of Pittsburgh of the Commonwealth | | | | |
| System of Higher Education, CP | 0.32 | 10/7/10 | 20,000,000 | 20,000,000 |
| Wallingford-Swarthmore School District, GO Notes (Insured; Assured | | | | |
| Guaranty Municipal Corp. and Liquidity Facility; Dexia Credit Locale) | 0.54 | 8/7/10 | 10,000,000 a | 10,000,000 |
| York General Authority, Revenue (Strand-Capitol | | | | |
| Performing Arts Center Project) (LOC; M&T Bank) | 0.33 | 8/7/10 | 3,765,000 a | 3,765,000 |
| South Carolina—1.3% | | | | |
| South Carolina Jobs-Economic Development Authority, HR | | | | |
| (Conway Hospital, Inc.) (Insured; Assured Guaranty Municipal | | | | |
| Corp. and Liquidity Facility; Branch Banking and Trust Co.) | 0.29 | 8/7/10 | 44,625,000 a,d | 44,625,000 |
| Tennessee—6.6% | | | | |
| Blount County Public Building Authority, Local Government | | | | |
| Public Improvement Revenue (Liquidity Facility; | | | | |
| Branch Banking and Trust Co.) | 0.27 | 8/7/10 | 49,425,000 a | 49,425,000 |
| Blount County Public Building Authority, Local Government Public | | | | |
| Improvement Revenue (LOC; Branch Banking and Trust Co.) | 0.26 | 8/7/10 | 9,690,000 a | 9,690,000 |
| Blount County Public Building Authority, Local Government Public | | | | |
| Improvement Revenue (LOC; Branch Banking and Trust Co.) | 0.26 | 8/7/10 | 6,245,000 a | 6,245,000 |
| Blount County Public Building Authority, Local Government Public | | | | |
| Improvement Revenue (LOC; Branch Banking and Trust Co.) | 0.26 | 8/7/10 | 6,000,000 a | 6,000,000 |
| Blount County Public Building Authority, Local Government Public | | | | |
| Improvement Revenue (LOC; Branch Banking and Trust Co.) | 0.27 | 8/7/10 | 48,225,000 a | 48,225,000 |
| Metropolitan Government of Nashville and Davidson County | | | | |
| Health and Educational Facilities Board, Revenue (The Vanderbilt | | | | |
| University) (Liquidity Facility: Bayerische Landesbank and | | | | |
| Landesbank Hessen-Thuringen Girozentrale) | 0.20 | 8/7/10 | 18,925,000 a | 18,925,000 |
44
| | | | |
| Dreyfus Tax Exempt | Coupon | Maturity | Principal | |
| Cash Management (continued) | Rate (%) | Date | Amount ($) | Value ($) |
| Short-Term Investments (continued) | | | | |
| Tennessee (continued) | | | | |
| Shelby County Health, Educational and Housing | | | | |
| Facility Board, Revenue (Trezevant Manor | | | | |
| Project) (LOC; ABN-AMRO) | 0.28 | 8/7/10 | 6,270,000 a,d | 6,270,000 |
| Tennergy Corporation, Gas Revenue (Putters Program) | | | | |
| (Liquidity Facility; JPMorgan Chase Bank) | 0.30 | 8/7/10 | 14,640,000 a,b | 14,640,000 |
| Tennergy Corporation, Gas Revenue | | | | |
| (Putters Program) (LOC; BNP Paribas) | 0.30 | 8/7/10 | 53,990,000 a,b | 53,990,000 |
| Tennessee, CP (Liquidity Facility; Tennessee | | | | |
| Consolidated Retirement System) | 0.33 | 9/14/10 | 18,750,000 | 18,750,000 |
| Texas—8.4% | | | | |
| Crawford Education Facilities Corporation, Revenue | | | | |
| (Hyde Park Baptist School Project) (LOC; JPMorgan Chase Bank) | 0.25 | 8/7/10 | 12,600,000 a | 12,600,000 |
| Gregg County Health Facilities Development Corporation, HR | | | | |
| (Good Shepherd Medical Center Project) (LOC; JPMorgan Chase Bank) | 0.36 | 8/1/10 | 5,000,000 a,d | 5,000,000 |
| Gregg County Health Facilities Development Corporation, HR | | | | |
| (Good Shepherd Medical Center Project) (LOC; JPMorgan Chase Bank) | 0.36 | 8/1/10 | 32,000,000 a,d | 32,000,000 |
| Harris County, CP (Liquidity Facility: | | | | |
| Bank of Nova Scotia and BNP Paribas) | 0.35 | 8/13/10 | 25,015,000 | 25,015,000 |
| Harris County, GO Notes, TAN | 2.00 | 2/28/11 | 32,000,000 | 32,308,025 |
| Harris County Cultural Education Facilities Finance | | | | |
| Corporation, Revenue, CP (Methodist Healthcare) | 0.45 | 1/11/11 | 22,500,000 d | 22,500,000 |
| Harris County Metropolitan Transportation Authority, CP | | | | |
| (Liquidity Facility; JPMorgan Chase Bank) | 0.33 | 9/13/10 | 13,250,000 | 13,250,000 |
| Houston, Utility System Revenue, CP (LOC; Bank of Nova Scotia) | 0.37 | 9/15/10 | 10,000,000 | 10,000,000 |
| Puttable Floating Option Tax Exempt Receipts (Brazos County | | | | |
| Health Facilities Development Corporation, Revenue (Franciscan | | | | |
| Services Corporation Obligated Group)) (Liquidity Facility; | | | | |
| Bank of America and LOC; Bank of America) | 0.33 | 8/7/10 | 7,000,000 a,b,d | 7,000,000 |
| RBC Municipal Products, Inc. (Houston, Combined Utility | | | | |
| System First Lien Revenue, Refunding) (Liquidity Facility; | | | | |
| Royal Bank of Canada and LOC; Royal Bank of Canada) | 0.28 | 8/7/10 | 21,000,000 a,b | 21,000,000 |
| Tarrant County Cultural Education Facilities Finance | | | | |
| Corporation, Revenue (Texas Health Resources System) | 0.28 | 8/7/10 | 6,500,000 a,d | 6,500,000 |
| Texas, TRAN | 2.50 | 8/31/10 | 38,000,000 | 38,063,734 |
| Texas Water Development Board, State Revolving Fund | | | | |
| Subordinate Lien Revenue (Liquidity Facility; Citibank NA) | 0.28 | 8/7/10 | 10,940,000 a,b | 10,940,000 |
| University of Texas, University Revenue, CP | 0.26 | 8/3/10 | 20,000,000 | 20,000,000 |
| University of Texas, University Revenue, CP | 0.31 | 10/13/10 | 30,000,000 | 30,000,000 |
| University of Texas, University Revenue, CP | 0.30 | 11/15/10 | 9,000,000 | 9,000,000 |
STATEMENT OF INVESTMENTS (Unaudited) (continued)
| | | | |
| Dreyfus Tax Exempt | Coupon | Maturity | Principal | |
| Cash Management (continued) | Rate (%) | Date | Amount ($) | Value ($) |
| Short-Term Investments (continued) | | | | |
| Utah—2.2% | | | | |
| Central Utah Water Conservancy District Revenue, Refunding | | | | |
| (Liquidity Facility; Landesbank Hessen-Thuringen Girozentrale) | 0.32 | 8/7/10 | 39,600,000 a | 39,600,000 |
| Murray City, HR (Intermountain Health Care Health Services, Inc.) | 0.23 | 8/7/10 | 24,700,000 a,d | 24,700,000 |
| Utah Housing Corporation, SFMR (LOC; Royal Bank of Canada) | 0.50 | 12/29/10 | 4,805,000 | 4,805,000 |
| Utah Housing Finance Agency, MFHR, Refunding | | | | |
| (Candlestick Apartments Project) (Liquidity | | | | |
| Facility; FNMA and LOC; FNMA) | 0.28 | 8/7/10 | 6,400,000 a | 6,400,000 |
| Virginia—1.2% | | | | |
| Chesterfield County Economic Development Authority, Revenue | | | | |
| (Bon Secours Health System, Inc.) (Insured; Assured Guaranty | | | | |
| Municipal Corp. and Liquidity Facility; Dexia Credit Locale) | 0.33 | 8/7/10 | 20,000,000 a,d | 20,000,000 |
| Fairfax County Economic Development Authority, | | | | |
| Educational Facilities Revenue (Trinity Christian | | | | |
| School Project) (LOC; Wachovia Bank) | 0.35 | 8/7/10 | 9,000,000 a | 9,000,000 |
| Richmond, CP (Liquidity Facility; Bank of America) | 0.43 | 8/9/10 | 6,500,000 | 6,500,000 |
| Roanoke Industrial Development Authority, HR (Carilion Health | | | | |
| System Obligated Group) (Insured; Assured Guaranty | | | | |
| Municipal Corp. and Liquidity Facility; Wachovia Bank) | 0.25 | 8/1/10 | 8,000,000 a,d | 8,000,000 |
| Washington—.2% | | | | |
| Puttable Floating Option Tax Exempt Receipts (Washington, | | | | |
| Various Purpose GO, Refunding) (Liquidity Facility; Bank of America) | 0.28 | 8/7/10 | 6,060,000 a,b | 6,060,000 |
| Wisconsin—.4% | | | | |
| Byron, IDR, Refunding (Ocean Spray Cranberries, Inc. | | | | |
| Project) (LOC; Bank of America) | 0.35 | 8/7/10 | 6,500,000 a | 6,500,000 |
| Milwaukee Redevelopment Authority, Redevelopment LR | | | | |
| (University of Wisconsin-Milwaukee Kenilworth | | | | |
| Project) (LOC; U.S. Bank NA) | 0.28 | 8/7/10 | 6,375,000 a | 6,375,000 |
| |
| Total Investments (cost $3,476,958,110) | | | 99.7% | 3,476,958,110 |
| Cash and Receivables (Net) | | | .3% | 9,491,008 |
| Net Assets | | | 100.0% | 3,486,449,118 |
| |
| See footnotes on page 53. | | | | |
| See notes to financial statements. | | | | |
46
STATEMENT OF INVESTMENTS
July 31, 2010 (Unaudited)
| | | | |
| Dreyfus California AMT-Free | Coupon | Maturity | Principal | |
| Municipal Cash Management | Rate (%) | Date | Amount ($) | Value ($) |
| |
| Short-Term Investments—99.9% | | | | |
| California—97.6% | | | | |
| ABAG Finance Authority for Nonprofit Corporations, | | | | |
| Revenue (Eskaton Village-Roseville) (LOC; KBC Bank) | 0.30 | 8/7/10 | 14,670,000 a | 14,670,000 |
| ABAG Finance Authority for Nonprofit Corporations, Revenue | | | | |
| (Northbay Healthcare Group) (LOC; JPMorgan Chase Bank) | 0.30 | 8/7/10 | 12,000,000 a | 12,000,000 |
| ABAG Finance Authority for Nonprofit Corporations, Revenue, | | | | |
| Refunding (Eskaton Properties, Inc.) (LOC; Bank of America) | 0.30 | 8/7/10 | 15,560,000 a | 15,560,000 |
| Alameda County Industrial Development Authority, Recovery Zone | | | | |
| Facility Revenue (Dale Hardware, Inc. Project) (LOC; Comerica Bank) | 0.36 | 8/7/10 | 2,670,000 a | 2,670,000 |
| Alameda Unified School District, GO Notes, TRAN | 2.00 | 6/30/11 | 2,600,000 | 2,623,476 |
| Alameda-Contra Costa Schools Financing Authority, COP | | | | |
| (Capital Improvement Financing Projects) (LOC; KBC Bank) | 0.30 | 8/7/10 | 185,000 a | 185,000 |
| California, Economic Recovery Bonds (Insured; Assured Guaranty | | | | |
| Municipal Corp. and Liquidity Facility; Dexia Credit Locale) | 0.35 | 8/7/10 | 10,825,000 a | 10,825,000 |
| California, GO Notes (LOC; KBC Bank) | 0.32 | 8/1/10 | 11,600,000 a | 11,600,000 |
| California, GO Notes (LOC; Landesbank Hessen-Thuringen Girozentrale) | 0.36 | 8/1/10 | 2,000,000 a | 2,000,000 |
| California, GO Notes (Prerefunded) | 5.25 | 9/1/10 | 1,015,000 e | 1,019,138 |
| California, GO Notes (Prerefunded) | 5.25 | 9/1/10 | 2,550,000 e | 2,560,396 |
| California Department of Water Resources, Power Supply | | | | |
| Revenue (Insured; Assured Guaranty Municipal Corp. | | | | |
| and Liquidity Facility; JPMorgan Chase Bank) | 0.28 | 8/7/10 | 1,300,000 a | 1,300,000 |
| California Department of Water Resources, Water Revenue, CP | | | | |
| (Liquidity Facility; Landesbank Hessen-Thuringen Girozentrale) | 0.47 | 8/3/10 | 1,300,000 | 1,300,000 |
| California Department of Water Resources, Water Revenue, CP | | | | |
| (Liquidity Facility; Landesbank Hessen-Thuringen Girozentrale) | 0.47 | 8/4/10 | 2,300,000 | 2,300,000 |
| California Economic Development Financing Authority, Revenue, | | | | |
| Refunding (KQED, Inc. Project) (LOC; Wells Fargo Bank) | 0.45 | 8/7/10 | 200,000 a | 200,000 |
| California Educational Facilities Authority, Revenue | | | | |
| (Chapman University) (LOC; Bank of America) | 0.25 | 8/1/10 | 4,100,000 a | 4,100,000 |
| California Educational Facilities Authority, | | | | |
| Revenue, CP (Stanford University) | 0.30 | 11/19/10 | 2,900,000 | 2,900,000 |
| California Enterprise Development Authority, IDR | | | | |
| (Ramar International Corporation Project) (LOC; Bank of the West) | 0.29 | 8/7/10 | 4,220,000 a | 4,220,000 |
| California Enterprise Development Authority, IDR | | | | |
| (Tri Tool Inc. Project) (LOC; Comerica Bank) | 0.39 | 8/7/10 | 10,000,000 a | 10,000,000 |
| California Infrastructure and Economic Development Bank, | | | | |
| IDR (Kennfoods USA, LLC Project) (LOC; Bank of the West) | 0.30 | 8/7/10 | 2,500,000 a | 2,500,000 |
| California Infrastructure and Economic Development Bank, | | | | |
| Revenue (California Academy of Sciences, San Francisco, | | | | |
| California) (LOC; Wells Fargo Bank) | 0.23 | 8/1/10 | 1,900,000 a | 1,900,000 |
| California Infrastructure and Economic Development Bank, | | | | |
| Revenue (India Community Center, Inc.) (LOC; Bank of America) | 0.25 | 8/1/10 | 2,090,000 a | 2,090,000 |
| California Infrastructure and Economic Development Bank, Revenue | | | | |
| (San Francisco Ballet Association) (LOC; Allied Irish Banks) | 1.25 | 8/1/10 | 13,285,000 a | 13,285,000 |
| California Infrastructure and Economic Development Bank, Revenue | | | | |
| (Southern California Public Radio Project) (LOC; Allied Irish Banks) | 2.75 | 8/1/10 | 510,000 a | 510,000 |
STATEMENT OF INVESTMENTS (Unaudited) (continued)
| | | | |
| Dreyfus California AMT-Free | Coupon | Maturity | Principal | |
| Municipal Cash Management (continued) | Rate (%) | Date | Amount ($) | Value ($) |
| |
| Short-Term Investments (continued) | | | | |
| California (continued) | | | | |
| California Pollution Control Financing Authority, PCR, Refunding | | | | |
| (Pacific Gas and Electric Company) (LOC; Bank One NA) | 0.30 | 8/1/10 | 4,380,000 a | 4,380,000 |
| California Pollution Control Financing Authority, SWDR | | | | |
| (Garden City Sanitation, Inc. Project) (LOC; Comerica Bank) | 0.35 | 8/7/10 | 2,745,000 a | 2,745,000 |
| California Pollution Control Financing Authority, SWDR | | | | |
| (Garden City Sanitation, Inc. Project) (LOC; Union Bank of California) | 0.30 | 8/7/10 | 10,475,000 a | 10,475,000 |
| California Pollution Control Financing Authority, SWDR, | | | | |
| Refunding (BLT Enterprises of Fremont LLC Project) | | | | |
| (LOC; Union Bank of California) | 0.30 | 8/7/10 | 9,415,000 a | 9,415,000 |
| California Pollution Control Financing Authority, SWDR, Refunding | | | | |
| (MarBorg Industries Project) (LOC; Union Bank of California) | 0.30 | 8/7/10 | 3,640,000 a | 3,640,000 |
| California School Cash Reserve Program Authority, Revenue | 2.50 | 12/30/10 | 13,000,000 | 13,079,871 |
| California Statewide Communities Development Authority, | | | | |
| Revenue (Hanuman Fellowship Project) (LOC; Bank of America) | 0.30 | 8/7/10 | 1,690,000 a | 1,690,000 |
| California Statewide Communities Development Authority, | | | | |
| Revenue (John Muir Health) (LOC; Wells Fargo Bank) | 0.18 | 8/1/10 | 13,000,000 a | 13,000,000 |
| California Statewide Communities Development Authority, Revenue | | | | |
| (Rady Children’s Hospital— San Diego) (LOC; Bank of the West) | 0.19 | 8/1/10 | 5,600,000 a | 5,600,000 |
| California Statewide Communities Development Authority, | | | | |
| Revenue, CP (Kaiser Permanente) | 0.31 | 8/5/10 | 6,700,000 | 6,700,000 |
| California Statewide Communities Development Authority, | | | | |
| Revenue, Refunding (University Retirement Community | | | | |
| at Davis Project) (LOC; Bank of America) | 0.24 | 8/1/10 | 5,500,000 a | 5,500,000 |
| California Statewide Communities Development | | | | |
| Authority, TRAN (County of Yolo) | 2.00 | 6/30/11 | 5,400,000 | 5,448,759 |
| Deutsche Bank Spears/Lifers Trust (Anaheim Redevelopment | | | | |
| Agency, Tax Allocation Revenue, Refunding (Anaheim Merged | | | | |
| Redevelopment Project Area)) (Liquidity Facility; Deutsche | | | | |
| Bank AG and LOC; Deutsche Bank AG) | 0.31 | 8/7/10 | 6,280,000 a,b | 6,280,000 |
| Golden State Tobacco Securitization Corporation, Enhanced | | | | |
| Tobacco Settlement Asset-Backed Bonds (Insured; Berkshire | | | | |
| Hathaway Assurance Corporation and Liquidity Facility; Citibank NA) | 0.28 | 8/7/10 | 14,750,000 a,b | 14,750,000 |
| Irvine Assessment District Number 89-10 (LOC: California State | | | | |
| Teachers’ Retirement System and State Street Bank and Trust Co.) | 0.21 | 8/1/10 | 4,000,000 a | 4,000,000 |
| Irvine Ranch Water District (LOC; Landesbank | | | | |
| Hessen-Thueringen Girozentrale) | 0.29 | 8/1/10 | 1,500,000 a | 1,500,000 |
| Irvine Ranch Water District, GO (Improvement District | | | | |
| Numbers 105, 140, 240 and 250) (LOC; Bank of America) | 0.25 | 8/1/10 | 1,300,000 a | 1,300,000 |
| Long Beach, GO Notes, TRAN | 2.50 | 9/30/10 | 1,400,000 | 1,404,574 |
| Los Angeles County Metropolitan Transportation Authority, | | | | |
| Proposition C Sales Tax Revenue, Refunding | | | | |
| (Liquidity Facility; Bank of Nova Scotia) | 0.26 | 8/1/10 | 9,500,000 a | 9,500,000 |
| Los Angeles County Metropolitan Transportation Authority, | | | | |
| Proposition C Sales Tax Revenue, Refunding | | | | |
| (Liquidity Facility; Bank of Nova Scotia) | 0.26 | 8/1/10 | 2,300,000 a | 2,300,000 |
| Los Angeles Department of Water and Power, Power System | | | | |
| Revenue (Liquidity Facility; Bank of America) | 0.31 | 8/1/10 | 9,210,000 a | 9,210,000 |
48
| | | | |
| Dreyfus California AMT-Free | Coupon | Maturity | Principal | |
| Municipal Cash Management (continued) | Rate (%) | Date | Amount ($) | Value ($) |
| |
| Short-Term Investments (continued) | | | | |
| California (continued) | | | | |
| Los Angeles Department of Water and Power, Revenue, CP | | | | |
| (Liquidity Facility; Banco Bilbao Vizcaya Argentaria) | 0.55 | 8/19/10 | 1,500,000 | 1,500,000 |
| Los Angeles Department of Water and Power, Water System | | | | |
| Revenue (Liquidity Facility; U.S. Bank NA) | 0.27 | 8/1/10 | 2,800,000 a | 2,800,000 |
| Los Angeles Municipal Improvement Corporation, | | | | |
| LR, CP (LOC; Bank of America) | 0.41 | 9/21/10 | 1,900,000 | 1,900,000 |
| Menlo Park Community Development Agency, Tax Allocation Revenue, | | | | |
| Refunding (Las Pulgas Community Development Project) | | | | |
| (LOC; State Street Bank and Trust Co.) | 0.26 | 8/1/10 | 3,000,000 a | 3,000,000 |
| Puttable Floating Option Tax Exempt Receipts (California Statewide | | | | |
| Communities Development Authority, MFHR (La Mision Village | | | | |
| Apartments Project)) (Liquidity Facility; FHLMC and LOC; FHLMC) | 0.44 | 8/7/10 | 1,240,000 a,b | 1,240,000 |
| Puttable Floating Option Tax Exempt Receipts (California Statewide | | | | |
| Communities Development Authority, Revenue (Japanese American | | | | |
| National Museum)) (Liquidity Facility; Merrill Lynch Capital | | | | |
| Services and LOC; Merrill Lynch Capital Services) | 0.52 | 8/7/10 | 4,400,000 a,b | 4,400,000 |
| Ravenswood City School District, GO Notes, TRAN | 1.75 | 7/1/11 | 2,000,000 | 2,012,665 |
| Riverside County Transportation Commission, | | | | |
| Sales Tax Revenue (Liquidity Facility; JPMorgan Chase Bank) | 0.28 | 8/7/10 | 6,900,000 a | 6,900,000 |
| Roseville Joint Union High School District, COP (Insured; Assured | | | | |
| Guaranty Municipal Corp. and Liquidity Facility; Dexia Credit Locale) | 0.50 | 8/7/10 | 1,350,000 a | 1,350,000 |
| San Jose Redevelopment Agency, MFHR (101 San Fernando | | | | |
| Apartments) (Liquidity Facility; Citibank NA and LOC; Citibank NA) | 0.40 | 8/7/10 | 13,000,000 a,b | 13,000,000 |
| Sausalito, MFHR (Rotary Village Senior Housing | | | | |
| Project) (LOC; Bank of the West) | 0.28 | 8/7/10 | 2,185,000 a | 2,185,000 |
| Southern California Public Power Authority, Revenue | | | | |
| (Mead-Adelanto Project) (Liquidity Facility; JPMorgan Chase Bank) | 0.23 | 8/1/10 | 6,600,000 a | 6,600,000 |
| Southern California Public Power Authority, Transmission | | | | |
| Project Revenue, Refunding (Southern Transmission Project) | | | | |
| (Insured; Assured Guaranty Municipal Corp. and Liquidity | | | | |
| Facility; Westdeutsche Landesbank) | 0.30 | 8/7/10 | 8,225,000 a | 8,225,000 |
| Victorville Joint Powers Financing Authority, LR | | | | |
| (Cogeneration Facility Project) (LOC; Fortis Bank) | 0.39 | 8/7/10 | 14,000,000 a | 14,000,000 |
| West Covina Public Financing Authority, LR, Refunding (Public Facilities | | | | |
| Project) (LOC; California State Teachers Retirement System) | 0.32 | 8/7/10 | 1,540,000 a | 1,540,000 |
| U.S. Related—2.3% | | | | |
| Puerto Rico Sales Tax Financing Corporation, | | | | |
| Sales Tax Revenue (Liquidity Facility; Citibank NA) | 0.29 | 8/7/10 | 7,815,000 a,b | 7,815,000 |
| |
| Total Investments (cost $332,703,879) | | | 99.9% | 332,703,879 |
| Cash and Receivables (Net) | | | .1% | 465,217 |
| Net Assets | | | 100.0% | 333,169,096 |
| |
| See footnotes on page 53. | | | | |
| See notes to financial statements. | | | | |
STATEMENT OF INVESTMENTS
July 31, 2010 (Unaudited)
| | | | |
| Dreyfus New York AMT-Free | Coupon | Maturity | Principal | |
| Municipal Cash Management | Rate (%) | Date | Amount ($) | Value ($) |
| |
| Short-Term Investments—103.9% | | | | |
| New York—103.0% | | | | |
| Attica, GO Notes, BAN | 2.00 | 11/19/10 | 1,000,000 | 1,002,680 |
| Bayville, GO Notes, BAN | 1.50 | 3/24/11 | 1,814,500 | 1,822,038 |
| Broome County Industrial Development Agency, Continuing Care | | | | |
| Retirement Community Revenue (Good Shepherd Village at | | | | |
| Endwell, Inc. Project) (LOC; M&T Bank) | 0.33 | 8/7/10 | 3,250,000 a | 3,250,000 |
| Chenango County Industrial Development Agency, | | | | |
| Civic Facilities Revenue (Grace View Manor | | | | |
| Nursing Home Project) (LOC; Banco Santander) | 0.50 | 8/7/10 | 3,455,000 a | 3,455,000 |
| Dutchess County Industrial Development Agency, Civic Facility Revenue | | | | |
| (Anderson Foundation for Autism, Inc. Project) (LOC; M&T Bank) | 0.33 | 8/7/10 | 4,400,000 a | 4,400,000 |
| East Farmingdale Volunteer Fire Company Inc., | | | | |
| Volunteer Fire Department Revenue (LOC; Citibank NA) | 0.45 | 8/7/10 | 4,395,000 a | 4,395,000 |
| Eastchester Union Free School District, GO Notes, TAN | 1.00 | 12/29/10 | 2,500,000 f | 2,506,332 |
| Elmira City School District, GO Notes, BAN | 1.50 | 6/30/11 | 2,260,000 f | 2,267,134 |
| Franklin County Industrial Development Agency, Civic Facility | | | | |
| Revenue (Trudeau Institute, Inc. Project) (LOC; HSBC Bank USA) | 0.40 | 8/7/10 | 2,130,000 a | 2,130,000 |
| Franklin County Industrial Development Agency, Multi-Mode Civic | | | | |
| Facility Revenue (Paul Smith’s College Project) (LOC; U.S. Bank NA) | 0.35 | 8/7/10 | 480,000 a | 480,000 |
| Hamburg Central School District, GO Notes, RAN | 1.25 | 11/18/10 | 1,500,000 f | 1,502,209 |
| Mamaroneck Village, GO Notes, BAN | 1.00 | 8/18/10 | 1,000,000 | 1,000,300 |
| Metropolitan Transportation Authority, RAN | 2.00 | 12/31/10 | 5,000,000 | 5,033,468 |
| Metropolitan Transportation Authority, Transportation Revenue, | | | | |
| Refunding (Insured; Assured Guaranty Municipal Corp. and | | | | |
| Liquidity Facility; Westdeutsche Landesbank) | 0.33 | 8/7/10 | 10,520,000 a | 10,520,000 |
| Monroe County Industrial Development Agency, | | | | |
| Civic Facility Revenue (Association for the Blind | | | | |
| and Visually Impaired—Goodwill Industries of Greater | | | | |
| Rochester, Inc. Project) (LOC; JPMorgan Chase Bank) | 0.27 | 8/7/10 | 2,300,000 a | 2,300,000 |
| Monroe County Industrial Development Agency, Civic Facility Revenue | | | | |
| (Saint Ann’s Home for the Aged Project) (LOC; HSBC Bank USA) | 0.40 | 8/7/10 | 1,130,000 a | 1,130,000 |
| Monroe County Industrial Development Agency, Revenue | | | | |
| (Collegiate Housing Foundation —Rochester, L.L.C.— Rochester | | | | |
| Institute of Technology Project) (LOC; Wells Fargo Bank) | 0.28 | 8/7/10 | 10,795,000 a,f | 10,795,000 |
| New York City, GO Notes | 5.00 | 8/1/10 | 1,475,000 | 1,475,000 |
| New York City Capital Resource Corporation, Revenue | | | | |
| (Loan Enhanced Assistance Program) (LOC; Bank of America) | 0.40 | 8/7/10 | 1,445,000 a,f | 1,445,000 |
| New York City Housing Development Corporation, | | | | |
| MFHR (Liquidity Facility; Citibank NA) | 0.31 | 8/7/10 | 3,700,000 a,b | 3,700,000 |
| New York City Housing Development Corporation, MFMR (20 Exchange | | | | |
| Place) (LOC; Landesbank Hessen-Thuringen Girozentrale) | 0.28 | 8/7/10 | 1,910,000 a | 1,910,000 |
| New York City Housing Development Corporation, MFMR | | | | |
| (The Crest Project) (LOC; Landesbank Hessen-Thuringen Girozentrale) | 0.28 | 8/7/10 | 3,200,000 a | 3,200,000 |
| New York City Housing Development Corporation, | | | | |
| Residential Revenue (Queens College Residences) (LOC; FHLB) | 0.25 | 8/7/10 | 14,900,000 a,f | 14,900,000 |
| New York City Industrial Development Agency, Civic Facility | | | | |
| Revenue (Ateret Torah Center Project) (LOC; Wachovia Bank) | 0.27 | 8/7/10 | 12,480,000 a,f | 12,480,000 |
50
| | | | |
| Dreyfus New York AMT-Free | Coupon | Maturity | Principal | |
| Municipal Cash Management (continued) | Rate (%) | Date | Amount ($) | Value ($) |
| |
| Short-Term Investments (continued) | | | | |
| New York (continued) | | | | |
| New York City Municipal Water Finance Authority, CP (Liquidity Facility: | | | | |
| Bayerische Landesbank and Westdeutsche Landesbank) | 0.40 | 8/3/10 | 1,500,000 | 1,500,000 |
| New York City Municipal Water Finance Authority, Water and Sewer | | | | |
| System Revenue (Liquidity Facility; Dexia Credit Locale) | 0.33 | 8/1/10 | 3,040,000 a | 3,040,000 |
| New York City Transitional Finance Authority, | | | | |
| Future Tax Secured Revenue (Liquidity Facility; | | | | |
| Landesbank Hessen-Thuringen Girozentrale) | 0.26 | 8/1/10 | 1,000,000 a | 1,000,000 |
| New York City Transitional Finance Authority, Revenue | | | | |
| (New York City Recovery) (Liquidity Facility; Dexia Credit Locale) | 0.30 | 8/1/10 | 1,625,000 a | 1,625,000 |
| New York City Transitional Finance Authority, Revenue | | | | |
| (New York City Recovery) (Liquidity Facility; | | | | |
| Landesbank Hessen-Thuringen Girozentrale) | 0.26 | 8/1/10 | 4,845,000 a | 4,845,000 |
| New York City Transitional Finance Authority, Revenue | | | | |
| (New York City Recovery) (Liquidity Facility; | | | | |
| Landesbank Hessen-Thuringen Girozentrale) | 0.26 | 8/7/10 | 1,900,000 a | 1,900,000 |
| New York Liberty Development Corporation, Multi-Modal | | | | |
| Liberty Revenue (World Trade Center Project) | 0.50 | 1/18/11 | 5,000,000 | 5,000,000 |
| New York State Dormitory Authority, Revenue (Catholic Health | | | | |
| System Obligated Group) (LOC; HSBC Bank USA) | 0.26 | 8/7/10 | 4,100,000 a,f | 4,100,000 |
| New York State Dormitory Authority, | | | | |
| Revenue (D’Youville College) (LOC; Key Bank) | 0.38 | 8/7/10 | 5,235,000 a,f | 5,235,000 |
| New York State Dormitory Authority, Revenue | | | | |
| (F.F.T. Senior Communities, Inc.) (LOC; KBC Bank) | 0.26 | 8/7/10 | 3,915,000 a | 3,915,000 |
| New York State Dormitory Authority, Revenue | | | | |
| (Park Ridge Hospital, Inc.) (LOC; JPMorgan Chase Bank) | 0.29 | 8/7/10 | 10,200,000 a | 10,200,000 |
| New York State Environmental Facilities Corporation, | | | | |
| State Clean Water and Drinking Water Revolving | | | | |
| Funds Revenue (Pooled Financing Program) | 4.50 | 3/15/11 | 500,000 | 512,041 |
| New York State Housing Finance Agency, Housing | | | | |
| Revenue (Baisley Park Gardens) (LOC; Citibank NA) | 0.29 | 8/7/10 | 2,400,000 a | 2,400,000 |
| New York State Urban Development Corporation, State Personal | | | | |
| Income Tax Revenue (State Facilities and Equipment) | 5.00 | 3/15/11 | 500,000 | 513,896 |
| New York State Urban Development Corporation, | | | | |
| State Personal Income Tax Revenue (State Facilities | | | | |
| and Equipment) (Liquidity Facility; Dexia Credit Locale) | 0.35 | 8/7/10 | 6,545,000 a | 6,545,000 |
| Orange County Industrial Development Agency, Civic Facility | | | | |
| Revenue (Tuxedo Park School Project) (LOC; M&T Bank) | 0.33 | 8/7/10 | 1,000,000 a | 1,000,000 |
| Port Authority of New York and New Jersey, Equipment Notes | 0.34 | 8/7/10 | 2,800,000 a | 2,800,000 |
| Ravena-Coeymans-Selkirk Central School District, GO Notes, RAN | 1.00 | 10/15/10 | 1,360,000 f | 1,360,690 |
| Rockland County Industrial Development Agency, Civic Facility | | | | |
| Revenue (Dominican College Project) (LOC; TD Bank) | 0.27 | 8/7/10 | 1,750,000 a | 1,750,000 |
| Rockland County Industrial Development Agency, Civic Facility | | | | |
| Revenue (Dominican College Project) (LOC; TD Bank) | 0.27 | 8/7/10 | 2,870,000 a | 2,870,000 |
| Rockland County Industrial Development Agency, Civic Facility | | | | |
| Revenue (Dominican College Project) (LOC; TD Bank) | 0.27 | 8/7/10 | 6,405,000 a | 6,405,000 |
| Rome, GO Notes, BAN | 1.25 | 1/20/11 | 1,215,877 c | 1,217,263 |
STATEMENT OF INVESTMENTS (Unaudited) (continued)
| | | | |
| Dreyfus New York AMT-Free | Coupon | Maturity | Principal | |
| Municipal Cash Management (continued) | Rate (%) | Date | Amount ($) | Value ($) |
| Short-Term Investments (continued) | | | | |
| New York (continued) | | | | |
| Sag Harbor Union Free School District, GO Notes, TAN | 1.50 | 6/23/11 | 1,200,000 f | 1,204,231 |
| Schenectady, GO Notes, BAN | 1.50 | 5/20/11 | 5,600,000 | 5,611,008 |
| Syracuse Industrial Development Agency, Civic Facility Revenue | | | | |
| (Community Development Properties-Larned Project) (LOC; M&T Bank) | 0.31 | 8/7/10 | 1,800,000 a | 1,800,000 |
| Syracuse Industrial Development Agency, Civic Facility Revenue | | | | |
| (Crouse Health Hospital, Inc. Project) (LOC; HSBC Bank USA) | 0.26 | 8/7/10 | 2,835,000 a | 2,835,000 |
| Ticonderoga Central School District, GO Notes, BAN | 2.00 | 6/24/11 | 1,228,175 f | 1,237,400 |
| Triborough Bridge and Tunnel Authority, | | | | |
| General Revenue (Liquidity Facility; Dexia Credit Locale) | 0.30 | 8/7/10 | 7,595,000 a | 7,595,000 |
| Wappingers Central School District, GO Notes, TAN | 1.00 | 10/29/10 | 1,000,000 f | 1,000,991 |
| Westchester County Health Care Corporation, CP (Liquidity Facility; | | | | |
| JPMorgan Chase Bank and LOC; Westchester County) | 0.40 | 8/13/10 | 3,000,000 | 3,000,000 |
| U.S. Related—.9% | | | | |
| Puerto Rico Commonwealth, Public Improvement GO Notes, | | | | |
| Refunding (Insured; Assured Guaranty Municipal Corp. | | | | |
| and Liquidity Facility; Dexia Credit Locale) | 0.25 | 8/7/10 | 1,600,000 a | 1,600,000 |
| |
| Total Investments (cost $192,716,681) | | | 103.9% | 192,716,681 |
| Liabilities, Less Cash and Receivables | | | (3.9%) | (7,228,567) |
| Net Assets | | | 100.0% | 185,488,114 |
| |
| See footnotes on page 53. | | | | |
| See notes to financial statements. | | | | |
52
| | | |
| Summary of Abbreviations | | |
| |
| ABAG | Association of Bay Area Governments | ACA | American Capital Access |
| AGC | ACE Guaranty Corporation | AGIC | Asset Guaranty Insurance Company |
| AMBAC | American Municipal Bond Assurance Corporation | ARRN | Adjustable Rate Receipt Notes |
| BAN | Bond Anticipation Notes | BPA | Bond Purchase Agreement |
| CIFG | CDC Ixis Financial Guaranty | COP | Certificate of Participation |
| CP | Commercial Paper | EDR | Economic Development Revenue |
| EIR | Environmental Improvement Revenue | FGIC | Financial Guaranty Insurance Company |
| FHA | Federal Housing Administration | FHLB | Federal Home Loan Bank |
| FHLMC | Federal Home Loan Mortgage Corporation | FNMA | Federal National Mortgage Association |
| GAN | Grant Anticipation Notes | GIC | Guaranteed Investment Contract |
| GNMA | Government National Mortgage Association | GO | General Obligation |
| HR | Hospital Revenue | IDB | Industrial Development Board |
| IDC | Industrial Development Corporation | IDR | Industrial Development Revenue |
| LOC | Letter of Credit | LOR | Limited Obligation Revenue |
| LR | Lease Revenue | MFHR | Multi-Family Housing Revenue |
| MFMR | Multi-Family Mortgage Revenue | PCR | Pollution Control Revenue |
| PILOT | Payment in Lieu of Taxes | PUTTERS | Puttable Tax-Exempt Receipts |
| RAC | Revenue Anticipation Certificates | RAN | Revenue Anticipation Notes |
| RAW | Revenue Anticipation Warrants | RRR | Resources Recovery Revenue |
| SAAN | State Aid Anticipation Notes | SBPA | Standby Bond Purchase Agreement |
| SFHR | Single Family Housing Revenue | SFMR | Single Family Mortgage Revenue |
| SONYMA | State of New York Mortgage Agency | SWDR | Solid Waste Disposal Revenue |
| TAN | Tax Anticipation Notes | TAW | Tax Anticipation Warrants |
| TRAN | Tax and Revenue Anticipation Notes | XLCA | XL Capital Assurance |

|
| † Based on total investments. |
| a Variable rate demand note—rate shown is the interest rate in effect at July 31, 2010. Maturity date represents the next demand date, or the ultimate maturity date if earlier. |
| b Securities exempt from registration under Rule 144A of the Securities Act of 1933.These securities may be resold in transactions exempt from registration, normally to qualified |
| institutional buyers. At July 31, 2010, Dreyfus Municipal Cash Management Plus amounted to $79,220,000 or 6.4%, Dreyfus NewYork Municipal Cash Management amounted to |
| $31,810,000 or 3.9%, Dreyfus Tax Exempt Cash Management amounted to $373,269,000 or 10.7%, Dreyfus California AMT-Free Municipal Cash Management amounted to |
| $47,485,000 or 14.3% and Dreyfus NewYork AMT-Free Municipal Cash Management amounted to $3,700,000 or 2.0% of net assets. |
| c Purchased on delayed delivery basis. |
| d At July 31, 2010, Dreyfus Tax Exempt Cash Management had $948,121,000 or 27.2% of net assets invested in securities whose payment of principal and interest is dependent upon |
| revenues generated from health care. |
| e These securities are prerefunded; the date shown represents the prerefunded date. Bonds which are prerefunded are collateralized by U.S. Government securities which are held in escrow |
| and are used to pay principal and interest on the municipal issue and to retire the bonds in full at the earliest refunding date. |
| f At July 31, 2010, Dreyfus NewYork AMT-Free Municipal Cash Management had $60,033,987 or 32.4% of net assets invested in securities whose payment of principal and interest |
| is dependent upon revenues generated from education. |
| g Notes which are not F, MIG or SP rated are represented by bond ratings of the issuers. |
| h Securities which, while not rated by Fitch, Moody’s and Standard & Poor’s, have been determined by the Manager to be of comparable quality to those rated securities in which the fund |
| may invest. |
See notes to financial statements.
STATEMENT OF ASSETS AND LIABILITIES
(amounts in thousands, except Net Asset Value Per Share)
July 31, 2010 (Unaudited)
| | | | | | |
| | | Dreyfus | Dreyfus | Dreyfus | Dreyfus | Dreyfus |
| | Dreyfus | Cash | Government | Government | Treasury & | Treasury |
| | Cash | Management | Cash | Prime Cash | Agency Cash | Prime Cash |
| | Management | Plus, Inc. | Management | Management | Management | Management |
| Assets ($): | | | | | | |
| Investments at value—Note 1(a,b)† | 28,800,508a | 6,257,768a | 25,619,249a | 4,460,703 | 11,221,107a | 21,119,217 |
| Cash | — | 13,053 | 120,804 | 48,842 | 1,335 | 32,525 |
| Interest receivable | 11,537 | 2,040 | 7,612 | 1,505 | 49,614 | 71,198 |
| Prepaid expenses and other assets | 293 | 160 | 305 | 125 | 188 | 298 |
| | 28,812,338 | 6,273,021 | 25,747,970 | 4,511,175 | 11,272,244 | 21,223,238 |
| Liabilities ($): | | | | | | |
| Due to The Dreyfus Corporation | | | | | | |
| and affiliates—Note 2(c) | 5,407 | 973 | 4,538 | 837 | 1,937 | 2,513 |
| Cash overdraft due to Custodian | 2,125 | — | — | 80 | — | — |
| Payable for investment securities purchased | — | — | — | — | — | 859,802 |
| Payable for shares of Beneficial | | | | | | |
| Interest/Common Stock redeemed | 3,274 | 639 | 30,171 | 41,608 | 1,440 | 12,230 |
| Accrued expenses | 269 | 145 | 32 | — | 92 | 76 |
| | 11,075 | 1,757 | 34,741 | 42,525 | 3,469 | 874,621 |
| Net Assets ($) | 28,801,263 | 6,271,264 | 25,713,229 | 4,468,650 | 11,268,775 | 20,348,617 |
| Composition of Net Assets ($): | | | | | | |
| Paid-in capital | 28,801,265 | 6,289,594 | 25,713,099 | 4,468,638 | 11,268,726 | 20,348,533 |
| Accumulated net realized | | | | | | |
| gain (loss) on investments | (2) | (18,330) | 130 | 12 | 49 | 84 |
| Net Assets ($) | 28,801,263 | 6,271,264 | 25,713,229 | 4,468,650 | 11,268,775 | 20,348,617 |
| Net Asset Value Per Share | | | | | | |
| Institutional Shares | | | | | | |
| Net Assets ($) | 24,616,782 | 4,170,741 | 22,127,250 | 2,825,523 | 8,494,384 | 13,283,459 |
| Shares Outstanding | 24,616,782 | 4,180,017 | 22,127,166 | 2,825,515 | 8,494,345 | 13,283,403 |
| Net Asset Value Per Share ($) | 1.00 | 1.00 | 1.00 | 1.00 | 1.00 | 1.00 |
| Investor Shares | | | | | | |
| Net Assets ($) | 2,805,937 | 972,212 | 2,265,382 | 475,720 | 1,775,771 | 3,324,769 |
| Shares Outstanding | 2,805,940 | 974,279 | 2,265,372 | 475,718 | 1,775,764 | 3,324,758 |
| Net Asset Value Per Share ($) | 1.00 | 1.00 | 1.00 | 1.00 | 1.00 | 1.00 |
54
| | | | | | |
| | | Dreyfus | Dreyfus | Dreyfus | Dreyfus | Dreyfus |
| | Dreyfus | Cash | Government | Government | Treasury & | Treasury |
| | Cash | Management | Cash | Prime Cash | Agency Cash | Prime Cash |
| | Management | Plus, Inc. | Management | Management | Management | Management |
| Net Asset Value Per Share (continued) | | | | | | |
| Administrative Shares | | | | | | |
| Net Assets ($) | 632,693 | 829,613 | 840,134 | 629,462 | 360,941 | 1,177,713 |
| Shares Outstanding | 632,696 | 830,962 | 840,131 | 629,461 | 360,941 | 1,177,708 |
| Net Asset Value Per Share ($) | 1.00 | 1.00 | 1.00 | 1.00 | 1.00 | 1.00 |
| Participant Shares | | | | | | |
| Net Assets ($) | 667,510 | 275,912 | 416,525 | 500,094 | 496,998 | 2,478,469 |
| Shares Outstanding | 667,506 | 276,492 | 416,523 | 500,092 | 496,995 | 2,478,458 |
| Net Asset Value Per Share ($) | 1.00 | 1.00 | 1.00 | 1.00 | 1.00 | 1.00 |
| Service Shares | | | | | | |
| Net Assets ($) | — | 16,836 | — | — | 4,531 | — |
| Shares Outstanding | — | 16,870 | — | — | 4,531 | — |
| Net Asset Value Per Share ($) | — | 1.00 | — | — | 1.00 | — |
| Select Shares | | | | | | |
| Net Assets ($) | — | 5,949 | — | — | 15,576 | — |
| Shares Outstanding | — | 5,961 | — | — | 15,576 | — |
| Net Asset Value Per Share ($) | — | 1.00 | — | — | 1.00 | — |
| Agency Shares | | | | | | |
| Net Assets ($) | 78,341 | 1 | 63,938 | 37,851 | 58,651 | 84,207 |
| Shares Outstanding | 78,341 | 1 | 63,938 | 37,851 | 58,651 | 84,206 |
| Net Asset Value Per Share ($) | 1.00 | 1.00 | 1.00 | 1.00 | 1.00 | 1.00 |
| Premier Shares | | | | | | |
| Net Assets ($) | — | — | — | — | 61,923 | — |
| Shares Outstanding | — | — | — | — | 61,923 | — |
| Net Asset Value Per Share ($) | — | — | — | — | 1.00 | — |
| † Investments at cost ($) | 28,800,508 | 6,257,768 | 25,619,249 | 4,460,703 | 11,221,107 | 21,119,217 |
|
| a Amount includes repurchase agreements of $3,140,000,000, $1,143,000,000, $7,912,000,000 and $3,407,000,000 for Dreyfus Cash Management, Dreyfus Cash Management |
| Plus, Inc., Dreyfus Government Cash Management and Dreyfus Treasury & Agency Cash Management, respectively, See Note 1(c). |
See notes to financial statements.
STATEMENT OF ASSETS AND LIABILITIES (continued)
(amounts in thousands, except Net Asset Value Per Share)
July 31, 2010 (Unaudited)
| | | | | |
| | | | | Dreyfus | Dreyfus |
| | Dreyfus | Dreyfus | Dreyfus | California | New York |
| Municipal Cash | New York | Tax Exempt | AMT-Free | AMT-Free |
| Management | Municipal Cash | Cash Municipal Cash | Municipal Cash |
| | Plus | Management | Management | Management | Management |
| Assets ($): | | | | | |
| Investments at value—Note 1(a,b)† | 1,235,706 | 819,779 | 3,476,958 | 332,704 | 192,717 |
| Cash | 4,322 | 4,456 | 5,085 | 228 | — |
| Receivable for investment securites sold | 1,894 | — | — | — | 1,009 |
| Interest receivable | — | 627 | 4,857 | 325 | 180 |
| Prepaid expenses and other assets | 78 | 57 | 381 | 14 | — |
| | 1,242,000 | 824,919 | 3,487,281 | 333,271 | 193,906 |
| Liabilities ($): | | | | | |
| Due to The Dreyfus Corporation and affiliates—Note 2(c) | 283 | 158 | 617 | 57 | 38 |
| Cash overdraft due to Custodian | — | — | — | — | 616 |
| Payable for investment securities purchased | — | 3,518 | — | — | 7,764 |
| Payable for shares of Beneficial Interest redeemed | 10 | 10 | 93 | 14 | — |
| Accrued expenses | 52 | 17 | 122 | 31 | — |
| | 345 | 3,703 | 832 | 102 | 8,418 |
| Net Assets ($) | 1,241,655 | 821,216 | 3,486,449 | 333,169 | 185,488 |
| Composition of Net Assets ($): | | | | | |
| Paid-in capital | 1,241,652 | 821,182 | 3,486,134 | 333,169 | 185,480 |
| Accumulated net realized gain (loss) on investments | 3 | 34 | 315 | — | 8 |
| Net Assets ($) | 1,241,655 | 821,216 | 3,486,449 | 333,169 | 185,488 |
| Net Asset Value Per Share | | | | | |
| Instititutional Shares | | | | | |
| Net Assets ($) | 467,929 | 498,746 | 2,997,854 | 210,939 | 107,629 |
| Shares Outstanding | 467,821 | 498,727 | 2,997,581 | 210,933 | 107,603 |
| Net Asset Value Per Share ($) | 1.00 | 1.00 | 1.00 | 1.00 | 1.00 |
| Investor Shares | | | | | |
| Net Assets ($) | 260,810 | 255,045 | 388,957 | 68,614 | 60,760 |
| Shares Outstanding | 260,736 | 255,036 | 388,925 | 68,611 | 60,746 |
| Net Asset Value Per Share ($) | 1.00 | 1.00 | 1.00 | 1.00 | 1.00 |
| Administrative Shares | | | | | |
| Net Assets ($) | 488,832 | 58,833 | 82,779 | 4,090 | 7,774 |
| Shares Outstanding | 488,718 | 58,831 | 82,770 | 4,089 | 7,772 |
| Net Asset Value Per Share ($) | 1.00 | 1.00 | 1.00 | 1.00 | 1.00 |
| Participant Shares | | | | | |
| Net Assets ($) | 23,368 | 8,591 | 16,565 | 49,525 | 10 |
| Shares Outstanding | 23,362 | 8,591 | 16,564 | 49,523 | 10 |
| Net Asset Value Per Share ($) | 1.00 | 1.00 | 1.00 | 1.00 | 1.00 |
| Agency Shares | | | | | |
| Net Assets ($) | 716 | 1 | 294 | 1 | — |
| Shares Outstanding | 716 | 1 | 294 | 1 | — |
| Net Asset Value Per Share ($) | 1.00 | 1.00 | 1.00 | 1.00 | — |
| Classic Shares | | | | | |
| Net Assets ($) | — | — | — | — | 9,315 |
| Shares Outstanding | — | — | — | — | 9,313 |
| Net Asset Value Per Share ($) | — | — | — | — | 1.00 |
| † Investments at cost ($) | 1,235,706 | 819,779 | 3,476,958 | 332,704 | 192,717 |
| |
| See notes to financial statements. | | | | | |
56
STATEMENT OF OPERATIONS
(amounts in thousands)
Six Months Ended July 31, 2010 (Unaudited)
| | | | | | |
| | | Dreyfus | Dreyfus | Dreyfus | Dreyfus | Dreyfus |
| | Dreyfus | Cash | Government | Government | Treasury & | Treasury |
| | Cash | Management | Cash | Prime Cash | Agency Cash | Prime Cash |
| Management | Plus, Inc. | Management | Management | Management | Management |
| Investment Income ($): | | | | | | |
| Interest Income | 50,545 | 9,342 | 30,499 | 5,100 | 13,469 | 14,839 |
| Expenses: | | | | | | |
| Management fee—Note 2(a) | 31,143 | 5,761 | 25,572 | 4,814 | 13,811 | 22,335 |
| Distribution fees—Note 2(b) | 6,074 | 2,178 | 3,757 | 2,026 | 3,863 | 9,993 |
| Custodian fees—Note 2(c) | 498 | 130 | 406 | 97 | 276 | 319 |
| Shareholder servicing costs—Note 2(c) | 364 | 133 | 162 | 62 | 397 | 236 |
| Registration fees | 139 | 110 | 167 | 186 | 83 | 122 |
| Trustees’/Directors’ fees and expenses—Note 2(d) | 67 | 10 | 47 | 9 | 25 | 43 |
| Professional fees | 35 | 22 | 25 | 7 | 26 | 27 |
| Prospectus and shareholders’ reports | — | 82 | 66 | 34 | 27 | 78 |
| Miscellaneous | 353 | 47 | 247 | 73 | 162 | 248 |
| Total Expenses | 38,673 | 8,473 | 30,449 | 7,308 | 18,670 | 33,401 |
| Less—reduction in expenses | | | | | | |
| due to undertaking—Note 2(a) | (3,269) | (837) | (3,505) | (2,315) | (5,256) | (18,569) |
| Less—reduction in management fee | | | | | | |
| due to undertaking—Note 2(a) | — | (1,880) | — | — | — | — |
| Less—reduction in fees | | | | | | |
| due to earnings credits—Note 1(b) | —a | —a | (2) | (1) | (6) | (4) |
| Net Expenses | 35,404 | 5,756 | 26,942 | 4,992 | 13,408 | 14,828 |
| Investment Income—Net | 15,141 | 3,586 | 3,557 | 108 | 61 | 11 |
| Realized and Unrealized Gain (Loss) on | | | | | | |
| Investments—Note 1(b) ($) | — | 6 | (7) | (1) | 30 | (18) |
| Net Increase (Decrease) in Net Assets | | | | | | |
| Resulting from Operations | 15,141 | 3,592 | 3,550 | 107 | 91 | (7) |
| a Amount represents less than $1,000. | | | | | | |
| See notes to financial statements. | | | | | | |
STATEMENT OF OPERATIONS (continued)
(amounts in thousands)
Six Months Ended July 31, 2010 (Unaudited)
| | | | | |
| | | | | Dreyfus | Dreyfus |
| | Dreyfus | Dreyfus | Dreyfus | California | New York |
| | Municipal Cash | New York | Tax Exempt | AMT-Free | AMT-Free |
| | Management | Municipal Cash | Cash | Municipal Cash | Municipal Cash |
| | Plus | Management | Management | Management | Management |
| Investment Income ($): | | | | | |
| Interest Income | 2,376 | 1,564 | 5,953 | 536 | 416 |
| Expenses: | | | | | |
| Management fee—Note 2(a) | 1,295 | 880 | 3,806 | 279 | 238 |
| Distribution fees—Note 2(b) | 694 | 395 | 571 | 177 | 209 |
| Registration fees | 60 | 24 | 98 | 5 | — |
| Custodian fees—Note 2(c) | 53 | 53 | 80 | 16 | — |
| Professional fees | 29 | 28 | 32 | 24 | — |
| Shareholder servicing costs—Note 2(c) | 28 | 14 | 229 | 3 | — |
| Prospectus and shareholders’ reports | 13 | 14 | 18 | 1 | — |
| Trustees’ fees and expenses—Note 2(d) | 3 | 2 | 8 | 1 | — |
| Miscellaneous | 26 | 17 | 74 | 9 | — |
| Total Expenses | 2,201 | 1,427 | 4,916 | 515 | 447 |
| Less—reduction in expenses | | | | | |
| due to undertaking—Note 2(a) | (225) | (191) | (339) | (95) | (118) |
| Less—reduction in fees due | | | | | |
| to earnings credits—Note 1(b) | —a | —a | —a | —a | — |
| Net Expenses | 1,976 | 1,236 | 4,577 | 420 | 329 |
| Investment Income—Net | 400 | 328 | 1,376 | 116 | 87 |
| Net Realized Gain (Loss) on | | | | | |
| Investments—Note 1(b) ($) | — | 3 | — | — | — |
| Net Increase in Net Assets | | | | | |
| Resulting from Operations | 400 | 331 | 1,376 | 116 | 87 |
| |
| a Amount represents less than $1,000. | | | | | |
| See notes to financial statements. | | | | | |
58
STATEMENT OF CHANGES IN NET ASSETS
(amounts in thousands)
| | | | |
| | Dreyfus Cash Management | Dreyfus Cash Management Plus, Inc. |
| | Six Months Ended | Year Ended | Six Months Ended | Year Ended |
| | July 31, 2010 | January 31, | July 31, 2010 | January 31, |
| | (Unaudited) | 2010 | (Unaudited) | 2010 |
| |
| Operations ($): | | | | |
| Investment income—net | 15,141 | 151,861 | 3,586 | 21,224 |
| Net realized gain (loss) on investments | — | 231 | 6 | (81,757) |
| Net unrealized appreciation (depreciation) on investments | — | — | — | 32,337 |
| Net Increase from payment by affiliate | — | — | — | 68,407 |
| Net Increase (Decrease) in Net Assets | | | | |
| Resulting from Operations | 15,141 | 152,092 | 3,592 | 40,211 |
| Dividends to Shareholders from ($): | | | | |
| Investment income—net: | | | | |
| Institutional Shares | (15,030) | (134,824) | (3,347) | (14,894) |
| Investor Shares | (1) | (10,304) | (17) | (2,497) |
| Administrative Shares | (86) | (4,339) | (222) | (3,054) |
| Participant Shares | —a | (1,690) | —a | (771) |
| Service Shares | — | — | —a | (3) |
| Select Shares | — | — | —a | (5) |
| Agency Shares | (24) | (704) | —a | —a |
| Total Dividends | (15,141) | (151,861) | (3,586) | (21,224) |
| Beneficial Interest/Capital Stock | | | | |
| Transactions ($1.00 per share): | | | | |
| Net proceeds from shares sold: | | | | |
| Institutional Shares | 55,865,695 | 205,919,725 | 8,359,403 | 18,044,547 |
| Investor Shares | 6,305,971 | 15,180,824 | 683,184 | 2,315,173 |
| Administrative Shares | 1,044,241 | 3,832,973 | 940,640 | 2,041,658 |
| Participant Shares | 1,581,237 | 4,130,178 | 735,412 | 1,684,262 |
| Service Shares | — | — | 1,395,367 | 45,157 |
| Select Shares | — | — | 8,318 | 24,034 |
| Agency Shares | 29,925 | 317,162 | —a | — |
| Capital contribution from affiliate—Note 2(e): | | | | |
| Institutional Shares | — | — | 3,215 | — |
| Investor Shares | — | — | 623 | — |
| Administrative Shares | — | — | 668 | — |
| Participant Shares | — | — | 492 | — |
| Service Shares | — | — | 7 | — |
| Select Shares | — | — | 7 | — |
| Agency Shares | — | — | —a | — |
| Dividends reinvested: | | | | |
| Institutional Shares | 2,683 | 34,050 | 1,215 | 6,598 |
| Investor Shares | —a | 1,925 | 16 | 2,121 |
| Administrative Shares | 41 | 1,264 | 175 | 2,588 |
| Participant Shares | —a | 358 | —a | 717 |
| Service Shares | — | — | — | —a |
| Agency Shares | 1 | 335 | —a | —a |
| Cost of shares redeemed: | | | | |
| Institutional Shares | (65,542,462) | (203,484,505) | (7,983,336) | (18,089,064) |
| Investor Shares | (6,956,918) | (16,619,109) | (631,294) | (2,889,192) |
| Administrative Shares | (1,524,442) | (3,897,228) | (746,579) | (2,503,691) |
| Participant Shares | (1,504,426) | (4,592,274) | (786,637) | (2,396,803) |
| Service Shares | — | — | (1,380,351) | (49,976) |
| Select Shares | — | — | (7,141) | (47,374) |
| Agency Shares | (41,478) | (326,276) | — | — |
| Increase (Decrease) in Net Assets from | | | | |
| Beneficial Interest/Capital Stock Transactions | (10,739,932) | 499,402 | 593,404 | (1,809,245) |
| Total Increase (Decrease) In Net Assets | (10,739,932) | 499,633 | 593,410 | (1,790,258) |
| Net Assets ($): | | | | |
| Beginning of Period | 39,541,195 | 39,041,562 | 5,677,854 | 7,468,112 |
| End of Period | 28,801,263 | 39,541,195 | 6,271,264 | 5,677,854 |
|
| a Amount represents less than $1,000. |
| See notes to financial statements. |
STATEMENT OF CHANGES IN NET ASSETS (continued)
(amounts in thousands)
| | | | |
| | Dreyfus Government | Dreyfus Government |
| | Cash Management | Prime Cash Management |
| | Six Months Ended | Year Ended | Six Months Ended | Year Ended |
| | July 31, 2010 | January 31, | July 31, 2010 | January 31, |
| | (Unaudited) | 2010 | (Unaudited) | 2010 |
| Operations ($): | | | | |
| Investment income—net | 3,557 | 55,790 | 108 | 5,610 |
| Net realized gain (loss) on investments | (7) | 138 | (1) | 13 |
| Net Increase (Decrease) in Net Assets | | | | |
| Resulting from Operations | 3,550 | 55,928 | 107 | 5,623 |
| Dividends to Shareholders from ($): | | | | |
| Investment income—net: | | | | |
| Institutional Shares | (3,557) | (52,625) | (108) | (5,334) |
| Investor Shares | —a | (1,261) | —a | (30) |
| Administrative Shares | —a | (1,737) | —a | (238) |
| Participant Shares | —a | (56) | —a | (1) |
| Agency Shares | —a | (111) | —a | (26) |
| Total Dividends | (3,557) | (55,790) | (108) | (5,629) |
| Beneficial Interest Transactions ($1.00 per share): | | | | |
| Net proceeds from shares sold: | | | | |
| Institutional Shares | 71,708,893 | 164,894,102 | 7,202,807 | 19,903,414 |
| Investor Shares | 3,446,456 | 7,738,977 | 868,841 | 2,096,688 |
| Administrative Shares | 1,350,160 | 3,193,172 | 2,490,818 | 5,145,416 |
| Participant Shares | 884,910 | 2,203,530 | 540,794 | 1,568,552 |
| Agency Shares | 88,526 | 231,624 | 51,806 | 190,988 |
| Dividends reinvested: | | | | |
| Institutional Shares | 684 | 14,771 | 16 | 1,794 |
| Investor Shares | 8 | 735 | 1 | 13 |
| Administrative Shares | 3 | 1,361 | 1 | 209 |
| Participant Shares | 1 | 29 | 1 | 1 |
| Agency Shares | —a | —a | — | —a |
| Cost of shares redeemed: | | | | |
| Institutional Shares | (73,545,227) | (174,661,061) | (7,524,756) | (23,196,803) |
| Investor Shares | (3,390,302) | (9,588,829) | (986,456) | (2,681,628) |
| Administrative Shares | (1,339,151) | (4,623,225) | (2,357,857) | (5,342,373) |
| Participant Shares | (807,755) | (2,526,210) | (746,488) | (2,208,938) |
| Agency Shares | (97,238) | (244,894) | (104,143) | (142,069) |
| Increase (Decrease) in Net Assets from | | | | |
| Beneficial Interest Transactions | (1,700,032) | (13,365,918) | (564,615) | (4,664,736) |
| Total Increase (Decrease) In Net Assets | (1,700,039) | (13,365,780) | (564,616) | (4,664,742) |
| Net Assets ($): | | | | |
| Beginning of Period | 27,413,268 | 40,779,048 | 5,033,266 | 9,698,008 |
| End of Period | 25,713,229 | 27,413,268 | 4,468,650 | 5,033,266 |
| |
| a Amount represents less than $1,000. | | | | |
| See notes to financial statements. | | | | |
60
| | | | |
| | Dreyfus Treasury & | Dreyfus Treasury |
| | Agency Cash Management | Prime Cash Management |
| | Six Months Ended | Year Ended | Six Months Ended | Year Ended |
| | July 31, 2010 | January 31, | July 31, 2010 | January 31, |
| | (Unaudited) | 2010 | (Unaudited) | 2010 |
| Operations ($): | | | | |
| Investment income—net | 61 | 10,789 | 11 | 5,500 |
| Net realized gain (loss) on investments | 30 | 136 | (18) | 102 |
| Net Increase (Decrease) in Net Assets | | | | |
| Resulting from Operations | 91 | 10,925 | (7) | 5,602 |
| Dividends to Shareholders from ($): | | | | |
| Investment income—net: | | | | |
| Institutional Shares | (61) | (10,543) | (6) | (5,594) |
| Investor Shares | —a | (5) | (3) | (9) |
| Administrative Shares | —a | (214) | (1) | (11) |
| Participant Shares | —a | (1) | (1) | (6) |
| Service Shares | —a | —a | — | — |
| Select Shares | —a | —a | — | — |
| Agency Shares | —a | (26) | —a | (13) |
| Premier Shares | —a | —a | — | — |
| Total Dividends | (61) | (10,789) | (11) | (5,633) |
| Beneficial Interest Transactions ($1.00 per share): | | | |
| Net proceeds from shares sold: | | | | |
| Institutional Shares | 22,218,993 | 68,033,436 | 25,555,987 | 60,299,612 |
| Investor Shares | 6,044,447 | 11,174,580 | 4,736,056 | 9,985,602 |
| Administrative Shares | 1,221,622 | 4,043,353 | 1,471,402 | 4,671,129 |
| Participant Shares | 764,042 | 2,139,953 | 4,998,495 | 11,299,483 |
| Service Shares | 869 | 5,379 | — | — |
| Select Shares | 41,600 | 69,667 | — | — |
| Agency Shares | 24,145 | 208,593 | 89,253 | 666,934 |
| Premier Shares | 162,541 | 886,267 | — | — |
| Dividends reinvested: | | | | |
| Institutional Shares | 13 | 3,198 | 23 | 2,210 |
| Investor Shares | 1 | 1 | 10 | 5 |
| Administrative Shares | —a | 135 | 3 | 6 |
| Participant Shares | —a | —a | 9 | 5 |
| Service Shares | —a | —a | — | — |
| Select Shares | —a | —a | — | — |
| Agency Shares | —a | —a | —a | 10 |
| Premier Shares | —a | —a | — | — |
| Cost of shares redeemed: | | | | |
| Institutional Shares | (25,739,700) | (72,482,785) | (31,023,332) | (72,138,346) |
| Investor Shares | (6,190,309) | (12,569,809) | (5,633,213) | (13,286,181) |
| Administrative Shares | (1,555,209) | (4,703,968) | (1,565,360) | (5,925,054) |
| Participant Shares | (787,370) | (2,063,624) | (5,118,844) | (14,137,635) |
| Service Shares | (1,597) | (5,553) | — | — |
| Select Shares | (50,834) | (77,569) | — | — |
| Agency Shares | (36,269) | (201,117) | (386,464) | (694,755) |
| Premier Shares | (161,708) | (860,009) | — | — |
| Increase (Decrease) in Net Assets from | | | | |
| Beneficial Interest Transactions | (4,044,723) | (6,399,872) | (6,875,975) | (19,256,975) |
| Total Increase (Decrease) In Net Assets | (4,044,693) | (6,399,736) | (6,875,993) | (19,257,006) |
| Net Assets ($): | | | | |
| Beginning of Period | 15,313,468 | 21,713,204 | 27,224,610 | 46,481,616 |
| End of Period | 11,268,775 | 15,313,468 | 20,348,617 | 27,224,610 |
|
| a Amount represents less than $1,000. |
| See notes to financial statements. |
STATEMENT OF CHANGES IN NET ASSETS (continued)
(amounts in thousands)
| | | | |
| | Dreyfus Municipal | Dreyfus New York |
| | Cash Management Plus | Municipal Cash Management |
| | Six Months Ended | Year Ended | Six Months Ended | Year Ended |
| | July 31, 2010 | January 31, | July 31, 2010 | January 31, |
| | (Unaudited) | 2010 | (Unaudited) | 2010 |
| Operations ($): | | | | |
| Investment income—net | 400 | 8,292 | 328 | 3,592 |
| Net realized gain (loss) on investments | — | 3 | 3 | 31 |
| Net Increase (Decrease) in Net Assets | | | | |
| Resulting from Operations | 400 | 8,295 | 331 | 3,623 |
| Dividends to Shareholders from ($): | | | | |
| Investment income—net: | | | | |
| Institutional Shares | (295) | (4,713) | (320) | (2,573) |
| Investor Shares | —a | (835) | —a | (851) |
| Administrative Shares | (105) | (2,815) | (8) | (202) |
| Participant Shares | —a | (96) | —a | (54) |
| Agency Shares | —a | (8) | —a | —a |
| Total Dividends | (400) | (8,467) | (328) | (3,680) |
| Beneficial Interest Transactions ($1.00 per share): | | | | |
| Net proceeds from shares sold: | | | | |
| Institutional Shares | 1,299,000 | 6,300,589 | 512,190 | 1,100,157 |
| Investor Shares | 209,649 | 703,488 | 344,804 | 889,613 |
| Administrative Shares | 411,657 | 1,559,147 | 36,605 | 90,472 |
| Participant Shares | 21,611 | 62,395 | 4,852 | 91,910 |
| Agency Shares | —a | 14,601 | — | — |
| Dividends reinvested: | | | | |
| Institutional Shares | 229 | 2,833 | 80 | 444 |
| Investor Shares | —a | 801 | —a | 731 |
| Administrative Shares | 105 | 2,711 | 8 | 197 |
| Participant Shares | —a | 96 | —a | 54 |
| Agency Shares | —a | 6 | —a | —a |
| Cost of shares redeemed: | | | | |
| Institutional Shares | (1,191,205) | (6,532,452) | (602,535) | (1,055,760) |
| Investor Shares | (349,424) | (596,560) | (371,623) | (982,328) |
| Administrative Shares | (504,670) | (1,604,890) | (47,427) | (82,764) |
| Participant Shares | (21,257) | (100,239) | (8,473) | (130,790) |
| Agency Shares | (431) | (13,462) | — | — |
| Increase (Decrease) in Net Assets from | | | | |
| Beneficial Interest Transactions | (124,736) | (200,936) | (131,519) | (78,064) |
| Total Increase (Decrease) In Net Assets | (124,736) | (201,108) | (131,516) | (78,121) |
| Net Assets ($): | | | | |
| Beginning of Period | 1,366,391 | 1,567,499 | 952,732 | 1,030,853 |
| End of Period | 1,241,655 | 1,366,391 | 821,216 | 952,732 |
| |
| a Amount represents less than $1,000. | | | | |
| See notes to financial statements. | | | | |
62
| | | | |
| | Dreyfus Tax Exempt | Dreyfus California AMT-Free |
| | Cash Management | Municipal Cash Management |
| | Six Months Ended | Year Ended | Six Months Ended | Year Ended |
| | July 31, 2010 | January 31, | July 31, 2010 | January 31, |
| | (Unaudited) | 2010 | (Unaudited) | 2010 |
| Operations ($): | | | | |
| Investment income—net | 1,376 | 23,272 | 116 | 676 |
| Net realized gain (loss) on investments | — | 315 | — | — |
| Net Increase (Decrease) in Net Assets | | | | |
| Resulting from Operations | 1,376 | 23,587 | 116 | 676 |
| Dividends to Shareholders from ($): | | | | |
| Investment income—net: | | | | |
| Institutional Shares | (1,368) | (20,448) | (115) | (462) |
| Investor Shares | (2) | (1,122) | —a | (86) |
| Administrative Shares | (6) | (1,629) | (1) | (28) |
| Participant Shares | —a | (189) | —a | (115) |
| Agency Shares | —a | (24) | —a | —a |
| Total Dividends | (1,376) | (23,412) | (116) | (691) |
| Beneficial Interest Transactions ($1.00 per share): | | | | |
| Net proceeds from shares sold: | | | | |
| Institutional Shares | 7,299,488 | 17,954,303 | 263,987 | 331,375 |
| Investor Shares | 305,648 | 870,127 | 38,400 | 181,355 |
| Administrative Shares | 55,365 | 779,288 | 14,177 | 76,700 |
| Participant Shares | 45,551 | 227,547 | 32,585 | 85,895 |
| Agency Shares | 263 | 28,927 | —a | —a |
| Dividends reinvested: | | | | |
| Institutional Shares | 649 | 10,310 | 115 | 409 |
| Investor Shares | 2 | 883 | —a | 86 |
| Administrative Shares | 6 | 1,381 | 1 | 28 |
| Participant Shares | —a | 1 | —a | 115 |
| Agency Shares | —a | 21 | —a | —a |
| Cost of shares redeemed: | | | | |
| Institutional Shares | (7,685,388) | (19,772,464) | (192,100) | (284,010) |
| Investor Shares | (270,487) | (1,082,483) | (33,531) | (141,488) |
| Administrative Shares | (92,739) | (1,305,085) | (14,278) | (72,589) |
| Participant Shares | (56,069) | (334,628) | (39,129) | (126,545) |
| Agency Shares | (7,016) | (26,239) | — | —a |
| Increase (Decrease) in Net Assets from | | | | |
| Beneficial Interest Transactions | (404,727) | (2,648,111) | 70,227 | 51,331 |
| Total Increase (Decrease) In Net Assets | (404,727) | (2,647,936) | 70,227 | 51,316 |
| Net Assets ($): | | | | |
| Beginning of Period | 3,891,176 | 6,539,112 | 262,942 | 211,626 |
| End of Period | 3,486,449 | 3,891,176 | 333,169 | 262,942 |
| |
| a Amount represents less than $1,000. | | | | |
| See notes to financial statements. | | | | |
STATEMENT OF CHANGES IN NET ASSETS (continued)
(amounts in thousands)
| | |
| | Dreyfus New York AMT-Free |
| | Municipal Cash Management |
| | Six Months Ended | Year Ended |
| | July 31, 2010 | January 31, |
| | (Unaudited) | 2010 |
| Operations ($): | | |
| Investment income—net | 87 | 586 |
| Net realized gain (loss) on investments | — | 8 |
| Net Increase (Decrease) in Net Assets Resulting from Operations | 87 | 594 |
| Dividends to Shareholders from ($): | | |
| Investment income—net: | | |
| Institutional Shares | (85) | (247) |
| Investor Shares | —a | (236) |
| Administrative Shares | (2) | (2) |
| Participant Shares | —a | —a |
| Classic Shares | —a | (101) |
| Total Dividends | (87) | (586) |
| Beneficial Interest Transactions ($1.00 per share): | | |
| Net proceeds from shares sold: | | |
| Institutional Shares | 84,284 | 196,310 |
| Investor Shares | 80,651 | 193,259 |
| Administrative Shares | 13,093 | 31,044 |
| Participant Shares | —a | —a |
| Classic Shares | 125,437 | 304,233 |
| Dividends reinvested: | | |
| Institutional Shares | 60 | 52 |
| Investor Shares | —a | 62 |
| Administrative Shares | 2 | 2 |
| Classic Shares | —a | 101 |
| Cost of shares redeemed: | | |
| Institutional Shares | (87,007) | (135,412) |
| Investor Shares | (93,410) | (221,786) |
| Administrative Shares | (13,466) | (22,912) |
| Participant Shares | — | —a |
| Classic Shares | (175,692) | (321,100) |
| Increase (Decrease) in Net Assets from | | |
| Beneficial Interest Transactions | (66,048) | 23,853 |
| Total Increase (Decrease) In Net Assets | (66,048) | 23,861 |
| Net Assets ($): | | |
| Beginning of Period | 251,536 | 227,675 |
| End of Period | 185,488 | 251,536 |
| |
| a Amount represents less than $1,000. | | |
| See notes to financial statements. | | |
64
FINANCIAL HIGHLIGHTS
The following tables describe the performance for each share class for the fiscal periods indicated. All information reflects financial results for a single fund share.Total return shows how much your investment in the fund would have increased (or decreased) during each period, assuming you had reinvested all dividends and distributions. These figures have been derived from the fund’s financial statements. Please note that the financial highlights information in the following tables for Dreyfus New York AMT-Free Municipal Cash Management’s Institutional, Investor and Classic shares represents the financial highlights of Dreyfus New York AMT-Free Municipal Cash Management’s predecessor, BNY Hamilton New York AMT-Free Municipal Money Fund (New York AMT-Free Municipal Money Fund), before Dreyfus NewYork AMT-Free Municipal Cash Management commenced operations as of the close of business on September 12, 2008, and re presents the performance of Dreyfus NewYork AMT-Free Municipal Cash Management’s Institutional, Investor and Classic shares thereafter. Before Dreyfus New York AMT-Free Municipal Cash Management commenced operations, all of the assets of the New York AMT-Free Municipal Money Fund were transferred to Dreyfus New York AMT-Free Municipal Cash Management in exchange for Institutional, Investor and Classic shares of the fund in a tax-free reorganization.Total return shows how much your investment in Dreyfus New York AMT-Free Municipal Cash Management would have increased (or decreased) during each period, assuming you had reinvested all dividends and distributions. These figures have been derived from Dreyfus NewYork AMT-Free Municipal Cash Management’s predecessor’s financial statements.

| |
| a | Annualized. |
| b | Expense waivers and/or reimbursements amounted to less than .01%. |
| c | Amount represents less than $.001 per share. |
| d | Amount represents less than .01%. |
| e | From October 1, 2007 (commencement of initial offering) to January 31, 2008. |
See notes to financial statements.
FINANCIAL HIGHLIGHTS (continued)
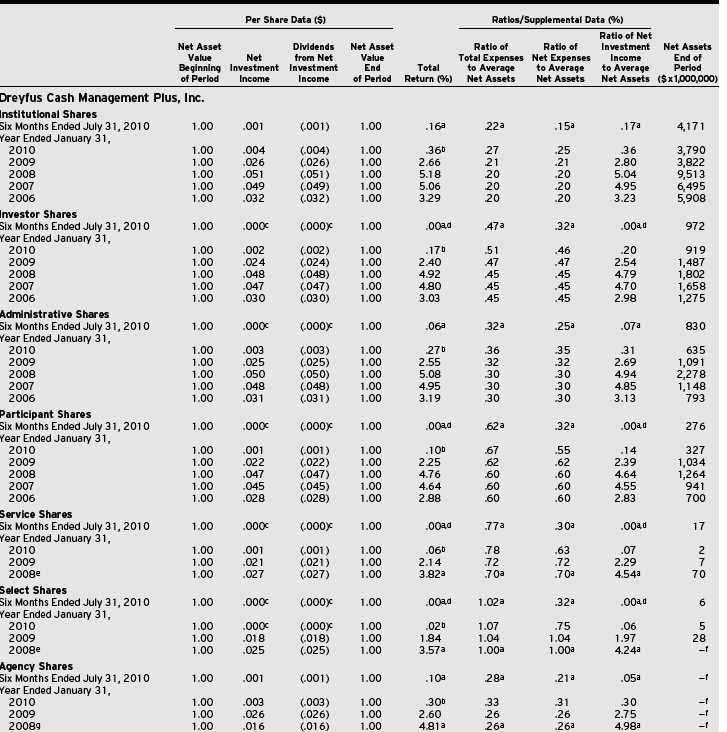
|
| a Annualized. |
| b If payment pursuant to the Capital Support Agreement was not made, total return would have been (1.65)% for Institutional Shares, (1.83)% for Investor Shares, (1.74)% for |
| Administrative Shares, (1.90)% for Participant Shares, (1.94)% for Service Shares, (1.98)% for Select Shares and (1.71)% for Agency Shares. |
| c Amount represents less than $.001 per share. |
| d Amount represents less than .01%. |
| e From June 29, 2007 (commencement of initial offering) to January 31, 2008. |
| f Amount represents less than $1 million. |
| g From October 1, 2007 (commencement of initial offering) to January 31, 2008. |
See notes to financial statements.
66
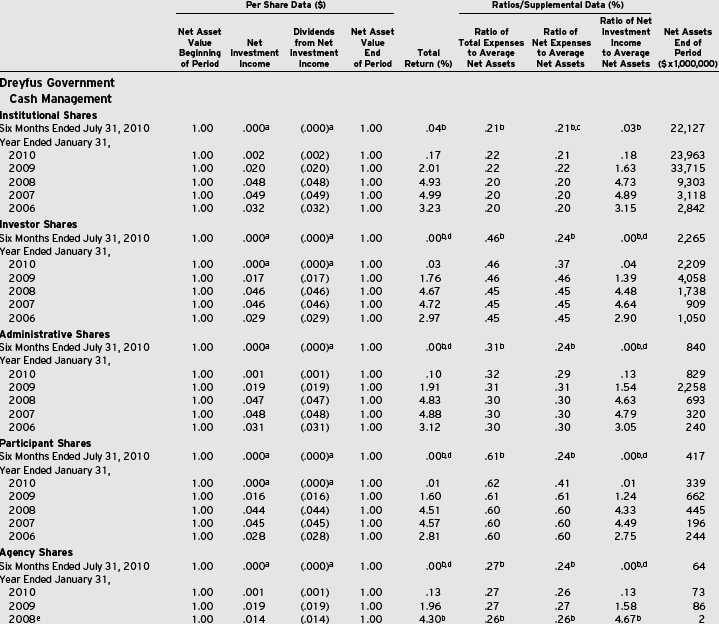
| |
| a | Amount represents less than $.001 per share. |
| b | Annualized. |
| c | Expense waivers and/or reimbursements amounted to less than .01%. |
| d | Amount represents less than .01%. |
| e | From October 1, 2007 (commencement of initial offering) to January 31, 2008. |
See notes to financial statements.
FINANCIAL HIGHLIGHTS (continued)

| |
| a | Amount represents less than $.001 per share. |
| b | Annualized. |
| c | Amount represents less than .01%. |
| d | From October 1, 2007 (commencement of initial offering) to January 31, 2008. |
See notes to financial statements.
68
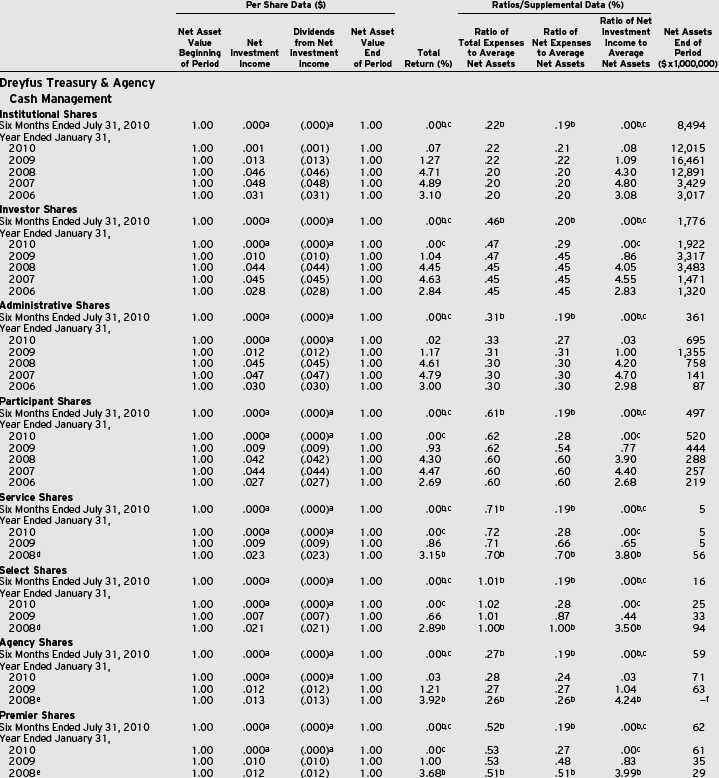
| |
| a | Amount represents less than $.001 per share. |
| b | Annualized. |
| c | Amount represents less than .01%. |
| d | From June 29, 2007 (commencement of initial offering) to January 31, 2008. |
| e | From October 1, 2007 (commencement of initial offering) to January 31, 2008. |
| f | Amount represents less than $1 million. |
See notes to financial statements.
FINANCIAL HIGHLIGHTS (continued)
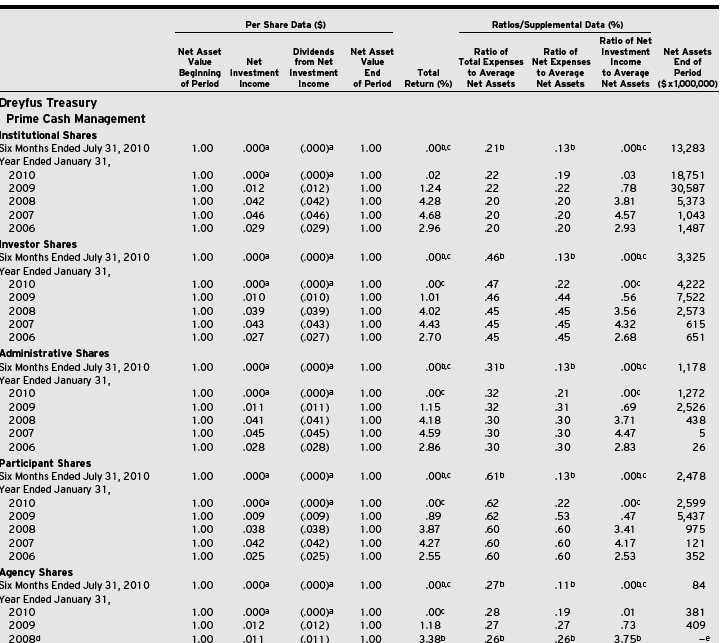
| |
| a | Amount represents less than $.001 per share. |
| b | Annualized. |
| c | Amount represents less than .01%. |
| d | From October 1, 2007 (commencement of initial offering) to January 31, 2008. |
| e | Amount represents less than $1 million. |
See notes to financial statements.
70
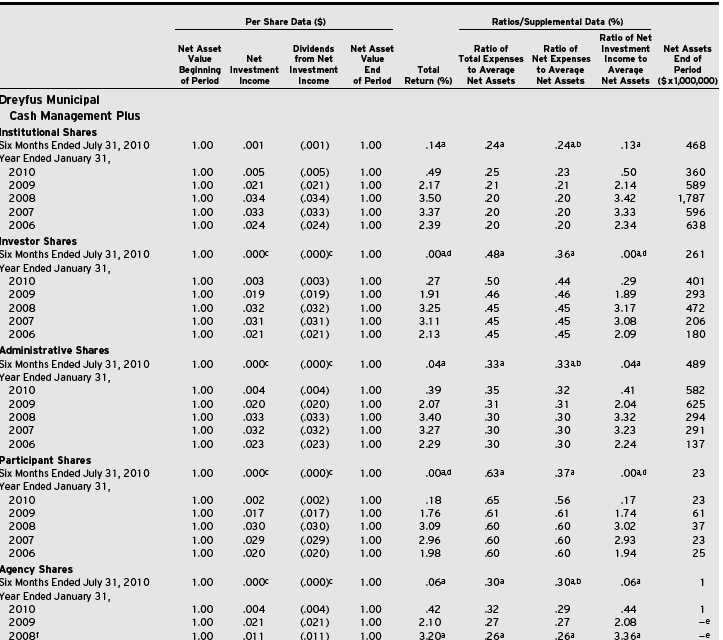
| |
| a | Annualized. |
| b | Expense waivers and/or reimbursements amounted to less than .01%. |
| c | Amount represents less than $.001 per share. |
| d | Amount represents less than .01%. |
| e | Amount represents less than $1 million. |
| f | From October 1, 2007 (commencement of initial offering) to January 31, 2008. |
See notes to financial statements.
FINANCIAL HIGHLIGHTS (continued)
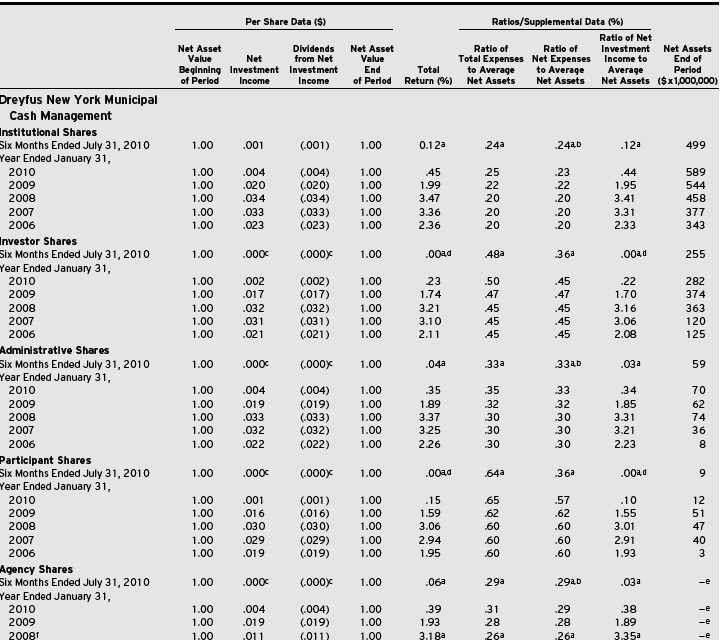
| |
| a | Annualized. |
| b | Expense waivers and/or reimbursements amounted to less than .01%. |
| c | Amount represents less than $.001 per share. |
| d | Amount represents less than .01%. |
| e | Amount represents less than $1 million. |
| f | From October 1, 2007 (commencement of initial offering) to January 31, 2008. |
See notes to financial statements.
72

| |
| a | Amount represents less than $.001 per share. |
| b | Annualized. |
| c | Expense waivers and/or reimbursements amounted to less than .01%. |
| d | Amount represents less than .01%. |
| e | Amount represents less than $1 million. |
| f | From October 1, 2007 (commencement of initial offering) to January 31, 2008. |
See notes to financial statements.
FINANCIAL HIGHLIGHTS (continued)

| |
| a | Annualized. |
| b | Expense waivers and/or reimbursements amounted to less than .01%. |
| c | From August 1, 2007 (commencement of operations) to January 31, 2008. |
| d | Amount represents less than $.001 per share. |
| e | Amount represents less than .01%. |
| f | Amount represents less than $1 million. |
| g | From October 1, 2007 (commencement of initial offering) to January 31, 2008. |
See notes to financial statements.
74
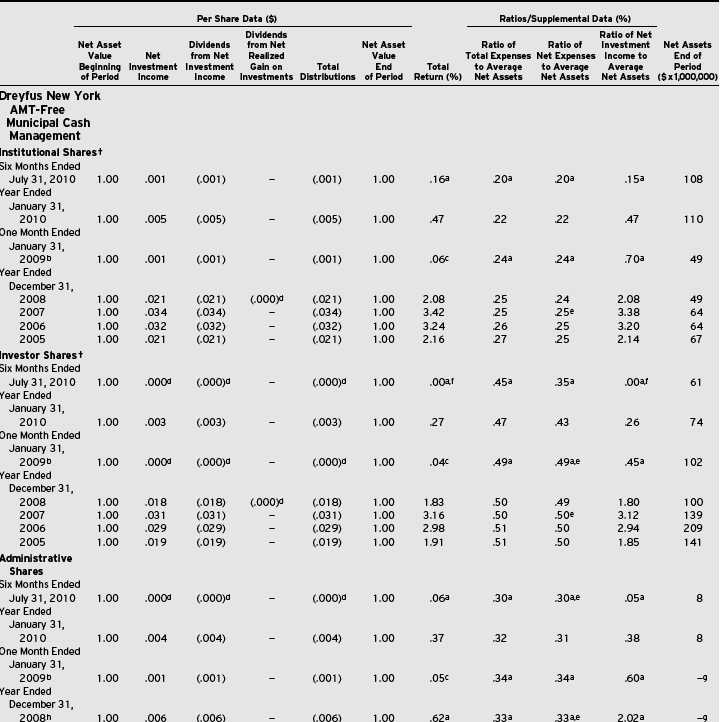
FINANCIAL HIGHLIGHTS (continued)

|
| † Represents information for the fund’s predecessor, BNY Hamilton NewYork AMT-Free Money Market Fund through September 12, 2008. |
| a Annualized. |
| b The fund has changed its fiscal year end from December 31 to January 31. |
| c Not annualized. |
| d Amount represents less than $.001 per share. |
| e Expense waivers and/or reimbursements amounted to less than .01%. |
| f Amount represents less than .01%. |
| g Amount represents less than $1 million. |
| h From September 13, 2008 (commencement of initial offering) to December 31, 2008. |
See notes to financial statements.
76
NOTES TO FINANCIAL STATEMENTS (Unaudited)
NOTE 1—Significant Accounting Policies:
Dreyfus Cash Management, Dreyfus Cash Management Plus, Inc., Dreyfus Government Cash Management, Dreyfus Government Prime Cash Management, Dreyfus Treasury & Agency Cash Management, Dreyfus Treasury Prime Cash Management, Dreyfus Municipal Cash Management Plus, Dreyfus New York Municipal Cash Management, Dreyfus Tax Exempt Cash Management, Dreyfus California AMT-Free Municipal Cash Management and Dreyfus New York AMT-Free Municipal Cash Management (each, a “fund” and collectively, the “funds”) are open-end management investment companies registered under the Investment Company Act of 1940, as amended (the “Act”). Each fund, other than Dreyfus New York Municipal Cash Management, Dreyfus California AMT-Free Municipal Cash Management and Dreyfus New York AMT-Free Municipal Cash Management is diversified. Dreyfus New York Municipal Cash Management, Dreyfus California AMT-Free Municipal Cash Managem ent and Dreyfus New York AMT-Free Municipal Cash Management are non-diversified. Dreyfus Government Cash Management and Dreyfus Government Prime Cash Management are each a separate series of Dreyfus Government Cash Management Funds (the “Company”) and Dreyfus Tax Exempt Cash Management, Dreyfus California AMT-Free Municipal Cash Management and Dreyfus New York AMT-Free Municipal Cash Management are separate series of Dreyfus Tax Exempt Cash Management Funds (the “Trust”). Each fund’s investment objective is to provide investors with as high a level of current income as is consistent with the preservation of capital and the maintenance of liquidity and, in the case of Dreyfus Municipal Cash Management Plus and Dreyfus Tax Exempt Cash Management only, which are exempt from federal income tax; in the case of Dreyfus New York Municipal Cash Management and Dreyfus New York AMT-Free Municipal Cash Management, which is exempt from federal, New York state and NewYork city personal income tax es, and in the case of Dreyfus California AMT-Free Municipal Cash Management only, which is exempt from federal and California state personal income taxes. The Dreyfus Corporation (the “Manager” or “Dreyfus”), a wholly-owned subsidiary of The Bank of New York Mellon Corporation (“BNY Mellon”), serves as each fund’s investment adviser.
MBSC Securities Corporation (the “Distributor”), a wholly-owned subsidiary of the Manager, is the distributor of the funds’ shares, which are sold to the public without a sales charge. Each fund offers Institutional Shares, Investor Shares, Administrative Shares, Participant Shares and Agency Shares (with the exception of Dreyfus New York AMT-Free Municipal Cash Management which does not offer Agency Shares). In addition, Dreyfus Cash Management Plus, Inc. and Dreyfus Treasury & Agency Cash Management also offer Service Shares and Select Shares, Dreyfus Treasury & Agency Cash Management also offers Premier Shares and Dreyfus New York AMT-Free Municipal Cash Management also offers Classic Shares. Each share class, except Institutional Shares, are subject to a Service Plan adopted pursuant to Rule 12b-1 under the act. Other differences between the classes include the services offered (by service agents rece iving Rule 12b-1 fees) to and the expenses borne by each class and certain voting rights. Income, expenses (other than expenses attributable to a specific class), and realized and unrealized gains or losses on investments are allocated to each class of shares based on its relative net assets.
As of July 31, 2010, MBC Investments Corp., an indirect subsidiary of BNY Mellon, held the following shares:
| |
| Dreyfus Cash Management | |
| Plus, Inc., Agency Shares | 1,046 |
| |
| Dreyfus New York Municipal Cash | |
| Management, Agency Shares | 1,034 |
| |
| Dreyfus California AMT-Free | |
| Municipal Cash Management, | |
| Agency Shares | 1,032 |
It is each fund’s policy to maintain a continuous net asset value per share of $1.00; each fund has adopted certain investment, portfolio valuation and dividend and distribution policies to enable it to do so.There is no assurance, however, that any fund will be able to maintain a stable net asset value per share of $1.00.
NOTES TO FINANCIAL STATEMENTS (Unaudited) (continued)
The Company and the Trust account separately for the assets, liabilities and operations of each series. Expenses directly attributable to each series are charged to that series’ operations; expenses which are applicable to all series are allocated among them on a pro rata basis.
The Financial Accounting Standards Board (“FASB”) Accounting Standards Codification (“ASC”) is the exclusive reference of authoritative U.S. generally accepted accounting principles (“GAAP”) recognized by the FASB to be applied by nongovernmental entities. Rules and interpretive releases of the Securities and Exchange Commission (“SEC”) under authority of federal laws are also sources of authoritative GAAP for SEC registrants. Each fund’s financial statements are prepared in accordance with GAAP, which may require the use of management estimates and assumptions. Actual results could differ from those estimates.
The funds enter into contracts that contain a variety of indemnifications.The funds’ maximum exposure under these arrangements is unknown. The funds do not anticipate recognizing any loss related to these arrangements.
(a) Portfolio valuation: Investments in securities are valued at amortized cost in accordance with Rule 2a-7 of the Act,which has been determined by the Board of Trustees/Directors to represent the fair value of each fund’s investments.
The fair value of a financial instrument is the amount that would be received to sell an asset or paid to transfer a liability in an orderly transaction between market participants at the measurement date (i.e. the exit price). GAAP establishes a fair value hierarchy that prioritizes the inputs of valuation techniques used to measure fair value. This hierarchy gives the highest priority to unadjusted quoted prices in active markets for identical assets or liabilities (Level 1 measurements) and the lowest priority to unobservable inputs (Level 3 measurements).
Additionally, GAAP provides guidance on determining whether the volume and activity in a market has decreased significantly and whether such a decrease in activity results in transactions that are not orderly. GAAP requires enhanced disclosures around valuation inputs and techniques used during annual and interim periods.
Various inputs are used in determining the value of the each fund’s investments relating to fair value measurements.These inputs are summarized in the three broad levels listed below:
Level 1—unadjusted quoted prices in active markets for identical investments.
Level 2—other significant observable inputs (including quoted prices for similar investments, interest rates, prepayment speeds, credit risk, etc.).
Level 3—significant unobservable inputs (including the funds’ own assumptions in determining the fair value of investments).
The inputs or methodology used for valuing securities are not necessarily an indication of the risk associated with investing in those securities. For example, money market securities are valued using amortized cost, in accordance with rules under the Act. Generally, amortized cost approximates the current fair value of a security, but since the value is not obtained from a quoted price in an active market, such securities are reflected as Level 2.
Table 1 summarizes the inputs used as of July 31, 2010 in valuing each fund’s investments.
(b) Securities transactions and investment income:
Securities transactions are recorded on a trade date basis. Realized gains and losses from securities transactions are recorded on the identified cost basis. Interest income, adjusted for accretion of discount and amortization of premium on investments, is earned from settlement date and recognized on the accrual basis. Cost of investments represents amortized cost.
The funds (except Dreyfus New York AMT-Free Municipal Cash Management) have arrangements with the custodian and cash management bank whereby the funds may receive earnings credits when positive cash balances are maintained, which are used to offset custody and cash management fees. For financial reporting purposes, the funds include net earnings credits as an expense offset in the Statement of Operations.
Dreyfus New York Municipal Cash Management, Dreyfus California AMT-Free Municipal Cash Management and Dreyfus New York AMT-Free Municipal Cash Management
78
follow an investment policy of investing primarily in municipal obligations of one state. Economic changes affecting the state and certain of its public bodies and municipalities may affect the ability of issuers within the state to pay interest on, or repay principal of, municipal obligations held by the fund.
(c) Repurchase Agreements: Dreyfus Cash Management, Dreyfus Cash Management Plus, Inc., Dreyfus Government Cash Management and Dreyfus Treasury & Agency Cash Management may enter into repurchase agreements with financial institutions, deemed to be creditworthy by the Manager, subject to the seller’s agreement to repurchase and the fund’s agreement to resell such securities at a mutually agreed upon price. Securities purchased subject to repurchase agreements are deposited with the funds’ custodians and, pursuant to the terms of the repurchase agreement, must have an aggregate market value greater than or equal to the repurchase price plus accrued interest at all times. If the value of the underlying securities falls below the value of the repurchase price plus accrued interest, the fund will require the seller to deposit additional c ollateral by the next business day. If the request for additional collateral is not met, or the seller defaults on its repurchase obligation, the fund maintains its right to sell the underlying securities at market value and may claim any resulting loss against the seller.
(d) Dividends to shareholders: It is the policy of each fund to declare dividends from investment income-net on each business day. Such dividends are paid monthly. Dividends from net realized capital gains, if any, are normally declared and paid annually, but each fund may make distributions on a more frequent basis to comply with the distribution requirements of the Internal Revenue Code of 1986, as amended (the “Code”). To the extent that net realized capital gains can be offset by capital loss carryovers, it is the policy of each fund not to distribute such gains.
(e) Federal income taxes: It is the policy of Dreyfus Cash Management, Dreyfus Cash Management Plus, Inc., Dreyfus Government Cash Management, Dreyfus Government Prime Cash Management, Dreyfus Treasury & Agency Cash Management and Dreyfus Treasury Prime Cash Management to continue to qualify as a regulated investment company if such qualification is in the best interests of its shareholders, by complying with the applicable provisions of the Code and to make distributions of taxable income sufficient to relieve it from substantially all federal income and excise taxes.
| | | | |
| Table 1. | | | | |
| |
| | | Short-Term Investments ($)† | |
| | Level 1—Unadjusted | Level 2—Other Significant | Level 3—Significant | |
| | Quoted Prices | Observable Inputs | Unobservable Inputs | Total |
| Dreyfus Cash Management | — | 28,800,507,899 | — | 28,800,507,899 |
| Dreyfus Cash Management Plus, Inc. | — | 6,257,768,417 | — | 6,257,768,417 |
| Dreyfus Government Cash Management | — | 25,619,248,796 | — | 25,619,248,796 |
| Dreyfus Government Prime Cash Management | — | 4,460,703,033 | — | 4,460,703,033 |
| Dreyfus Treasury & Agency Cash Management | — | 11,221,106,614 | — | 11,221,106,614 |
| Dreyfus Treasury Prime Cash Management | — | 21,119,217,338 | — | 21,119,217,338 |
| Dreyfus Municipal Cash Management Plus | — | 1,235,705,687 | — | 1,235,705,687 |
| Dreyfus New York Municipal Cash Management | — | 819,778,892 | — | 819,778,892 |
| Dreyfus Tax Exempt Cash Management | — | 3,476,958,110 | — | 3,476,958,110 |
| Dreyfus California AMT—Free Municipal Cash Management | — | 332,703,879 | — | 332,703,879 |
| Dreyfus New York AMT—Free Municipal Cash Management | — | 192,716,681 | — | 192,716,681 |
| |
| † | See Statements of Investments for additional detailed categorizations. |
NOTES TO FINANCIAL STATEMENTS (Unaudited) (continued)
It is the policy of Dreyfus Municipal Cash Management Plus, Dreyfus New York Municipal Cash Management, Dreyfus Tax Exempt Cash Management, Dreyfus California AMT-Free Municipal Cash Management and Dreyfus New York AMT-Free Municipal Cash Management to continue to qualify as a regulated investment company, which can distribute tax exempt dividends, by complying with the applicable provisions of the Code and to make distributions of income and net realized gain sufficient to relieve it from substantially all federal income and excise taxes.
As of and during the period ended July 31, 2010, the funds did not have any liabilities for any uncertain tax positions. The funds recognize interest and penalties, if any, related to uncertain tax positions as income tax expense in the Statements of Operations. During the period, the funds did not incur any interest or penalties.
Each of the tax years in the three-year period ended January 31, 2010 remains subject to examination by the Internal Revenue Service and state taxing authorities.
Table 2 summarizes each relevant fund’s unused capital loss carryover available for federal income tax purposes to be applied against future net securities profits, if any, realized subsequent to January 31, 2010.
The tax character of distributions paid to shareholders for each fund (except for Dreyfus Municipal Cash Management Plus, Dreyfus New York Municipal Cash Management, Dreyfus Tax Exempt Cash Management, Dreyfus California AMT-Free Municipal Cash Management and Dreyfus New York AMT-Free Municipal Cash Management) during the fiscal year ended January 31, 2010 was all ordinary income. The tax character of current year distributions will be determined at the end of the current fiscal year.
Table 3 summarizes the tax character of distributions paid to shareholders of Dreyfus Municipal Cash Management Plus, Dreyfus New York Municipal Cash Management, Dreyfus Tax Exempt Cash Management, Dreyfus California AMT-Free Municipal Cash Management and Dreyfus New York AMT-Free Municipal Cash Management during the fiscal year ended January 31, 2010.
At July 31, 2010, the cost of investments for federal income tax purposes was substantially the same as the cost for financial reporting purposes (see the Statements of Investments).
| | | | | | |
| Table 2. | | | | | | |
| |
| | | Expiring in fiscal: | ($ x 1,000) | |
| | 2014† | 2015† | 2016† | 2017† | 2018† | Total |
| Dreyfus Cash Management | — | — | — | 2 | — | 2 |
| Dreyfus Cash Management Plus, Inc. | 4,986 | — | — | — | 13,350 | 18,336 |
| |
| † | If not applied, the carryovers expire in the above years. |
| | | |
| Table 3. | | | |
| |
| | Tax-Exempt | Ordinary | Long-Term |
| | Income | Income | Capital Gains |
| Dreyfus Municipal Cash Management Plus | 8,292 | 175 | — |
| Dreyfus New York Municipal Cash Management | 3,592 | 3 | 85 |
| Dreyfus Tax Exempt Cash Management | 23,272 | 97 | 43 |
| Dreyfus California AMT-Free Municipal Cash Management | 676 | 15 | — |
| Dreyfus New York AMT-Free Municipal Cash Management | 586 | — | — |
80
NOTE 2—Management Fee and Other Transactions with Affiliates:
(a) Pursuant to separate management agreements with the Manager, the management fee of each fund is computed at the annual rate of .20% of the value of such fund’s average daily net assets and is payable monthly.
The Manager has undertaken, with respect to each fund, to waive receipt of a portion of its management fee and/or reimburse expenses in the event that a fund’s current yield were to otherwise drop below a certain level. Such limitation may fluctuate daily, is voluntary and not contractual and may be terminated at any time. Table 4 summarizes the reduction in expenses for each relevant class of shares of each fund pursuant to these undertakings during the period ended July 31, 2010.
As to Dreyfus Cash Management Plus, Inc., effective February 10, 2010, the Manager also has separately agreed to waive a portion of the expenses so that annual fund operating expenses (exclusive of Rule 12b-1 Service Plan expenses) are limited to .15% of the value of the fund’s average daily net assets.This undertaking is voluntary, not contractual, and may be terminated at any time. The reduction in management fee for DCMP, pursuant to this undertaking, amounted to $1,879,904 during the period ending July 31, 2010.
As to Dreyfus New York AMT-Free Municipal Cash Management, the Manager also has agreed that until September
| | | | | | |
| Table 4. | | | | | | |
| |
| | | Dreyfus | Dreyfus | Dreyfus | Dreyfus | Dreyfus |
| | | Cash | Government | Government | Treasury & | Treasury |
| | Dreyfus Cash | Management | Cash | Prime Cash | Agency Cash | Prime Cash |
| | Management | Plus, Inc. | Management | Management | Management | Management |
| Institutional Shares ($) | — | — | 253,343 | 230,721 | 1,153,082 | 5,789,667 |
| Investor Shares ($) | 2,300,598 | 361,992 | 2,304,897 | 649,653 | 2,652,637 | 5,899,783 |
| Administrative Shares ($) | 42,056 | 5,144 | 294,553 | 286,683 | 278,792 | 1,093,533 |
| Participant Shares ($) | 926,570 | 392,510 | 643,412 | 1,133,380 | 951,342 | 5,693,044 |
| Service Shares ($) | — | 57,494 | — | — | 12,558 | — |
| Select Shares ($) | — | 19,800 | — | — | 83,156 | — |
| Agency Shares ($) | — | — | 9,272 | 14,705 | 24,111 | 93,340 |
| Premier Shares ($) | — | — | — | — | 100,556 | — |
| | | | | |
| Table 4. (continued) | | | | | |
| |
| | Dreyfus | Dreyfus | | Dreyfus | Dreyfus |
| | Municipal | New York | Dreyfus | California | New York |
| | Cash | Municipal | Tax Exempt | AMT-Free | AMT-Free |
| | Management | Cash | Cash | Municipal Cash | Municipal Cash |
| | Plus | Management | Management | Management | Management |
| Investor Shares ($) | 185,599 | 174,442 | 287,150 | 33,176 | 36,090 |
| Administrative Shares ($) | 7,705 | 1,871 | 9,897 | 184 | 134 |
| Participant Shares ($) | 31,342 | 14,885 | 41,455 | 62,138 | 12 |
| Agency Shares ($) | 4 | — | 143 | — | — |
| Classic Shares ($) | — | — | — | — | 82,008 |
NOTES TO FINANCIAL STATEMENTS (Unaudited) (continued)
30, 2010, the Manager, and not the fund, will be liable for fund expenses (exclusive of taxes, brokerage fees, interest on borrowings and extraordinary expenses) other than the following expenses, which will be borne by the fund: the management fee, and with respect to the fund’s Investor Shares, Administrative Shares, Participant Shares, and Classic Shares, Rule 12b-1 Service Plan expenses from February 1, 2010 through September 30, 2010.
(b) Under each fund’s Service Plan adopted pursuant to Rule 12b-1 under the Act, with respect to each fund’s Investor Shares, Administrative Shares, Participant Shares and Agency Shares (with the exception of Dreyfus New York AMT-Free Municipal Cash Management which does not offer Agency Shares), Dreyfus Cash Management Plus’ Service Shares and Select Shares, Dreyfus Treasury & Agency Cash Management’s Service Shares, Select Shares and Premier Shares and Dreyfus New York AMT-Free Municipal Cash Management’s Classic Shares, each fund pays the Distributor for distributing such classes of shares, for advertising and marketing and for providing certain services relating to shareholders of the respective class of shares. These services include answering shareholder inquiries regarding the fund and providing reports and other inf ormation and services related to the maintenance of shareholder accounts (“Servicing”). Under the Service Plan, as to each relevant class, the Distributor may make payments to Service Agents in respect to these services. Generally, the Service Agent may provide holders of Investor,Administrative, Participant, Service, Select,Agency, Premier and Classic Shares a consolidated statement.The Service Agent will also provide the holders of Investor, Participant, Service, Select and/or Premier Shares, automated teller check writing privileges and, in the case of Participant, Service, Select and Premier Shares, automated teller machine access, and bill paying services.The amount paid under the Service Plan for Servicing is intended to be a “service fee” as defined under the Conduct Rules of the Financial Industry Regulatory Authority (“FINRA”), and at no time will such amount exceed the maximum amount permitted to be paid unde r the FINRA Conduct Rules as a service fee.The fees payable under the Service Plan are payable without regard to actual expenses incurred. Table 5 summarizes the amount each fund was charged pursuant to the Service Plan during the period ended July 31, 2010.
(c) Each fund (except for Dreyfus New York AMT-Free Municipal Cash Management) has adopted a Shareholder Services Plan (the “Plan”), with respect to their Institutional shares. Each fund reimburses the Distributor an amount not to
| | | | | | | | |
| Table 5. | | | | | | | | |
| |
| | Investor | Administrative | Participant | Service | Select | Agency | Premier | Classic |
| | Shares ($) | Shares ($) | Shares ($) | Shares ($) | Shares ($) | Shares ($) | Shares ($) | Shares ($) |
| Dreyfus Cash Management | 4,309,744 | 408,952 | 1,330,789 | — | — | 24,299 | — | — |
| Dreyfus Cash Management Plus, Inc. | 1,096,644 | 306,594 | 665,907 | 83,780 | 25,236 | — | — | — |
| Dreyfus Government Cash Management | 2,633,662 | 411,591 | 693,313 | — | — | 18,619 | — | — |
| Dreyfus Government | | | | | | | | |
| Prime Cash Management | 635,179 | 266,313 | 1,112,887 | — | — | 11,995 | — | — |
| Dreyfus Treasury & Agency | | | | | | | | |
| Cash Management | 2,516,758 | 233,581 | 906,157 | 12,160 | 81,573 | 18,944 | 93,813 | — |
| Dreyfus Treasury | | | | | | | | |
| Prime Cash Management | 4,547,780 | 627,974 | 4,782,083 | — | — | 35,156 | — | — |
| Dreyfus Municipal | | | | | | | | |
| Cash Management Plus | 404,021 | 241,499 | 48,145 | — | — | 245 | — | — |
| Dreyfus New York Municipal | | | | | | | | |
| Cash Management | 345,560 | 28,422 | 21,145 | — | — | — | — | — |
| Dreyfus Tax Exempt | | | | | | | | |
| Cash Management | 468,465 | 48,819 | 53,719 | — | — | 578 | — | — |
| Dreyfus California AMT-Free | | | | | | | | |
| Municipal Cash Management | 78,689 | 1,823 | 96,238 | — | — | — | — | — |
| Dreyfus New York AMT-Free | | | | | | | | |
| Municipal Cash Management | 91,623 | 3,399 | 20 | — | — | — | — | 113,768 |
82
exceed an annual rate of .25% of the value of the fund’s average daily net assets attributable to Institutional Shares for certain allocated expenses of providing personal services and/or maintaining shareholder accounts. The services provided may include personal services relating to shareholder accounts, such as answering shareholder inquiries regarding the fund, providing reports and other information and services related to the maintenance of shareholder accounts. Table 6 summarizes the amount each relevant fund was charged pursuant to the Plan during the period ended July 31, 2010.
The funds (except for Dreyfus New York AMT-Free Municipal Cash Management) compensate Dreyfus Transfer, Inc., a wholly-owned subsidiary of the Manager, under a transfer agency agreement for providing personnel and facilities to perform transfer agency services for the funds. Table 7 summarizes the amount each relevant fund was charged during the period ended July 31, 2010, pursuant to the transfer agency agreement, which is included in Shareholder servicing costs in the Statements of Operations.
The funds (except Dreyfus NewYork AMT-Free Municipal Cash Management) compensate The Bank of New York Mellon, a subsidiary of BNY Mellon and an affiliate of Dreyfus, under a cash management agreement for performing cash management services related to fund subscriptions and redemptions. Table 8 summarizes the amount each relevant fund was charged during the period ended July 31, 2010, pursuant to the cash management agreement, which is included in Shareholder servicing costs in the Statements
| |
| Table 6. | |
| |
| | Institutional |
| | Shares ($) |
| Dreyfus Cash Management | 295,245 |
| Dreyfus Cash Management Plus, Inc. | 51,071 |
| Dreyfus Government Cash Management | 96,370 |
| Dreyfus Government Prime Cash Management | 27,760 |
| Dreyfus Treasury & Agency Cash Management | 367,141 |
| Dreyfus Treasury Prime Cash Management | 154,449 |
| Dreyfus Municipal Cash Management Plus | 21,351 |
| Dreyfus New York Municipal Cash Management | 7,551 |
| Dreyfus Tax Exempt Cash Management | 207,767 |
| Dreyfus California AMT-Free Municipal Cash Management | 1,630 |
| |
| |
| Table 7. | |
| |
| | Transfer Agency |
| | Fees ($) |
| Dreyfus Cash Management | 35,807 |
| Dreyfus Cash Management Plus, Inc. | 38,042 |
| Dreyfus Government Cash Management | 24,446 |
| Dreyfus Government Prime Cash Management | 18,891 |
| Dreyfus Treasury & Agency Cash Management | 14,304 |
| Dreyfus Treasury Prime Cash Management | 39,006 |
| Dreyfus Municipal Cash Management Plus | 2,132 |
| Dreyfus New York Municipal Cash Management | 4,446 |
| Dreyfus Tax Exempt Cash Management | 11,365 |
| Dreyfus California AMT-Free Municipal Cash Management | 1,093 |
NOTES TO FINANCIAL STATEMENTS (Unaudited) (continued)
of Operations. These fees were partially offset by earnings credits, also summarized in Table 8.
The funds (except for Dreyfus New York AMT-Free Municipal Cash Management) also compensate The Bank of New York Mellon under a custody agreement for providing custodial services for each fund. Table 9 summarizes the amount each relevant fund was charged during the period ended July 31, 2010, pursuant to the custody agreement.
During the period ended July 31, 2010, each relevant fund (except for Dreyfus New York AMT-Free Municipal Cash Management) was charged $2,012 for services performed by the Chief Compliance Officer.
Table 10 summarizes the components of “Due to The Dreyfus Corporation and affiliates” in the Statements of Assets and Liabilities for each fund.
(d) Each Board member also serves as a Board member of other funds within the Dreyfus complex.Annual retainer fees are allocated to each fund based on net assets, and each fund pays its Board members an attendance fee of $500 per meeting.
| | |
| Table 8. | | |
| |
| | Cash Management | |
| | Fees ($) | Earnings Credits ($) |
| Dreyfus Cash Management | 2,642 | (162) |
| Dreyfus Cash Management Plus, Inc. | 3,229 | (196) |
| Dreyfus Government Cash Management | 4,592 | (279) |
| Dreyfus Government Prime Cash Management | 3,446 | (210) |
| Dreyfus Treasury & Agency Cash Management | 2,746 | (167) |
| Dreyfus Treasury Prime Cash Management | 7,613 | (463) |
| Dreyfus Municipal Cash Management Plus | 130 | (8) |
| Dreyfus New York Municipal Cash Management | 294 | (18) |
| Dreyfus Tax Exempt Cash Management | 608 | (37) |
| Dreyfus California AMT-Free Municipal Cash Management | 25 | (2) |
| |
| |
| Table 9. | | |
| |
| | Custody | |
| | Fees ($) | |
| Dreyfus Cash Management | 498,122 | |
| Dreyfus Cash Management Plus, Inc. | 129,725 | |
| Dreyfus Government Cash Management | 405,851 | |
| Dreyfus Government Prime Cash Management | 97,214 | |
| Dreyfus Treasury & Agency Cash Management | 276,121 | |
| Dreyfus Treasury Prime Cash Management | 319,348 | |
| Dreyfus Municipal Cash Management Plus | 52,856 | |
| Dreyfus New York Municipal Cash Management | 52,535 | |
| Dreyfus Tax Exempt Cash Management | 79,755 | |
| Dreyfus California AMT-Free Municipal Cash Management | 16,422 | |
84
(e) On July 31, 2010, BNY Mellon made a capital contribution of $5,011,734 to Dreyfus Cash Management Plus, Inc.
NOTE 3—Capital Share Transactions:
Each fund (except for Dreyfus Cash Management Plus, Inc.) is authorized to issue an unlimited number of $.001 par value shares of Beneficial Interest. Dreyfus Cash Management Plus, Inc. is authorized to issue 120 billion shares of $.001 par value Common Stock.
NOTE 4—Reverse Repurchase Agreements:
Dreyfus Cash Management and Dreyfus Cash Management Plus, Inc. may enter into reverse repurchase agreements with banks, brokers or dealers.This form of borrowing involves the transfer by the fund of an underlying debt instrument in return for cash proceeds based on a percentage of value of the security. The funds retain the right to receive interest and principal payments on the security.At an agreed upon future
| | | | | | |
| Table 10. | | | | | | |
| |
| |
| | | Rule 12b-1 | | Chief | | |
| | | Distribution | | Compliance | Transfer | |
| | Management | Plan | Custodian | Officer | Agency | Less Expense |
| | Fees ($) | Fees ($) | Fees ($) | Fees ($) | Fees ($) | Reimbursement ($) |
| |
| Dreyfus Cash Management | 4,400,381 | 938,430 | 241,779 | 1,341 | 26,691 | (201,647) |
| Dreyfus Cash | | | | | | |
| Management Plus, Inc. | 890,463 | 389,345 | 63,232 | 1,341 | 30,194 | (401,332) |
| Dreyfus Government | | | | | | |
| Cash Management | 4,125,693 | 666,072 | 197,587 | 1,341 | 18,483 | (470,926) |
| Dreyfus Government | | | | | | |
| Prime Cash Management | 733,326 | 337,473 | 48,021 | 1,341 | 13,788 | (297,021) |
| Dreyfus Treasury & Agency | | | | | | |
| Cash Management | 1,908,952 | 611,570 | 128,482 | 1,341 | 11,335 | (724,273) |
| Dreyfus Treasury Prime | | | | | | |
| Cash Management | 3,386,571 | 1,701,784 | 155,377 | 1,341 | 30,470 | (2,762,943) |
| Dreyfus Municipal | | | | | | |
| Cash Management Plus | 172,405 | 114,706 | 25,844 | 1,341 | 2,132 | (33,428) |
| Dreyfus New York Municipal | | | | | | |
| Cash Management | 100,146 | 63,070 | 19,840 | 1,341 | 3,411 | (29,418) |
| Dreyfus Tax Exempt | | | | | | |
| Cash Management | 519,023 | 99,955 | 42,345 | 1,341 | 8,573 | (54,354) |
| Dreyfus California AMT-Free | | | | | | |
| Municipal Cash Management | 31,087 | 30,169 | 8,547 | 1,341 | 736 | (15,035) |
| Dreyfus New York AMT-Free | | | | | | |
| Municipal Cash Management | 27,476 | 18,283 | — | — | — | (7,651) |
NOTES TO FINANCIAL STATEMENTS (Unaudited) (continued)
date, the funds repurchase the security at principal plus accrued interest. Reverse repurchase agreements may subject the funds to interest rate risk and counterparty credit risk. During the period ended July 31, 2010, neither fund entered into reverse repurchase agreements.
NOTE 5—Securities Transactions:
The funds are permitted to purchase or sell securities from or to certain related affiliated funds under specified conditions outlined in procedures adopted by the Board of Trustees/Directors. The procedures have been designed to ensure that any purchase or sale of securities by the funds from or to another fund or portfolio that are, or could be, considered an affiliate by virtue of having a common investment adviser (or affiliated investment adviser), common Trustee/Director and/or common officers, complies with Rule 17a-7 of the Act. Table 11 summarizes the amounts of purchases and sales of securities engaged in by each relevant fund pursuant to Rule 17a-7 of the Act during the period ended July 31, 2010.
| | |
| Table 11. | | |
| |
| |
| | Purchases ($) | Sales ($) |
| Dreyfus Municipal Cash Management Plus | 656,055,000 | 422,875,000 |
| Dreyfus New York Municipal Cash Management | 202,760,000 | 211,065,000 |
| Dreyfus Tax Exempt Cash Management | 51,290,000 | 725,590,000 |
| Dreyfus California AMT—Free Municipal Cash Management | 133,725,000 | 69,370,000 |
| Dreyfus New York AMT—Free Municipal Cash Management | 40,600,000 | 55,470,000 |
86
PROXY RESULTS (Unaudited)
Dreyfus Cash Management Fund
Dreyfus Cash Management Fund held a special meeting of shareholders on February 12, 2010. The proposals considered at the meeting and the results are as follows:
| | | |
| | | Shares | |
| | For | Against | Abstain |
| 1. To approve amending the fund’s fundamental policy regarding borrowing | 15,443,935,310 | 1,492,651,629 | 3,626,193,445 |
| 2. To approve amending the fund’s fundamental policy regarding lending | 15,256,479,696 | 1,679,576,610 | 3,626,724,078 |
| 3. To approve amending the fund’s fundamental policy | | | |
| to permit investment in additional money market instruments | 15,658,595,568 | 1,370,239,999 | 3,533,944,817 |
| 4. To approve amending the fund’s fundamental policy | | | |
| to permit investment in other investment companies | 15,033,045,398 | 1,846,074,400 | 3,683,660,586 |
PROXY RESULTS (Unaudited)
Dreyfus Government Cash Management Fund
Dreyfus Government Cash Management Fund held a special meeting of shareholders on February 12, 2010. The proposals considered at the meeting and the results are as follows:
| | | |
| | | Shares | |
| | For | Against | Abstain |
| 1. To approve amending the fund’s fundamental policy regarding borrowing | 15,970,253,482 | 1,282,421,891 | 1,400,225,094 |
| 2. To approve amending the fund’s fundamental policy regarding lending | 15,338,787,031 | 2,072,809,073 | 1,241,304,363 |
| 3. To approve amending the fund’s fundamental policy | | | |
| to permit investment in other investment companies | 13,031,662,926 | 4,369,751,316 | 1,251,486,225 |
PROXY RESULTS (Unaudited)
Dreyfus Treasury & Agency Cash Management
Dreyfus Treasury & Agency Cash Management Fund held a special meeting of shareholders on February 14, 2010.The proposals considered at the meeting and the results are as follows:
| | | |
| | | Shares | |
| | For | Against | Abstain |
| 1. To approve amending the fund’s fundamental policy regarding borrowing | 6,284,472,014 | 1,369,599,599 | 384,479,847 |
| 2. To approve amending the fund’s fundamental policy regarding lending | 5,982,347,186 | 1,671,423,283 | 384,780,991 |
| 3. To approve amending the fund’s fundamental policy | | | |
| to permit investment in other investment companies | 4,641,943,664 | 3,003,306,959 | 393,300,837 |
PROXY RESULTS (Unaudited)
Dreyfus New York Municipal Cash Management
Dreyfus New York Municipal Cash Management Fund held a special meeting of shareholders on February 14, 2010.The proposals considered at the meeting and the results are as follows:
| | | |
| | | Shares | |
| | For | Against | Abstain |
| 1. To approve amending the fund’s fundamental policy regarding borrowing | 550,463,277 | 49,704,084 | 40,100,717 |
| 2. To approve amending the fund’s fundamental policy regarding lending | 548,640,937 | 51,525,358 | 40,101,783 |
| 3. To approve amending the fund’s fundamental policy | | | |
| to permit investment in other investment companies | 563,217,157 | 51,610,261 | 25,440,660 |
88
|
| INFORMATION ABOUT THE REVIEW AND APPROVAL OF |
| EACH FUND’S MANAGEMENT AGREEMENT (Unaudited) |
ALL CASH MANAGEMENT FUNDS
At a Joint Meeting of the Board of each fund held on May 18, 2010, the Board considered the re-approval for an annual period of each fund’s Management Agreement, pursuant to which the Manager provides each fund with investment advisory and administrative services. The Board members, none of whom are “interested persons” (as defined in the Investment Company Act of 1940, as amended) of the funds, were assisted in their review by independent legal counsel and met with counsel in executive session separate from representatives of the Manager.
Analysis of Nature, Extent, and Quality of Services Provided to each Fund. The Board members received a presentation from representatives of the Manager regarding services provided to each fund and other funds in the Dreyfus fund complex, and discussed the nature, extent, and quality of the services provided to each fund pursuant to each fund’s Management Agreement.The Manager’s representatives noted that the funds serve institutional investors acting for themselves or in a fiduciary capacity, and reviewed the nature of the relationships that the Manager has with various institutions and intermediaries and the different needs of each.The Manager’s representatives noted the sales and servicing support provided by the distributor’s BNY Mellon and Dreyfus Cash Investment Services Divisions, and the Dreyfus Investments Division, respectively, to each fund, the diversity of distribution of the funds in the Dreyfus complex generally, and the Manager’s need for broad, deep, and diverse resources to be able to provide ongoing shareholder services among various distribution channels.The Board also reviewed the number of shareholder accounts in each fund, as well as each fund’s asset size.
The Board members also considered the Manager’s research and portfolio management capabilities and that the Manager also provides oversight of day-to-day fund operations, including fund accounting and administration and assistance in meeting legal and regulatory requirements. The Board members also considered the Manager’s extensive administrative, accounting, and compliance infrastructure.
Comparative Analysis of Each Fund’s Management Fee and Expense Ratio and Performance. The Board members reviewed reports prepared by Lipper, Inc., an independent provider of investment company data, which included information comparing each fund’s management fee and expense ratio (based on each fund’s Institutional Shares) with a group of comparable funds (the “Expense Group”) and with a broader group of funds (the “Expense Universe”) that were selected by Lipper.The Board reviewed the results of Expense Group and Expense Universe comparisons that were prepared based on financial statements currently available to Lipper as of March 31, 2010. Included in each fund’s reports were comparisons of contractual and actual management fee rates and total operating expenses.
The Board members also reviewed the reports prepared by Lipper that presented each fund’s performance (for each fund’s Institutional Shares) for various periods ended March 31, 2010, and comparisons of total return performance for each fund to the same group of funds as the fund’s Expense Group (the “Performance Group”) and to a group of funds that was broader than the fund’s Expense Universe (the “Performance Universe”) that also were selected by Lipper.
DREYFUS CASH MANAGEMENT
The Board reviewed the range of management fees and expense ratios of the funds in the Expense Group and Expense Universe, and noted that the fund’s contractual management fee was higher than the Expense Group median and that the fund’s actual management fee was higher than the Expense Group median and Expense Universe median.The Board also noted that the fund’s total expense ratio was higher than the Expense Group median and lower than the Expense Universe median. The Board also noted that, where higher than the median, only two to four basis points separated the fund’s management fee and expense ratios from the respective medians.
With respect to the fund’s performance, the Board noted that the fund achieved total return results variously at, higher, and lower than the Performance Group median, and higher than
|
| INFORMATION ABOUT THE REVIEW AND APPROVAL OF |
| EACH FUND’S MANAGEMENT AGREEMENT (Unaudited) (continued) |
the Performance Universe median, for each reported time period up to ten years. The Board noted the low absolute returns and the narrow spreads in the returns among the fund and the Performance Group funds for each reported time period.The Board also noted that the Manager was waiving receipt of a portion of its management fee and absorbing certain fund and/or share class expenses in order to maintain a minimum yield floor limit of 0.00%. The Board also noted the portfolio manager’s presentation regarding the strategies for managing the fund’s weighted average maturity, credit risk profile, and liquidity requirements over the past year.
Representatives of the Manager reviewed with the Board members the fees paid to the Manager or its affiliates by mutual funds managed by the Manager or its affiliates that were reported in the same Lipper category as the fund (the “Similar Funds”), and explained the nature of the Similar Funds and the differences, from the Manager’s perspective, in providing services to the Similar Funds as compared to the fund. The Board members noted that the Similar Funds included retail funds, funds used primarily as sweep vehicles for asset management accounts, and funds with investment minimums ranging from $100,000 to $1 billion. The Board analyzed differences in fees paid to the Manager and discussed the relationship of the management fees paid in light of the services provided. The Board members considered the relevance of the fee information provided for the Similar Funds to evaluate the appropriateness and reasonablene ss of the fund’s management fee.
The Manager’s representatives noted that there were no similarly managed institutional separate accounts or wrap fee accounts managed by the Manager or its affiliates with similar investment objectives, policies, and strategies as the fund.
DREYFUS CASH MANAGEMENT PLUS
The Board reviewed the range of management fees and expense ratios of the funds in the Expense Group and Expense Universe, and noted that the fund’s contractual management fee approximated the Expense Group median and that the fund’s actual management fee was higher than the Expense Group median and Expense Universe median. The Board also noted that the fund’s total expense ratio was
higher than the Expense Group median and lower than the Expense Universe median.The Board also noted that, where higher than the median, only two to four basis points separated the fund’s management fee and expense ratios from the respective medians.
With respect to the fund’s performance, the Board noted that the fund achieved total return results higher than the Performance Group median for each reported time period up to five years, at the Performance Group median for the 10-year period, and higher than the Performance Universe median for each reported time period up to ten years. The Board noted the low absolute returns and the narrow spreads in the returns among the fund and the Performance Group funds for each reported time period. The Board also noted that the Manager was waiving receipt of a portion of its management fee and absorbing certain fund and/or share class expenses in order to maintain a minimum yield floor limit of 0.00%.The Board also noted the portfolio manager’s presentation regarding the strategies for managing the fund’s weighted average maturity, credit risk profile, and liquidity requirements over the past year.
Representatives of the Manager reviewed with the Board members the fees paid to the Manager or its affiliates by Similar Funds, and explained the nature of the Similar Funds and the differences, from the Manager’s perspective, in providing services to the Similar Funds as compared to the fund.The Board members noted that the Similar Funds included retail funds, funds used primarily as sweep vehicles for asset management accounts, and funds with investment minimums ranging from $100,000 to $1 billion.The Board analyzed differences in fees paid to the Manager and discussed the relationship of the management fees paid in light of the services provided.The Board members considered the relevance of the fee information provided for the Similar Funds to evaluate the appropriateness and reasonableness of the fund’s management fee.
The Manager’s representatives noted that there were no similarly managed institutional separate accounts or wrap fee accounts managed by the Manager or its affiliates with similar investment objectives, policies, and strategies as the fund.
90
DREYFUS GOVERNMENT CASH MANAGEMENT
The Board reviewed the range of management fees and expense ratios of the funds in the Expense Group and Expense Universe, and noted that the fund’s contractual management fee was at the Expense Group median and that the fund’s actual management fee was higher than the Expense Group median and Expense Universe median.The Board also noted that the fund’s total expense ratio was at the Expense Group median and lower than the Expense Universe median.The Board also noted that, where higher than the median, only three to four basis points separated the fund’s actual management fee from the Expense Group and Expense Universe medians.
With respect to the fund’s performance, the Board noted that the fund achieved total return results lower than the Performance Group median, and higher than the Performance Universe median, for each reported time period up to ten years. The Board noted the low absolute returns and the very narrow spreads in the returns among the fund and the Performance Group funds for each reported time period.The Board also noted that the Manager was waiving receipt of a portion of its management fee and absorbing certain fund and/or share class expenses in order to maintain a minimum yield floor limit of 0.00%. The Board noted the portfolio manager’s presentation regarding the strategy for managing the fund’s weighted average maturity and liquidity requirements over the past year.
Representatives of the Manager reviewed with the Board members the fees paid to the Manager or its affiliates by a Similar Fund, which the Manager explained was another cash management fund with the same management fee as the fund. The Board discussed the relationship of the management fees paid in light of the services provided. The Board members considered the relevance of the fee information provided for the Similar Fund to evaluate the appropriateness and reasonableness of the fund’s management fee.
The Manager’s representatives noted that there were no similarly managed institutional separate accounts or wrap fee accounts managed by the Manager or its affiliates with similar investment objectives, policies, and strategies as the fund.
DREYFUS GOVERNMENT PRIME CASH MANAGEMENT
The Board reviewed the range of management fees and expense ratios of the funds in the Expense Group and Expense Universe, and noted that the fund’s contractual management fee was lower than the Expense Group median and that the fund’s actual management fee approximated the Expense Group median and was higher than the Expense Universe median.The Board also noted that the fund’s total expense ratio was at the Expense Group median and lower than the Expense Universe median.
With respect to the fund’s performance, the Board noted that the fund achieved total return results at or within one basis point of the Performance Group median, and higher than the Performance Universe median, for each reported time period up to ten years. The Board noted the low absolute returns and the very narrow spreads in the returns among the fund and the Performance Group funds for each reported time period.The Board also noted that the Manager was waiving receipt of a portion of its management fee and absorbing certain fund and/or share class expenses in order to maintain a minimum yield floor limit of 0.00%. The Board noted the portfolio manager’s presentation regarding the strategy for managing the fund’s weighted average maturity and liquidity requirements over the past year.
Representatives of the Manager reviewed with the Board members the fees paid to the Manager or its affiliates by a Similar Fund, which the Manager explained was another cash management fund with the same management fee as the fund. The Board discussed the relationship of the management fees paid in light of the services provided. The Board members considered the relevance of the fee information provided for the Similar Fund to evaluate the appropriateness and reasonableness of the fund’s management fee.
The Manager’s representatives noted that there were no similarly managed institutional separate accounts or wrap fee accounts managed by the Manager or its affiliates with similar investment objectives, policies, and strategies as the fund.
|
| INFORMATION ABOUT THE REVIEW AND APPROVAL OF |
| EACH FUND’S MANAGEMENT AGREEMENT (Unaudited) (continued) |
DREYFUS TREASURY & AGENCY CASH MANAGEMENT
The Board reviewed the range of management fees and expense ratios of the funds in the Expense Group and Expense Universe, and noted that the fund’s contractual management fee and the fund’s actual management fee each approximated the Expense Group median, and that the fund’s actual management fee was higher than the Expense Universe median.The Board also noted that the fund’s total expense ratio was lower than the Expense Group median and the Expense Universe median.
With respect to the fund’s performance, the Board noted that the fund achieved total return results lower than the Performance Group median, and higher than the Performance Universe median, for each reported time period up to ten years.The Board noted the low absolute returns and the narrow spreads in the returns among the fund and the Performance Group funds (noting, for example, that the one-year return for each Performance Group fund ranged from four to ten basis points, respectively) for each reported time period up to ten years.The Board also noted that the Manager was waiving receipt of a portion of its management fee and absorbing certain fund and/or share class expenses in order to maintain a minimum yield floor limit of 0.00%. The Board noted the portfolio manager’s presentation regarding the strategy for managing the fund’s weighted average maturity and liquidity requirements over the past year.
Representatives of the Manager reviewed with the Board members the fees paid to the Manager or its affiliates by Similar Funds, and explained the nature of the Similar Funds and the differences, from the Manager’s perspective, in providing services to the Similar Funds as compared to the fund.The Board members noted that the Similar Funds included funds used primarily as a sweep vehicle for asset management accounts as well as funds with investment minimums close to or the same as that of the fund.The Board analyzed differences in fees paid to the Manager and discussed the relationship of the management fees paid in light of the services provided. The Board members considered the relevance of the fee information provided for the Similar Funds to evaluate the appropriateness and reasonableness of the fund’s management fee.
The Manager’s representatives noted that there were no similarly managed institutional separate accounts or wrap fee accounts managed by the Manager or its affiliates with similar investment objectives, policies, and strategies as the fund.
DREYFUS TREASURY PRIME CASH MANAGEMENT
The Board reviewed the range of management fees and expense ratios of the funds in the Expense Group and Expense Universe, and noted that the fund’s contractual management and the fund’s actual management fee each was at the Expense Group median, and that the fund’s actual management fee was higher than the Expense Universe median. The Board also noted that the fund’s total expense ratio was lower than the Expense Group median and the Expense Universe median.
With respect to the fund’s performance, the Board noted that the fund achieved total return results variously at, higher, and lower than the Performance Group median, and at or higher than the Performance Universe median, for each reported time period up to ten years.The Board noted the low absolute returns and the very narrow spreads in the returns among the fund and the Performance Group funds (including, for example, that the one-year return for each Performance Group fund ranged from one to seven basis points, respectively) for each reported time period. The Board also noted that the Manager was waiving receipt of a portion of its management fee and absorbing certain fund and/or share class expenses in order to maintain a minimum yield floor limit of 0.00%.The Board also noted the portfolio manager’s presentation regarding the strategy for managing the fund’s average maturity and liquidity over the past year.
Representatives of the Manager reviewed with the Board members the fees paid to the Manager or its affiliates by Similar Funds, and explained the nature of the Similar Funds and the differences, from the Manager’s perspective, in providing services to the Similar Funds as compared to the fund.The Board members noted that the Similar Funds included funds used primarily as a sweep vehicle for asset management accounts as well as funds with investment minimums close to or the same as that of the fund.The Board analyzed differences in fees paid to the
92
Manager and discussed the relationship of the management fees paid in light of the services provided. The Board members considered the relevance of the fee information provided for the Similar Funds to evaluate the appropriateness and reasonableness of the fund’s management fee.
The Manager’s representatives noted that there were no similarly managed institutional separate accounts or wrap fee accounts managed by the Manager or its affiliates with similar investment objectives, policies, and strategies as the fund.
DREYFUS TAX EXEMPT CASH MANAGEMENT
The Board reviewed the range of management fees and expense ratios of the funds in the Expense Group and Expense Universe, and noted that the fund’s contractual management fee was lower than the Expense Group median and that the fund’s actual management fee was higher that the Expense Group median and Expense Universe median. The Board also noted that the fund’s total expense ratio approximated the Expense Group median and was lower than the Expense Universe median.
With respect to the fund’s performance, the Board noted that the fund achieved total return results at or higher than the Performance Group median, and higher than the Performance Universe median, for each reported time period up to ten years. The Board also noted the low absolute returns for the Performance Group funds and the portfolio manager’s presentation regarding management of the fund’s weighted average maturity, credit risk profile, and liquidity requirements over the past year.The Board also noted that the Manager was waiving receipt of a portion of its management fee and absorbing certain fund and/or share class expenses in order to maintain a minimum yield floor limit of 0.00%.
Representatives of the Manager reviewed with the Board members the fees paid to the Manager or its affiliates by Similar Funds, and explained the nature of the Similar Funds and the differences, from the Manager’s perspective, in providing services to the Similar Funds as compared to the fund. The Board members noted that the Similar Funds included a fund used primarily as a sweep vehicle for asset management accounts, a fund designed for private wealth management clients, and another cash management fund.The Board analyzed differences in fees paid to the Manager and discussed the relationship of the management fees paid in light of the services provided.The Board members considered the relevance of the fee information provided for the Similar Funds to evaluate the appropriateness and reasonableness of the fund’s management fee.
The Manager’s representatives noted that there were no similarly managed institutional separate accounts or wrap fee accounts managed by the Manager or its affiliates with similar investment objectives, policies, and strategies as the fund.
DREYFUS MUNICIPAL CASH MANAGEMENT PLUS
The Board reviewed the range of management fees and expense ratios of the funds in the Expense Group and Expense Universe, and noted that the fund’s contractual management fee was lower than the Expense Group median and that the fund’s actual management fee approximated the Expense Group median and Expense Universe median. The Board also noted that the fund’s total expense ratio also approximated the Expense Group median and was lower than the Expense Universe median.
With respect to the fund’s performance, the Board noted that the fund achieved total return results higher than the Performance Group median and Performance Universe median for each reported time period up to ten years. The Board also noted the low absolute returns for the Performance Group funds and the portfolio manager’s presentation regarding management of the fund’s weighted average maturity, credit risk profile, and liquidity requirements over the past year. The Board also noted that the Manager was waiving receipt of a portion of its management fee and absorbing certain fund and/or share class expenses in order to maintain a minimum yield floor limit of 0.00%.
Representatives of the Manager reviewed with the Board members the fees paid to the Manager or its affiliates by Similar Funds, and explained the nature of the Similar Funds and the differences, from the Manager’s perspective, in pro-
|
| INFORMATION ABOUT THE REVIEW AND APPROVAL OF |
| EACH FUND’S MANAGEMENT AGREEMENT (Unaudited) (continued) |
viding services to the Similar Funds as compared to the fund. The Board members noted that the Similar Funds included a fund used primarily as a sweep vehicle for asset management accounts, a fund designed for private wealth management clients, and another cash management fund.The Board analyzed differences in fees paid to the Manager and discussed the relationship of the management fees paid in light of the services provided. The Board members considered the relevance of the fee information provided for the Similar Funds to evaluate the appropriateness and reasonableness of the fund’s management fee.
The Manager’s representatives noted that there were no similarly managed institutional separate accounts or wrap fee accounts managed by the Manager or its affiliates with similar investment objectives, policies, and strategies as the fund.
DREYFUS NEW YORK MUNICIPAL CASH MANAGEMENT
The Board reviewed the range of management fees and expense ratios of the funds in the Expense Group and Expense Universe, and noted that the fund’s contractual management fee was lower than the Expense Group median and that the fund’s actual management fee was lower than the Expense Group median and approximated the Expense Universe median.The Board also noted that the fund’s total expense ratio was lower than the Expense Group median and Expense Universe median.
With respect to the fund’s performance, the Board noted that the fund achieved total return results higher than the Performance Group median and Performance Universe median for each reported time period up to ten years. The Board also noted the low absolute returns for the Performance Group funds and the portfolio manager’s presentation regarding management of the fund’s weighted average maturity, credit risk profile, and liquidity requirements over the past year. The Board also noted that the Manager was waiving receipt of a portion of its management fee and absorbing certain fund and/or share class expenses in order to maintain a minimum yield floor limit of 0.00%.
Representatives of the Manager reviewed with the Board members the fees paid to the Manager or its affiliates by Similar Funds, and explained the nature of the Similar Funds and the differences, from the Manager’s perspective, in providing services to the Similar Funds as compared to the fund. The Board members noted that the Similar Funds included several funds commonly used as sweep vehicles for asset management accounts as well as one other retail fund.The Board analyzed differences in fees paid to the Manager and discussed the relationship of the management fees paid in light of the services provided.The Board members considered the relevance of the fee information provided for the Similar Funds to evaluate the appropriateness and reasonableness of the fund’s management fee.
The Manager’s representatives noted that there were no similarly managed institutional separate accounts or wrap fee accounts managed by the Manager or its affiliates with similar investment objectives, policies, and strategies as the fund.
DREYFUS NEW YORK AMT-FREE MUNICIPAL CASH MANAGEMENT
The Board reviewed the range of management fees and expense ratios of the funds in the Expense Group and Expense Universe, and noted that the fund’s contractual management fee was lower than the Expense Group median and that the fund’s actual management fee was lower than the Expense Group median and higher than the Expense Universe median.The Board also noted that the fund’s total expense ratio was lower than the Expense Group median and Expense Universe median.
With respect to the fund’s performance, the Board noted that the fund achieved the number one total return ranking in its Performance Group for each reported time period up to five years, and total return results that were higher than the Performance Universe median for each reported time period up to five years. The Board also noted the low absolute returns for the Performance Group funds and the portfolio manager’s presentation regarding management of the fund’s weighted average maturity, credit risk profile, and liquidity requirements over the past year.The Board also noted that the Manager was waiving receipt of a portion of its management fee and absorbing certain fund and/or share class expenses in order to maintain a minimum yield floor limit of 0.00%.
94
Representatives of the Manager reviewed with the Board members the fees paid to the Manager or its affiliates by Similar Funds, and explained the nature of the Similar Funds and the differences, from the Manager’s perspective, in providing services to the Similar Funds as compared to the fund. The Board members noted that the Similar Funds included several funds commonly used as sweep vehicles for asset management accounts as well as two other retail funds.The Board analyzed differences in fees paid to the Manager and discussed the relationship of the management fees paid in light of the services provided.The Board members considered the relevance of the fee information provided for the Similar Funds to evaluate the appropriateness and reasonableness of the fund’s management fee.
The Manager’s representatives noted that there were no similarly managed institutional separate accounts or wrap fee accounts managed by the Manager or its affiliates with similar investment objectives, policies, and strategies as the fund.
DREYFUS CALIFORNIA AMT-FREE MUNICIPAL CASH MANAGEMENT
The Board reviewed the range of management fees and expense ratios of the funds in the Expense Group and Expense Universe, and noted that the fund’s contractual management fee was lower than the Expense Group median and that the fund’s actual management fee was lower than the Expense Group median and Expense Universe median.The Board also noted that the fund’s total expense ratio was lower than the Expense Group median and Expense Universe median.
With respect to the fund’s performance, the Board noted that the fund achieved total return results higher than the Performance Group median and Performance Universe median for each reported time period up to two years. The Board also noted the low absolute returns for the Performance Group funds and the portfolio manager’s presentation regarding management of the fund’s weighted average maturity, and credit risk profile, and liquidity requirements over the past year. The Board also noted that the Manager was waiving receipt of a portion of its management fee and absorbing certain fund and/or share class expenses in order to maintain a minimum yield floor limit of 0.00%.
Representatives of the Manager reviewed with the Board members the fees paid to the Manager or its affiliates by Similar Funds, and explained the nature of the Similar Funds and the differences, from the Manager’s perspective, in providing services to the Similar Funds as compared to the fund. The Board members noted that the Similar Funds included two funds commonly used as sweep vehicles for asset management accounts as well as one other retail fund. The Board analyzed differences in fees paid to the Manager and discussed the relationship of the management fees paid in light of the services provided. The Board members considered the relevance of the fee information provided for the Similar Funds to evaluate the appropriateness and reasonableness of the fund’s management fee.
The Manager’s representatives noted that there were no similarly managed institutional separate accounts or wrap fee accounts managed by the Manager or its affiliates with similar investment objectives, policies, and strategies as the fund.
Analysis of Profitability and Economies of Scale. The Manager’s representatives reviewed the dollar amount of expenses allocated and profit received by the Manager for each fund and the method used to determine such expenses and profit. The Board considered information, previously provided and discussed, prepared by an independent consulting firm regarding the Manager’s approach to allocating costs to, and determining the profitability of, individual funds and the entire Dreyfus mutual fund complex. The Board members also considered that the methodology had also been reviewed by an independent registered public accounting firm which, like the consultant, found the methodology to be reasonable.The consulting firm also analyzed where any economies of scale might emerge in connection with the management of a fund. The Board members evaluated the profitab ility analysis in light of the relevant circumstances for each fund, including each fund’s change in asset size from the prior year, and the extent to which economies of scale would be realized if the fund grows and whether fee levels reflect these economies of scale for the benefit of fund share-holders.The Board also considered the Manager’s brokerage policies and practices, the standards applied for seeking best execution, and the potential benefits to the Manager from
|
| INFORMATION ABOUT THE REVIEW AND APPROVAL OF |
| EACH FUND’S MANAGEMENT AGREEMENT (Unaudited) (continued) |
acting as investment adviser to each fund and noted that there were no soft dollar arrangements in effect with respect to trading any fund’s portfolio.
It was noted that the Board members should consider the Manager’s profitability with respect to each fund as part of their evaluation of whether the fees under the Management Agreement bear a reasonable relationship to the mix of services provided by the Manager, including the nature, extent, and quality of such services and that a discussion of economies of scale is predicated on increasing assets. It was noted that the profitability percentage for managing each fund (except Dreyfus California AMT-Free Municipal Cash Management) was within the range determined by appropriate court cases to be reasonable given the services rendered and that the profitability percentage for managing the fund was reasonable given the generally superior service levels provided. As to Dreyfus California AMT-Free Municipal Cash Management, it was noted that the Manager did not realize a profit on the fund’s operations.The Board also noted the Manager’s fee waivers and expense undertakings in effect for each fund over the past year and its effect on the profitability of the Manager.
At the conclusion of these discussions, the Board agreed that it had been furnished with sufficient information to make an informed business decision with respect to continuation of each fund’s Management Agreement. Based on the discussions and considerations as described above, each fund’s Board reached the following conclusions and determinations:
The Board concluded that the nature, extent, and quality of the services provided by the Manager to each fund are ade- quate and appropriate.
The Board generally was satisfied with each fund’s relative performance. The Board noted the low absolute returns and the narrow spreads among the returns for each fund and its Performance Group funds.
The Board considered the impact of the Manager’s undertakings and corresponding yield floor had on each fund’s relative performance and expense results, and the Manager’s profitability.
The Board considered portfolio managements’ discussions of investment strategy and the credit research that sup- ported those strategies, and commended these groups for their work in this historic rate environment, noting their unwavering commitment to sound investment strategies, to intensive credit research, and to high credit quality.
The Board concluded that the fee paid to the Manager by each fund was reasonable in light of the services provided, comparative performance and expense and management fee information, including the undertaking and related yield floor in effect for each fund, costs of the services provided and profits to be realized and benefits derived or to be derived by the Manager from its relationship with each fund.
The Board determined that the economies of scale which may accrue to the Manager and its affiliates in connection with the management of each fund had been adequately considered by the Manager in connection with the man- agement fee rate charged to each fund, and that, to the extent in the future it were to be determined that mater- ial economies of scale had not been shared with a fund, the Board would seek to have those economies of scale shared with the fun d.
The Board members considered these conclusions and determinations, along with the information received on a routine and regular basis throughout the year, and, without any one factor being dispositive, the Board determined that re-approval of each fund’s Management Agreement was in the best interests of the fund and its respective shareholders.
96
For More Information
| |
| Dreyfus Cash Management Funds | Transfer Agent & |
| 200 Park Avenue | Dividend Disbursing Agent |
| New York, NY 10166 | Dreyfus Transfer, Inc. |
| Manager | 200 Park Avenue |
| | New York, NY 10166 |
| The Dreyfus Corporation | |
| 200 Park Avenue | Distributor |
| New York, NY 10166 | MBSC Securities Corporation |
| Custodian | 200 Park Avenue |
| | New York, NY 10166 |
| The Bank of New York Mellon | |
| One Wall Street | |
| New York, NY 10286 | |
Item 2. Code of Ethics.
Not applicable.
Item 3. Audit Committee Financial Expert.
Not applicable.
Item 4. Principal Accountant Fees and Services.
Not applicable.
Item 5. Audit Committee of Listed Registrants.
Not applicable.
Item 6. Investments.
(a) Not applicable.
Item 7. Disclosure of Proxy Voting Policies and Procedures for Closed-End Management Investment Companies.
Not applicable.
Item 8. Portfolio Managers of Closed-End Management Investment Companies.
Not applicable.
Item 9. Purchases of Equity Securities by Closed-End Management Investment Companies and Affiliated Purchasers.
Not applicable. [CLOSED END FUNDS ONLY]
Item 10. Submission of Matters to a Vote of Security Holders.
There have been no material changes to the procedures applicable to Item 10.
Item 11. Controls and Procedures.
(a) The Registrant's principal executive and principal financial officers have concluded, based on their evaluation of the Registrant's disclosure controls and procedures as of a date within 90 days of the filing date of this report, that the Registrant's disclosure controls and procedures are reasonably designed to ensure that information required to be disclosed by the Registrant on Form N-CSR is recorded, processed, summarized and reported within the required time periods and that information required to be disclosed by the Registrant in the reports that it files or submits on Form N-CSR is accumulated and communicated to the Registrant's management, including its principal executive and principal financial officers, as appropriate to allow timely decisions regarding required disclosure.
(b) There were no changes to the Registrant's internal control over financial reporting that occurred during the second fiscal quarter of the period covered by this report that have materially affected, or are reasonably likely to materially affect, the Registrant's internal control over financial reporting.
Item 12. Exhibits.
(a)(1) Not applicable.
(a)(2) Certifications of principal executive and principal financial officers as required by Rule 30a-2(a) under the Investment Company Act of 1940.
(a)(3) Not applicable.
(b) Certification of principal executive and principal financial officers as required by Rule 30a-2(b) under the Investment Company Act of 1940.
SIGNATURES
Pursuant to the requirements of the Securities Exchange Act of 1934 and the Investment Company Act of 1940, the Registrant has duly caused this Report to be signed on its behalf by the undersigned, thereunto duly authorized.
DREYFUS TAX EXEMPT CASH MANAGEMENT FUNDS
By: /s/ Bradley J. Skapyak |
Bradley J. Skapyak, President |
Date: | September 24, 2010 |
|
Pursuant to the requirements of the Securities Exchange Act of 1934 and the Investment Company Act of 1940, this Report has been signed below by the following persons on behalf of the Registrant and in the capacities and on the dates indicated. |
|
By: /s/ Bradley J. Skapyak |
Bradley J. Skapyak, President |
Date: | September 24, 2010 |
|
By: /s/ James Windels |
James Windels, Treasurer |
Date: | September 24, 2010 |
|
EXHIBIT INDEX
(a)(2) Certifications of principal executive and principal financial officers as required by Rule 30a-2(a) under the Investment Company Act of 1940. (EX-99.CERT)
(b) Certification of principal executive and principal financial officers as required by Rule 30a-2(b) under the Investment Company Act of 1940. (EX-99.906CERT)