UNITED STATES
SECURITIES AND EXCHANGE COMMISSION
Washington, D.C. 20549
FORM 10-K
| | | | | | | | | | | | | | | | | | | | | | | |
| (Mark One) | | | | | |
| ☒ | | ANNUAL REPORT PURSUANT TO SECTION 13 OR 15(d) OF THE SECURITIES EXCHANGE ACT OF 1934 |
| For the year ended December 31, 2024 | |
| OR |
| ☐ | | TRANSITION REPORT PURSUANT TO SECTION 13 OR 15(d) OF THE SECURITIES EXCHANGE |
| ACT OF 1934 FOR THE TRANSITION PERIOD FROM | TO | |
Commission file number: 1-10989
Ventas, Inc.
(Exact Name of Registrant as Specified in Its Charter)
| | | | | | | | |
| Delaware | | 61-1055020 |
| (State or Other Jurisdiction of Incorporation or Organization) | | (I.R.S. Employer Identification No.) |
300 North LaSalle Street, Suite 1600
Chicago, Illinois
60654
(Address of Principal Executive Offices)
(877) 483-6827
(Registrant’s Telephone Number, Including Area Code)
Securities registered pursuant to Section 12(b) of the Act:
| | | | | | | | | | | | | | |
| Trading Symbol | | Title of Each Class | | Name of Exchange on Which Registered |
| VTR | | Common Stock, $0.25 par value | | New York Stock Exchange |
Indicate by check mark if the registrant is a well-known seasoned issuer, as defined in Rule 405 of the Securities Act. Yes ☒ No ¨
Indicate by check mark if the registrant is not required to file reports pursuant to Section 13 or Section 15(d) of the Act. Yes ¨ No ☒
Indicate by check mark whether the registrant (1) has filed all reports required to be filed by Section 13 or 15(d) of the Securities Exchange Act of 1934 during the preceding 12 months (or for such shorter period that the registrant was required to file such reports), and (2) has been subject to such filing requirements for the past 90 days. Yes ☒ No ¨
Indicate by check mark whether the registrant has submitted electronically every Interactive Data File required to be submitted pursuant to Rule 405 of Regulation S-T (§232.405 of this chapter) during the preceding 12 months (or for such shorter period that the registrant was required to submit such files). Yes ☒ No ¨
Indicate by check mark whether the registrant is a large accelerated filer, an accelerated filer, a non-accelerated filer, a smaller reporting company, or an emerging growth company. See the definitions of “large accelerated filer,” “accelerated filer,” “smaller reporting company” and “emerging growth company” in Rule 12b-2 of the Exchange Act.
| | | | | | | | | | | | | | | | | | | | | | | |
| Large accelerated filer | ☒ | | Accelerated filer | ¨ | | Non-accelerated filer | ☐ |
| Smaller reporting company | ☐ | | | | | Emerging growth company | ☐ |
If an emerging growth company, indicate by check mark if the registrant has elected not to use the extended transition period for complying with any new or revised financial accounting standards provided pursuant to Section 13(a) of the Exchange Act. ¨
Indicate by check mark whether the registrant has filed a report on and attestation to its management’s assessment of the effectiveness of its internal control over financial reporting under Section 404(b) of the Sarbanes-Oxley Act (15 U.S.C. 7262(b)) by the registered public accounting firm that prepared or issued its audit report. ☒
If securities are registered pursuant to Section 12(b) of the Act, indicate by check mark whether the financial statements of the registrant included in the filing reflect the correction of an error to previously issued financial statements. ☐
Indicate by check mark whether any of those error corrections are restatements that required a recovery analysis of incentive-based compensation received by any of the registrant’s executive officers during the relevant recovery period pursuant to §240.10D-1(b). ☐
Indicate by check mark whether the registrant is a shell company (as defined in Rule 12b-2 of the Act). Yes ☐ No ☒
The aggregate market value of shares of the registrant’s common stock held by non-affiliates of the registrant on June 30, 2024, based on a closing price of the common stock of $51.26 as reported on the New York Stock Exchange, was $21.1 billion.
As of February 7, 2025, there were 437,139,980 shares of the registrant’s common stock outstanding.
DOCUMENTS INCORPORATED BY REFERENCE
Portions of the registrant’s definitive Proxy Statement for the 2025 Annual Meeting of Stockholders are incorporated by reference into Part III, Items 10 through 14 of this Annual Report on Form 10-K to the extent stated herein. Such proxy statement will be filed with the Securities and Exchange Commission within 120 days of the registrant’s fiscal year ended December 31, 2024.
CAUTIONARY STATEMENTS
Unless otherwise indicated or except where the context otherwise requires, the terms “we,” “us,” “our,” “Company” and other similar terms in this Annual Report on Form 10-K (the “Annual Report”) refer to Ventas, Inc. and its consolidated subsidiaries.
Forward-Looking Statements
This Annual Report includes forward-looking statements within the meaning of Section 27A of the Securities Act of 1933, as amended (the “Securities Act”), and Section 21E of the Securities Exchange Act of 1934, as amended (the “Exchange Act”). These forward-looking statements include, among others, statements of expectations, beliefs, future plans and strategies, anticipated results from operations and developments and other matters that are not historical facts. Forward-looking statements include, among others, statements regarding our and our officers’ intent, belief or expectation as identified by the use of phrases or words such as “assume,” “may,” “will,” “project,” “expect,” “believe,” “intend,” “anticipate,” “seek,” “target,” “forecast,” “plan,” “potential,” “opportunity,” “estimate,” “could,” “would,” “should,” “line of sight,” “outlook” and other comparable and derivative terms or the negatives thereof. Forward-looking statements are based on management’s beliefs as well as on a number of assumptions concerning future events. You should not put undue reliance on these forward-looking statements, which are not a guarantee of performance and are subject to a number of uncertainties and other factors that could cause actual events or results to differ materially from those expressed or implied by the forward-looking statements. We do not undertake a duty to update these forward-looking statements, which speak only as of the date on which they are made. We urge you to carefully review the disclosures we make concerning risks and uncertainties that may affect our business and future financial performance, including those made below under “Summary Risk Factors” and in “Item 1A, Risk Factors” of this Annual Report.
Summary Risk Factors
Our business is subject to significant risks and uncertainties that make an investment in us speculative and risky. Below we summarize what we believe are the principal risk factors, but these risks are not the only ones we face. You should carefully review and consider the full discussion of our risk factors in the section titled “Risk Factors” in Part I, Item 1A of this Annual Report, together with the other information in this Annual Report. If any of the following risks, or any other risks and uncertainties that are not addressed below or elsewhere in this Annual Report or that we have not yet identified, actually occur, our business, financial condition and results of operations could be materially adversely affected and the value of our securities could decline.
Risks Related to Our Business Operations and Strategy
•Macroeconomic trends, including trends relating to labor costs, unemployment, inflation, interest rates and exchange rates, may affect our business and financial results
•Changes in the U.S. political and regulatory environment could affect availability of government funding that we or our managers, tenants or borrowers rely on, which could negatively impact our business
•Economic conditions and other events or occurrences that affect areas in which our properties are geographically concentrated may impact financial results
•To the extent that we or our managers, tenants and borrowers are unable to navigate successfully the trends affecting our or their businesses and the industries in which we or they operate, we may be adversely affected
•We are vulnerable to adverse changes affecting our specific asset classes and the real estate industry generally
•Our third-party managers and tenants operate or exert substantial control over the properties that they manage for or rent from us, which limits our control and influence over operations and results
•Our operating assets may expose us to various operational risks, liabilities and claims that could adversely affect our ability to generate revenues or increase our costs and could adversely affect our business, financial condition and results of operations
•A significant portion of our revenues and operating income is dependent on a limited number of managers and tenants, including Atria, Sunrise, Le Groupe Maurice, Brookdale, Ardent and Kindred
•If we need to replace any of our managers or tenants, we may be unable to do so on as favorable terms, if at all, and we could be subject to delays, limitations and expenses, which could adversely affect our business, financial condition and results of operations
•If our managers’, tenants’ or borrowers’ financial condition or business prospects deteriorate, our business, financial condition and results of operations could be adversely affected
•We face potential adverse consequences from the bankruptcy, insolvency or financial deterioration of our managers, tenants, borrowers and other obligors
•The hospitals on or near the campuses where our outpatient medical buildings are located and their affiliated health systems may not remain competitive or financially viable
•Our research tenants face unique levels of expense and uncertainty
•If a borrower defaults, we may be unable to obtain payment, successfully foreclose on collateral or realize the value of any collateral, which could adversely affect our ability to recover our investment
•Our ongoing strategy depends, in part, upon identifying and consummating future acquisitions and investments and effectively managing our expansion opportunities
•Our investments in and acquisitions of properties may be unsuccessful or fail to meet our expectations
•Our investments in co-investment vehicles, joint ventures and minority interests may subject us to risks and liabilities that we would not otherwise face
•Increased construction and development in the markets in which our properties are located could adversely affect our future occupancy rates, operating margins and profitability
•Merger, acquisition and investment activity in our industries resulting in a change of control of, or a competitor’s investment in, one or more of our managers, tenants or borrowers could adversely affect our business, financial condition and results of operations
•Development, redevelopment and construction risks could affect our profitability
•We may face increased risks and costs associated with volatility in materials and labor prices or as a result of supply chain or procurement disruptions, which may adversely affect the status of our construction projects
•Our success depends, in part, on our ability to attract and retain talented employees. The loss of any one of our key personnel or the inability to maintain appropriate staffing could adversely impact our business
•We may be required to recognize reserves, allowances, credit losses or impairment charges
•We own properties that are subject to ground lease, air rights or other restrictive agreements that limit our uses of the properties, restrict our ability to sell or otherwise transfer the properties and expose us to loss of the properties if such agreements are breached by us or terminated
•Purchase options, rights of first offer or rights of first refusal in favor of third parties could negatively affect us or discourage prospective buyers from negotiating with us with respect to the sale of our properties
•Damage from catastrophic or extreme weather and other natural events and the physical effects of climate change could result in losses to the Company
•Cybersecurity threats and incidents could disrupt our operations or the operations of the third parties with whom we do business, invest in or lend to, result in the loss of or unauthorized access to confidential or personal information or damage our or their business relationships and reputation
•Damage to our reputation could adversely affect our business, financial condition or result of operations
•Activist investors could cause us to incur substantial costs, divert management’s attention and have an adverse effect on our business
Our Capital Structure Risks
•Market conditions and the actual and perceived state of the capital markets generally could negatively impact our business, financial condition and results of operations
•We are exposed to increases in interest rates, which could reduce our profitability and adversely impact our ability to refinance existing debt, sell assets or engage in acquisition, investment, development and redevelopment activity, and our decision to hedge against interest rate risk might not be effective
•We have a significant amount of outstanding indebtedness and may incur additional indebtedness in the future
•Limitations on our ability to access the capital markets could have an adverse effect on us, including our ability to make required payments on our debt obligations, make distributions to our stockholders or make future investments necessary to implement our business strategy
•We may be adversely affected by fluctuations in currency exchange rates
•Covenants in the instruments governing our and our subsidiaries’ existing indebtedness limit our operational flexibility, and a covenant breach could adversely affect our operations
Our Legal, Compliance and Regulatory Risks
•Significant legal or regulatory proceedings could subject us or our managers, tenants or borrowers to increased operating costs and substantial uninsured liabilities, which could adversely affect our or their liquidity, financial condition and results of operations
•We and our managers, tenants and borrowers may be adversely affected by regulation and enforcement
•Our investments may expose us to unknown liabilities
•We and our managers, tenants and borrowers may be adversely affected by complex and evolving laws and regulations regarding data privacy and cybersecurity
•The amount and scope of insurance coverage provided by our policies and policies maintained by our managers, tenants or other counterparties may not adequately insure against losses
•Failure to maintain effective internal controls could harm our business, results of operations and financial condition
•We could incur substantial liabilities and costs if any of our properties are found to be contaminated with hazardous substances or we become involved in any environmental disputes
•There can be no assurance as to the total amount of financial assistance that we or our managers, tenants or borrowers will retain from programs implemented under the CARES Act and other pandemic-related legislation
Our REIT Status Risks
•Loss of our status as a REIT would have significant adverse consequences for us and the value of our common stock
•To preserve our qualification as a REIT, our certificate of incorporation contains ownership limits with respect to our capital stock that may delay, defer or prevent a change of control of our company
•Complying with REIT requirements may cause us to forego otherwise attractive opportunities (including investing in our tenants) or liquidate otherwise attractive investments
Note Regarding Third-Party Information
This Annual Report includes information that has been provided to us by our managers, tenants, borrowers, business partners and investments unconsolidated entities from SEC filings or other publicly available information of our tenants, managers, business partners and unconsolidated entities in which we invest. We believe that such information is accurate and that the sources from which it has been obtained are reliable. However, we cannot guarantee the accuracy of such information and have not independently verified the assumptions on which such information is based.
TABLE OF CONTENTS
| | | | | | | | |
|
| Item 1. | | |
| Item 1A. | | |
| Item 1B. | | |
| Item 1C. | | |
| Item 2. | | |
| Item 3. | | |
| Item 4. | | |
|
| Item 5. | | |
| Item 6. | | |
| Item 7. | | |
| Item 7A. | | |
| Item 8. | | |
| Item 9. | | |
| Item 9A. | | |
| Item 9B. | | |
| Item 9C. | | |
|
| Item 10. | | |
| Item 11. | | |
| Item 12. | | |
| Item 13. | | |
| Item 14. | | |
|
| Item 15. | | |
| Item 16. | | |
PART I
ITEM 1. Business
BUSINESS
Overview
Ventas, Inc., an S&P 500 company, is a real estate investment trust (“REIT”) focused on delivering strong, sustainable shareholder returns by enabling exceptional environments that benefit a large and growing aging population. We hold a portfolio that includes senior housing communities, outpatient medical buildings, research centers, hospitals and healthcare facilities located in North America and the United Kingdom. As of December 31, 2024, we owned or had investments in 1,387 properties consisting of 1,356 properties in our reportable business segments (“Segment Properties”) and 31 properties held by unconsolidated real estate entities in our non-segment operations. Our Company is headquartered in Chicago, Illinois with additional corporate offices in Louisville, Kentucky and New York, New York.
We elected to be taxed as a REIT under Sections 856 through 860 of the Internal Revenue Code (the “Code”), commencing with our taxable year ended December 31, 1999. Provided we qualify for taxation as a REIT, we generally are not required to pay U.S. federal corporate income taxes on our REIT taxable income that is currently distributed to our stockholders. In order to maintain our qualification as a REIT, we must satisfy a number of technical requirements, which impact how we invest in, operate and manage our assets. See “Risk Factors—Our REIT Status Risks” included in Part I, Item 1A of this Annual Report on Form 10-K (the “Annual Report”).
We operate through three reportable business segments: senior housing operating portfolio, which we refer to as “SHOP,” outpatient medical and research portfolio, which we refer to as “OM&R,” and triple-net leased properties, which we refer to as “NNN.” We also hold assets outside of our reportable business segments, which we refer to as non-segment assets and which consist primarily of corporate assets, including cash and cash equivalents, restricted cash, loans receivable and investments and accounts receivable as well as investments in unconsolidated entities. Our investments in unconsolidated entities include investments made through our third-party institutional private capital management platform, Ventas Investment Management (“VIM”). Through VIM, we partner with third-party institutional investors to invest in real estate through various joint ventures and other co-investment vehicles where we are the sponsor or general partner, including our open-ended investment vehicle, the Ventas Life Science & Healthcare Real Estate Fund (the “Ventas Fund”). See our Consolidated Financial Statements and the related notes, including “Note 7 – Investments in Unconsolidated Entities” included in Part II, Item 8 of this Annual Report.
Our chief operating decision maker evaluates performance of the combined properties in each operating segment and determines how to allocate resources to these segments, based on net operating income (“NOI”) for each segment. See our Consolidated Financial Statements and the related notes, including “Note 2 – Accounting Policies” and “Note 18 – Segment Information” included in Part II, Item 8 of this Annual Report.
The following table summarizes information for our portfolio for the year ended December 31, 2024 (dollars in thousands):
| | | | | | | | | | | | | | | | | | | | |
| Segment | | NOI (1) | | Percentage of Total NOI | | Segment Properties |
| Senior housing operating portfolio (SHOP) | | $ | 866,383 | | | 41.9 | % | | 629 | |
| Outpatient medical and research portfolio (OM&R) | | 579,271 | | | 28.0 | % | | 426 | |
| Triple-net leased properties (NNN) | | 606,225 | | | 29.3 | % | | 301 | |
Non-segment (2) | | 17,204 | | | 0.8 | % | | n/a |
| | $ | 2,069,083 | | | 100 | % | | 1,356 | |
______________________________
(1) “NOI” is defined as total revenues, less interest and other income, property-level operating expenses and third-party capital management expenses. See “Non-GAAP Financial Measures” included elsewhere in this Annual Report for additional disclosure and a reconciliation of net income attributable to common stockholders, as computed in accordance with U.S. generally accepted accounting principles (“GAAP”), to NOI.
(2) NOI for non-segment includes management fees and promote revenues, net of expenses related to our third-party institutional private capital management platform, income from loans and investments and corporate-level expenses not directly attributable to any of our three reportable business segments.
Business Strategy
For more than 25 years, Ventas has pursued what we believe is a successful, enduring strategy focused on delivering outsized value to stockholders and other key stakeholders by enabling exceptional environments that benefit the aging population. Working with industry-leading care providers, partners, developers and research and medical institutions, our collaborative and experienced team is focused on achieving consistent, superior total returns through: (1) delivering profitable organic growth in senior housing, (2) capturing value-creating external growth focused on senior housing, (3) driving strong execution and cash flow generation throughout our portfolio of high-quality assets unified in serving the large and growing aging population and (4) maintaining financial strength, flexibility and liquidity.
Our objective is to generate reliable and growing cash flows from our portfolio, which enables us to pay regular cash dividends to stockholders and creates opportunities to increase stockholder value.
Our Businesses
Senior Housing Operating Portfolio (SHOP)
In our SHOP segment, we own and invest in senior housing communities. We participate directly in the financial performance of the communities’ operations and are generally responsible for all operational costs, expenses and other liabilities. We typically engage third-party managers to operate the communities on our behalf but generally hold applicable healthcare licenses and enroll in applicable government healthcare programs on behalf of the communities in our SHOP segment.
The senior housing communities in our SHOP segment include independent living communities, assisted living communities, memory care communities and continuing care retirement communities. Independent living communities are typically age-restricted multifamily rental properties with central dining facilities that provide residents with access to meals and other services such as housekeeping, linen service, transportation and social and recreational activities. Assisted living communities typically offer similar services as independent living communities, plus supportive care that is provided by trained employees to residents who require assistance with activities of daily living, such as bathing, dressing and medication management. Memory care communities provide care for individuals with Alzheimer’s disease and other forms of dementia or memory loss. Continuing care retirement communities are typically age-restricted properties that offer a continuum of care, and may include a combination of independent living, assisted living, memory care and skilled nursing units. Our assisted living, memory care and continuing care retirement communities are generally subject to state licensure requirements for the delivery of some or all of their services, while our independent living communities generally are not. Charges for room, board and services at these communities are generally paid from private sources, with limited reliance on government reimbursement programs such as Medicaid.
Because we have elected to be taxed as a REIT, we are subject to restrictions impacting how we invest in, operate or manage our properties, including the senior housing communities in our SHOP segment. Some of those restrictions depend on whether a senior housing community is treated as a “qualified healthcare property” under the REIT rules. We treat most of the senior housing communities in our SHOP segment as “qualified healthcare properties.” Senior housing communities in our SHOP segment that are “qualified healthcare properties” generally must be managed and operated by a third-party manager, including for purposes of procuring supplies, hiring and training employees, entering into third-party contracts for the benefit of the property and providing resident care and services. Senior housing communities that are not “qualified healthcare properties” may be managed by us directly through a taxable REIT subsidiary or by a third-party manager. See “—Government Regulation—Tax Regulation included in Part I, Item 1 of this Annual Report.”
Where we engage a third-party manager, either by choice or as required by REIT tax rules, we generally rely on the third-party managers’ personnel, expertise, technical resources and information systems, risk management processes, proprietary information, good faith and judgment to manage the senior housing communities’ operations efficiently and effectively. We also rely on the third-party managers to set appropriate resident fees, to provide accurate property-level financial results in a timely manner and otherwise manage risk and operate the senior housing communities in compliance with the terms of our management agreements and all applicable laws and regulations. We are generally responsible for all operational costs, expenses and other risks and liabilities. While our managers typically indemnify us for liabilities arising out of certain of their actions such as gross negligence, fraud or willful misconduct, we may not be able to enforce these rights, or we may determine it is not prudent to do so if we believe that enforcement of our rights would be more detrimental to our business than seeking alternative approaches See “Risk Factors—Risks Related to Our Business Operations and Strategy—Our third-party managers and tenants operate or exert substantial control over the properties that they manage for or rent from us,
which limits our control and influence over operations and results” and “Risk Factors—Risks Related to Our Business Operations and Strategy—Our operating assets may expose us to various operational risks, liabilities and claims that could adversely affect our ability to generate revenues or increase our costs and could adversely affect our business, financial condition and results of operations” included in Part I, Item 1A of this Annual Report.
Our management agreements typically have fixed terms and are subject to renewal under certain conditions. These agreements may include provisions for termination under specific circumstances, with or without the payment of a fee. The managers generally receive annual management fees which are calculated based on various performance measures, which may include revenue, NOI and other objective financial metrics. Additionally, incentive fees may be awarded if specified performance targets are met.
As of December 31, 2024, 28 third-party managers operated all of the 629 properties in our SHOP segment on our behalf. The following table provides information regarding our significant SHOP manager concentration as of and for the year ended December 31, 2024:
| | | | | | | | | | | | | | | | | |
| Percentage of Total NOI | | Segment Properties | | Percentage of Segment Properties |
| Atria Senior Living, Inc. | 18.6 | % | | 199 | | | 14.7 | % |
| Sunrise Senior Living, LLC | 6.2 | | | 98 | | | 7.2 | |
| Le Groupe Maurice | 6.0 | | | 37 | | | 2.7 | |
| | | | | |
The properties in our SHOP segment managed by Atria Senior Living, Inc. (together with its subsidiaries, “Atria”), Sunrise Senior Living, LLC (together with its subsidiaries, “Sunrise”) and Le Group Maurice (together with its subsidiaries, “Le Groupe Maurice”) accounted for a significant portion of our SHOP segment revenues and NOI for the year ended December 31, 2024. See “Management’s Discussion and Analysis of Financial Condition and Results of Operations—Concentration risk” included in Part II, Item 7 of this Annual Report and “Risk Factors—Risks Related to Our Business Operations and Strategy—A significant portion of our revenues and operating income is dependent on a limited number of managers and tenants, including Atria, Sunrise, Le Groupe Maurice, Brookdale, Ardent and Kindred” included in Part I, Item 1A of this Annual Report.
We hold a 34% ownership interest in Atria, which entitles us to customary minority rights and protections, as well as the right to appoint two members to the Atria Board of Directors. See Note 7 – Investments in Unconsolidated Entities of the Notes to Consolidated Financial Statements included in Part II, Item 8 of this Annual Report for a further discussion of our ownership interest.
Outpatient Medical and Research Portfolio (OM&R)
In our OM&R segment, we primarily acquire, own, develop, lease and manage outpatient medical buildings and research centers.
Our outpatient medical buildings, which are predominantly located on or contiguous to a health system campus, are generally multi-tenant properties leased to health systems and several unrelated medical practices, although in many cases they may be associated with a large single specialty or multi-specialty group, including neighboring health systems. Tenants typically require customized space devoted to patient examination and treatment, diagnostic imaging, outpatient surgery and other outpatient services. Outpatient medical buildings typically require enhanced plumbing, electrical and mechanical systems to accommodate the needs of healthcare providers such as sinks in every room, brighter lights and specialized medical equipment.
Our research centers generally contain laboratory and office space that is leased primarily to universities, academic medical centers, technology, biotechnology, medical device and pharmaceutical companies and other organizations involved in the research industry. While these properties may have certain characteristics similar to commercial office buildings, they generally contain more advanced electrical, mechanical, heating, ventilating and air conditioning systems. The facilities generally have specialty equipment including emergency generators, fume hoods, lab bench tops and related amenities. In many instances, research center tenants make significant investments to improve their leased space, in addition to landlord improvements, to accommodate biology, chemistry or medical device research initiatives. Our research centers are often located on or contiguous to university and academic medical campuses.
We lease these properties to tenants under varying lease types that obligate the tenants to pay rent, and may require the tenant to pay their proportionate share of some or all property-related expenses, including utilities, real estate taxes, insurance,
repairs and maintenance, cleaning, roads and grounds expense and other expenses. The leases are typically for a fixed term, and may be subject to renewal under certain conditions.
Although we do not participate directly in the financial performance of our tenants’ operations, we are exposed to the credit risk of our tenants in our OM&R segment. See “Risk Factors—Risks Related to Our Business Operations and Strategy—If our managers’, tenants’ or borrowers’ financial condition or business prospects deteriorate, our business, financial condition and results of operations could be adversely affected” included in Part I, Item 1A of this Annual Report.
Through our Lillibridge subsidiary and our 50% ownership interest in PMB Real Estate Services LLC (“PMBRES”), a property management platform, we provide outpatient medical building and research center management, leasing, marketing, facility development and advisory services to highly rated hospitals and health systems and universities, academic medical centers, biotech and other similar companies throughout the United States.
Triple-Net Leased Properties (NNN)
In our NNN segment, we invest in and own senior housing communities, skilled nursing facilities (“SNFs”), long-term acute care facilities (“LTACs”), freestanding inpatient rehabilitation facilities (“IRFs”) and other healthcare facilities.
The senior housing communities in our NNN segment may include independent living communities, assisted living communities, memory care communities and continuing care retirement communities, which property types are described in more detail above in “—Senior Housing Operating Portfolio (SHOP).”
SNFs provide rehabilitative, restorative, skilled nursing and medical treatment for patients and residents who do not require the high technology, care-intensive, high-cost setting of an acute care or rehabilitation hospital. Treatment programs include physical, occupational, speech, respiratory and other therapies, including sub-acute clinical protocols such as wound care and intravenous drug treatment.
LTACs typically serve medically complex, chronically ill patients who require a high 1evel of monitoring and specialized care, but whose conditions do not necessitate the continued services of an intensive care unit and have a Medicare average length of stay of greater than 25 days. The tenants of these LTACs have the capability to treat patients who suffer from multiple systemic failures or conditions such as neurological disorders, head injuries, brain stem and spinal cord trauma, cerebral vascular accidents, chemical brain injuries, central nervous system disorders, developmental anomalies and cardiopulmonary disorders. Chronic patients often depend on technology for continued life support, such as mechanical ventilators, total parenteral nutrition, respiration or cardiac monitors and dialysis machines, and, due to their severe medical conditions, generally are not clinically appropriate for admission to a skilled nursing facility or rehabilitation hospital.
IRFs are devoted to the rehabilitation of patients with various neurological, musculoskeletal, orthopedic and other medical conditions following stabilization of their acute medical issues. Other healthcare facilities provide medical and surgical services, including inpatient care, intensive care, cardiac care, diagnostic services and emergency services. These other healthcare facilities may also provide outpatient services such as outpatient surgery, laboratory, radiology, respiratory therapy, cardiology and physical therapy.
Charges for services provided at SNFs, LTACs, IRFs and other healthcare facilities are generally paid from a combination of government reimbursement, commercial insurance and other private sources.
We lease these properties to tenants under triple-net or absolute-net leases that obligate the tenants to pay all property-related expenses, including maintenance, utilities, repairs, taxes, insurance and capital expenditures. The leases in our NNN segment typically contain annual or periodic rent escalators that may be contingent upon the satisfaction of specified facility revenue parameters or based on increases in the Consumer Price Index (“CPI”), with caps, floors or collars. These agreements may include provisions for termination under specific circumstances, including in the event of a monetary or non-monetary default by the tenant or in the event of a failure of the tenant to meet certain financial or operational covenants. The agreements typically include broad indemnities in our favor from the tenant for liabilities arising out of the tenant’s operations. Although we do not participate directly in the financial performance of the tenants’ operations, we are exposed to the credit risk of our tenants in our NNN segment. See “Risk Factors—Risks Related to Our Business Operations and Strategy—If our managers’, tenants’ or borrowers’ financial condition or business prospects deteriorate, our business, financial condition and results of operations could be adversely affected” included in Part I, Item 1A of this Annual Report.
The following table provides information regarding our significant triple-net leased tenant concentration as of and for the year ended December 31, 2024:
| | | | | | | | | | | | | | | | | |
| Percentage of Total NOI | | Segment Properties | | Percentage of Segment Properties |
Brookdale Senior Living, Inc. (1) | 7.2 | % | | 121 | | | 8.9 | % |
| Kindred Healthcare, LLC | 6.7 | | | 34 | | | 2.5 | |
Ardent Health Partners, LLC (2) | 6.6 | | | 11 | | | 0.8 | |
| | | | | |
______________________________
(1)Excludes nine properties managed by Brookdale Senior Living, Inc. pursuant to long-term management agreements and included in the SHOP segment.
(2)We also lease 19 outpatient medical buildings to Ardent, which are included in the OM&R segment.
The properties we lease to Brookdale Senior Living, Inc. (together with its subsidiaries, “Brookdale”), Ardent Health Partners, LLC (together with its subsidiaries, “Ardent”) and Kindred Healthcare, LLC (together with its subsidiaries, “Kindred”) accounted for a significant portion of our NNN segment revenues and NOI for the year ended December 31, 2024. See “Risk Factors—Risks Related to Our Business Operations and Strategy—A significant portion of our revenues and operating income is dependent on a limited number of managers and tenants, including Atria, Sunrise, Le Groupe Maurice, Brookdale, Ardent and Kindred” included in Part I, Item 1A of this Annual Report, “Management’s Discussion and Analysis of Financial Condition and Results of Operations— “Concentration Risk,” included in Part II, Item 7 of this Annual Report and “Note 3 – Concentration of Credit Risk” included in Part II, Item 8 of this Annual Report.
As of December 31, 2024, we held warrants for 11.1 million shares of Brookdale common stock, which are exercisable at any time prior to December 31, 2025 and have an exercise price of $3.00 per share (the “Brookdale Warrants”). In addition, we hold warrants exercisable at any time prior to September 13, 2034 for 9.9% of the common equity of a parent company of Kindred exercisable at the pre-transaction value of such common equity (the “Scion Warrants”). See “Note 9 – Other Assets” of the Notes to Consolidated Financial Statements included in Part II, Item 8 of this Annual Report.
As of December 31, 2024, we held an approximately 6.7% ownership interest in Ardent. See “Note 7 – Investments in Unconsolidated Entities” of the Notes to Consolidated Financial Statements included in Part II, Item 8 of this Annual Report for a further discussion of our ownership interest.
Non-Segment Assets
Non-segment assets consist primarily of corporate assets, including cash and cash equivalents, restricted cash, loans receivable and investments and accounts receivable. Our loans receivable and investments generally provide us with interest income and fees and are often secured by mortgage liens or leasehold mortgages on the underlying properties and corporate or personal guarantees by affiliates of the borrowing entity. In some cases, the loans are secured by a pledge of ownership interests in the entity or entities that own the related properties or may take the form of mezzanine loans, which are subordinated to senior secured loans held by other investors that encumber the same real estate. Non-segment assets also include other assets, such as our Brookdale and Kindred Warrants. See “Note 6 – Loans Receivable and Investments” of the Notes to Consolidated Financial Statements included in Part II, Item 8 of this Annual Report. Although we do not participate directly in the financial performance of the operations of our borrowers’ properties, we are directly exposed to the credit risk of our borrowers and therefore indirectly to the operational risks of our borrowers. See “Risk Factors—Risks Related to Our Business Operations and Strategy—If our managers’, tenants’ or borrowers’ financial condition or business prospects deteriorate, our business, financial condition and results of operations could be adversely affected” included in Part I, Item 1A of this Annual Report.
Non-segment assets also include our investments in unconsolidated entities, including investments in unconsolidated real estate entities through our third-party institutional private capital management platform, VIM, and investments in unconsolidated operating entities, such as Ardent and Atria. Through VIM, we partner with third-party institutional investors to invest in real estate through various joint ventures and other co-investment vehicles. In these arrangements, we are typically the general partner and earn fees as a result of that service. The assets in our VIM business are primarily comprised of three platforms: the Ventas Fund, a state pension fund joint venture and a sovereign wealth fund joint venture. The Ventas Fund is a perpetual life vehicle focused on investments in core and core plus life science, outpatient medical and senior housing real estate in North America. Our state pension fund joint venture is principally focused on investment in ground up development and value added redevelopment of senior housing. Our sovereign wealth fund joint venture is focused on university-based research and innovation development projects. In the Ventas Fund and certain other ventures, we have the ability to earn
revenues through incentive fees periodically during the life of a venture. See “Note 7 – Investments in Unconsolidated Entities” of the Notes to Consolidated Financial Statements included in Part II, Item 8 of this Annual Report.
Development and Redevelopment Activities
From time to time, we engage in development and redevelopment activities within our reportable business segments and through our investments in unconsolidated entities. For example, we are party to certain agreements that commit us to develop properties funded through capital that we and, in certain circumstances, our joint venture partners provide. As of December 31, 2024, we had three active and committed projects pursuant to these agreements, including two projects that are unconsolidated. In addition, from time to time, we engage in redevelopment projects with respect to our existing senior housing communities, outpatient medical buildings and research centers to maximize the value, increase NOI, maintain a market-competitive position, achieve property stabilization or change the primary use of the property.
Geographic Diversification of Properties
Our portfolio of assets is broadly diversified by geographic location throughout the United States, Canada and the United Kingdom, with properties in only one state (California) accounting for more than 10% of our total revenues for the year ended December 31, 2024. See “Management’s Discussion and Analysis of Financial Condition and Results of Operations—”Concentration Risk.” included in Part II, Item 7 of this Annual Report.
Competition
We generally compete for investments in real estate with publicly traded, private and non-listed healthcare REITs, real estate partnerships, healthcare providers, healthcare lenders and other investors, including developers, banks, insurance companies, pension funds, government-sponsored entities and private equity firms, some of whom may have greater financial resources and lower costs of capital than we do. Increased competition challenges our ability to identify and successfully capitalize on opportunities that meet our objectives, which is affected by, among other factors, the availability of suitable acquisition or investment targets, our ability to negotiate acceptable transaction terms and our access to and cost of capital. See “Risk Factors—Risks Related to Our Business Operations and Strategy—Our ongoing strategy depends, in part, upon identifying and consummating future acquisitions and investments and effectively managing our expansion opportunities” included in Part I, Item 1A of this Annual Report and “Note 10 – Senior Notes Payable and Other Debt” of the Notes to Consolidated Financial Statements included in Part II, Item 8 of this Annual Report.
Our managers, tenants and borrowers typically compete on a local and regional basis with other organizations that provide comparable services. They typically compete to attract and retain residents and patients to our properties based on scope and quality of care, reputation and financial condition, price, location and physical appearance of the properties, services offered, qualified personnel, physician referrals and family preferences. With respect to outpatient medical buildings and research centers, we and our third-party managers compete to attract and retain tenants based on many of the same factors, in addition to quality of the affiliated health system or university, physician preferences and proximity to hospital or university campuses or research centers and quality of lab space. The ability of our managers, tenants and borrowers to compete successfully could be affected by private, federal and state reimbursement programs and other laws and regulations. See “Risk Factors—Our Legal, Compliance and Regulatory Risks—We and our managers, tenants and borrowers may be adversely affected by regulation and enforcement” included in Part I, Item 1A of this Annual Report.
Human Capital Management
At Ventas, our experienced team drives our success and creates value. As of December 31, 2024, we had 498 employees, none of which are subject to a collective bargaining agreement.
We provide a unique environment that offers opportunities for our team to use their professional skills, develop their talents and learn from each other as they build successful careers. We are committed to upholding human dignity and equal opportunity under the principles outlined in the United Nations’ Universal Declaration of Human Rights. Our Global Code of Ethics and Business Conduct, Vendor Code of Conduct and Human Rights Policy embed the responsibility to respect human rights in business functions across our operations as well as our supply chain.
The Compensation Committee and Nominating, Governance and Corporate Responsibility (“NGCR”) Committee of our Board of Directors provide oversight on certain human capital matters, goals and framework. We report on human capital matters regularly to our Compensation Committee and periodically to our Board of Directors. The most significant human capital measures and objectives that we focus on include the topics described below.
Talent Acquisition, Development and Retention
We strive to foster a culture that attracts and retains individuals who share a passion for integrity, flawless execution, collaborative problem-solving and, above all, excellence. A key component of our ability to attract and retain the top talent in our industry is our investment in our people and their continuous development by providing expansive professional opportunities, best-in-class leadership development and a broad array of workshops and training.
Employee engagement and employee satisfaction contribute to our ability to attract and retain top talent. Each year, we conduct an employee engagement survey through an independent third party, which measures our progress on key employee issues and identifies opportunities for evolving our programs.
Compensation and Benefits
Ventas prides itself in offering an industry-leading compensation and benefits package. Our benefits programs include a robust offering of medical, dental, vision, life, accidental death and dismemberment, disability plans and wellness programs, all of which require very low employee contributions or are offered at no cost to employees. We also provide other ancillary benefits at competitive group rates that allow employees to customize benefits to best meet their needs. The Ventas retirement plans consist of a 401(k) profit sharing plan with both pretax and Roth offerings and competitive employer matching contributions.
Health & Safety
Ventas is committed to the health and safety of its employees. Helping to make our workplaces secure and hazard-free is a responsibility shared with each Ventas employee. Our commitment to health and safety is maintained by effective administration, training and education, and we expect our operating and development partners to comply with applicable company and legal requirements.
Organizational Resilience
Our talented employee base is the foundation of our organizational resilience. As part of our employee value proposition, in addition to competitive compensation and benefits offerings, we invest in growth, development opportunities and comprehensive performance management for our employees that empower them to realize their full potential, expand their capabilities and fill critical roles within the organization. Our employee base is comprised of a mix of longer tenured employees, who contribute deep institutional experience and knowledge, and shorter tenured employees, who contribute new perspectives and ways of doing things. As of December 31, 2024, more than 40% of our employees have been promoted or transferred internally for new opportunities, reflecting our deep commitment to creating an environment where people can build their careers.
The Nominating, Governance & Corporate Responsibility Committee leads, and the Board oversees and reviews at least annually, a robust short- and long-term succession planning process for our senior management team, including our CEO. In general, our management succession planning is designed to anticipate both “planned” successions, such as those arising from anticipated retirements, and unplanned succession events, including emergencies and a range of other potential contingencies.
The CEO and Vice President, Human Resources support the annual succession plan review conducted by the Nominating, Governance & Corporate Responsibility Committee by providing information about each executive role and succession scenarios, including an overview of each potential successor’s experience and potential, readiness assessment and planned leadership development opportunities. The independent members of the Board also regularly interact with executives across several leadership levels of Ventas through management presentations at the Board meetings and other informal events to form their own independent assessment of senior leaders.
Both the Nominating, Governance and Corporate Responsibility Committee and the Board also regularly review strength and gaps in the executive and senior management team and their organizations with the Company’s long-term strategy and goal of optimizing performance in mind. When appropriate, action plans are identified and executed to drive performance, enhance organizational resilience and support succession planning, including for the CEO. We engage third party experts where appropriate to bring additional insights to, and facilitate, succession planning, conduct assessments and provide coaching and development to executives and others in cases where the Company and the employee will benefit.
Corporate Sustainability
Ventas has a robust, data-driven strategy designed to support the sustainable growth of our business and build long-term value for shareholders and other key stakeholders. Three priorities guide our efforts:
•Our Impact: Enabling Sustainable Environments and Strong Communities
•Our Employees: Empowering Exceptional People
•Our Standards: Leading in Governance and Transparency
Ventas has set measurable goals related to each of our key sustainability topics and progress towards these goals is reported annually in our Corporate Sustainability Report.
These matters are overseen by our NGCR Committee. Our EVP, General Counsel and Ethics & Compliance Officer and VP, Corporate ESG & Sustainability report on these matters regularly to the NGCR Committee and periodically to our Board of Directors.
Insurance
We maintain or require in our lease, management and other agreements that our managers, tenants or other counterparties maintain comprehensive insurance coverage on our properties and their operations with terms, conditions, limits and deductibles that we believe are customary for similarly situated companies in each industry and we frequently review our insurance programs and requirements. The insurance that we maintain or require may take the form of commercial insurance, captive insurance or self-insurance.
We maintain the property insurance for a vast majority of our properties in our OM&R and SHOP segments. We also maintain liability insurance for certain outpatient medical properties, as well as the general and professional liability insurance for certain senior housing communities and related operations in our SHOP segment. However, some senior housing managers maintain the general and professional liability insurance for our senior housing communities and related operations that they manage in accordance with the terms of our management agreements.
Through our OM&R segment, we provide engineering, construction and architectural services in connection with new development projects, and we maintain and cause tenants, contractors, design professionals and other parties involved with such services to maintain property and liability insurance with respect to those activities.
In May 2020, the Company formed a wholly-owned captive insurance company, which provides insurance coverage for losses below the deductible and within the self-insured retention of the commercial property, general and professional liability insurance that we maintain for certain of our outpatient medical and senior housing locations.
Additional Information
We maintain a website at www.ventasreit.com and an Investor Relations website at ir.ventasreit.com. We use our Investor Relations website as a means of disclosing material information. Accordingly, investors should monitor our Investor Relations website in addition to following our press releases, SEC filings and public conference calls and webcasts. The information on our website and our Investor Relations website is not incorporated by reference in this Annual Report, and our web addresses are included as an inactive textual reference only.
We make available, free of charge, through our Investor Relations website, our Annual Report, Quarterly Reports on Form 10-Q, Current Reports on Form 8-K and amendments to those reports filed or furnished pursuant to Section 13 or 15(d) of the Exchange Act as soon as reasonably practicable after we electronically file such material with, or furnish it to, the SEC. In addition, our Guidelines on Governance, our Global Code of Ethics and Business Conduct (including waivers from and amendments to that document) and the charters for each of our Audit and Compliance, Nominating and Corporate Governance and Compensation Committees are available on our website, and we will mail copies of the foregoing documents to stockholders, free of charge, upon request to our Corporate Secretary at Ventas, Inc., 300 North LaSalle Street, Suite 1600, Chicago, Illinois 60654.
GOVERNMENT REGULATION
United States Healthcare Regulation, Licensing and Enforcement
Overview
We, along with our managers, tenants and borrowers in the United States, are subject to or impacted by extensive and complex federal, state and local healthcare laws and regulations, including laws and regulations relating to quality of care, licensure and certificates of need (“CON”), conduct of operations, government reimbursement, such as Medicare and Medicaid, fraud and abuse, qualifications of personnel, appropriateness and classification of care, adequacy of plant and equipment and data privacy and cybersecurity. In our SHOP segment, these laws and regulations typically apply directly to us and our senior housing communities, where we generally hold the applicable healthcare licenses. In some instances, we enroll in government reimbursement programs, such as Medicaid. In our other segments, our tenants and borrowers are typically subject to these laws and regulations. Imposition of sanctions associated with these laws and regulations could adversely affect the tenant’s or borrower’s ability to satisfy its obligations to us. See “Risk Factors—Risks Related to Our Business Operations and Strategy—Our operating assets may expose us to various operational risks, liabilities and claims that could adversely affect our ability to generate revenues or increase our costs and could adversely affect our business, financial condition and results of operations” and “Risk Factors—Risks Related to Our Business Operations and Strategy—If our managers’, tenants’ or borrowers’ financial condition or business prospects deteriorate, our business, financial condition and results of operations could be adversely affected” included in Part I, Item 1A of this Annual Report.
Healthcare laws and regulations are wide-ranging, and noncompliance may result in the imposition of civil, criminal, and administrative penalties, including: the loss or suspension of accreditation, licenses or CONs; suspension of or non-payment for new admissions; denial of reimbursement; fines; suspension, decertification, or exclusion from federal and state healthcare programs; or facility closure. Changes in laws or regulations, reimbursement policies, enforcement activity and regulatory non-compliance by us or our managers, tenants or borrowers could have a significant effect on our and their operations and financial condition, which in turn may adversely impact us, as detailed below and set forth under “Risk Factors—Our Legal, Compliance and Regulatory Risks” in Part I, Item 1A of this Annual Report.
Licensure, Certification and CONs
Senior housing communities, other than independent living communities, are subject to state and local laws that may require licenses, certifications and permits, and may vary greatly from one jurisdiction to another. Our senior housing communities that receive Medicaid payments are also subject to extensive federal laws and regulation. Our tenants or borrowers who operate other facilities, such as SNFs, LTACs, IRFs, health systems and medical practices, are typically subject to extensive federal and state regulation and must hold various licenses, certifications, and permits. Licensure and certification may be conditioned on requirements related to, among other things, the quality of medical care provided, compliance with staffing levels and reporting requirements, qualifications of the operator’s administrative personnel and clinical staff, adequacy of the physical plant and equipment and continuing compliance with applicable laws and regulations. Sanctions for failure to comply with licensure and certification laws and regulations include loss of licensure or certification and ability to participate in or receive payments from the Medicare and Medicaid programs, suspension of or non-payment for new admissions, fines, and potential criminal penalties.
Many of our licensed facilities, tenants and borrowers are subject to state CON laws, which require governmental approval prior to the development or expansion of licensed facilities and services. The approval process in states with CON laws generally requires a facility to demonstrate the need for additional or expanded licensed facilities or services. CONs, where applicable, are also sometimes necessary for changes in ownership or control of licensed facilities, addition of beds, investment in major capital equipment, introduction of new services or termination of services previously approved through the CON process. CON laws and regulations may restrict our or our tenants’ ability to expand and grow in certain circumstances, which could have an adverse effect on our or their revenues.
Fraud and Abuse Enforcement
Participants in the U.S. healthcare industry are subject to complex federal and state civil and criminal laws and regulations governing healthcare provider referrals, relationships and arrangements. These laws include: (i) federal and state false claims acts, which generally prohibit providers from filing false claims or making false statements to receive payment from Medicare, Medicaid or other federal or state healthcare programs; (ii) federal and state anti-kickback and fee-splitting statutes, including the federal Anti-Kickback Statute, which prohibits the payment or receipt of remuneration to induce referrals or generate business involving healthcare items or services payable by Medicare or Medicaid; (iii) federal and state physician
self-referral laws, which generally prohibit referrals of certain services by physicians to entities with which the physician or an immediate family member has a financial relationship; and (iv) the federal Civil Monetary Penalties Law, which requires a lower burden of proof than other fraud and abuse laws and prohibits, among other things, the knowing presentation of a false or fraudulent claim for certain healthcare services.
Violating these healthcare fraud and abuse laws and regulations may result in criminal and civil penalties, such as punitive sanctions, damage assessments, monetary penalties, imprisonment, denial of Medicare and Medicaid payments, and exclusion from the Medicare and Medicaid programs. These laws and regulations are enforced by a variety of federal, state and local governmental agencies, and many can also be enforced by private litigants through federal and state false claims acts and other laws that allow private individuals to bring whistleblower suits known as qui tam actions.
Reimbursement
Sources of revenue for us and some of our tenants and borrowers include, among others, governmental healthcare programs, such as the federal Medicare programs and state Medicaid programs, and non-governmental third-party payors, such as insurance carriers and health maintenance organizations. Medicare is a federal health insurance program for persons aged 65 and over, some disabled persons and persons with end-stage renal disease. Medicaid is a medical assistance program for eligible needy persons that is funded jointly by federal and state governments and administered by the states. Medicaid eligibility requirements and benefits vary by state. The Medicare and Medicaid programs are highly regulated and subject to frequent and substantial changes resulting from legislation, regulations and administrative and judicial interpretations of existing law.
Federal and state governments may from time to time reduce Medicare and Medicaid spending through methods such as reductions in reimbursement rates and increased enrollment in managed care programs. Private payors, such as insurance companies, are typically for-profit companies and are continuously seeking opportunities to control healthcare costs. In some cases, private payors rely on government reimbursement systems to determine reimbursement rates, such that reductions in Medicare and Medicaid payment rates may negatively impact payments from private payors. These changes may result in reduced or slower growth in reimbursement for certain services provided by some of our tenants and borrowers. Additionally, the U.S. Congress and certain state legislatures have introduced and passed a large number of proposals and legislation designed to make major changes in the healthcare system, including changes that directly or indirectly affect reimbursement. Several of these laws, including the Patient Protection and Affordable Care Act, as amended by the Health Care and Education Reconciliation Act of 2010 (the “Affordable Care Act”), have promoted shifting from traditional fee-for-service reimbursement models to alternative payment models that tie reimbursement to quality and cost of care, such as accountable care organizations and bundled payments. It is difficult to predict the nature and success of future financial or delivery system reforms, but changes to reimbursement rates and related policies could adversely impact our and our tenants’ results of operations.
CARES Act and Similar Governmental Funding Programs
In response to the COVID-19 pandemic, in 2020, Congress enacted a series of economic stimulus and relief measures through the Coronavirus Aid, Relief and Economic Security Act (the “CARES Act”), the Paycheck Protection Program and Health Care Enhancement Act and the Consolidated Appropriations Act, 2021. Other domestic, foreign, local, regional or national governments also implemented similar grant programs. We, and our managers, tenants and borrowers, applied for and received grants under these types of government programs.
The HHS Office of Inspector General, the Pandemic Response Accountability Committee and other governments each may have the right to conduct audits of our, or our managers’, tenants’ or borrowers’, use of funds from such programs and may have the right to recoup some or all of the payments if it determines those payments were not made or the funds not used in compliance with its rules, regulations and interpretive guidance.
Data Privacy and Cybersecurity
We and our managers, tenants and borrowers are subject to federal and state laws and regulations related to data privacy and cybersecurity. In most cases, we depend on our managers, tenants and borrowers to fulfill any compliance obligations with respect to these data privacy and cybersecurity laws and regulations.
For example, data privacy and cybersecurity regulations issued pursuant to the Health Insurance Portability and Accountability Act of 1996, as amended (“HIPAA”), restrict the use and disclosure of individually identifiable health information (“protected health information” or “PHI”), provide for individual rights and require safeguards for PHI and notification of breaches of unsecure PHI. Entities subject to HIPAA include most healthcare providers, including some of our managers, tenants and borrowers. These covered entities are required to implement administrative, physical and technical
practices to protect the security of PHI that is electronically maintained or transmitted. Business associates of covered entities who create, receive, maintain or transmit PHI are also subject to certain HIPAA provisions. Violations of HIPAA may result in substantial civil and/or criminal fines and penalties. The Federal Trade Commission uses its consumer protection authority to initiate enforcement actions in response to data breaches. and regulate unfair or deceptive acts or practices, including with respect to data privacy and cybersecurity. Moreover, the U.S. Congress has recently considered, and is currently considering, various proposals for more comprehensive data privacy and cybersecurity legislation to which we or our managers, tenants and borrowers may be subject if passed.
Data privacy and cybersecurity are also areas of increasing state legislative focus, and states are increasingly proposing or enacting legislation that relates to data privacy and cybersecurity. For example, the California Consumer Privacy Act, as amended by the California Privacy Rights Act (collectively, the “CCPA”), gives California residents certain rights with respect to their personal information. Other states where we or our managers, tenants or borrowers do business, or may in the future do business, have enacted, or are considering enacting, comprehensive data privacy and cybersecurity laws that share similarities with the CCPA, for example the Texas Data Privacy and Security Act, effective as of July 1, 2024. In addition, laws in all 50 U.S. states and most U.S. territories generally require businesses to provide notice under certain circumstances to consumers whose personal information has been disclosed as a result of a data breach, and we or our managers, tenants or borrowers may be required to report events related to data privacy or cybersecurity issues, events where customer information may be compromised, unauthorized access to our or their systems or networks and other security breaches, to affected individuals or the relevant regulatory authorities. These state statutes, and other similar federal and state laws and regulations that may be enacted in the future, may require us or our managers, tenants or borrowers to modify our or their data processing practices and policies, incur substantial compliance-related costs and expenses and otherwise suffer adverse impacts on our or their business.
International Healthcare Regulation
We own senior housing communities in Canada and the United Kingdom. Senior living residences in Canada are provincially regulated. Within each province, there are different categories for senior living residences that are generally based on the level of care sought or required by a resident (e.g., assisted or retirement living, senior living residences, residential care, long-term care). In some of these categories and depending on the province, residences may be government funded, or the individual residents may be eligible for a government subsidy, while other residences are exclusively private-pay. The governing legislation and regulations vary by province, but generally impose licensing requirements and requirements related to quality control, public health, infection control and other care-related operating standards. These laws empower regulators in each province to take a variety of steps to ensure compliance, conduct inspections, issue reports and generally regulate the industry. Our communities in Canada are also subject to data privacy and cybersecurity legislation, including, in certain provinces, data privacy and cybersecurity laws specifically related to personal health information. Although the obligations of senior living residences in the various provinces differ, they all include the obligation to protect personal information. The powers of data privacy and cybersecurity regulators and penalties for violations of data privacy and cybersecurity laws vary according to the applicable law or are left to the courts. Our senior living residences in Canada are also subject to a variety of other laws and regulations, including minimum wage standards and other employment laws.
In the United Kingdom, our senior housing communities are principally regulated as “care home services” under the Health and Social Care Act 2008. This legislation subjects service providers to standards of care and requires, among other things, that all persons carrying out such activities, and the managers of such persons, be registered. Providers of care home services are also subject (as data controllers) to the U.K.’s Data Protection Act 2018, as supplemented by the European Union’s General Data Protection Regulation as implemented into U.K. law (collectively, “UK GDPR”), which governs the processing of personal data (including in relation to employees, clients and recipients of care home services). The UK GDPR imposes a significant number of obligations on data controllers with the potential for fines of up to 4% of annual worldwide turnover or £17.5 million, whichever is greater. Our business operations in the United Kingdom are also subject to a range of other regulations, such as the U.K. Bribery Act 2010.
Regulation Impacting Life Sciences Research
Some of our tenants, including university-affiliated organizations and private sector companies, conduct life sciences, medical device or related research. These tenants may be dependent on the public markets, private investors, the federal government agencies, such as the National Institutes of Health (“NIH”), or other sources of funding to support their activities. Creating a new pharmaceutical product or medical device requires substantial investments of time and capital, in part because of the extensive regulation of the healthcare industry; it also entails considerable risk of failure in demonstrating that the product is safe and effective and in gaining regulatory approval and market acceptance. Therefore, these tenants may face high levels of regulation, expense and uncertainty. See “Risk Factors—Risks Related to Our Business Operations and Strategy—Our research tenants face unique levels of expense and uncertainty” included in Part I, Item 1A of this Annual Report.
Our tenants with marketable products may be adversely affected by healthcare reform and government reimbursement policies, including changes under the current presidential administration or by private healthcare payors. See “Risk Factors—Risks Related to Our Business Operations and Strategy—Changes in the U.S. political and regulatory environment could affect availability of government funding that we or our managers, tenants or borrowers rely on, which could negatively impact our business” included in Part I, Item 1A of this Annual Report
Tax Regulation
We elected to be taxed as a REIT under Sections 856 through 860 of the Code, commencing with our taxable year ended December 31, 1999. Provided we qualify for taxation as a REIT, we generally will not be required to pay U.S. federal corporate income taxes on our REIT taxable income that is currently distributed to our stockholders. This treatment substantially eliminates the “double taxation” that ordinarily results from investment in a C corporation. We are required to pay income tax in certain circumstances, including on taxable income earned by our taxable REIT subsidiaries.
In addition, we are subject to state and local tax in the U.S. and certain states do not conform completely to the federal income tax rules. We also are subject to non-U.S. tax on our operations in Canada and in the U.K., as our U.S. REIT status does not by itself afford us special tax status in those countries. We attempt to structure our investments outside of the U.S. in the most efficient manner possible, but do expect to incur some tax expense on our non-U.S. operations, which could increase due to tax rate increases, interest expense limitations or other changes in law. In particular, recently finalized legislation related to interest expense deductibility in Canada may have a significant impact on our income tax expense and cash taxes. See “Risk Factors—Our REIT Status Risks—Legislative or other actions affecting REITs or taxes could have a negative effect on our stockholders or us” included in Part I, Item 1A of this Annual Report.
The Code defines a REIT as a corporation, trust or association:
(1) that is managed by one or more trustees or directors;
(2) that issues transferable shares or transferable certificates to evidence its beneficial ownership;
(3) that would be taxable as a domestic corporation, but for Sections 856 through 860 of the Code;
(4) that is not a financial institution or an insurance company within the meaning of certain provisions of the Code;
(5) that is beneficially owned by 100 or more persons;
(6) not more than 50% in value of the outstanding stock of which is owned, actually or constructively, by five or fewer individuals, including certain specified entities, during the last half of each taxable year; and
(7) that meets other tests, regarding the nature of its income and assets and the amount of its distributions.
We believe that we have been organized and have operated in a manner that has allowed us, and will continue to allow us, to satisfy conditions (1) through (7) inclusive, during the relevant time periods, and we intend to continue to be organized and operate in this manner. However, qualification and taxation as a REIT depend upon our ability to meet the various qualification tests imposed under the Code, including through actual operating results, asset composition, distribution levels and diversity of stock ownership. Accordingly, no assurance can be given that we will be organized or will be able to operate in a manner so as to qualify or remain qualified as a REIT.
If we lose our status as a REIT (currently or with respect to any tax years for which the statute of limitations has not expired), we will face serious tax consequences that will substantially reduce the funds available to satisfy our obligations, to implement our business strategy and to make distributions to our stockholders for each of the years involved because:
•We would not be allowed a deduction for distributions to stockholders in computing our taxable income and would be subject to regular U.S. federal corporate income tax;
•We could be subject to increased state and local taxes; and
•Unless we are entitled to relief under statutory provisions, we could not elect to be subject to tax as a REIT for four taxable years following the year during which we were disqualified.
In addition, in such event we would no longer be required to pay dividends to maintain REIT status, which could adversely affect the value of our common stock. See “Risk Factors—Our REIT Status Risks.”
Our senior housing communities, including certain of our independent living communities, that are considered “qualified healthcare properties” that are not leased to a third party operator generally must be owned and operated in a structure where we engage a third-party manager to manage and operate the senior housing communities. For these senior housing communities we are required to rely on a third-party manager to manage and operate the property, including for purposes of procuring supplies, hiring and training all employees, entering into all third-party contracts for the benefit of the property, including resident/patient agreements, complying with laws and regulations, including but not limited to healthcare laws, and providing resident care and services, in exchange for a management fee. We treat most of the senior housing communities in our SHOP segment as qualified healthcare properties that must be operated by third-party managers.
Environmental Regulation
A wide variety of federal, local and foreign environmental and occupational health and safety laws and regulations affect our assets. These complex federal, local and foreign statutes, and their enforcement, involve a myriad of regulations, many of which impose strict liability on offenders. Some of these federal, local and foreign laws and regulations may directly impact us. Under various federal, local and foreign environmental laws, ordinances and regulations, an owner of real property or a secured lender, such as us, may be liable for the costs of removal or remediation of hazardous or toxic substances at, under or disposed of in connection with such property, as well as other potential costs relating to hazardous or toxic substances (including government fines and damages for injuries to persons and adjacent property).
With respect to our properties that are operated by third parties, we may be held primarily or jointly and severally liable for costs relating to the investigation and cleanup of any property from which there is or has been an actual or threatened release of a regulated material and any other affected properties, regardless of whether we knew of or caused the release. Such costs typically are not limited by law or regulation and could exceed the property’s value. In addition, we may be liable for certain other costs, such as governmental fines and injuries to persons, property or natural resources, as a result of any such actual or threatened release. See “Risk Factors—Risks Related to Our Business Operations and Strategy—Our operating assets may expose us to various operational risks, liabilities and claims that could adversely affect our ability to generate revenues or increase our costs and could adversely affect our business, financial condition and results of operations” included in Part I, Item 1A of this Annual Report.
Under the terms of our leases and loans, we generally have a right to indemnification by the tenants of our properties or borrowers for any contamination caused by them.
In some instances, we have agreed to indemnify our managers and tenants against any environmental claims (including penalties and cleanup costs) resulting from any condition arising in, on or under, or relating to, the applicable properties at any time before the applicable lease or management commencement date. With respect to SHOP, we have agreed to indemnify our managers against any environmental claims (including penalties and cleanup costs) resulting from any condition on those properties.
ITEM 1A. Risk Factors
This section discusses material factors that affect our business, operations and financial condition. It does not describe all risks and uncertainties applicable to us, our industry or ownership of our securities. If any of the following risks, or any other risks and uncertainties that are not addressed below or that we have not yet identified, actually occur, we could be materially adversely affected, and the value of our securities could decline.
As set forth below, we believe that the risks we face generally fall into the following categories:
•Risks Related to Our Business Operations and Strategy
•Our Capital Structure Risks
•Our Legal, Compliance and Regulatory Risks
•Our REIT Status Risks
Risks Related to Our Business Operations and Strategy
Macroeconomic trends, including trends relating to labor costs, unemployment, inflation, interest rates and exchange rates, may affect our business and financial results.
Macroeconomic trends, including unfavorable trends relating to labor costs, unemployment, inflation, interest rates and exchange rates, may adversely impact our business, financial condition and results of operations. Increased labor costs and a shortage of available skilled and unskilled workers may impact our or our managers’, tenants’ or borrowers’ workforce, including employees at our senior housing communities. To the extent we or our managers, tenants or borrowers cannot hire sufficient qualified workers, we or they may need to rely on high-cost alternatives to meet labor needs, including contract and overtime labor. In addition, we and our managers, tenants and borrowers compete with various other companies in attracting and retaining qualified and skilled personnel. Competitive pressures may require that we or our managers, tenants or borrowers enhance pay and benefits packages to compete effectively for such personnel. We and our managers, tenants and borrowers may not be able to offset additional staffing costs by increasing the rates we charge, whether to residents, tenants or others. If there is an increase in these costs or if we or our managers, tenants and borrowers fail to attract and retain qualified and skilled personnel, our respective businesses and operating results could be adversely affected.
Many of our costs and the costs of our managers, tenants and borrowers, including operating and administrative expenses, interest expense and real estate acquisition and construction costs, are subject to inflation. These include expenses for property-related contracted services, utilities, repairs and maintenance and insurance and general and administrative costs including compensation costs, technology services and professional service fees. See also “—We may face increased risks and costs associated with volatility in materials and labor prices or as a result of supply chain or procurement disruptions, which may adversely affect the status of our construction projects.” Property taxes are also impacted by inflationary changes because taxes in some jurisdictions are regularly reassessed based on changes in the fair value of our properties. We may not be able to offset such additional costs by passing them through, or increasing the rates we charge, to residents and tenants. If there is an increase in these costs, our business, cash flows and operating results could be adversely affected.
Rising interest rates may also result in higher operating and incremental borrowing costs for us and our managers, tenants and borrowers. Increases in or elevated interest rates may also result in a decrease in the value of our real estate and a decrease in our cash flows and net income. See “—We are exposed to increases in interest rates, which could reduce our profitability and adversely impact our ability to refinance existing debt, sell assets or engage in acquisition, investment, development and redevelopment activity, and our decision to hedge against interest rate risk might not be effective.”
Elevated inflation or higher than expected interest rates due to macrodevelopments, U.S. government policies, or otherwise, could negatively impact consumer spending, our and our managers’, tenants’ and borrowers’ businesses, and future demand for our properties. See also “—Market conditions and the actual and perceived state of the capital markets generally could negatively impact our business, financial condition and results of operations”, “—If our managers’, tenants’ or borrowers’ financial condition or business prospects deteriorate, our business, financial condition and results of operations could be adversely affected.”
Changes in the U.S. political and regulatory environment could affect availability of government funding that we or our managers, tenants or borrowers rely on, which could negatively impact our business.
We and our managers, tenants and borrowers may rely on government programs or agencies as a source of funding. Our tenants include universities, academic medical centers and other research institutions whose funding may be dependent on grants from government agencies, such as the NIH and similar agencies or organizations. Other of our tenants, such as LTACs, SNFs and certain healthcare facilities, may rely on reimbursement from Medicare and/or Medicaid.
Funding from government agencies and reimbursement programs such as the NIH, Medicare and Medicaid, including the overall availability and reimbursement rates under these programs, often fluctuates and is subject to the political process, which is often unpredictable. For example, on February 7, 2025, the NIH issued Notice Number NOT-OD-25-068, a guidance document pronouncing that reimbursement for certain indirect costs would be capped at 15% for existing and future grant recipients, a rate that is lower than the in-place rate for many existing grant recipients. Certain of our tenants, including certain university tenants, may depend on NIH grants and reimbursements to partially fund research and in some cases to pay rent for space in our properties. In addition, federal policymakers have announced proposals to reduce overall healthcare spending, including with respect to Medicaid funding, which could impact our healthcare provider tenants and borrowers.
Any reduction in the availability or rate of funding or reimbursement, or delays surrounding the approval of such funding or reimbursement, may adversely impact our managers’, tenants’ or borrowers’ operations or may cause our tenants to
cease making rent payment payments to us or delay or forgo leasing space in our properties, which in turn may negatively impact our business, financial condition, or results of operations. In addition, such developments could adversely impact the overall demand for space in our properties.
Economic conditions and other events or occurrences that affect areas in which our properties are geographically concentrated may impact financial results.
We are exposed to general economic conditions, local, regional, national and international economic conditions and other events and occurrences that affect the markets in which we own properties. Our operating performance is impacted by the economic conditions of the specific markets in which we have concentrations of properties and could be adversely affected if conditions become less favorable in any such markets.
A substantial portion of our value is derived from properties in California, New York, Texas, Illinois and Quebec, Canada. As a result, we are subject to increased exposure to adverse conditions affecting these regions, including downturns in the local economies or changes in local real estate conditions, changing demographics, increased construction and competition or decreased demand for our properties, regional climate events, such as wildfires, earthquakes or storms, regional disruptions to, or limited availability of, utilities and other services and changes in the state and local legal and regulatory environment. Our inability to response to such condition, events or occurrences could adversely affect our business, financial condition and results of operations.
To the extent that we or our managers, tenants and borrowers are unable to navigate successfully the trends affecting our or their businesses and the industries in which we or they operate, we may be adversely affected.
Our managers, tenants and borrowers include senior housing managers, hospitals, post-acute facilities and other healthcare systems, medical practices and life sciences and technology companies that are subject to a complex set of trends affecting their businesses and the industries in which they operate. If we or they are unable to successfully navigate these trends, our business, financial condition and results and that of our managers, tenants and borrowers could be adversely affected.
There have been, and there are expected to continue to be, advances and changes in technology, payment models, healthcare delivery models, public policy, regulation and consumer behavior and perception that could reduce demand for on-site activities provided at our properties. For example, the increased demand in telehealth solutions could broadly impact market demand for our properties and cause long-term structural changes in the marketplace. If our managers, tenants or borrowers are unable to adapt to long-term changes in demand, their financial condition could be materially impacted and our business, financial condition and results of operations could suffer.
Our managers, tenants and borrowers face a highly competitive labor market, which has been compounded by general inflationary pressures on wages and could be further compounded by a shortage of care givers or other trained personnel, union activities or minimum wage laws. For example, California SB-525, which was signed into law in June 2023 and became effective for healthcare workers in 2024, requires certain healthcare facility employers to pay wages for certain covered employees that are higher than other state-mandated minimum wages. Pressures such as these may require our managers, tenants and borrowers to comply with regulations or enhance pay and benefits packages to compete effectively for trained personnel or use high-cost alternatives to meet labor needs, including contract and overtime labor. They may be unable to offset these increased costs by increasing the amounts they charge their patients, residents or clients. Rising labor expense could negatively impact the financial condition of our managers, tenants and borrowers and impair their ability to meet their obligations to us.
Federal policymakers have announced proposals that may result in significant changes to the healthcare system in the United States, including with respect to government funding of or from NIH and Medicaid, which could impact certain of our managers, tenants and borrowers. See “—Changes in the U.S. political and regulatory environment could affect availability of government funding that we or our managers, tenants or borrowers rely on, which could negatively impact our business.” These and other trends could significantly and adversely affect the profitability of these tenants, which could affect their ability to make payments or meet their other obligations to us or their willingness to renew their leases on terms that are as favorable to us, or at all.
We are vulnerable to adverse changes affecting our specific asset classes and the real estate industry generally.
We invest in a variety of asset classes in real estate, including senior housing, outpatient medical, research, long-term acute care facilities and other healthcare facilities. While we endeavor to invest in a diversified portfolio, there can be no
assurance that in a particular economic or operational environment all assets will perform equally well or that our balance sheet will be appropriately balanced. Each of our asset classes are subject to their own dynamics and their own specific operational, financial, compliance, regulatory and market risks.
A broad downturn or slowdown in the healthcare real estate sector could have a greater adverse impact on our business than if we had investments in multiple industries and could negatively impact the ability of our managers, tenants and borrowers to meet their obligations to us. A downturn or slowdown in any one of our asset classes could adversely affect the value of our properties in such asset class and our ability to sell such properties at prices or on terms acceptable or favorable to us if at all.
We are exposed to the risks inherent in investments in real estate. Real estate investments are relatively illiquid, and our ability to quickly sell or exchange our properties in response to changes in economic or other conditions is limited. If we market any of our properties for sale, the value of those properties and our ability to sell at prices or on terms acceptable to us could be adversely affected by a downturn in the real estate industry. Transfers of healthcare real estate may be subject to regulatory approvals that are not required for transfers of other types of commercial real estate. We cannot assure you that we will recognize the full value of any property that we sell, and the inability to respond quickly to changes in the performance of our investments could adversely affect our business, financial condition and results of operations.
Our third-party managers and tenants operate or exert substantial control over the properties that they manage for or rent from us, which limits our control and influence over operations and results.
A significant portion of our properties are either managed for us by third-party managers or leased from us by third-party tenants. Our third-party managers and tenants are ultimately in control of the day-to-day business of the properties that they manage for or lease from us. We have limited rights to direct or influence the business or operations of those properties, even though we have approval rights with respect to certain matters and the right to review operational and financial reporting information with respect to a majority of our portfolio. Although we may have the right under specified circumstances to terminate our arrangements with these third parties or pursue other remedies, we either may not be able to enforce these rights or may choose not to enforce these rights if we believe that enforcement would be more detrimental to our business than seeking alternative approaches. We depend on these third parties to operate these properties in a manner that complies with applicable law and regulation, minimizes legal risk and maximizes the value of our investment. These third parties may have business interests, goals and competing interests which conflict with ours that could create a conflict of interest. Additionally, new or smaller third-party managers may have less experience and require more oversight or attention. The failure by these third parties to operate these properties efficiently and effectively and adequately manage the related risks could adversely affect our business, financial condition and results of operations.
Our operating assets may expose us to various operational risks, liabilities and claims that could adversely affect our ability to generate revenues or increase our costs and could adversely affect our business, financial condition and results of operations.
Under the REIT tax rules, the senior housing communities in our SHOP segment that are “qualified healthcare properties” generally must be operated and managed for us by third-party managers and we have limited rights to direct or influence the business or operations of those communities. A number of the non-qualified healthcare properties in our SHOP segment are also managed by third-party managers. However, in each case, we nonetheless participate directly in the financial performance of the communities’ operations and are ultimately responsible for all operational risks and other liabilities of such properties, other than those arising out of certain actions by our managers, such as gross negligence, fraud or willful misconduct. These risks include, and our financial performance is impacted by, among other things, fluctuations in occupancy levels, the inability to charge desirable resident fees (including anticipated increases in those fees), increases in the cost of food, supplies, energy, labor (as a result of labor shortages, unionization, inflation or otherwise) or other services, rent control regulations, national and regional economic conditions, the imposition of new or increased taxes, capital expenditure requirements, changes in management or equity, accounting misstatements, professional and general liability claims, litigation and regulatory actions and the availability and cost of insurance. Any one or a combination of these factors could impact the performance of our SHOP segment, which could adversely affect our business, financial condition and results of operations. Such risks could also arise as a result of our ownership of outpatient medical and research buildings, and which could also adversely affect our business, financial condition and results of operations.
We generally hold the applicable healthcare license and enroll in applicable government healthcare programs on behalf of the properties in our SHOP segment, which subjects us to potential liability under various healthcare laws and regulations. See “—We and our managers, tenants and borrowers may be adversely affected by regulation and enforcement.”
A significant portion of our revenues and operating income is dependent on a limited number of managers and tenants, including Atria, Sunrise, Le Groupe Maurice, Brookdale, Ardent and Kindred.
The portfolios managed or leased by Atria, Sunrise, Le Groupe Maurice, Brookdale, Ardent and Kindred represent a substantial portion of our portfolio and account for a significant portion of our revenues and NOI.
We rely on Atria, Sunrise and Le Groupe Maurice to manage a significant portion of the properties in our SHOP segment, including by setting appropriate resident fees, managing expenses, providing accurate property-level financial results in a timely manner and otherwise managing risk and operating our senior housing communities profitably and in compliance with the terms of our management agreements and all applicable law and regulation. Any adverse developments in such managers’ business and affairs or financial condition could impair their ability to manage our properties efficiently and effectively and could adversely affect the financial performance of our properties and our business, financial condition and results of operations. If Atria, Sunrise or Le Groupe Maurice experience financial, legal, accounting, regulatory or other difficulties that impact their financial stability or ability to operate, our business, financial condition and results of operations could be adversely affected.
We depend on Brookdale, Ardent and Kindred to pay all property-related expenses, including maintenance, utilities, repairs, taxes, insurance and capital expenditures, and to comply with the terms of the mortgage financing, if any, affecting the properties they lease from us. These tenants have also agreed to indemnify, defend and hold us harmless from and against various claims, litigation and liabilities arising in connection with their respective businesses. We cannot assure you that they will be able to, or will continue to, satisfy their obligations to us, and any failure, inability or unwillingness by them to do so could adversely affect our business, financial condition and results of operations. Any failure by any one of Brookdale, Ardent or Kindred to effectively conduct its operations or to maintain and improve the properties they lease from us could adversely affect their financial condition and, in turn, our business, financial condition and results of operations.
If we need to replace any of our managers or tenants, we may be unable to do so on as favorable terms, if at all, and we could be subject to delays, limitations and expenses, which could adversely affect our business, financial condition and results of operations.
Our leases and management agreements have set terms. While our leases and management agreements may be renewed, either pursuant to prenegotiated renewal rights or through negotiation, there can be no assurance that our tenants will renew their leases with us, or our managers will renew their management agreements with us. Even if a tenant renews its lease with us, or a manager renews its management agreement with us, we cannot assure you that the renewals will be on favorable terms. This risk may be exacerbated if market conditions at the time of the renewal are not as favorable as they were at the time the lease or management agreement was initially entered into or if the manager or tenant is subject to financial or operational difficulties.
Our leases and management agreements provide us, our managers and our tenants with termination rights in certain circumstances. If our leases or management agreements are not renewed or are otherwise terminated, we may attempt to reposition those properties with one or more managers or tenants, as applicable, or for an alternative use. We may not be successful in identifying suitable replacements or entering into leases, management agreements or other arrangements with new managers or tenants on a timely basis or on terms as favorable to us as our current leases or management agreements, if at all. We may be required to fund certain expenses and obligations (such as real estate taxes, debt costs and maintenance expenses) or provide certain indemnities to preserve the value of, and avoid the imposition of liens on, our properties while they are being repositioned.
If our leases or management agreements are not renewed or are otherwise terminated at some properties, we may attempt to sell those properties. We may not be successful in identifying suitable buyers or entering into sale agreements with buyers on a timely basis or on favorable terms, if at all, and we may be required to fund some expenses and obligations (such as real estate taxes, debt costs and maintenance expenses) to preserve the value of, and avoid the imposition of liens on, our properties while they are being sold.
During transition periods to new managers or tenants or as a result of a repositioning for an alternative use, the attention of existing managers or tenants may be diverted from the performance of the properties, which could cause the financial and operational performance at those properties to decline. Our ability to reposition our properties with a suitable replacement manager or tenant or for an alternative use could be significantly delayed or limited by state licensing, receivership, certificates of need, Medicaid change-of-ownership rules or other legal and regulatory requirements or restrictions. We could incur substantial additional expenses in connection with any licensing, receivership or change-of-ownership proceedings.
In the case of our leased properties, following expiration of a lease term, or if we exercise our right to replace a tenant in default, rental payments on the related properties could decline or cease altogether while we attempt to reposition the properties with a suitable replacement tenant or for an alternative use. This risk could be exacerbated by laws and regulations in certain jurisdictions that limit our ability to take remedial action against defaulted tenants under certain circumstances. Market conditions in effect at the time of the expiration or default of a lease may require us to reduce our rental rates below those we currently charge to retain tenants or obtain new suitable replacement tenants. Our ability to locate and attract suitable replacement tenants could be impaired by the specialized healthcare use or contractual restrictions on use of the property, and we may be forced to spend substantial amounts to adapt the properties to other uses.
If our managers’, tenants’ or borrowers’ financial condition or business prospects deteriorate, our business, financial condition and results of operations could be adversely affected.
We rely heavily on our managers, tenants and borrowers and their ability to perform their obligations to us, regardless of whether our relationship is structured as a lease, as a management contract or as a loan. Any of our managers, tenants or borrowers may experience a weakening in their overall financial or operating condition, including as a result of deteriorating operating performance, changes in industry or market conditions, such as supply-demand dynamics, rising or elevated labor costs, interest rates or inflation, or other factors. If their financial condition deteriorates, they may be unable or unwilling to make payments or perform their obligations to us in a timely manner, if at all. Although we may have the right under specified circumstances to terminate a lease, evict a tenant, terminate our management agreements, demand immediate repayment of outstanding loan amounts or pursue other remedies, we may not be able to enforce these rights, or we may determine it is not prudent to do so if we believe that enforcement of our rights would be more detrimental to our business than seeking alternative approaches.
In some cases, our managers, tenants and borrowers rely on reimbursements from governmental programs for a portion of their revenues. Changes in reimbursement policies and other governmental regulation resulting from actions by the U.S. Congress, U.S. executive orders or other governmental or regulatory agencies may result in reductions in our managers’, tenants’ or borrowers’ revenues, operations and cash flows and affect our managers’, tenants’ or borrowers’ ability to meet their obligations to us. Failure to comply with reimbursement regulations or other laws applicable to healthcare providers could result in penalties, fines, litigation costs, lost revenue or other consequences, which could adversely impact our tenants’ ability to make contractual rent payments to us or adversely impact our cash flows from operations under a management arrangement. Our managers, tenants and borrowers who operate senior housing communities often depend on private pay sources consisting of the income or assets of residents or their family members to pay fees. Costs associated with independent and assisted living services generally are not reimbursable under government reimbursement programs, such as Medicare and Medicaid.
Our managers, tenants and borrowers depend on their ability to attract seniors, patients and other users of their services to their businesses, which may be affected by many factors, including, among other factors: (i) prevailing economic conditions and market trends, including market volatility, inflation and the strength of the economy generally and the housing market in particular; (ii) the ability to pay for such services, either through private resources or government reimbursement programs; (iii) consumer confidence; (iv) demographics; (v) property conditions; (vi) clinical conditions and safety, including as a result of a severe cold and flu season, an epidemic or any other widespread illness, such as that seen throughout the COVID-19 pandemic; (vi) public perception about such healthcare services; and (vii) social and environmental factors.
If our managers, tenants or borrowers fail to effectively conduct their operations, or to maintain and improve our properties on our behalf, it could adversely affect (i) their ability to attract and retain patients and residents in our properties, which could have an adverse effect on our and our managers’, tenants’ or borrowers’ business, financial condition or results of operations and (ii) our business reputation as the owner of the properties and the business reputation of our managers, tenants or borrowers. Further, if a manager, tenant or borrower defaults or fails to pay its outstanding obligations at a time when terminating our agreement with, or replacing, such manager, tenant or borrower may be extremely difficult or impossible, we may elect instead to amend such agreement, which may be on terms that are less favorable to us than the original agreements and may have a material adverse effect on our results of operations and financial condition.
We face potential adverse consequences from the bankruptcy, insolvency or financial deterioration of our managers, tenants, borrowers and other obligors.
We lease a significant number of our properties to tenants, operate a significant number of our properties through third-party managers and provide financing to third-party borrowers. We have limited control over the success or failure of our managers’, tenants’ and borrowers’ businesses, and, at any time, a manager, tenant or borrower may experience a downturn in
its business that weakens its financial condition. If that happens, the manager, tenant or borrower may fail to make payments or meet its other obligations to us, which could have an adverse impact on our results of operations and financial condition.
A downturn in any one of our managers’, tenants’ or borrowers’ businesses could ultimately lead to its bankruptcy if it is unable to timely resolve the underlying causes, which may be largely outside of its control. Bankruptcy and insolvency laws afford certain rights to a party that has filed for bankruptcy or reorganization that may render certain of our rights and remedies unenforceable or delay our ability to pursue such rights and remedies and realize any recoveries. For example, we cannot evict a tenant solely because it has filed a bankruptcy petition. A debtor-lessee may reject our lease in a bankruptcy proceeding, and any claim we have for unpaid rent might not be paid in full. We may be unable to exercise available termination rights under our management contracts during the pendency of any bankruptcy petition. We also may be required to fund certain expenses and obligations (such as real estate taxes, debt costs and maintenance expenses) to preserve the value of our properties, avoid the imposition of liens on our properties or transition our properties to a new manager or tenant.
Bankruptcy or insolvency proceedings may result in increased costs and require significant management attention and resources. If we are unable to transition affected properties efficiently and effectively, such properties could experience prolonged operational disruption, leading to lower occupancy rates and further depressed revenues. Publicity about a manager’s, tenant’s or borrower’s financial condition and insolvency proceedings may negatively impact its reputation, which could result in decreased customer demand and revenues. Any or all of these risks could adversely affect our business, financial condition and results of operations. These risks would be magnified where we lease multiple properties to a single third party, as a failure or default would expose us to these risks across multiple properties.
See also “—If a borrower defaults, we may be unable to obtain payment, successfully foreclose on collateral or realize the value of any collateral, which could adversely affect our ability to recover our investment” below.
The hospitals on or near the campuses where our outpatient medical buildings are located and their affiliated health systems may not remain competitive or financially viable.
Our outpatient medical buildings and other properties that serve the healthcare industry depend on the competitiveness and financial viability of the hospitals on or near the campuses where our properties are located or that our properties are otherwise affiliated with, and their ability to attract physicians and other healthcare-related clients to our properties. The viability of these hospitals, in turn, depends on a solid quality and mix of healthcare services provided, successful competition for patients, physicians and physician groups, positive demographic trends in the surrounding community, positive macroeconomic conditions, superior market position and growth potential as well as the ability of the affiliated health systems to provide economies of scale and access to capital. If a hospital on or near the campus where one of our properties is located fails or becomes unable to meet its financial obligations, and if an affiliated health system is unable to support that hospital, that hospital may be unable to compete successfully. That could adversely impact the hospital’s ability to attract physicians and other healthcare-related clients, and, in some cases, the hospital might even close or relocate. We rely on proximity to and affiliations with hospitals to create leasing demand in our outpatient medical buildings and similar properties. If a hospital moves, closes, doesn’t remain competitive or financially viable or can’t attract physicians and physician groups, our properties and our business, financial condition and results of operations could be adversely affected.
Our research tenants face unique levels of expense and uncertainty.
Our research tenants develop and sell products and services in an industry that is characterized by rapid and significant changes, evolving industry standards, significant research and development risk, in some cases, and uncertainty over the implementation of new healthcare reform or medical device legislation. These tenants, particularly those involved in developing and marketing pharmaceutical or other life science products, require significant outlays of funds for the research and development, clinical testing, manufacture and commercialization of their products and technologies, as well as to fund their other obligations, including rent payments to us. Our tenants’ ability to raise capital depends on the timely success of their research and development activities, viability of their products and technologies, their financial and operating condition and outlook and the overall financial, economic and legal and regulatory environment. If private investors, the federal government, universities, public markets or other sources of funding are unwilling or unable to fund these tenants because of general economic conditions, adverse market conditions or otherwise, a tenant may not be able to pay rent or meet its other obligations to us and its business may fail. The financing market and availability of government funding for research companies has been and may continue to be volatile, which may contribute to these risks. See “—Changes in the U.S. political and regulatory environment could affect availability of government funding that we or our managers, tenants or borrowers rely on, which could negatively impact our business.”
The research and development, clinical testing, manufacture and marketing of some of our tenants’ products require federal, state and foreign regulatory approvals. The approval process is typically long, expensive and uncertain. Even if our tenants have sufficient funds to seek approvals, one or all of their products may fail to obtain the required regulatory approvals on a timely basis or at all. Our tenants may only have a small number of products under development. If one product fails to receive the required approvals at any stage of development, it could significantly and adversely affect the tenant’s entire business. Our tenants may be unable to manufacture their products successfully or economically, may be unable to adapt to rapid technological advances in their industry, may be unable to adequately obtain, maintain, enforce, defend, protect or commercialize their intellectual property, may face competition from new products or may not receive acceptance of their products. If our research tenants’ business deteriorates for these or any other reasons, they may be unable to make payments or meet their other obligations to us.
We cannot assure you that any of our research tenants will be successful in their businesses. Any tenant that is unable to avoid, or sufficiently mitigate, the risks described above may have difficulty making payments or satisfying its other obligations to us, which in turn could adversely affect our business, financial condition and results of operations. See also “—If we need to replace any of our managers or tenants, we may be unable to do so on as favorable terms, if at all, and we could be subject to delays, limitations and expenses, which could adversely affect our business, financial condition and results of operations.”
If a borrower defaults, we may be unable to obtain payment, successfully foreclose on collateral or realize the value of any collateral, which could adversely affect our ability to recover our investment.
If a borrower defaults under a mortgage or other loan for which we are the lender, we may attempt to obtain payment in full or foreclose on the collateral securing the loan, including by acquiring any pledged equity interests or acquiring title to the subject properties, to protect our investment. The defaulting borrower may not be able to repay us even if we are legally entitled to full repayment of the debt. The defaulting borrower may contest our enforcement of foreclosure or other available remedies, seek bankruptcy protection against our exercise of enforcement or other available remedies or bring claims against us for lender liability. Any such delay or limit on our ability to pursue our rights or remedies could adversely affect our business, financial condition and results of operations. See “—We face potential adverse consequences from the bankruptcy, insolvency or financial deterioration of our managers, tenants, borrowers and other obligors.”
Although our loan agreements give us the right to exercise, under certain circumstances, certain remedies in the event of a default on the obligations owing to us, we may decide not to exercise those remedies for one or more reasons. For example, we may not exercise remedies (or be successful in exercising remedies) if the terms are not enforceable, if the terms are too costly to enforce or if we believe that enforcement of our rights would be more detrimental to our business than seeking alternative approaches. We may also decide not to enforce other contractual protections, such as annual rent escalators, or the properties may not generate sufficient revenue to achieve the specified rent escalation parameters.
Even if we successfully foreclose on any collateral securing our mortgages and other loans, costs related to enforcement of our remedies, high loan-to-value ratios or declines in the value of the collateral could prevent us from realizing the full amount of our investment and we could be required to record a reserve or valuation allowance with respect to such loans. The collateral securing our mortgages and other loans may include equity interests in an entity with unexpected liabilities that limits the value of those equity interests, or the equity interests may be subject to securities law restrictions that limit our ability to sell those interests in a timely manner, if at all. The mortgages and other loans we hold may have other limiting characteristics that result in us not having full recourse to the collateral securing those obligations or may limit our flexibility if we foreclose on the collateral. In connection with any foreclosure on any loan, we may be required to assume, replace or otherwise incur indebtedness, which may have an adverse effect on our financial condition. We may be unable to reposition any real property included in acquired collateral on a timely basis, if at all, or without making significant improvements or repairs. Any delay or costs incurred in selling or repositioning acquired collateral could adversely affect our ability to recover the full amount of our investment.
Our ongoing strategy depends, in part, upon identifying and consummating future acquisitions and investments and effectively managing our expansion opportunities.
Our ongoing strategy depends, in part, upon identifying and consummating future acquisitions and investments and effectively managing our expansion opportunities. Our ability to execute this strategy successfully is affected by many factors, including the significant competition we face for acquisition, investment, development and redevelopment opportunities, the availability of suitable opportunities, our relationships with current and prospective clients and partners, our ability to obtain debt and equity capital at costs comparable to or better than our competitors and lower than the yield we earn on our acquisitions or investments and our ability to negotiate favorable terms with counterparties, including buyers and sellers of
assets. We compete for these opportunities with a broad variety of potential investors, including other healthcare REITs, real estate partnerships, healthcare providers, healthcare lenders and other investors, including developers, banks, insurance companies, pension funds, government-sponsored entities and private equity firms, some of whom may have advantages compared to us, including greater financial resources and lower costs of capital. See “Business—Competition” included in Part I, Item 1 of this Annual Report. If we are unsuccessful at identifying and capitalizing on investment, acquisition, development and redevelopment opportunities and otherwise expanding and diversifying our portfolio, our growth and profitability may be adversely affected.
When expanding into areas that are new to us, we face numerous risks and uncertainties, including risks associated with (i) the required investment of capital and other resources; (ii) the possibility that we have insufficient expertise to engage in such activities profitably or without incurring inappropriate amounts of risk; (iii) the diversion of management’s attention from our other businesses; (iv) the increasing demands on or issues related to operational and management systems and controls; (v) compliance with additional legal or regulatory requirements with which we are not familiar; and (vi) the broadening of our geographic footprint, including the risks associated with conducting operations in non-U.S. jurisdictions. Any new strategies, markets or businesses that we enter into may not be successful or meet our expectations, or we may be unable to effectively monitor or manage our portfolio of properties as it expands. Failure to meet any of these objectives could adversely affect our business, financial condition and results of operations.
Our investments in and acquisitions of properties may be unsuccessful or fail to meet our expectations.
We have made and expect to continue to make significant acquisitions and investments as part of our overall business strategy. Investing in and acquiring healthcare real estate entails risks associated with real estate investments generally, including the risk that the investment will not achieve expected returns, that the cost estimates for necessary property improvements will prove inaccurate or that a manager, tenant or borrower will fail to meet performance expectations or their obligations to us. We also make acquisitions and investments outside the United States, which raises legal, economic and market risks associated with doing business in foreign countries, such as currency exchange fluctuations and foreign tax risks.
Our real estate development and redevelopment projects present additional risks, including the risk of construction delays or cost overruns that increase expenses, the inability to obtain required zoning, occupancy and other governmental approvals and permits on a timely basis and the incurrence of significant costs prior to completion of the project. Healthcare real estate properties are often highly customized, and the development or redevelopment of such properties may require costly tenant-specific or market-driven improvements.
Other risks that our significant acquisition and investment activity, including our developments and redevelopments, presents include that:
•We may be unable to successfully integrate the operations, personnel or systems of acquired companies, maintain consistent standards, controls, policies and procedures, retain key personnel or companies we acquire or realize the anticipated benefits of acquisitions and other investments within the anticipated time frame if at all;
•Our underwriting assumptions, including projections of estimated future revenues and expenses and anticipated synergies and other costs savings, and other financial and operating metrics that we develop may be inaccurate, in which case we may not be able to realize the expected benefits of the acquisition, investment, development or redevelopment;
•Our leverage could increase or our per share financial results could decline if we incur additional debt or issue equity securities to finance acquisitions and investments;
•Acquisitions and investments could divert management’s attention from our existing assets;
•The value of the assets we acquire or invest in may decline or we may not realize the expected return on the developments or redevelopments we undertake; and
•If our acquisitions, investments, developments and redevelopments are not successful, the market price of our common stock may decline.
See also “—Our ongoing strategy depends, in part, upon identifying and consummating future acquisitions and investments and effectively managing our expansion opportunities.”
We cannot assure you that our acquisitions, investments, developments and redevelopments will be successful or meet our expectations, which could adversely affect our business, financial condition and results of operations.
Our investments in co-investment vehicles, joint ventures and minority interests may subject us to risks and liabilities that we would not otherwise face.
We have and may continue to develop and acquire properties in co-investment vehicles or joint ventures with other persons or entities when circumstances warrant the use of these structures. In 2020, we formed Ventas Investment Management (“VIM”) to combine our private capital management capabilities for certain assets under a single platform. We also own minority investments in properties and unconsolidated operating entities. These minority investments usually entitle us to typical rights and protections but inherently involve a lesser degree of control over business operations than if we owned a majority interest. In the future, we may enter into additional co-investments, partnerships and joint ventures, either through VIM or otherwise.
There can be no assurance that our co-investments, joint ventures, minority or other investments, which we refer to collectively below as investments and ventures, will be successful or meet our expectations. These investments and ventures involve significant risk, including, among others, the following:
•We may be unable to take actions that are opposed by our partners under arrangements that require us to share decision-making authority;
•For investments and ventures in which we have a noncontrolling interest, our partners may take actions that we oppose;
•If our partners become bankrupt, insolvent or otherwise fail to fund their share of required capital contributions or fulfill other partner obligations, we may choose to or be required to contribute that capital;
•Our partners may seek to redeem their investment, and may do so simultaneously, causing the venture to seek capital to satisfy these requests on less than optimal terms;
•Some of our investments and ventures may incur indebtedness; in some cases, we may guarantee the payment of such indebtedness, in whole or in part; depending on credit market conditions, the refinancing or payoff of such indebtedness may require equity capital calls, which we or our partners may not be capable of funding or which may be required at inopportune times;
•We may be subject to restrictions on our ability to transfer our interest in the investment or venture, which may require us to retain our interest at a time when we would otherwise prefer to sell it;
•Our partners may have business interests or goals that conflict with our business interests and goals, including the timing, terms and strategies for any investments, and what levels of financing to incur or carry;
•Our partners may be structured differently than us for tax purposes and this could create conflicts of interest, including with respect to our compliance with the REIT requirements, and our REIT status could be jeopardized if any of our joint ventures do not operate in compliance with REIT requirements;
•Our investments or ventures or our partners may be unable to meet their financial or other obligations to us or to the investment or venture, including any obligation to provide equity to the investment or venture or indemnify us or the investment or venture for losses;
•Our partners may have competing interests in our markets that could create conflicts of interest;
•We could experience an impasse on certain decisions where we do not have sole decision-making authority, which could require us to expend additional resources on resolving such impasses or potential disputes;
•We could become engaged in a dispute with any of our partners that could lead to the sale of either parties’ ownership interest or the underlying assets;
•Disagreements with our partners could result in litigation or arbitration; and
•We may suffer other losses as a result of actions taken by our partners.
In some instances, our partners may have the right to cause us to sell our interest, or acquire our partner’s interest, at a time when we otherwise would not have initiated such a transaction. Our ability to acquire our partner’s interest will be limited if we do not have sufficient cash, available borrowing capacity or other capital resources. This may require us to sell our interest in the investment or venture when we would otherwise prefer to retain it.
In certain circumstances, Ventas serves as managing member, general partner or controlling party with respect to investments and ventures, including within our VIM platform. In such instances, we may face additional risks including, among others, the following:
•Ventas may have increased duties to the other investors or partners in the investment or venture;
•In the event of certain events or conflicts, our partners may have recourse against Ventas, including the right to monetary penalties, the ability to force a sale or exit the investment or venture;
•Our partners may have the right to remove us as the general partner or managing member in certain cases involving cause; and
•Our subsidiaries that would be the general partner or managing member of the investment or venture could be generally liable, under applicable law or the governing agreement of a venture, for the debts and obligations of the investment or venture, subject to certain exculpation and indemnification rights pursuant to the terms of the governing agreement.
Increased construction and development in the markets in which our properties are located could adversely affect our future occupancy rates, operating margins and profitability.
If existing supply and development collectively outpaces demand in the markets in which our properties are located, those markets may become saturated and we could experience decreased occupancy, reduced operating margins and lower profitability, which could adversely affect our business, financial condition and results of operations. Depending on the jurisdiction, there are limited barriers to developing properties in our asset classes, particularly senior housing. As a result, supply and demand dynamics can change quickly. We may be unable to rebalance our portfolio in a timely manner in order to respond to changes in those dynamics.
Merger, acquisition and investment activity in our industries resulting in a change of control of, or a competitor’s investment in, one or more of our managers, tenants or borrowers could adversely affect our business, financial condition and results of operations.
The senior housing and healthcare industries have experienced and may continue to experience consolidation, including among owners of real estate, managers, tenants borrowers and care providers. When a change of control of a managers, tenant or borrower occurs, that manager’s, tenant’s or borrower’s strategy, financial condition, management team or real estate needs may change, any of which could adversely affect our relationship with that party and our revenues and results of operations. If any of our managers or tenants merge with one another, our dependence on a small group of significant third parties would increase, as would our exposure to the risks described above under “—Our investments in and acquisitions of properties may be unsuccessful or fail to meet our expectations.” A competitor’s investment in one of our managers, tenants or borrowers could enable our competitor to directly or indirectly influence that manager’s, tenant’s or borrower’s business and strategy in a manner that impairs our relationship with the manager, tenant or borrower or is otherwise adverse to our interests. Depending on our contractual agreements and the specific facts and circumstances, we may not have the right to prevent a competitor’s investment in, a change of control of, or other transactions impacting a manager, tenant or borrower.
Development, redevelopment and construction risks could affect our profitability.
We invest in various development and redevelopment projects. In deciding whether to make an investment in a project, we make certain underwriting assumptions regarding expected future performance. Our assumptions are subject to risks generally associated with development and redevelopment projects, including, among others, that:
•Tenants may not lease the amount of space projected or at the projected rental rate levels or lease on the projected schedule, including due to increased competition in the market and other market and economic conditions;
•Our underwriting assumptions and other financial and operating metrics that we develop, such as the estimated costs necessary to develop or redevelop the property, may be inaccurate, in which case we may not be able to realize the expected benefits of the project;
•We may not complete the project on schedule or within budgeted amounts;
•We may not be able to recognize rental revenue even though cash rent is being paid and the lease has commenced;
•We may encounter delays in obtaining or we may fail to obtain necessary zoning, land use, building, occupancy, environmental and other governmental permits and authorizations;
•We may be unable to obtain financing for the project on favorable terms or at all, including at the maturity of an applicable construction loan;
•Construction or other delays may provide tenants or residents the right to terminate preconstruction leases or cause us to incur additional costs, including through rent abatement;
•Volatility in the price of construction materials or labor may increase our project costs;
•Any partners in the project may maintain significant decision-making authority with respect to the project, which lessens our control and could lead to increased costs, project delays or disputes;
•Our builders or development managers may fail to meet their obligations to us or satisfy the expectations of our tenants and partners; and
•We may incorrectly forecast risks associated with development in new geographic regions or addressing markets that are new to us, including new markets where we may not have sufficient depth of market knowledge.
We may face increased risks and costs associated with volatility in materials and labor prices or as a result of supply chain or procurement disruptions, which may adversely affect the status of our construction projects.
The price of materials and labor for our construction projects may increase due to external factors, including but not limited to performance of third-party suppliers and contractors, overall market supply and demand, elevated or increasing interest rates, government regulation and policies, including actions taken by the Federal Reserve, and changes in general business, economic or political conditions. As a result, the costs of construction materials and skilled labor required for the completion of our development and redevelopment projects may fluctuate significantly over time.
We rely on a number of third-party suppliers and contractors to supply materials and labor for our construction projects. We may experience difficulties obtaining necessary materials from suppliers or vendors whose supply chains might be disrupted by macroeconomic conditions or otherwise, or difficulties obtaining adequate labor from third-party contractors . If we are unable to access materials and labor to complete our construction projects within our expected budgets and meet our or our development partners’ and tenants’ demands and expectations in a timely and efficient manner, our results of operations may be adversely impacted. We may be unable to complete our development or redevelopment projects timely or within our budget, which may affect our ability to lease space to potential tenants and adversely affect our business, financial condition and results of operations.
If any of the risks described above occur, our development and redevelopment projects may not yield anticipated returns, which could adversely affect our business, financial condition and results of operations.
Our success depends, in part, on our ability to attract and retain talented employees. The loss of any one of our key personnel or the inability to maintain appropriate staffing could adversely impact our business.
The success of our business depends, in part, on the leadership and performance of our executive management team and key employees and the ability to maintain appropriate staffing levels across our organization. Failure to attract, retain and motivate highly qualified employees, or failure to develop, implement and maintain viable succession plans, could result in loss of institutional knowledge and important skill sets negatively impact our culture, significantly impacting our performance and adversely affecting our business.
Competition for talented employees is intense, and we cannot assure you that we will retain our employees or that we will be able to attract and retain other highly qualified individuals in the future. If our long-term compensation and retention plans and succession plans are not effective, if we lose any one or more of our key officers and employees or are unable to maintain appropriate staffing or operate below capacity – causing us to forego potential revenue and growth opportunities and affecting our ability to effectively manage risk – our business could be adversely affected.
We may be required to recognize reserves, allowances, credit losses or impairment charges.
Declines in the value of our properties or other assets or loan collateral, financial deterioration of our borrowers or other obligors or other factors may result in the recognition of reserves, allowances, credit losses or impairment charges. Our determination of such reserves, allowances or credit losses relies on estimates regarding the fair value of any loan collateral, which is a complex and subjective process. In addition, we evaluate our assets for impairments based on various triggers, including market conditions, our current intentions with respect to holding or disposing of the assets and the expected future undiscounted cash flows from the assets. Impairments, reserves, allowances and credit losses are based on estimates and assumptions that are inherently uncertain, may increase or decrease in the future and may not represent or reflect the ultimate value of, or loss that we ultimately realize with respect to, the relevant assets. Any such impairment, reserve, allowance or credit loss, or any change in any of the foregoing, could have an adverse impact on our results of operations and financial condition.
See also “—If a borrower defaults, we may be unable to obtain payment, successfully foreclose on collateral or realize the value of any collateral, which could adversely affect our ability to recover our investment” and “—We face potential adverse consequences from the bankruptcy, insolvency or financial deterioration of our managers, tenants, borrowers and other obligors.”
We own properties that are subject to ground lease, air rights or other restrictive agreements that limit our uses of the properties, restrict our ability to sell or otherwise transfer the properties and expose us to loss of the properties if such agreements are breached by us or terminated.
Our investments in outpatient medical buildings and research buildings and facilities as well as other properties may be made through leasehold interests in the land on which the buildings are located, leases of air rights for the space above the land on which the buildings are located, or other similar restrictive arrangements. Many of these ground lease, air rights and other restrictive agreements impose significant limitations on our uses of the subject properties, restrict our ability to sell or otherwise transfer our interests in the properties or restrict the leasing of the properties. These restrictions may limit our ability to timely sell or exchange the properties, impair the properties’ value or negatively impact our ability to find suitable tenants for the properties. We could lose our interests in the subject properties if the ground lease, air rights or other restrictive agreements are breached by us, are terminated or expire. In addition, we could be forced to renegotiate such ground leases upon their expiration on terms that are unfavorable to us.
Purchase options, rights of first offer or rights of first refusal in favor of third parties could negatively affect us or discourage prospective buyers from negotiating with us with respect to the sale of our properties.
Some of our properties are subject to purchase options, rights of first offer, rights of first refusal or similar rights in favor of third parties. Purchase options for our properties may give a third party the right to purchase the property at fair market value, at a price set based on our investment in the property, or at fixed prices as of certain dates. The proceeds we receive as a result of the exercise of a purchase option may be less than the price we paid for the property, and we may not be able to re-invest the proceeds on favorable terms or at all. In addition, purchase options could force us to sell a property when we would otherwise prefer to hold such property. Purchase options, rights of first offer or rights of first refusal that encumber our properties could discourage prospective buyers from negotiating with us and may prevent us from receiving the maximum price that we may otherwise have obtained.
Damage from catastrophic or extreme weather and other natural events and the physical effects of climate change could result in losses to the Company.
Some of our properties are in areas particularly susceptible to revenue loss, cost increase or damage caused by catastrophic or extreme weather and other natural events, including fires, snow, rain or ice storms, windstorms, tornadoes, hurricanes, earthquakes, flooding and other severe weather. These adverse weather and natural events could cause substantial damages or losses to our properties that could exceed our or our managers’, tenants’ or borrowers’ property insurance coverage.
Any of these events could cause a major power outage, leading to a disruption of our systems and operations. If we incur a loss greater than insured limits, or if for any reason insurance coverage is unavailable, we could lose our capital invested in the affected property, as well as anticipated future revenue from that property. Any such loss could materially and adversely affect our business, financial condition and results of operations. Climate change may increase the cost of property insurance on terms we find acceptable or make such insurance unavailable.
If significant changes in the climate occur in areas where our properties are located, we may experience extreme weather and changes in precipitation and temperature, all of which may result in physical damage to or a decrease in demand for properties located in these areas or affected by these conditions. Where climate change has a significant or sustained impact, our properties could be destroyed and our business, financial condition or results of operations may be adversely affected.
Changes in federal, state or foreign legislation and regulation on climate change could result in increased capital expenditures to improve the energy efficiency of our existing properties and could also require us to spend more on our new development properties without a corresponding increase in revenue.
Cybersecurity threats and incidents could disrupt our operations or the operations of the third parties with whom we do business, invest in or lend to, result in the loss of or unauthorized access to confidential or personal information or damage our or their business relationships and reputation.
Cybersecurity threats and incidents have been occurring globally at a more frequent and advanced level and will likely continue to increase in frequency and severity in the future. Our business and the businesses of our managers, tenants, borrowers, investments in unconsolidated entities, vendors, suppliers, service providers and other third parties with whom we do business rely on technology and are consequently subject to risk from cybersecurity threats and incidents, including attempts to gain unauthorized access to systems and networks, to disrupt operations, corrupt data or steal confidential or personal information and other cybersecurity breaches. Such attempts can originate from a wide variety of sources, including organized crime, hackers, activists, insider threats, terrorists, nation-states, state-sponsored actors and others, any of which may see their effectiveness enhanced by the use of artificial intelligence.
While we have implemented measures designed to help mitigate these threats for our business, these measures cannot guarantee that we will be successful in preventing a cybersecurity incident. Our information technology systems and networks are essential to our ability to perform day-to-day operations of our business, and a cybersecurity threat or incident could result in a data center outage, disrupt our systems and operations, compromise the confidential or personal information of our employees, partners or the residents in our senior housing communities and damage our business relationships and reputation. Although we have implemented various measures designed to manage risks to our information technology systems and networks relating to these types of events, these measures could prove to be inadequate. If our information technology systems or networks are compromised, they could become inoperable for extended periods of time, cease to function properly or fail to adequately secure confidential and personal information, which could have an adverse impact on our ability to operate our business.
Cybersecurity threats and incidents, such as those involving software bugs, server malfunctions, software or hardware failure, telecommunications failures, error or misconduct, ransomware, covertly introduced malware, denial-of-service attacks, impersonation of authorized users or other social engineering schemes (including phishing attacks), industrial or other espionage and other cybersecurity breaches may not be identified even with sophisticated prevention and detection systems, potentially resulting in further harm and preventing them from being addressed appropriately. The failure of our systems or of our disaster recovery plans for any reason could cause significant interruptions in our operations and result in a failure to maintain the security, confidentiality or privacy of sensitive data, including personal information, material nonpublic information and intellectual property and trade secrets and other confidential or sensitive information we possess.
We do not control the information technology systems and network or cybersecurity measures put in place by our managers, tenants, borrowers, investments in unconsolidated entities, vendors, suppliers, service providers or other third parties with whom we do business, all of whom are subject to risks associated with cybersecurity threats and incidents. If those parties are unable to adequately manage those risks, their results of operations, financial condition and the viability of their business could be adversely affected, which could in turn have an adverse impact on us and our business. Any contractual protections with such third parties, such as indemnification obligations to us, if any at all, may be ineffective or otherwise inadequate.
In the event of a cybersecurity threat or incident involving us or our managers, tenants, borrowers, investments in unconsolidated entities, vendors, suppliers, service providers or other third parties with whom we do business, we and they may be required to make a significant investment to attempt to mitigate or remediate the effects of any cybersecurity threats incidents, and such efforts may not be successful. We and they may be subject to legal claims and regulatory or enforcement actions and may experience harm to our reputations and adverse publicity or suffer other adverse consequences. Further, we and they may not have adequate or any insurance coverage to cover any costs, expenses or other losses arising from any of the foregoing. In addition, we cannot be sure such insurance coverage will continue to be available on acceptable terms or at all, or that the applicable insurers will not deny coverage as to any future claim.
Damage to our reputation could adversely affect our business, financial condition or result of operations.
Our positive reputation for quality and service with our key stakeholders, including our managers, tenants development partners, lenders and stockholders, could be damaged. Such damage to our reputation could result if, for example, we experience a sustained period of distress, either as a result of general market conditions or otherwise, where our properties underperform, our managers or tenants default or in other instances that result in misalignment with those parties. Damage to our reputation could result in a decrease in the market price of our common stock or make it more difficult to maintain or expand our business relationships, which could adversely affect our business, financial condition and results of operations.
Activist investors could cause us to incur substantial costs, divert management’s attention and have an adverse effect on our business.
Activist investors have engaged, and may in the future engage, in proxy solicitations, advance shareholder proposals or otherwise attempt to affect changes or acquire control over us. Responding to these actions can be costly and time-consuming, divert the attention of our Board and management from the management of our business and the pursuit of our business strategies. In addition to incurred costs, perceived uncertainties as to our future direction may result in the loss of potential business opportunities, damage to our reputation and may make it more difficult to attract and retain qualified directors, personnel and business partners. These actions could also cause our stock price to experience periods of volatility.
Our Capital Structure Risks
Market conditions and the actual and perceived state of the capital markets generally could negatively impact our business, financial condition and results of operations.
We are dependent on the capital markets and any disruption to the capital markets or our ability to access such markets could impair our ability to fulfill our dividend requirements, make payments to our security holders or otherwise finance our business operations. Adverse developments affecting economies throughout the world, including elevated or rising inflation, a general tightening of availability of credit (including the price, terms and conditions under which it can be obtained), the state of the public and private capital markets, decreased liquidity in certain financial markets, elevated or increased interest rates, foreign exchange fluctuations, low or declining consumer confidence, the actual or perceived state of the real estate market, tightened labor markets or significant declines in stock markets, as well as concerns regarding pandemics, epidemics and the spread of contagious diseases, could impact our business, financial condition and results of operations. For example, unfavorable changes in general economic conditions, including recessions, economic slowdowns, high unemployment and rising prices or the perception by consumers of weak or weakening economic conditions may reduce disposable income and impact consumer spending in healthcare or senior housing, which could adversely affect our financial results.
During inflationary periods, interest rates have historically increased, which would have, and in recent periods has had, a direct effect on the interest expense and overall cost of our borrowings. The U.S. Federal Reserve may raise the federal funds rate, may maintain an elevated federal funds rate for longer than the market expects, or may not lower the federal funds rate consistent with market expectations. Any of these actions or failure to take action could result in higher than expected interest rates in the credit markets and the possibility of lower asset values, slowing economic growth or a recession. We are exposed to increases in or elevated interest rates in the short term through our variable-rate borrowings, which consist of borrowings under our unsecured credit facility, our unsecured term loans, our commercial paper program and certain other credit facilities. Therefore, interest rate increases or sustained elevated interest rates, due to inflation or otherwise, have in recent periods increased and may continue to increase our interest expense under these variable-rate facilities in the short term and increase our financing costs as we refinance our existing variable-rate and fixed-rate long-term borrowings, or incur additional interest expense related to the issuance of incremental debt in the long term.
To the extent there is turmoil in the global financial markets, this turmoil has the potential to adversely affect (i) the value of our properties; (ii) the availability or the terms of financing that we have or may be able to obtain; (iii) our ability to
make principal and interest payments on, or refinance when due, any outstanding indebtedness; (iv) our ability to pay a dividend; and (v) the ability of our managers, tenants and borrowers to satisfy their obligations to us. Disruptions in the capital and credit markets may also adversely affect the market price of our securities.
We are exposed to increases in interest rates, which could reduce our profitability and adversely impact our ability to refinance existing debt, sell assets or engage in acquisition, investment, development and redevelopment activity, and our decision to hedge against interest rate risk might not be effective.
Increases in or elevated interest rates may result in a decrease in the value of our real estate, a decrease in the market price of our common stock and a decrease in our cash flows and net income. Increases in or elevated interest rates may also adversely affect the securities markets generally, which could reduce the market price of our common stock without regard to our operating performance. Any such unfavorable changes to our borrowing costs and price of our common stock could significantly impact our ability to raise new debt and equity capital going forward and increase the cost of financing on our acquisition, investment, development and redevelopment activity. An increase in or elevated interest rates also could limit our ability to refinance existing debt upon maturity or cause us to pay higher rates upon refinancing, as well as decrease the amount that third parties are willing to pay for our assets, thereby limiting our ability to promptly reposition our portfolio in response to changes in economic or other conditions.
We receive a significant portion of our revenues by leasing assets under long-term triple-net leases that generally provide for fixed rental rates subject to annual escalations, while certain of our debt obligations are variable rate obligations with interest and related payments that vary with the movement of the Secured Overnight Financing Rate (“SOFR”), Bankers’ Acceptance or other indexes. The generally fixed rate nature of a significant portion of our revenues and the variable rate nature of certain of our debt obligations create interest rate risk. If interest rates continue to rise or remain elevated, the costs of our existing variable rate debt would increase or remain elevated and any new debt that we incur could increase. These increased costs could reduce our profitability, impair our ability to meet our debt obligations, or increase the cost of financing our acquisition, investment, development and redevelopment activity.
We may seek to manage our exposure to interest rate volatility with hedging arrangements that involve additional risks, including the risks that counterparties may fail to honor their obligations under these arrangements, that these arrangements may not be effective in reducing our exposure to interest rate changes, that the amount of income we earn from hedging transactions may be limited by federal tax provisions governing REITs, and that these arrangements may cause us to pay higher interest rates on our debt obligations than otherwise would be the case. Moreover, no amount of hedging activity can fully insulate us from the risks associated with changes in interest rates. Failure to hedge effectively against interest rate risk, if we choose to engage in such activities, could adversely affect our business, financial condition and results of operations.
We have a significant amount of outstanding indebtedness and may incur additional indebtedness in the future.
As of December 31, 2024, we had approximately $13.6 billion of outstanding principal indebtedness. The instruments governing our existing indebtedness permit us to incur substantial additional debt, including secured debt, and we may satisfy our capital and liquidity needs through additional borrowings. Our indebtedness requires us to dedicate a significant portion of our cash flow from operations to the payment of debt service, thereby reducing the funds available to implement our business strategy and make distributions to stockholders. A high level of indebtedness on an absolute basis or as a ratio to our cash flow could also have the following consequences:
•Potential limits on our ability to adjust rapidly to changing market conditions and vulnerability in the event of a downturn in general economic conditions or in the real estate or healthcare industries;
•Potential impairment of our ability to obtain additional financing to execute on our business strategy; and
•Potential downgrade in the rating of our debt securities by one or more rating agencies, which could have the effect of, among other things, limiting our access to capital and increasing our cost of borrowing.
We mortgage, and expect to continue to mortgage, certain of our properties to secure payment of indebtedness. If we are unable to meet our mortgage payments, then the encumbered properties could be foreclosed upon or transferred to the mortgagee with a resulting loss of income and asset value.
Limitations on our ability to access the capital markets could have an adverse effect on us, including our ability to make required payments on our debt obligations, make distributions to our stockholders or make future investments necessary to implement our business strategy.
We are highly dependent on access to the debt and equity capital markets. We cannot assure you that we will be able to raise the capital necessary to meet our debt service obligations, make distributions to our stockholders or make future investments necessary to implement our business strategy if our cash flow from operations is insufficient to satisfy these needs. We cannot assure you that conditions in the capital markets will not deteriorate, that our access to capital and other sources of funding will not become constrained or that interest rates will not rise, any of which could adversely affect the availability and terms of future borrowings, renewals or refinancings and our results of operations and financial condition. If we cannot access capital at an acceptable cost or at all, we may be required to liquidate one or more investments in properties at times that may not permit us to maximize the return on those investments or that could result in adverse tax consequences to us.
As a public company, our access to debt and equity capital depends, in part, on the trading prices of our senior notes and common stock, which, in turn, depend upon market conditions that change from time to time, such as the market’s perception of our financial condition, our growth potential and our current and expected future earnings and cash distributions. Our failure to meet the market’s expectation regarding future earnings and cash distributions or a significant downgrade in the ratings assigned to our long-term debt could impact our ability to access capital or increase our borrowing costs.
We rely on the financial institutions that are parties to our revolving credit facilities. If these institutions become capital constrained, tighten their lending standards or become insolvent or if they experience excessive volumes of borrowing requests from other borrowers within a short period of time, they may be unable or unwilling to honor their funding commitments to us, which would adversely affect our ability to draw on our revolving credit facilities and, over time, could negatively impact our ability to consummate acquisitions, repay indebtedness as it matures, fund capital expenditures or make distributions to our stockholders.
We may be adversely affected by fluctuations in currency exchange rates.
Our ownership of properties in Canada and the United Kingdom currently subjects us to fluctuations in the exchange rates between U.S. dollars and Canadian dollars or the British pound, which may, from time to time, impact our financial condition and results of operations. If we continue to expand our international presence through investments in, or acquisitions or development of, assets outside the United States, Canada or the United Kingdom, we may transact business in other foreign currencies. Although we may pursue hedging alternatives, including borrowing in local currencies, to protect against foreign currency fluctuations, we cannot assure you that such hedging will be successful and that fluctuations will not adversely affect our business, financial condition and results of operations.
Covenants in the instruments governing our and our subsidiaries’ existing indebtedness limit our operational flexibility, and a covenant breach could adversely affect our operations.
The terms of the instruments governing our existing indebtedness require us to comply with certain customary financial and other covenants, such as maintaining debt service coverage, leverage ratios and minimum net worth requirements. Our continued ability to incur additional debt and to conduct business in general is subject to our compliance with these covenants, which limit our operational flexibility. Breaches of these covenants could result in defaults under the applicable debt instruments and could trigger defaults under any of our other indebtedness that is cross-defaulted against such instruments, even if we satisfy our payment obligations. Covenants contained in the instruments governing our subsidiaries’ outstanding mortgage indebtedness may restrict our ability to obtain cash distributions from such subsidiaries for the purpose of meeting our debt service obligations. Financial and other covenants that limit our operational flexibility, as well as defaults resulting from our breach of any of these covenants, could adversely affect our business, financial condition and results of operations.
Our Legal, Compliance and Regulatory Risks
Significant legal or regulatory proceedings could subject us or our managers, tenants or borrowers to increased operating costs and substantial uninsured liabilities, which could adversely affect our or their liquidity, financial condition and results of operations.
From time to time, we or our managers, tenants or borrowers may be subject to lawsuits, investigations, claims and other legal or regulatory proceedings arising out of our or their alleged actions or inactions. These claims may include, among other things, professional liability and general liability claims, commercial liability claims, unfair business practices claims,
class action claims, employment-related claims, as well as regulatory proceedings, including proceedings related to our SHOP segment, where we are typically the holder of the applicable healthcare license. In addition, some of our properties are in states in which the litigation environment may pose a significant business risk to us.
In our operating assets, including those in our SHOP and OM&R segments, we are generally responsible for all liabilities of the properties, including any lawsuits, investigations, claims and other legal or regulatory proceedings, other than those arising out of certain limited actions by our managers, such as those caused by gross negligence, fraud or willful misconduct. As a result, we have exposure to, among other things, professional and general liability claims, employment-related claims and the associated litigation and other costs related to defending and resolving such claims, some of which may be uninsured, either as a result of insufficient coverage or unavailability of coverage at a reasonable price.
In our SHOP segment in particular, if one of our managers fails to comply with applicable law or regulation, we may be held responsible, which could subject us to civil, criminal and administrative penalties, including the loss or suspension of accreditation, licenses or certificates of need with respect to a single community or more broadly; suspension of or nonpayment for new admissions; denial of reimbursement; fines; suspension, decertification, or exclusion from federal, state or foreign healthcare programs; or facility closure. In addition, we cannot assure you that any contractual obligations to indemnify, defend and hold us harmless from such liabilities will be satisfied by third parties, or that any amounts held in escrow for such purpose will be sufficient.
An unfavorable resolution of any such lawsuit, investigation, claim or other legal or regulatory proceeding could materially and adversely affect our or our managers’, tenants’ or borrowers’ liquidity, financial condition and results of operations, and may not be protected by sufficient or any insurance coverage. Even with a favorable resolution of litigation or a proceeding, the effect of litigation and other potential litigation and proceedings may materially increase operating costs we or our managers, tenants or borrowers incur. Negative publicity with respect to any lawsuits, claims or other legal or regulatory proceedings may also negatively impact their or our or the affected properties’ reputation.
Our business may be subject to lawsuits or other legal or regulatory proceedings such as professional or general liability litigation alleging wrongful death and negligence claims, some of which may result in large damage awards and not be indemnified or subject to sufficient insurance coverage, may require our support as a result of our indemnification agreements or may result in restrictions in the operations of our or our managers’ or tenants’ business.
We and our managers, tenants and borrowers may be adversely affected by regulation and enforcement.
We and our managers, tenants and borrowers are subject to or impacted by extensive and frequently changing federal, state, local and international laws and regulations. For example, the healthcare industry is subject to laws and regulations that relate to, among other things, licensure and certificates of need, conduct of operations, ownership of communities and facilities, construction of new communities and facilities and addition of equipment, governmental reimbursement programs, such as Medicare and Medicaid, allowable costs, services, prices for services, qualified beneficiaries, appropriateness and classification of care, patient rights, resident health and safety, data privacy and cybersecurity, wage and hour, fraud and abuse and financial and other arrangements that may be entered into by healthcare providers. We generally hold the applicable healthcare licenses and enroll in applicable government healthcare programs on behalf of the properties in our SHOP segment, and that subjects us to potential liability under some healthcare laws and regulations. See “Government Regulation—United States Healthcare Regulation, Licensing and Enforcement” included in Part I, Item 1 of this Annual Report. Many of our research tenants are subject to laws and regulations that govern the research, development, clinical testing, manufacture and marketing of drugs, medical devices and similar products.
The laws and regulations that apply to us and our managers, tenants and borrowers are complex and may change rapidly or new laws and regulations may be introduced, and efforts to comply with them require significant resources. Any new laws, regulations or changes in scope, interpretation or enforcement of the regulatory framework could require us or our managers, tenants or borrowers to make changes to our business or operations and invest significant resources in responding to these changes. For example, certain states have considered or passed legislation imposing restrictions that could affect the ability of REITs to acquire interests in healthcare properties, including hospitals. Other similar laws or regulations could be enacted at the state or federal level. If we or our managers, tenants or borrowers fail to comply with the extensive laws, regulations and other requirements applicable to our or their businesses and the operation of our or their properties, we or they could face a number of remedial actions, including forced closure, loss of accreditation, bans on admissions of new patients or residents, enforcement actions, investigations, imposition of fines, ineligibility to receive reimbursement from governmental and private third-party payor programs or civil or criminal penalties with respect to a single community or more broadly. If any of these occur, our and our managers’, tenants’ and borrowers’ businesses, reputation, results of operations (including results of properties) or financial condition could be adversely affected.
Our investments may expose us to unknown liabilities.
We may acquire or invest in properties or businesses that are subject to liabilities and without any recourse, or with only limited recourse, against the prior owners or other third parties with respect to unknown liabilities. As a result, if a liability was asserted against us based upon ownership of those properties or businesses, we might have to pay substantial sums to settle or contest it, which could adversely affect our results of operations and cash flow.
We may assume or incur liabilities, including, in some cases, contingent liabilities, and be exposed to actual or potential claims in connection with our acquisitions that adversely affect us, such as:
•Liabilities relating to the clean-up or remediation of environmental conditions;
•Unasserted claims of vendors or other persons dealing with the prior owners;
•Liabilities, claims, litigation or obligations, including indemnification obligations, relating to periods prior to or following our acquisition;
•Claims for indemnification by general partners, directors, officers and others indemnified by the sellers; and
•Liabilities for taxes relating to periods prior to our acquisition.
If the liabilities we assume in connection with acquisitions are greater than expected, or if we discover obligations relating to the acquired properties or businesses, our business and results of operations could be materially adversely affected.
We and our managers, tenants and borrowers may be adversely affected by complex and evolving laws and regulations regarding data privacy and cybersecurity.
In the ordinary course of business, we and our managers, tenants and borrowers collect, use, store, disclose, transfer and otherwise process personal information, including personal information specific to tenants, residents and employees. We or our managers, tenants and borrowers may transfer some of this personal information to third parties who assist with certain aspects of our or their business for limited purposes. Accordingly, we and our managers, tenants and borrowers are subject to a variety of stringent data privacy and cybersecurity laws and regulations at the state, federal and international level, as well as contractual requirements and other obligations related to data privacy and cybersecurity. For more information about applicable data privacy and cybersecurity laws and regulations, see “Government Regulation—United States Healthcare Regulation, Licensing and Enforcement—Data Privacy and Cybersecurity” for a discussion of U.S. data privacy and cybersecurity laws and regulations and “Government Regulation—International Healthcare Regulation” for a discussion of international data privacy and cybersecurity laws and regulations.
The legal and regulatory environment surrounding data privacy and cybersecurity is constantly evolving and can be subject to significant change. Laws and regulations governing data privacy, cybersecurity and the unauthorized disclosure of personal information pose increasingly complex compliance challenges, including the potential for inconsistent interpretation, and the implementation and maintenance of compliance measures may potentially elevate our costs. While we believe we have taken commercially reasonable steps, and depend on our managers, tenants and borrowers, to comply with applicable data privacy and cybersecurity laws and regulations, these laws and regulations are in some cases relatively new and the interpretation and application of these laws and regulations are uncertain. Thus, there can be no assurance that our efforts will be deemed effective by regulatory authorities. As noted below, we and our managers, tenants and borrowers, are also subject to the possibility of cybersecurity threats or incidents, which themselves may result in a violation of these laws and regulations and may require us or our managers, tenants or borrowers to report certain incidents to affected individuals or the relevant regulatory authorities. These laws and regulations, and the laws and regulations that may be enacted in the future, also may require us or our managers, tenants or borrowers to modify our or their data processing practices and policies, incur substantial compliance-related costs and expenses and otherwise suffer adverse impacts on our or their business. Any failure, or perceived failure, by us or our managers, tenants or borrowers to comply with applicable data privacy and cybersecurity laws and regulations could result in enforcement actions, investigations, imposition of fines, or civil or criminal penalties. We and our tenants, managers and borrowers also may post public privacy policies and other documentation regarding our or their collection, use, disclosure and other processing of personal information, and any actual or perceived failure to comply with such published policies and other documentation may carry similar consequences or subject us or them to enforcement actions, investigations or litigation if such published policies and other documentation are found to be deceptive, unfair or
misrepresentative of our or their actual practices. If any of the foregoing occurs, our and our managers’, tenants’ and borrowers’ businesses, reputation, results of operations (including results of properties) or financial condition could be adversely affected.
The amount and scope of insurance coverage provided by our policies and policies maintained by our managers, tenants or other counterparties may not adequately insure against losses.
We maintain or require in our lease, management and other agreements that our managers, tenants or other counterparties maintain comprehensive insurance coverage on our properties and their operations with terms, conditions, limits and deductibles that we believe are customary for similarly situated companies in each industry. Although we frequently review our insurance programs and requirements, we cannot assure you that we or our managers, tenants or other counterparties will be able to procure or maintain adequate levels of insurance. We also cannot assure you that we or our managers, tenants or other counterparties will maintain the insurance coverage required under our lease, management and other agreements, that we will continue to require the same levels of insurance under our lease, management and other agreements, that this insurance will be available at a reasonable cost in the future or at all or that the policies maintained will fully cover all losses on our properties when a catastrophic event occurs. We cannot make any guaranty as to the future financial viability of the insurers that underwrite our policies and the policies maintained by our managers, tenants and other counterparties. If we sustain losses in excess of our insurance coverage, we may be required to pay the difference and we could lose our investment in, or experience reduced profits and cash flows from, our operations.
In some cases, we and our managers and tenants may be subject to professional liability, general liability, employment, premise, data privacy, cybersecurity, environmental, unfair business practice and contracts claims brought by plaintiffs’ attorneys seeking significant damages and attorneys’ fees, some of which may not be insured or indemnified and some of which may result in significant damage awards. Due to the historically high frequency and severity of professional liability claims against senior housing and healthcare providers, the availability of professional liability insurance has decreased, and the premiums on this insurance coverage remain costly. Insurance for other claims such as wage and hour, certain environmental, data privacy, cybersecurity and unfair business practices may no longer be available, and the premiums on that insurance coverage, to the extent it is available, remain costly. As a result, insurance protection against these claims may not be sufficient to cover all claims against us or our managers or tenants and may not be available at a reasonable cost or otherwise on terms that provide adequate coverage. If we or our managers and tenants are unable to maintain adequate insurance coverage or are required to pay damages, we or they may be exposed to substantial liabilities, and the adverse impact on our or our managers’ and tenants’ respective financial condition, results of operations and cash flows could be material, and could adversely affect our managers’ and tenants’ ability to meet their obligations to us.
Additionally, we and those of our managers and tenants who self-insure or who transfer risk of losses to a wholly-owned captive insurance company could incur large funded and unfunded property and liability expenses, which could materially adversely affect their or our liquidity, financial condition and results of operations.
Failure to maintain effective internal controls could harm our business, results of operations and financial condition.
Under the Sarbanes-Oxley Act of 2002, we are required to provide a report by management on internal control over financial reporting, including management’s assessment of the effectiveness of that control. Because of its inherent limitations, including the possibility of human error, the circumvention or overriding of controls, or fraud, effective internal controls over financial reporting may not prevent or detect material misstatement and can provide only reasonable assurance with respect to the preparation and fair presentation of financial statements. If we fail to maintain the adequacy of our internal controls over financial reporting and our operating internal controls, including any failure to implement required new or improved controls as a result of changes to our business or otherwise, or if we experience difficulties in their implementation, our business, financial condition and results of operations could be adversely affected and we could fail to meet our reporting obligations.
We could incur substantial liabilities and costs if any of our properties are found to be contaminated with hazardous substances or we become involved in any environmental disputes.
Under federal and state environmental laws and regulations, a current or former owner of real property may be liable for costs related to the investigation, removal and remediation of petroleum or hazardous or toxic substances that are released from or are present at or under, or that are disposed of in connection with, the property. Owners of real property may also face other environmental liabilities, including government fines and penalties imposed by regulatory authorities and damages for injuries to persons, property or natural resources. Environmental laws and regulations often impose liability without regard to whether the owner was aware of, or was responsible for, the presence, release or disposal of hazardous or toxic substances or petroleum. In some circumstances, environmental liability may result from the activities of a current or former manager or
tenant of the property. Although we generally have indemnification rights against the current managers or tenants of our properties for contamination they cause, that indemnification may not adequately cover all environmental costs. See “Government Regulation—Environmental Regulation” included in Part I, Item 1 of this Annual Report.
There can be no assurance as to the total amount of financial assistance that we or our managers, tenants or borrowers will retain from programs implemented under the CARES Act and other pandemic-related legislation.
In response to the COVID-19 pandemic, the CARES Act and other certain legislation authorized funds to be distributed to healthcare providers through the Provider Relief Fund. We applied for and received funds from the Provider Relief Fund, as well as from other similar state and local programs, in late 2020 through 2022 on behalf of the assisted living communities in our SHOP segment. Many of our managers, tenants and borrowers also received grants from the Provider Relief Fund. As a recipient of funds from the Provider Relief Fund, we, our managers, tenants and borrowers are required to comply with detailed reporting requirements specified by HHS, including in some instances by providing a third party audit of the use of the funds. In addition, the HHS Office of Inspector General and Pandemic Response Accountability Committee each have the right to conduct their own audits of the use of funds from the Provider Relief Fund, and HHS has the right to recoup some or all of the payments if it determines noncompliance with its rules. We cannot assure you that some or all of the grants received by us, our managers, tenants and borrowers will not need to be repaid, which repayment could adversely affect our business and results of operations.
Our REIT Status Risks
Loss of our status as a REIT would have significant adverse consequences for us and the value of our common stock.
If we lose our status as a REIT (currently or with respect to any tax years for which the statute of limitations has not expired), we will face serious tax consequences that will substantially reduce the funds available to satisfy our obligations, to implement our business strategy and to make distributions to our stockholders because:
•We would not be allowed a deduction for distributions to stockholders in computing our taxable income and would be subject to regular U.S. federal corporate income tax for any taxable year for which we did not qualify as a REIT;
•We could be subject to increased state and local taxes for those years; and
•Unless we are entitled to relief under statutory provisions, we could not elect to be subject to tax as a REIT for four taxable years following the latest taxable year during which we were disqualified.
In addition, for any year in which we are otherwise unable to qualify as a REIT, we will not be required to pay dividends to maintain REIT status, which could adversely affect the value of our common stock.
Qualification as a REIT involves the application of highly technical and complex provisions of the Code for which there are only limited judicial and administrative interpretations. The determination of factual matters and circumstances not entirely within our control, as well as new legislation, regulations, administrative interpretations or court decisions, may adversely affect our investors or our ability to remain qualified as a REIT for tax purposes. In order to maintain our qualification as a REIT, we must satisfy a number of requirements, generally including requirements regarding the ownership of our stock, requirements regarding the composition of our assets, a requirement that at least 95% of our gross income in any year must be derived from qualifying sources, and a requirement to make distributions to our stockholders aggregating annually at least 90% of our net taxable income, excluding capital gains. Although we believe that we currently qualify as a REIT, we cannot assure you that we will continue to qualify for all future periods.
Even if we qualify as a REIT, we are subject to some taxes on our income and property, including state, local, and foreign taxes, and U.S. federal income taxes in the case of our taxable REIT subsidiaries. To the extent the Company is required to pay any taxes under existing laws or due to future changes in law, we will have less cash available for distribution to shareholders.
The 90% distribution requirement will decrease our liquidity and may limit our ability to engage in otherwise beneficial transactions.
To comply with the 90% distribution requirement applicable to REITs and to avoid a nondeductible excise tax and federal corporate income tax on undistributed REIT taxable income, we must make annual distributions of 100% of our REIT taxable income to our stockholders. Such distributions reduce the funds we have available to finance our investment,
acquisition, development and redevelopment activity and may limit our ability to engage in transactions that are otherwise in the best interests of our stockholders.
From time to time, we may not have sufficient cash or other liquid assets to satisfy the REIT distribution requirements. For example, timing differences between the actual receipt of income and actual payment of deductible expenses, on the one hand, and the inclusion of that income and deduction of those expenses in arriving at our taxable income, on the other hand, or non-deductible expenses such as principal amortization or repayments or capital expenditures in excess of non-cash deductions may prevent us from having sufficient cash or liquid assets to distribute 100% of our REIT taxable income.
In the event that timing differences occur (or, as applicable, we decide to retain cash or to distribute such greater amount as may be necessary to avoid income and excise taxation), we may seek to borrow funds, issue additional equity securities, pay taxable stock dividends, distribute other property or securities or engage in other transactions intended to enable us to meet the REIT distribution requirements. Any of these actions may require us to raise additional capital to meet our obligations; however, see “—Our Capital Structure Risks—We are highly dependent on access to the capital markets. Limitations on our ability to access capital could have an adverse effect on us, including our ability to make required payments on our debt obligations, make distributions to our stockholders or make future investments necessary to implement our business strategy,” above. The terms of the instruments governing our existing indebtedness restrict our ability to engage in certain of these transactions.
To preserve our qualification as a REIT, our certificate of incorporation contains ownership limits with respect to our capital stock that may delay, defer or prevent a change of control of our company.
Our certificate of incorporation contains restrictions on the ownership and transfer of our common and preferred stock to enable us to preserve our REIT status. Our certificate of incorporation provides certain specified remedies if a transfer would violate one of the ownership limitations. In particular, if a person acquires beneficial or constructive ownership of more than the ownership limit (currently, 9.0%, in number or value, of our outstanding common stock or more than 9.9%, in number or value, of our outstanding preferred stock), or in violation of certain other limitations set forth in our certificate of incorporation, then the shares that are beneficially or constructively owned in excess of the relevant limitation are considered “excess shares.” Excess shares are automatically deemed transferred to a trust for the benefit of a charitable institution or other qualifying organization selected by our Board of Directors. The trust is entitled to all dividends with respect to the excess shares and the trustee may exercise all voting power over the excess shares. We also have the right to purchase the excess shares for a price equal to the lesser of (i) the price per share in the transaction that created the excess shares or (ii) the market price on the day we purchase the shares, and we may defer payment of the purchase price for up to five years. If we do not purchase the excess shares, the trustee of the trust is required to transfer the shares at the direction of our Board of Directors. The owner of the excess shares is entitled to receive the lesser of the proceeds from the sale of the excess shares or the original purchase price for such excess shares, and any additional amounts are payable to the beneficiary of the trust. These ownership limits could delay, defer or prevent a transaction or a change of control that might involve a premium price for our common stock or might otherwise be in the best interests of our stockholders.
Our use of taxable REIT subsidiaries is limited under the Code.
Under the Code, no more than 20% of the value of the gross assets of a REIT may be represented by securities of one or more TRSs. This limitation may affect our ability to increase the size of our TRSs’ operations and assets, and there can be no assurance that we will be able to comply with the applicable limitation, or that such compliance will not adversely affect our business. Also, our TRSs may not, among other things, operate or manage healthcare facilities, which may cause us to forgo investments we might otherwise make. Finally, we may be subject to a 100% excise tax as a result of transactions involving our TRSs to the extent that it is determined that those transactions resulted in our TRSs having less taxable income than the TRSs would have had if the transactions were undertaken by unrelated parties on an arm's-length basis. We believe our arrangements with or involving our TRSs are on arm's-length terms and intend to continue to operate in a manner that allows us to avoid incurring the 100% excise tax described above, but there can be no assurance that we will be able to avoid application of that tax.
Complying with REIT requirements may cause us to forego otherwise attractive opportunities (including investing in our tenants) or liquidate otherwise attractive investments.
To qualify as a REIT for federal income tax purposes, we must continually satisfy tests concerning, among other things, the sources of our income, the nature and diversification of our assets, the amounts we distribute to our stockholders and the ownership of our common stock. In order to meet these tests, we may be required to forego investments we might
otherwise make (including investments in our tenants) or to liquidate otherwise attractive investments. This limited investment scope could also lead to financial risks or limit our flexibility during times of operating instability.
The lease of qualified healthcare properties to a TRS is subject to special requirements.
We lease certain healthcare properties to TRSs, which in turn contract with third-party managers to manage the healthcare operations at these properties. The rents we receive from a TRS pursuant to this arrangement are treated as qualifying rents from real property if the healthcare property is a qualified health care property (as defined in the Code), the rents are paid pursuant to a lease with a TRS and the manager qualifies as an eligible independent contractor (as defined in the Code). The determination of what is a qualified healthcare property is complex and, particularly with respect to unlicensed properties, dependent on the day-to-day operations and other arrangements in place at those properties. We believe that we have appropriately determined which of our properties are properly characterized as qualified healthcare properties and that we have structured the applicable leases and related arrangements in a manner intended to meet these requirements, but there can be no assurance that these conditions will be satisfied. If any of these conditions is not satisfied with respect to a particular lease, then the rents we receive with respect to such lease will not be qualifying rents, which could have an adverse effect on our ability to comply with REIT income tests and thus on our ability to qualify as a REIT unless we are able to avail ourselves of certain relief provisions.
The tax imposed on REITs engaging in “prohibited transactions” may limit our ability to engage in transactions which would be treated as sales for federal income tax purposes.
A REIT’s net income from prohibited transactions is subject to a 100% penalty tax. In general, prohibited transactions are sales or other dispositions of property, other than foreclosure property, held primarily for sale to customers in the ordinary course of business, unless certain safe harbor exceptions apply. Although we do not intend to hold any properties that would be characterized as held for sale to customers in the ordinary course of our business, such characterization is a factual determination and no guarantee can be given that the IRS would agree with our characterization of our properties or that we will always be able to satisfy the available safe harbors.
Ventas may incur adverse tax consequences if New Senior or any of Ventas’s subsidiary REITs failed to qualify as a REIT for U.S. federal income tax purposes.
Ventas completed its merger with New Senior and received an opinion from REIT counsel to the effect that, at all times starting with its taxable year ended December 31, 2014 and through the closing date, New Senior was organized and operated in conformity with the requirements for qualification and taxation as a REIT under the Code. The opinion is not binding on the IRS or any court, and it is possible that the IRS could take a contrary position or that this tax position might not be sustained. If New Senior failed to qualify as a REIT for U.S. federal income tax purposes, Ventas would succeed to any tax liabilities. These liabilities could be significant, and Ventas could possibly fail to qualify as a REIT. If New Senior failed to qualify as a REIT for U.S. federal income tax purposes, for the five-year period after the merger, upon a taxable disposition of any of New Senior’s assets, Ventas could be subject to corporate-level tax with respect to all or a portion of the gain so recognized. Ventas’s REIT status also depends on the ongoing qualification of subsidiary entities qualifying as REITs or TRSs, as applicable, as a result of its substantial ownership interest in those entities.
Legislative or other actions affecting REITs or taxes could have a negative effect on our stockholders or us.
The rules dealing with federal income taxation are constantly under review by persons involved in the legislative process and by the IRS and the U.S. Treasury Department. Changes to the tax laws, with or without retroactive application, could adversely affect our investors or us. New legislation, U.S. Treasury Department regulations, administrative interpretations or court decisions could significantly and negatively affect our ability to qualify as a REIT, the federal income tax consequences of such qualification, or the federal income tax consequences of an investment in us. Also, the law relating to the tax treatment of other entities, or an investment in other entities, could change, making an investment in such other entities more attractive relative to an investment in a REIT.
ITEM 1B. Unresolved Staff Comments
None.
ITEM 1C. Cybersecurity
Our business is subject to risk from cybersecurity threats and incidents. Cybersecurity threats and incidents include attempts to gain unauthorized access to our systems and networks, or those of our managers, tenants, borrowers, investments in unconsolidated entities, vendors, suppliers, service providers or other third parties with whom we do business, to disrupt operations, corrupt data or steal confidential or personal information and other cybersecurity breaches. Ventas considers cybersecurity risk a serious threat to our assets and our people and has put processes in place designed to mitigate the risk and impact of any such cybersecurity threat or incident.
Risk Management and Strategy
As part of our cybersecurity risk management process, we:
•Periodically review and implement procedures that endeavor to follow the cybersecurity standards set forth by the National Institute of Standards and Technology, including procedures with respect to evaluation and monitoring of cybersecurity threats and incidents;
•Implement, maintain and regularly review incident response plans to manage cybersecurity threats and incidents and further improve our preparedness and response infrastructure. Such plans are informed by our testing and monitoring activities and set forth actions to be taken in responding to and recovering from cybersecurity incidents which include procedures for assessing the severity of such threats and incidents, escalating and disseminating information and containing, investigating and remediating threats and incidents;
•Engage third-party security firms to monitor and respond to cybersecurity threats and incidents, including those associated with our use of third-party vendors and service providers, and conduct periodic penetration tests with the aim of identifying and remediating vulnerabilities;
•Periodically evaluate and assess cybersecurity risks associated with our use of key third-party business partners, vendors and service providers. However, we do not control the cybersecurity plans and systems put in place by such third parties and we may have limited contractual protections with such third parties, such as indemnification obligations to us, which could cause us to be negatively impacted as a result;
•Provide employees with the training, tools and resources designed to protect the Company from cybersecurity threats and incidents and to identify and report such threats and incidents. Our employees receive training and testing on cybersecurity protocols throughout the year, including regular anti-phishing campaigns, periodic live training programs and mandatory annual training and assessments with passing requirements. Each employee periodically acknowledges that they have read, understood and will abide by the Company’s cybersecurity policies; and
•Seek to minimize the amount of personal information collected to support business needs and use storage and transfer protocols leveraging encryption of critical information, including confidential or personal information.
Our processes for assessing, identifying, and managing material risks from cybersecurity threats and incidents are integrated into our multi-disciplinary enterprise risk management (“ERM”) process. Our ERM process is managed through our ERM Committee, which we have established to assess, identify and manage enterprise-wide risks to the Company, and is comprised of personnel from our senior leadership team. The ERM Committee is convened at least quarterly to review and update our top risks, including cybersecurity risks. Existing risks are evaluated for changes, and mitigation strategies are discussed as needed. New risks are discussed and evaluated for consideration as a top risk. Results are discussed with our Board of Directors at quarterly Board meetings as needed.
As of December 31, 2024, the Company is not aware of any cybersecurity threats or incidents that have materially affected or are reasonably likely to materially affect the Company, including with respect to our business strategy, results of operations or financial condition. While we have implemented measures designed to help mitigate the risk from cybersecurity threats and incidents, we cannot guarantee that we or our managers, tenants, borrowers, investments in unconsolidated entities, vendors, suppliers, service providers or other third parties with whom we do business will be successful in preventing a cybersecurity incident, or mitigating or remediating a cybersecurity threat, which could result in a data center outage, disrupt our systems and operations or the systems and operations of our managers, tenants, borrowers, investments in unconsolidated entities, vendors, suppliers, service providers or other third parties with whom we do business, compromise the confidential or personal information of our employees, partners or the residents in our senior housing communities and damage our business relationships and reputation. Although we have implemented various measures designed to manage risks relating to these types
of events, these measures and the systems supporting them could prove to be inadequate and, if compromised, could become inoperable for extended periods of time, cease to function properly or fail to adequately secure confidential or personal information. See “Risk Factors—Our Legal, Compliance and Regulatory Risks—Cybersecurity threats and incidents could disrupt our operations or the operations of the third parties with whom we do business, invest in or lend to, result in the loss of or unauthorized access to confidential or personal information or damage our or their business relationships and reputation” included in Part I, Item 1A of this Annual Report.
Governance
Role of our Board of Directors and the Audit and Compliance Committee
As part of our Board of Directors’ role in overseeing the Company’s ERM program, which includes our cybersecurity risk management, our Board is responsible for overseeing management’s identification, assessment and management of material cybersecurity risks which may reasonably be expected to impact the Company. While our Board has overall responsibility for enterprise risk oversight, our Board has delegated to the Audit and Compliance Committee responsibility for overseeing risks from cybersecurity threats and incidents. The Audit and Compliance Committee is responsible for overseeing the effectiveness of the Company’s cybersecurity risk management initiatives, taking into account the Company’s risk exposures. Management briefs the Audit and Compliance Committee at least once a year and our Board as appropriate on cybersecurity controls, protocols, risk assessments and mitigation measures.
Role of our Management
Our management has primary responsibility for identifying, assessing and managing our exposure to cybersecurity threats and incidents, subject to oversight by our Board of Directors of the processes we establish to assess, monitor and mitigate that exposure.
Our Chief Information Officer oversees our Information Technology Team and is responsible for the development and implementation of strategy for our information systems, networks, infrastructure, cybersecurity and data analytics. She has more than 25 years of experience in the field of information technology and is a member of our senior leadership team. Prior to joining Ventas, she spent approximately 12 years at a multinational hospitality public company where, in her most recent role, she was responsible for application management and support of enterprise-wide systems. This role also had responsibility for global service desk support for more than 100,000 employees.
If a potentially material cybersecurity threat or incident is identified or discovered, the Company’s Information Technology Team will notify our Chief Executive Officer, Chief Financial Officer, General Counsel and other relevant business executives. Our Chief Information Officer will work with the appropriate leaders and employees in any impacted business groups, as well as appropriate personnel in our finance, legal and other departments, to assess the risks to the Company and potential impact while determining appropriate remediation steps.
If management determines that a cybersecurity threat or incident could be material to the Company, our management will notify the Audit and Compliance Committee, who will then escalate the risk to our full Board of Directors, depending on management’s assessment of the risk. As discussed above, management also provides regular reports to the Audit and Compliance Committee and to our Board as appropriate.
ITEM 2. Properties
As of December 31, 2024, we owned or had investments in 1,387 properties consisting of 1,356 properties in our SHOP, OM&R and NNN segments and 31 properties held by unconsolidated real estate entities in our non-segment operations. See “Note 7 – Investments in Unconsolidated Entities.”
The following table provides additional information regarding the geographic diversification of our Segment Properties as of December 31, 2024: | | | | | | | | | | | | | | | | | | | | | | | | | | | | | | | | | | | | | | | | | | | | | | | | | | | | | | | | | | | | | | | | | | | | | | | | | | | |
| | | Senior Housing
Communities | | SNFs | | Outpatient Medical Buildings | | Research Centers | | IRFs and LTACs | | Other Healthcare Facilities | |
| Geographic Location | | # of
Properties | | Units | | # of Properties | | Licensed Beds | | # of Properties | | Square Feet (1) | | # of Properties | | Square Feet (1) | | # of Properties | | Licensed Beds | | # of Properties | | Licensed Beds | |
| Alabama | | 1 | | | 154 | | | — | | | — | | | 6 | | | 617 | | | — | | | — | | | — | | | — | | | — | | | — | | |
| Arkansas | | 5 | | | 414 | | | — | | | — | | | 1 | | | 10 | | | — | | | — | | | — | | | — | | | — | | | — | | |
| Arizona | | 29 | | | 2,572 | | | — | | | — | | | 14 | | | 893 | | | — | | | — | | | 1 | | | 60 | | | — | | | — | | |
| California | | 78 | | | 8,864 | | | — | | | — | | | 29 | | | 2,256 | | | — | | | — | | | 8 | | | 667 | | | — | | | — | | |
| Colorado | | 22 | | | 2,061 | | | 1 | | | 82 | | | 17 | | | 877 | | | — | | | — | | | 1 | | | 81 | | | — | | | — | | |
| Connecticut | | 12 | | | 1,560 | | | — | | | — | | | — | | | — | | | — | | | — | | | — | | | — | | | — | | | — | | |
| Delaware | | 2 | | | 109 | | | — | | | — | | | — | | | — | | | — | | | — | | | — | | | — | | | — | | | — | | |
| District of Columbia | | — | | | — | | | — | | | — | | | 2 | | | 103 | | | — | | | — | | | — | | | — | | | — | | | — | | |
| Florida | | 45 | | | 4,073 | | | — | | | — | | | 14 | | | 343 | | | 1 | | | 252 | | | 7 | | | 563 | | | — | | | — | | |
| Georgia | | 15 | | | 1,447 | | | — | | | — | | | 18 | | | 1,275 | | | — | | | — | | | 1 | | | 42 | | | — | | | — | | |
| Hawaii | | 1 | | | 123 | | | — | | | — | | | 1 | | | 23 | | | — | | | — | | | — | | | — | | | — | | | — | | |
| Iowa | | 2 | | | 215 | | | — | | | — | | | — | | | — | | | — | | | — | | | — | | | — | | | — | | | — | | |
| Idaho | | 1 | | | 70 | | | — | | | — | | | 1 | | | 76 | | | — | | | — | | | — | | | — | | | — | | | — | | |
| Illinois | | 33 | | | 3,643 | | | 1 | | | 82 | | | 40 | | | 1,728 | | | 1 | | | 129 | | | 4 | | | 427 | | | — | | | — | | |
| Indiana | | 9 | | | 752 | | | — | | | — | | | 41 | | | 2,287 | | | — | | | — | | | 1 | | | 59 | | | — | | | — | | |
| Kansas | | 12 | | | 941 | | | — | | | — | | | 2 | | | 115 | | | — | | | — | | | — | | | — | | | — | | | — | | |
| Kentucky | | 10 | | | 1,056 | | | — | | | — | | | 2 | | | 73 | | | — | | | — | | | 1 | | | 384 | | | — | | | — | | |
| Louisiana | | 3 | | | 281 | | | — | | | — | | | 8 | | | 456 | | | — | | | — | | | 1 | | | 32 | | | — | | | — | | |
| Massachusetts | | 18 | | | 2,173 | | | 2 | | | 181 | | | — | | | — | | | — | | | — | | | — | | | — | | | — | | | — | | |
| Maryland | | 4 | | | 282 | | | — | | | — | | | 2 | | | 83 | | | 3 | | | 320 | | | — | | | — | | | — | | | — | | |
| Maine | | 8 | | | 895 | | | — | | | — | | | — | | | — | | | — | | | — | | | — | | | — | | | — | | | — | | |
| Michigan | | 23 | | | 1,675 | | | — | | | — | | | 16 | | | 726 | | | — | | | — | | | — | | | — | | | — | | | — | | |
| Minnesota | | 14 | | | 856 | | | — | | | — | | | 3 | | | 159 | | | — | | | — | | | — | | | — | | | — | | | — | | |
| Missouri | | 5 | | | 474 | | | — | | | — | | | 19 | | | 1,117 | | | 5 | | | 810 | | | 4 | | | 159 | | | — | | | — | | |
| Mississippi | | 1 | | | 94 | | | — | | | — | | | 1 | | | 51 | | | — | | | — | | | — | | | — | | | — | | | — | | |
| Montana | | 5 | | | 464 | | | — | | | — | | | — | | | — | | | — | | | — | | | — | | | — | | | — | | | — | | |
| North Carolina | | 36 | | | 3,048 | | | — | | | — | | | 15 | | | 676 | | | 9 | | | 1,144 | | | 1 | | | 124 | | | — | | | — | | |
| North Dakota | | 2 | | | 115 | | | — | | | — | | | 1 | | | 114 | | | — | | | — | | | — | | | — | | | — | | | — | | |
| Nebraska | | 2 | | | 251 | | | — | | | — | | | — | | | — | | | — | | | — | | | — | | | — | | | — | | | — | | |
| New Hampshire | | 2 | | | 242 | | | — | | | — | | | — | | | — | | | — | | | — | | | — | | | — | | | — | | | — | | |
| New Jersey | | 14 | | | 1,310 | | | 1 | | | 153 | | | 3 | | | 37 | | | — | | | — | | | — | | | — | | | — | | | — | | |
| New Mexico | | 4 | | | 451 | | | — | | | — | | | 3 | | | 53 | | | — | | | — | | | 2 | | | 123 | | | 4 | | | 555 | | |
| Nevada | | 7 | | | 780 | | | — | | | — | | | 4 | | | 329 | | | — | | | — | | | 2 | | | 130 | | | — | | | — | | |
| New York | | 41 | | | 4,501 | | | — | | | — | | | 4 | | | 244 | | | — | | | — | | | — | | | — | | | — | | | — | | |
| Ohio | | 30 | | | 2,701 | | | — | | | — | | | 16 | | | 591 | | | — | | | — | | | 1 | | | 50 | | | — | | | — | | |
| Oklahoma | | 9 | | | 694 | | | — | | | — | | | 1 | | | 80 | | | — | | | — | | | 1 | | | 41 | | | 4 | | | 958 | | |
| Oregon | | 36 | | | 3,261 | | | 6 | | | 360 | | | 1 | | | 105 | | | — | | | — | | | — | | | — | | | — | | | — | | |
| Pennsylvania | | 32 | | | 2,520 | | | 12 | | | 2,526 | | | 8 | | | 614 | | | 6 | | | 1,119 | | | 1 | | | 52 | | | — | | | — | | |
| Rhode Island | | 4 | | | 399 | | | — | | | — | | | — | | | — | | | 3 | | | 444 | | | — | | | — | | | — | | | — | | |
| South Carolina | | 6 | | | 539 | | | — | | | — | | | 22 | | | 1,188 | | | — | | | — | | | — | | | — | | | — | | | — | | |
| South Dakota | | 5 | | | 295 | | | — | | | — | | | — | | | — | | | — | | | — | | | — | | | — | | | — | | | — | | |
| Tennessee | | 17 | | | 1,355 | | | — | | | — | | | 5 | | | 250 | | | — | | | — | | | 1 | | | 49 | | | — | | | — | | |
| Texas | | 59 | | | 5,392 | | | — | | | — | | | 47 | | | 2,084 | | | — | | | — | | | 9 | | | 627 | | | 2 | | | 445 | | |
| Utah | | 6 | | | 661 | | | — | | | — | | | — | | | — | | | — | | | — | | | 1 | | | 41 | | | — | | | — | | |
| Virginia | | 11 | | | 1,029 | | | — | | | — | | | 5 | | | 234 | | | 1 | | | 262 | | | — | | | — | | | — | | | — | | |
| Washington | | 20 | | | 2,114 | | | 7 | | | 636 | | | 10 | | | 584 | | | — | | | — | | | — | | | — | | | — | | | — | | |
| Wisconsin | | 35 | | | 2,236 | | | — | | | — | | | 15 | | | 745 | | | — | | | — | | | — | | | — | | | — | | | — | | |
| West Virginia | | 2 | | | 122 | | | 4 | | | 326 | | | — | | | — | | | — | | | — | | | — | | | — | | | — | | | — | | |
| Wyoming | | 2 | | | 169 | | | — | | | — | | | — | | | — | | | — | | | — | | | — | | | — | | | — | | | — | | |
| Total U.S. | | 740 | | | 69,433 | | | 34 | | | 4,346 | | | 397 | | | 21,192 | | | 29 | | | 4,480 | | | 48 | | | 3,711 | | | 10 | | | 1,958 | | |
| Canada | | 84 | | | 16,185 | | | — | | | — | | | — | | | — | | | — | | | — | | | — | | | — | | | — | | | — | | |
| United Kingdom | | 11 | | | 723 | | | — | | | — | | | — | | | — | | | — | | | — | | | — | | | — | | | 3 | | | 121 | | |
| Total | | 835 | | | 86,341 | | | 34 | | | 4,346 | | | 397 | | | 21,192 | | | 29 | | | 4,480 | | | 48 | | | 3,711 | | | 13 | | | 2,079 | | |
______________________________
(1)Square Feet are in thousands. Totals may not foot due to rounding.
Corporate Offices
Our headquarters are located in Chicago, Illinois and we have additional corporate offices in Louisville, Kentucky and New York, New York. We lease all of our corporate offices.
ITEM 3. Legal Proceedings
The information contained in “Note 14 – Commitments and Contingencies” of the Notes to Consolidated Financial Statements included in Part II, Item 8 of this Annual Report is incorporated by reference into this Item 3. Except as set forth therein, we are not a party to, nor is any of our property the subject of, any material pending legal proceedings.
ITEM 4. Mine Safety Disclosures
Not applicable.
PART II
ITEM 5. Market for Registrant’s Common Equity, Related Stockholder Matters and Issuer Purchases of Equity Securities
Market Information
Our common stock, par value $0.25 per share, is listed and traded on the New York Stock Exchange (the “NYSE”) under the symbol “VTR.” As of February 7, 2025, there were 437.1 million shares of our common stock outstanding, held by approximately 3,115 stockholders of record.
Dividends and Distributions
We pay regular quarterly dividends to holders of our common stock to comply with the provisions of the Internal Revenue Code of 1986, as amended (the “Code”), governing REITs. In order to maintain our qualification as a REIT, we are required under the Code, among other things, to distribute annually at least 90% of our REIT taxable income, determined without regard to any net capital gain. In addition, we will be subject to income tax at the regular corporate rate to the extent we distribute less than 100% of our REIT taxable income, including any net capital gains. We expect to distribute at least 100% of our taxable net income, after the use of any net operating loss carryforwards, to our stockholders for 2025.
In general, our Board of Directors makes decisions regarding the nature, frequency and amount of our dividends on a quarterly basis. Because the Board considers many factors when making these decisions, including our present and future liquidity needs, our current and projected financial condition and results of operations and the performance and credit quality of our managers, tenants, borrowers, we cannot assure you that we will maintain the practice of paying regular quarterly dividends to continue to qualify as a REIT. Please see “Cautionary Statements” and the risk factors included in Part I, Item 1A of this Annual Report for a description of other factors that may affect our distribution policy.
Director and Employee Stock Sales
Certain of our directors, executive officers and other employees have adopted or, from time to time in the future, may adopt non-discretionary, written trading plans that comply with Rule 10b5-1 under the Exchange Act, or otherwise monetize, gift or transfer their equity-based compensation. These transactions typically are conducted for estate, tax and financial planning purposes and are subject to compliance with our Amended and Restated Securities Trading Policy and Procedures (“Securities Trading Policy”), the minimum stock ownership requirements contained in our Guidelines on Governance and all applicable laws and regulations.
Our Securities Trading Policy expressly prohibits our directors, executive officers and employees from buying or selling derivatives with respect to our securities or other financial instruments that are designed to hedge or offset a decrease in the market value of our securities and from engaging in short sales with respect to our securities. In addition, our Securities Trading Policy prohibits our directors and executive officers from holding our securities in margin accounts or pledging our securities to secure loans. Each of our directors and executive officers has advised us that he or she is in compliance with the Securities Trading Policy and has not pledged any of our equity securities to secure margin or other loans.
Stock Performance Graph
The following performance graph compares the cumulative total return (including dividends) to the holders of our common stock from December 31, 2019 through December 31, 2024, with the cumulative total returns of the S&P 500 Index, the FTSE Nareit Equity REITs Index (“FTSE Nareit Equity Index”), the FTSE Nareit Equity Health Care Index (“FTSE Nareit Health Care Index”), the NYSE Composite Index and the FTSE Nareit Composite REIT Index (the “Composite REIT Index”) over the same period. The comparison assumes $100 was invested on December 31, 2019 in our common stock and in each of the foregoing indices and assumes reinvestment of dividends, as applicable. We have included the S&P 500 Index because we are a member of the S&P 500. Additionally, we have elected to replace the NYSE Composite Index and Composite REIT Index with FTSE Nareit Health Care Index and FTSE Nareit Equity Index because we believe those indices are more representative of the industries in which we compete, or otherwise provide fair bases for comparison with us, and are therefore particularly relevant to an assessment of our performance. In this transition year, in accordance with Item 201(e)(4) of Regulation S-K, the stock performance graph below includes both the new indices as well as the replaced indices that we used in the immediately preceding year to assist our investors in understanding the impact of the transition. The figures in the table below are rounded to the nearest dollar.
| | | | | | | | | | | | | | | | | | | | | | | | | | | | | | | | | | | |
| 12/31/2019 | | 12/31/2020 | | 12/31/2021 | | 12/31/2022 | | 12/31/2023 | | 12/31/2024 |
| Ventas | $100 | | $90 | | $97 | | $89 | | $102 | | $125 |
| S&P 500 Index | $100 | | $118 | | $152 | | $125 | | $158 | | $197 |
| FTSE Nareit Equity Index | $100 | | $92 | | $132 | | $100 | | $113 | | $123 |
| FTSE Nareit Health Care Index | $100 | | $90 | | $105 | | $82 | | $93 | | $115 |
| NYSE Composite Index | $100 | | $107 | | $129 | | $117 | | $133 | | $154 |
| Composite REIT Index | $100 | | $94 | | $132 | | $99 | | $110 | | $115 |
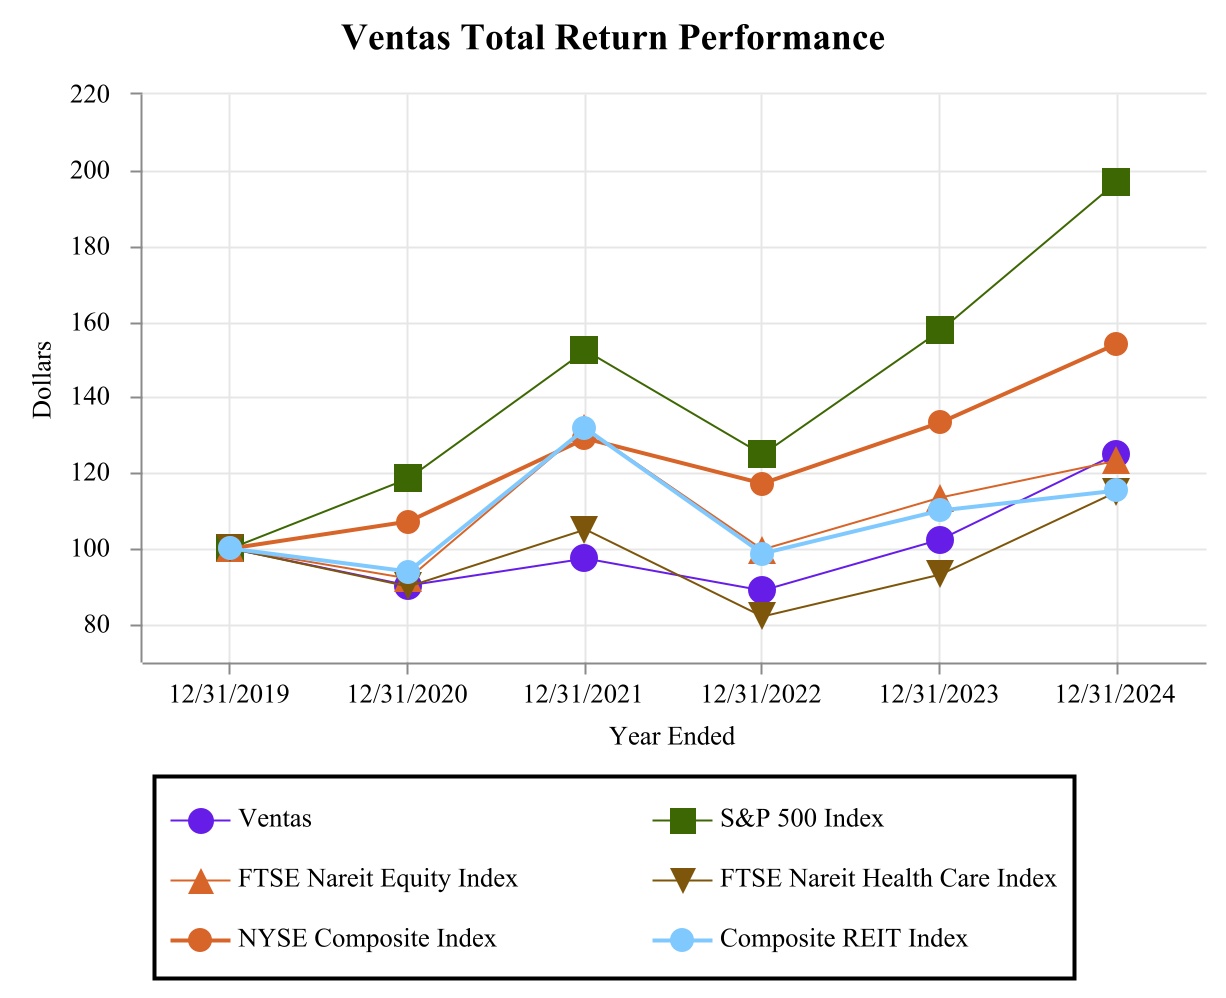
Stock Repurchases
We do not have a publicly announced repurchase plan or program in effect. The table below summarizes repurchases of our common stock made during the quarter ended December 31, 2024:
| | | | | | | | | | | | | | | | | | | | | | | |
| Number of Shares Repurchased (1) | | Average Price
Per Share | | Total Number of Shares Purchased as Part of Publicly Announced Plans or Programs | | Maximum Number (or Approximate Dollar Value) of Shares that May Yet be Purchased Under the Plans or Programs |
| October 1 through October 31 | 496 | | | $ | 62.93 | | | — | | | — | |
| November 1 through November 30 | — | | | — | | | — | | | — | |
| December 1 through December 31 | 145 | | | 62.26 | | | — | | | — | |
| Total | 641 | | | $ | 62.78 | | | — | | | — | |
______________________________
(1)Repurchases represent shares withheld to pay taxes on the vesting of restricted stock and restricted stock units (including time-based and performance-based awards) and/or to pay taxes on the exercise price upon the exercise of stock options, granted to employees. The value of the shares withheld is the closing price of our common stock on the date the vesting or exercise occurred (or, if not a trading day, the immediately preceding trading day) or the fair market value of our common stock at the time of the exercise, as the case may be.
ITEM 6. [Reserved]
ITEM 7. Management’s Discussion and Analysis of Financial Condition and Results of Operations
The following discussion provides information that management believes is relevant to an understanding and assessment of the consolidated financial condition and results of operations of Ventas, Inc. You should read this discussion in conjunction with our Consolidated Financial Statements and the notes thereto included in Part II, Item 8 of this Annual Report and our Risk Factors included in Part I, Item 1A of this Annual Report.
Business Summary and Overview of 2024
Ventas, Inc., (together with its consolidated subsidiaries, unless otherwise indicated or except where the context otherwise requires, “we,” “us,” “our,” “Company” and other similar terms) is a real estate investment trust (“REIT”) focused on delivering strong, sustainable shareholder returns by enabling exceptional environments that benefit a large and growing aging population. We hold a portfolio that includes senior housing communities, outpatient medical buildings, research centers, hospitals and healthcare facilities located in North America and the United Kingdom. As of December 31, 2024, we owned or had investments in 1,387 properties consisting of 1,356 properties in our reportable business segments (“Segment Properties”) and 31 properties held by unconsolidated real estate entities in our non-segment operations. Our Company is headquartered in Chicago, Illinois with additional corporate offices in Louisville, Kentucky and New York, New York.
We elected to be taxed as a REIT under Sections 856 through 860 of the Internal Revenue Code (the “Code”), commencing with our taxable year ended December 31, 1999. Provided we qualify for taxation as a REIT, we generally are not required to pay U.S. federal corporate income taxes on our REIT taxable income that is currently distributed to our stockholders. In order to maintain our qualification as a REIT, we must satisfy a number of technical requirements, which impact how we invest in, operate and manage our assets. See “Risk Factors—Our REIT Status Risks” included in Part I, Item 1A of this Annual Report on Form 10-K (the “Annual Report”).
We operate through three reportable business segments: senior housing operating portfolio, which we refer to as “SHOP,” outpatient medical and research portfolio, which we refer to as “OM&R,” and triple-net leased properties, which we refer to as “NNN.” We also hold assets outside of our reportable business segments, which we refer to as non-segment assets and which consist primarily of corporate assets, including cash and cash equivalents, restricted cash, loans receivable and investments and accounts receivable as well as investments in unconsolidated entities. Our investments in unconsolidated entities include investments made through our third-party institutional private capital management platform, Ventas Investment Management (“VIM”). Through VIM, we partner with third-party institutional investors to invest in real estate through various joint ventures and other co-investment vehicles where we are the sponsor or general partner, including our open-ended investment vehicle, the Ventas Life Science & Healthcare Real Estate Fund (the “Ventas Fund”). See our Consolidated Financial Statements and the related notes, including “Note 7 – Investments in Unconsolidated Entities” included in Part II, Item 8 of this Annual Report.
Our chief operating decision maker evaluates performance of the combined properties in each operating segment and determines how to allocate resources to these segments, based on net operating income (“NOI”) for each segment. See our Consolidated Financial Statements and the related notes, including “Note 2 – Accounting Policies” and “Note 18 – Segment Information” included in Part II, Item 8 of this Annual Report.
The following table summarizes information for our portfolio for the year ended December 31, 2024 (dollars in thousands):
| | | | | | | | | | | | | | | | | | | | |
| Segment | | NOI (1) | | Percentage of Total NOI | | Segment Properties |
| Senior housing operating portfolio (SHOP) | | $ | 866,383 | | | 41.9 | % | | 629 | |
| Outpatient medical and research portfolio (OM&R) | | 579,271 | | | 28.0 | % | | 426 | |
| Triple-net leased properties (NNN) | | 606,225 | | | 29.3 | % | | 301 | |
Non-segment (2) | | 17,204 | | | 0.8 | % | | n/a |
| | $ | 2,069,083 | | | 100 | % | | 1,356 | |
______________________________
(1) “NOI” is defined as total revenues, less interest and other income, property-level operating expenses and third-party capital management expenses. See “Non-GAAP Financial Measures” included elsewhere in this Annual Report for additional disclosure and a reconciliation of net income attributable to common stockholders, as computed in accordance with U.S. generally accepted accounting principles (“GAAP”), to NOI.
(2) NOI for non-segment includes management fees and promote revenues, net of expenses related to our third-party institutional private capital management platform, income from loans and investments and corporate-level expenses not directly attributable to any of our three reportable business segments.
For more than 25 years, Ventas has pursued what we believe is a successful, enduring strategy focused on delivering outsized value to stockholders and other key stakeholders by enabling exceptional environments that benefit the aging population. Working with industry-leading care providers, partners, developers and research and medical institutions, our collaborative and experienced team is focused on achieving consistent, superior total returns through: (1) delivering profitable organic growth in senior housing, (2) capturing value-creating external growth focused on senior housing, (3) driving strong execution and cash flow generation throughout our portfolio of high-quality assets unified in serving the large and growing aging population and (4) maintaining financial strength, flexibility and liquidity.
Our objective is to generate reliable and growing cash flows from our portfolio, which enables us to pay regular cash dividends to stockholders and creates opportunities to increase stockholder value.
2025 Market Trends
We expect senior housing to benefit from strong supply/demand fundamentals, including robust projected demand growth combined with low projected supply growth. Senior housing is expected to benefit from a large and growing aging demographic in the United States, with the 80+ population anticipated to grow by more than 28% through 2030. United States senior housing construction starts are at their lowest point since 2010.
Our operations have been and are expected to continue to be impacted by economic and market conditions. For instance, in senior housing, our managers and tenants have experienced expense pressures, due in part to increased inflation and low unemployment. While there have been signs that expense pressures are moderating, there can be no assurance that this will continue to be the case.
Continual improvement in the performance and growth of our business will also depend on the broader macroeconomic environment, including interest rates, inflation and GDP growth.
See “Risk Factors” in Part I, Item 1A of this Annual Report for additional discussion of risks affecting our business.
Select 2024 and Early 2025 Highlights
Investments and Dispositions
•During the year ended December 31, 2024, we made $2.0 billion of investments including 50 senior housing communities reported within our SHOP segment, five long-term acute care facilities (“LTACs”) reported within our NNN segment for an aggregate purchase price of $1.9 billion and new secured debt financing of $109.0 million to the owner of a senior housing property, secured by the asset and with additional credit support. The loan provides us with a right of first offer to purchase the asset on certain terms and conditions. The loan has a 3-year term and bears interest at a variable rate based on one-month SOFR, subject to a floor of 4.50%, plus a spread of 5.75%, increasing to 6.00% commencing October 1, 2025.
•During the year ended December 31, 2024, we sold 19 senior housing communities in our SHOP segment, 12 outpatient medical buildings (one of which was vacant) in our OM&R segment and 24 properties in our NNN segment for aggregate consideration of $315.1 million and recognized $57.0 million in Gain on real estate dispositions in our Consolidated Statements of Income.
•In January 2025, we acquired two senior housing communities reported within our SHOP segment for an aggregate purchase price of $70.0 million.
Liquidity and Capital
•As of December 31, 2024, we had $3.8 billion in liquidity, including availability under our revolving credit facility, cash and cash equivalents on hand and unsettled equity forward sales agreements, with no borrowings outstanding under our commercial paper program.
Senior Notes
•In February 2024, our wholly-owned subsidiary, Ventas Canada Finance Limited (“Ventas Canada”), issued and sold C$650.0 million ($478.3 million) aggregate principal amount of 5.10% Senior Notes, Series J due 2029 in a private placement.
•In April and May 2024, we repaid $800.0 million senior notes consisting of $400.0 million aggregate principal amount of 3.50% Senior Notes due 2024 and $400.0 million aggregate principal amount of 3.75% Senior Notes due 2024.
•In April 2024, we repaid C$73.0 million ($53.4 million) aggregate principal amount of 2.80% Senior Notes, Series E due 2024.
•In May 2024, our wholly-owned subsidiary, Ventas Realty, Limited Partnership (“Ventas Realty”), issued and sold $500.0 million aggregate principal amount of 5.625% Senior Notes due 2034 in a registered public offering.
•In September 2024, Ventas Realty issued and sold $550.0 million aggregate principal amount of 5.00% Senior Notes due 2035 in a registered public offering.
•In September 2024, we repaid C$163.3 million ($120.8 million) aggregate principal amount of 4.125% Senior Notes due 2024.
•In January and February 2025, we repaid $450.0 million and $600.0 million aggregate principal amount of 2.65% Senior Notes due 2025 and aggregate principal amount of 3.50% Senior Notes due 2025, respectively.
Equity
•During the year ended December 31, 2024, we issued 37.3 million shares of our common stock for gross proceeds of $2.2 billion, representing an average price of $58.38 per share, of which 3.4 million shares or approximately $201.1 million in gross proceeds remained unsettled with maturity in March 2026.
•In January 2025, we entered into additional unsettled equity forward sales agreements for 0.8 million shares or approximately $49.8 million in gross proceeds with maturity in March 2026.
•As of December 31, 2024, we had $1.5 billion remaining under our current “at-the-market” equity offering program for future sales of common stock.
Portfolio
•During the year ended December 31, 2024, we converted 11 senior housing communities from the NNN segment to the SHOP segment. We also transitioned 17 senior housing communities within the SHOP segment to new managers.
•In September 2024, we entered into agreements with Kindred Healthcare, LLC and certain of its affiliates (“Kindred”) and its parent companies (“ScionHealth”) with respect to 23 LTACs whose lease term was scheduled to expire under our Master Lease with Kindred on April 30, 2025 (the “Kindred Group 2 LTACs”). Under these agreements, among other things: (i) the term of the Kindred Master Lease for 20 of the Kindred Group 2 LTACs was extended to April 30, 2030, (ii) we acquired five LTACs from Kindred, which were added to the Kindred Master Lease with a term expiring on September 30, 2034, and (iii) we received warrants for 9.9% of the common equity of ScionHealth exercisable at its pre-transaction value. The current term for three Kindred Group 2 LTACs will expire on April 30, 2025.
•In December 2024, we entered into agreements with Brookdale Senior Living, Inc. and certain of its affiliates (“Brookdale”) with respect to 121 senior housing properties whose lease term was scheduled to expire under our Master Lease with Brookdale on December 31, 2025. Under these agreements, among other things: (i) the term of the Brookdale Master Lease for 65 senior housing properties was extended to December 31, 2035, and (ii) commencing September 1, 2025, we will have the right to convert 45 senior housing properties to our SHOP segment with one or more managers of our choosing. The current term for the remaining 11 properties will expire on December 31, 2025.
Other Items
•In July 2024, Ardent Health Partners, Inc., the parent company of the tenants under, and guarantor of, the Ardent Master Lease, consummated an initial public offering (the “Ardent IPO”). Following the Ardent IPO, our equity stake in Ardent decreased from 7.5% to approximately 6.7%, which resulted in a gain of $8.7 million for the year ended December 31, 2024, which is included in Income from unconsolidated entities in our Consolidated Statements of Income.
Critical Accounting Policies and Estimates
Our Consolidated Financial Statements included in Part II, Item 8 of this Annual Report have been prepared in accordance with GAAP set forth in the Accounting Standards Codification (“ASC”), as published by the Financial Accounting Standards Board (“FASB”). GAAP requires us to make estimates and assumptions regarding future events that affect the reported amounts of assets and liabilities, the disclosure of contingent assets and liabilities at the date of the financial statements and the reported amounts of revenues and expenses during the reporting periods. We base these estimates on our experience and assumptions we believe to be reasonable under the circumstances. However, if our judgment or interpretation of the facts and circumstances relating to various transactions or other matters had been different, we may have applied a different accounting treatment, resulting in a different presentation of our financial statements. We periodically reevaluate our estimates and assumptions and, in the event they prove to be different from actual results, we make adjustments in subsequent periods to reflect more current estimates and assumptions about matters that are inherently uncertain.
We believe that the critical accounting policies described below, among others, affect our more significant estimates and judgments used in the preparation of our financial statements. For more information regarding our critical accounting policies, see “Note 2 – Accounting Policies” of the Notes to Consolidated Financial Statements included in Part II, Item 8 of this Annual Report.
Principles of Consolidation
The Consolidated Financial Statements included in Part II, Item 8 of this Annual Report include our accounts and the accounts of our wholly-owned subsidiaries and the joint venture entities over which we exercise control. All intercompany transactions and balances have been eliminated in consolidation, and our net earnings are reduced by the portion of net earnings attributable to noncontrolling interests.
GAAP requires us to identify entities for which control is achieved through means other than voting rights and to determine which business enterprise is the primary beneficiary of variable interest entities (“VIEs”). A VIE is broadly defined as an entity with one or more of the following characteristics: (a) the total equity investment at risk is insufficient to finance the entity’s activities without additional subordinated financial support; (b) as a group, the holders of the equity investment at risk lack (i) the ability to make decisions about the entity’s activities through voting or similar rights, (ii) the obligation to absorb the expected losses of the entity, or (iii) the right to receive the expected residual returns of the entity; and (c) the equity investors have voting rights that are not proportional to their economic interests, and substantially all of the entity’s activities either involve, or are conducted on behalf of, an investor that has disproportionately few voting rights. We consolidate our investment in a VIE when we determine that we are its primary beneficiary. We may change our original assessment of a VIE upon subsequent events such as the modification of contractual arrangements that affects the characteristics or adequacy of the entity’s equity investments at risk and the disposition of all or a portion of an interest held by the primary beneficiary.
We identify the primary beneficiary of a VIE as the enterprise that has both: (i) the power to direct the activities of the VIE that most significantly impact the entity’s economic performance; and (ii) the obligation to absorb losses or the right to receive benefits of the VIE that could be significant to the entity. We perform this analysis on an ongoing basis.
Accounting for Real Estate Acquisitions
When we acquire real estate, we first make reasonable judgments about whether the transaction involves an asset or a business. Our real estate acquisitions are generally accounted for as asset acquisitions as substantially all of the fair value of the gross assets acquired is concentrated in a single identifiable asset or group of similar identifiable assets. We record the cost of the assets acquired as tangible and intangible assets and liabilities based upon their relative fair values as of the acquisition date.
Our asset acquisitions may include one or more groups of real estate properties within which there are different types of tangible and intangible assets, typically consisting of land, buildings, site improvements, furniture, fixtures and equipment and lease intangibles. When we acquire multiple real estate properties in a single transaction, we first assess the individual fair
value of the real estate properties and then determine the individual fair value of the various types of tangible and intangible assets therein. The individual fair value of the real estate properties is estimated by applying a valuation methodology such as the direct capitalization method of the income approach, which includes estimate for a capitalization rate, annual gross income, vacancy, and expenses based on a number of factors including historical operating results, known and anticipated trends as well as market and economic conditions.
We estimate the fair value of buildings acquired on an as-if-vacant basis or replacement cost basis and depreciate the building value over the estimated remaining life of the building, generally not to exceed 35 years. We determine the fair value of other fixed assets, such as site improvements and furniture, fixtures and equipment, based upon the replacement cost and depreciate such value over the assets’ estimated remaining useful lives as determined at the applicable acquisition date. We determine the value of land either by considering the sales prices of similar properties in recent transactions or based on internal analyses of recently acquired and existing comparable properties within our portfolio. We generally determine the value of construction in progress based upon the replacement cost. However, for certain acquired properties that are part of a ground-up development, we determine fair value by using the same valuation approach as for all other properties and deducting the estimated cost to complete the development. During the remaining construction period, we capitalize project costs until the development has reached substantial completion. Construction in progress, including capitalized interest, is not depreciated until the development has reached substantial completion.
Intangibles primarily include the value of in-place leases and acquired lease contracts. We include all lease-related intangible assets and liabilities within acquired lease intangibles and accounts payable and other liabilities, respectively, on our Consolidated Balance Sheets.
The fair value of acquired lease-related intangibles, if any, reflects: (i) the estimated value of any above or below market leases, determined by discounting the difference between the estimated market rent and in-place lease rent; and (ii) the estimated value of in-place leases related to the cost to obtain tenants, including leasing commissions, and an estimated value of the absorption period to reflect the value of the rent and recovery costs foregone during a reasonable lease-up period as if the acquired space was vacant. We amortize any acquired lease-related intangibles to revenue or amortization expense over the remaining life of the associated lease plus any assumed bargain renewal periods. If a lease is terminated prior to its stated expiration or not renewed upon expiration, we recognize all unamortized amounts of lease-related intangibles associated with that lease in operations over the shortened lease term.
We estimate the fair value of purchase option intangible assets and liabilities, if any, by discounting the difference between the applicable property’s acquisition date fair value and an estimate of its future option price. We do not amortize the resulting intangible asset or liability over the term of the lease, but rather adjust the recognized value of the asset or liability upon sale.
In connection with an acquisition, we may assume rights and obligations under certain lease agreements pursuant to which we become the lessee of a given property. We generally assume the lease classification previously determined by the prior lessee absent a modification in the assumed lease agreement. We assess assumed operating leases, including ground leases, to determine whether the lease terms are favorable or unfavorable to us given current market conditions on the acquisition date. To the extent the lease terms are favorable or unfavorable to us relative to market conditions on the acquisition date, we recognize an intangible asset or liability at fair value and amortize that asset or liability to interest or rental expense in our Consolidated Statements of Income over the applicable lease term. Where we are the lessee, we record the acquisition date values of leases, including any above or below market value, within operating lease assets and operating lease liabilities on our Consolidated Balance Sheets.
We estimate the fair value of noncontrolling interests assumed consistent with the manner in which we value all of the underlying assets and liabilities.
We calculate the fair value of long-term assumed debt by discounting the remaining contractual cash flows on each instrument at the current market rate for those borrowings, which we approximate based on the rate at which we would expect to incur a replacement instrument on the date of acquisition, and recognize any fair value adjustments related to long-term debt as effective yield adjustments over the remaining term of the instrument.
Impairment of Long-Lived and Intangible Assets
We periodically evaluate our long-lived assets, primarily consisting of investments in real estate, for impairment indicators. If indicators of impairment are present, we evaluate the carrying value of the related real estate investments in relation to the future undiscounted cash flows of the underlying operations. In performing this evaluation, we consider market
conditions and our current intentions with respect to holding or disposing of the asset. We adjust the net book value of real estate properties and other long-lived assets to fair value if the sum of the expected future undiscounted cash flows, including sales proceeds, is less than book value. We recognize an impairment loss at the time we make any such determination.
Estimates of fair value used in our evaluation of investments in real estate are based upon an income approach, if necessary, or other acceptable valuation techniques that are based, in turn, upon all available evidence including level three inputs, such as net operating income, revenue and expense growth rates, estimates of future cash flows, capitalization rates, discount rates, general economic conditions and trends, or other available market data such as replacement cost or comparable sales. Our ability to accurately predict future operating results and cash flows and to estimate and determine fair values impacts the timing and recognition of impairments. While we believe our assumptions are reasonable, changes in these assumptions may have a material impact on our financial results.
Accounting for Foreclosed Properties
The Company may receive properties pursuant to a foreclosure, deed in lieu of foreclosure or other legal action in full or partial settlement of loans receivable by taking legal title or physical possession of the properties. We refer to such actions as a “foreclosure” and to such properties as “foreclosed properties.” We account for foreclosed properties received in settlement of loans receivable in accordance with ASC 310, Receivables. Foreclosed real estate received in full or partial satisfaction of a loan and any debt assumed upon foreclosure is recorded at fair value at the time of foreclosure. If the amortized cost basis in the loan exceeds the fair value of the collateral received, the difference is recorded as an allowance on loans receivable and investments in the Consolidated Statements of Income. Conversely, if the fair value of the collateral received is higher than the amortized cost basis in the loan, the difference, less the fair value of any debt assumed, less the principal amount of the loan receivable (after the reversal of previously recorded allowances), and net of working capital assumed and transaction costs, is recorded as a gain on foreclosure of real estate in the Consolidated Statements of Income.
Recent Accounting Standards
In December 2023, the FASB issued Accounting Standards Update 2023-09, Improvements to Income Tax Disclosures (“ASU 2023-09”), which requires public entities on an annual basis to (1) disclose specific categories in the rate reconciliation and (2) provide additional information for reconciling items that meet a quantitative threshold (if the effect of those reconciling items is equal to or greater than 5 percent of the amount computed by multiplying pretax income or loss by the applicable statutory income tax rate). ASU 2023-09 is effective for fiscal years beginning after December 15, 2024. We are evaluating the impact of adopting ASU 2023-09 on our Consolidated Financial Statements.
In March 2024, the SEC adopted the final rule under SEC Release No. 33-11275, The Enhancement and Standardization of Climate Related Disclosures for Investors, which requires registrants to disclose climate-related information in registration statements and annual reports. The new rules would be effective for annual reporting periods beginning in fiscal year 2025. However, in April 2024, the SEC exercised its discretion to stay these rules pending the completion of judicial review of certain consolidated petitions with the United States Court of Appeals for the Eighth Circuit in connection with these rules. We are evaluating the impact of this rule on our Consolidated Financial Statements.
On November 4, 2024, the FASB issued ASU 2024-03, Disaggregation of Income Statement Expenses (DISE), which requires disaggregated disclosure of income statement expenses for public business entities (PBEs). ASU 2024-03 requires a footnote disclosure about specific expenses by requiring PBEs to disaggregate, in a tabular presentation, each relevant expense caption on the face of the income statement that includes certain natural expenses relevant to the Company, such as (1) employee compensation, (2) depreciation and (3) intangible asset amortization. The tabular disclosure would also include certain other expenses, when applicable. The ASU does not change the expense captions an entity presents on the face of the income statement; rather, it requires disaggregation of certain expense captions into specified categories in disclosures within the footnotes to the financial statements. ASU 2024-03 is effective for annual reporting periods beginning after December 15, 2026 and interim reporting periods beginning after December 15, 2027. The requirements will be applied prospectively with the option for retrospective application. We are evaluating the impact of adopting ASU 2024-03 on our Consolidated Financial Statements.
Results of Operations
As of December 31, 2024, we operated through three reportable business segments: SHOP, OM&R and NNN. In our SHOP segment, we own and invest in senior housing communities throughout the United States and Canada and engage operators to operate those communities. In our OM&R segment, we primarily acquire, own, develop, lease and manage outpatient medical buildings and research centers throughout the United States. In our NNN segment, we invest in and own senior housing communities, skilled nursing facilities (“SNFs”), long-term acute care facilities (“LTACs”), freestanding inpatient rehabilitation facilities (“IRFs”) and other healthcare facilities, throughout the United States and the United Kingdom and lease these properties to tenants under triple-net or absolute-net leases that obligate the tenants to pay all property-related expenses, including maintenance, utilities, repairs, taxes, insurance and capital expenditures. Information provided for “non-segment” includes management fees and promote revenues, net of expenses related to our third-party institutional private capital management platform, income from loans and investments and corporate-level expenses not directly attributable to any of our three reportable business segments. Non-segment assets consist primarily of corporate assets, including cash and cash equivalents, restricted cash, loans receivable and investments and accounts receivable. Non-segment assets also include our investments in unconsolidated entities, including investments in unconsolidated real estate entities through our third-party institutional private capital management platform, VIM, and investments in unconsolidated operating entities, such as Ardent and Atria. Through VIM, we partner with third-party institutional investors to invest in real estate through various joint ventures and other co-investment vehicles. Non-segment assets also include other assets, such as our Brookdale and Kindred Warrants.
Our chief operating decision maker (“CODM”) is the Chief Executive Officer of the Company. Our CODM evaluates performance of the combined properties in each reportable business segment and determines how to allocate resources to those segments based on NOI for each segment. For further information regarding our reportable business segments and a discussion of our definition of NOI, see “Note 18 – Segment Information” of the Notes to Consolidated Financial Statements included in Part II, Item 8 of this Annual Report.
Years Ended December 31, 2024 and 2023
The table below shows our results of operations for the years ended December 31, 2024 and 2023 and the effect of changes in those results from period to period on our net income attributable to common stockholders (dollars in thousands):
| | | | | | | | | | | | | | | | | | | | | | | |
| | For the Years Ended
December 31, | | Increase (Decrease) to
Net Income |
| | 2024 | | 2023 | | $ | | % |
| NOI: | | | | | | | |
| SHOP | $ | 866,383 | | | $ | 711,407 | | | $ | 154,976 | | | 21.8 | % |
| OM&R | 579,271 | | | 576,932 | | | 2,339 | | | 0.4 | |
| NNN | 606,225 | | | 604,651 | | | 1,574 | | | 0.3 | |
| Non-segment | 17,204 | | | 32,177 | | | (14,973) | | | (46.5) | |
| Total NOI | 2,069,083 | | | 1,925,167 | | | 143,916 | | | 7.5 | |
| Interest and other income | 28,114 | | | 11,414 | | | 16,700 | | | 146.3 | |
| Interest expense | (602,835) | | | (574,112) | | | (28,723) | | | (5.0) | |
| Depreciation and amortization | (1,253,143) | | | (1,392,461) | | | 139,318 | | | 10.0 | |
| General, administrative and professional fees | (162,990) | | | (148,876) | | | (14,114) | | | (9.5) | |
| (Loss) gain on extinguishment of debt, net | (687) | | | 6,104 | | | (6,791) | | | (111.3) | |
| Transaction, transition and restructuring costs | (20,369) | | | (15,215) | | | (5,154) | | | (33.9) | |
| Reversal of allowance on loans receivable and investments, net | 166 | | | 20,270 | | | (20,104) | | | (99.2) | |
| Gain on foreclosure of real estate | — | | | 29,127 | | | (29,127) | | | 100.0 | |
| Shareholder relations matters | (15,751) | | | — | | | (15,751) | | | (100.0) | |
| Other (expense) income | (49,584) | | | 23,001 | | | (72,585) | | | nm |
| Loss before unconsolidated entities, real estate dispositions, income taxes and noncontrolling interests | (7,996) | | | (115,581) | | | 107,585 | | | 93.1 | |
| Income from unconsolidated entities | 1,563 | | | 13,626 | | | (12,063) | | | (88.5) | |
| Gain on real estate dispositions | 57,009 | | | 62,119 | | | (5,110) | | | (8.2) | |
| Income tax benefit | 37,775 | | | 9,539 | | | 28,236 | | | nm |
| | | | | | | |
| | | | | | | |
| Net income (loss) | 88,351 | | | (30,297) | | | 118,648 | | | nm |
| Net income attributable to noncontrolling interests | 7,198 | | | 10,676 | | | (3,478) | | | (32.6) | |
| Net income (loss) attributable to common stockholders | $ | 81,153 | | | $ | (40,973) | | | $ | 122,126 | | | nm |
______________________________
nm - not meaningful
NOI—SHOP Segment
The following table summarizes results of operations in our SHOP segment as of December 31, 2024 (dollars in thousands):
| | | | | | | | | | | | | | | | | | | | | | | |
| For the Years Ended
December 31, | | Increase (Decrease) to NOI |
| 2024 | | 2023 | | $ | | % |
| NOI—SHOP: | | | | | | | |
| Resident fees and services | $ | 3,372,796 | | | $ | 2,959,219 | | | $ | 413,577 | | | 14.0 | % |
| Less: Property-level operating expenses | (2,506,413) | | | (2,247,812) | | | (258,601) | | | (11.5) | |
| NOI | $ | 866,383 | | | $ | 711,407 | | | $ | 154,976 | | | 21.8 | % |
| | | | | | | | | | | | | | | | | | | | | | | | | | | | | | | | | | | |
| Segment Properties at December 31, | | Average Unit
Occupancy
for the Years Ended
December 31, | | Average Monthly Revenue Per Occupied Room for
the Years Ended
December 31, |
| 2024 | | 2023 | | 2024 | | 2023 | | 2024 | | 2023 |
| Total communities | 629 | | | 587 | | | 84.5 | % | | 81.4 | % | | $ | 4,923 | | | $ | 4,684 | |
Resident fees and services include all amounts earned from residents at our senior housing communities, such as rental fees related to resident leases, extended healthcare fees and other ancillary service income. Property-level operating expenses related to our SHOP segment include labor, food, utilities, real estate taxes, insurance, repairs and maintenance, marketing, management fees, supplies and other costs of operating the properties. For senior housing communities in our SHOP segment, occupancy generally reflects average operator-reported unit occupancy for the reporting period. Average monthly revenue per occupied room reflects average resident fees and services per operator-reported occupied unit for the reporting period.
The increase in our SHOP segment NOI in 2024 over the prior year was driven by positive trends in revenue driven by gains in occupancy and revenue per occupied room, the addition of communities acquired in our SHOP segment and conversions of senior housing communities from our NNN segment to our SHOP segment. The revenue increase is partially offset by higher operating expenses in 2024, driven by an increase in the number of communities in our SHOP segment and an increase in occupancy.
The following table compares results of operations for our 472 same-store SHOP communities (dollars in thousands). See “Non-GAAP Financial Measures—NOI” included elsewhere in this Annual Report for additional disclosure regarding same-store NOI for each of our reportable business segments.
| | | | | | | | | | | | | | | | | | | | | | | |
| For the Years Ended
December 31, | | Increase (Decrease) to NOI |
| 2024 | | 2023 | | $ | | % |
| Same-Store NOI—SHOP: | | | | | | | |
| Resident fees and services | $ | 2,764,175 | | | $ | 2,554,227 | | | $ | 209,948 | | | 8.2 | % |
| Less: Property-level operating expenses | (2,012,969) | | | (1,905,495) | | | (107,474) | | | (5.6) | |
| NOI | $ | 751,206 | | | $ | 648,732 | | | $ | 102,474 | | | 15.8 | % |
| | | | | | | | | | | | | | | | | | | | | | | | | | | | | | | | | | | |
| Segment Properties at December 31, | | Average Unit
Occupancy
for the Years Ended
December 31, | | Average Monthly Revenue Per Occupied Room for
the Years Ended
December 31, |
| 2024 | | 2023 | | 2024 | | 2023 | | 2024 | | 2023 |
| Same-store communities | 472 | | | 472 | | | 86.4 | % | | 83.4 | % | | $ | 4,917 | | | $ | 4,709 | |
The increase in our same-store SHOP segment NOI in 2024 was primarily driven by positive trends in occupancy and revenue per occupied room in 2024, partially offset by higher operating expenses driven by an increase in occupancy.
NOI—OM&R Segment
The following table summarizes results of operations in our OM&R segment as of December 31, 2024 (dollars in thousands). For properties in our OM&R segment, occupancy generally reflects occupied square footage divided by net rentable square footage as of the end of the reporting period.
| | | | | | | | | | | | | | | | | | | | | | | |
| For the Years Ended
December 31, | | Increase (Decrease) to NOI |
| 2024 | | 2023 | | $ | | % |
| NOI—OM&R: | | | | | | | |
| Rental income | $ | 874,886 | | | $ | 867,193 | | | $ | 7,693 | | | 0.9 | % |
| Third-party capital management revenues | 2,705 | | | 2,515 | | | 190 | | | 7.6 | |
| Total revenues | 877,591 | | | 869,708 | | | 7,883 | | | 0.9 | |
| Less: | | | | | | | |
| Property-level operating expenses | (298,320) | | | (292,776) | | | (5,544) | | | (1.9) | |
| | | | | | | |
| NOI | $ | 579,271 | | | $ | 576,932 | | | $ | 2,339 | | | 0.4 | % |
| | | | | | | | | | | | | | | | | | | | | | | | | | | | | | | | | | | |
| Segment Properties at December 31, | | Occupancy at
December 31, | | Annualized Average Rent Per Occupied Square Foot for the Years Ended December 31, |
| 2024 | | 2023 | | 2024 | | 2023 | | 2024 | | 2023 |
| Total OM&R | 426 | | | 437 | | | 88.3 | % | | 87.7 | % | | $ | 37 | | | $ | 37 | |
The increase in our OM&R segment NOI in 2024 over the prior year was primarily due to properties acquired in May 2023, favorable leasing activity, improved parking revenues and a development project placed in service, partially offset by dispositions.
The following table compares results of operations for our 337 same-store OM&R (dollars in thousands):
| | | | | | | | | | | | | | | | | | | | | | | |
| For the Years Ended
December 31, | | Increase (Decrease) to NOI |
| 2024 | | 2023 | | $ | | % |
| Same-Store NOI—OM&R: | | | | | | | |
| Rental income | $ | 747,910 | | | $ | 729,864 | | | $ | 18,046 | | | 2.5 | % |
| Less: Property-level operating expenses | (240,497) | | | (231,803) | | | (8,694) | | | (3.8) | |
| NOI | $ | 507,413 | | | $ | 498,061 | | | $ | 9,352 | | | 1.9 | % |
| | | | | | | | | | | | | | | | | | | | | | | | | | | | | | | | | | | |
| Segment Properties at December 31, | | Occupancy at
December 31, | | Annualized Average Rent Per Occupied Square Foot for the Years Ended December 31, |
| 2024 | | 2023 | | 2024 | | 2023 | | 2024 | | 2023 |
| Same-store OM&R | 337 | | | 337 | | | 91.1 | % | | 91.1 | % | | $ | 38 | | | $ | 37 | |
The increase in our same-store OM&R segment NOI in 2024 over the prior year is primarily due to favorable leasing activity. high tenant retention at higher rates and improved parking revenues.
NOI—NNN Segment
The following table summarizes results of operations in our 301 NNN segment as of December 31, 2024 (dollars in thousands):
| | | | | | | | | | | | | | | | | | | | | | | |
| | For the Years Ended
December 31, | | Increase (Decrease) to NOI |
| | 2024 | | 2023 | | $ | | % |
| NOI—NNN: | | | | | | | |
| Rental income | $ | 622,054 | | | $ | 619,208 | | | $ | 2,846 | | | 0.5 | % |
| | | | | | | |
| Less: Property-level operating expenses | (15,829) | | | (14,557) | | | (1,272) | | | (8.7) | |
| NOI | $ | 606,225 | | | $ | 604,651 | | | $ | 1,574 | | | 0.3 | % |
In our NNN segment, our revenues generally consist of fixed rental amounts (subject to contractual escalations) received from our tenants in accordance with the applicable lease terms. We report revenues and property-level operating expenses within our NNN segment for real estate tax and insurance expenses that are paid from escrows collected from our tenants.
The increase in our NNN segment NOI in 2024 over the prior year was primarily driven by a $18 million increase from acquisitions, a $10 million net increase in contractual rent escalators, partially offset by a $16 million decrease in rental income from communities that converted to our SHOP segment, a $6 million decrease from dispositions and a $4 million decrease due to additional rental income received in 2023.
Occupancy rates may affect the profitability of our tenants’ operations. For senior housing communities and post-acute properties in our NNN segment, occupancy generally reflects average operator-reported unit and bed occupancy, respectively, for the reporting period. Because triple-net financials are delivered to us following the reporting period, occupancy is reported in arrears. The following table sets forth average continuing occupancy rates related to the triple-net leased properties we owned at December 31, 2024 and measured over the trailing 12 months ended September 30, 2024 (which is the most recent information available to us from our tenants) and average continuing occupancy rates related to the triple-net leased properties we owned at December 31, 2023 and measured over the 12 months ended September 30, 2023. The Segment Properties in the table below excludes non-stabilized properties, certain properties for which we do not receive occupancy information and properties acquired or properties that transitioned operators for which we do not have a full four quarters of occupancy results.
| | | | | | | | | | | | | | | | | | | | | | | | | | |
| Number of Properties Owned at December 31, 2024 | | Average Occupancy for the Trailing 12 Months Ended September 30, 2024 | | | Number of Properties Owned at December 31, 2023 | | Average Occupancy for the Trailing 12 Months Ended September 30, 2023 |
| Senior housing communities | 190 | | | 78.7 | % | | | 223 | | | 77.4 | % |
| SNFs | 18 | | | 84.7 | | | | 16 | | | 83.6 | |
| IRFs and LTACs | 34 | | | 54.8 | | | | 36 | | | 54.3 | |
The following table compares results of operations for our 265 same-store NNN segment (dollars in thousands):
| | | | | | | | | | | | | | | | | | | | | | | |
| | For the Years Ended
December 31, | | Increase (Decrease) to NOI |
| | 2024 | | 2023 | | $ | | % |
| Same-Store NOI—NNN: | | | | | | | |
| Rental income | $ | 573,845 | | | $ | 567,011 | | | $ | 6,834 | | | 1.2 | % |
| Less: Property-level operating expenses | (14,604) | | | (12,749) | | | (1,855) | | | (14.6) | |
| NOI | $ | 559,241 | | | $ | 554,262 | | | $ | 4,979 | | | 0.9 | % |
The increase in our same-store NNN segment rental income in 2024 over the prior year was attributable primarily to a $10 million net increase in contractual rent escalators, partially offset by $4 million of additional rental income received in 2023.
NOI — Non-Segment
Non-segment NOI includes management fees and promote revenues, net of expenses, related to our third-party institutional private capital management platform, income from loans and investments and corporate-level expenses not directly attributable to any of our three reportable business segments. The $15.0 million decrease in non-segment NOI in 2024 over the prior year was primarily due to a $17.9 million decrease in interest income due to the conversion of the outstanding principal amount of a loan to equity in May 2023, partially offset by interest income from a new secured debt financing provided in September 2024. See “Note 6 – Loans Receivable and Investments” and “Note 7 – Investments in Unconsolidated Entities” of the Notes to Consolidated Financial Statements included in Part II, Item 8 of this Annual Report.
Company Results
Interest and other income
The $16.7 million increase in interest and other income in 2024 over the prior year was primarily due to interest income earned on a higher invested cash balance as a result of pre-funding debt issuance activities ahead of certain debt maturities.
Interest expense
The $28.7 million increase in interest expense, net of higher capitalized interest of $3.3 million, in 2024 over the prior year was primarily attributable to an increase of $23.9 million due to a higher effective interest rate and $18.9 million due to higher average debt balances. Our weighted average effective interest rate was 4.41% for 2024, compared to 4.23% for 2023. Our weighted average debt outstanding was $13.5 billion for 2024, compared to $13.1 billion for 2023. The higher weighted average debt balance for 2024 compared to 2023 was primarily attributable to pre-funding debt issuance activities ahead of certain debt maturities. Capitalized interest for 2024 and 2023 was $15.6 million and $12.3 million, respectively.
Depreciation and amortization
The $139.3 million decrease in depreciation and amortization expense in 2024 over the prior year was primarily due to a $189.1 million decrease in impairments recognized in 2024 compared to 2023 related to properties that were sold or classified as held for sale.
General, administrative and professional fees
The $14.1 million increase in general, administrative and professional fees in 2024 over the prior year was primarily due to our expanded employee base consistent with enterprise growth and inflationary increases.
(Loss) gain on extinguishment of debt, net
The $6.8 million decrease in gain on extinguishment of debt, net in 2024 over the prior year was primarily related to $8.3 million of gain recognized as a result of cash tender offers in 2023.
Transaction, transition and restructuring costs
The $5.2 million increase in transaction, transition and restructuring costs in 2024 over the prior year was primarily due to costs incurred in connection with the amendment of the Kindred Master Lease.
Reversal of allowance on loans receivable and investments, net
In May 2023, we reversed a $20.0 million allowance previously recorded. This item did not recur in 2024.
Gain on foreclosure of real estate
The gain of $29.1 million for the year ended December 31, 2023 was recorded in connection with our equitization of a mezzanine loan in May 2023. This item did not recur in 2024.
Shareholder relations matters
Shareholder relations matters of $15.8 million for the year ended December 31, 2024 relates to proxy advisory costs related to our response to a proxy campaign associated with the Company’s 2024 annual meeting. There were no such costs incurred for the year ended December 31, 2023.
Other (expense) income
The $72.6 million change from $23.0 million other income in 2023 to $49.6 million other expense in 2024 was primarily due to a $46.7 million change in the fair value of stock warrants, a $14.1 million decrease in insurance reimbursements received in 2024, a $6.6 million increase in insurance expense and a $3.2 million increase in damages caused by significant disruptive events. For the year ended December 31, 2024 and 2023, we recognized unrealized loss of $11.0 million and unrealized gain of $35.7 million, respectively, relating to the change in fair value of stock warrants.
Income from unconsolidated entities
The $12.1 million decrease in income from unconsolidated entities for 2024 over the prior year was primarily due to a $33.5 million gain recognized upon the sale of approximately 24% of our 9.8% ownership interest in Ardent in May 2023, partially offset by $11.0 million increase in income from Ardent in 2024 and a $8.7 million gain recognized following the Ardent IPO in July 2024 and the resulting decrease in our equity stake from 7.5% to approximately 6.7%.
Gain on real estate dispositions
The $5.1 million decrease in gain on real estate dispositions was due to a gain of $62.1 million recognized in 2023 compared to a gain of $57.0 million in 2024.
Income tax benefit
The 2024 income tax benefit is primarily due to losses in certain of our TRS entities and a $28.6 million change in valuation allowance due to purchase accounting activity. The 2023 income tax benefit is primarily due to losses in certain of our TRS entities and a $3.2 million benefit from internal restructurings of U.S. TRS entities.
Years Ended December 31, 2023 and 2022
Our Annual Report for the year ended December 31, 2023, filed with the SEC on February 15, 2024, contains information regarding our results of operations for the years ended December 31, 2023 and 2022 and the effect of changes in those results from period to period on our net income attributable to common stockholders.
Non-GAAP Financial Measures
We consider certain non-GAAP financial measures to be useful supplemental measures of our operating performance. A non-GAAP financial measure is a measure of historical or future financial performance, financial position or cash flows that excludes or includes amounts that are not so excluded from or included in the most directly comparable measure calculated and presented in accordance with GAAP. Described below are the non-GAAP financial measures used by management to evaluate our operating performance and that we consider most useful to investors, together with reconciliations of these measures to the most directly comparable GAAP measures.
The non-GAAP financial measures we present in this Annual Report may not be comparable to those presented by other real estate companies due to the fact that not all real estate companies use the same definitions. You should not consider these measures as alternatives for, or superior to, financial measures calculated in accordance with GAAP. In order to facilitate a clear understanding of our consolidated historical operating results, you should examine these measures in conjunction with the most directly comparable GAAP measures as presented in our Consolidated Financial Statements and other financial data included elsewhere in this Annual Report.
Nareit Funds From Operations and Normalized Funds From Operations Attributable to Common Stockholders
Historical cost accounting for real estate assets implicitly assumes that the value of real estate assets diminishes predictably over time. However, since real estate values historically have risen or fallen with market conditions, many industry investors deem presentations of operating results for real estate companies that use historical cost accounting to be insufficient by themselves. For that reason, we consider Nareit Funds From Operations attributable to common stockholders (“FFO”) and Normalized FFO attributable to common stockholders (“Normalized FFO”) to be appropriate supplemental measures of operating performance of an equity REIT. We believe that the presentation of FFO, combined with the presentation of required GAAP financial measures, has improved the understanding of operating results of REITs among the investing public and has helped make comparisons of REIT operating results more meaningful. Management generally considers FFO to be a useful measure for understanding and comparing our operating results because, by excluding gains and losses related to sales of previously depreciated operating real estate assets, impairment losses on depreciable real estate and real estate asset depreciation and amortization (which can differ across owners of similar assets in similar condition based on historical cost accounting and useful life estimates), FFO can help investors compare the operating performance of a company’s real estate across reporting periods and to the operating performance of other companies. We believe that Normalized FFO is useful because it allows investors, analysts and our management to compare our operating performance to the operating performance of other real estate companies across periods on a consistent basis without having to account for differences caused by non-recurring items and other non-operational events such as transactions and litigation. In some cases, we provide information about identified non-cash components of FFO and Normalized FFO because it allows investors, analysts and our management to assess the impact of those items on our financial results.
We use the National Association of Real Estate Investment Trusts (“Nareit”) definition of FFO. Nareit defines FFO as net income attributable to common stockholders (computed in accordance with GAAP) excluding gains (or losses) from sales of real estate property, including gain (or loss) on re-measurement of equity method investments and impairment write-downs of depreciable real estate, plus real estate depreciation and amortization, and after adjustments for unconsolidated entities and noncontrolling interests. Adjustments for unconsolidated entities and noncontrolling interests will be calculated to reflect FFO on the same basis. We define Normalized FFO as Nareit FFO excluding the following income and expense items, without duplication: (a) gains and losses on derivatives, net and changes in the fair value of financial instruments; (b) the non-cash impact of income tax benefits or expenses; (c) gains and losses on extinguishment of debt, net including the write-off of unamortized deferred financing fees or additional costs, expenses, discounts, make-whole payments, penalties or premiums incurred as a result of early retirement or payment of our debt; (d) transaction, transition and restructuring costs; (e) amortization of other intangibles; (f) the non-cash impact of changes to our executive equity compensation plan; (g) net expenses or recoveries related to significant disruptive events; (h) the impact of expenses related to asset impairment and valuation allowances; (i) non-cash charges related to leases; (j) the financial impact of contingent consideration; (k) gains and losses on non-real estate dispositions and other normalizing items related to noncontrolling interests and unconsolidated entities; and (l) other items set forth in the Normalized FFO reconciliation included herein.
The following table summarizes our FFO and Normalized FFO for the three years ended December 31, 2024, 2023, and 2022 (dollars in thousands):
| | | | | | | | | | | | | | | | | |
| | For the Years Ended December 31, |
| | 2024 | | 2023 | | 2022 |
| Net income (loss) attributable to common stockholders | $ | 81,153 | | | $ | (40,973) | | | $ | (47,447) | |
| Adjustments: | | | | | |
| Depreciation and amortization on real estate assets | 1,250,453 | | | 1,390,025 | | | 1,194,751 | |
| Depreciation on real estate assets related to noncontrolling interests | (15,113) | | | (16,657) | | | (17,451) | |
| Depreciation on real estate assets related to unconsolidated entities | 49,170 | | | 44,953 | | | 30,940 | |
| Gain on real estate dispositions | (57,009) | | | (62,119) | | | (7,780) | |
| Gain on real estate dispositions related to noncontrolling interests | 9 | | | 6,685 | | | 32 | |
| | | | | |
| | | | | |
| Gain on real estate dispositions and other related to unconsolidated entities | (3,216) | | | (180) | | | (14,546) | |
| | | | | |
| | | | | |
| Nareit FFO attributable to common stockholders | 1,305,447 | | | 1,321,734 | | | 1,138,499 | |
| Adjustments: | | | | | |
| Loss (gain) on derivatives, net | 11,942 | | | (32,076) | | | 23,615 | |
| Non-cash impact of income tax benefit | (43,486) | | | (15,269) | | | (21,349) | |
| Loss (gain) on extinguishment of debt, net | 687 | | | (6,104) | | | 581 | |
| Transaction, transition and restructuring costs | 20,369 | | | 15,215 | | | 30,884 | |
| Amortization of other intangibles | 400 | | | 385 | | | 385 | |
| Non-cash impact of changes to executive equity compensation plan | 180 | | | 161 | | | (312) | |
| Significant disruptive events, net | 8,230 | | | (5,339) | | | 12,451 | |
| (Reversal of) allowance on loans receivable and investments, net | (166) | | | (20,270) | | | 19,757 | |
| | | | | |
| | | | | |
| Normalizing items related to noncontrolling interests and unconsolidated entities, net | (2,012) | | | (25,683) | | | (18,233) | |
Other normalizing items, net (1) | $ | 25,856 | | | $ | (20,870) | | | $ | 20,693 | |
| Normalized FFO attributable to common stockholders | $ | 1,327,447 | | | $ | 1,211,884 | | | $ | 1,206,971 | |
______________________________
(1) For the year ended December 31, 2024, primarily related to shareholder relations matters and certain legal matters. For the year ended December 31, 2023, primarily related to gain on foreclosure of real estate, payment obligation arising in connection with sale of real estate and certain legal matters. For the year ended December 31, 2022, primarily related to shareholder relations matters.
NOI
We also consider NOI an important supplemental measure because it allows investors, analysts and our management to assess our unlevered property-level operating results and to compare our operating results with those of other real estate companies and between periods on a consistent basis. We define NOI as total revenues, less interest and other income, property-level operating expenses and third-party capital management expenses.
The following table sets forth a reconciliation of net income attributable to common stockholders to NOI (dollars in thousands):
| | | | | | | | | | | | | | | | | |
| | For the Years Ended December 31, |
| | 2024 | | 2023 | | 2022 |
| | | | | |
| | | | | |
| | | | | |
| | | | | |
| Net income (loss) attributable to common stockholders | $ | 81,153 | | | $ | (40,973) | | | $ | (47,447) | |
| Adjustments: | | | | | |
| Interest and other income | (28,114) | | | (11,414) | | | (3,635) | |
| Interest expense | 602,835 | | | 574,112 | | | 467,557 | |
| Depreciation and amortization | 1,253,143 | | | 1,392,461 | | | 1,197,798 | |
| General, administrative and professional fees | 162,990 | | | 148,876 | | | 144,874 | |
| Loss (gain) on extinguishment of debt, net | 687 | | | (6,104) | | | 581 | |
| Transaction, transition and restructuring costs | 20,369 | | | 15,215 | | | 30,884 | |
| (Reversal of) allowance on loans receivable and investments, net | (166) | | | (20,270) | | | 19,757 | |
| Gain on foreclosure of real estate | — | | | (29,127) | | | — | |
| | | | | |
| Shareholder relations matters | 15,751 | | | — | | | 20,693 | |
| Other expense (income) | 49,584 | | | (23,001) | | | 58,268 | |
| Net income attributable to noncontrolling interests | 7,198 | | | 10,676 | | | 6,516 | |
| Income from unconsolidated entities | (1,563) | | | (13,626) | | | (28,500) | |
| Income tax benefit | (37,775) | | | (9,539) | | | (16,926) | |
| Gain on real estate dispositions | (57,009) | | | (62,119) | | | (7,780) | |
| NOI | $ | 2,069,083 | | | $ | 1,925,167 | | | $ | 1,842,640 | |
See “Results of Operations” for discussions regarding both NOI and same-store NOI. We define same-store as properties owned, consolidated and operational for the full period in both comparison periods and that are not otherwise excluded; provided, however, that we may include selected properties that otherwise meet the same-store criteria if they are included in substantially all of, but not a full, period for one or both of the comparison periods, and in our judgment such inclusion provides a more meaningful presentation of our segment performance.
Newly acquired development properties and recently developed or redeveloped properties in our SHOP reportable business segment will be included in same-store once they are stabilized for the full period in both periods presented. These properties are considered stabilized upon the earlier of (a) the achievement of 80% sustained occupancy or (b) 24 months from the date of acquisition or substantial completion of work. Recently developed or redeveloped properties in our OM&R and NNN reportable business segments will be included in same-store once substantial completion of work has occurred for the full period in both periods presented. Our SHOP and NNN that have undergone operator or business model transitions will be included in same-store once operating under consistent operating structures for the full period in both periods presented.
Properties are excluded from same-store if they are: (i) sold, classified as held for sale or properties whose operations were classified as discontinued operations in accordance with GAAP; (ii) impacted by significant disruptive events such as flood or fire; (iii) for SHOP, those properties that are currently undergoing a significant disruptive redevelopment; (iv) for OM&R and NNN reportable business segments, those properties for which management has an intention to institute, or has instituted, a redevelopment plan because the properties may require major property-level expenditures to maximize value, increase NOI, or maintain a market-competitive position and/or achieve property stabilization, most commonly as the result of an expected or actual material change in occupancy or NOI; or (v) for SHOP and NNN reportable business segments, those properties that are scheduled to undergo operator or business model transitions, or have transitioned operators or business models after the start of the prior comparison period.
To eliminate the impact of exchange rate movements, certain of our performance-based disclosures, including same-store NOI for SHOP and NNN, assume constant exchange rates across comparable periods, using the following methodology: the current period’s results are shown in actual reported USD, while prior comparison period’s results are adjusted and converted to USD based on the average monthly exchange rate for the current period.
Asset/Liability Management
Asset/liability management, a key element of enterprise risk management, is designed to support the achievement of our business strategy, while ensuring that we maintain appropriate and tolerable levels of market risk (primarily interest rate risk and foreign currency exchange risk) and credit risk. Effective management of these risks is a contributing factor to the absolute levels and variability of our FFO and net worth. The following discussion addresses our integrated management of assets and liabilities, including the use of derivative financial instruments.
Market Risk
We are primarily exposed to market risk related to changes in interest rates with respect to borrowings under our unsecured revolving credit facility, our unsecured term loans and our commercial paper program, certain of our mortgage loans that are variable rate obligations, mortgage loans receivable that bear interest at variable rates and available for sale securities. These market risks result primarily from changes in benchmark interest rates. To manage these risks, we continuously monitor our level of variable rate debt with respect to total debt and other factors, including our assessment of current and future economic conditions. See “Risk Factors—We are exposed to increases in interest rates, which could reduce our profitability and adversely impact our ability to refinance existing debt, sell assets or engage in acquisition, investment, development and redevelopment activity, and our decision to hedge against interest rate risk might not be effective” included in Part I, Item 1A of this Annual Report.
The table below sets forth certain information with respect to our debt, excluding premiums and discounts (dollars in thousands):
| | | | | | | | | | | | | | | | | |
| As of December 31, |
| 2024 | | 2023 | | 2022 |
| Balance: | | | | | |
| Fixed rate: | | | | | |
| Senior notes/Exchangeable senior notes | $ | 9,744,519 | | $ | 9,302,840 | | $ | 8,627,540 |
| Unsecured term loans | 400,000 | | 400,000 | | 200,000 |
| | | | | |
| Mortgage loans and other | 2,684,014 | | 2,755,988 | | 2,035,896 |
| Subtotal fixed rate | 12,828,533 | | 12,458,828 | | 10,863,436 |
| Variable rate: | | | | | |
| | | | | |
| Unsecured revolving credit facility | 6,397 | | 14,006 | | 25,230 |
| Unsecured term loans | 300,000 | | 677,501 | | 669,031 |
| Commercial paper notes | — | | — | | 403,000 |
| | | | | |
| Mortgage loans and other | 483,872 | | 418,263 | | 400,547 |
| Subtotal variable rate | 790,269 | | 1,109,770 | | 1,497,808 |
| Total | $ | 13,618,802 | | $ | 13,568,598 | | $ | 12,361,244 |
| Percentage of total debt: | | | | | |
| Fixed rate: | | | | | |
| Senior notes/Exchangeable senior notes | 71.6 | % | | 68.6 | % | | 69.8 | % |
| Unsecured term loans | 2.9 | | | 2.9 | | | 1.6 | |
| | | | | |
| Mortgage loans and other | 19.7 | | | 20.3 | | | 16.5 | |
| Variable rate: | | | | | |
| Unsecured revolving credit facility | — | | | 0.1 | | | 0.2 | |
| Unsecured term loans | 2.2 | | | 5.0 | | | 5.4 | |
| Commercial paper notes | — | | | — | | | 3.3 | |
| | | | | |
| Mortgage loans and other | 3.6 | | | 3.1 | | | 3.2 | |
| Total | 100.0 | % | | 100.0 | % | | 100.0 | % |
| Weighted average interest rate at end of period: | | | | | |
| Fixed rate: | | | | | |
| Senior notes/Exchangeable senior notes | 4.1 | % | | 3.8 | % | | 3.7 | % |
| Unsecured term loans | 4.7 | | | 4.7 | | | 3.6 | |
| | | | | |
| Mortgage loans and other | 4.3 | | | 4.2 | | | 3.7 | |
| Variable rate: | | | | | |
| Unsecured revolving credit facility | 5.3 | | | 6.1 | | | 4.5 | |
| Unsecured term loans | 5.3 | | | 6.3 | | | 5.5 | |
| Commercial paper notes | — | | | — | | | 4.7 | |
| | | | | |
| Mortgage loans and other | 5.1 | | | 6.1 | | | 5.1 | |
| Total | 4.2 | | | 4.1 | | | 3.9 | |
The variable rate debt as of December 31, 2024 in the table above reflects, in part, the effect of $141.3 million notional amount of interest rate swaps with maturities in March 2027, that effectively convert fixed rate debt to variable rate debt. In addition, the fixed rate debt as of December 31, 2024 in the table above reflects, in part, the effect of $526.5 million and C$635.9 million notional amount of interest rate swaps with maturities ranging from February 2025 to April 2031, in each case, that effectively convert variable rate debt to fixed rate debt. See “Note 10 – Senior Notes Payable and Other Debt” of the Notes to Consolidated Financial Statements included in Part II, Item 8 of this Annual Report.
The decrease in our outstanding variable rate debt as of December 31, 2024 compared to December 31, 2023 is primarily attributable to the repayment of a C$500.0 million ($369.4 million) unsecured term loan.
The increase in our outstanding fixed rate debt from December 31, 2024 compared to December 31, 2023 was primarily attributable to net issuances of senior notes.
Assuming a 100 basis point increase in the weighted average interest rate related to our consolidated variable rate debt and assuming no change in our consolidated variable rate debt outstanding as of December 31, 2024 of $0.8 billion, interest expense on an annualized basis would increase by approximately $7.9 million, or less than $0.02 per diluted common share.
As of December 31, 2024 and 2023, our joint venture partners’ aggregate share of total consolidated debt was $310.9 million and $297.5 million, respectively, with respect to certain properties we owned through consolidated joint ventures.
Total consolidated debt does not include our portion of unconsolidated debt related to investments in unconsolidated real estate entities, which was $676.8 million and $575.3 million as of December 31, 2024 and 2023, respectively.
The fair value of our fixed rate debt is based on current market interest rates at which we could obtain similar borrowings. Increases in market interest rates typically result in a decrease in the fair value of fixed rate debt while decreases in market interest rates typically result in an increase in the fair value of fixed rate date. While changes in market interest rates affect the fair value of our fixed rate debt, these changes do not affect the interest expense associated with our fixed rate debt. Therefore, interest rate risk does not have a significant impact on our fixed rate debt obligations until their maturity or earlier prepayment and refinancing. If interest rates have risen at the time we seek to refinance our fixed rate debt, whether at maturity or otherwise, our future earnings and cash flows could be adversely affected by additional borrowing costs. Conversely, lower interest rates at the time of refinancing may reduce our overall borrowing costs.
To highlight the sensitivity of our fixed rate debt to changes in interest rates, the following summary shows the effects of a hypothetical instantaneous change of 100 basis points in interest rates (dollars in thousands):
| | | | | | | | | | | |
| As of December 31, |
| 2024 | | 2023 |
| Gross book value | $ | 12,828,533 | | | $ | 12,458,828 | |
| Fair value | 12,620,797 | | | 11,994,321 | |
| Fair value reflecting change in interest rates: | | | |
| -100 basis points | 13,078,684 | | | 12,457,648 | |
| +100 basis points | 12,158,222 | | | 11,568,461 | |
As of December 31, 2024 and 2023, the fair value of our secured and non-mortgage loans receivable, based on our estimates of currently prevailing rates for comparable loans, was $173.9 million and $53.1 million, respectively. See “Note 6 – Loans Receivable and Investments” and “Note 11 – Fair Values of Financial Instruments” of the Notes to Consolidated Financial Statements included in Part II, Item 8 of this Annual Report.
As a result of our Canadian and United Kingdom operations, we are subject to fluctuations in certain foreign currency exchange rates that may, from time to time, affect our financial condition and operating performance. Based solely on our results for the year ended December 31, 2024 (including the impact of existing hedging arrangements), if the value of the U.S. dollar relative to the British pound and Canadian dollar were to increase or decrease by one standard deviation compared to the average exchange rate during the year, our Net Income and Normalized FFO for the year ended December 31, 2024 would decrease or increase by less than $0.01 per diluted common share. We will continue to mitigate these risks through a layered approach to hedging and continual assessment of our foreign operational capital structure. Nevertheless, we cannot assure you that any such fluctuations will not have an effect on our earnings.
Concentration Risk
We use concentration ratios to identify, understand and evaluate the potential impact of economic downturns and other adverse events that may affect our asset types, geographic locations, business models, and managers, tenants and borrowers. We evaluate concentration risk in terms of investment mix and operations mix. Investment mix measures the percentage of our investments that is concentrated in a specific asset type or that is operated or managed by a particular manager, tenant or borrower. Operations mix measures the percentage of our operating results that is attributed to a particular manager, tenant, or borrower, geographic location or business model.
The following tables reflect our concentration risk as of the dates and for the periods presented:
| | | | | | | | | | | |
| | As of December 31, |
| | 2024 | | 2023 |
Investment mix by asset type (1): | | | |
| Senior housing communities | 67.3 | % | | 65.8 | % |
| Outpatient medical buildings | 19.7 | | | 20.4 | |
| Research centers | 5.3 | | | 5.7 | |
| Other healthcare facilities | 4.5 | | | 4.8 | |
| Inpatient rehabilitation facilities (“IRFs”) and long-term acute care facilities (“LTACs”) | 2.0 | | | 1.5 | |
| Skilled nursing facilities (“SNFs”) | 1.2 | | | 1.7 | |
| Secured loans receivable and investments, net | — | | | 0.1 | |
| Total | 100.0 | % | | 100.0 | % |
Investment mix by manager and tenant (1): | | | |
| Atria | 21.0 | % | | 23.5 | % |
| Sunrise | 9.9 | | | 9.0 | |
| Lillibridge | 9.8 | | | 10.2 | |
| Brookdale | 6.6 | | | 7.7 | |
| Le Groupe Maurice | 6.4 | | | 7.0 | |
| Wexford | 5.1 | | | 5.4 | |
| Ardent | 4.9 | | | 5.1 | |
| Kindred | 1.3 | | | 0.8 | |
| All other | 35.0 | | | 31.3 | |
| Total | 100.0 | % | | 100.0 | % |
______________________________
(1)Ratios are based on the gross book value of consolidated real estate investments (excluding properties classified as held for sale, development properties not yet operational and land parcels) as of each reporting date.
| | | | | | | | | | | | | | | | | |
| | For the Years Ended December 31, |
| | 2024 | | 2023 | | 2022 |
| Operations mix by manager and tenant and business model: | | | | | |
Revenues (1): | | | | | |
| SHOP | 68.5 | % | | 65.8 | % | | 64.3 | % |
Brookdale (2) | 3.1 | | | 3.3 | | | 3.6 | |
Ardent (3) | 2.8 | | | 3.0 | | | 3.2 | |
| Kindred | 2.8 | | | 2.9 | | | 3.2 | |
| All others | 22.8 | | | 25.0 | | | 25.7 | |
| Total | 100.0 | % | | 100.0 | % | | 100.0 | % |
| Net operating income (“NOI”): | | | | | |
| SHOP | 41.9 | % | | 37.0 | % | | 35.1 | % |
Brookdale (2) | 7.2 | | | 7.7 | | | 8.1 | |
| Kindred | 6.7 | | | 6.9 | | | 7.3 | |
Ardent (3) | 6.6 | | | 6.9 | | | 7.1 | |
| All others | 37.6 | | | 41.5 | | | 42.4 | |
| Total | 100.0 | % | | 100.0 | % | | 100.0 | % |
Operations mix by geographic location (1): | | | | | |
| California | 13.4 | % | | 13.6 | % | | 14.3 | % |
| New York | 7.0 | | | 7.4 | | | 7.5 | |
| Texas | 6.6 | | | 6.5 | | | 6.6 | |
| Quebec, Canada | 5.9 | | | 6.0 | | | 6.2 | |
| Illinois | 4.9 | | | 4.4 | | | 4.3 | |
| All others | 62.2 | | | 62.1 | | | 61.1 | |
| Total | 100.0 | % | | 100.0 | % | | 100.0 | % |
______________________________
(1)Represents percentage of total revenues which include third-party capital management revenues, income from loans and investments and interest and other income.
(2)Results exclude nine senior housing communities which are included in our SHOP segment.
(3)Results exclude 19 outpatient medical buildings included in “All others.”
See “Non-GAAP Financial Measures” included elsewhere in this Annual Report for additional disclosure and reconciliations of net income attributable to common stockholders, as computed in accordance with GAAP, to NOI.
We derive a significant portion of our revenues by leasing assets under long-term triple-net leases in which the rental rate is generally fixed with escalators, subject to certain limitations. Some of our triple-net lease escalators are contingent upon the satisfaction of specified facility revenue parameters or based on increases in the Consumer Price Index (“CPI”), with caps, floors or collars. We also earn revenues directly from individual residents in our senior housing communities that are managed by operators, such as Atria, Sunrise and Le Groupe Maurice, and tenants in our outpatient medical buildings.
The concentration of our NNN segment revenues and operating income that are attributed to Brookdale, Ardent and Kindred creates credit risk. If any of Brookdale, Ardent or Kindred becomes unable or unwilling to satisfy its obligations to us or to renew its leases with us upon expiration of the terms thereof, our financial condition and results of operations could decline, and our ability to service our indebtedness and to make distributions to our stockholders could be impaired. See “Risk Factors—Risks Related to Our Business Operations and Strategy—A significant portion of our revenues and operating income is dependent on a limited number of managers and tenants, including Atria, Sunrise, Le Groupe Maurice, Brookdale, Ardent and Kindred” included in Part I, Item 1A of this Annual Report and “Note 3 – Concentration of Credit Risk” of the Notes to Consolidated Financial Statements included in Part II, Item 8 of this Annual Report.
We regularly monitor and assess any changes in the relative credit risk associated with our significant tenant relationships. The ratios and metrics we use to evaluate the relative credit risk associated with those relationships depend on facts and circumstances specific to that relationship and may vary over time. Such ratios and metrics may include, without
limitation, the credit history of, and the legal, regulatory or economic conditions affecting, any tenant, guarantor, obligor, or affiliated company associated with the tenant. Among other things, we may review and analyze information regarding the real estate, senior housing and healthcare industries generally, financial statements and other public or private information regarding any tenant, guarantor, obligor, or affiliated company. From time to time we may also participate in discussions and in-person meetings with representatives of the significant tenant. Using this information, we calculate and review multiple financial ratios (which may, but do not necessarily, include, leverage, fixed charge coverage, rent coverage and other property level key performance indicators), including certain adjustments based on information provided by the tenant or required by the relevant reporting requirements and the expected future performance of the assets, tenants and guarantors.
Because Atria, Sunrise and Le Groupe Maurice manage our properties in exchange for the receipt of a management fee from us, we are not directly exposed to the credit risk of our managers in the same manner or to the same extent as our triple-net tenants. However, we rely on our managers’ personnel, expertise, technical resources and information systems, proprietary information, good faith and judgment to manage the senior housing communities’ operations efficiently and effectively. We also rely on Atria, Sunrise and Le Groupe Maurice to set appropriate resident fees, to provide accurate property-level financials results in a timely manner and otherwise operate our senior housing communities in compliance with the terms of our management agreements and all applicable laws and regulations. Although we have various rights as the property owner under our management agreements, including various rights to terminate and exercise remedies under the agreements as provided therein, Atria’s. Sunrise’s or Le Groupe Maurice’s failure, inability or unwillingness to satisfy its respective obligations under those agreements, to efficiently and effectively manage our properties or to provide timely and accurate accounting information with respect thereto could have a Material Adverse Effect on us. See “Risk Factors—Risks Related to Our Business Operations and Strategy” included in Part I, Item 1A of this Annual Report.
Triple-Net Lease Performance and Expirations
Any failure, inability or unwillingness by our tenants to satisfy their obligations under our triple-net leases could have a material adverse effect on us. Also, if our tenants are not able or willing to renew our triple-net leases upon expiration, we may be unable to reposition the applicable properties on a timely basis or on the same or better economic terms, if at all. Although our lease expirations are staggered, the non-renewal of some or all of our triple-net leases that expire in any given year could have a material adverse effect on us. During the year ended December 31, 2024, we had no triple-net lease expirations that, in the aggregate, had a material impact on our financial condition or results of operations for that period. See “Risk Factors—Risks Related to Our Business Operations and Strategy—If we need to replace any of our managers or tenants, we may be unable to do so on as favorable terms, if at all, and we could be subject to delays, limitations and expenses, which could adversely affect our business, financial condition and results of operations” included in Part I, Item IA of this Annual Report.
Tenant Lease Expirations
The following table summarizes our lease expirations in our OM&R and NNN segments over the next 10 years and thereafter, assuming that none of the tenants exercise any of their renewal or purchase options, as of December 31, 2024 (dollars in thousands):
| | | | | | | | | | | | | | | | | | | | | | | | | | | | | | | | | | | | | | | | | | | | | | | | | | | | | | | | | | | | | | | | | |
| Expiration Year |
| 2025 | | 2026 | | 2027 | | 2028 | | 2029 | | 2030 | | 2031 | | 2032 | | 2033 | | 2034 | | Thereafter |
| OM&R: | | | | | | | | | | | | | | | | | | | | | |
| Segment Properties | 426 | | 426 | | 426 | | 426 | | 426 | | 426 | | 426 | | 426 | | 426 | | 426 | | 426 |
Annualized Base Rent (1) | 72,314 | | 65,137 | | 85,516 | | 67,695 | | 70,060 | | 49,547 | | 32,347 | | 41,433 | | 33,067 | | 58,566 | | 42,790 |
| % of Segment Base Rent | 12 | % | | 11 | % | | 14 | % | | 11 | % | | 11 | % | | 8 | % | | 5 | % | | 7 | % | | 5 | % | | 9 | % | | 7 | % |
| | | | | | | | | | | | | | | | | | | | | |
| | | | | | | | | | | | | | | | | | | | | |
| | | | | | | | | | | | | | | | | | | | | |
| NNN: | | | | | | | | | | | | | | | | | | | | | |
| Segment Properties | 174 | | 112 | | 98 | | 104 | | 101 | | 101 | | 96 | | 102 | | 99 | | 95 | | 160 |
Annualized Base Rent (1)(2) | 95,558 | | 41,513 | | 10,512 | | 45,669 | | 28,834 | | 113,130 | | 1,982 | | 5,803 | | 3,932 | | 16,040 | | 205,743 |
| % of Segment Base Rent | 17 | % | | 7 | % | | 2 | % | | 8 | % | | 5 | % | | 20 | % | | — | % | | 1 | % | | 1 | % | | 3 | % | | 36 | % |
| | | | | | | | | | | | | | | | | | | | | |
| | | | | | | | | | | | | | | | | | | | | |
| | | | | | | | | | | | | | | | | | | | | |
| Total Annualized Base Rent | 167,872 | | 106,650 | | 96,027 | | 113,364 | | 98,894 | | 162,677 | | 34,329 | | 47,236 | | 36,999 | | 74,605 | | 248,533 |
| % of Total OM&R and NNN Base Rent | 14 | % | | 9 | % | | 8 | % | | 10 | % | | 8 | % | | 14 | % | | 3 | % | | 4 | % | | 3 | % | | 6 | % | | 21 | % |
______________________________
(1)Annualized Base Rent (“ABR”) represents the annualized impact of the current period’s cash base rent at 100% share for consolidated entities. ABR does not include straight-line rental income, rent escalators, common area maintenance charges, the amortization of above / below market lease intangibles or other non-cash items.
(2)The expiration of ABR in 2025 includes rent associated with (a) 56 senior housing properties currently leased to Brookdale, 45 of which are intended to be converted to our SHOP segment on or after September 1, 2025 and (b) 3 LTACs currently leased to Kindred through April 2025. The expiration of ABR in 2030 includes rent associated with 20 LTACs currently leased to Kindred. The expiration of ABR in 2034 includes rent associated with 5 LTACs currently leased to Kindred. The expiration of ABR Thereafter includes rent associated with 65 properties currently leased to Brookdale. See “Risk Factors—Risks Related to Our Business Operations and Strategy—If we need to replace any of our managers or tenants, we may be unable to do so on as favorable terms, if at all, and we could be subject to delays, limitations and expenses, which could adversely affect our business, financial condition and results of operations” included in Part I, Item 1A of this Annual Report.
Liquidity and Capital Resources
Our principal sources of liquidity are cash flows from operations, proceeds from the issuance of debt and equity securities, borrowings under our unsecured revolving credit facility and commercial paper program, and proceeds from asset sales.
For the next 12 months, our principal liquidity needs are to: (i) fund operating expenses; (ii) meet our debt service requirements; (iii) repay maturing mortgage and other debt; (iv) fund acquisitions, investments and commitments and any development and redevelopment activities; (v) fund capital expenditures; and (vi) make distributions to our stockholders and unitholders, as required for us to continue to qualify as a REIT. Depending upon the availability of external capital, we believe our liquidity is sufficient to fund these uses of cash. We expect that these liquidity needs generally will be satisfied by a combination of the following: cash flows from operations, cash on hand, debt assumptions and financings (including secured financings), issuances of debt and equity securities, dispositions of assets (including in whole or in part, through joint venture arrangements) and borrowings under our revolving credit facilities and commercial paper program. However, an inability to access liquidity through multiple capital sources concurrently could have a material adverse effect on us.
Our material contractual obligations arising in the normal course of business primarily consist of long-term debt and related interest payments, and operating obligations which include ground lease obligations. During the year ended December 31, 2024, our material contractual obligations increased primarily due to net issuances of senior notes to pre-fund upcoming debt maturities. See “Note 10 – Senior Notes Payable and Other Debt” and “Note 14 – Commitments and Contingencies” of the Notes to Consolidated Financial Statements included in Part II, Item 8 of this Annual Report for further information regarding our long-term debt obligations and operating obligations, respectively.
We may, from time to time, seek to retire or purchase our outstanding indebtedness for cash or in exchange for equity securities in open market purchases, privately negotiated transactions or otherwise. Such repurchases or exchanges, if any, will depend on prevailing market conditions, our liquidity requirements, contractual restrictions, prospects for capital and other factors. The amounts involved may be material.
Loans Receivable and Investments
In September 2024, we provided new secured debt financing of $109.0 million to the owner of a senior housing property, secured by the asset and with additional credit support. The loan provides us with a right of first offer to purchase the asset on certain terms and conditions. The loan has a 3-year term and bears interest at a variable rate based on one-month SOFR, subject to a floor of 4.50%, plus a spread of 5.75%, increasing to 6.00% commencing October 1, 2025.
Credit Facilities, Commercial Paper, Unsecured Term Loans and Letters of Credit
As of December 31, 2024, we had $2.74 billion of undrawn capacity under our unsecured revolving credit facility with $6.4 million outstanding and an additional $0.8 million restricted to support outstanding letters of credit. We use our unsecured revolving credit facility to support our commercial paper program and for general corporate purposes.
Our wholly-owned subsidiary, Ventas Realty, Limited Partnership (“Ventas Realty”), may issue from time to time unsecured commercial paper notes up to a maximum aggregate amount outstanding at any time of $1.0 billion. The notes are sold under customary terms in the U.S. commercial paper note market and are ranked pari passu with all of Ventas Realty’s other unsecured senior indebtedness. The notes are fully and unconditionally guaranteed by Ventas, Inc. As of December 31, 2024, we had no borrowings outstanding under our commercial paper program.
Ventas Realty has a $500.0 million unsecured term loan priced at Adjusted SOFR plus 0.85%, which is subject to adjustment based on Ventas Realty’s debt ratings. This term loan is fully and unconditionally guaranteed by Ventas, Inc. It matures in June 2027 and includes an accordion feature that permits Ventas Realty to increase the aggregate borrowings thereunder to up to $1.25 billion, subject to the satisfaction of certain conditions, including the receipt of additional commitments for such increase.
Ventas Realty has a $200.0 million unsecured term loan priced at Adjusted SOFR plus 0.85%, which is subject to adjustment based on Ventas Realty’s debt ratings. This term loan is fully and unconditionally guaranteed by Ventas, Inc. It matures in February 2027 and includes an accordion feature that permits Ventas Realty to increase the aggregate borrowings thereunder to up to $500.0 million, subject to the satisfaction of certain conditions, including the receipt of additional commitments for such increase.
During the year ended December 31, 2024, we repaid a C$500.0 million ($369.4 million) unsecured term loan facility priced at Canadian Dollar Offered Rate (“CDOR”) plus 0.90% that would otherwise have matured in January 2025.
As of December 31, 2024, our $100.0 million uncommitted line for standby letters of credit had an outstanding balance of $15.4 million. The agreement governing the line contains certain customary covenants and, under its terms, we are required to pay a commission on each outstanding letter of credit at a fixed rate.
Exchangeable Senior Notes
In June 2023, Ventas Realty issued $862.5 million aggregate principal amount of its 3.75% Exchangeable Senior Notes due 2026 (the “Exchangeable Notes”) in a private placement. The Exchangeable Notes are senior, unsecured obligations of Ventas Realty and are fully and unconditionally guaranteed on an unsecured and unsubordinated basis by Ventas, Inc. The Exchangeable Notes bear interest at a rate of 3.75% per year, payable semi-annually in arrears on June 1 and December 1 of each year, beginning on December 1, 2023. The Exchangeable Notes mature on June 1, 2026, unless earlier exchanged, redeemed or repurchased. As of both December 31, 2024 and 2023, we had $862.5 million aggregate principal amount of the Exchangeable Notes outstanding with an effective interest rate of 4.62% inclusive of the impact of the amortization of issuance costs. For the years ended December 31, 2024 and 2023, we recognized $32.3 million and $17.8 million of contractual interest expense, respectively, and amortization of issuance costs of $6.8 million and $3.6 million, respectively, related to the Exchangeable Notes. Unamortized issuance costs of $10.3 million and $17.1 million as of December 31, 2024 and 2023 were recorded as an offset to Senior notes payable and other debt on our Consolidated Balance Sheets.
The Exchangeable Notes are exchangeable at an initial exchange rate of 18.2460 shares of our common stock per $1,000 principal amount of Exchangeable Notes (equivalent to an initial exchange price of approximately $54.81 per share of
common stock). The initial exchange rate is subject to adjustment, including in the event of the payment of a quarterly dividend in excess of $0.45 per share, but will not be adjusted for any accrued and unpaid interest. Upon exchange of the Exchangeable Notes, Ventas Realty will pay cash up to the aggregate principal amount of the Exchangeable Notes to be exchanged and pay or deliver (or cause to be delivered), as the case may be, cash, shares of common stock or a combination of cash and shares of common stock, at Ventas Realty’s election, in respect of the remainder, if any, of its exchange obligation in excess of the aggregate principal amount of the Exchangeable Notes being exchanged. Prior to the close of business on the business day immediately preceding March 1, 2026, the Exchangeable Notes will be exchangeable at the option of the noteholders only upon the satisfaction of specified conditions and during certain periods described in the indenture governing the Exchangeable Notes. On or after March 1, 2026, until the close of business on the business day immediately preceding the maturity date, the Exchangeable Notes will be exchangeable at the option of the noteholders at any time regardless of these conditions or periods.
Senior Notes
As of December 31, 2024, we had outstanding $8.3 billion aggregate principal amount of senior notes issued by Ventas Realty, approximately $73.8 million aggregate principal amount of senior notes issued by Nationwide Health Properties, Inc. (“NHP”) and assumed by our subsidiary, Nationwide Health Properties, LLC (“NHP LLC”), as successor to NHP, in connection with our acquisition of NHP, and C$2.0 billion aggregate principal amount of senior notes issued by our subsidiary, Ventas Canada Finance Limited (“Ventas Canada”). All of the senior notes issued by Ventas Realty and Ventas Canada are unconditionally guaranteed by Ventas, Inc.
We may, from time to time, seek to retire or purchase our outstanding senior notes for cash or in exchange for equity securities in open market purchases, privately negotiated transactions or otherwise. Such repurchases or exchanges, if any, will depend on prevailing market conditions, our liquidity requirements, contractual restrictions, prospects for capital and other factors. The amounts involved may be material.
The indentures governing our outstanding senior notes require us to comply with various financial and other restrictive covenants. We were in compliance with all of these covenants at December 31, 2024.
In February 2024, Ventas Canada issued and sold C$650.0 million ($478.3 million) aggregate principal amount of 5.10% Senior Notes, Series J due 2029 in a private placement. The proceeds were primarily used to repay our C$500.0 million ($369.4 million) unsecured term loan facility due 2025.
In April and May 2024, we repaid $800.0 million senior notes consisting of $400.0 million aggregate principal amount of 3.50% Senior Notes due 2024 and $400.0 million aggregate principal amount of 3.75% Senior Notes due 2024 at maturity primarily with cash on hand and borrowings through our commercial paper program.
In April 2024, we repaid C$73.0 million ($53.4 million) aggregate principal amount of 2.80% Senior Notes, Series E due 2024 at maturity with cash on hand.
In May 2024, Ventas Realty issued and sold $500.0 million aggregate principal amount of 5.625% Senior Notes due 2034 in a registered public offering. The proceeds were primarily used to repay balances outstanding under our commercial paper program.
In September 2024, Ventas Realty issued and sold $550.0 million aggregate principal amount of 5.00% Senior Notes due 2035 in a registered public offering. We used the proceeds for general corporate purposes, including funding of acquisitions and the repayment of other indebtedness.
In September 2024, we repaid C$163.3 million ($120.8 million) aggregate principal amount of 4.125% Senior Notes due 2024 at maturity with cash on hand.
In January and February 2025, we repaid $450.0 million and $600.0 million aggregate principal amount of 2.65% Senior Notes due 2025 and aggregate principal amount of 3.50% Senior Notes due 2025, respectively, at maturity using cash on hand and borrowings through our commercial paper program.
Mortgages
At December 31, 2024, our consolidated aggregate principal amount of mortgage debt outstanding was $3.2 billion, of which our share was $2.9 billion.
Under certain circumstances, contractual and legal restrictions, including those contained in the instruments governing our subsidiaries’ outstanding mortgage indebtedness, may restrict our ability to obtain cash from our subsidiaries for the purpose of meeting our debt service obligations, including our payment guarantees with respect to Ventas Realty’s and Ventas Canada’s senior notes.
In February 2024, we entered into a C$52.8 million ($39.1 million) fixed rate mortgage loan, which accrues interest at 4.644%, matures in 2029 and is secured by one senior housing community in Canada.
In April 2024, we entered into an aggregate C$103.0 million ($75.5 million) fixed rate mortgage loans, which accrue interest at a blended rate of 4.90%, mature in 2029 and are secured by two senior housing communities in Canada.
In May 2024, we entered into a $52.3 million fixed rate mortgage loan, which accrues interest at 6.02%, matures in 2034 and is secured by one outpatient medical building in California.
Derivatives and Hedging
In the normal course of our business, interest rate fluctuations affect future cash flows under our variable rate debt obligations, loans receivable and marketable debt securities, and foreign currency exchange rate fluctuations affect our operating results. We follow established risk management policies and procedures, including the use of derivative instruments, to mitigate the impact of these risks.
We do not use derivative instruments for trading or speculative purposes, and we have a policy of entering into contracts only with major financial institutions based upon their credit ratings and other factors. When considered together with the underlying exposure that the derivative is designed to hedge, we do not expect that the use of derivatives in this manner would have any material adverse effect on our future financial condition or results of operations.
We enter into interest rate swaps in order to maintain a capital structure containing targeted amounts of fixed and variable-rate debt and manage interest rate risk. Interest rate swaps designated as cash flow hedges involve the receipt of variable amounts from a counterparty in exchange for our fixed-rate payments. These interest rate swap agreements are used to hedge the variable cash flows associated with variable-rate debt.
Periodically, we enter into and designate interest rate locks to partially hedge the risk of changes in interest payments attributable to increases in the benchmark interest rate during the period leading up to the probable issuance of fixed-rate debt. We designate our interest rate locks as cash flow hedges. Gains and losses when we settle our interest rate locks are amortized over the life of the related debt and recorded in Interest expense in our Consolidated Statements of Income.
As of December 31, 2024, our variable rate debt obligations of $0.8 billion reflect, in part, the effect of $141.3 million notional amount of interest rate swaps with maturities in March 2027, that effectively convert fixed rate debt to variable rate debt.
As of December 31, 2024, our fixed rate debt obligations of $12.8 billion reflect, in part, the effect of $526.5 million and C$635.9 million notional amount of interest rate swaps with maturities ranging from February 2025 to April 2031, in each case, that effectively convert variable rate debt to fixed rate debt.
2024 Activity
From June through September 2024, we entered into an aggregate $350.0 million treasury locks to hedge interest rate risk on future debt issuances. In September 2024, we terminated the treasury locks in conjunction with the issuance of the $550.0 million aggregate principal amount of 5.00% Senior Notes due 2035.
Capital Stock
In February 2024, we entered into an amendment to our November 2021 ATM Sales Agreement, providing for an “at-the-market” equity offering program, pursuant to which we could sell, from time to time, up to $1.0 billion aggregate gross sales price of shares of our common stock (as amended, the “February 2024 ATM Program”). In September 2024, we terminated the February 2024 ATM Program and entered into an ATM Sales Agreement providing for the sale, from time to time, of up to $2.0 billion aggregate gross sales price of shares of our common stock (the “September 2024 ATM Program” and, together with the February 2024 ATM Program, the “ATM Programs”). The ATM Programs have allowed us to enter into forward sales agreements, as discussed below. By utilizing a forward sales agreement, we can secure a share price on the sale of
shares of our common stock at or shortly after the time the forward sales agreement becomes effective, while postponing the receipt of proceeds from the sale of shares until a future date. As of December 31, 2024, the remaining amount available under our September 2024 ATM Program for future sales of common stock was $1.5 billion.
During the year ended December 31, 2024, we issued 37.3 million shares of our common stock for gross proceeds of $2.2 billion, representing an average price of $58.38 per share, of which 3.4 million shares or approximately $201.1 million in gross proceeds remained unsettled with maturity in March 2026. During the year ended December 31, 2023, we issued 2.3 million shares of our common stock for gross proceeds of $110.4 million, representing an average price of $47.89 per share. There were no issuances of common stock for the year ended December 31, 2022.
Equity Forward Sales Agreements
Equity forward sales agreements generally have a maturity of one to two years. At any time during the term of an equity forward sales agreement, we may settle that equity forward sales agreement by delivery of physical shares of our common stock to the forward purchaser or, at our election, subject to certain exceptions, we may settle in cash or by net share settlement. The forward sales price we expect to receive upon settlement of outstanding equity forward sales agreements will be the initial forward price, net of commissions, established on or shortly after the effective date of the relevant equity forward sales agreement, subject to adjustments for accrued interest, the forward purchasers’ stock borrowing costs in excess of a certain threshold specified in the equity forward sales agreement, and certain fixed price reductions for expected dividends on our common stock during the term of the equity forward sales agreement. Our unsettled equity forward sales agreements are accounted for as equity instruments.
In January 2025, we entered into additional unsettled equity forward sales agreements for 0.8 million shares or approximately $49.8 million in gross proceeds with maturity in March 2026.
Dividends
During 2024, we declared four dividends totaling $1.80 per share of our common stock, including a fourth quarter dividend of $0.45 per share. In order to continue to qualify as a REIT, we must make annual distributions to our stockholders of at least 90% of our REIT taxable income (excluding net capital gain). In addition, we will be subject to income tax at the regular corporate rate to the extent we distribute less than 100% of our REIT taxable income, including any net capital gains. We intend to pay dividends greater than 100% of our taxable income, after the use of any net operating loss carryforwards, for 2025.
We expect that our cash flows will exceed our REIT taxable income due to depreciation and other non-cash deductions in computing REIT taxable income and that we will be able to satisfy the 90% distribution requirement. However, from time to time, we may not have sufficient cash on hand or other liquid assets to meet this requirement or we may decide to retain cash or distribute such greater amount as may be necessary to avoid income and excise taxation. If we do not have sufficient cash on hand or other liquid assets to enable us to satisfy the 90% distribution requirement, or if we desire to retain cash, we may borrow funds, issue additional equity securities, pay taxable stock dividends, if possible, distribute other property or securities or engage in a transaction intended to enable us to meet the REIT distribution requirements or any combination of the foregoing.
Capital Expenditures
From time to time, we engage in development and redevelopment activities within our reportable business segments and through our investments in unconsolidated entities. For example, we are party to certain agreements that commit us to develop properties funded through capital that we and, in certain circumstances, our joint venture partners provide. As of December 31, 2024, we had three active and committed projects pursuant to these agreements, including two projects that are unconsolidated. In addition, from time to time, we engage in redevelopment projects with respect to our existing senior housing communities, outpatient medical buildings and research centers to maximize the value, increase NOI, maintain a market-competitive position, achieve property stabilization or change the primary use of the property.
The terms of our triple-net leases generally obligate our tenants to pay all capital expenditures necessary to maintain and improve our triple-net leased properties. However, from time to time, we may fund the capital expenditures for our triple-net leased properties through loans or advances to the tenants, which may increase the amount of rent payable with respect to the properties in certain cases. We may also fund capital expenditures for which we may become responsible upon expiration of our triple-net leases or in the event that our tenants are unable or unwilling to meet their obligations under those leases.
We expect that these liquidity needs generally will be satisfied by a combination of the following: cash flows from operations, cash on hand, debt assumptions and financings (including secured financings), issuances of debt and equity securities, dispositions of assets (in whole or in part through joint venture arrangements) and borrowings under our revolving credit facilities and commercial paper program.
To the extent that unanticipated capital expenditure needs arise or significant borrowings are required, our liquidity may be affected adversely. Our ability to borrow additional funds may be restricted in certain circumstances by the terms of the instruments governing our outstanding indebtedness.
Cash Flows
The following table sets forth our sources and uses of cash flows for the years ended December 31, 2024 and 2023 (dollars in thousands):
| | | | | | | | | | | | | | | | | | | | | | | |
| | For the Years Ended
December 31, | | Change |
| | 2024 | | 2023 | | $ | | % |
| Cash, cash equivalents and restricted cash at beginning of year | $ | 563,462 | | | $ | 170,745 | | | $ | 392,717 | | | nm |
| Net cash provided by operating activities | 1,329,625 | | | 1,119,873 | | | 209,752 | | | 18.7 | |
| Net cash used in investing activities | (2,377,089) | | | (184,664) | | | (2,192,425) | | | nm |
| Net cash provided by (used in) financing activities | 1,445,220 | | | (543,749) | | | 1,988,969 | | | nm |
| Effect of foreign currency translation | (3,985) | | | 1,257 | | | (5,242) | | | nm |
| Cash, cash equivalents and restricted cash at end of year | $ | 957,233 | | | $ | 563,462 | | | $ | 393,771 | | | 69.9 | |
______________________________
nm - not meaningful
Cash Flows from Operating Activities
Cash flows from operating activities increased $209.8 million during 2024 compared to the same period in 2023 primarily due to growth in our businesses and improvements to our working capital.
Cash Flows from Investing Activities
Cash flows used in investing activities increased $2.2 billion during 2024 compared to the same period in 2023 primarily due to a $1.9 billion increase in acquisition and a $122.6 million increase in investment in loans receivable in 2024.
Cash Flows from Financing Activities
Net cash provided by financing activities increased $2.0 billion during 2024 compared to the same period in 2023 primarily due to a $1.9 billion increase in issuances of common stock.
Off-Balance Sheet Arrangements
We own interests in certain unconsolidated entities as described in “Note 7 – Investments in Unconsolidated Entities.” Except in limited circumstances, our risk of loss is limited to our investment in the entities and any outstanding loans receivable. Further, we use financial derivative instruments to hedge interest rate and foreign currency exchange rate exposure. Finally, as of December 31, 2024, we had $16.3 million outstanding letters of credit obligations.
Commitments and Contingencies
The information contained in “Note 14 – Commitments and Contingencies” of the Notes to Consolidated Financial Statements included in Part II, Item 8 of this Annual Report is incorporated by reference into this Item 7.
Guarantor and Issuer Information - Registered Senior Notes
Ventas, Inc. has fully and unconditionally guaranteed the obligation to pay principal and interest with respect to the outstanding senior notes issued by our 100% owned subsidiary, Ventas Realty, that were issued in transactions registered under the Securities Act of 1933. No other Ventas entities are issuers or guarantors of debt securities registered under the Securities Act.
Under certain circumstances, contractual and legal restrictions, including those contained in the instruments governing our subsidiaries’ outstanding mortgage indebtedness, may restrict our ability to obtain cash from our subsidiaries for the purpose of meeting our debt service obligations, including Ventas Realty’s payment obligations and our payment guarantees with respect to Ventas Realty’s registered senior notes.
Ventas Realty is a direct, wholly owned subsidiary of Ventas, Inc. Excluding investments in subsidiaries, the assets, liabilities and results of operations of Ventas Realty and Ventas, Inc., on a combined basis, are not material to the consolidated financial position or consolidated results of operations of Ventas. Therefore, in accordance with Rule 13-01 of Regulation S-X, we have elected to exclude summarized financial information for the issuer and guarantor of our registered senior notes.
Please see “—Liquidity and Capital Resources” for a description of our outstanding senior notes and other debt obligations, including the registered senior notes described above.
ITEM 7A. Quantitative and Qualitative Disclosures About Market Risk
The information set forth in Part II, Item 7 of this Annual Report under “Management’s Discussion and Analysis of Financial Condition and Results of Operations—Asset/Liability Management” is incorporated by reference into this Item 7A.
ITEM 8. Financial Statements and Supplementary Data
Ventas, Inc.
Index to Consolidated Financial Statements and Financial Statement Schedules
MANAGEMENT REPORT ON INTERNAL CONTROL OVER FINANCIAL REPORTING
Our management is responsible for establishing and maintaining adequate internal control over financial reporting, as defined in Rules 13a-15(f) and 15d-15(f) under the Exchange Act of 1934, as amended. This system is designed to provide reasonable assurance regarding the reliability of financial reporting and the preparation of consolidated financial statements for external purposes in accordance with U.S. GAAP. Because of its inherent limitations, internal control over financial reporting is not intended to provide absolute assurance that a misstatement of our financial statements would be prevented or detected.
Management, with the participation of the Company’s Chief Executive Officer and Chief Financial Officer, conducted an assessment of the effectiveness of the Company’s internal control over financial reporting based on the criteria set forth in Internal Control - Integrated Framework (2013) issued by the Committee of Sponsoring Organizations of the Treadway Commission (COSO). Based on this assessment, management has concluded that our internal control over financial reporting was effective at the reasonable assurance level as of December 31, 2024.
The effectiveness of our internal control over financial reporting as of December 31, 2024 has been audited by KPMG LLP, an independent registered public accounting firm, as stated in their report included herein.
Report of Independent Registered Public Accounting Firm
To the Stockholders and Board of Directors
Ventas, Inc.:
Opinion on the Consolidated Financial Statements
We have audited the accompanying consolidated balance sheets of Ventas, Inc. and subsidiaries (the Company) as of December 31, 2024 and 2023, the related consolidated statements of income, comprehensive income, equity, and cash flows for each of the years in the three-year period ended December 31, 2024, and the related notes and financial statement schedules III and IV (collectively, the consolidated financial statements). In our opinion, the consolidated financial statements present fairly, in all material respects, the financial position of the Company as of December 31, 2024 and 2023, and the results of its operations and its cash flows for each of the years in the three-year period ended December 31, 2024, in conformity with U.S. generally accepted accounting principles.
We also have audited, in accordance with the standards of the Public Company Accounting Oversight Board (United States) (PCAOB), the Company’s internal control over financial reporting as of December 31, 2024, based on criteria established in Internal Control – Integrated Framework (2013) issued by the Committee of Sponsoring Organizations of the Treadway Commission, and our report dated February 13, 2025 expressed an unqualified opinion on the effectiveness of the Company’s internal control over financial reporting.
Basis for Opinion
These consolidated financial statements are the responsibility of the Company’s management. Our responsibility is to express an opinion on these consolidated financial statements based on our audits. We are a public accounting firm registered with the PCAOB and are required to be independent with respect to the Company in accordance with the U.S. federal securities laws and the applicable rules and regulations of the Securities and Exchange Commission and the PCAOB.
We conducted our audits in accordance with the standards of the PCAOB. Those standards require that we plan and perform the audit to obtain reasonable assurance about whether the consolidated financial statements are free of material misstatement, whether due to error or fraud. Our audits included performing procedures to assess the risks of material misstatement of the consolidated financial statements, whether due to error or fraud, and performing procedures that respond to those risks. Such procedures included examining, on a test basis, evidence regarding the amounts and disclosures in the consolidated financial statements. Our audits also included evaluating the accounting principles used and significant estimates made by management, as well as evaluating the overall presentation of the consolidated financial statements. We believe that our audits provide a reasonable basis for our opinion.
Critical Audit Matter
The critical audit matter communicated below is a matter arising from the current period audit of the consolidated financial statements that was communicated or required to be communicated to the audit committee and that: (1) relates to accounts or disclosures that are material to the consolidated financial statements and (2) involves our especially challenging, subjective, or complex judgments. The communication of a critical audit matter does not alter in any way our opinion on the consolidated financial statements, taken as a whole, and we are not, by communicating the critical audit matter below, providing a separate opinion on the critical audit matter or on the accounts or disclosures to which it relates.
Impairment of real estate investments in the senior housing operating portfolio
As discussed in Notes 1, 2, and 5 to the consolidated financial statements, the Company periodically evaluates its long-lived assets, primarily consisting of investments in real estate, for impairment indicators. If indicators of impairment are present, the Company evaluates the carrying value of the related real estate investments in relation to the future undiscounted cash flows of the underlying operations. In performing this evaluation, the Company considers market conditions and current intentions with respect to holding or disposing of the asset and adjusts the net book value of real estate properties to fair value if the sum of the expected future undiscounted cash flows, including sales proceeds, is less than book value. During the year, impairment indicators arose for certain real estate properties and as a result, recoverability assessments were performed.
We identified the evaluation of real estate investments within the senior housing operating portfolio for impairment as a critical audit matter. Subjective auditor judgment was required in evaluating the Company’s determination of the future undiscounted cash flows. In particular, the undiscounted cash flows were sensitive to significant assumptions, including capitalization rates, projected operating cash flows, and stabilization period. Additionally, subjective auditor judgment and specialized skills and knowledge were needed to evaluate market data used by the Company.
The following are the primary procedures we performed to address this critical audit matter. We evaluated the design and tested the operating effectiveness of certain internal controls related to the impairment process. This included controls related to the Company’s impairment process and the significant assumptions described above. To test certain of the Company’s undiscounted cash flow estimates, we evaluated the Company’s forecasts of projected operating cash flows by comparing actual results to the Company’s forecasts adjusted for current market trends. In addition, we involved valuation professionals with specialized skills and knowledge, who assisted in evaluating the Company’s significant assumptions by comparing the significant assumptions to publicly available market data.
/s/ KPMG LLP
We have served as the Company’s auditor since 2014.
Chicago, Illinois
February 13, 2025
Report of Independent Registered Public Accounting Firm
To the Stockholders and Board of Directors Ventas, Inc.:
Opinion on Internal Control Over Financial Reporting
We have audited Ventas, Inc. and subsidiaries' (the Company) internal control over financial reporting as of December 31, 2024, based on criteria established in Internal Control – Integrated Framework (2013) issued by the Committee of Sponsoring Organizations of the Treadway Commission. In our opinion, the Company maintained, in all material respects, effective internal control over financial reporting as of December 31, 2024, based on criteria established in Internal Control – Integrated Framework (2013) issued by the Committee of Sponsoring Organizations of the Treadway Commission.
We also have audited, in accordance with the standards of the Public Company Accounting Oversight Board (United States) (PCAOB), the consolidated balance sheets of the Company as of December 31, 2024 and 2023, the related consolidated statements of income, comprehensive income, equity, and cash flows for each of the years in the three-year period ended December 31, 2024, and the related notes and financial statement schedules III and IV (collectively, the consolidated financial statements), and our report dated February 13, 2025 expressed an unqualified opinion on those consolidated financial statements.
Basis for Opinion
The Company’s management is responsible for maintaining effective internal control over financial reporting and for its assessment of the effectiveness of internal control over financial reporting, included in the accompanying Management Report on Internal Control over Financial Reporting. Our responsibility is to express an opinion on the Company’s internal control over financial reporting based on our audit. We are a public accounting firm registered with the PCAOB and are required to be independent with respect to the Company in accordance with the U.S. federal securities laws and the applicable rules and regulations of the Securities and Exchange Commission and the PCAOB.
We conducted our audit in accordance with the standards of the PCAOB. Those standards require that we plan and perform the audit to obtain reasonable assurance about whether effective internal control over financial reporting was maintained in all material respects. Our audit of internal control over financial reporting included obtaining an understanding of internal control over financial reporting, assessing the risk that a material weakness exists, and testing and evaluating the design and operating effectiveness of internal control based on the assessed risk. Our audit also included performing such other procedures as we considered necessary in the circumstances. We believe that our audit provides a reasonable basis for our opinion.
Definition and Limitations of Internal Control Over Financial Reporting
A company’s internal control over financial reporting is a process designed to provide reasonable assurance regarding the reliability of financial reporting and the preparation of financial statements for external purposes in accordance with generally accepted accounting principles. A company’s internal control over financial reporting includes those policies and procedures that (1) pertain to the maintenance of records that, in reasonable detail, accurately and fairly reflect the transactions and dispositions of the assets of the company; (2) provide reasonable assurance that transactions are recorded as necessary to permit preparation of financial statements in accordance with generally accepted accounting principles, and that receipts and expenditures of the company are being made only in accordance with authorizations of management and directors of the company; and (3) provide reasonable assurance regarding prevention or timely detection of unauthorized acquisition, use, or disposition of the company’s assets that could have a material effect on the financial statements.
Because of its inherent limitations, internal control over financial reporting may not prevent or detect misstatements. Also, projections of any evaluation of effectiveness to future periods are subject to the risk that controls may become inadequate because of changes in conditions, or that the degree of compliance with the policies or procedures may deteriorate.
/s/ KPMG LLP
Chicago, Illinois
February 13, 2025
VENTAS, INC.
CONSOLIDATED BALANCE SHEETS
(In thousands, except per share amounts)
| | | | | | | | | | | |
| As of December 31, |
| 2024 | | 2023 |
| Assets | | | |
| Real estate investments: | | | |
| Land and improvements | $ | 2,775,790 | | | $ | 2,596,274 | |
| Buildings and improvements | 28,717,990 | | | 27,201,381 | |
| Construction in progress | 336,231 | | | 368,143 | |
| Acquired lease intangibles | 1,558,751 | | | 1,448,146 | |
| Operating lease assets | 308,019 | | | 312,142 | |
| 33,696,781 | | | 31,926,086 | |
| Accumulated depreciation and amortization | (11,096,236) | | | (10,177,136) | |
| Net real estate property | 22,600,545 | | | 21,748,950 | |
| Secured loans receivable and investments, net | 144,872 | | | 27,986 | |
| Investments in unconsolidated real estate entities | 626,122 | | | 598,206 | |
| Net real estate investments | 23,371,539 | | | 22,375,142 | |
| Cash and cash equivalents | 897,850 | | | 508,794 | |
| Escrow deposits and restricted cash | 59,383 | | | 54,668 | |
| Goodwill | 1,044,915 | | | 1,045,176 | |
| Assets held for sale | 18,625 | | | 56,489 | |
| Deferred income tax assets, net | 1,931 | | | 1,754 | |
| Other assets | 792,663 | | | 683,410 | |
| Total assets | $ | 26,186,906 | | | $ | 24,725,433 | |
| Liabilities and equity | | | |
| Liabilities: | | | |
| Senior notes payable and other debt | $ | 13,522,551 | | | $ | 13,490,896 | |
| Accrued interest payable | 143,345 | | | 117,403 | |
| Operating lease liabilities | 218,003 | | | 194,734 | |
| Accounts payable and other liabilities | 1,152,306 | | | 1,041,616 | |
| Liabilities related to assets held for sale | 2,726 | | | 9,243 | |
| Deferred income tax liabilities | 8,150 | | | 24,500 | |
| Total liabilities | 15,047,081 | | | 14,878,392 | |
| Redeemable OP unitholder and noncontrolling interests | 310,229 | | | 302,636 | |
| Commitments and contingencies | | | |
| Equity: | | | |
| Ventas stockholders’ equity: | | | |
| Preferred stock, $1.00 par value; 10,000 shares authorized, unissued | — | | | — | |
| Common stock, $0.25 par value; 600,000 shares authorized, 437,085 and 402,380 shares outstanding at December 31, 2024 and 2023, respectively | 109,119 | | | 100,648 | |
| Capital in excess of par value | 17,607,482 | | | 15,650,734 | |
| Accumulated other comprehensive loss | (33,526) | | | (35,757) | |
| Retained earnings (deficit) | (6,886,653) | | | (6,213,803) | |
| Treasury stock, 4 and 279 shares issued at December 31, 2024 and 2023, respectively | (25,155) | | | (13,764) | |
| Total Ventas stockholders’ equity | 10,771,267 | | | 9,488,058 | |
| Noncontrolling interests | 58,329 | | | 56,347 | |
| Total equity | 10,829,596 | | | 9,544,405 | |
| Total liabilities and equity | $ | 26,186,906 | | | $ | 24,725,433 | |
See accompanying notes.
VENTAS, INC.
CONSOLIDATED STATEMENTS OF INCOME
(In thousands, except per share amounts)
| | | | | | | | | | | | | | | | | |
| For the Years Ended December 31, |
| 2024 | | 2023 | | 2022 |
| Revenues | | | | | |
| Rental income: | | | | | |
| Triple-net leased properties | $ | 622,054 | | | $ | 619,208 | | | $ | 598,154 | |
| Outpatient medical and research portfolio | 874,886 | | | 867,193 | | | 801,159 | |
| 1,496,940 | | | 1,486,401 | | | 1,399,313 | |
| Resident fees and services | 3,372,796 | | | 2,959,219 | | | 2,651,886 | |
| Third-party capital management revenues | 17,359 | | | 17,841 | | | 26,199 | |
| Income from loans and investments | 9,057 | | | 22,952 | | | 48,160 | |
| Interest and other income | 28,114 | | | 11,414 | | | 3,635 | |
| Total revenues | 4,924,266 | | | 4,497,827 | | | 4,129,193 | |
| Expenses | | | | | |
| Interest | 602,835 | | | 574,112 | | | 467,557 | |
| Depreciation and amortization | 1,253,143 | | | 1,392,461 | | | 1,197,798 | |
| Property-level operating expenses: | | | | | |
| Senior housing | 2,506,413 | | | 2,247,812 | | | 2,004,420 | |
| Outpatient medical and research portfolio | 298,320 | | | 292,776 | | | 257,003 | |
| Triple-net leased properties | 15,829 | | | 14,557 | | | 15,301 | |
| 2,820,562 | | | 2,555,145 | | | 2,276,724 | |
| Third-party capital management expenses | 6,507 | | | 6,101 | | | 6,194 | |
| General, administrative and professional fees | 162,990 | | | 148,876 | | | 144,874 | |
| Loss (gain) on extinguishment of debt, net | 687 | | | (6,104) | | | 581 | |
| Transaction, transition and restructuring costs | 20,369 | | | 15,215 | | | 30,884 | |
| (Reversal of) allowance on loans receivable and investments, net | (166) | | | (20,270) | | | 19,757 | |
| Gain on foreclosure of real estate | — | | | (29,127) | | | — | |
| Shareholder relations matters | 15,751 | | | — | | | 20,693 | |
| Other expense (income) | 49,584 | | | (23,001) | | | 58,268 | |
| Total expenses | 4,932,262 | | | 4,613,408 | | | 4,223,330 | |
| Loss before unconsolidated entities, real estate dispositions, income taxes and noncontrolling interests | (7,996) | | | (115,581) | | | (94,137) | |
| Income from unconsolidated entities | 1,563 | | | 13,626 | | | 28,500 | |
| Gain on real estate dispositions | 57,009 | | | 62,119 | | | 7,780 | |
| Income tax benefit | 37,775 | | | 9,539 | | | 16,926 | |
| | | | | |
| | | | | |
| Net income (loss) | 88,351 | | | (30,297) | | | (40,931) | |
| Net income attributable to noncontrolling interests | 7,198 | | | 10,676 | | | 6,516 | |
| Net income (loss) attributable to common stockholders | $ | 81,153 | | | $ | (40,973) | | | $ | (47,447) | |
| Earnings per common share | | | | | |
| Basic: | | | | | |
| Net income (loss) | $ | 0.21 | | | $ | (0.08) | | | $ | (0.10) | |
| Net income (loss) attributable to common stockholders | 0.20 | | | (0.10) | | | (0.12) | |
Diluted: (1) | | | | | |
| Net income (loss) | $ | 0.21 | | | $ | (0.08) | | | $ | (0.10) | |
| Net income (loss) attributable to common stockholders | 0.19 | | | (0.10) | | | (0.12) | |
(1) Potential common shares are not included in the computation of diluted earnings per share (“EPS”) when a net loss exists as the effect would be an antidilutive per share amount.
See accompanying notes.
VENTAS, INC.
CONSOLIDATED STATEMENTS OF COMPREHENSIVE INCOME
(In thousands)
| | | | | | | | | | | | | | | | | |
| For the Years Ended December 31, |
| 2024 | | 2023 | | 2022 |
| Net income (loss) | $ | 88,351 | | | $ | (30,297) | | | $ | (40,931) | |
| Other comprehensive (loss) income: | | | | | |
| Foreign currency translation gain (loss) | 14,433 | | | 6,024 | | | (11,837) | |
| Unrealized loss on available for sale securities | (862) | | | (1,256) | | | (1,838) | |
| Unrealized (loss) gain on derivative instruments | (19,672) | | | (2,766) | | | 39,377 | |
| Total other comprehensive (loss) income | (6,101) | | | 2,002 | | | 25,702 | |
| Comprehensive income (loss) | 82,250 | | | (28,295) | | | (15,229) | |
| Comprehensive (loss) income attributable to noncontrolling interests | (1,135) | | | 11,635 | | | 4,497 | |
| Comprehensive income (loss) attributable to common stockholders | $ | 83,385 | | | $ | (39,930) | | | $ | (19,726) | |
See accompanying notes.
VENTAS, INC.
CONSOLIDATED STATEMENTS OF EQUITY
For the Years Ended December 31, 2024, 2023 and 2022
(In thousands, except per share amounts)
| | | | | | | | | | | | | | | | | | | | | | | | | | | | | | | | | | | | | | | | | | | | | | | |
| Common
Stock Par
Value | | Capital in
Excess of
Par Value | | Accumulated Other Comprehensive Loss | | Retained
Earnings
(Deficit) | | Treasury
Stock | | Total Ventas
Stockholders’
Equity | | Non- controlling
Interests | | Total Equity |
| Balance at January 1, 2022 | $ | 99,838 | | | $ | 15,498,956 | | | $ | (64,520) | | | $ | (4,679,889) | | | $ | — | | | $ | 10,854,385 | | | $ | 91,375 | | | $ | 10,945,760 | |
| Net income | — | | | — | | | — | | | (47,447) | | | — | | | (47,447) | | | 6,516 | | | (40,931) | |
| Other comprehensive income | — | | | — | | | 27,720 | | | — | | | — | | | 27,720 | | | (2,018) | | | 25,702 | |
| Net change in noncontrolling interests | — | | | (9,235) | | | — | | | — | | | — | | | (9,235) | | | (27,164) | | | (36,399) | |
| | | | | | | | | | | | | | | |
| Dividends to common stockholders—$1.80 per share | — | | | — | | | — | | | (722,049) | | | — | | | (722,049) | | | — | | | (722,049) | |
| | | | | | | | | | | | | | | |
| Issuance of common stock for stock plans, restricted stock grants and other | 74 | | | 38,370 | | | — | | | — | | | (536) | | | 37,908 | | | — | | | 37,908 | |
| | | | | | | | | | | | | | | |
| Adjust redeemable OP unitholder interests to current fair value | — | | | 11,480 | | | — | | | — | | | — | | | 11,480 | | | — | | | 11,480 | |
| Redemption of OP Units | — | | | 206 | | | — | | | — | | | — | | | 206 | | | — | | | 206 | |
| | | | | | | | | | | | | | | |
| | | | | | | | | | | | | | | |
| Balance at December 31, 2022 | 99,912 | | | 15,539,777 | | | (36,800) | | | (5,449,385) | | | (536) | | | 10,152,968 | | | 68,709 | | | 10,221,677 | |
| Net loss | — | | | — | | | — | | | (40,973) | | | — | | | (40,973) | | | 10,676 | | | (30,297) | |
| Other comprehensive income | — | | | — | | | 1,043 | | | — | | | — | | | 1,043 | | | 959 | | | 2,002 | |
| | | | | | | | | | | | | | | |
| Net change in noncontrolling interests | — | | | (12,495) | | | — | | | — | | | — | | | (12,495) | | | (23,997) | | | (36,492) | |
| Dividends to common stockholders—$1.80 per share | — | | | 40 | | | — | | | (723,445) | | | — | | | (723,405) | | | — | | | (723,405) | |
| | | | | | | | | | | | | | | |
| Issuance of common stock for stock plans, restricted stock grants and other | 736 | | | 141,552 | | | — | | | — | | | (13,228) | | | 129,060 | | | — | | | 129,060 | |
| Adjust redeemable OP unitholder interests to current fair value | — | | | (18,056) | | | — | | | — | | | — | | | (18,056) | | | — | | | (18,056) | |
| Redemption of OP Units | — | | | (84) | | | — | | | — | | | — | | | (84) | | | — | | | (84) | |
| | | | | | | | | | | | | | | |
| | | | | | | | | | | | | | | |
| Balance at December 31, 2023 | 100,648 | | | 15,650,734 | | | (35,757) | | | (6,213,803) | | | (13,764) | | | 9,488,058 | | | 56,347 | | | 9,544,405 | |
| Net income | — | | | — | | | — | | | 81,153 | | | — | | | 81,153 | | | 7,198 | | | 88,351 | |
| Other comprehensive loss | — | | | — | | | 2,231 | | | — | | | — | | | 2,231 | | | (8,332) | | | (6,101) | |
| | | | | | | | | | | | | | | |
| Net change in noncontrolling interests | — | | | (22,345) | | | — | | | — | | | — | | | (22,345) | | | 3,116 | | | (19,229) | |
| Dividends to common stockholders— $1.80 per share | — | | | 78 | | | — | | | (754,003) | | | — | | | (753,925) | | | — | | | (753,925) | |
| | | | | | | | | | | | | | | |
| Issuance of common stock for stock plans, restricted stock grants and other | 8,471 | | | 2,015,265 | | | — | | | — | | | (11,391) | | | 2,012,345 | | | — | | | 2,012,345 | |
| | | | | | | | | | | | | | | |
| Adjust redeemable OP unitholder interests to current fair value | — | | | (34,169) | | | — | | | — | | | — | | | (34,169) | | | — | | | (34,169) | |
| Redemption of OP Units | — | | | (2,081) | | | — | | | — | | | — | | | (2,081) | | | — | | | (2,081) | |
| Balance at December 31, 2024 | $ | 109,119 | | | $ | 17,607,482 | | | $ | (33,526) | | | $ | (6,886,653) | | | $ | (25,155) | | | $ | 10,771,267 | | | $ | 58,329 | | | $ | 10,829,596 | |
See accompanying notes.
VENTAS, INC.
CONSOLIDATED STATEMENTS OF CASH FLOWS
(In thousands) | | | | | | | | | | | | | | | | | |
| For the Years Ended December 31, |
| 2024 | | 2023 | | 2022 |
| Cash flows from operating activities: | | | | | |
| Net income (loss) | $ | 88,351 | | | $ | (30,297) | | | $ | (40,931) | |
| Adjustments to reconcile net income (loss) to net cash provided by operating activities: | | | | | |
| Depreciation and amortization | 1,253,143 | | | 1,392,461 | | | 1,197,798 | |
| Amortization of deferred revenue and lease intangibles, net | (54,242) | | | (59,604) | | | (63,543) | |
| Other non-cash amortization | 30,143 | | | 22,416 | | | 12,957 | |
| (Reversal of) allowance on loans receivable and investments, net | (166) | | | (20,270) | | | 19,757 | |
| Stock-based compensation | 30,991 | | | 30,987 | | | 30,715 | |
| Straight-lining of rental income | (5,094) | | | (7,597) | | | (11,094) | |
| Loss (gain) on extinguishment of debt, net | 687 | | | (6,104) | | | 581 | |
| Gain on real estate dispositions | (57,009) | | | (62,119) | | | (7,780) | |
| | | | | |
| | | | | |
| Income tax benefit | (43,487) | | | (15,269) | | | (21,348) | |
| Income from unconsolidated entities | (1,563) | | | (13,626) | | | (28,500) | |
| Gain on foreclosure of real estate | — | | | (29,127) | | | — | |
| | | | | |
| Distributions from unconsolidated entities | 18,298 | | | 16,123 | | | 19,847 | |
| | | | | |
| Other | 25,762 | | | (44,503) | | | 52,489 | |
| Changes in operating assets and liabilities: | | | | | |
| Increase in other assets | (117,363) | | | (48,445) | | | (52,897) | |
| Increase in accrued interest payable | 27,205 | | | 1,252 | | | 4,915 | |
| Increase (decrease) in accounts payable and other liabilities | 133,969 | | | (6,405) | | | 7,197 | |
| Net cash provided by operating activities | 1,329,625 | | | 1,119,873 | | | 1,120,163 | |
| Cash flows from investing activities: | | | | | |
| Net investment in real estate property | (1,925,957) | | | (6,466) | | | (446,628) | |
| Investment in loans receivable | (125,363) | | | (2,750) | | | (30,700) | |
| Proceeds from real estate disposals | 329,094 | | | 399,534 | | | 112,926 | |
| Proceeds from loans receivable | 6,870 | | | 44,630 | | | 890 | |
| | | | | |
| Proceeds from sale of interest in unconsolidated entities | — | | | 50,054 | | | — | |
| Net cash assumed in foreclosure of real estate | — | | | 11,615 | | | — | |
| | | | | |
| | | | | |
| Development project expenditures | (322,232) | | | (383,590) | | | (231,939) | |
| Capital expenditures | (281,614) | | | (259,415) | | | (222,130) | |
| Distributions from unconsolidated entities | 8,368 | | | 74,670 | | | 28,311 | |
| Investment in unconsolidated entities | (69,797) | | | (130,522) | | | (83,652) | |
| Insurance proceeds for property damage claims | 3,542 | | | 17,576 | | | 13,704 | |
| Net cash used in investing activities | (2,377,089) | | | (184,664) | | | (859,218) | |
| Cash flows from financing activities: | | | | | |
| Net change in borrowings under revolving credit facilities | (7,103) | | | (12,410) | | | (27,179) | |
| Net change in borrowings under commercial paper program | — | | | (402,354) | | | 122,414 | |
| Proceeds from debt | 1,913,431 | | | 2,527,482 | | | 957,781 | |
| Repayment of debt | (1,621,316) | | | (1,973,132) | | | (575,391) | |
| Purchase of noncontrolling interests | (11,064) | | | (110) | | | (170) | |
| Payment of deferred financing costs | (35,878) | | | (41,837) | | | (8,824) | |
| Issuance of common stock, net | 1,964,867 | | | 108,455 | | | — | |
| Cash distribution to common stockholders | (740,326) | | | (723,559) | | | (720,319) | |
| Cash distribution to redeemable OP unitholders | (6,468) | | | (6,191) | | | (6,292) | |
| Cash issued for redemption of OP Units | (2,416) | | | (1,132) | | | (1,487) | |
| Contributions from noncontrolling interests | 3,703 | | | 20,241 | | | 5,371 | |
| Distributions to noncontrolling interests | (22,300) | | | (32,029) | | | (32,325) | |
| Proceeds from stock option exercises | 26,052 | | | 1,736 | | | 8,691 | |
| Other | (15,962) | | | (8,909) | | | (6,198) | |
| Net cash provided by (used in) financing activities | 1,445,220 | | | (543,749) | | | (283,928) | |
| Net increase (decrease) in cash, cash equivalents and restricted cash | 397,756 | | | 391,460 | | | (22,983) | |
| Effect of foreign currency translation | (3,985) | | | 1,257 | | | (2,869) | |
| Cash, cash equivalents and restricted cash at beginning of year | 563,462 | | | 170,745 | | | 196,597 | |
| Cash, cash equivalents and restricted cash at end of year | $ | 957,233 | | | $ | 563,462 | | | $ | 170,745 | |
VENTAS, INC.
CONSOLIDATED STATEMENTS OF CASH FLOWS (Continued)
(Dollars in thousands)
| | | | | | | | | | | | | | | | | |
| For the Years Ended December 31, |
| 2024 | | 2023 | | 2022 |
| Supplemental disclosure of cash flow information: | | | | | |
| Interest paid excluding capitalized interest | $ | 575,741 | | | $ | 548,108 | | | $ | 467,556 | |
| | | | | |
| | | | | |
| Supplemental schedule of non-cash activities: | | | | | |
| Assets acquired and liabilities assumed from acquisitions and other: | | | | | |
| Real estate investments | $ | 43,086 | | | $ | — | | | $ | 16,540 | |
| Other assets | 12,955 | | | 7,873 | | | 875 | |
| | | | | |
| Other liabilities | 23,489 | | | 9,000 | | | 7,747 | |
| Deferred income tax liability | 28,601 | | | 12,382 | | | 960 | |
| Noncontrolling interests | — | | | — | | | 3,351 | |
| | | | | |
| Settlement of loan receivable | — | | | 486,082 | | | — | |
| Real estate received in settlement of loan receivable | — | | | 1,566,395 | | | — | |
| Assumption of debt related to real estate owned | — | | | 1,016,804 | | | — | |
| Equity issued for redemption of OP Units | 434 | | | — | | | — | |
| Investment in unconsolidated entities | — | | | — | | | 8,100 | |
See accompanying notes.
VENTAS, INC.
NOTES TO CONSOLIDATED FINANCIAL STATEMENTS
NOTE 1 – DESCRIPTION OF BUSINESS
Ventas, Inc., (together with its consolidated subsidiaries, unless otherwise indicated or except where the context otherwise requires, “we,” “us,” “our,” “Company” and other similar terms) is a real estate investment trust (“REIT”) focused on delivering strong, sustainable shareholder returns by enabling exceptional environments that benefit a large and growing aging population. We hold a portfolio that includes senior housing communities, outpatient medical buildings, research centers, hospitals and healthcare facilities located in North America and the United Kingdom. As of December 31, 2024, we owned or had investments in 1,387 properties consisting of 1,356 properties in our reportable business segments (“Segment Properties”) and 31 properties held by unconsolidated real estate entities in our non-segment operations. Our Company is headquartered in Chicago, Illinois with additional corporate offices in Louisville, Kentucky and New York, New York.
We elected to be taxed as a REIT under Sections 856 through 860 of the Internal Revenue Code (the “Code”), commencing with our taxable year ended December 31, 1999. Provided we qualify for taxation as a REIT, we generally are not required to pay U.S. federal corporate income taxes on our REIT taxable income that is currently distributed to our stockholders. In order to maintain our qualification as a REIT, we must satisfy a number of technical requirements, which impact how we invest in, operate and manage our assets.
We operate through three reportable business segments: senior housing operating portfolio, which we refer to as “SHOP,” outpatient medical and research portfolio, which we refer to as “OM&R,” and triple-net leased properties, which we refer to as “NNN.” We also hold assets outside of our reportable business segments, which we refer to as non-segment assets and which consist primarily of corporate assets, including cash and cash equivalents, restricted cash, loans receivable and investments and accounts receivable as well as investments in unconsolidated entities. Our investments in unconsolidated entities include investments made through our third-party institutional private capital management platform, Ventas Investment Management (“VIM”). Through VIM, we partner with third-party institutional investors to invest in real estate through various joint ventures and other co-investment vehicles where we are the sponsor or general partner, including our open-ended investment vehicle, the Ventas Life Science & Healthcare Real Estate Fund (the “Ventas Fund”).
Our chief operating decision maker evaluates performance of the combined properties in each operating segment and determines how to allocate resources to these segments, based on net operating income (“NOI”) for each segment. See our Consolidated Financial Statements and the related notes, including “Note 2 – Accounting Policies” and “Note 18 – Segment Information”.
The following table summarizes information for our portfolio for the year ended December 31, 2024 (dollars in thousands):
| | | | | | | | | | | | | | | | | | | | |
| Segment | | NOI (1) | | Percentage of Total NOI | | Segment Properties |
| Senior housing operating portfolio (SHOP) | | $ | 866,383 | | | 41.9 | % | | 629 | |
| Outpatient medical and research portfolio (OM&R) | | 579,271 | | | 28.0 | % | | 426 | |
| Triple-net leased properties (NNN) | | 606,225 | | | 29.3 | % | | 301 | |
Non-segment (2) | | 17,204 | | | 0.8 | % | | n/a |
| | $ | 2,069,083 | | | 100 | % | | 1,356 | |
______________________________
(1) “NOI” is defined as total revenues, less interest and other income, property-level operating expenses and third-party capital management expenses. See “Non-GAAP Financial Measures” included elsewhere in this Annual Report for additional disclosure and a reconciliation of net income attributable to common stockholders, as computed in accordance with U.S. generally accepted accounting principles (“GAAP”), to NOI.
(2) NOI for non-segment includes management fees and promote revenues, net of expenses related to our third-party institutional private capital management platform, income from loans and investments and corporate-level expenses not directly attributable to any of our three reportable business segments.
NOTE 2 – ACCOUNTING POLICIES
Principles of Consolidation
The accompanying Consolidated Financial Statements include our accounts and the accounts of our wholly-owned subsidiaries and the joint venture entities over which we exercise control. All intercompany transactions and balances have been
VENTAS, INC.
NOTES TO CONSOLIDATED FINANCIAL STATEMENTS
eliminated in consolidation, and our net earnings are reduced by the portion of net earnings attributable to noncontrolling interests.
U.S. generally accepted accounting principles (“GAAP”) require us to identify entities for which control is achieved through means other than voting rights and to determine which business enterprise is the primary beneficiary of variable interest entities (“VIEs”). A VIE is broadly defined as an entity with one or more of the following characteristics: (a) the total equity investment at risk is insufficient to finance the entity’s activities without additional subordinated financial support; (b) as a group, the holders of the equity investment at risk lack (i) the ability to make decisions about the entity’s activities through voting or similar rights, (ii) the obligation to absorb the expected losses of the entity, or (iii) the right to receive the expected residual returns of the entity; and (c) the equity investors have voting rights that are not proportional to their economic interests, and substantially all of the entity’s activities either involve, or are conducted on behalf of, an investor that has disproportionately few voting rights. We consolidate our investment in a VIE when we determine that we are its primary beneficiary. We may change our original assessment of a VIE upon subsequent events such as the modification of contractual arrangements that affects the characteristics or adequacy of the entity’s equity investments at risk and the disposition of all or a portion of an interest held by the primary beneficiary.
We identify the primary beneficiary of a VIE as the enterprise that has both: (i) the power to direct the activities of the VIE that most significantly impact the entity’s economic performance and (ii) the obligation to absorb losses or the right to receive benefits of the VIE that could be significant to the entity. We perform this analysis on an ongoing basis.
As it relates to investments in joint ventures, GAAP may preclude consolidation by the sole general partner in certain circumstances based on the type of rights held by the limited partner or partners. We assess limited partners’ rights and their impact on our consolidation conclusions, and we reassess if there is a change to the terms or in the exercisability of the rights of the limited partners, the sole general partner increases or decreases its ownership of limited partnership (“LP”) interests or there is an increase or decrease in the number of outstanding LP interests. We also apply this guidance to managing member interests in limited liability companies (“LLCs”).
We consolidate several VIEs that share the following common characteristics:
•the VIE is in the legal form of an LP or LLC;
•the VIE was designed to own and manage its underlying real estate investments;
•we are the general partner or managing member of the VIE;
•we own a majority of the voting interests in the VIE;
•a minority of voting interests in the VIE are owned by external third parties, unrelated to us;
•the minority owners do not have substantive kick-out or participating rights in the VIE; and
•we are the primary beneficiary of the VIE.
We have separately identified certain special purpose entities that were established to allow investments in research projects by tax credit investors (“TCIs”). We have determined that these special purpose entities are VIEs, we are a holder of variable interests and we are the primary beneficiary of the VIEs, and therefore, we consolidate these special purpose entities. Our primary beneficiary determination is based upon several factors, including but not limited to the rights we have in directing the activities which most significantly impact the VIEs’ economic performance as well as certain guarantees which protect the TCIs from losses should a tax credit recapture event occur.
VENTAS, INC.
NOTES TO CONSOLIDATED FINANCIAL STATEMENTS
Substantially all of the assets of the VIEs are real estate investments and substantially all of the liabilities of the VIEs are mortgage loans. Assets of the consolidated VIEs can only be used to settle obligations of such VIEs. Liabilities of the consolidated VIEs represent claims against the specific assets of the VIEs. Unless otherwise required by an operating agreement, any mortgage loans of the consolidated VIEs are non-recourse to us. The table below summarizes the total assets and liabilities of our consolidated VIEs as reported on our Consolidated Balance Sheets (dollars in thousands):
| | | | | | | | | | | | | | | | | | | | | | | | | | |
| | As of December 31, 2024 | | As of December 31, 2023 |
| | Total Assets | | Total Liabilities | | Total Assets | | Total Liabilities |
| NHP/PMB L.P. | | $ | 728,457 | | | $ | 286,030 | | | $ | 759,817 | | | $ | 266,658 | |
| Fonds Immobilier Groupe Maurice, S.E.C. | | 1,779,762 | | | 1,121,659 | | | 1,971,410 | | | 1,204,619 | |
| Other identified VIEs | | 1,447,381 | | | 410,721 | | | 1,597,957 | | | 354,828 | |
Tax credit VIEs (1) | | — | | | — | | | 29,746 | | | 4,024 | |
______________________________
(1) Balances as of December 31, 2024 reflect the completion of the tax credit structure unwinds.
Investments in Unconsolidated Entities
We report investments in unconsolidated entities over whose operating and financial policies we have the ability to exercise significant influence under the equity method of accounting. We adjust our investment in unconsolidated entities for additional contributions made, distributions received as well as our share of the investee’s earnings or losses, which is included in Income from unconsolidated entities in our Consolidated Statements of Income.
We base the initial carrying value of investments in unconsolidated entities on the fair value of the assets at the time we acquired the joint venture interest. We estimate fair values for our equity method investments based on discounted cash flow models that include all estimated cash inflows and outflows over a specified holding period and, where applicable, any estimated debt premiums or discounts. The capitalization rates, discount rates and credit spreads we use in these models are based upon assumptions that we believe to be within a reasonable range of current market rates for the respective investments.
We generally amortize any difference between our cost basis and the basis reflected at the joint venture level, if any, over the lives of the related assets and liabilities and include that amortization in our share of income or loss from unconsolidated entities. For earnings of equity method investments with pro rata distribution allocations, net income or loss is allocated between the partners in the joint venture based on their respective stated ownership percentages. In other instances, net income or loss may be allocated between the partners in the joint venture based on the hypothetical liquidation at book value method (the “HLBV method”). Under the HLBV method, net income or loss is allocated between the partners based on the difference between each partner’s claim on the net assets of the joint venture at the end and beginning of the period, after taking into account contributions and distributions. Each partner’s share of the net assets of the joint venture is calculated as the amount that the partner would receive if the joint venture were to liquidate all of its assets at net book value and distribute the resulting cash to creditors and partners in accordance with their respective priorities. Under the HLBV method, in any given period, we could record more or less income than the joint venture has generated, than actual cash distributions we receive or than the amount we may receive in the event of an actual liquidation.
Redeemable OP Unitholder and Noncontrolling Interests
We own a majority interest in NHP/PMB L.P. (“NHP/PMB”), a limited partnership formed in 2008 to acquire properties from entities affiliated with Pacific Medical Buildings LLC (“PMB”). Given our wholly-owned subsidiary is the general partner and the primary beneficiary of NHP/PMB, we consolidate NHP/PMB as a VIE. As of December 31, 2024, third-party investors owned 3.8 million Class A limited partnership units in NHP/PMB (“OP Units”), which represented 33% of the total units then outstanding, and we owned 7.7 million Class B limited partnership units in NHP/PMB, representing the remaining 67%. The OP Units may be redeemed at any time at the election of the holder for cash or, at our option, 0.9051 shares of our common stock per OP Unit, subject to adjustment in certain circumstances. We are party by assumption to a registration rights agreement with the holders of the OP Units that requires us, subject to the terms and conditions and certain exceptions set forth therein, to file and maintain a registration statement relating to the issuance of shares of our common stock upon redemption of OP Units.
The OP Units are classified outside of permanent equity on our Consolidated Balance Sheets because they may be redeemed by third parties under circumstances that are outside of our control. We reflect the OP Units at the greater of cost or redemption value. We recognize changes in fair value through capital in excess of par value, net of cash distributions paid and
VENTAS, INC.
NOTES TO CONSOLIDATED FINANCIAL STATEMENTS
purchases by us of any OP Units. Our diluted earnings per share includes the effect of any potential shares outstanding from redemption of the OP Units.
Certain noncontrolling interests of other consolidated joint ventures were also classified as redeemable at December 31, 2024 and 2023. We record the carrying amount of these noncontrolling interests at the greater of their initial carrying amount (increased or decreased for the noncontrolling interests’ share of net income or loss and distributions) or the redemption value, which is primarily based on the fair value of the underlying real estate asset. Our joint venture partners have certain redemption rights with respect to their noncontrolling interests in these joint ventures that are outside of our control, and the redeemable noncontrolling interests are classified outside of permanent equity on our Consolidated Balance Sheets. We recognize changes in the carrying value of redeemable noncontrolling interests through Capital in excess of par value on our Consolidated Balance Sheets.
Noncontrolling Interests
Excluding the redeemable noncontrolling interests described above, we present the portion of any equity that we do not own in entities that we control (and thus consolidate) as noncontrolling interests and classify those interests as a component of consolidated equity, separate from total Ventas stockholders’ equity, on our Consolidated Balance Sheets. For consolidated joint ventures with pro rata distribution allocations, net income or loss, and comprehensive income, is allocated between the joint venture partners based on their respective stated ownership percentages. In other cases, net income or loss is allocated between the joint venture partners based on the HLBV method. We account for purchases or sales of equity interests that do not result in a change of control as equity transactions, through capital in excess of par value. We include Net income attributable to noncontrolling interests in net income in our Consolidated Statements of Income and we include the noncontrolling interests’ share of comprehensive income in our Consolidated Statements of Comprehensive Income.
Accounting for Historic and New Markets Tax Credits
For certain of our research centers, we are party to contractual arrangements with TCIs that were established to enable the TCIs to receive benefits of historic tax credits (“HTCs”), new markets tax credits (“NMTCs”) or both. As of December 31, 2024 and 2023, we owned zero and one property that had syndicated NMTCs to TCIs.
In general, TCIs invest cash into special purpose entities that invest in entities that own the subject property and generate the tax credits. The TCIs receive substantially all of the tax credits and hold only a nominal interest in the economic risk and benefits of the special purpose entities.
HTCs are delivered to the TCIs upon substantial completion of the project. NMTCs are allowed for up to 39% of a qualified investment and are delivered to the TCIs after the investment has been funded and spent on a qualified business. HTCs are subject to recapture within five years of substantial completion. The amount of the recapture is equal to 100% of the HTCs during the first year after the completion of the historic rehabilitation and is reduced by 20% each year during the subsequent five-year period. NMTCs are subject to recapture until the end of the seventh year following the qualifying investment. We have provided the TCIs with certain guarantees which protect the TCIs from losses should a tax credit recapture event occur. The contractual arrangements with the TCIs include a put/call provision whereby we may be obligated or entitled to repurchase the interest of the TCIs in the special purpose entities at the end of the tax credit recapture period. We anticipate that either the TCIs will exercise their put rights or we will exercise our call rights prior to the applicable tax credit recapture periods.
The portion of the TCI’s investment that is attributed to the put is recorded at fair value at inception in accounts payable and other liabilities on our Consolidated Balance Sheets, and is accreted to the expected put price as interest expense in our Consolidated Statements of Income over the recapture period. The remaining balance of the TCI’s investment is initially recorded in accounts payable and other liabilities on our Consolidated Balance Sheets and will be relieved upon delivery of the tax credit to the TCI, as a reduction in the carrying value of the subject property, net of allocated expenses. Direct and incremental costs incurred in structuring the transaction are deferred and will be recognized as an increase in the cost basis of the subject property upon the recognition of the related tax credit as discussed above.
VENTAS, INC.
NOTES TO CONSOLIDATED FINANCIAL STATEMENTS
Accounting Estimates
The preparation of financial statements in accordance with GAAP requires us to make estimates and assumptions regarding future events that affect the reported amounts of assets and liabilities, the disclosure of contingent assets and liabilities at the date of the financial statements and the reported amounts of revenues and expenses during the reporting period. Actual results could differ from those estimates.
Accounting for Real Estate Acquisitions
When we acquire real estate, we first make reasonable judgments about whether the transaction involves an asset or a business. Our real estate acquisitions are generally accounted for as asset acquisitions as substantially all of the fair value of the gross assets acquired is concentrated in a single identifiable asset or group of similar identifiable assets. We record the cost of the assets acquired as tangible and intangible assets and liabilities based upon their relative fair values as of the acquisition date.
Our asset acquisitions may include one or more groups of real estate properties within which there are different types of tangible and intangible assets, typically consisting of land, buildings, site improvements, furniture, fixtures and equipment and lease intangibles. When we acquire multiple real estate properties in a single transaction, we first assess the individual fair value of the real estate properties and then determine the individual fair value of the various types of tangible and intangible assets therein. The individual fair value of the real estate properties is estimated by applying a valuation methodology such as the direct capitalization method of the income approach, which includes estimate for a capitalization rate, annual gross income, vacancy, and expenses based on a number of factors including historical operating results, known and anticipated trends as well as market and economic conditions.
We estimate the fair value of buildings acquired on an as-if-vacant basis or replacement cost basis and depreciate the building value over the estimated remaining life of the building, generally 35 years. We determine the fair value of other fixed assets, such as site improvements, and furniture, fixtures and equipment, based upon the replacement cost and depreciate such value over the assets’ estimated remaining useful lives, generally 15 years for land improvements and 20 years for building improvements. We determine the value of land either by considering the sales prices of similar properties in recent transactions or based on internal analyses of recently acquired and existing comparable properties within our portfolio. We generally determine the value of construction in progress based upon the replacement cost. However, for certain acquired properties that are part of a ground-up development, we determine fair value by using the same valuation approach as for all other properties and deducting the estimated cost to complete the development. During the remaining construction period, we capitalize project costs until the development has reached substantial completion. Construction in progress, including capitalized interest, is not depreciated until the development has reached substantial completion.
Intangibles primarily include the value of in-place leases and acquired lease contracts. We include all lease-related intangible assets and liabilities within Acquired lease intangibles and Accounts payable and other liabilities, respectively, on our Consolidated Balance Sheets.
The fair value of acquired lease-related intangibles, if any, reflects: (i) the estimated value of any above or below market leases, determined by discounting the difference between the estimated market rent and in-place lease rent; and (ii) the estimated value of in-place leases related to the cost to obtain tenants, including leasing commissions, and an estimated value of the absorption period to reflect the value of the rent and recovery costs foregone during a reasonable lease-up period as if the acquired space was vacant. We amortize any acquired lease-related intangibles to revenue or amortization expense over the remaining life of the associated lease plus any assumed bargain renewal periods. If a lease is terminated prior to its stated expiration or not renewed upon expiration, we recognize all unamortized amounts of lease-related intangibles associated with that lease in operations over the shortened lease term.
We estimate the fair value of purchase option intangible assets and liabilities, if any, by discounting the difference between the applicable property’s acquisition date fair value and an estimate of its future option price. We do not amortize the resulting intangible asset or liability over the term of the lease, but rather adjust the recognized value of the asset or liability upon sale.
In connection with an acquisition, we may assume rights and obligations under certain lease agreements pursuant to which we become the lessee of a given property. We generally assume the lease classification previously determined by the prior lessee absent a modification in the assumed lease agreement. We assess assumed operating leases, including ground leases, to determine whether the lease terms are favorable or unfavorable to us given current market conditions on the acquisition date. To the extent the lease terms are favorable or unfavorable to us relative to market conditions on the acquisition
VENTAS, INC.
NOTES TO CONSOLIDATED FINANCIAL STATEMENTS
date, we recognize an intangible asset or liability at fair value and amortize that asset or liability to Interest or rental expense in our Consolidated Statements of Income over the applicable lease term. Where we are the lessee, we record the acquisition date values of leases, including any above or below market value, within Operating lease assets and Operating lease liabilities on our Consolidated Balance Sheets.
We estimate the fair value of noncontrolling interests assumed consistent with the manner in which we value all of the underlying assets and liabilities.
We calculate the fair value of long-term assumed debt by discounting the remaining contractual cash flows on each instrument at the current market rate for those borrowings, which we approximate based on the rate at which we would expect to incur a replacement instrument on the date of acquisition, and recognize any fair value adjustments related to long-term debt as effective yield adjustments over the remaining term of the instrument.
Impairment of Long-Lived and Intangible Assets
We periodically evaluate our long-lived assets, primarily consisting of investments in real estate, for impairment indicators. If indicators of impairment are present, we evaluate the carrying value of the related real estate investments in relation to the future undiscounted cash flows of the underlying operations. In performing this evaluation, we consider market conditions and our current intentions with respect to holding or disposing of the asset. We adjust the net book value of properties and other long-lived assets to fair value if the sum of the expected future undiscounted cash flows, including sales proceeds, is less than book value. We recognize an impairment loss at the time we make any such determination.
If impairment indicators arise with respect to intangible assets with finite useful lives, we evaluate impairment by comparing the carrying amount of the asset to the estimated future undiscounted net cash flows expected to be generated by the asset. If estimated future undiscounted net cash flows are less than the carrying amount of the asset, then we estimate the fair value of the asset and compare the estimated fair value to the intangible asset’s carrying value. We recognize any shortfall from carrying value as an impairment loss in the current period.
We evaluate our investments in unconsolidated entities for impairment at least annually, and whenever events or changes in circumstances indicate that the carrying value of our investment may exceed its fair value. If we determine that a decline in the fair value of our investment in an unconsolidated entity is other-than-temporary, and if such reduced fair value is below the carrying value, we record an impairment.
We test goodwill for impairment at least annually, and more frequently if indicators of impairment arise. We first assess qualitative factors, such as current macroeconomic conditions, state of the equity and capital markets and our overall financial and operating performance, to determine the likelihood that the fair value of a reporting unit is less than its carrying amount. If we determine it is more likely than not that the fair value of a reporting unit is less than its carrying amount, we proceed with estimating the fair value of the operating unit. A goodwill impairment, if any, will be recognized in the period it is determined and is measured as the amount by which a reporting unit’s carrying value exceeds its fair value.
Estimates of fair value used in our evaluation of goodwill (if necessary based on our qualitative assessment), investments in real estate, investments in unconsolidated entities and intangible assets are based upon discounted future cash flow projections or other acceptable valuation techniques that are based, in turn, upon all available evidence including level three inputs, such as revenue and expense growth rates, estimates of future cash flows, capitalization rates, discount rates, general economic conditions and trends, or other available market data such as replacement cost or comparable sales. Our ability to accurately predict future operating results and cash flows and to estimate and determine fair values impacts the timing and recognition of impairments. While we believe our assumptions are reasonable, changes in these assumptions may have a material impact on our financial results.
Assets Held for Sale
We sell properties from time to time for various reasons, including favorable market conditions or the exercise of purchase options by tenants. We classify certain long-lived assets as held for sale once the criteria, as defined by GAAP, have been met. Long-lived assets to be disposed of are reported at the lower of their carrying amount or fair value minus cost to sell and are no longer depreciated.
If at any time we determine that the criteria for classifying assets as held for sale are no longer met, we reclassify assets within Net real estate property on our Consolidated Balance Sheets for all periods presented. The carrying amount of
VENTAS, INC.
NOTES TO CONSOLIDATED FINANCIAL STATEMENTS
these assets is adjusted in the period in which a change in classification is determined to reflect any depreciation expense that would have been recognized had the asset been continuously classified as net real estate investments.
Loans Receivable
We record loans receivable, other than those acquired in connection with asset acquisition, on our Consolidated Balance Sheets (either in Secured loans receivable and investments, net or Other assets, in the case of non-mortgage loans receivable) at the unpaid principal balance, net of any deferred origination fees, purchase discounts or premiums and valuation allowances. We amortize net deferred origination fees, which are comprised of loan fees collected from the borrower net of certain direct costs, and purchase discounts or premiums over the contractual life of the loan using the effective interest method and immediately recognize in income any unamortized balances if the loan is repaid before its contractual maturity.
We evaluate a current estimate of all expected credit losses over the life of a financial instrument, which may result in recognition of credit losses on loans and other financial instruments before an actual event of default. We evaluate the collectability of our loans receivable based on a combination of credit quality indicators, including, but not limited to, payment status, financial strength of the borrower and guarantors, historical loan write-offs, and nature, extent and value of the underlying collateral. We establish reserves for any estimated credit losses with a corresponding charge to Allowance on loans receivable and investments in our Consolidated Statements of Income. Subsequent changes in our estimate of credit losses may result in a corresponding increase or decrease to Allowance on loans receivable and investments in our Consolidated Statements of Income.
Cash Equivalents
Cash equivalents consist of highly liquid investments with original maturity date of three months or less when purchased. These investments are stated at cost, which approximates fair value.
Escrow Deposits and Restricted Cash
Escrow deposits consist of amounts held by us or our lenders to provide for future real estate tax, insurance expenditures and tenant improvements related to our properties and operations. Restricted cash generally represents amounts paid to us for security deposits and other similar purposes.
Deferred Financing Costs
We amortize deferred financing costs, which are reported as a reduction to Senior notes payable and other debt on our Consolidated Balance Sheets, as a component of interest expense over the terms of the related borrowings using a method that approximates a level yield. Amortization of approximately $28.9 million, $23.2 million and $18.2 million were included in Interest expense for the years ended December 31, 2024, 2023 and 2022, respectively.
Available for Sale Securities
We record our available for sale securities at fair value and include unrealized gains and losses in stockholders’ equity as a component of Accumulated other comprehensive income on our Consolidated Balance Sheets. If we determine that a credit loss exists with respect to individual investments, we will recognize an allowance against the amortized cost basis of the investment with a corresponding charge to net income (in Allowance on loans receivable and investments) in our Consolidated Statements of Income. Income from available for sale securities is recognized when earned and gains or losses on securities sold, which are based on the specific identification method, and reported in Income from loans and investments in our Consolidated Statements of Income.
Derivative Instruments
We recognize all derivative instruments in Other assets or Accounts payable and other liabilities on our Consolidated Balance Sheets at fair value as of the reporting date. We recognize changes in the fair value of derivative instruments designated as cash flow hedges, which are primarily used to hedge interest rate risk, in Accumulated other comprehensive income on our Consolidated Balance Sheets, and are amortized over the life of the related debt to Interest expense in our Consolidated Statements of Income.
VENTAS, INC.
NOTES TO CONSOLIDATED FINANCIAL STATEMENTS
We do not use our derivative financial instruments, including interest rate caps, interest rate swaps and foreign currency forward contracts, for trading or speculative purposes. Our foreign currency forward contracts and certain of our interest rate swaps (including the interest rate swap contracts of consolidated and unconsolidated joint ventures) are designated as effectively hedging the variability of expected cash flows related to their underlying securities and, therefore, also are recorded on our Consolidated Balance Sheets at fair value, with changes in the fair value of these instruments recognized in Accumulated other comprehensive income on our Consolidated Balance Sheets. We recognize any noncontrolling interests’ proportionate share of the changes in fair value of swap contracts of our consolidated joint ventures in Noncontrolling interests on our Consolidated Balance Sheets. We recognize our proportionate share of the change in fair value of swap contracts of our unconsolidated joint ventures in Accumulated other comprehensive income on our Consolidated Balance Sheets. Certain of our other interest rate swaps and rate caps were not designated as having a hedging relationship with the underlying securities and therefore do not meet the criteria for hedge accounting under GAAP. Accordingly, these derivative instruments are recorded on our Consolidated Balance Sheets at fair value, and changes in the fair value of these instruments are recognized in Interest expense in our Consolidated Statements of Income.
Fair Values of Financial Instruments
Fair value is a market-based measurement, not an entity-specific measurement, and we determine fair value based on the assumptions that we expect market participants would use in pricing the asset or liability. As a basis for considering market participant assumptions in fair value measurements, GAAP establishes a fair value hierarchy that distinguishes between market participant assumptions based on market data obtained from sources independent of the reporting entity (observable inputs that are classified within Levels 1 and 2 of the hierarchy) and the reporting entity’s own assumptions about market participant assumptions (unobservable inputs classified within Level 3 of the hierarchy).
The fair value hierarchy is as follows:
•Level 1 inputs - Unadjusted quoted prices for identical assets or liabilities in active markets that we have the ability to access.
•Level 2 inputs - Inputs other than quoted prices included in Level 1 that are directly or indirectly observable for the asset or liability. Level 2 inputs may include quoted prices for similar assets and liabilities in active markets and other inputs for the asset or liability that are observable at commonly quoted intervals, such as interest rates, foreign exchange rates and yield curves.
•Level 3 inputs - Unobservable inputs for the asset or liability, which typically are based on our own assumptions, because there is little, if any, related market activity.
If the determination of the fair value measurement is based on inputs from different levels of the hierarchy, the level within which the entire fair value measurement falls is the lowest-level input that is significant to the fair value measurement in its entirety. If the volume and level of market activity for an asset or liability has decreased significantly relative to the normal market activity for such asset or liability (or similar assets or liabilities), then transactions or quoted prices may not accurately reflect fair value. In addition, if there is evidence that a transaction for an asset or liability is not orderly, little, if any, weight is placed on that transaction price as an indicator of fair value. Our assessment of the significance of a particular input to the fair value measurement in its entirety requires judgment and considers factors specific to the asset or liability.
We use the following methods and assumptions in estimating the fair value of our financial instruments whose fair value is determined on a recurring basis.
•Cash and cash equivalents - The carrying amount of unrestricted cash and cash equivalents reported on our Consolidated Balance Sheets approximates fair value due to the short maturity of these instruments.
•Escrow deposits and restricted cash - The carrying amount of escrow deposits and restricted cash reported on our Consolidated Balance Sheets approximates fair value due to the short maturity of these instruments.
•Loans receivable - We estimate the fair value of loans receivable using Level 2 and Level 3 inputs, including underlying asset performance and credit quality. We discount future cash flows using current interest rates at which similar loans with the same terms and length to maturity would be made to borrowers with similar credit ratings.
•Available for sale securities - We estimate the fair value of marketable debt securities using Level 2 inputs. We observe quoted prices for similar assets or liabilities in active markets that we have the ability to access. We
VENTAS, INC.
NOTES TO CONSOLIDATED FINANCIAL STATEMENTS
consider credit spreads, underlying asset performance and credit quality, default rates and confirmed settlement amounts at maturity.
•Derivative instruments - We estimate the fair value of derivative instruments, including interest rate caps, interest rate swaps, and foreign currency forward contracts, using Level 2 inputs.
◦Interest rate caps - We observe forward yield curves and other relevant information.
◦Interest rate swaps - We observe alternative financing rates derived from market-based financing rates, forward yield curves and discount rates.
◦Foreign currency forward contracts - We estimate the future values of the two currency tranches using forward exchange rates that are based on traded forward points and calculate a present value of the net amount using a discount factor based on observable traded interest rates.
•Stock warrants - We estimate the fair value of stock warrants representing an interest in a public-traded entity using Level 2 inputs that are obtained from public sources such as equity spot price, dividend yield, volatility and risk-free rate. We estimate the fair value of stock warrants representing a financial interest in a private entity based on Level 3 inputs that reflect significant assumptions including underlying enterprise value, market volatility, duration, dividend rate and risk-free rate.
•Senior notes payable and other debt - We estimate the fair value of senior notes payable and other debt using Level 2 inputs. We discount the future cash flows using current interest rates at which we could obtain similar borrowings. For mortgage debt, we may estimate fair value using level three inputs, similar to those used in determining fair value of loans receivable (above).
•Redeemable OP unitholder interests - We estimate the fair value of our redeemable OP unitholder interests using Level 1 inputs. We base fair value on the closing price of our common stock, as OP Units may be redeemed at the election of the holder for cash or, at our option, shares of our common stock, subject to adjustment in certain circumstances.
Revenue Recognition
NNN and OM&R
In accordance with Accounting Standards Codification (“ASC”) 842, Leases (“ASC 842”), we recognize rental revenue for operating lease arrangements when the tenant takes possession or controls the physical leased asset. Certain of our triple-net leases and most of our outpatient medical buildings and research centers’ (collectively, “outpatient medical and research portfolio”) leases provide for periodic and determinable increases in base rent. We recognize base rental revenues under these leases on a straight-line basis over the applicable lease term when collectability of substantially all rents is probable. Recognizing rental income on a straight-line basis generally results in recognized revenues during the first half of a lease term exceeding the cash amounts contractually due from our tenants, creating a straight-line rent receivable that is included in other assets on our Consolidated Balance Sheets. At December 31, 2024 and 2023, this cumulative excess totaled $202.7 million and $194.1 million, respectively (excluding properties classified as held for sale).
Certain of our leases provide for periodic increases in base rent only if certain revenue parameters or other substantive contingencies are met. We recognize the increased rental revenue under these leases as the related parameters or contingencies are met, rather than on a straight-line basis over the applicable lease term.
We assess the probability of collecting substantially all rents under our leases based on several factors, including, among other things, payment history, the financial strength of the tenant and any guarantors, the historical operations and operating trends of the property, the historical payment pattern of the tenant, the type of property, the value of the underlying collateral, if any, expected future performance of the property and current economic conditions. If our evaluation of these factors indicates it is not probable that we will be able to collect substantially all rents under the lease, we record a charge to rental income. If we change our conclusions regarding the probability of collecting rent payments required by a lease, we may recognize adjustments to rental income in the period we make such change in our conclusions.
VENTAS, INC.
NOTES TO CONSOLIDATED FINANCIAL STATEMENTS
We are also entitled to receive reimbursements from our tenants for various property operating costs that we pay on their behalf. We have elected the practical expedient for lessors to account for the lease and nonlease components as a single component pursuant to ASC 842 when the lease component is predominant, the timing and pattern of transfer are the same, and the lease component, if separately accounted for, would be treated as an operating lease. Accordingly, the reimbursements from tenants are recognized as variable lease payments when earned and the corresponding property-level operating costs are expensed when incurred.
SHOP
Our resident agreements are accounted for as leases under ASC 842. Resident leases within our SHOP reportable business segment also contain service elements. We elected the practical expedient to account for our resident leases as a single lease component and recognize resident fees and services, other than move-in fees and certain rent incentives, monthly as services are provided. We recognize move-in fees and certain rent incentives on a straight-line basis over the average resident stay.
Other
We provide various services to our unconsolidated real estate entities in exchange for fees and reimbursements, which are determined in accordance with the terms specific to each arrangement. We recognize these fees as we provide the services.
We may also earn promote revenue within the VIM platform related to the Ventas Fund, a perpetual life investment vehicle focused on investments in research centers, outpatient medical buildings and senior housing communities in North America. Within the Ventas Fund, promote revenue is generally based on the Ventas Fund’s cumulative returns over three-year performance periods. The promote revenue is based on operating performance and real estate valuation of the portfolio, including highly variable inputs such as capitalization rates, market rents, and interest rates. As the asset appreciation is an important driver of the promote and the key inputs in the valuation process can change, we generally recognize promote revenues at or near the end of the performance period. We include these revenues as a component of Third-party capital management revenues in our Consolidated Statements of Income.
We may also earn promote revenues within the VIM platform related to our other investment vehicles. Within these other investment vehicles, promote revenues are generally earned after our partners have received distributions sufficient to provide a specified rate of return on their invested capital.
We recognize interest income from loans and investments, including discounts and premiums, using the effective interest method when collectability is reasonably assured. We apply the effective interest method on a loan-by-loan basis and recognize discounts and premiums as yield adjustments over the related loan term. We recognize interest income on loans with an allowance on a cash basis.
Accounting for Leased Property
We lease real property, primarily land and corporate office space, and equipment, primarily vehicles at our senior housing communities. At lease inception, we establish an operating lease asset and operating lease liability, calculated as the present value of future minimum lease payments on our Consolidated Balance Sheets. As our leases do not provide an implicit rate, we use a discount rate that approximates our incremental borrowing rate available at lease commencement to determine the present value. Our lease expense primarily consists of ground and corporate office leases. Ground lease expense is included in Interest expense and corporate office lease expense is included in General, administrative and professional fees in our Consolidated Statements of Income.
Accounting for Foreclosed Properties
The Company may receive properties pursuant to a foreclosure, deed in lieu of foreclosure or other legal action in full or partial settlement of loans receivable by taking legal title or physical possession of the properties. We refer to such actions as a “foreclosure” and to such properties as “foreclosed properties.” We account for foreclosed properties received in settlement of loans receivable in accordance with ASC 310, Receivables. Foreclosed real estate received in full or partial satisfaction of a loan and any debt assumed upon foreclosure is recorded at fair value at the time of foreclosure. If the amortized cost basis in the loan exceeds the fair value of the collateral received, the difference is recorded as an allowance on loans receivable and investments in the Consolidated Statements of Income. Conversely, if the fair value of the collateral received is higher than the amortized cost basis in the loan, the difference, less the fair value of any debt assumed, less the principal amount of the loan
VENTAS, INC.
NOTES TO CONSOLIDATED FINANCIAL STATEMENTS
receivable (after the reversal of previously recorded allowances), and net of working capital assumed and transaction costs, is recorded as a Gain on foreclosure of real estate in the Consolidated Statements of Income.
Exchangeable Senior Notes
We account for our exchangeable senior notes in accordance with ASC 470-20, Debt - Debt with Conversion and Other Options (after the adoption of Accounting Standards Update (“ASU”) 2020-06, Debt - Debt with Conversion and Other Options (Subtopic 470-20) and Derivatives and Hedging - Contracts in Entity’s Own Equity (Subtopic 815-40): Accounting for Convertible Instruments and Contracts in an Entity’s Own Equity (“ASU 2020-06”)). We evaluate the exchange features embedded in our exchangeable senior notes in accordance with ASC 815, Derivatives and Hedging. ASC 815 requires embedded derivatives to be separated from their host non-derivative contracts and accounted for as free-standing derivative financial instruments if, and only if, each of the following three criteria is met: (a) the economic characteristics and risks of the embedded derivative instrument are not clearly and closely related to the economic characteristics and risks of the host contract, (b) the hybrid instrument that embodies both the embedded derivative instrument and the host contract is not re-measured at fair value under otherwise applicable GAAP with changes in fair value reported in earnings as they occur and (c) a separate instrument with the same terms as the embedded derivative instrument would be considered a derivative instrument. Certain contracts that involve an entity’s own equity are explicitly exempted from the requirements of ASC 815.
Stock-Based Compensation
We recognize share-based payments to employees and directors, including grants of restricted stock and restricted stock units (including time-based and performance-based awards), included in General, administrative and professional fees in our Consolidated Statements of Income generally on a straight-line basis over the requisite service period based on the grant date fair value of the award. Forfeitures of share-based awards are recognized as they occur.
Transaction, Transition and Restructuring Costs
Transaction, transition and restructuring costs include expenses relating to mergers, acquisitions and investments; expenses relating to strategic transactions, such as spin-offs, joint ventures, partnerships, significant lease and management agreement transactions and similar arrangements; transition and integration expenses incurred by properties that have undergone operator or business model transitions; and expenses relating to organizational and other restructuring activities.
Other Expense
Other expense includes the changes in fair value of stock warrants, net expenses or recoveries related to significant disruptive events and other expenses or income.
Gain on Real Estate Dispositions
We recognize a gain on real estate disposition when we transfer control of a property and when it is probable that we will collect substantially all of the related consideration.
Federal Income Tax
We have elected to be treated as a REIT under the applicable provisions of the Internal Revenue Code of 1986, as amended (the “Code”), for every year beginning with the year ended December 31, 1999. Accordingly, we generally are not subject to federal income tax on net income that we distribute to our stockholders, provided that we continue to qualify as a REIT. However, with respect to certain of our subsidiaries that have elected to be treated as taxable REIT subsidiaries (“TRS” or “TRS entities”), we record income tax expense or benefit, as those entities are subject to federal income tax similar to regular corporations. Certain foreign subsidiaries are subject to foreign income tax, although they did not elect to be treated as TRSs.
We account for deferred income taxes using the asset and liability method and recognize deferred tax assets and liabilities for the expected future tax consequences of events that have been included in our financial statements or tax returns. Under this method, we determine deferred tax assets and liabilities based on the differences between the financial reporting and tax bases of assets and liabilities using enacted tax rates in effect for the year in which the differences are expected to reverse. Any increase or decrease in the deferred tax liability that results from a change in circumstances, and that causes us to change our judgment about expected future tax consequences of events, is included in the tax provision when such changes occur. Deferred income taxes also reflect the impact of operating loss and tax credit carryforwards. A valuation allowance is provided
VENTAS, INC.
NOTES TO CONSOLIDATED FINANCIAL STATEMENTS
if we believe it is more likely than not that all or some portion of the deferred tax asset will not be realized. Any increase or decrease in the valuation allowance that results from a change in circumstances, and that causes us to change our judgment about the realizability of the related deferred tax asset, is included in the tax provision when such changes occur.
We recognize the tax benefit from an uncertain tax position claimed or expected to be claimed on a tax return only if it is more likely than not that the tax position will be sustained on examination by taxing authorities, based on the technical merits of the position. The tax benefits recognized in the financial statements from such a position are measured based on the largest benefit that has a greater than fifty percent likelihood of being realized upon ultimate settlement. We recognize interest and penalties, if applicable, related to uncertain tax positions as part of Income tax benefit in our Consolidated Statements of Income.
Foreign Currency
Certain of our subsidiaries’ functional currencies are the local currencies of their respective foreign jurisdictions. We translate the results of operations of our foreign subsidiaries into U.S. dollars using average rates of exchange in effect during the period, and we translate balance sheet accounts using exchange rates in effect at the end of the period. We record the resulting currency translation adjustments in Accumulated other comprehensive income, a component of stockholders’ equity, on our Consolidated Balance Sheets, and we record foreign currency transaction gains and losses in Other expense (income) in our Consolidated Statements of Income. We recognize any noncontrolling interests’ proportionate share of currency translation adjustments of our foreign consolidated joint ventures in Noncontrolling interests on our Consolidated Balance Sheets.
Segment Reporting
As of December 31, 2024, we operated through three reportable business segments: SHOP, OM&R and NNN. In our SHOP segment, we own and invest in senior housing communities throughout the United States and Canada and engage operators to operate those communities. In our OM&R segment, we primarily acquire, own, develop, lease and manage outpatient medical buildings and research centers throughout the United States. In our NNN segment, we invest in and own senior housing communities, skilled nursing facilities (“SNFs”), long-term acute care facilities (“LTACs”), freestanding inpatient rehabilitation facilities (“IRFs”) and other healthcare facilities, throughout the United States and the United Kingdom and lease these properties to tenants under triple-net or absolute-net leases that obligate the tenants to pay all property-related expenses, including maintenance, utilities, repairs, taxes, insurance and capital expenditures. See “Note 18 – Segment Information.”
Government Assistance
We applied for and received grants under Phase 2, Phase 3 and Phase 4 of the Provider Relief Fund administered by the U.S. Department of Health & Human Services (“HHS”) on behalf of the assisted living communities in our senior living operations segment to partially mitigate losses attributable to COVID-19. These grants are intended to reimburse eligible providers for expenses incurred to prevent, prepare for and respond to COVID-19 and lost revenues attributable to COVID-19. We will not be required to repay distributions from the Provider Relief Fund, provided that we attest to and comply with certain terms and conditions, including, not using grants received from the Provider Relief Fund to reimburse expenses or losses that other sources are obligated to reimburse, reporting and record keeping requirements and cooperating with any government audits. See “Government Regulation—CARES Act and Similar Governmental Funding Programs” in Part I, Item 1 of this Annual Report.
We, and our managers, tenants, borrowers and investments in unconsolidated entities also received grants under other government programs on behalf of our senior housing communities primarily to partially mitigate losses attributable to COVID-19.
During 2024 and 2023, we did not receive any HHS grants. During 2022, we received $54.2 million in HHS grants. These grants are recognized as a contra expense within Property-level operating expenses in our Consolidated Statements of Income in the period in which they were received. Any grants that are ultimately received and retained by us are not expected to fully offset the losses incurred in our SHOP segment that are attributable to COVID-19. Further, although we continue to monitor and evaluate the terms and conditions associated with these government grants, we cannot assure you that we will be in compliance with all requirements related to the payments received, in which case some or all of the grants received may need to be repaid.
VENTAS, INC.
NOTES TO CONSOLIDATED FINANCIAL STATEMENTS
Recent Accounting Standards
In December 2023, the FASB issued Accounting Standards Update 2023-09, Improvements to Income Tax Disclosures (“ASU 2023-09”), which requires public entities on an annual basis to (1) disclose specific categories in the rate reconciliation and (2) provide additional information for reconciling items that meet a quantitative threshold (if the effect of those reconciling items is equal to or greater than 5 percent of the amount computed by multiplying pretax income or loss by the applicable statutory income tax rate). ASU 2023-09 is effective for fiscal years beginning after December 15, 2024. We are evaluating the impact of adopting ASU 2023-09 on our Consolidated Financial Statements.
In March 2024, the SEC adopted the final rule under SEC Release No. 33-11275, The Enhancement and Standardization of Climate Related Disclosures for Investors, which requires registrants to disclose climate-related information in registration statements and annual reports. The new rules would be effective for annual reporting periods beginning in fiscal year 2025. However, in April 2024, the SEC exercised its discretion to stay these rules pending the completion of judicial review of certain consolidated petitions with the United States Court of Appeals for the Eighth Circuit in connection with these rules. We are evaluating the impact of this rule on our Consolidated Financial Statements.
On November 4, 2024, the FASB issued ASU 2024-03, Disaggregation of Income Statement Expenses (DISE), which requires disaggregated disclosure of income statement expenses for public business entities (PBEs). ASU 2024-03 requires a footnote disclosure about specific expenses by requiring PBEs to disaggregate, in a tabular presentation, each relevant expense caption on the face of the income statement that includes certain natural expenses relevant to the Company, such as (1) employee compensation, (2) depreciation and (3) intangible asset amortization. The tabular disclosure would also include certain other expenses, when applicable. The ASU does not change the expense captions an entity presents on the face of the income statement; rather, it requires disaggregation of certain expense captions into specified categories in disclosures within the footnotes to the financial statements. ASU 2024-03 is effective for annual reporting periods beginning after December 15, 2026 and interim reporting periods beginning after December 15, 2027. The requirements will be applied prospectively with the option for retrospective application. We are evaluating the impact of adopting ASU 2024-03 on our Consolidated Financial Statements.
Reclassifications
To conform to the current year presentation, expenses related to shareholder relations matters for the comparative periods have been reclassified from Transaction, transition and restructuring costs and presented separately in our Consolidated Statements of Income.
NOTE 3 – CONCENTRATION OF CREDIT RISK
We use total revenues and total NOI in assessing our concentration of credit risk. See “Non-GAAP Financial Measures” included elsewhere in this Annual Report for additional disclosure and a reconciliation of net income attributable to common stockholders, as computed in accordance with GAAP, to total NOI.
We are exposed to the credit risk of our tenants in our NNN and OM&R segments because those tenants are obligated to pay us rent and, in certain instances pay or reimburse us for some or all property-related expenses, including utilities, real estate taxes, insurance, repairs and maintenance, cleaning, roads and grounds expense and other expenses.. Because we engage independent managers to manage the properties in our SHOP segment in exchange for a management fee, we are not directly exposed to their credit risk in the same manner or to the same extent as the tenants in our NNN and OM&R segments.
Our consolidated properties were located in 48 states, the District of Columbia, seven Canadian provinces and the United Kingdom as of December 31, 2024, with properties in one state (California) accounting for more than 10% of our total revenues and NOI for each of the years ended December 31, 2024, 2023 and 2022.
VENTAS, INC.
NOTES TO CONSOLIDATED FINANCIAL STATEMENTS
The following table summarizes certain information about our credit risk concentration for our NNN and OM&R segments for the years presented:
| | | | | | | | | | | | | | | | | |
| | For the Years Ended December 31, |
| | 2024 | | 2023 | | 2022 |
Contribution as a Percentage of Total Revenues (1): | | | | | |
Brookdale Senior Living (“Brookdale”) (2) (3) | 3.1 | % | | 3.3 | % | | 3.6 | % |
Ardent Health Partners, LLC (together with its subsidiaries, “Ardent”) (4) | 2.8 | | | 3.0 | | | 3.2 | |
| Kindred Healthcare, LLC (together with its subsidiaries, “Kindred”) | 2.8 | | | 2.9 | | | 3.2 | |
| All others | 22.8 | | | 25.0 | | | 25.7 | |
| Contribution as a Percentage of Total NOI: | | | | | |
Brookdale (2) (3) | 7.2 | % | | 7.7 | % | | 8.1 | % |
| Kindred | 6.7 | | | 6.9 | | | 7.3 | |
Ardent (4) | 6.6 | | | 6.9 | | | 7.1 | |
| All others | 37.6 | | | 41.5 | | | 42.4 | |
______________________________
(1)Represents percentage of total revenues which include third-party capital management revenues, income from loans and investments and interest and other income.
(2)The 2024, 2023 and 2022 results include $42.0 million, $42.6 million and $42.6 million, respectively, of amortization of up-front consideration received in 2020 from a revised master lease agreement with Brookdale.
(3)Results exclude nine senior housing communities which are included in our SHOP segment.
(4)Results exclude 19 outpatient medical buildings included in “All others.”
Each of our Brookdale, Ardent and Kindred leases is guaranteed by a corporate parent.
Lease Income
Rental income from our NNN and OM&R operating leases consists of fixed and variable lease payments. The variable payments primarily represent reimbursements of various property-level operating expenses that we pay on behalf of our tenants. The following table summarizes rental income from our NNN and OM&R operating leases (in thousands):
| | | | | | | | | | | | | | | | | |
| For the Years Ended December 31, |
| 2024 | | 2023 | | 2022 |
| Fixed income from operating leases | $ | 1,251,042 | | | $ | 1,241,075 | | | $ | 1,192,607 | |
| Variable income from operating leases | 245,898 | | | 245,326 | | | 206,706 | |
VENTAS, INC.
NOTES TO CONSOLIDATED FINANCIAL STATEMENTS
Future Contractual Rents
The following table sets forth the minimum lease payments under the existing lease for all of our consolidated triple-net and outpatient medical and research building leases as of December 31, 2024 (excluding properties classified as held for sale as of December 31, 2024, dollars in thousands):
| | | | | | | | | | | | | | | | | | | | | | | | | | | | | |
| Brookdale Senior Living (1) | | Ardent | | Kindred | | Other | | Total |
| 2025 | $ | 158,858 | | | $ | 152,913 | | | $ | 137,178 | | | $ | 739,668 | | | $ | 1,188,617 | |
| 2026 | 72,350 | | | 152,354 | | | 133,747 | | | 684,967 | | | 1,043,418 | |
| 2027 | 72,350 | | | 151,237 | | | 133,747 | | | 584,104 | | | 941,438 | |
| 2028 | 72,350 | | | 151,237 | | | 116,007 | | | 483,548 | | | 823,142 | |
| 2029 | 72,350 | | | 151,237 | | | 107,137 | | | 381,595 | | | 712,319 | |
| Thereafter | 434,102 | | | 839,613 | | | 116,863 | | | 1,296,791 | | | 2,687,369 | |
| Total | $ | 882,360 | | | $ | 1,598,591 | | | $ | 744,679 | | | $ | 4,170,673 | | | $ | 7,396,303 | |
______________________________
(1)2025 minimum lease payments include all assets covered by the Brookdale lease as of December 31, 2024, of which $86.5 million is associated with 56 senior housing properties for which the lease will expire on December 31, 2025.
NOTE 4 – ACQUISITIONS OF REAL ESTATE PROPERTY
We acquire and invest in senior housing, outpatient medical buildings, research centers and other healthcare properties primarily to achieve an expected yield on our investment, to grow and diversify our portfolio and revenue base, and to reduce our dependence on any single manager or tenant, geographic location, asset type, business model or revenue source. Each of our acquisitions disclosed below was accounted for as an asset acquisition.
2025 Acquisitions
In January 2025, we acquired two senior housing communities reported within our SHOP segment for an aggregate purchase price of $70.0 million.
2024 Acquisitions
During the year ended December 31, 2024, we acquired 50 senior housing communities reported within our SHOP segment and five long-term acute care facilities (“LTACs”) reported within our NNN segment for an aggregate purchase price of $1.9 billion.
2022 Acquisitions
During the year ended December 31, 2022, for an aggregate purchase price of $453.2 million, we acquired 18 outpatient medical buildings leased to affiliates of Ardent, one behavioral health center, one research center (all of which are reported within our OM&R segment) and two senior housing communities (which are reported within our SHOP segment).
NOTE 5 – DISPOSITIONS, ASSETS HELD FOR SALE AND IMPAIRMENTS
2024 Activity
During the year ended December 31, 2024, we sold 19 senior housing communities in our SHOP segment, 12 outpatient medical buildings (one of which was vacant) in our OM&R segment and 24 properties in our NNN segment for aggregate consideration of $315.1 million and recognized $57.0 million in Gain on real estate dispositions in our Consolidated Statements of Income.
VENTAS, INC.
NOTES TO CONSOLIDATED FINANCIAL STATEMENTS
2023 Activity
During the year ended December 31, 2023, we sold seven communities in our SHOP segment, 10 properties in our OM&R segment, nine properties in our NNN segment and two land parcels for aggregate consideration of $399.5 million and recognized a gain on the sale of these assets of $62.1 million in our Consolidated Statements of Income.
2022 Activity
During the year ended December 31, 2022, we sold seven communities in our SHOP segment, two properties in our OM&R segment, three properties in our NNN segment, two vacant properties for aggregate consideration of $115.1 million and recognized a net gain on the sale of these assets of $7.8 million in our Consolidated Statements of Income.
Assets Held for Sale
The table below summarizes our real estate assets classified as held for sale including the amounts reported on our Consolidated Balance Sheets (dollars in thousands):
| | | | | | | | | | | | | | | | | | | | | | | | | | | | | | | | | | | | | | |
| | As of December 31, 2024 | | As of December 31, 2023 |
| | Segment Properties Held for Sale | | Assets Held for Sale | | Liabilities Related to Assets
Held for Sale | | Segment Properties Held for Sale | | Assets Held for Sale | | Liabilities Related to Assets
Held for Sale |
| SHOP | | 2 | | | $ | 18,612 | | | $ | 2,158 | | | 13 | | | $ | 48,173 | | | $ | 6,419 | |
OM&R (1) | | — | | | 13 | | | 568 | | | 3 | | | 5,431 | | | 2,643 | |
| NNN | | — | | | — | | | — | | | 1 | | | 2,885 | | | 181 | |
| Total | | 2 | | | $ | 18,625 | | | $ | 2,726 | | | 17 | | | $ | 56,489 | | | $ | 9,243 | |
______________________________
(1)The balances as of December 31, 2024 relate to a partial sale of a building, as such, the property count did not change.
Real Estate Impairments
For the year ended December 31, 2024, we recognized impairments of $86.0 million comprising of $43.8 million, $1.5 million and $40.7 million impairments in our SHOP, OM&R and NNN segments, respectively. For the year ended December 31, 2023, we recognized impairments of $226.6 million comprising of $190.5 million, $19.2 million and $16.9 million impairments in our SHOP, OM&R and NNN segments, respectively. For the year ended December 31, 2022, we recognized impairments of $107.8 million comprising of $76.4 million, $27.5 million and $3.9 million impairments in our SHOP, OM&R and NNN segments, respectively. The impairments are recorded primarily as a component of Depreciation and amortization in our Consolidated Statements of Income. The impairments recorded were primarily a result of a change in our intent to hold or a change in the future cash flows of the impaired assets.
VENTAS, INC.
NOTES TO CONSOLIDATED FINANCIAL STATEMENTS
NOTE 6 – LOANS RECEIVABLE AND INVESTMENTS
As of December 31, 2024 and 2023, we held $173.0 million and $54.1 million, respectively, of loans receivable and investments, net of allowance, relating to senior housing and healthcare operators or properties. The following is a summary of our loans receivable and investments, net, including amortized cost, fair value and unrealized gains or losses on available for sale investments, if applicable (dollars in thousands):
| | | | | | | | | | | | | | | | | | | | | | | | | |
| Amortized Cost | | Allowance | | | | Carrying Amount | | Fair Value |
| As of December 31, 2024: | | | | | | | | | |
Secured/mortgage loans and other, net (1) | $ | 144,872 | | | $ | — | | | | | $ | 144,872 | | | $ | 146,229 | |
| | | | | | | | | |
| | | | | | | | | |
Non-mortgage loans receivable, net (2) | 31,939 | | | (3,810) | | | | | 28,129 | | | 27,640 | |
| | | | | | | | | |
| Total loans receivable and investments, net | $ | 176,811 | | | $ | (3,810) | | | | | $ | 173,001 | | | $ | 173,869 | |
| | | | | | | | | |
| As of December 31, 2023: | | | | | | | | | |
Secured/mortgage loans and other, net (1) | $ | 27,986 | | | $ | — | | | | | $ | 27,986 | | | $ | 27,947 | |
| | | | | | | | | |
| | | | | | | | | |
Non-mortgage loans receivable, net (2) | 30,128 | | | (3,976) | | | | | 26,152 | | | 25,200 | |
| | | | | | | | | |
| Total loans receivable and investments, net | $ | 58,114 | | | $ | (3,976) | | | | | $ | 54,138 | | | $ | 53,147 | |
______________________________
(1)Investments have contractual maturities ranging from 2025 to 2027.
(2)Included in Other assets on our Consolidated Balance Sheets.
2024 Activity
In September 2024, we provided new secured debt financing of $109.0 million to the owner of a senior housing property, secured by the asset and with additional credit support. The loan provides us with a right of first offer to purchase the asset on certain terms and conditions. The loan has a 3-year term and bears interest at a variable rate based on one-month SOFR, subject to a floor of 4.50%, plus a spread of 5.75%, increasing to 6.00% commencing October 1, 2025.
2023 Activity
On May 1, 2023, we took ownership of the properties that secured the Company’s cash-pay non-recourse mezzanine loan to Santerre Health Investors (the “Santerre Mezzanine Loan”) by converting the outstanding principal amount of the Santerre Mezzanine Loan to equity, with no additional consideration being paid. As a result, the Santerre Mezzanine Loan is no longer outstanding. The properties consisted of a diverse pool of outpatient medical buildings, senior housing communities, triple-net leased skilled nursing facilities and hospital assets in the United States, which, at the time, also secured a $1 billion non-recourse senior mortgage loan issued under the CHC Commercial Mortgage Trust 2019-CHC (the “CHC Mortgage Loan”). For additional information regarding the CHC Mortgage Loan, see “Note 10 – Senior Notes Payable and Other Debt.”
Upon taking ownership of the portfolio, we reversed the previously recorded (in 2022) $20.0 million CECL allowance and recognized a Gain on foreclosure of real estate of $29.1 million in our Consolidated Statements of Income. The gain is the fair value of the properties that secured the Santerre Mezzanine Loan, less the fair value of the CHC Mortgage Loan, less the principal amount of the Santerre Mezzanine Loan on May 1, 2023 (after the reversal of previously recorded allowances), and net of non-real estate assets and liabilities and transaction costs. For additional information, see “Note 11 – Fair Values of Financial Instruments.”
VENTAS, INC.
NOTES TO CONSOLIDATED FINANCIAL STATEMENTS
NOTE 7 – INVESTMENTS IN UNCONSOLIDATED ENTITIES
We report investments in unconsolidated entities over whose operating and financial policies we have the ability to exercise significant influence under the equity method of accounting. Our investments in unconsolidated entities include investments in both real estate entities and operating entities as described further below.
Investments in Unconsolidated Real Estate Entities
Below is a summary of our investments in unconsolidated real estate entities, including through VIM, as of December 31, 2024 and 2023, respectively (dollars in thousands):
| | | | | | | | | | | | | | | | | | | | | | | | | | |
| | Ownership (1) as of December 31, | | Carrying Amount as of December 31, |
| | 2024 | | 2023 | | 2024 | | 2023 |
| Investments in unconsolidated real estate entities: | | | | | | | | |
| Ventas Life Science & Healthcare Real Estate Fund | | 20.0% | | 20.1% | | $ | 267,202 | | | $ | 264,442 | |
| Pension Fund Joint Venture | | 25.0% | | 25.0% | | 11,939 | | | 22,169 | |
| Research & Innovation Development Joint Venture | | 53.0% | | 53.0% | | 309,499 | | | 275,829 | |
| Ventas Investment Management platform | | | | | | 588,640 | | | 562,440 | |
| Atrium Health & Wake Forest Joint Venture | | 48.5% | | 48.5% | | 36,881 | | | 35,137 | |
All other (2) | | 34.0%-37.5% | | 34.0%-37.5% | | 601 | | | 629 | |
| Total investments in unconsolidated real estate entities | | | | | | $ | 626,122 | | | $ | 598,206 | |
______________________________
(1) The entities in which we have an ownership interest may have less than a 100% interest in the underlying real estate. The ownership percentages in the table reflect our interest in the entities. Joint venture members, including us in some instances, have equity participation rights based on the underlying performance of the investments, which could result in non pro rata distributions.
(2) Includes investments in parking structures and other de minimis investments in unconsolidated real estate entities.
We provide various services to our unconsolidated real estate entities in exchange for fees and reimbursements. Total management fees earned in connection with these services were $15.5 million, $14.7 million and $14.5 million for the years ended December 31, 2024, 2023 and 2022, respectively. Such amounts, along with any promote revenue, are included in Third-party capital management revenues in our Consolidated Statements of Income.
Investments in Unconsolidated Operating Entities
We own investments in unconsolidated operating entities such as Ardent and Atria, which are included within Other assets on our Consolidated Balance Sheets.
As of December 31, 2024, we held a 34% ownership interest in Atria, which entitles us to customary minority rights and protections, including the right to appoint two members to the Atria Board of Directors.
As of December 31, 2024, we held an approximately 6.7% ownership interest in Ardent. One of our executive officers is currently a member of the Ardent Board of Directors. Going forward, we have the right (but not the obligation) to nominate one member of the Ardent Board of Directors for so long as we beneficially own 4% or more of the total voting power of the outstanding common stock of Ardent, pursuant to our nomination agreement with Ardent. Following Ardent’s initial public offering, which was consummated in July 2024, our equity stake in Ardent decreased from the issuance of primary shares from 7.5% to approximately 6.7%, which resulted in a gain of $8.7 million for the year ended December 31, 2024, which is included in Income from unconsolidated entities in our Consolidated Statements of Income.
In May 2023, we sold approximately 24% of our ownership interest in Ardent to a third-party investor for $50.1 million in total proceeds. As a result of the sale, we recognized $33.5 million of gain for the year ended December 31, 2023 in Income from unconsolidated entities in our Consolidated Statements of Income and our ownership interest in Ardent was reduced from 9.8% to 7.5%.
VENTAS, INC.
NOTES TO CONSOLIDATED FINANCIAL STATEMENTS
Pursuant to Rule 3-09 and Rule 4-08(g) of Regulation S-X under the Securities Act, we are required to present summarized financial information of the combined accounts of our unconsolidated entities accounted for by the equity method. The following table summarizes the combined unaudited financial information of our equity method investments, based on the most recent financial information available to us as of the respective reporting dates and periods (dollars in thousands):
| | | | | | | | | | | |
| As of December 31, |
| 2024 | | 2023 |
| Total assets | $ | 9,813,724 | | | $ | 9,423,867 | |
| Total liabilities | 6,168,639 | | | 6,133,776 | |
| Total noncontrolling interests | 582,678 | | | 574,575 | |
| Total equity, net of noncontrolling interests | 3,062,405 | | | 2,715,516 | |
| | | | | | | | | | | | | | | | | |
| For the Years Ended December 31, |
| 2024 | | 2023 | | 2022 |
| Total revenues | $ | 7,121,808 | | | $ | 6,526,010 | | | $ | 6,193,393 | |
| Total pre-tax income | 313,313 | | | 43,100 | | | 335,793 | |
| Net income (loss) attributable to common stockholders | 196,984 | | | (44,313) | | | 212,112 | |
NOTE 8 – INTANGIBLES
The following is a summary of our intangibles (dollars in thousands):
| | | | | | | | | | | | | | | | | | | | | | | |
| | As of December 31, 2024 | | As of December 31, 2023 |
| | Balance | | Weighted Average
Remaining Amortization
Period in Years | | Balance | | Weighted Average
Remaining Amortization
Period in Years |
| Intangible assets: | | | | | | | |
Above-market lease intangibles (1) | $ | 124,515 | | | 4.3 | | $ | 130,371 | | | 4.8 |
In-place lease and other real estate intangibles (2) | 1,434,236 | | | 8.4 | | 1,317,775 | | | 8.3 |
| Acquired lease intangibles | 1,558,751 | | | | | 1,448,146 | | | |
| Goodwill | 1,044,915 | | | N/A | | 1,045,176 | | | N/A |
Other intangibles (2) | 41,190 | | | 24.4 | | 34,440 | | | 4.8 |
| Accumulated amortization | (1,286,374) | | | N/A | | (1,189,817) | | | N/A |
| Net intangible assets | $ | 1,358,482 | | | 8.8 | | $ | 1,337,945 | | | 8.0 |
| Intangible liabilities: | | | | | | | |
Below-market lease intangibles (1) | $ | 269,572 | | | 7.0 | | $ | 306,499 | | | 8.1 |
| Other lease intangibles | 13,498 | | | N/A | | 13,498 | | | N/A |
| Accumulated amortization | (211,441) | | | N/A | | (241,600) | | | N/A |
| Purchase option intangibles | 3,568 | | | N/A | | 3,568 | | | N/A |
| Net intangible liabilities | $ | 75,197 | | | 7.0 | | $ | 81,965 | | | 8.1 |
______________________________
(1) Amortization of above- and below-market lease intangibles is recorded as a decrease and an increase to revenues, respectively, in our Consolidated Statements of Income.
(2) Amortization of intangibles is recorded in Depreciation and amortization in our Consolidated Statements of Income.
N/A—Not Applicable
Other intangibles (including non-compete agreements, trade names and trademarks) are included in Other assets on our Consolidated Balance Sheets. Net intangible liabilities are included in Accounts payable and other liabilities on our Consolidated Balance Sheets. For the years ended December 31, 2024, 2023 and 2022, our net amortization related to these intangibles was $80.8 million, $111.2 million and $102.4 million, respectively.
VENTAS, INC.
NOTES TO CONSOLIDATED FINANCIAL STATEMENTS
The following is a summary of the estimated net amortization related to these intangibles for each of the next five years (dollars in thousands):
| | | | | |
| Estimated Net Amortization |
| 2025 | $ | 104,042 | |
| 2026 | 41,445 | |
| 2027 | 14,830 | |
| 2028 | 12,723 | |
| 2029 | 8,730 | |
The table below reflects the carrying amount of goodwill, by segment, as of December 31, 2024 (dollars in thousands):
| | | | | | | | |
| | | Goodwill |
| OM&R | | $ | 466,967 | |
| NNN | | 318,412 | |
| SHOP | | 259,536 | |
| Total goodwill | | $ | 1,044,915 | |
There were no significant changes in the allocation of goodwill or any impairments during the years ended December 31, 2024, 2023 and 2022.
NOTE 9 – OTHER ASSETS
The following is a summary of our other assets (dollars in thousands):
| | | | | | | | | | | |
| As of December 31, |
| 2024 | | 2023 |
| Straight-line rent receivables | $ | 202,675 | | | $ | 194,108 | |
| Deferred lease costs, net | 145,973 | | | 118,556 | |
Accounts receivable, net (1) | 108,138 | | | 76,091 | |
| Investment in unconsolidated operating entities | 95,623 | | | 80,312 | |
| Stock warrants | 40,192 | | | 59,281 | |
| Non-mortgage loans receivable, net | 28,129 | | | 26,152 | |
| | | |
| Other intangibles, net | 11,513 | | | 5,584 | |
| Other | 160,420 | | | 123,326 | |
| Total other assets | $ | 792,663 | | | $ | 683,410 | |
______________________________
(1) Allowance for doubtful accounts as of December 31, 2024 and 2023 were $70.3 million and $75.5 million, respectively.
In the above table, stock warrants as of December 31, 2024 represent: (1) warrants exercisable at any time prior to December 31, 2025, in whole or in part, for 11.1 million shares of Brookdale Senior Living, Inc common stock (“Brookdale Common Stock”) at an exercise price of $3.00 per share (the “Brookdale Warrants”), and (2) warrants exercisable at any time prior to September 13, 2034 for 9.9% of the common equity of a parent company of Kindred Healthcare, LLC (“Kindred”) exercisable at the pre-transaction value of such common equity (the “Scion Warrants”). We received the Scion Warrants in September 2024 as part of the consideration for a lease amendment that we entered into with Kindred and its parent companies, ScionHealth.
During the year ended December 31, 2024, we exercised Brookdale Warrants for 5.2 million shares of Brookdale Common Stock on a cashless basis, resulting in our receipt of 2.9 million shares of Brookdale Common Stock (net of the $3.00 exercise price), which we sold for net cash proceeds of approximately $18.0 million (recorded within operating cash flows in our Consolidated Statements of Cash Flows).
VENTAS, INC.
NOTES TO CONSOLIDATED FINANCIAL STATEMENTS
The Brookdale Warrants and the Scion Warrants are measured at fair value with changes in fair value being recognized within Other expense (income) in our Consolidated Statements of Income.
NOTE 10 – SENIOR NOTES PAYABLE AND OTHER DEBT
The following is a summary of our senior notes payable and other debt (dollars in thousands):
| | | | | | | | | | | |
| As of December 31, |
| 2024 | | 2023 |
Unsecured revolving credit facility (1)(2) | $ | 6,397 | | | $ | 14,006 | |
| Commercial paper notes | — | | | — | |
| | | |
| | | |
| 3.50% Senior Notes due 2024 | — | | | 400,000 | |
| 3.75% Senior Notes due 2024 | — | | | 400,000 | |
4.125% Senior Notes, Series B due 2024 (2) | — | | | 123,256 | |
2.80% Senior Notes, Series E due 2024 (2) | — | | | 55,143 | |
Unsecured term loan due 2025 (2) | — | | | 377,501 | |
| 2.65% Senior Notes due 2025 | 450,000 | | | 450,000 | |
| 3.50% Senior Notes due 2025 | 600,000 | | | 600,000 | |
| 4.125% Senior Notes due 2026 | 500,000 | | | 500,000 | |
| 3.75% Exchangeable Senior Notes due 2026 | 862,500 | | | 862,500 | |
| 3.25% Senior Notes due 2026 | 450,000 | | | 450,000 | |
| Unsecured term loan due February 2027 | 200,000 | | | 200,000 | |
| Unsecured term loan due June 2027 | 500,000 | | | 500,000 | |
2.45% Senior Notes, Series G due 2027 (2) | 330,320 | | | 358,626 | |
| 3.85% Senior Notes due 2027 | 400,000 | | | 400,000 | |
| 4.00% Senior Notes due 2028 | 650,000 | | | 650,000 | |
5.398% Senior Notes, Series I due 2028 (2) | 417,246 | | | 453,001 | |
| 4.40% Senior Notes due 2029 | 750,000 | | | 750,000 | |
5.10% Senior Notes, Series J due 2029 (2) | 452,017 | | | — | |
| 3.00% Senior Notes due 2030 | 650,000 | | | 650,000 | |
| 4.75% Senior Notes due 2030 | 500,000 | | | 500,000 | |
| 2.50% Senior Notes due 2031 | 500,000 | | | 500,000 | |
3.30% Senior Notes, Series H due 2031 (2) | 208,623 | | | 226,501 | |
| 5.625% Senior Notes due 2034 | 500,000 | | | — | |
| 5.00% Senior Notes due 2035 | 550,000 | | | — | |
6.90% Senior Notes due 2037 (3) | 52,400 | | | 52,400 | |
6.59% Senior Notes due 2038 (3) | 21,413 | | | 21,413 | |
| 5.70% Senior Notes due 2043 | 300,000 | | | 300,000 | |
| 4.375% Senior Notes due 2045 | 300,000 | | | 300,000 | |
| 4.875% Senior Notes due 2049 | 300,000 | | | 300,000 | |
| Mortgage loans and other | 3,167,886 | | | 3,174,251 | |
| Total | 13,618,802 | | | 13,568,598 | |
| Deferred financing costs, net | (92,365) | | | (84,034) | |
| Unamortized fair value adjustment | 11,587 | | | 17,081 | |
| Unamortized discounts | (15,473) | | | (10,749) | |
| Senior notes payable and other debt | $ | 13,522,551 | | | $ | 13,490,896 | |
______________________________
(1)As of December 31, 2024 and 2023, aggregate Canadian Dollar borrowings of C$2.0 million ($1.4 million) and zero were outstanding, respectively. As of December 31, 2024 and 2023, aggregate British Pound borrowings of £4.0 million ($5.0 million) and £11.0 million ($14.0 million) were outstanding, respectively.
(2)British Pound and Canadian Dollar debt obligations shown in US Dollars.
VENTAS, INC.
NOTES TO CONSOLIDATED FINANCIAL STATEMENTS
(3)Our 6.90% Senior Notes due 2037 are subject to repurchase at the option of the holders, at par, on October 1, 2027, and our 6.59% Senior Notes due 2038 are subject to repurchase at the option of the holders, at par, on July 7, 2028.
Credit Facilities, Commercial Paper, Unsecured Term Loans and Letters of Credit
As of December 31, 2024, we have a $2.75 billion unsecured revolving credit facility priced at SOFR plus 0.10% (“Adjusted SOFR”) plus 0.775% which is subject to adjustment based on the Company’s debt ratings. Our unsecured revolving credit facility matures in April 2028, and may be extended at our option, subject to the satisfaction of certain conditions, for two additional periods of six months each. The revolving credit facility also includes an accordion feature that permits us to increase our aggregate borrowing capacity thereunder to up to $3.75 billion, subject to the satisfaction of certain conditions, including the receipt of additional commitments for such increase.
Our unsecured revolving credit facility imposes certain customary restrictions on us, including restrictions pertaining to: (i) liens; (ii) investments; (iii) the incurrence of additional indebtedness; (iv) mergers and dissolutions; (v) certain dividend, distribution and other payments; (vi) permitted businesses; (vii) transactions with affiliates; and (viii) the maintenance of certain consolidated total leverage, secured debt leverage, unsecured debt leverage and fixed charge coverage ratios and minimum consolidated adjusted net worth, and contains customary events of default.
As of December 31, 2024, we had $2.74 billion of undrawn capacity under our unsecured revolving credit facility with $6.4 million outstanding and an additional $0.8 million restricted to support outstanding letters of credit. We use our unsecured revolving credit facility to support our commercial paper program and for general corporate purposes.
Our wholly-owned subsidiary, Ventas Realty, Limited Partnership (“Ventas Realty”), may issue from time to time unsecured commercial paper notes up to a maximum aggregate amount outstanding at any time of $1.0 billion. The notes are sold under customary terms in the U.S. commercial paper note market and are ranked pari passu with all of Ventas Realty’s other unsecured senior indebtedness. The notes are fully and unconditionally guaranteed by Ventas, Inc. As of December 31, 2024, we had no borrowings outstanding under our commercial paper program.
Ventas Realty has a $500.0 million unsecured term loan priced at Adjusted SOFR plus 0.85%, which is subject to adjustment based on Ventas Realty’s debt ratings. This term loan is fully and unconditionally guaranteed by Ventas, Inc. It matures in June 2027 and includes an accordion feature that permits Ventas Realty to increase the aggregate borrowings thereunder to up to $1.25 billion, subject to the satisfaction of certain conditions, including the receipt of additional commitments for such increase.
Ventas Realty has a $200.0 million unsecured term loan priced at Adjusted SOFR plus 0.85%, which is subject to adjustment based on Ventas Realty’s debt ratings. This term loan is fully and unconditionally guaranteed by Ventas, Inc. It matures in February 2027 and includes an accordion feature that permits Ventas Realty to increase the aggregate borrowings thereunder to up to $500.0 million, subject to the satisfaction of certain conditions, including the receipt of additional commitments for such increase.
During the year ended December 31, 2024, we repaid a C$500.0 million ($369.4 million) unsecured term loan facility priced at Canadian Dollar Offered Rate (“CDOR”) plus 0.90% that would otherwise have matured in January 2025.
As of December 31, 2024, our $100.0 million uncommitted line for standby letters of credit had an outstanding balance of $15.4 million. The agreement governing the line contains certain customary covenants and, under its terms, we are required to pay a commission on each outstanding letter of credit at a fixed rate.
Exchangeable Senior Notes
In June 2023, Ventas Realty issued $862.5 million aggregate principal amount of its 3.75% Exchangeable Senior Notes due 2026 (the “Exchangeable Notes”) in a private placement. The Exchangeable Notes are senior, unsecured obligations of Ventas Realty and are fully and unconditionally guaranteed on an unsecured and unsubordinated basis by Ventas, Inc. The Exchangeable Notes bear interest at a rate of 3.75% per year, payable semi-annually in arrears on June 1 and December 1 of each year, beginning on December 1, 2023. The Exchangeable Notes mature on June 1, 2026, unless earlier exchanged, redeemed or repurchased. As of both December 31, 2024 and 2023, we had $862.5 million aggregate principal amount of the Exchangeable Notes outstanding with an effective interest rate of 4.62% inclusive of the impact of the amortization of issuance costs. For the years ended December 31, 2024 and 2023, we recognized $32.3 million and $17.8 million of contractual interest expense, respectively, and amortization of issuance costs of $6.8 million and $3.6 million, respectively, related to the
VENTAS, INC.
NOTES TO CONSOLIDATED FINANCIAL STATEMENTS
Exchangeable Notes. Unamortized issuance costs of $10.3 million and $17.1 million as of December 31, 2024 and 2023 were recorded as an offset to Senior notes payable and other debt on our Consolidated Balance Sheets.
The Exchangeable Notes are exchangeable at an initial exchange rate of 18.2460 shares of our common stock per $1,000 principal amount of Exchangeable Notes (equivalent to an initial exchange price of approximately $54.81 per share of common stock). The initial exchange rate is subject to adjustment, including in the event of the payment of a quarterly dividend in excess of $0.45 per share, but will not be adjusted for any accrued and unpaid interest. Upon exchange of the Exchangeable Notes, Ventas Realty will pay cash up to the aggregate principal amount of the Exchangeable Notes to be exchanged and pay or deliver (or cause to be delivered), as the case may be, cash, shares of common stock or a combination of cash and shares of common stock, at Ventas Realty’s election, in respect of the remainder, if any, of its exchange obligation in excess of the aggregate principal amount of the Exchangeable Notes being exchanged. Prior to the close of business on the business day immediately preceding March 1, 2026, the Exchangeable Notes will be exchangeable at the option of the noteholders only upon the satisfaction of specified conditions and during certain periods described in the indenture governing the Exchangeable Notes. On or after March 1, 2026, until the close of business on the business day immediately preceding the maturity date, the Exchangeable Notes will be exchangeable at the option of the noteholders at any time regardless of these conditions or periods.
We have evaluated and concluded that the exchange options embedded in our exchangeable senior notes are eligible for the entity’s own equity scope exception from ASC 815 and therefore, do not need to be bifurcated. Accordingly, we record our exchangeable senior notes as liabilities (included in Senior notes payable and other debt on our Consolidated Balance Sheets).
Senior Notes
As of December 31, 2024, we had outstanding $8.3 billion aggregate principal amount of senior notes issued by Ventas Realty, approximately $73.8 million aggregate principal amount of senior notes issued by Nationwide Health Properties, Inc. (“NHP”) and assumed by our subsidiary, Nationwide Health Properties, LLC (“NHP LLC”), as successor to NHP, in connection with our acquisition of NHP, and C$2.0 billion aggregate principal amount of senior notes issued by our subsidiary, Ventas Canada Finance Limited (“Ventas Canada”). All of the senior notes issued by Ventas Realty and Ventas Canada are unconditionally guaranteed by Ventas, Inc.
Ventas Realty’s senior notes are part of our and Ventas Realty’s general unsecured obligations, ranking equal in right of payment with all of our and Ventas Realty’s existing and future senior obligations and ranking senior in right of payment to all of our and Ventas Realty’s existing and future subordinated indebtedness. However, Ventas Realty’s senior notes are effectively subordinated to our and Ventas Realty’s secured indebtedness, if any, to the extent of the value of the assets securing that indebtedness. Ventas Realty’s senior notes are also structurally subordinated to the preferred equity and indebtedness, whether secured or unsecured, of our subsidiaries (other than Ventas Realty).
Ventas Canada’s senior notes are part of our and Ventas Canada’s general unsecured obligations, ranking equal in right of payment with all of Ventas Canada’s existing and future subordinated indebtedness. However, Ventas Canada’s senior notes are effectively subordinated to our and Ventas Canada’s secured indebtedness, if any, to the extent of the value of the assets securing that indebtedness. Ventas Canada’s senior notes are also structurally subordinated to the preferred equity and indebtedness, whether secured or unsecured, of our subsidiaries (other than Ventas Canada).
NHP LLC’s senior notes are part of NHP LLC’s general unsecured obligations, ranking equal in right of payment with all of NHP LLC’s existing and future senior obligations and ranking senior to all of NHP LLC’s existing and future subordinated indebtedness. However, NHP LLC’s senior notes are effectively subordinated to NHP LLC’s secured indebtedness, if any, to the extent of the value of the assets securing that indebtedness. NHP LLC’s senior notes are also structurally subordinated to the preferred equity and indebtedness, whether secured or unsecured, of its subsidiaries.
Ventas Realty and Ventas Canada may redeem each series of their respective senior notes in whole at any time or in part from time to time, prior to maturity at the redemption prices set forth in the applicable indenture (which include, in many instances, a make-whole premium), plus, in each case, accrued and unpaid interest thereon to the redemption date.
In February 2024, Ventas Canada issued and sold C$650.0 million ($478.3 million) aggregate principal amount of 5.10% Senior Notes, Series J due 2029 in a private placement. The proceeds were primarily used to repay our C$500.0 million ($369.4 million) unsecured term loan facility due 2025.
VENTAS, INC.
NOTES TO CONSOLIDATED FINANCIAL STATEMENTS
In April and May 2024, we repaid $800.0 million senior notes consisting of $400.0 million aggregate principal amount of 3.50% Senior Notes due 2024 and $400.0 million aggregate principal amount of 3.75% Senior Notes due 2024 at maturity primarily with cash on hand and borrowings through our commercial paper program.
In April 2024, we repaid C$73.0 million ($53.4 million) aggregate principal amount of 2.80% Senior Notes, Series E due 2024 at maturity with cash on hand.
In May 2024, Ventas Realty issued and sold $500.0 million aggregate principal amount of 5.625% Senior Notes due 2034 in a registered public offering. The proceeds were primarily used to repay balances outstanding under our commercial paper program.
In September 2024, Ventas Realty issued and sold $550.0 million aggregate principal amount of 5.00% Senior Notes due 2035 in a registered public offering. We used the proceeds for general corporate purposes, including funding of acquisitions and the repayment of other indebtedness.
In September 2024, we repaid C$163.3 million ($120.8 million) aggregate principal amount of 4.125% Senior Notes due 2024 at maturity with cash on hand.
In January and February 2025, we repaid $450.0 million and $600.0 million aggregate principal amount of 2.65% Senior Notes due 2025 and aggregate principal amount of 3.50% Senior Notes due 2025, respectively, at maturity using cash on hand and borrowings through our commercial paper program.
Mortgages
At December 31, 2024, we had 145 mortgage loans outstanding in the aggregate principal amount of $3.2 billion, which are secured by 140 of our properties. Of these loans, 131 loans in the aggregate principal amount of $2.7 billion bear interest at fixed rates ranging from 2.24% to 7.13% per annum, and 14 loans in the aggregate principal amount of $483.9 million bear interest at variable rates ranging from 3.05% to 7.79% per annum as of December 31, 2024. At December 31, 2024, the weighted average annual rate on our fixed rate mortgage loans was 4.3%, and the weighted average annual rate on our variable rate mortgage loans was 5.1%. Our mortgage loans had a weighted average maturity of 4.3 years as of December 31, 2024.
During the year ended December 31, 2024, we repaid in full mortgage loans in the aggregate principal amount of $48.3 million.
In February 2024, we entered into a C$52.8 million ($39.1 million) fixed rate mortgage loan, which accrues interest at 4.644%, matures in 2029 and is secured by one senior housing community in Canada.
In April 2024, we entered into an aggregate C$103.0 million ($75.5 million) fixed rate mortgage loans, which accrue interest at a blended rate of 4.90%, mature in 2029 and are secured by two senior housing communities in Canada.
In May 2024, we entered into a $52.3 million fixed rate mortgage loan, which accrues interest at 6.02%, matures in 2034 and is secured by one outpatient medical building in California.
VENTAS, INC.
NOTES TO CONSOLIDATED FINANCIAL STATEMENTS
Scheduled Maturities of Borrowing Arrangements and Other Provisions
As of December 31, 2024, our indebtedness had the following maturities (dollars in thousands):
| | | | | | | | | | | | | | | | | | | | | | | |
| Principal Amount
Due at Maturity | | Unsecured Revolving
Credit Facility and Commercial Paper Notes | | Scheduled Periodic
Amortization | | Total Maturities |
| 2025 | $ | 1,737,827 | | | $ | — | | | $ | 48,425 | | | $ | 1,786,252 | |
| 2026 | 2,041,934 | | | — | | | 42,663 | | | 2,084,597 | |
| 2027 | 1,558,922 | | | — | | | 42,907 | | | 1,601,829 | |
| 2028 | 1,447,250 | | | 6,397 | | | 36,105 | | | 1,489,752 | |
| 2029 | 1,637,470 | | | — | | | 29,906 | | | 1,667,376 | |
| Thereafter | 4,890,539 | | | — | | | 98,457 | | | 4,988,996 | |
| Total maturities | $ | 13,313,942 | | | $ | 6,397 | | | $ | 298,463 | | | $ | 13,618,802 | |
The instruments governing our outstanding indebtedness contain covenants that limit our ability and the ability of certain of our subsidiaries to, among other things: (i) incur debt; (ii) make certain dividends, distributions and investments; (iii) enter into certain transactions; and/or (iv) merge, consolidate or sell certain assets. Ventas Realty’s and Ventas Canada’s senior notes also require us and our subsidiaries to maintain total unencumbered assets of at least 150% of our unsecured debt. Our credit facilities also require us to maintain certain financial covenants pertaining to, among other things, our consolidated total leverage, secured debt, unsecured debt, fixed charge coverage and net worth.
As of December 31, 2024, we were in compliance with all of these covenants.
Derivatives and Hedging
In the normal course of our business, interest rate fluctuations affect future cash flows under our variable rate debt obligations, loans receivable and marketable debt securities, and foreign currency exchange rate fluctuations affect our operating results. We follow established risk management policies and procedures, including the use of derivative instruments, to mitigate the impact of these risks.
We do not use derivative instruments for trading or speculative purposes, and we have a policy of entering into contracts only with major financial institutions based upon their credit ratings and other factors. When considered together with the underlying exposure that the derivative is designed to hedge, we do not expect that the use of derivatives in this manner would have any material adverse effect on our future financial condition or results of operations.
We enter into interest rate swaps in order to maintain a capital structure containing targeted amounts of fixed and variable-rate debt and manage interest rate risk. Interest rate swaps designated as cash flow hedges involve the receipt of variable amounts from a counterparty in exchange for our fixed-rate payments. These interest rate swap agreements are used to hedge the variable cash flows associated with variable-rate debt.
Periodically, we enter into and designate interest rate locks to partially hedge the risk of changes in interest payments attributable to increases in the benchmark interest rate during the period leading up to the probable issuance of fixed-rate debt. We designate our interest rate locks as cash flow hedges. Gains and losses when we settle our interest rate locks are amortized over the life of the related debt and recorded in Interest expense in our Consolidated Statements of Income.
As of December 31, 2024, our variable rate debt obligations of $0.8 billion reflect, in part, the effect of $141.3 million notional amount of interest rate swaps with maturities in March 2027, that effectively convert fixed rate debt to variable rate debt.
As of December 31, 2024, our fixed rate debt obligations of $12.8 billion reflect, in part, the effect of $526.5 million and C$635.9 million notional amount of interest rate swaps with maturities ranging from February 2025 to April 2031, in each case, that effectively convert variable rate debt to fixed rate debt.
VENTAS, INC.
NOTES TO CONSOLIDATED FINANCIAL STATEMENTS
2024 Activity
From June through September 2024, we entered into an aggregate $350.0 million treasury locks to hedge interest rate risk on future debt issuances. In September 2024, we terminated the treasury locks in conjunction with the issuance of the $550.0 million aggregate principal amount of 5.00% Senior Notes due 2035.
During the year ended December 31, 2024, approximately $22.3 million of realized gain primarily relating to our interest rate swaps was reclassified into Interest expense in our Consolidated Statements of Income. Approximately $3.0 million of unrealized gains, which are included in Accumulated other comprehensive income as of December 31, 2024, are expected to be reclassified into earnings within the next 12 months.
NOTE 11 – FAIR VALUES OF FINANCIAL INSTRUMENTS
Financial Instruments Measured at Fair Value
The table below summarizes the carrying amounts and fair values of our financial instruments either recorded or disclosed on a recurring basis (dollars in thousands):
| | | | | | | | | | | | | | | | | | | | | | | |
| | As of December 31, 2024 | | As of December 31, 2023 |
| | Carrying Amount | | Fair Value | | Carrying Amount | | Fair Value |
| Assets: | | | | | | | |
Cash and cash equivalents (1) | $ | 897,850 | | | $ | 897,850 | | | $ | 508,794 | | | $ | 508,794 | |
Escrow deposits and restricted cash (1) | 59,383 | | | 59,383 | | | 54,668 | | | 54,668 | |
Stock warrants (3)(4)(5) | 40,192 | | | 40,192 | | | 59,281 | | | 59,281 | |
Secured mortgage loans and other, net (3)(4) | 144,872 | | | 146,229 | | | 27,986 | | | 27,947 | |
Non-mortgage loans receivable, net (3)(4)(5) | 28,129 | | | 27,640 | | | 26,152 | | | 25,200 | |
| | | | | | | |
| | | | | | | |
Derivative instruments (3)(5) | 12,908 | | | 12,908 | | | 19,782 | | | 19,782 | |
| Liabilities: | | | | | | | |
Senior notes payable and other debt, gross (3)(4) | 13,618,802 | | | 13,411,066 | | | 13,568,598 | | | 13,104,091 | |
Derivative instruments (3)(6) | 5,887 | | | 5,887 | | | 2,525 | | | 2,525 | |
Redeemable OP Units (2) | 200,420 | | | 200,420 | | | 173,452 | | | 173,452 | |
______________________________(1)The carrying amount approximates fair value due to the short maturity of these instruments.
(2)Level 1 within fair value hierarchy.
(3)Level 2 within fair value hierarchy.
(4)Level 3 within fair value hierarchy.
(5)Included in Other assets on our Consolidated Balance Sheets.
(6)Included in Accounts payable and other liabilities on our Consolidated Balance Sheets.
(7)During the years ended December 31, 2024 and 2023, there were no material transfers of financial assets or liabilities within the fair value hierarchy.
For a discussion of the assumptions considered, refer to “Note 2 – Accounting Policies.” The use of different market assumptions and estimation methodologies may have a material effect on the reported estimated fair value amounts. Accordingly, the estimates presented above are not necessarily indicative of the amounts we would realize in a current market exchange.
Items Measured at Fair Value on a Recurring Basis
In the above table, stock warrants consist of the Brookdale Warrants and the Scion Warrants. The Brookdale Warrants represent an interest in a publicly-traded entity and their fair value is based on Level 2 inputs that are obtained from public sources such as equity spot price, dividend yield, volatility and risk-free rate.
The Scion Warrants represent a financial interest in a private entity whose fair value is based on Level 3 inputs that reflect significant assumptions including underlying enterprise value, market volatility, duration, dividend rate and risk-free rate. Changes in one or more of these inputs could impact the fair value determination. During the year ended December 31,
VENTAS, INC.
NOTES TO CONSOLIDATED FINANCIAL STATEMENTS
2024, there has been no realized or unrealized gains or losses recognized for these warrants. There has been no transfer into or out of Level 3 financial instruments during the periods presented.
Substantially all of our derivative instruments consist of interest rate swaps. Their fair value is based on Level 2 inputs. See “Note 2 – Accounting Policies.”
Other Items Measured at Fair Value on a Nonrecurring Basis
Real estate recorded as held for sale and any associated real estate impairment recorded due to the shortening of the expected hold period due to our change in intent to hold the asset (see “Note 5 – Dispositions and Impairments”) are measured at fair value on a nonrecurring basis. We estimate the fair value of assets held for sale and any associated impairment charges based primarily on current sales price expectations, which reside within Level 2 of the fair value hierarchy.
Real estate impairment charges recorded due to our evaluation of recoverability when events or changes in circumstances indicate the carrying amount may not be recoverable are based on company-specific inputs and our assumptions about the marketability of the properties as observable inputs are not available. As such, we have determined that these fair value measurements generally reside within Level 3 of the fair value hierarchy. We estimate the fair value of real estate deemed to not be recoverable using the cost or income approach and unobservable data such as net operating income and estimated capitalization and discount rates, and giving consideration to local and national industry market data including comparable sales.
2023 Activity
The fair value of the collateral received in connection with the equitization of the Santerre Mezzanine Loan on May 1, 2023 was determined using fair value determinations within Level 1, 2 and 3 of the fair value hierarchy. The fair value of the non-real estate assets and liabilities was based on their cost, given the short term nature of those balances and because cost was the best information available, which reside within Level 1 of the fair value hierarchy. The fair value of the CHC Mortgage Loan, which approximates par, was based on the absence of recent underlying trading activity, consideration of the near-term maturity date and adjustments for the credit-worthiness of the borrower, which reside within Level 2 of the fair value hierarchy.
The fair value of the real estate properties that secured the Santerre Mezzanine Loan of $1.566 billion (net of $31.8 million of capital expenditures) on May 1, 2023 was determined using unobservable inputs primarily within Level 3 of the fair value hierarchy. For SHOP and outpatient medical properties, fair value was based on either an income or market approach that took into account unobservable inputs such as direct capitalization rates, estimated NOI, market rents, costs per unit, replacement cost and estimates of future cash flows, which are based on a number of factors including historical operating results, known trends and market and economic conditions. For the majority of the SHOP properties, fair value was based on an income approach with significant unobservable inputs that included an average direct capitalization rate of 6.8% on estimated expected stabilized NOI, adjusted based on cost per unit in certain cases. For the majority of the outpatient medical properties, fair value was based on an income approach with significant unobservable inputs that included an average direct capitalization rate of 6.7% on estimated expected stabilized NOI, adjusted based on cost per square foot in certain cases. For triple-net leased properties, fair value was primarily based on an average estimated per bed value by property by state of $88,000, which was determined based on an assessment of recent transactions adjusted for property, operator and other characteristics such as contractual rent, tenant payment history, underlying operating trends, reimbursement rates and other market data.
NOTE 12 – LONG-TERM COMPENSATION
Compensation Plans
We currently have:
•one plan, the 2022 Incentive Plan, under which equity awards, including options to purchase common stock, shares of restricted stock or restricted stock units, have been or may be granted to our officers, employees and non-employee directors; and
•one plan under which our non-employee directors may elect to defer receipt of all or a portion of their cash retainers and meeting fees and receive shares of common stock in lieu thereof at a later date chosen by the participating director (the Non-Employee Directors’ Cash Compensation Deferral Plan, formerly known as the Non-Employee Directors’ Deferred Stock Compensation Plan).
VENTAS, INC.
NOTES TO CONSOLIDATED FINANCIAL STATEMENTS
These plans are referred to collectively as the “Plans.”
The number of shares initially reserved for issuance and the number of shares available for future grants or issuance under the Plans as of December 31, 2024 were as follows:
•2022 Incentive Plan—11.4 million shares, plus any shares of common stock subject to awards granted under the 2012 Plan as of October 1, 2022, that expire, or for any reason are forfeited, cancelled or terminated either without such shares being issued or with such shares being forfeited (such shares the “2012 Plan Shares”) were reserved initially for grants or issuance to employees and non-employee directors, and 10.8 million shares were available for future issuance as of December 31, 2024.
•Non-Employee Directors’ Cash Compensation Deferral Plan—0.6 million shares were reserved initially for issuance to participating non-employee directors in lieu of the payment of all or a portion of their retainer and meeting fees, at their option, and 0.4 million shares were available for future issuance as of December 31, 2024.
In addition, we have two plans under which outstanding options to purchase common stock, shares of restricted stock or restricted stock units have been granted to our officers, employees and non-employee directors (the 2006 Stock Plan for Directors and the 2012 Incentive Plan). New grants are not permitted under either of these plans.
Outstanding options, all of which were issued under the 2012 Plan, are exercisable at the market price on the date of grant, expire ten years from the date of grant, and are fully vested.
Stock Options
The following is a summary of stock option activity in 2024:
| | | | | | | | | | | | | | | | | | | | | | | |
| Shares (000’s) | | Weighted Average
Exercise Price | | Weighted
Average
Remaining
Contractual
Life (years) | | Intrinsic
Value
($000’s) |
| Outstanding as of December 31, 2023 | 3,457 | | | $ | 62.17 | | | | | |
| | | | | | | |
| Options exercised | (426) | | | 61.21 | | | | | 1,208 | |
| Options forfeited | (400) | | | 51.84 | | | | | |
| | | | | | | |
| Outstanding as of December 31, 2024 | 2,631 | | | 63.89 | | | 1.6 | | $ | 399 | |
| Exercisable as of December 31, 2024 | 2,631 | | | 63.89 | | | 1.6 | | $ | 399 | |
Compensation costs for all share-based awards are based on the grant date fair value and are recognized on a straight-line basis during the requisite service periods, with charges primarily recorded in General, administrative and professional fees in our Consolidated Statements of Income. As of December 31, 2024, 2023 and 2022, there was no unrecognized compensation expense relating to stock options.
Aggregate proceeds received from options exercised under the Plans for the years ended December 31, 2024, 2023 and 2022 were $26.1 million, $1.7 million and $8.7 million, respectively. The total intrinsic value at exercise of options exercised during the year ended December 31, 2024 was $1.2 million. The total intrinsic value at exercise of options exercised during the year ended December 31, 2023 was immaterial. The total intrinsic value at exercise of options exercised during the year ended December 31, 2022 was $0.7 million. There was no deferred income tax benefit for stock options exercised.
Restricted Stock and Restricted Stock Units
We recognize the fair value of shares of restricted stock and restricted stock units (including time-based and performance-based awards) on the grant date of the award as stock-based compensation expense over the requisite service period, with charges primarily to General, administrative and professional fees of $30.9 million, $30.4 million and $30.7 million in 2024, 2023 and 2022, respectively, in our Consolidated Statements of Income. Time-based restricted stock and restricted stock unit awards granted to employees generally vest over a three-year period, while time-based restricted stock unit awards granted to non-employee directors typically vest approximately one year from the date of grant. Performance-based
VENTAS, INC.
NOTES TO CONSOLIDATED FINANCIAL STATEMENTS
stock units granted to our executive officers, which include market and performance components, may be earned and vest, if at all, at the end of the three-year performance period based on the achievement of such components. If provided in the applicable Plan or award agreement, the vesting of awards may accelerate upon a change of control (as defined in the applicable Plan) of Ventas and other specified events. In addition to customary change in control vesting provisions, awards generally vest on retirement provided certain conditions are met. Employees are typically not retirement eligible until age 65, or in the case of executive officers, until their age plus years of service equals 75, with a minimum age of 62; the retirement age for non-employee directors is 75.
The fair market value of time-based restricted stock units is determined based on the closing market price of the Company’s shares on the grant date and is expensed over the period of three to four years. In calculating the grant date fair value of performance-based stock units, we use a Monte Carlo simulation to calculate the grant date fair value of the total shareholder return (“TSR”)-driven components and the closing price on the date of grant, assuming performance at target—which was the probable outcome at the grant date—for other performance components. The Monte Carlo simulation “probability weights” potential outcomes of the relative TSR measures of each performance-based stock unit as of the grant date, based on, among other things, assumptions related to volatility, correlation and interest rates, which can fluctuate significantly year-over-year. The following assumptions were used in the Monte Carlo valuation for the TSR-driven components for performance-based stock units granted during the years ended December 31, 2024, 2023 and 2022, respectively: (i) expected term of three years for each of the years (equal to the remaining performance period at the grant date), (ii) historical volatility of 42.0%, 41.3%, and 38.7% and, (iii) risk-free rate of 4.09%, 3.84%, and 1.02%. The total grant date fair value of time-based restricted stock units and performance-based stock units granted during the years ended December 31, 2024, 2023 and 2022 was $35.6 million, $30.1 million, and $24.1 million, respectively.
The following is a summary of the status of our non-vested restricted stock and restricted stock units (including time-based and performance-based awards) as of December 31, 2024, and changes during the year ended December 31, 2024:
| | | | | | | | | | | | | | | | | | | | | | | |
| Restricted
Stock
(000’s) | | Weighted
Average
Grant Date
Fair Value | | Restricted
Stock Units (000’s) | | Weighted
Average
Grant Date
Fair Value |
| Non-vested at December 31, 2023 | 156 | | | $ | 51.30 | | | 1,309 | | | $ | 52.03 | |
| Granted | — | | | — | | | 750 | | | 49.74 | |
| Vested | (99) | | | 52.03 | | | (665) | | | 48.54 | |
| Forfeited | (6) | | | 51.09 | | | (93) | | | 47.16 | |
| Non-vested at December 31, 2024 | 51 | | | 49.88 | | | 1,301 | | | 52.39 | |
As of December 31, 2024, we had $17.2 million of unrecognized compensation cost related to non-vested restricted stock and restricted stock units under the Plans. We expect to recognize that cost over a weighted average period of 0.45 years. The total fair value at the vesting date for restricted stock and restricted stock units that vested during the years ended December 31, 2024, 2023 and 2022 was $32.7 million, $25.0 million and $29.6 million, respectively.
Employee and Director Stock Purchase Plan
We have in effect an Employee and Director Stock Purchase Plan (“ESPP”) under which our employees and directors may purchase shares of our common stock at a discount. Pursuant to the terms of the ESPP, on each purchase date, participants may purchase shares of common stock at a price not less than 90% of the market price on that date (with respect to the employee tax-favored portion of the plan) and not less than 95% of the market price on that date (with respect to the additional employee and director portion of the plan). We initially reserved 3.0 million shares for issuance under the ESPP. As of December 31, 2024, 0.2 million shares had been purchased under the ESPP and 2.8 million shares were available for future issuance.
Employee Benefit Plan
We maintain a 401(k) plan that allows eligible employees to defer compensation subject to certain limitations imposed by the Code. In 2024, we made contributions for each qualifying employee of up to 4.0% of his or her salary, subject to certain limitations. During 2024, 2023 and 2022, our aggregate contributions were approximately $2.1 million, $2.0 million and $1.6 million, respectively.
VENTAS, INC.
NOTES TO CONSOLIDATED FINANCIAL STATEMENTS
NOTE 13 – INCOME TAXES
We have elected to be taxed as a REIT under the applicable provisions of the Code for every year beginning with the year ended December 31, 1999. We have also elected for certain of our subsidiaries to be treated as TRS entities, which are subject to federal, state and foreign income taxes. All entities other than the TRS entities are collectively referred to as the “REIT” within this note. Certain REIT entities are subject to foreign income tax.
Although we intend to continue to operate in a manner that will enable us to qualify as a REIT, such qualification depends upon our ability to meet, on a continuing basis, various distribution, stock ownership and other tests. Our tax treatment of distributions per common share was as follows:
| | | | | | | | | | | | | | | | | |
| For the Years Ended December 31, |
| 2024 | | 2023 | | 2022 |
| Tax treatment of distributions: | | | | | |
| Ordinary income | $ | — | | | $ | — | | | $ | — | |
| Qualified ordinary income | — | | | 0.04468 | | | 0.04906 | |
| 199A qualified business income | 1.09580 | | | 1.49465 | | | 1.75094 | |
| Long-term capital gain | — | | | 0.09136 | | | — | |
| | | | | |
| Non-dividend distribution | 0.70420 | | | 0.16931 | | | — | |
| Distribution reported for 1099-DIV purposes | 1.80000 | | | 1.80000 | | | 1.80000 | |
| Add: Dividend declared in current year and taxable in following year | 0.45000 | | | 0.45000 | | | 0.45000 | |
| Less: Dividend declared in prior year and taxable in current year | (0.45000) | | | (0.45000) | | | (0.45000) | |
| Distribution declared per common share outstanding | $ | 1.80000 | | | $ | 1.80000 | | | $ | 1.80000 | |
We believe we have met the annual REIT distribution requirement by payment of at least 90% of our estimated taxable income for 2024, 2023 and 2022. Our consolidated expense (benefit) for income taxes was as follows (dollars in thousands):
| | | | | | | | | | | | | | | | | |
| For the Years Ended December 31, |
| 2024 | | 2023 | | 2022 |
| Current - Federal | $ | 324 | | | $ | 534 | | | $ | (2,257) | |
| Current - State | 2,630 | | | 2,564 | | | 2,662 | |
| Deferred - Federal | (30,436) | | | (6,135) | | | 338 | |
| Deferred - State | 28 | | | 230 | | | 1,310 | |
| Current - Foreign | 2,646 | | | 2,587 | | | 3,217 | |
| Deferred - Foreign | (12,967) | | | (9,319) | | | (22,196) | |
| Total | $ | (37,775) | | | $ | (9,539) | | | $ | (16,926) | |
The 2024 income tax benefit is primarily due to losses in certain of our TRS entities and a $28.6 million change in valuation allowance due to purchase accounting activity. The 2023 income tax benefit is primarily due to losses in certain of our TRS entities and a $3.2 million benefit from internal restructurings of U.S. TRS entities. The 2022 income tax benefit is primarily due to losses at certain TRS entities and an income tax benefit of $11.9 million from an internal restructuring of foreign TRS entities.
Although the TRS entities and certain other foreign entities have paid minimal cash federal, state and foreign income taxes for the year ended December 31, 2024, their income tax liabilities may increase in future years as we exhaust net operating loss (“NOL”) carryforwards and as our operations grow. Such increases could be significant.
VENTAS, INC.
NOTES TO CONSOLIDATED FINANCIAL STATEMENTS
A reconciliation of income tax expense and benefit, which is computed by applying the federal corporate tax rate for the years ended December 31, 2024, 2023 and 2022, to the income tax expense and benefit is as follows (dollars in thousands):
| | | | | | | | | | | | | | | | | |
| For the Years Ended December 31, |
| 2024 | | 2023 | | 2022 |
| Tax at statutory rate on earnings from continuing operations before unconsolidated entities, noncontrolling interest and income taxes | $ | (1,679) | | | $ | (24,272) | | | $ | (19,733) | |
| State income taxes, net of federal benefit | 2,641 | | | (839) | | | (5,411) | |
| Change in valuation allowance | (10,593) | | | 20,330 | | | 53,117 | |
| | | | | |
| Tax at statutory rate on earnings not subject to federal income taxes | (18,773) | | | (7,809) | | | (31,528) | |
| Foreign rate differential and foreign taxes | 1,813 | | | 43 | | | 123 | |
| Change in tax status of TRS | — | | | 9,171 | | | (1,961) | |
| | | | | |
| | | | | |
| Other differences | (11,184) | | | (6,163) | | | (11,533) | |
| Income tax benefit | $ | (37,775) | | | $ | (9,539) | | | $ | (16,926) | |
Each TRS is a tax-paying component for purposes of classifying deferred tax assets and liabilities. The tax effects of temporary differences and carryforwards included in the net deferred tax liabilities are summarized as follows (dollars in thousands):
| | | | | | | | | | | | | | | | | |
| As of December 31, |
| 2024 | | 2023 | | 2022 |
| Property, primarily differences in depreciation and amortization, the tax basis of land assets and the treatment of interests and certain costs | $ | (73,214) | | | $ | (26,071) | | | $ | (34,734) | |
| Operating loss and interest deduction carryforwards | 236,424 | | | 233,847 | | | 220,891 | |
| Expense accruals and other | 56,546 | | | 26,700 | | | 16,723 | |
| Valuation allowance | (225,975) | | | (257,222) | | | (227,960) | |
| Net deferred tax liabilities | $ | (6,219) | | | $ | (22,746) | | | $ | (25,080) | |
Our net deferred tax liability decreased $16.5 million during 2024 primarily due to the impact of operating losses at certain TRS entities and an increase in deferred tax assets of $18.0 million due to tax law changes in Canada regarding the deductibility of interest and financing expenses. Our net deferred tax liability decreased $1.7 million during 2023 primarily due to the impact of operating losses at certain TRS entities and the reversal of $3.2 million of net deferred tax liabilities from an internal restructuring of TRS entities, partially offset by an increase of $12.4 million in connection with our equitization of the Santerre Mezzanine Loan on May 1, 2023. Our net deferred tax liability decreased $23.0 million during 2022 primarily due to the impact of operating losses at certain TRS entities and the reversal of $11.9 million of deferred tax liabilities from an internal restructuring of foreign TRS entities.
Due to uncertainty regarding the realization of certain deferred tax assets, we have established valuation allowances, primarily in connection with the NOL carryforwards related to certain TRSs. The amounts related to NOLs at the TRS entities for 2024, 2023 and 2022 are $180.8 million, $179.0 million and $171.0 million, respectively.
We are subject to corporate-level taxes (“built-in gains tax”) for any asset dispositions during the five-year period immediately after the assets were owned by a C corporation (either prior to our REIT election, through stock acquisition or merger). The amount of income potentially subject to built-in gains tax is generally equal to the lesser of the excess of the fair value of the asset over its adjusted tax basis as of the date it became a REIT asset or the actual amount of gain. Some, but not all, future gains could be offset by available NOL carryforwards.
At December 31, 2024, 2023 and 2022, the REIT had NOL carryforwards of $1.0 billion, $1.1 billion and $1.1 billion, respectively. Additionally, the REIT has $10.8 million of federal income tax credits that were carried over from acquisitions at December 31, 2024, 2023 and 2022. These amounts can be used to offset future taxable income (or taxable income for prior years if an audit determines that tax is owed), if any. The REIT will be entitled to utilize NOLs and tax credit carryforwards only to the extent that REIT taxable income exceeds our deduction for dividends paid. Certain NOL and credit carryforwards are limited as to their utilization by Section 382 of the Code. The remaining REIT carryforwards began to expire in 2023.
VENTAS, INC.
NOTES TO CONSOLIDATED FINANCIAL STATEMENTS
For the years ended December 31, 2024 and 2023, the net difference between tax bases and the reported amount of REIT assets and liabilities for federal income tax purposes was approximately $1.8 billion and $2.2 billion, respectively, less than the book bases of those assets and liabilities for financial reporting purposes.
Generally, we are subject to audit under the statute of limitations by the Internal Revenue Service (“IRS”) for the year ended December 31, 2021, and subsequent years and are subject to audit by state taxing authorities for the year ended December 31, 2020 and subsequent years. We are subject to audit generally under the statutes of limitation by the Canada Revenue Agency and provincial authorities with respect to the Canadian entities for the year ended December 31, 2020 and subsequent years. We are subject to audit in the United Kingdom generally for the periods ended in and subsequent to 2023.
The following table summarizes the activity related to our unrecognized tax benefits (dollars in thousands):
| | | | | | | | | | | |
| 2024 | | 2023 |
| Balance as of January 1 | $ | 5,205 | | | $ | 5,828 | |
| | | |
| Additions to tax positions related to prior years | — | | | 108 | |
| Subtractions to tax positions related to prior years | (1,242) | | | (731) | |
| | | |
| | | |
| Balance as of December 31 | $ | 3,963 | | | $ | 5,205 | |
If recognized, these unrecognized tax benefits of $4.0 million and $5.2 million at December 31, 2024 and 2023, respectively, would reduce our annual effective tax rate. We accrued no interest or penalties related to the unrecognized tax benefits during 2024. We do not expect our unrecognized tax benefits to increase or decrease materially in 2025.
As a part of the transfer pricing structure in the normal course of business, the REIT enters into transactions with certain TRSs, such as leasing and sub-management transactions, other capital financing and allocation of general and administrative costs, which transactions are intended to comply with the IRS and foreign tax authority transfer pricing rules.
NOTE 14 – COMMITMENTS AND CONTINGENCIES
From time to time, we are party to various lawsuits, investigations, claims and other legal and regulatory proceedings arising in connection with our business. In certain circumstances, regardless of whether we are a named party in a lawsuit, investigation, claim or other legal or regulatory proceeding, we may be contractually obligated to indemnify, defend and hold harmless our managers, tenants and borrowers or other third parties against, or may otherwise be responsible for, such actions, proceedings or claims. These claims may include, among other things, professional liability and general liability claims, commercial liability claims, unfair business practices claims and employment claims, as well as regulatory proceedings and government investigations, including proceedings related to our senior housing operating portfolio, where we are typically the holder of the applicable healthcare license. These claims may not be fully insured and some may allege large damage amounts.
It is the opinion of management, that the disposition of any such lawsuits, investigations, claims and other legal and regulatory proceedings that are currently pending will not, individually or in the aggregate, have a material adverse effect on us. However, regardless of the merits of a particular action, investigation or claim, we may be forced to expend significant financial resources to defend and resolve these matters. We are unable to predict the ultimate outcome of these lawsuits, investigations, claims and other legal and regulatory proceedings, and if management’s assessment of our liability with respect thereto is incorrect, such actions, investigations and claims could have a material adverse effect on us.
From time to time, on behalf of ourselves or on behalf of our unconsolidated entities, we have agreed, and may in the future agree, to provide guarantees, indemnities or other similar contingent obligations to third parties. Such agreements may include, without limitation: (1) guarantees of all or a portion of the principal, interest and other amounts due under mortgage debt or other borrowings, (2) customary nonrecourse carve-out guarantees provided in connection with mortgage or other borrowings, (3) customary indemnifications of lenders for potential environmental liabilities, (4) completion guarantees provided to lenders, tenants, ground lessors or other third parties for the completion of development and redevelopment projects, (5) guarantees of payment of contingent tax obligations to tax credit investors who have purchased historic, new market and other tax credits from us or our unconsolidated entities, (6) guarantees of ground rent and other payment of ground rent and other obligations to ground lessors and (7) indemnities and other guarantees required in connection with the procurement of performance and surety bonds and standby letters of credit.
As of December 31, 2024 and 2023, no triggering events relating to our guarantees, indemnities or similar contingent obligations have occurred. Accordingly, no contingent liability is recorded in our Consolidated Balance Sheets.
VENTAS, INC.
NOTES TO CONSOLIDATED FINANCIAL STATEMENTS
Operating Leases
We lease land, equipment and corporate office space. At inception, we establish an operating lease asset and operating lease liability represented as the present value of future minimum lease payments. As our leases do not provide an implicit rate, we use a discount rate that approximates our incremental borrowing rate available at lease commencement to determine the present value of lease payments. The incremental borrowing rates were adjusted for the length of the individual lease term. The weighted average discount rate and remaining lease term of our leases are 7.40% and 33.1 years, respectively. Operating lease assets and liabilities are not recognized for leases with an initial term of 12 months or less, as these short-term leases are accounted for similar to previous guidance. Many of our leases include renewal options to extend the term for one year or more. Renewal options that we are not reasonably certain to exercise are excluded from the operating lease assets and liabilities.
Our lease expense primarily consists of ground leases, which is included in Interest expense in our Consolidated Statements of Income. For the years ended December 31, 2024, 2023 and 2022, we recognized $33.7 million, $37.0 million and $31.9 million of expense relating to our leases, respectively. For the years ended December 31, 2024, 2023 and 2022, cash paid for leases was $24.8 million, $29.8 million and $24.0 million, respectively, as reported within operating cash outflows in our Consolidated Statements of Cash Flows.
The following table summarizes future minimum lease obligations under non-cancelable ground and other operating leases as of December 31, 2024 (dollars in thousands):
| | | | | |
| 2025 | $ | 20,176 | |
| 2026 | 21,701 | |
| 2027 | 21,202 | |
| 2028 | 20,022 | |
| 2029 | 19,201 | |
| Thereafter | 598,633 | |
| Total undiscounted minimum lease payments | 700,935 | |
| Less: imputed interest | (482,932) | |
| Operating lease liabilities | $ | 218,003 | |
VENTAS, INC.
NOTES TO CONSOLIDATED FINANCIAL STATEMENTS
NOTE 15 – EARNINGS PER SHARE
The following table shows the amounts used in computing our basic and diluted earnings per share (in thousands, except per share amounts):
| | | | | | | | | | | | | | | | | |
| | For the Years Ended December 31, |
| | 2024 | | 2023 | | 2022 |
| Numerator for basic and diluted earnings per share: | | | | | |
| | | | | |
| | | | | |
| Net income (loss) | $ | 88,351 | | | $ | (30,297) | | | $ | (40,931) | |
| Net income attributable to noncontrolling interests | 7,198 | | | 10,676 | | | 6,516 | |
| Net income (loss) attributable to common stockholders | $ | 81,153 | | | $ | (40,973) | | | $ | (47,447) | |
| Denominator: | | | | | |
| Denominator for basic earnings per share—weighted average shares | 411,770 | | | 401,809 | | | 399,549 | |
| Effect of dilutive securities: | | | | | |
| | | | | |
| Restricted stock awards | 397 | | | 389 | | | 390 | |
| OP unitholder interests | 3,422 | | | 3,472 | | | 3,515 | |
| Exchangeable Notes | 744 | | | — | | | — | |
| Equity forward sales agreements | 33 | | | — | | | — | |
| Denominator for diluted earnings per share—adjusted weighted average shares | 416,366 | | | 405,670 | | | 403,454 | |
| Basic earnings per share: | | | | | |
| Net income (loss) | $ | 0.21 | | | $ | (0.08) | | | $ | (0.10) | |
| Net income (loss) attributable to common stockholders | 0.20 | | | (0.10) | | | (0.12) | |
Diluted earnings per share: (1) | | | | | |
| Net income (loss) | $ | 0.21 | | | $ | (0.08) | | | $ | (0.10) | |
| Net income (loss) attributable to common stockholders | 0.19 | | | (0.10) | | | (0.12) | |
______________________________
(1) Potential common shares are not included in the computation of diluted earnings per share when a net loss exists as the effect would be an antidilutive per share amount.
There were 2.9 million, 3.5 million and 3.6 million anti-dilutive options outstanding for the years ended December 31, 2024, 2023 and 2022, respectively.
The dilutive effect of our Exchangeable Notes is calculated using the if-converted method in accordance with ASU 2020-06. We are required, pursuant to the indenture governing the Exchangeable Notes, to settle the aggregate principal amount of the Exchangeable Notes in cash and may elect to settle any remaining exchange obligation (i.e., the stock price in excess of the exchange obligation) in cash, shares of our common stock, or a combination thereof. Under the if-converted method, we include the number of shares required to satisfy the exchange obligation, assuming all the Exchangeable Notes are exchanged. The average closing price of our common stock for the year ended December 31, 2024 is used as the basis for determining the dilutive effect on earnings per share. The Exchangeable Notes were not included in the computation of diluted earnings per share for the years ended December 31, 2023 and 2022 as they were antidilutive.
Our unsettled equity forward sales agreements do not impact basic earnings per share. We apply the treasury stock method to our unsettled equity forward sales agreements to determine their dilutive effect, if any. See “Note 16 – Permanent and Temporary Equity.”
NOTE 16 – PERMANENT AND TEMPORARY EQUITY
Capital Stock
In February 2024, we entered into an amendment to our November 2021 ATM Sales Agreement, providing for an “at-the-market” equity offering program, pursuant to which we could sell, from time to time, up to $1.0 billion aggregate gross sales price of shares of our common stock (as amended, the “February 2024 ATM Program”). In September 2024, we
VENTAS, INC.
NOTES TO CONSOLIDATED FINANCIAL STATEMENTS
terminated the February 2024 ATM Program and entered into an ATM Sales Agreement providing for the sale, from time to time, of up to $2.0 billion aggregate gross sales price of shares of our common stock (the “September 2024 ATM Program” and, together with the February 2024 ATM Program, the “ATM Programs”). The ATM Programs have allowed us to enter into forward sales agreements, as discussed below. By utilizing a forward sales agreement, we can secure a share price on the sale of shares of our common stock at or shortly after the time the forward sales agreement becomes effective, while postponing the receipt of proceeds from the sale of shares until a future date. As of December 31, 2024, the remaining amount available under our September 2024 ATM Program for future sales of common stock was $1.5 billion.
During the year ended December 31, 2024, we issued 37.3 million shares of our common stock for gross proceeds of $2.2 billion, representing an average price of $58.38 per share, of which 3.4 million shares or approximately $201.1 million in gross proceeds remained unsettled with maturity in March 2026. During the year ended December 31, 2023, we issued 2.3 million shares of our common stock for gross proceeds of $110.4 million, representing an average price of $47.89 per share. There were no issuances of common stock for the year ended December 31, 2022.
Equity Forward Sales Agreements
Equity forward sales agreements generally have a maturity of one to two years. At any time during the term of an equity forward sales agreement, we may settle that equity forward sales agreement by delivery of physical shares of our common stock to the forward purchaser or, at our election, subject to certain exceptions, we may settle in cash or by net share settlement. The forward sales price we expect to receive upon settlement of outstanding equity forward sales agreements will be the initial forward price, net of commissions, established on or shortly after the effective date of the relevant equity forward sales agreement, subject to adjustments for accrued interest, the forward purchasers’ stock borrowing costs in excess of a certain threshold specified in the equity forward sales agreement, and certain fixed price reductions for expected dividends on our common stock during the term of the equity forward sales agreement. Our unsettled equity forward sales agreements are accounted for as equity instruments.
In January 2025, we entered into additional unsettled equity forward sales agreements for 0.8 million shares or approximately $49.8 million in gross proceeds with maturity in March 2026.
Excess Share Provision
Our Amended and Restated Certificate of Incorporation (our “Charter”) contains restrictions on the ownership and transfer of our common and preferred stock to enable us to preserve our REIT status. Our Charter provides certain specified remedies if a transfer would violate one of the ownership limitations. In particular, if a person acquires beneficial or constructive ownership of more than the ownership limit (currently, 9.0%, in number or value, of our outstanding common stock or 9.9%, in number or value, of our outstanding preferred stock), or in violation of certain other limitations set forth in our Charter, then the shares that are beneficially or constructively owned in excess of the relevant limitation are considered to be “excess shares.” Excess shares are automatically deemed transferred to a trust for the benefit of a charitable institution or other qualifying organization selected by our Board of Directors. The trust is entitled to all dividends with respect to the excess shares, and the trustee may exercise all voting power over the excess shares.
We have the right to purchase the excess shares for a purchase price equal to the lesser of the price per share in the transaction that created the excess shares or the market price on the date we buy the shares, and we may defer payment of the purchase price for up to five years (and we are not obligated to pay interest on such deferred payment). If we do not purchase the excess shares, the trustee of the trust is required to transfer the excess shares at the direction of our Board of Directors. The owner of the excess shares is entitled to receive the lesser of the proceeds from the sale of the excess shares or the original purchase price for such excess shares, and any additional amounts are payable to the beneficiary of the trust. As of December 31, 2024, there were no shares in the trust. Our Charter also provides that a transfer of shares of common or preferred stock that would otherwise result in ownership, under the applicable attribution rules of the Code, of shares in excess of the ownership limit, would cause our shares to be beneficially owned by fewer than 100 persons, or would result in our being “closely held” (within the meaning of Section 856(h) of the Code), will be void ab initio and the purported transferee will acquire no rights in such shares.
Our Board of Directors is empowered to grant waivers from the excess share provisions of our Charter under certain circumstances.
VENTAS, INC.
NOTES TO CONSOLIDATED FINANCIAL STATEMENTS
Accumulated Other Comprehensive Loss
The following is a summary of our accumulated other comprehensive loss (dollars in thousands):
| | | | | | | | | | | |
| As of December 31, |
| | 2024 | | 2023 |
| Foreign currency translation loss | $ | (34,341) | | | $ | (56,596) | |
| Unrealized loss on available for sale securities | (2,118) | | | (1,256) | |
| Unrealized gain on derivative instruments | 2,933 | | | 22,095 | |
| Total accumulated other comprehensive loss | $ | (33,526) | | | $ | (35,757) | |
Redeemable OP Unitholder and Noncontrolling Interests
The following is a roll-forward of our redeemable OP unitholder and noncontrolling interests for 2024 (dollars in thousands):
| | | | | | | | | | | | | | | | | | | | |
| | Redeemable OP Unitholder Interests | | Redeemable Noncontrolling Interests | | Total Redeemable OP Unitholder and Noncontrolling Interests |
| Balance as of December 31, 2023 | | $ | 173,452 | | | $ | 129,184 | | | $ | 302,636 | |
| New issuances | | — | | | 1,141 | | | 1,141 | |
| Change in fair value | | 34,163 | | | 1,198 | | | 35,361 | |
| Dispositions | | — | | | — | | | — | |
| Distributions and other | | (6,424) | | | (21,714) | | | (28,138) | |
| Redemptions | | (771) | | | — | | | (771) | |
| Balance as of December 31, 2024 | | $ | 200,420 | | | $ | 109,809 | | | $ | 310,229 | |
NOTE 17 – RELATED PARTY TRANSACTIONS
Atria
We hold a 34% ownership interest in Atria, which entitles us to customary minority rights and protections, including the right to appoint two members to the Atria Board of Directors.
Atria provides comprehensive property management and accounting services with respect to our senior housing communities that Atria operates, for which we pay annual management fees pursuant to long-term management agreements. For the years ended December 31, 2024, 2023 and 2022, we incurred fees to Atria of $62.9 million, $63.4 million and $61.5 million, respectively, which are recorded within property-level operating expenses in our Consolidated Statements of Income. For the year ended December 31, 2024, 2023 and 2022, we incurred fees to Atria of $0.1 million, $1.5 million and $6.1 million, respectively, primarily in connection with the transition of senior housing communities operated by Atria, which are recorded within Transaction, transition and restructuring costs in our Consolidated Statements of Income.
Ardent
As of December 31, 2024, we held an approximately 6.7% ownership interest in Ardent. One of our executive officers is currently a member of the Ardent Board of Directors. Going forward, we have the right (but not the obligation) to nominate one member of the Ardent Board of Directors for so long as we beneficially own 4% or more of the total voting power of the outstanding common stock of Ardent, pursuant to our nomination agreement with Ardent. Following Ardent’s initial public offering, which was consummated in July 2024, our equity stake in Ardent decreased from the issuance of primary shares from 7.5% to approximately 6.7%, which resulted in a gain of $8.7 million for the year ended December 31, 2024, which is included in Income from unconsolidated entities in our Consolidated Statements of Income.
In May 2023, we sold approximately 24% of our ownership interest in Ardent to a third-party investor for $50.1 million in total proceeds. As a result of the sale, we recognized $33.5 million of gain for the year ended December 31,
VENTAS, INC.
NOTES TO CONSOLIDATED FINANCIAL STATEMENTS
2023 in Income from unconsolidated entities in our Consolidated Statements of Income and our ownership interest in Ardent was reduced from 9.8% to 7.5%.
As of December 31, 2024, we leased 11 hospitals to Ardent pursuant to a single, triple-net master lease agreement. For the years ended December 31, 2024, 2023 and 2022, we recognized rental income from Ardent of $137.1 million, $133.7 million and $130.5 million, respectively. As of December 31, 2024, we also leased 19 outpatient medical buildings to Ardent under separate leases included in our OM&R segment. For the years ended December 31, 2024, 2023 and 2022, we recognized rental income from Ardent of $13.5 million, $13.4 million and $12.1 million, respectively.
PMBRES
We hold a 50% ownership interest in PMB Real Estate Services LLC (“PMBRES”), which entitles us to customary rights and protections, including the right to appoint two members to the PMBRES Board of Directors.
PMBRES provides outpatient medical building management, leasing, marketing, facility development and advisory services to highly rated hospitals and other healthcare facilities throughout the United States, for which we pay management fees and leasing commissions pursuant to long-term management agreements. For the years ended December 31, 2024, 2023 and 2022, we incurred fees to PMBRES of $11.2 million, $10.9 million and $8.5 million, respectively. Management fees are recorded within property-level operating expenses in our Consolidated Statements of Income. Leasing commissions are accounted for as initial direct costs and recorded within other assets on our Consolidated Balance Sheets and amortized over the life of the related lease.
NOTE 18 – SEGMENT INFORMATION
As of December 31, 2024, we operated through three reportable business segments: SHOP, OM&R and NNN. In our SHOP segment, we own and invest in senior housing communities throughout the United States and Canada and engage operators to operate those communities. In our OM&R segment, we primarily acquire, own, develop, lease and manage outpatient medical buildings and research centers throughout the United States. In our NNN segment, we invest in and own senior housing communities, skilled nursing facilities (“SNFs”), long-term acute care facilities (“LTACs”), freestanding inpatient rehabilitation facilities (“IRFs”) and other healthcare facilities, throughout the United States and the United Kingdom and lease these properties to tenants under triple-net or absolute-net leases that obligate the tenants to pay all property-related expenses, including maintenance, utilities, repairs, taxes, insurance and capital expenditures. Information provided for “non-segment” includes management fees and promote revenues, net of expenses related to our third-party institutional private capital management platform, income from loans and investments and corporate-level expenses not directly attributable to any of our three reportable business segments. Non-segment assets consist primarily of corporate assets, including cash and cash equivalents, restricted cash, loans receivable and investments and accounts receivable. Non-segment assets also include our investments in unconsolidated entities, including investments in unconsolidated real estate entities through our third-party institutional private capital management platform, VIM, and investments in unconsolidated operating entities, such as Ardent and Atria. Through VIM, we partner with third-party institutional investors to invest in real estate through various joint ventures and other co-investment vehicles. Non-segment assets also include other assets, such as our Brookdale and Kindred Warrants. Total assets by reportable business segment is not disclosed as the CODM does not review such information to evaluate business performance and allocate resources. The accounting policies for the segments are the same as those described in the summary of significant accounting policies (see “Note 2 – Accounting Policies”).
Our chief operating decision maker (“CODM”) is the Chief Executive Officer of the Company. Our CODM evaluates performance of the combined properties in each reportable business segment and determines how to allocate resources to those segments based on NOI for each segment. Our CODM uses NOI to assess the performance of each segment and to allocate resources (including employees and financial or capital resources) primarily during the quarterly or annual business review and annual budget and forecasting process. We define NOI as total revenues, less interest and other income, property-level operating expenses and third-party capital management expenses. We consider NOI useful because it allows investors, analysts and our management to measure unlevered property-level operating results and to compare our operating results to the operating results of other real estate companies between periods on a consistent basis. In order to facilitate a clear understanding of our historical consolidated operating results, NOI should be examined in conjunction with net income attributable to common stockholders as presented in our Consolidated Financial Statements and other financial data included elsewhere in this Annual Report. See “Non-GAAP Financial Measures” included elsewhere in this Annual Report for additional disclosure and reconciliations of net income attributable to common stockholders, as computed in accordance with GAAP, to NOI.
VENTAS, INC.
NOTES TO CONSOLIDATED FINANCIAL STATEMENTS
Interest expense, depreciation and amortization, general, administrative and professional fees, income tax expense and other non-property-specific revenues and expenses are not allocated to individual reportable business segments for purposes of assessing segment performance. There are no intersegment sales or transfers.
VENTAS, INC.
NOTES TO CONSOLIDATED FINANCIAL STATEMENTS
Summary information by reportable business segment is as follows (dollars in thousands):
| | | | | | | | | | | | | | | | | | | | | | | | | | | | | |
| For the Year Ended December 31, 2024 |
| SHOP | | OM&R | | NNN | | Non-Segment | | Total |
| Revenues: | | | | | | | | | |
| Rental income | $ | — | | | $ | 874,886 | | | $ | 622,054 | | | $ | — | | | $ | 1,496,940 | |
| Resident fees and services | 3,372,796 | | | — | | | — | | | — | | | 3,372,796 | |
| Third-party capital management revenues | — | | | 2,705 | | | — | | | 14,654 | | | 17,359 | |
| Income from loans and investments | — | | | — | | | — | | | 9,057 | | | 9,057 | |
| Interest and other income | — | | | — | | | — | | | 28,114 | | | 28,114 | |
| Total revenues | $ | 3,372,796 | | | $ | 877,591 | | | $ | 622,054 | | | $ | 51,825 | | | $ | 4,924,266 | |
| | | | | | | | | |
| Total revenues | $ | 3,372,796 | | | $ | 877,591 | | | $ | 622,054 | | | $ | 51,825 | | | $ | 4,924,266 | |
| Less: | | | | | | | | | |
| Interest and other income | — | | | — | | | — | | | 28,114 | | | 28,114 | |
Labor (1) | 1,418,320 | | | — | | | — | | | — | | | 1,418,320 | |
| Management fees | 174,491 | | | — | | | — | | | — | | | 174,491 | |
Other segment expenses (2) | 913,602 | | | 298,320 | | | 15,829 | | | — | | | 1,227,751 | |
| Property-level operating expenses | 2,506,413 | | | 298,320 | | | 15,829 | | | — | | | 2,820,562 | |
| Third-party capital management expenses | — | | | — | | | — | | | 6,507 | | | 6,507 | |
| NOI | $ | 866,383 | | | $ | 579,271 | | | $ | 606,225 | | | $ | 17,204 | | | 2,069,083 | |
| Interest and other income | | | | | | | | | 28,114 | |
| Interest expense | | | | | | | | | (602,835) | |
| Depreciation and amortization | | | | | | | | | (1,253,143) | |
| General, administrative and professional fees | | | | | | | | | (162,990) | |
| Loss on extinguishment of debt, net | | | | | | | | | (687) | |
| Transaction, transition and restructuring costs | | | | | | | | | (20,369) | |
| Reversal of allowance on loans receivable and investments, net | | | | | | | | | 166 | |
| | | | | | | | | |
| Shareholder relations matters | | | | | | | | | (15,751) | |
| Other expense | | | | | | | | | (49,584) | |
| Income from unconsolidated entities | | | | | | | | | 1,563 | |
| Gain on real estate dispositions | | | | | | | | | 57,009 | |
| Income tax benefit | | | | | | | | | 37,775 | |
| | | | | | | | | |
| Net income | | | | | | | | | 88,351 | |
| Net income attributable to noncontrolling interests | | | | | | | | | 7,198 | |
| Net income attributable to common stockholders | | | | | | | | | $ | 81,153 | |
______________________________
(1) Labor expense primarily includes salaries, benefits and related taxes.
(2) Other segment expenses include:
•SHOP — food, utilities, real estate taxes, insurance, repairs and maintenance, marketing, supplies and other expenses.
•OM&R — utilities, real estate taxes, insurance, repairs and maintenance, cleaning, roads and grounds expense and other expenses.
•NNN — real estate taxes and insurance.
The CODM does not regularly receive significant expense details for the OM&R or the NNN segments and focuses on monitoring revenues and NOI because a significant majority or all of the property-level operating expenses are recovered from the tenants.
VENTAS, INC.
NOTES TO CONSOLIDATED FINANCIAL STATEMENTS
| | | | | | | | | | | | | | | | | | | | | | | | | | | | | |
| For the Year Ended December 31, 2023 |
| SHOP | | OM&R | | NNN | | Non-Segment | | Total |
| Revenues: | | | | | | | | | |
| Rental income | $ | — | | | $ | 867,193 | | | $ | 619,208 | | | $ | — | | | $ | 1,486,401 | |
| Resident fees and services | 2,959,219 | | | — | | | — | | | — | | | 2,959,219 | |
| Third-party capital management revenues | — | | | 2,515 | | | — | | | 15,326 | | | 17,841 | |
| Income from loans and investments | — | | | — | | | — | | | 22,952 | | | 22,952 | |
| Interest and other income | — | | | — | | | — | | | 11,414 | | | 11,414 | |
| Total revenues | $ | 2,959,219 | | | $ | 869,708 | | | $ | 619,208 | | | $ | 49,692 | | | $ | 4,497,827 | |
| | | | | | | | | |
| Total revenues | $ | 2,959,219 | | | $ | 869,708 | | | $ | 619,208 | | | $ | 49,692 | | | $ | 4,497,827 | |
| Less: | | | | | | | | | |
| Interest and other income | — | | | — | | | — | | | 11,414 | | | 11,414 | |
Labor (1) | 1,279,296 | | | — | | | — | | | — | | | 1,279,296 | |
| Management fees | 146,162 | | | — | | | — | | | — | | | 146,162 | |
Other segment expenses (2) | 822,354 | | | 292,776 | | | 14,557 | | | — | | | 1,129,687 | |
| Property-level operating expenses | 2,247,812 | | | 292,776 | | | 14,557 | | | — | | | 2,555,145 | |
| Third-party capital management expenses | — | | | — | | | — | | | 6,101 | | | 6,101 | |
| NOI | $ | 711,407 | | | $ | 576,932 | | | $ | 604,651 | | | $ | 32,177 | | | 1,925,167 | |
| Interest and other income | | | | | | | | | 11,414 | |
| Interest expense | | | | | | | | | (574,112) | |
| Depreciation and amortization | | | | | | | | | (1,392,461) | |
| General, administrative and professional fees | | | | | | | | | (148,876) | |
| Gain on extinguishment of debt, net | | | | | | | | | 6,104 | |
| Transaction, transition and restructuring costs | | | | | | | | | (15,215) | |
| Reversal of allowance on loans receivable and investments, net | | | | | | | | | 20,270 | |
| Gain on foreclosure of real estate | | | | | | | | | 29,127 | |
| | | | | | | | | |
| Other income | | | | | | | | | 23,001 | |
| Income from unconsolidated entities | | | | | | | | | 13,626 | |
| Gain on real estate dispositions | | | | | | | | | 62,119 | |
| Income tax benefit | | | | | | | | | 9,539 | |
| | | | | | | | | |
| Net loss | | | | | | | | | (30,297) | |
| Net income attributable to noncontrolling interests | | | | | | | | | 10,676 | |
| Net loss attributable to common stockholders | | | | | | | | | $ | (40,973) | |
______________________________
(1) Labor expense primarily includes salaries, benefits and related taxes.
(2) Other segment expenses include:
•SHOP — food, utilities, real estate taxes, insurance, repairs and maintenance, marketing, supplies and other expenses.
•OM&R — utilities, real estate taxes, insurance, repairs and maintenance, cleaning, roads and grounds expense and other expenses.
•NNN — real estate taxes and insurance.
The CODM does not regularly receive significant expense details for the OM&R or the NNN segments and focuses on monitoring revenues and NOI because a significant majority or all of the property-level operating expenses are recovered from the tenants.
VENTAS, INC.
NOTES TO CONSOLIDATED FINANCIAL STATEMENTS
| | | | | | | | | | | | | | | | | | | | | | | | | | | | | |
| For the Year Ended December 31, 2022 |
| SHOP | | OM&R | | NNN | | Non-Segment | | Total |
| Revenues: | | | | | | | | | |
| Rental income | $ | — | | | $ | 801,159 | | | $ | 598,154 | | | $ | — | | | $ | 1,399,313 | |
| Resident fees and services | 2,651,886 | | | — | | | — | | | — | | | 2,651,886 | |
| Third-party capital management revenues | — | | | 2,448 | | | — | | | 23,751 | | | 26,199 | |
| Income from loans and investments | — | | | — | | | — | | | 48,160 | | | 48,160 | |
| Interest and other income | — | | | — | | | — | | | 3,635 | | | 3,635 | |
| Total revenues | $ | 2,651,886 | | | $ | 803,607 | | | $ | 598,154 | | | $ | 75,546 | | | $ | 4,129,193 | |
| | | | | | | | | |
| Total revenues | $ | 2,651,886 | | | $ | 803,607 | | | $ | 598,154 | | | $ | 75,546 | | | $ | 4,129,193 | |
| Less: | | | | | | | | | |
| Interest and other income | — | | | — | | | — | | | 3,635 | | | 3,635 | |
Labor (1) | 1,164,761 | | | — | | | — | | | — | | | 1,164,761 | |
| Management fees | 127,453 | | | — | | | — | | | — | | | 127,453 | |
Other segment expenses (2) | 712,206 | | | 257,003 | | | 15,301 | | | — | | | 984,510 | |
| Property-level operating expenses | 2,004,420 | | | 257,003 | | | 15,301 | | | — | | | 2,276,724 | |
| Third-party capital management expenses | — | | | — | | | — | | | 6,194 | | | 6,194 | |
| NOI | $ | 647,466 | | | $ | 546,604 | | | $ | 582,853 | | | $ | 65,717 | | | 1,842,640 | |
| Interest and other income | | | | | | | | | 3,635 | |
| Interest expense | | | | | | | | | (467,557) | |
| Depreciation and amortization | | | | | | | | | (1,197,798) | |
| General, administrative and professional fees | | | | | | | | | (144,874) | |
| Loss on extinguishment of debt, net | | | | | | | | | (581) | |
| Transaction, transition and restructuring costs | | | | | | | | | (30,884) | |
| Allowance on loans receivable and investments, net | | | | | | | | | (19,757) | |
| | | | | | | | | |
| Shareholder relations matters | | | | | | | | | (20,693) | |
| Other expense | | | | | | | | | (58,268) | |
| Income from unconsolidated entities | | | | | | | | | 28,500 | |
| Gain on real estate dispositions | | | | | | | | | 7,780 | |
| Income tax benefit | | | | | | | | | 16,926 | |
| | | | | | | | | |
| Net loss | | | | | | | | | (40,931) | |
| Net income attributable to noncontrolling interests | | | | | | | | | 6,516 | |
| Net loss attributable to common stockholders | | | | | | | | | $ | (47,447) | |
______________________________
(1) Labor expense primarily includes salaries, benefits and related taxes.
(2) Other segment expenses include:
•SHOP — food, utilities, real estate taxes, insurance, repairs and maintenance, marketing, supplies and other expenses.
•OM&R — utilities, real estate taxes, insurance, repairs and maintenance, cleaning, roads and grounds expense and other expenses.
•NNN — real estate taxes and insurance.
The CODM does not regularly receive significant expense details for the OM&R or the NNN segments and focuses on monitoring revenues and NOI because a significant majority or all of the property-level operating expenses are recovered from the tenants.
VENTAS, INC.
NOTES TO CONSOLIDATED FINANCIAL STATEMENTS
Capital expenditures, including investments in real estate property and development project expenditures, by reportable business segment are as follows (dollars in thousands):
| | | | | | | | | | | | | | | | | |
| | For the Years Ended December 31, |
| Capital Expenditures: | 2024 | | 2023 | | 2022 |
| SHOP | $ | 2,061,741 | | | $ | 409,105 | | | $ | 423,420 | |
| OM&R | 273,615 | | | 231,855 | | | 472,662 | |
| NNN | 194,447 | | | 8,511 | | | 4,614 | |
| Total capital expenditures | $ | 2,529,803 | | | $ | 649,471 | | | $ | 900,696 | |
Our portfolio of properties and loans and other investments are located in the United States, Canada and the United Kingdom. Revenues are attributed to an individual country based on the location of each property. Geographic information regarding our operations is as follows (dollars in thousands):
| | | | | | | | | | | |
| | As of December 31, |
| Net Real Estate Property: | 2024 | | 2023 |
| United States | $ | 19,690,838 | | | $ | 18,702,960 | |
| Canada | 2,719,078 | | | 2,837,858 | |
| United Kingdom | 190,629 | | | 208,132 | |
| Total net real estate property | $ | 22,600,545 | | | $ | 21,748,950 | |
| | | | | | | | | | | | | | | | | |
| For the Years Ended December 31, |
| Revenues: | 2024 | | 2023 | | 2022 |
| United States | $ | 4,366,953 | | | $ | 4,004,173 | | | $ | 3,652,327 | |
| Canada | 526,575 | | | 464,772 | | | 449,091 | |
| United Kingdom | 30,738 | | | 28,882 | | | 27,775 | |
| Total revenues | $ | 4,924,266 | | | $ | 4,497,827 | | | $ | 4,129,193 | |
VENTAS, INC.
SCHEDULE III - REAL ESTATE AND ACCUMULATED DEPRECIATION
(Dollars in thousands)
| | | | | | | | | | | | | | | | | |
| | For the Years Ended December 31, |
| | 2024 | | 2023 | | 2022 |
| Reconciliation of real estate: | | | | | |
| Carrying cost: | | | | | |
| Balance at beginning of period | $ | 30,165,798 | | | $ | 28,768,409 | | | $ | 28,479,870 | |
| Additions during period: | | | | | |
| Acquisitions | 1,817,275 | | | 1,437,729 | | | 460,959 | |
| Capital expenditures | 560,006 | | | 645,596 | | | 443,710 | |
| Deductions during period: | | | | | |
| Foreign currency translation | (287,505) | | | 90,105 | | | (265,942) | |
Other (1) | (425,563) | | | (776,041) | | | (350,188) | |
| Balance at end of period | $ | 31,830,011 | | | $ | 30,165,798 | | | $ | 28,768,409 | |
| | | | | |
| Accumulated depreciation: | | | | | |
| Balance at beginning of period | $ | 9,016,173 | | | $ | 8,231,160 | | | $ | 7,433,480 | |
| Additions during period: | | | | | |
| Depreciation expense | 1,015,531 | | | 937,767 | | | 907,134 | |
| Dispositions: | | | | | |
| Sales and/or transfers to assets held for sale | (115,981) | | | (190,666) | | | (72,047) | |
| Foreign currency translation | (76,185) | | | 37,912 | | | (37,407) | |
| Balance at end of period | $ | 9,839,538 | | | $ | 9,016,173 | | | $ | 8,231,160 | |
______________________________
(1)Other may include sales, transfers to assets held for sale and impairments.
VENTAS, INC.
SCHEDULE III - REAL ESTATE AND ACCUMULATED DEPRECIATION
December 31, 2024
(Dollars in thousands)
| | | | | | | | | | | | | | | | | | | | | | | | | | | | | | | | | | | | | | | | | | | | | | | | | | | | | | | | | | | | | | | | | | | | | | | | | | | | | | | | | | | | | | | | | | | | |
| | | | | | | | Initial Cost to Company | | | | Gross Amount Carried
at Close of Period | | | | | | | | | | | | | | |
| | Description | | Count | | Encumbrances | | Land and
Improvements | | Buildings and
Improvements | | Costs Capitalized Subsequent to Acquisition (1) | | Land and
Improvements | | Buildings and
Improvements | | Total | | Accumulated
Depreciation | | Net Book Value | | Year of
Construction | | Year
Acquired | | Life on which
Depreciation
In Income Statement is Computed | | |
| UNITED STATES PROPERTIES | | | | | | | | | | | | | | | | | | | | | | | | | | | | |
| Senior Housing | | | | | | | | | | | | | | | | | | | | | | | | | | | | |
| | Atria Senior Living | | 168 | | | $ | 808,973 | | | $ | 511,890 | | | $ | 4,640,742 | | | $ | 759,032 | | | $ | 542,415 | | | $ | 5,369,249 | | | $ | 5,911,664 | | | $ | 2,018,616 | | | $ | 3,893,048 | | | 1860 - 2013 | | 2007 - 2021 | | 13 - 54 years | | |
| | Brookdale Senior Living | | 129 | | | 48,040 | | | 190,091 | | | 1,860,167 | | | 131,497 | | | 190,698 | | | 1,991,057 | | | 2,181,755 | | | 1,066,193 | | | 1,115,563 | | | 1915 - 2012 | | 2004 - 2021 | | 24 - 35 years | | |
| | Sunrise Senior Living | | 86 | | | 41,372 | | | 210,207 | | | 2,331,589 | | | 275,821 | | | 223,688 | | | 2,593,930 | | | 2,817,617 | | | 1,194,960 | | | 1,622,657 | | | 1985 - 2009 | | 2007 - 2021 | | 17 - 35 years | | |
| | Sinceri Senior Living | | 40 | | | — | | | 74,077 | | | 693,443 | | | 83,227 | | | 76,113 | | | 774,634 | | | 850,747 | | | 278,086 | | | 572,661 | | | 1974 - 2017 | | 2006 - 2024 | | 35 - 35 years | | |
| | Discovery Senior Living | | 34 | | | 27,964 | | | 72,430 | | | 659,902 | | | 53,549 | | | 73,629 | | | 712,253 | | | 785,881 | | | 168,124 | | | 617,758 | | | 1984 - 2020 | | 2006 - 2024 | | 24 - 35 years | | |
| | Priority Life Care Properties | | 32 | | | 37,954 | | | 47,010 | | | 445,682 | | | 68,896 | | | 48,199 | | | 513,388 | | | 561,588 | | | 179,116 | | | 382,471 | | | 1986 - 2009 | | 2006 - 2021 | | 29 - 51 years | | |
| | Sodalis Senior Living | | 30 | | | — | | | 52,780 | | | 441,080 | | | 52,397 | | | 53,402 | | | 492,856 | | | 546,257 | | | 162,765 | | | 383,492 | | | 1987 - 2009 | | 2006 - 2021 | | 14 - 47 years | | |
| | Grace Management | | 26 | | | 17,662 | | | 98,083 | | | 655,799 | | | 13,278 | | | 98,082 | | | 669,078 | | | 767,160 | | | 28,040 | | | 739,120 | | | 1985 - 2016 | | 2011 - 2024 | | 12 - 39 years | | |
| | Koelsch Senior Communities | | 19 | | | 64,403 | | | 27,721 | | | 292,414 | | | 13,289 | | | 28,133 | | | 305,291 | | | 333,424 | | | 83,674 | | | 249,750 | | | 1972 - 2014 | | 2011 - 2017 | | 35 - 35 years | | |
| | Senior Lifestyle | | 16 | | | — | | | 55,911 | | | 553,261 | | | 27,969 | | | 57,328 | | | 579,813 | | | 637,141 | | | 76,081 | | | 561,059 | | | 1982 - 2012 | | 2011 - 2023 | | 33 - 35 years | | |
| | Meridian Senior Living | | 14 | | | — | | | 19,090 | | | 104,237 | | | 2,025 | | | 19,091 | | | 106,261 | | | 125,352 | | | 29,308 | | | 96,044 | | | 1972 - 2012 | | 2011 - 2023 | | 35 - 35 years | | |
| | Sonida Senior Living | | 13 | | | 12,401 | | | 18,129 | | | 197,928 | | | 38,816 | | | 18,833 | | | 236,040 | | | 254,873 | | | 89,332 | | | 165,541 | | | 1979 - 2006 | | 2005 - 2021 | | 35 - 47 years | | |
| | Azura Memory Care | | 13 | | | — | | | 6,361 | | | 53,002 | | | 7,193 | | | 7,200 | | | 59,356 | | | 66,556 | | | 24,560 | | | 41,996 | | | 1990 - 2019 | | 2011 - 2019 | | 35 - 35 years | | |
| | Milestone Retirement Communities | | 11 | | | — | | | 16,810 | | | 183,225 | | | 20,049 | | | 16,903 | | | 203,181 | | | 220,084 | | | 60,488 | | | 159,596 | | | 1965 - 2011 | | 2011 - 2014 | | 35 - 35 years | | |
| | American House | | 11 | | | — | | | 5,438 | | | 124,369 | | | 20,905 | | | 6,926 | | | 143,786 | | | 150,712 | | | 65,038 | | | 85,674 | | | 1998 - 2000 | | 2006 - 2014 | | 35 - 35 years | | |
| | Avamere Family of Companies | | 11 | | | — | | | 20,407 | | | 113,192 | | | 13,817 | | | 20,654 | | | 126,763 | | | 147,416 | | | 50,780 | | | 96,636 | | | 1998 - 2014 | | 2011 - 2015 | | 35 - 35 years | | |
| | Hawthorn Senior Living | | 10 | | | 55,205 | | | 35,668 | | | 220,099 | | | 19,542 | | | 35,890 | | | 239,418 | | | 275,309 | | | 34,035 | | | 241,274 | | | 1991 - 2008 | | 2021 - 2021 | | 27 - 50 years | | |
| | Other Senior Housing Operators | | 75 | | | 91,351 | | | 127,976 | | | 1,258,229 | | | 44,351 | | | 127,606 | | | 1,302,947 | | | 1,430,555 | | | 294,791 | | | 1,135,768 | | | 1972 - 2021 | | 2004 - 2024 | | 11 - 35 years | | |
| | Other Senior Housing | | | | — | | | — | | | 165 | | | — | | | — | | | 165 | | | 165 | | | — | | | 165 | | | | | | | | | |
| Total Senior Housing | | 738 | | | 1,205,325 | | | 1,590,079 | | | 14,828,525 | | | 1,645,653 | | | 1,644,790 | | | 16,419,466 | | | 18,064,256 | | | 5,903,987 | | | 12,160,273 | | | | | | | | | |
| | | | | | | | | | | | | | | | | | | | | | | | | | | | | | |
| Outpatient Medical Buildings | | | | | | | | | | | | | | | | | | | | | | | | | | | | |
| | Lillibridge | | 215 | | | 24,760 | | | 165,132 | | | 2,113,822 | | | 683,332 | | | 170,334 | | | 2,791,952 | | | 2,962,286 | | | 1,223,597 | | | 1,738,689 | | | 1960 - 2016 | | 2004 - 2023 | | 4 - 39 years | | |
| | PMB RES | | 40 | | | 238,007 | | | 80,638 | | | 975,535 | | | 198,377 | | | 82,416 | | | 1,172,134 | | | 1,254,550 | | | 433,324 | | | 821,226 | | | 1968 - 2024 | | 2011 - 2023 | | 19 - 35 years | | |
| | Cornerstone Companies, Inc. | | 26 | | | — | | | 28,336 | | | 156,018 | | | 3,636 | | | 28,417 | | | 159,573 | | | 187,990 | | | 11,531 | | | 176,459 | | | 1975 - 2012 | | 2023 - 2023 | | 35 - 35 years | | |
| | Ardent Health Services | | 19 | | | — | | | 5,638 | | | 214,808 | | | 599 | | | 5,638 | | | 215,408 | | | 221,045 | | | 20,329 | | | 200,716 | | | 1974 - 2011 | | 2018 - 2022 | | 35 - 35 years | | |
| | Memorial Health System | | 12 | | | — | | | 2,346 | | | 25,031 | | | 13,169 | | | 2,453 | | | 38,093 | | | 40,546 | | | 24,592 | | | 15,954 | | | 1976 - 2003 | | 2010 - 2010 | | 35 - 35 years | | |
| | Other Medical Buildings Operators | | 85 | | | 10,805 | | | 133,897 | | | 1,033,609 | | | 55,493 | | | 131,098 | | | 1,091,901 | | | 1,222,999 | | | 371,341 | | | 851,658 | | | 1954 - 2019 | | 2004 - 2023 | | 25 - 35 years | | |
| | Other Medical Buildings | | | | — | | | — | | | — | | | 5,655 | | | 3,644 | | | 2,011 | | | 5,655 | | | 2,363 | | | 3,292 | | | | | | | | | |
| Total Outpatient Medical Buildings | | 397 | | | 273,572 | | | 415,987 | | | 4,518,823 | | | 960,261 | | | 424,000 | | | 5,471,072 | | | 5,895,071 | | | 2,087,077 | | | 3,807,994 | | | | | | | | | |
| | | | | | | | | | | | | | | | | | | | | | | | | | | | | | |
| | | | | | | | | | | | | | | | | | | | | | | | | | | | | | | | | | | | | | | | | | | | | | | | | | | | | | | | | | | | | | | | | | | | | | | | | | | | | | | | | | | | | | | | | | | | |
| | | | | | | | Initial Cost to Company | | | | Gross Amount Carried
at Close of Period | | | | | | | | | | | | | | |
| | Description | | Count | | Encumbrances | | Land and
Improvements | | Buildings and
Improvements | | Costs Capitalized Subsequent to Acquisition (1) | | Land and
Improvements | | Buildings and
Improvements | | Total | | Accumulated
Depreciation | | Net Book Value | | Year of
Construction | | Year
Acquired | | Life on which
Depreciation
In Income Statement is Computed | | |
| Research | | | | | | | | | | | | | | | | | | | | | | | | | | |
| | Wexford | | 27 | | | 227,600 | | | 71,764 | | | 1,429,367 | | | 55,798 | | | 71,002 | | | 1,485,927 | | | 1,556,929 | | | 381,547 | | | 1,175,382 | | | 1900 - 2019 | | 2016 - 2022 | | 15 - 60 years | | |
| | Other Research Operators | | 2 | | | — | | | 1,194 | | | 76,515 | | | 290 | | | 1,193 | | | 76,806 | | | 77,999 | | | 12,334 | | | 65,665 | | | 2010 - 2016 | | 2020 - 2020 | | 35 - 35 years | | |
| | Other Research | | | | 71,695 | | | — | | | 11,328 | | | 258,172 | | | 69,458 | | | 200,042 | | | 269,500 | | | 8,764 | | | 260,736 | | | | | | | | | |
| Total Research | | 29 | | | 299,295 | | | 72,958 | | | 1,517,210 | | | 314,260 | | | 141,653 | | | 1,762,775 | | | 1,904,428 | | | 402,645 | | | 1,501,783 | | | | | | | | | |
| | | | | | | | | | | | | | | | | | | | | | | | | | | | | | |
| IRFs & LTACs | | | | | | | | | | | | | | | | | | | | | | | | | | | | |
| | Kindred Healthcare | | 34 | | | — | | | 86,024 | | | 348,554 | | | (660) | | | 85,027 | | | 348,890 | | | 433,917 | | | 212,065 | | | 221,852 | | | 1949 - 2008 | | 1998 - 2024 | | 20 - 40 years | | |
| | Other IRFs & LTACs | | 14 | | | — | | | 18,641 | | | 198,449 | | | 1,070 | | | 18,644 | | | 199,517 | | | 218,160 | | | 56,594 | | | 161,567 | | | 1989 - 2013 | | 2011 - 2023 | | 35 - 36 years | | |
| Total IRFs & LTACs | | 48 | | | — | | | 104,665 | | | 547,003 | | | 410 | | | 103,671 | | | 548,407 | | | 652,077 | | | 268,659 | | | 383,419 | | | | | | | | | |
| | | | | | | | | | | | | | | | | | | | | | | | | | | | | | |
| Other Healthcare Facilities | | | | | | | | | | | | | | | | | | | | | | | | | | | | |
| | Ardent Health Services | | 10 | | | — | | | 98,428 | | | 1,126,010 | | | 78,106 | | | 97,416 | | | 1,205,128 | | | 1,302,544 | | | 321,882 | | | 980,663 | | | 1928 - 2020 | | 2018 - 2022 | | 35 - 35 years | | |
| | | | | | | | | | | | | | | | | | | | | | | | | | | | | | |
| Skilled Nursing | | | | | | | | | | | | | | | | | | | | | | | | | | | | |
| | Genesis Healthcare | | 12 | | | — | | | 11,350 | | | 164,745 | | | (5,708) | | | 11,350 | | | 159,037 | | | 170,387 | | | 82,117 | | | 88,270 | | | 1948 - 1995 | | 2004 - 2011 | | 30 - 35 years | | |
| | Other Skilled Nursing Operators | | 22 | | | — | | | 31,502 | | | 192,512 | | | (22,707) | | | 31,683 | | | 169,624 | | | 201,307 | | | 26,933 | | | 174,373 | | | 1920 - 2000 | | 1998 - 2023 | | 29 - 40 years | | |
| | | | | | | | | | | | | | | | | | | | | | | | | | | | | | |
| Total Skilled Nursing | | 34 | | | — | | | 42,852 | | | 357,257 | | | (28,415) | | | 43,033 | | | 328,661 | | | 371,694 | | | 109,050 | | | 262,643 | | | | | | | | | |
| | | | | | | | | | | | | | | | | | | | | | | | | | | | | | |
| CANADIAN PROPERTIES | | | | | | | | | | | | | | | | | | | | | | | | | | | | |
| Senior Housing | | | | | | | | | | | | | | | | | | | | | | | | | | | | |
| | Le Groupe Maurice | | 37 | | | 1,156,570 | | | 162,989 | | | 1,967,564 | | | (63,608) | | | 154,141 | | | 1,912,804 | | | 2,066,945 | | | 240,019 | | | 1,826,926 | | | 2000 - 2024 | | 2019 - 2022 | | 40 - 60 years | | |
| | Atria Senior Living | | 29 | | | 265,047 | | | 75,553 | | | 845,363 | | | (110,078) | | | 63,843 | | | 746,995 | | | 810,838 | | | 272,953 | | | 537,885 | | | 1988 - 2008 | | 2014 - 2014 | | 35 - 35 years | | |
| | Sunrise Senior Living | | 12 | | | — | | | 46,600 | | | 418,821 | | | (83,373) | | | 36,994 | | | 345,053 | | | 382,048 | | | 173,318 | | | 208,730 | | | 2001 - 2007 | | 2007 - 2007 | | 35 - 35 years | | |
| | Other Senior Housing Operators | | 6 | | | — | | | 25,172 | | | 146,694 | | | (16,019) | | | 22,116 | | | 133,732 | | | 155,847 | | | 14,841 | | | 141,006 | | | 2006 - 2019 | | 2021 - 2021 | | 35 - 35 years | | |
| | Other Senior Housing | | | | — | | | — | | | — | | | — | | | — | | | — | | | — | | | — | | | — | | | | | | | | | |
| Total Senior Housing | | 84 | | | 1,421,617 | | | 310,314 | | | 3,378,442 | | | (273,078) | | | 277,094 | | | 3,138,584 | | | 3,415,678 | | | 701,131 | | | 2,714,547 | | | | | | | | | |
| | | | | | | | | | | | | | | | | | | | | | | | | | | | | | |
| UNITED KINGDOM PROPERTIES | | | | | | | | | | | | | | | | | | | | | | | | | | | | |
| Senior Housing | | | | | | | | | | | | | | | | | | | | | | | | | | | | |
| | Canford Healthcare Limited | | 11 | | | — | | | 40,481 | | | 81,719 | | | (17,264) | | | 34,571 | | | 70,365 | | | 104,936 | | | 20,674 | | | 84,262 | | | 1910 - 2014 | | 2015 - 2017 | | 40 - 40 years | | |
| | | | | | | | | | | | | | | | | | | | | | | | | | | | | | |
| International Hospital | | | | | | | | | | | | | | | | | | | | | | | | | | | | |
| | Spire Healthcare | | 3 | | | — | | | 11,903 | | | 136,628 | | | (29,206) | | | 9,562 | | | 109,763 | | | 119,325 | | | 24,433 | | | 94,892 | | | 1980 - 1986 | | 2014 - 2014 | | 50 - 50 years | | |
| | | | | | | | | | | | | | | | | | | | | | | | | | | | | | |
| TOTAL | | 1,354 | | | $ | 3,199,809 | | | $ | 2,687,667 | | | $ | 26,491,617 | | | $ | 2,650,727 | | | $ | 2,775,790 | | | $ | 29,054,221 | | | $ | 31,830,011 | | | $ | 9,839,538 | | | $ | 21,990,473 | | | | | | | | | |
______________________________
(1) Adjustments to basis included provisions for asset impairments, partial dispositions, costs capitalized subsequent to acquisitions and foreign currency translation adjustments.
VENTAS, INC.
SCHEDULE IV - MORTGAGE LOANS ON REAL ESTATE
December 31, 2024
(Dollars in thousands)
| | | | | | | | | | | | | | | | | | | | | | | | | | | | | | | | | | | | | | | | | | | | | | | | | | |
| Location | | Interest Rate | | Fixed / Variable | | Maturity Date | | Periodic Payment Terms | | Prior Liens | | Face Amount of Mortgages | | Carrying Amount of Mortgages (1) | | Principal Amount of Loans Subject to Delinquent Principal or Interest |
| First mortgage relating to two senior housing properties located in: |
| Texas | | Lesser of 9.50% or Term SOFR plus 5.00% | | Variable | | 6/16/2025 | | Interest only (3) | | $ | — | | | $ | 8,000 | | | $ | 8,000 | | | $ | — | |
| First mortgage relating to one senior housing property located in: |
| Illinois | | Greater of 9.00% or Term SOFR plus 4.50% | | Variable | | 2/15/2026 | | Interest only | | — | | | 1,285 | | | 1,277 | | | — | |
| First mortgage relating to two senior housing properties located in: |
| Tennessee | | Greater of 9.00% or Term SOFR plus 4.50% | | Variable | | 4/23/2026 | | Interest only | | — | | | 3,150 | | | 3,100 | | | — | |
| First mortgage relating to two senior housing properties located in: |
| South Carolina | | Greater of 9.00% or Term SOFR plus 4.50% | | Variable | | 5/21/2026 | | Interest only | | — | | | 3,150 | | | 3,095 | | | — | |
| First mortgage relating to one senior housing property located in: |
| Washington | | Greater of 10.25% or Term SOFR plus 5.75% | | Variable | | 9/20/2027 | | Interest only (4) | | — | | | 109,000 | | | 108,022 | | | — | |
| First mortgage relating to one senior housing property located in: |
| Pennsylvania | | Term SOFR plus 3.75% | | Variable | | 11/4/2027 | | Interest and principal; $19.2M balloon due at maturity (2) | | — | | | 19,978 | | | 19,978 | | | — | |
| Total | | | | | | | | | | $ | — | | | $ | 144,563 | | | $ | 143,472 | | | $ | — | |
______________________________
(1) For Federal income tax purposes, the aggregate cost of investments in mortgage loans on real estate is the carrying amount, as disclosed in the schedule.
(2) A prepayment premium of 0% to3% is assessed on the outstanding principal balance depending on timing of prepayment and source of funds.
(3) This loan was originally scheduled to mature on June 16, 2024 and was extended to mature on June 15, 2025.
(4) A prepayment premium consisting of accelerated interest charged on the prepaid amount is assessed, as of the date of the prepayment, at the greater of the contract rate and the term SOFR forward curve through September 30, 2026. An exit fee is assessed at 1%of the amount of principal prepaid.
Reconciliation of Mortgage Loans:
| | | | | | | | | | | | | | | | | | | | |
| | Year Ended December 31, |
| | 2024 | | 2023 | | 2022 |
| Beginning Balance | | $ | 26,087 | | | $ | 491,334 | | | $ | 486,200 | |
| Additions: | | | | | | |
New loans (1) | | 115,359 | | | — | | | 25,247 | |
| Construction draws | | 2,100 | | | 835 | | | — | |
| Total additions | | 117,459 | | | 835 | | | 25,247 | |
| Deductions: | | | | | | |
| Principal repayments | | (74) | | | — | | | (113) | |
| Conversions to real property | | — | | | (486,082) | | | — | |
| Allowance | | — | | | 20,000 | | | (20,000) | |
| | | | | | |
| | | | | | |
| Total deductions | | (74) | | | (466,082) | | | (20,113) | |
| Effect of foreign currency translation | | — | | | — | | | — | |
| Ending Balance | | $ | 143,472 | | | $ | 26,087 | | | $ | 491,334 | |
______________________________
(1) New loans include $7.5 million received as non-cash consideration for properties sold in 2024.
ITEM 9. Changes in and Disagreements with Accountants on Accounting and Financial Disclosure
None.
ITEM 9A. Controls and Procedures
Evaluation of Disclosure Controls and Procedures
As required by Rules 13a-15(b) and 15d-15(b) of the Exchange Act, our management, with the participation of our Chief Executive Officer and Chief Financial Officer, has evaluated the effectiveness of our disclosure controls and procedures as of December 31, 2024. Based on that evaluation, our Chief Executive Officer and Chief Financial Officer concluded that our disclosure controls and procedures (as defined in Rules 13a-15(e) and 15d-15(e) under the Exchange Act) were effective as of December 31, 2024, at the reasonable assurance level.
Internal Control over Financial Reporting
The information set forth under “Management Report on Internal Control over Financial Reporting” and “Report of Independent Registered Public Accounting Firm on Internal Control over Financial Reporting” included in Part II, Item 8 of this Annual Report is incorporated by reference into this Item 9A.
Internal Control Changes
During the fourth quarter of 2024, there were no changes in our internal control over financial reporting (as defined in Rules 13a-15(f) and 15d-15(f) under the Exchange Act) that have materially affected, or are reasonably likely to materially affect, our internal control over financial reporting.
ITEM 9B. Other Information
During the three months ended December 31, 2024, none of our directors or officers (as defined in Rule 16a-1(f) of the Securities Exchange Act of 1934, as amended) adopted, terminated or modified a Rule 10b5-1 trading arrangement or non-Rule 10b5-1 trading arrangement (as such terms are defined in Item 408 of Regulation S-K).
ITEM 9C. Disclosure Regarding Foreign Jurisdictions that Prevent Inspections
None.
PART III
ITEM 10. Directors, Executive Officers and Corporate Governance
The information required by this Item 10 is incorporated by reference to our definitive Proxy Statement for the 2025 Annual Meeting of Stockholders, which we will file with the SEC not later than April 30, 2025.
ITEM 11. Executive Compensation
The information required by this Item 11 is incorporated by reference to our definitive Proxy Statement for the 2025 Annual Meeting of Stockholders, which we will file with the SEC not later than April 30, 2025.
ITEM 12. Security Ownership of Certain Beneficial Owners and Management and Related Stockholder Matters
The information required by this Item 12 is incorporated by reference to our definitive Proxy Statement for the 2025 Annual Meeting of Stockholders, which we will file with the SEC not later than April 30, 2025.
ITEM 13. Certain Relationships and Related Transactions, and Director Independence
The information required by this Item 13 is incorporated by reference to our definitive Proxy Statement for the 2025 Annual Meeting of Stockholders, which we will file with the SEC not later than April 30, 2025.
ITEM 14. Principal Accountant Fees and Services
The information required by this Item 14 is incorporated by reference to our definitive Proxy Statement for the 2025 Annual Meeting of Stockholders, which we will file with the SEC not later than April 30, 2025.
PART IV
ITEM 15. Exhibits and Financial Statement Schedules
Financial Statements and Financial Statement Schedules
The following documents have been included in Part II, Item 8 of this Annual Report on Form 10-K:
| | | | | |
| | Page |
| |
| |
| |
| |
| |
| |
| |
| Consolidated Financial Statement Schedules | |
| |
| |
All other schedules have been omitted because they are inapplicable or not required or the information is included elsewhere in the Consolidated Financial Statements or notes thereto.
EXHIBITS
| | | | | | | | | | | | | | | |
Exhibit
Number | | Description of Document | | Location of Document | |
| | Agreement and Plan of Merger, dated as of June 28, 2021, by and among Ventas, Inc., Cadence Merger Sub LLC and New Senior Investment Group Inc. | | Incorporated by reference herein. Previously filed as Exhibit 2.1 to our Current Report on Form 8-K, filed on June 28, 2021, File No. 001-10989. | |
| | | | | |
| | Amended and Restated Certificate of Incorporation, as amended, of Ventas, Inc. | | Incorporated by reference herein. Previously filed as Exhibit 3.1 to our Quarterly Report on Form 10-Q for the quarter ended June 30, 2011, filed on August 5, 2011, File No. 001-10989. | |
| | | | | |
| | Sixth Amended and Restated Bylaws, as amended, of Ventas, Inc. | | Incorporated by reference herein. Previously filed as Exhibit 3.1 to our Current Report on Form 8-K, filed on June 1, 2022, File No. 001-10989. | |
| | | | | |
| | Specimen common stock certificate. | | Incorporated by reference herein. Previously filed as Exhibit 4.1 to our Annual Report on Form 10-K for the fiscal year ended December 31, 2015, filed on February 12, 2016, File No. 001-10989. | |
| | | | | |
| | Indenture dated as of September 26, 2013 by and among Ventas, Inc., Ventas Realty, Limited Partnership, as Issuer, the Guarantors named therein, as Guarantors, and U.S. Bank National Association, as Trustee. | | Incorporated by reference herein. Previously filed as Exhibit 4.10 to our Annual Report on Form 10-K for the year ended December 31, 2016, filed on February 14, 2017, File No. 001-10989. | |
| | | | | |
| | Second Supplemental Indenture dated as of September 26, 2013 by and among Ventas Realty, Limited Partnership, as Issuer, Ventas, Inc., as Guarantor, and U.S. Bank National Association, as Trustee, relating to the 5.700% Senior Notes due 2043. | | Incorporated by reference herein. Previously filed as Exhibit 4.3 to our Current Report on Form 8-K, filed on September 26, 2013, File No. 001-10989. | |
| | | | | |
| | Fifth Supplemental Indenture dated as of January 14, 2015 by and among Ventas Realty, Limited Partnership, as Issuer, Ventas, Inc., as Guarantor, and U.S. Bank National Association, as Trustee, relating to the 3.500% Senior Notes due 2025. | | Incorporated by reference herein. Previously filed as Exhibit 4.2 to our Current Report on Form 8-K, filed on January 14, 2015, File No. 001-10989. | |
| | | | | |
| | Sixth Supplemental Indenture dated as of January 14, 2015 by and among Ventas Realty, Limited Partnership, as Issuer, Ventas, Inc., as Guarantor, and U.S. Bank National Association, as Trustee, relating to the 4.375% Senior Notes due 2045. | | Incorporated by reference herein. Previously filed as Exhibit 4.3 to our Current Report on Form 8-K, filed on January 14, 2015, File No. 001-10989. | |
| | | | | |
| | Indenture dated as September 24, 2014 by and among Ventas, Inc., Ventas Canada Finance Limited, the Guarantors parties thereto from time to time and Computershare Trust Company of Canada, as Trustee. | | Incorporated by reference herein. Previously filed as Exhibit 4.1 to our Quarterly Report on Form 10-Q for the quarter ended September 30, 2014, filed on October 24, 2014, File No. 001-10989. | |
| | | | | |
| | Seventh Supplemental Indenture dated as of December 1, 2021 by and among Ventas Canada Finance Limited, as Issuer, Ventas, Inc., as Guarantor, and Computershare Trust Company of Canada, as Trustee, relating to the 2.45% Senior Notes, Series G due 2027. | | Incorporated by reference herein. Previously filed as Exhibit 4.14 to our Annual Report on Form 10-K for the year ended December 31, 2021, filed on February 18, 2022, File No. 001-10989. | |
| | | | | |
| | Eighth Supplemental Indenture dated as of December 1, 2021 by and among Ventas Canada Finance Limited, as Issuer, Ventas, Inc., as Guarantor, and Computershare Trust Company of Canada, as Trustee, relating to the 3.30% Senior Notes, Series H due 2031. | | Incorporated by reference herein. Previously filed as Exhibit 4.15 to our Annual Report on Form 10-K for the year ended December 31, 2021, filed on February 18, 2022, File No. 001-10989. | |
| | | | | |
| | Ninth Supplemental Indenture dated as of April 21, 2023 by and among Ventas Canada Finance Limited, as Issuer, Ventas, Inc., as Guarantor, and Computershare Trust Company of Canada, as Trustee, relating to the 5.398% Senior Notes, Series I due 2028. | | Incorporated by reference herein. Previously filed as Exhibit 4.1 to our Quarterly Report on Form 10-Q for the quarter ended March 31, 2023, filed on May 9, 2023, File No. 001-10989. | |
| | | | | |
| | Eighth Supplemental Indenture dated as of December 1, 2021 by and among Ventas Canada Finance Limited, as Issuer, Ventas, Inc., as Guarantor, and Computershare Trust Company of Canada, as Trustee, relating to the 3.30% Senior Notes, Series H due 2031. | | Incorporated by reference herein. Previously filed as Exhibit 4.15 to our Annual Report on Form 10-K for the year ended December 31, 2021, filed on February 18, 2022, File No. 001-10989. | |
| | | | | |
| | | | | | | | | | | | | | | |
Exhibit
Number | | Description of Document | | Location of Document | |
| | Tenth Supplemental Indenture dated as of March 5, 2024 by and among Ventas Canada Finance Limited, as Issuer, Ventas, Inc., as Guarantor, and Computershare Trust Company of Canada, as Trustee, relating to the 5.10% Senior Notes, Series J due 2029. | | Incorporated by reference herein. Previously filed as Exhibit 4.1 to our Quarterly Report on Form 10-Q for the quarter ended March 31, 2024, filed on May 2, 2024, File No. 001-10989. | |
| | | | | |
| | Indenture dated as of July 16, 2015 by and among Ventas, Inc., Ventas Realty, Limited Partnership, as Issuer, the Guarantors named therein as Guarantors, and U.S. Bank National Association, as Trustee. | | Incorporated by reference herein. Previously filed as Exhibit 4.1 to our Current Report on Form 8-K, filed on July 16, 2015, File No. 001-10989. | |
| | | | | |
| | First Supplemental Indenture dated as of July 16, 2015 by and among Ventas Realty, Limited Partnership, as Issuer, Ventas Inc., as Guarantor, and U.S. Bank National Association, as Trustee, relating to the 4.125% Senior Notes due 2026. | | Incorporated by reference herein. Previously filed as Exhibit 4.2 to our Current Report on Form 8-K, filed on July 16, 2015, File No. 001-10989. | |
| | | | | |
| | Third Supplemental Indenture dated as of September 21, 2016 by and among Ventas Realty, Limited Partnership, as Issuer, Ventas Inc., as Guarantor, and U.S. Bank National Association, as Trustee, relating to the 3.250% Senior Notes due 2026. | | Incorporated by reference herein. Previously filed as Exhibit 4.2 to our Current Report on Form 8-K, filed on September 21, 2016, File No. 001-10989. | |
| | | | | |
| | Fourth Supplemental Indenture dated as of March 29, 2017 by and among Ventas Realty, Limited Partnership, as Issuer, Ventas, Inc., as Guarantor, and U.S. Bank National Association, as Trustee, relating to the 3.850% Senior Notes due 2027. | | Incorporated by reference herein. Previously filed as Exhibit 4.2 to our Current Report on Form 8-K, filed on March 29, 2017, File No. 001-10989. | |
| | | | | |
| | Indenture dated February 23, 2018 among Ventas, Inc., Ventas Realty, Limited Partnership, the Guarantors named therein, and U.S. Bank National Association, as Trustee | | Incorporated by reference herein. Previously filed as Exhibit 4.1 to our Current Report on Form 8-K, filed on February 23, 2018, File No. 001-10989. | |
| | | | | |
| | First Supplemental Indenture dated as of February 23, 2018 by and among Ventas Realty, Limited Partnership, as Issuer, Ventas, Inc., as Guarantor and U.S. Bank National Association, as Trustee relating to the 4.000% Senior Notes due 2028 | | Incorporated by reference herein. Previously filed as Exhibit 4.2 to our Current Report on Form 8-K, filed on February 23, 2018, File No. 001-10989.
| |
| | | | | |
| | Second Supplemental Indenture dated as of August 15, 2018 by and among Ventas Realty, Limited Partnership, as Issuer, Ventas, Inc., as Guarantor and U.S. Bank National Association, as Trustee relating to the 4.400% Senior Notes due 2029 | | Incorporated by reference herein. Previously filed as Exhibit 4.2 to our Current Report on Form 8-K, filed on August 15, 2018, File No. 001-10989. | |
| | | | | |
| | Third Supplemental Indenture dated as of February 26, 2019 by and among Ventas Realty, Limited Partnership, as Issuer, Ventas, Inc., as Guarantor and U.S. Bank National Association, as Trustee relating to the 3.500% Senior Notes due 2024 and 4.875% Senior Notes due 2049 | | Incorporated by reference herein. Previously filed as Exhibit 4.2 to our Current Report on Form 8-K, filed on February 26, 2019, File No. 001-10989. | |
| | | | | |
| | Fourth Supplemental Indenture dated as of July 3, 2019 by and among Ventas Realty, Limited Partnership, as Issuer, Ventas, Inc., as Guarantor and U.S. Bank National Association, as Trustee relating to the 2.650% Senior Notes due 2025 | | Incorporated by reference herein. Previously filed as Exhibit 4.2 to our Current Report on Form 8-K, filed on July 3, 2019, File No. 001-10989. | |
| | | | | |
| | Fifth Supplemental Indenture dated as of August 21, 2019 by and among Ventas Realty, Limited Partnership, as Issuer, Ventas, Inc., as Guarantor and U.S. Bank National Association, as Trustee relating to the 3.000% Senior Notes due 2030 | | Incorporated by reference herein. Previously filed as Exhibit 4.2 to our Current Report on Form 8-K, filed on August 21, 2019, File No. 001-10989. | |
| | | | | |
| | Sixth Supplemental Indenture dated as of April 1, 2020 by and among Ventas Realty, Limited Partnership, as Issuer, Ventas, Inc., as Guarantor and U.S. Bank National Association, as Trustee relating to the 4.750% Senior Notes due 2030. | | Incorporated by reference herein. Previously filed as Exhibit 4.2 to our Current Report on Form 8-K, filed on April 1, 2020, File No. 001-10989. | |
| | | | | |
| | | | | | | | | | | | | | | |
Exhibit
Number | | Description of Document | | Location of Document | |
| | Seventh Supplemental Indenture dated as of August 20, 2021 by and among Ventas Realty, Limited Partnership, as Issuer, Ventas, Inc., as Guarantor and U.S. Bank National Association, as Trustee relating to the 2.500% Senior Notes due 2031. | | Incorporated by reference herein. Previously filed as Exhibit 4.2 to our Current Report on Form 8-K, filed on August 20, 2021, File No. 001-10989. | |
| | | | | |
| | Eighth Supplemental Indenture dated as of May 13, 2024 by and among Ventas Realty, Limited Partnership, as Issuer, Ventas, Inc., as Guarantor and U.S. Bank National Association, as Trustee relating to the 5.625% Senior Notes due 2034. | | Incorporated by reference herein. Previously filed as Exhibit 4.2 to our Current Report on Form 8-K, filed on May 13, 2024, File No. 001-10989. | |
| | | | | |
| | Ninth Supplemental Indenture dated as of September 9, 2024 by and among Ventas Realty, Limited Partnership, as Issuer, Ventas, Inc., as Guarantor and U.S. Bank National Association, as Trustee relating to the 5.000% Senior Notes due 2035. | | Incorporated by reference herein. Previously filed as Exhibit 4.2 to our Current Report on Form 8-K, filed on August 20, 2021, File No. 001-10989. | |
| | | | | |
| | Indenture dated as of June 13, 2023, by and among Ventas Realty, Limited Partnership, as Issuer, Ventas, Inc., as Guarantor, and U.S. Bank Trust Company, National Association, as Trustee, relating to the 3.75% Exchangeable Senior Notes due 2026. | | Incorporated by reference herein. Previously filed as Exhibit 4.1 to our Current Report on Form 8-K, filed on June 13, 2023, File No. 001-10989. | |
| | | | | |
| | Description of the Registrant’s Securities. | | Filed herewith. | |
| | | | | |
| | Pursuant to Item 601(b)(4)(iii)(A) of Regulation S-K, the Company has not filed as an exhibit to this Form 10-K certain instruments defining the rights of the holders of certain additional long-term debt of the Company and its subsidiaries, none of which authorize a total amount of indebtedness in excess of 10% of the total assets of the Company and its subsidiaries on a consolidated basis. The Company agrees to furnish a copy of any of these agreements to the SEC upon request. | |
| | | | | |
| | First Amended and Restated Agreement of Limited Partnership of Ventas Realty, Limited Partnership. | | Incorporated by reference herein. Previously filed as Exhibit 3.5 to our Registration Statement on Form S-4, as amended, filed on May 29, 2002, File No. 333-89312. | |
| | | | | |
| | Credit and Guaranty Agreement, dated as of June 27, 2022, among Ventas Realty, Limited Partnership, a Delaware limited partnership, as borrower, Ventas, Inc., a Delaware corporation, as guarantor, the lending institutions party thereto from time to time, and Bank of America, N.A., as Administrative Agent. | | Incorporated by reference herein. Previously filed as Exhibit 10.1 to our Current Report on Form 8-K, filed on June 30, 2022, File No. 001-10989 | |
| | | | | |
| | Fourth Amended and Restated Credit and Guaranty Agreement, dated as of April 24, 2024, among Ventas Realty, Limited Partnership, Ventas SSL Ontario II, Inc., Ventas Canada Finance Limited, Ventas UK Finance, Inc., and Ventas Euro Finance, LLC, as Borrowers, Ventas, Inc., as Guarantor, the Lenders identified therein, Bank of America, N.A., as Administrative Agent, and Bank of America, N.A., JPMorgan Chase Bank, N.A. and Wells Fargo Bank, National Association, as L/C Issuers. | | Incorporated by reference herein. Previously filed as Exhibit 10.1 to our Current Report on Form 8-K, filed on April 24, 2024, File No. 001-10989. | |
| | | | | |
| | Credit and Guaranty Agreement, dated as of September 6, 2023, among Ventas Realty, Limited Partnership, a Delaware limited partnership, as borrower, Ventas, Inc., a Delaware corporation, as guarantor, the lending institutions party thereto from time to time, and Bank of America, N.A., as Administrative Agent. | | Incorporated by reference herein. Previously filed as Exhibit 10.1 to our Current Report on Form 8-K, filed on September 12, 2023, File No. 001-10989. | |
| | | | | |
| | ATM Sales Agreement, dated September 18, 2024, among Ventas, Inc. and the Agents and Forward Purchasers named therein. | | Incorporated by reference herein. Previously filed as Exhibit 1.1 to our Current Report on Form 8-K, filed on September 18, 2024, File No. 001-10989. | |
| | | | | |
| | | | | | | | | | | | | | | |
Exhibit
Number | | Description of Document | | Location of Document | |
| | Cooperation Agreement, dated March 4, 2024, among Ventas, Inc. and Land & Buildings Investment Management, LLC and certain of its affiliates. | | Incorporated by reference herein. Previously filed as Exhibit 10.1 to our Current Report on Form 8-K, filed on March 4, 2024, File No. 001-10989. | |
| | | | | |
| | Ventas, Inc. 2006 Stock Plan for Directors, as amended. | | Incorporated by reference herein. Previously filed as Exhibit 10.1 to our Quarterly Report on Form 10-Q for the quarter ended March 31, 2012, filed on April 27, 2012, File No. 001-10989. | |
| | | | | |
| | Form of Restricted Stock Unit Agreement—2006 Stock Plan for Directors. | | Incorporated by reference herein. Previously filed as Exhibit 10.11.4 to our Annual Report on Form 10-K for the year ended December 31, 2008, filed on February 27, 2009, File No. 001-10989. | |
| | | | | |
| | Ventas, Inc. 2012 Incentive Plan. | | Incorporated by reference herein. Previously filed as Exhibit 10.1 to our Current Report on Form 8-K, filed on May 23, 2012, File No. 001-10989. | |
| | | | | |
| | First Amendment to the Ventas, Inc. 2012 Incentive Plan. | | Incorporated by reference herein. Previously filed as Exhibit 10.10.7 to our Quarterly Report on Form 10-Q for the quarter ended March 31, 2017, filed on April 28, 2017, File No. 001-10989. | |
| | | | | |
| | Form of Stock Option Agreement (Employees) under the Ventas, Inc. 2012 Incentive Plan. | | Incorporated by reference herein. Previously filed as Exhibit 10.6.2 to our Annual Report on Form 10-K for the year ended December 31, 2014, filed February 13, 2015, File No. 001-10989. | |
| | | | | |
| | Form of Restricted Stock Agreement (Directors) under the Ventas, Inc. 2012 Incentive Plan. | | Incorporated by reference herein. Previously filed as Exhibit 10.5 to our Registration Form on S-8, filed on August 7, 2012, File No. 333-183121. | |
| | | | | |
| | Form of Restricted Stock Unit Agreement (Directors) under the Ventas, Inc. 2012 Incentive Plan. | | Incorporated by reference herein. Previously filed as Exhibit 10.6 to our Registration Form on S-8, filed on August 7, 2012, File No. 333-183121. | |
| | | | | |
| | Form of Performance-Based Restricted Stock Unit Agreement (CEO) under the Ventas, Inc. 2012 Incentive Plan. | | Incorporated by reference herein. Previously filed as Exhibit 10.10.8 to our Quarterly Report on Form 10-Q for the quarter ended March 31, 2017, filed on April 28, 2017, File No. 001-10989. | |
| | | | | |
| | Form of Restricted Stock Unit Agreement (CEO) under the Ventas, Inc. 2012 Incentive Plan. | | Incorporated by reference herein. Previously filed as Exhibit 10.10.9 to our Quarterly Report on Form 10-Q for the quarter ended March 31, 2017, filed on April 28, 2017, File No. 001-10989. | |
| | | | | |
| | Form of Performance-Based Restricted Stock Unit Agreement (Non-CEO) under the Ventas, Inc. 2012 Incentive Plan. | | Incorporated by reference herein. Previously filed as Exhibit 10.10.11 to our Quarterly Report on Form 10-Q for the quarter ended March 31, 2017, filed on April 28, 2017, File No. 001-10989. | |
| | | | | |
| | Form of Restricted Stock Unit Agreement (Non-CEO) under the Ventas, Inc. 2012 Incentive Plan. | | Incorporated by reference herein. Previously filed as Exhibit 10.10.12 to our Quarterly Report on Form 10-Q for the quarter ended March 31, 2017, filed on April 28, 2017, File No. 001-10989. | |
| | | | | |
| | Ventas, Inc. Non-Employee Directors’ Cash Compensation Deferral Plan (formerly the “Ventas Nonemployee Directors’ Deferred Stock Compensation Plan”) | | Incorporated by reference herein. Previously filed as Exhibit 10.10.1 to our Annual Report on Form 10-K for the year ended December 31, 2022, filed on February 10, 2023, File No. 001-10989. | |
| | | | | |
| | Deferral Election Form under the Ventas Nonemployee Directors’ Deferred Stock Compensation Plan (used prior to December 2022) | | Incorporated by reference herein. Previously filed as Exhibit 10.13.2 to our Annual Report on Form 10-K for the year ended December 31, 2008, filed on February 27, 2009, File No. 001-10989. | |
| | | | | |
| | Deferral Election Form under the Ventas, Inc. Non-Employee Directors’ Cash Compensation Deferral Plan. | | Incorporated by reference herein. Previously filed as Exhibit 10.10.3 to our Annual Report on Form 10-K for the year ended December 31, 2022, filed on February 10, 2023, File No. 001-10989 | |
| | | | | |
| | | | | | | | | | | | | | | |
Exhibit
Number | | Description of Document | | Location of Document | |
| | Ventas, Inc. 2022 Incentive Plan | | Incorporated by reference herein. Previously filed as Exhibit 10.1 to our Quarterly Report on Form 10-Q filed on August 5, 2022, File No. 001-10989. | |
| | | | | |
| | Ventas, Inc. Non-Employee Directors’ Equity Award Deferral Program Adopted Pursuant to the Ventas, Inc. 2022 Incentive Plan | | Incorporated by reference herein. Previously filed as Exhibit 10.11.2 to our Annual Report on Form 10-K for the year ended December 31, 2022, filed on February 10, 2023, File No. 001-10989. | |
| | | | | |
| | Deferral Election Form under the Ventas, Inc. Non-Employee Directors’ Equity Award Deferral Program | | Incorporated by reference herein. Previously filed as Exhibit 10.11.3 to our Annual Report on Form 10-K for the year ended December 31, 2022, filed on February 10, 2023, File No. 001-10989. | |
| | | | | |
| | Restricted Stock Award granted to Sumit Roy on October 1, 2022 under the Ventas, Inc. 2022 Incentive Plan | | Incorporated by reference herein. Previously filed as Exhibit 10.11.4 to our Annual Report on Form 10-K for the year ended December 31, 2022, filed on February 10, 2023, File No. 001-10989. | |
| | | | | |
| | Form of Restricted Stock Unit Award under the Ventas, Inc. 2022 Incentive Plan (Non-Employee Directors) | | Incorporated by reference herein. Previously filed as Exhibit 10.11.5 to our Annual Report on Form 10-K for the year ended December 31, 2022, filed on February 10, 2023, File No. 001-10989. | |
| | | | | |
| | Form of Restricted Stock Unit Agreement under the Ventas, Inc. 2022 Incentive Plan (CEO) | | Incorporated by reference herein. Previously filed as Exhibit 10.11.6 to our Annual Report on Form 10-K for the year ended December 31, 2022, filed on February 10, 2023, File No. 001-10989. | |
| | | | | |
| | Form of Performance Share Unit Agreement under the Ventas, Inc. 2022 Incentive Plan (CEO) | | Incorporated by reference herein. Previously filed as Exhibit 10.11.7 to our Annual Report on Form 10-K for the year ended December 31, 2022, filed on February 10, 2023, File No. 001-10989. | |
| | | | | |
| | Form of Restricted Stock Unit Award under the Ventas, Inc. 2022 Incentive Plan (non-CEO Executive Officer) | | Incorporated by reference herein. Previously filed as Exhibit 10.11.8 to our Annual Report on Form 10-K for the year ended December 31, 2022, filed on February 10, 2023, File No. 001-10989. | |
| | | | | |
| | Form of Performance Share Unit Award under the Ventas, Inc. 2022 Incentive Plan (non-CEO Executive Officer) | | Incorporated by reference herein. Previously filed as Exhibit 10.11.9 to our Annual Report on Form 10-K for the year ended December 31, 2022, filed on February 10, 2023, File No. 001-10989. | |
| | | | | |
| | Second Amended and Restated Employment Agreement dated as of March 22, 2011 between Ventas, Inc. and Debra A. Cafaro. | | Incorporated by reference herein. Previously filed as Exhibit 10.1 to our Current Report on Form 8-K, filed on March 24, 2011, File No. 001-10989. | |
| | | | | |
| | | | | |
| | | | | |
| | | | | |
| | | | | |
| | Offer Letter dated September 16, 2014 from Ventas, Inc. to Robert F. Probst. | | Incorporated by reference herein. Previously filed as Exhibit 10.1 to our Current Report on Form 8-K, filed on September 29, 2014, File No. 001-10989. | |
| | | | | |
| | Employee Protection and Noncompetition Agreement dated September 16, 2014 between Ventas, Inc. and Robert F. Probst. | | Incorporated by reference herein. Previously filed as Exhibit 10.2 to our Current Report on Form 8-K, filed on September 29, 2014, File No. 001-10989. | |
| | | | | |
| | Amendment dated December 8, 2017 to Employee Protection and Noncompetition Agreement dated as of September 16, 2014 between Ventas, Inc. and Robert F. Probst. | | Incorporated by reference herein. Previously filed as Exhibit 10.17.3 to our Annual Report on Form 10-K for the year ended December 31, 2017, filed on February 9, 2018, File No. 001-10989. | |
| | | | | |
| | Offer of Employment Term Sheet dated March 20, 2018 from Ventas, Inc. to Peter J. Bulgarelli. | | Incorporated by reference herein. Previously filed as Exhibit 10.1.1 to our Quarterly Report on Form 10-Q for the quarter ended March 31, 2018, filed on April 27, 2018, File No. 001-10989. | |
| | | | | |
| | Employee Protection and Noncompetition Agreement dated March 20, 2018 between Ventas, Inc. and Peter J. Bulgarelli.
| | Incorporated by reference herein. Previously filed as Exhibit 10.1.2 to our Quarterly Report on Form 10-Q for the quarter ended March 31, 2018, filed on April 27, 2018, File No. 001-10989. | |
| | | | | |
| | | | | | | | | | | | | | | |
Exhibit
Number | | Description of Document | | Location of Document | |
| | Offer Letter dated December 22, 2019 from Ventas, Inc. to Carey Shea Roberts. | | Incorporated by reference herein. Previously filed as Exhibit 10.18.3 to our Annual Report on Form 10-K for the year ended December 31, 2020, filed on February 23, 2021, File No. 001-10989 | |
| | | | | |
| | Employee Protection and Restrictive Covenants Agreement dated January 21, 2020 between Ventas, Inc. and Carey Shea Roberts. | | Incorporated by reference herein. Previously filed as Exhibit 10.2.1 to our Quarterly Report on Form 10-Q for the quarter ended March 31, 2020, filed on May 8, 2020, File No. 001-10989. | |
| | | | | |
| | Employment Bonus Agreement dated March 4, 2020 between Ventas, Inc. and Carey Shea Roberts. | | Incorporated by reference herein. Previously filed as Exhibit 10.2.2 to our Quarterly Report on Form 10-Q for the quarter ended March 31, 2020, filed on May 8, 2020, File No. 001-10989. | |
| | | | | |
| | Offer Letter dated January 30, 2020 from Ventas, Inc. to J. Justin Hutchens. | | Incorporated by reference herein. Previously filed as Exhibit 10.19.2 to our Annual Report on Form 10-K for the year ended December 31, 2020, filed on February 23, 2021, File No. 001-10989 | |
| | | | | |
| | Employee Protection and Restrictive Covenants Agreement dated February 7, 2020 between Ventas, Inc. and J. Justin Hutchens. | | Incorporated by reference herein. Previously filed as Exhibit 10.3 to our Quarterly Report on Form 10-Q for the quarter ended March 31, 2020, filed on May 8, 2020, File No. 001-10989. | |
| | | | | |
| | Ventas Employee and Director Stock Purchase Plan, as amended. | | Incorporated by reference herein. Previously filed as Exhibit 10.18 to our Annual Report on Form 10-K for the year ended December 31, 2008, filed on February 27, 2009, File No. 001-10989. | |
| | | | | |
| | Ventas, Inc. Securities Trading Policy | | Filed herewith. | |
| | | | | |
| | Subsidiaries of Ventas, Inc. | | Filed herewith. | |
| | | | | |
| | List of Guarantors and Issuers of Guaranteed Securities. | | Filed herewith. | |
| | | | | |
| | Consent of KPMG LLP. | | Filed herewith. | |
| | | | | |
| | Certification of Debra A. Cafaro, Chairman and Chief Executive Officer, pursuant to Rule 13a-14(a) under the Exchange Act. | | Filed herewith. | |
| | | | | |
| | Certification of Robert F. Probst, Executive Vice President and Chief Financial Officer, pursuant to Rule 13a-14(a) under the Exchange Act. | | Filed herewith. | |
| | | | | |
| | Certification of Debra A. Cafaro, Chairman and Chief Executive Officer, pursuant to Rule 13a-14(b) under the Exchange Act and 18 U.S.C. 1350. | | Filed herewith. | |
| | | | | |
| | Certification of Robert F. Probst, Executive Vice President and Chief Financial Officer, pursuant to Rule 13a-14(b) under the Exchange Act and 18 U.S.C. 1350. | | Filed herewith. | |
| | | | | |
| | Policy relating to recovery of erroneously awarded compensation. | | Incorporated by reference herein. Previously filed as Exhibit 97 to our Annual Report on Form 10-K for the year ended December 31, 2023, filed on February 15, 2024, File No. 001-10989. | |
| | | | | |
| | | | | | | | | | | | | | | |
Exhibit
Number | | Description of Document | | Location of Document | |
| 101 | | The following materials from the Company’s Annual Report on Form 10-K for the year ended December 31, 2024, formatted in iXBRL (Inline Extensible Business Reporting Language): (i) Index to Consolidated Financial Statements and Financial Statement Schedules, including auditor information, (ii) the Consolidated Balance Sheets, (iii) the Consolidated Statements of Income, (iv) the Consolidated Statements of Comprehensive Income, (v) the Consolidated Statements of Equity, (vi) the Consolidated Statements of Cash Flows, (vii) Notes to the Consolidated Financial Statements (viii) Schedule III and IV. | | Filed herewith. | |
| | | | | |
| 104 | | Cover Page Interactive Data File (embedded within the Inline XBRL document). | | Filed herewith. | |
| | | | | |
* Management contract or compensatory plan or arrangement required to be filed as an exhibit pursuant to Item 15(b) of Form 10-K.
ITEM 16. Form 10-K Summary
None.
SIGNATURES
Pursuant to the requirements of Section 13 or 15(d) of the Securities Exchange Act of 1934, as amended, the Registrant has duly caused this Report to be signed on its behalf by the undersigned, thereunto duly authorized.
Date: February 13, 2025
| | | | | | | | | | | |
| | VENTAS, INC. |
| | | |
| | By: | /s/ DEBRA A. CAFARO |
| | | Debra A. Cafaro
Chairman and Chief Executive Officer |
Pursuant to the requirements of the Securities Exchange Act of 1934, as amended, this Report has been signed below by the following persons on behalf of the Registrant and in the capacities and on the dates indicated.
| | | | | | | | | | | | | | |
| Signature | | Title | | Date |
| | | | |
| /s/ DEBRA A. CAFARO | | Chairman and Chief Executive Officer (Principal Executive Officer) | | February 13, 2025 |
| Debra A. Cafaro | | | | |
| | | | |
| /s/ ROBERT F. PROBST | | Executive Vice President and Chief Financial Officer (Principal Financial Officer) | | February 13, 2025 |
| Robert F. Probst | | | | |
| | | | |
| /s/ GREGORY R. LIEBBE | | Senior Vice President, Chief Accounting Officer and Controller (Principal Accounting Officer) | | February 13, 2025 |
| Gregory R. Liebbe | | | | |
| | | | |
| /s/ MELODY C. BARNES | | Director | | February 13, 2025 |
| Melody C. Barnes | | | | |
| | | | |
| /s/ THEODORE R. BIGMAN | | Director | | February 13, 2025 |
| Theodore R. Bigman | | | | |
| | | | |
| /s/ MICHAEL J. EMBLER | | Director | | February 13, 2025 |
| Michael J. Embler | | | | |
| | | | |
| /s/ MATTHEW J. LUSTIG | | Director | | February 13, 2025 |
| Matthew J. Lustig | | | | |
| | | | |
| /s/ ROXANNE M. MARTINO | | Director | | February 13, 2025 |
| Roxanne M. Martino | | | | |
| | | | |
| /s/ MARGUERITE M. NADER | | Director | | February 13, 2025 |
| Marguerite M. Nader | | | | |
| | | | |
| /s/ SEAN P. NOLAN | | Director | | February 13, 2025 |
| Sean P. Nolan | | | | |
| | | | |
| /s/ WALTER C. RAKOWICH | | Director | | February 13, 2025 |
| Walter C. Rakowich | | | | |
| | | | |
| /s/ JOE V. RODRIGUEZ, JR. | | Director | | February 13, 2025 |
| Joe V. Rodriguez, Jr. | | | | |
| | | | |
| /s/ SUMIT ROY | | Director | | February 13, 2025 |
| Sumit Roy | | | | |
| | | | |
| /s/ MAURICE S. SMITH | | Director | | February 13, 2025 |
| Maurice S. Smith | | | | |
| | | | |